
Experimental Study and Analytical Modeling on Properties of Freeze–Thaw Durability of Coal Gangue Pervious Concrete

Abstract
:1. Introduction
2. Materials and Methods
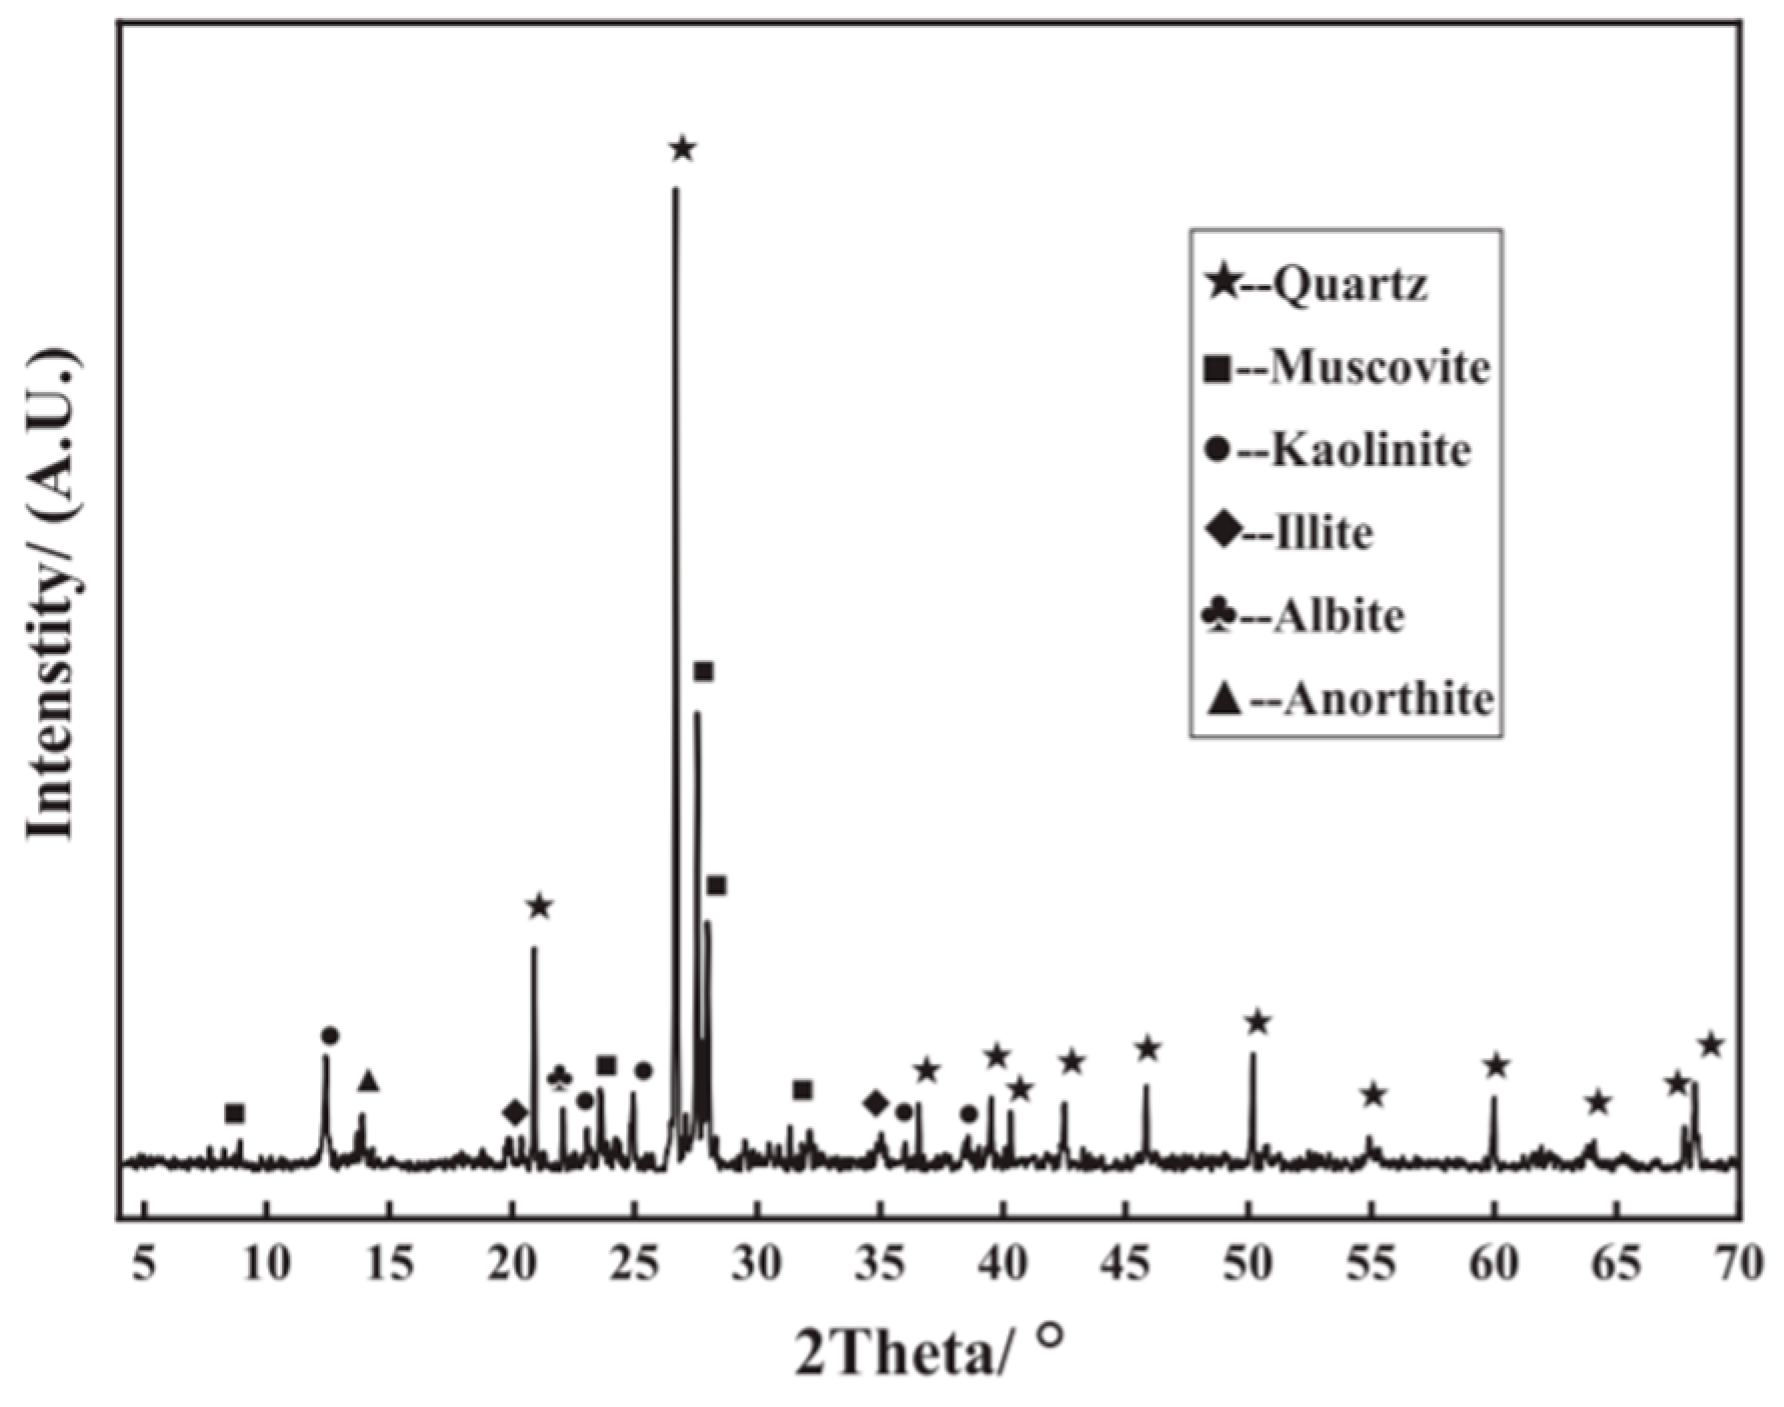
2.1. Materials
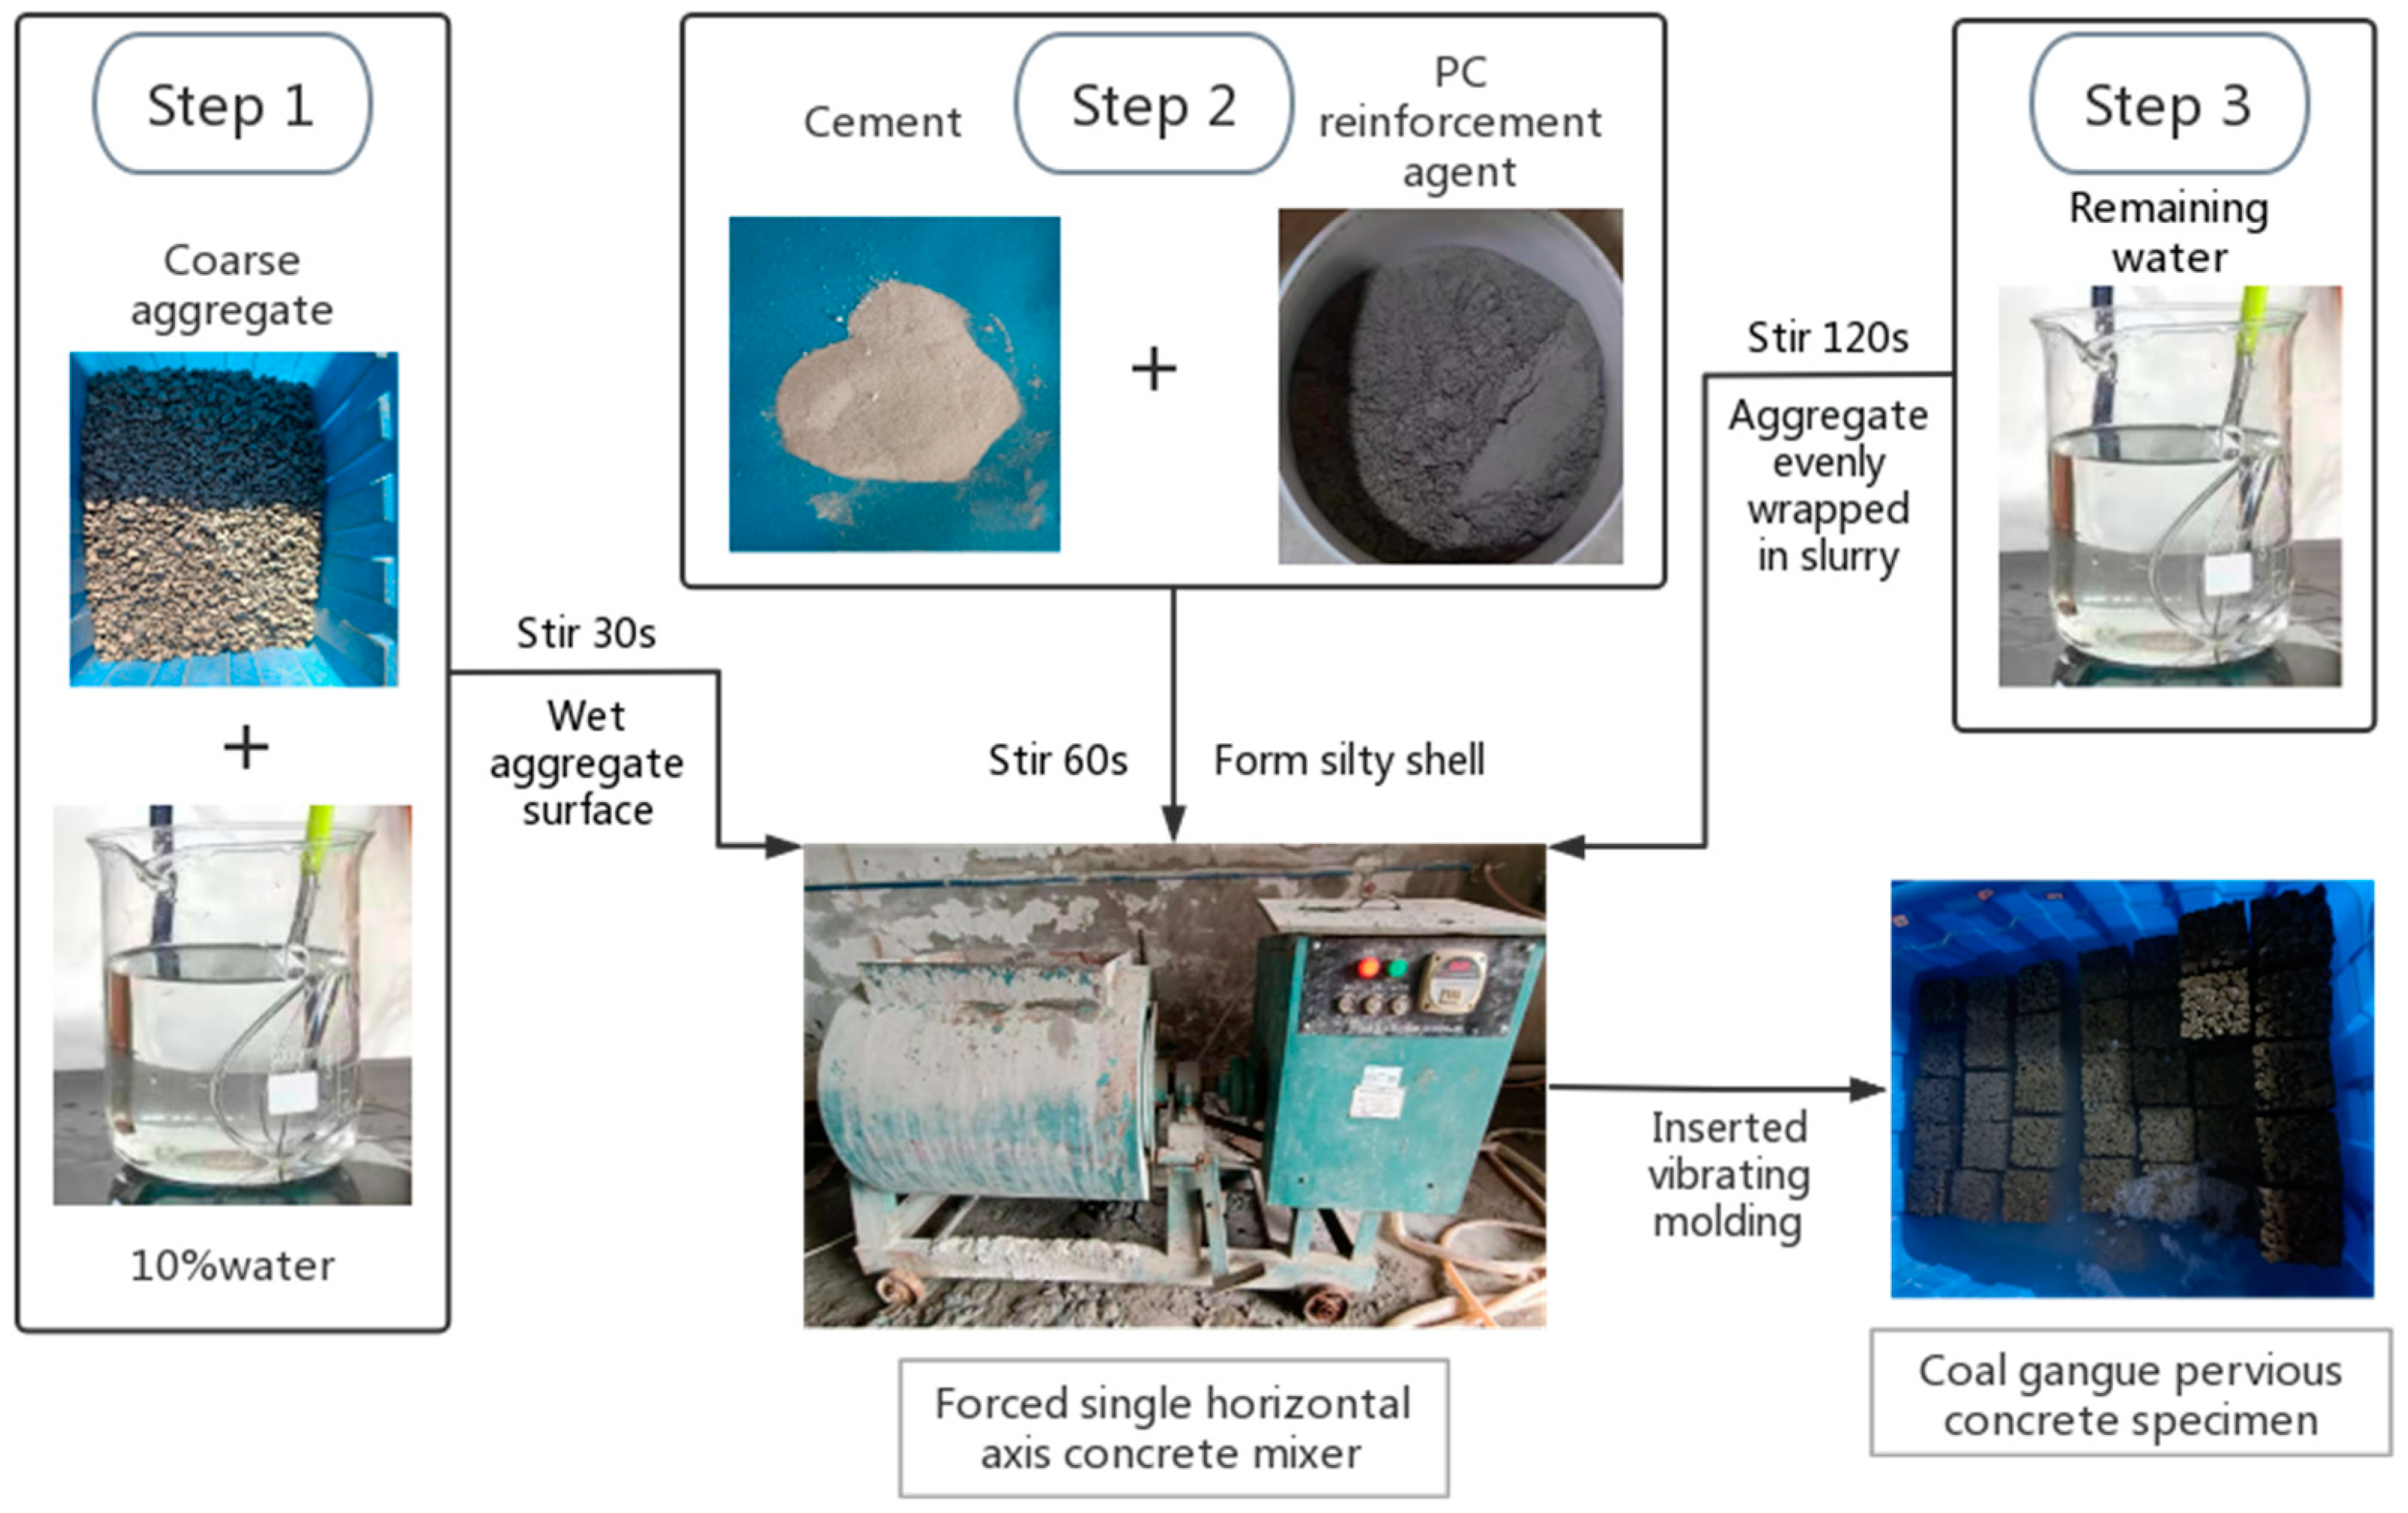
2.2. Sample Preparation and Mixture Proportions
2.3. Test Methods
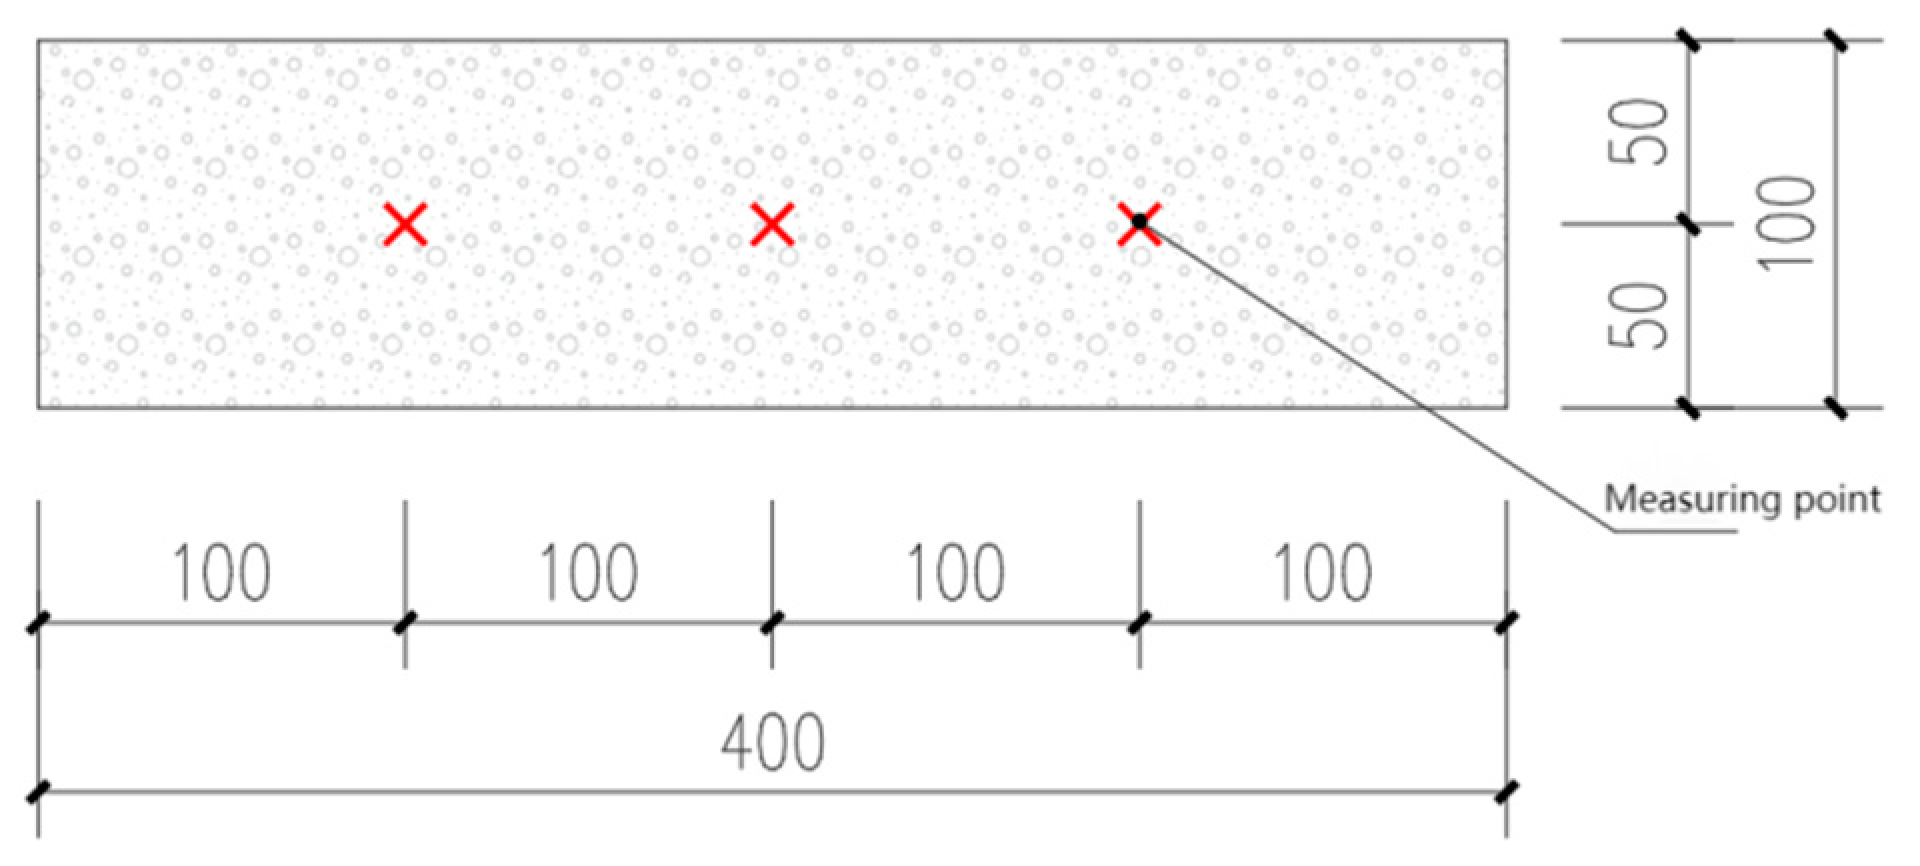
2.3.1. F-T Testing
2.3.2. Mass Loss Rate Test
2.3.3. Compressive Strength Test
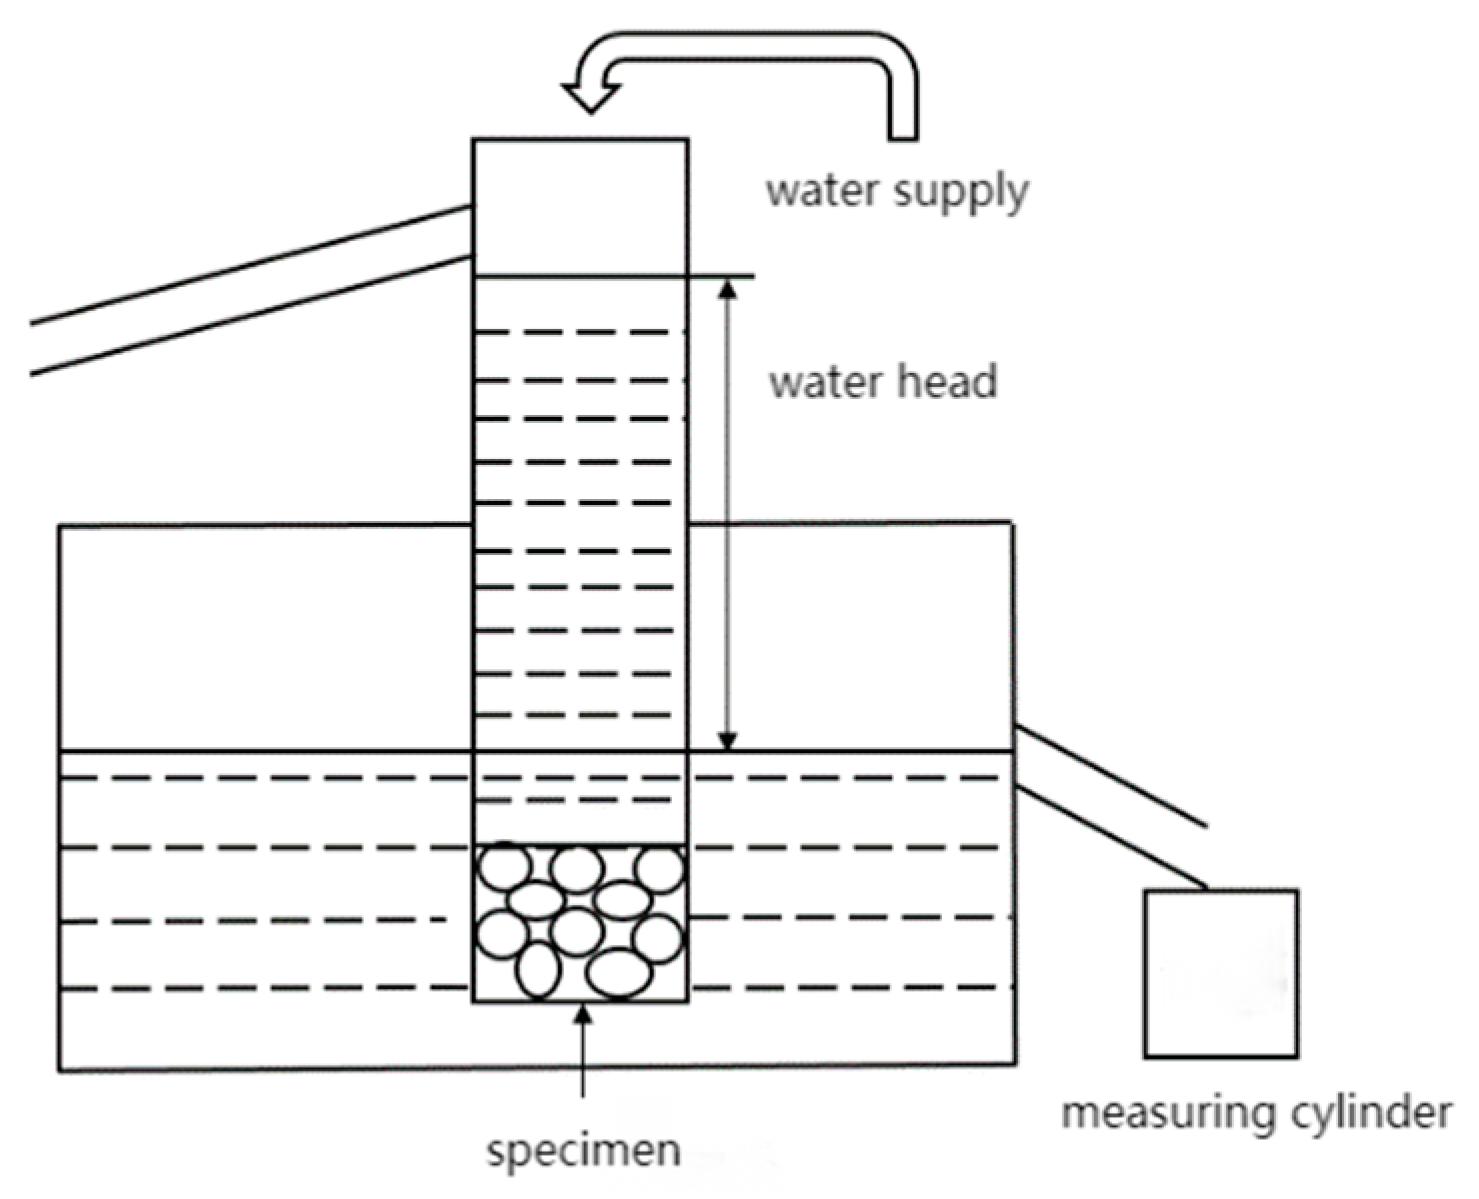
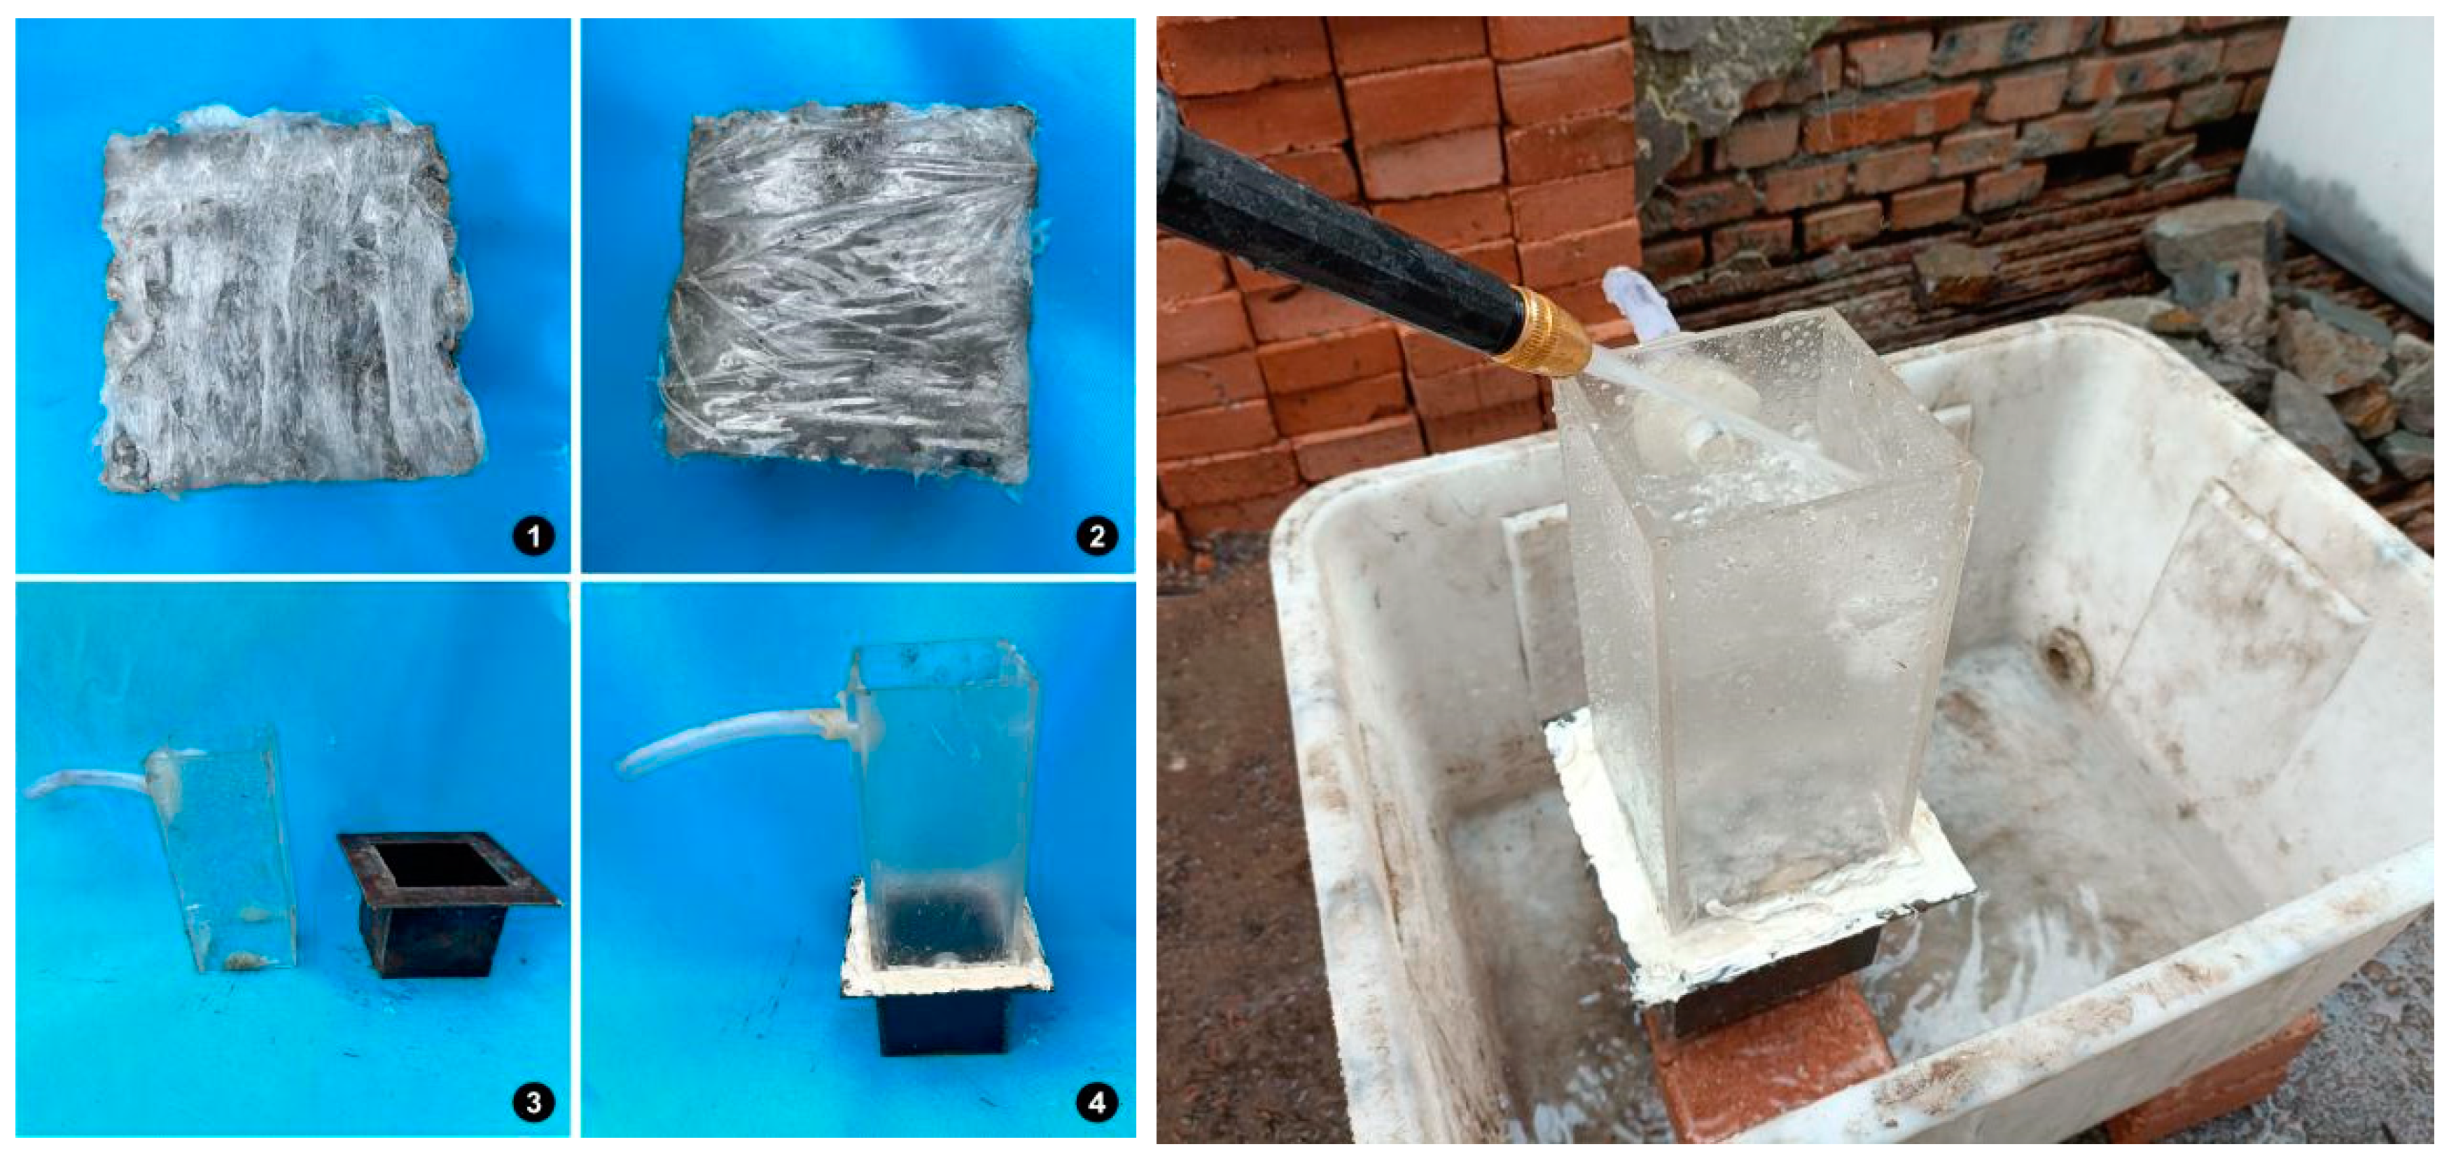
2.3.4. Water Permeability Test
3. Experiment Results and Discussions
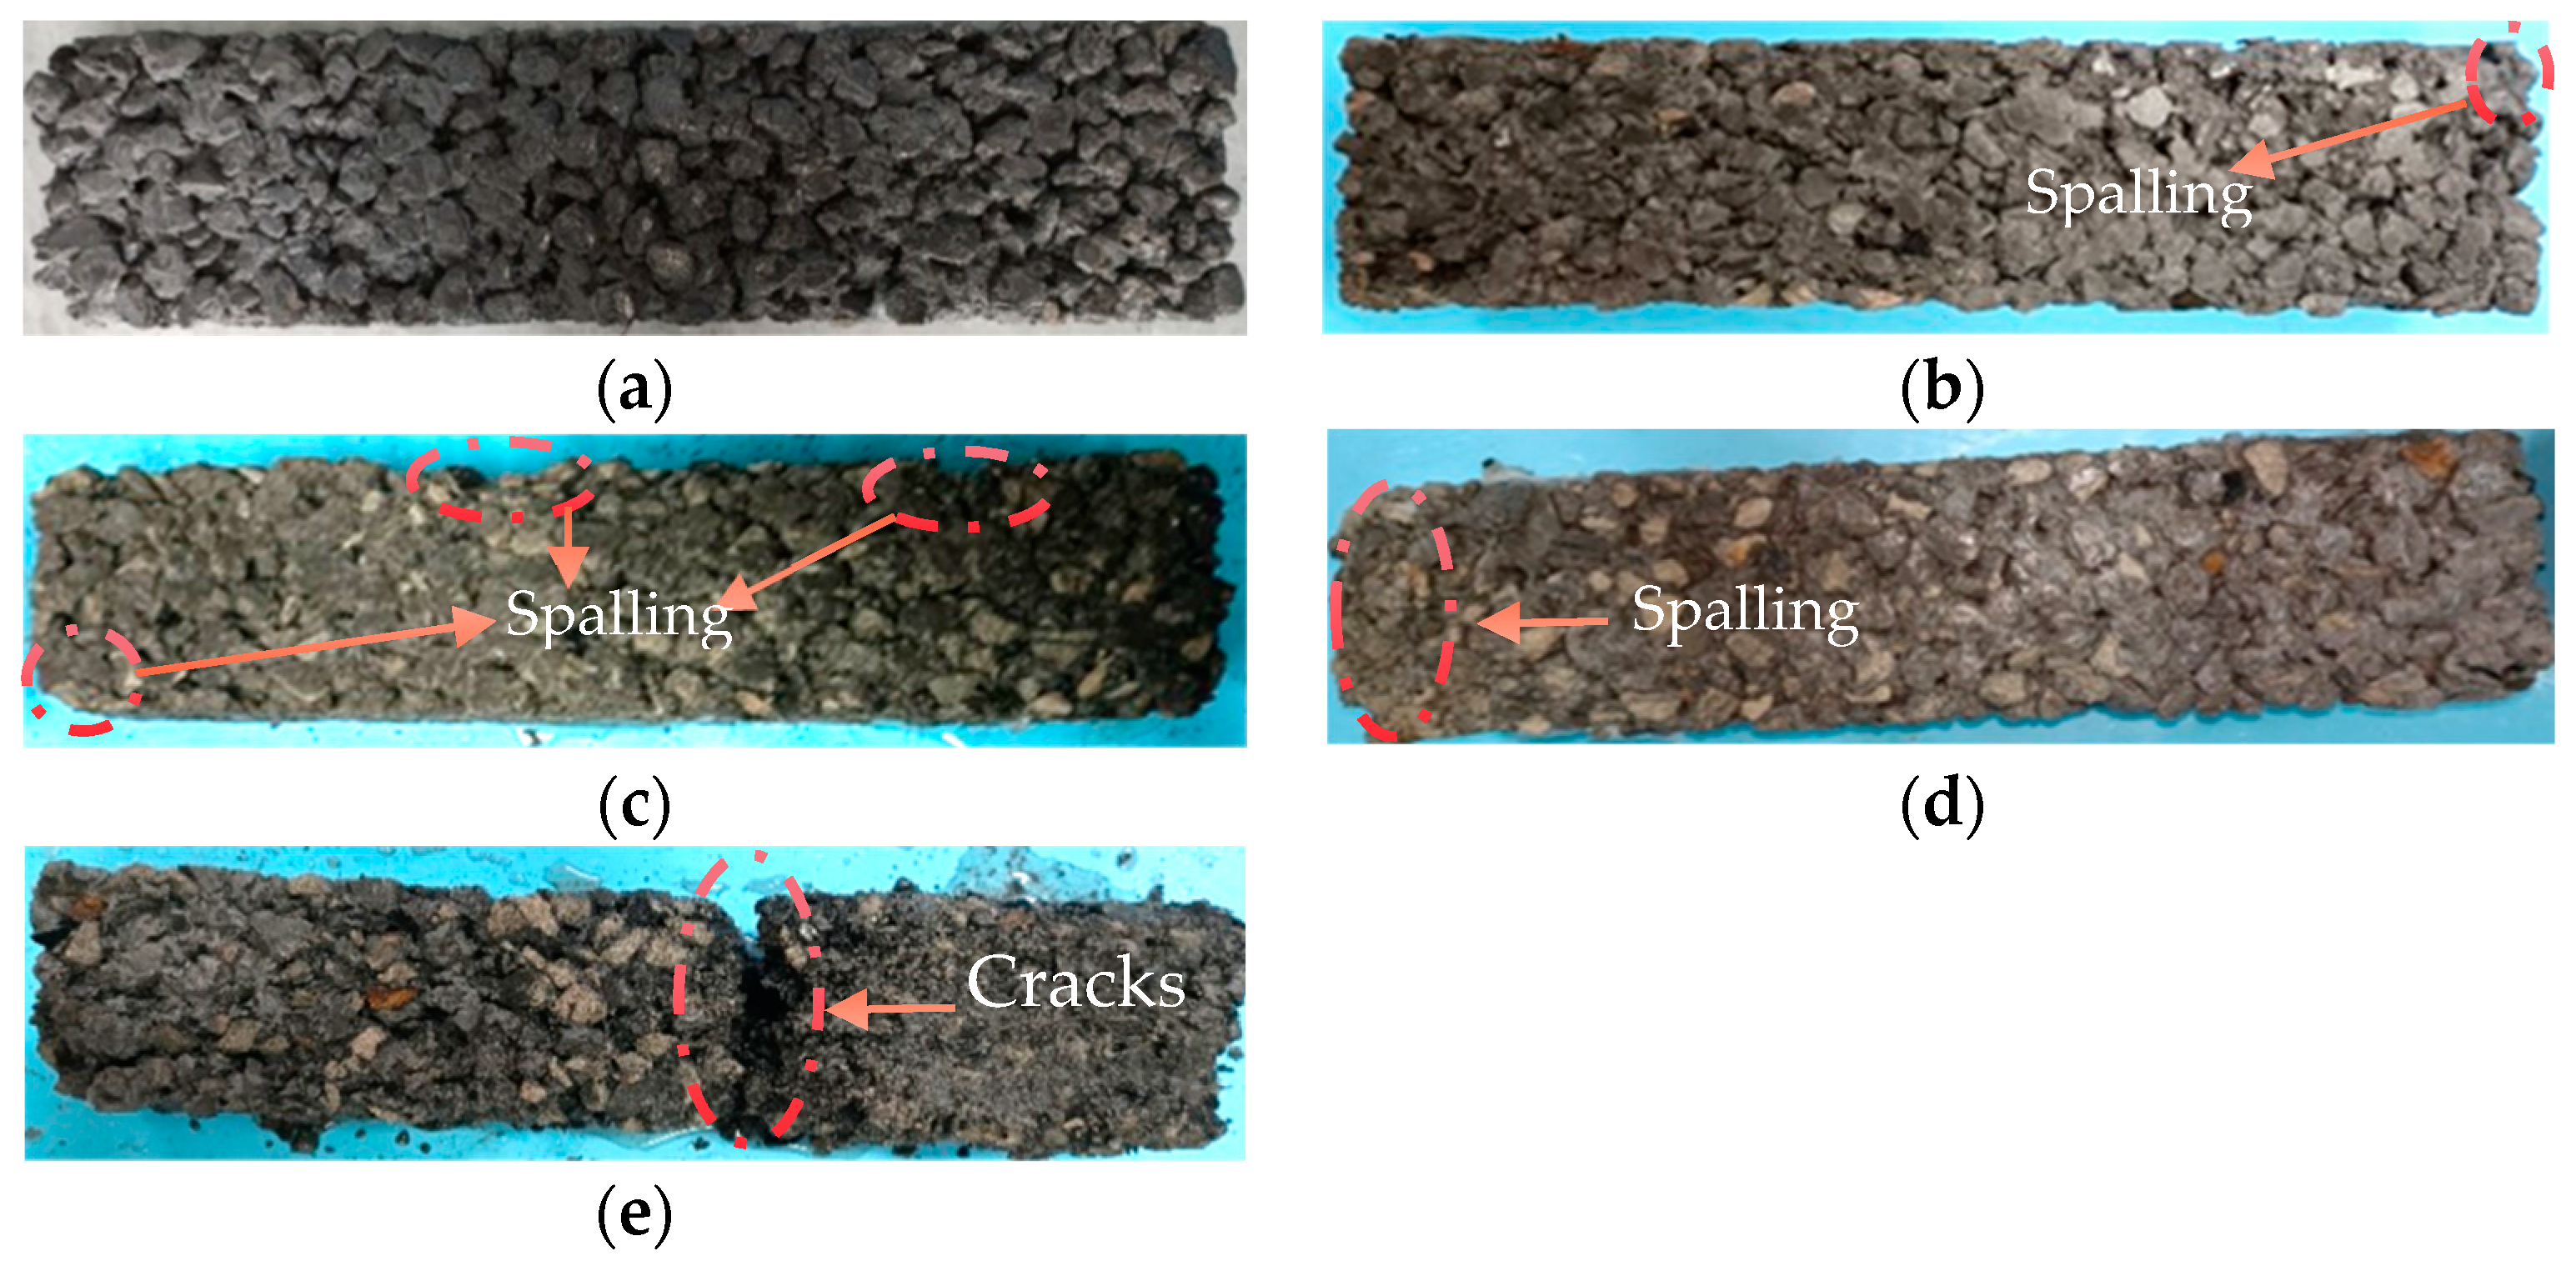
3.1. Apparent Morphology Changes of Specimen
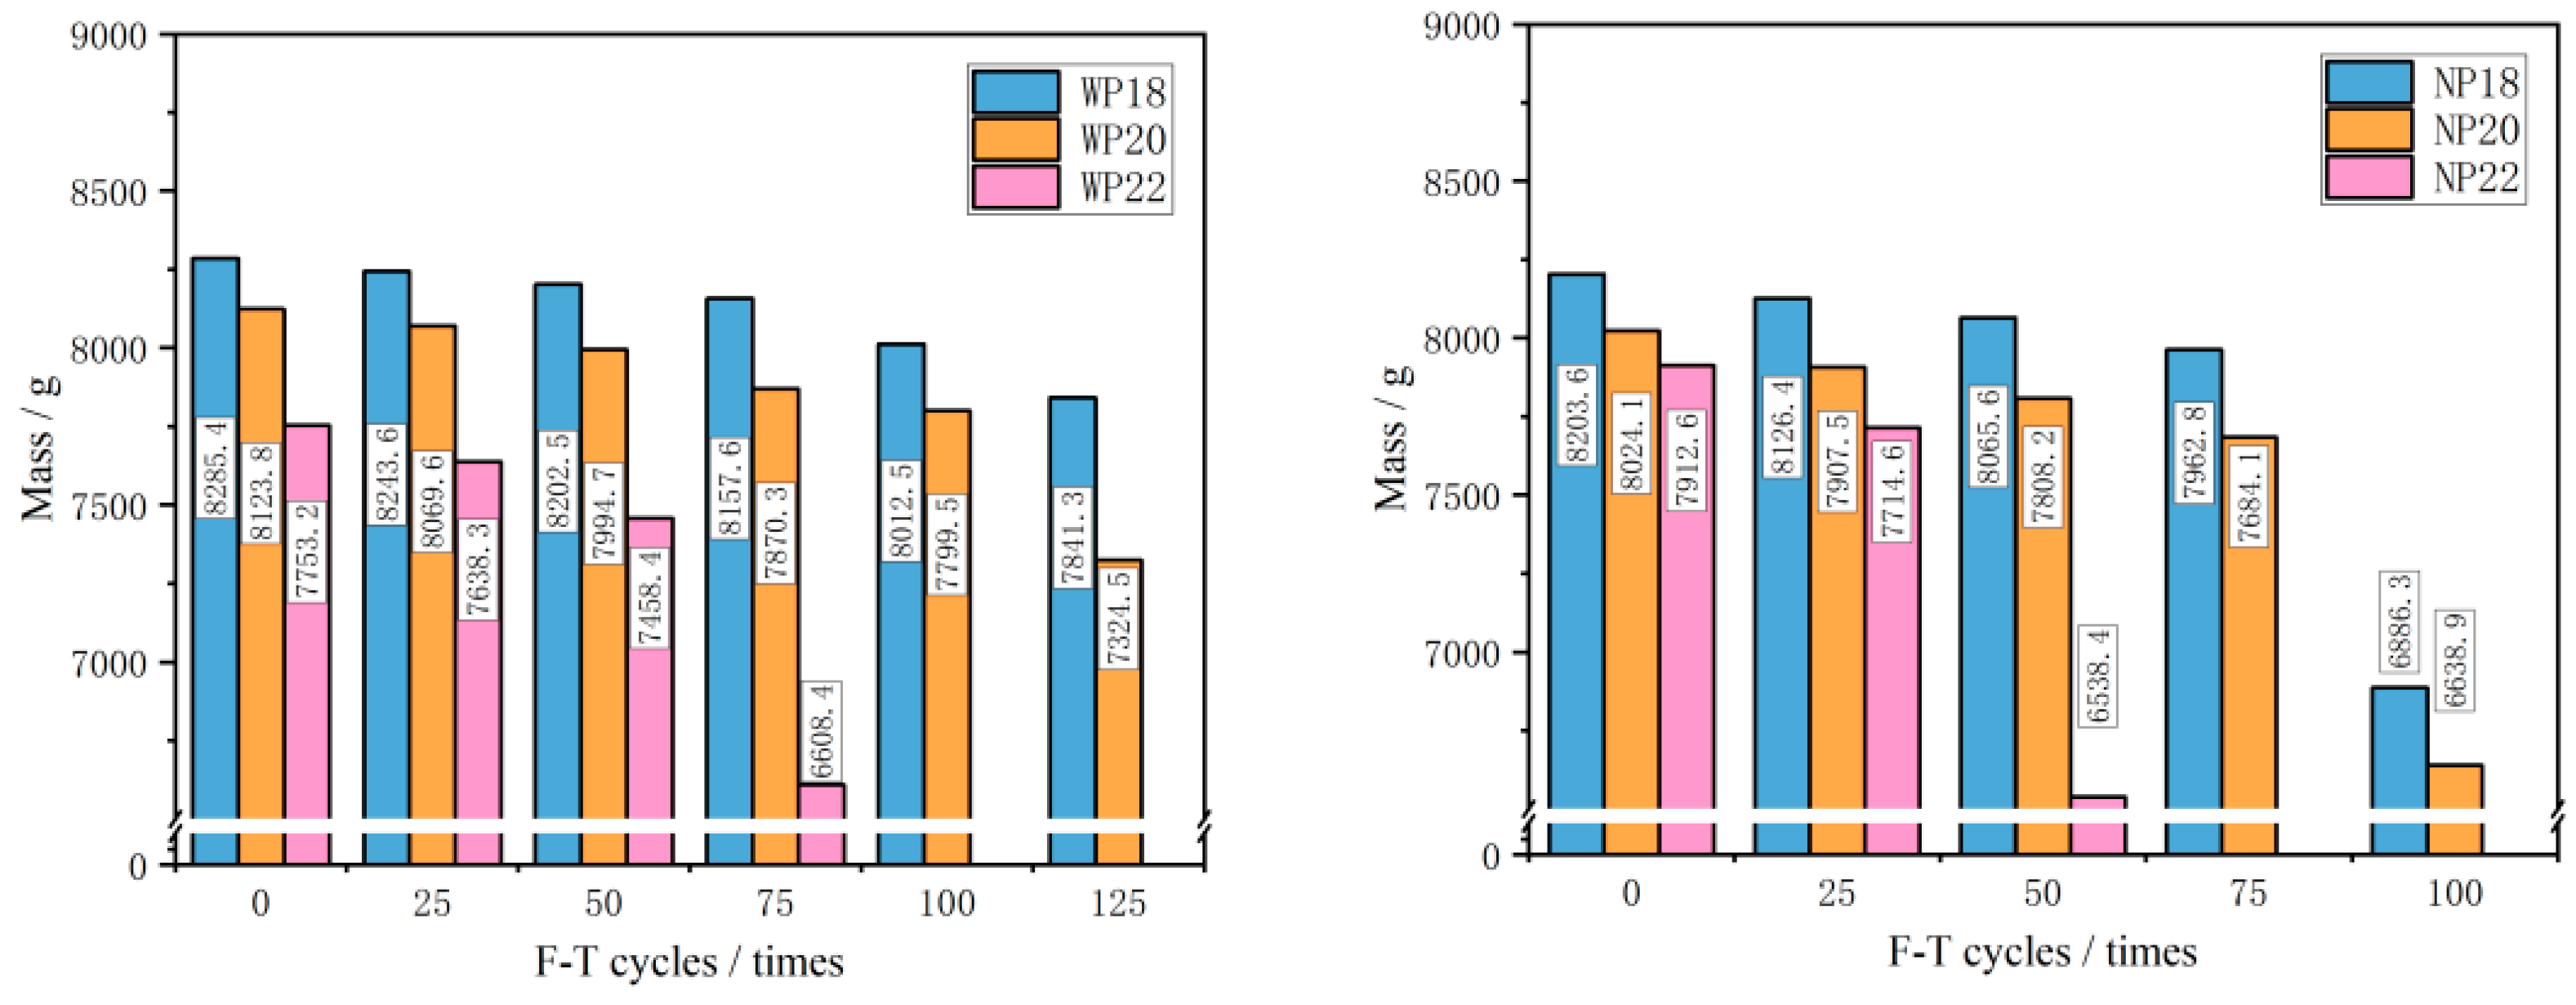
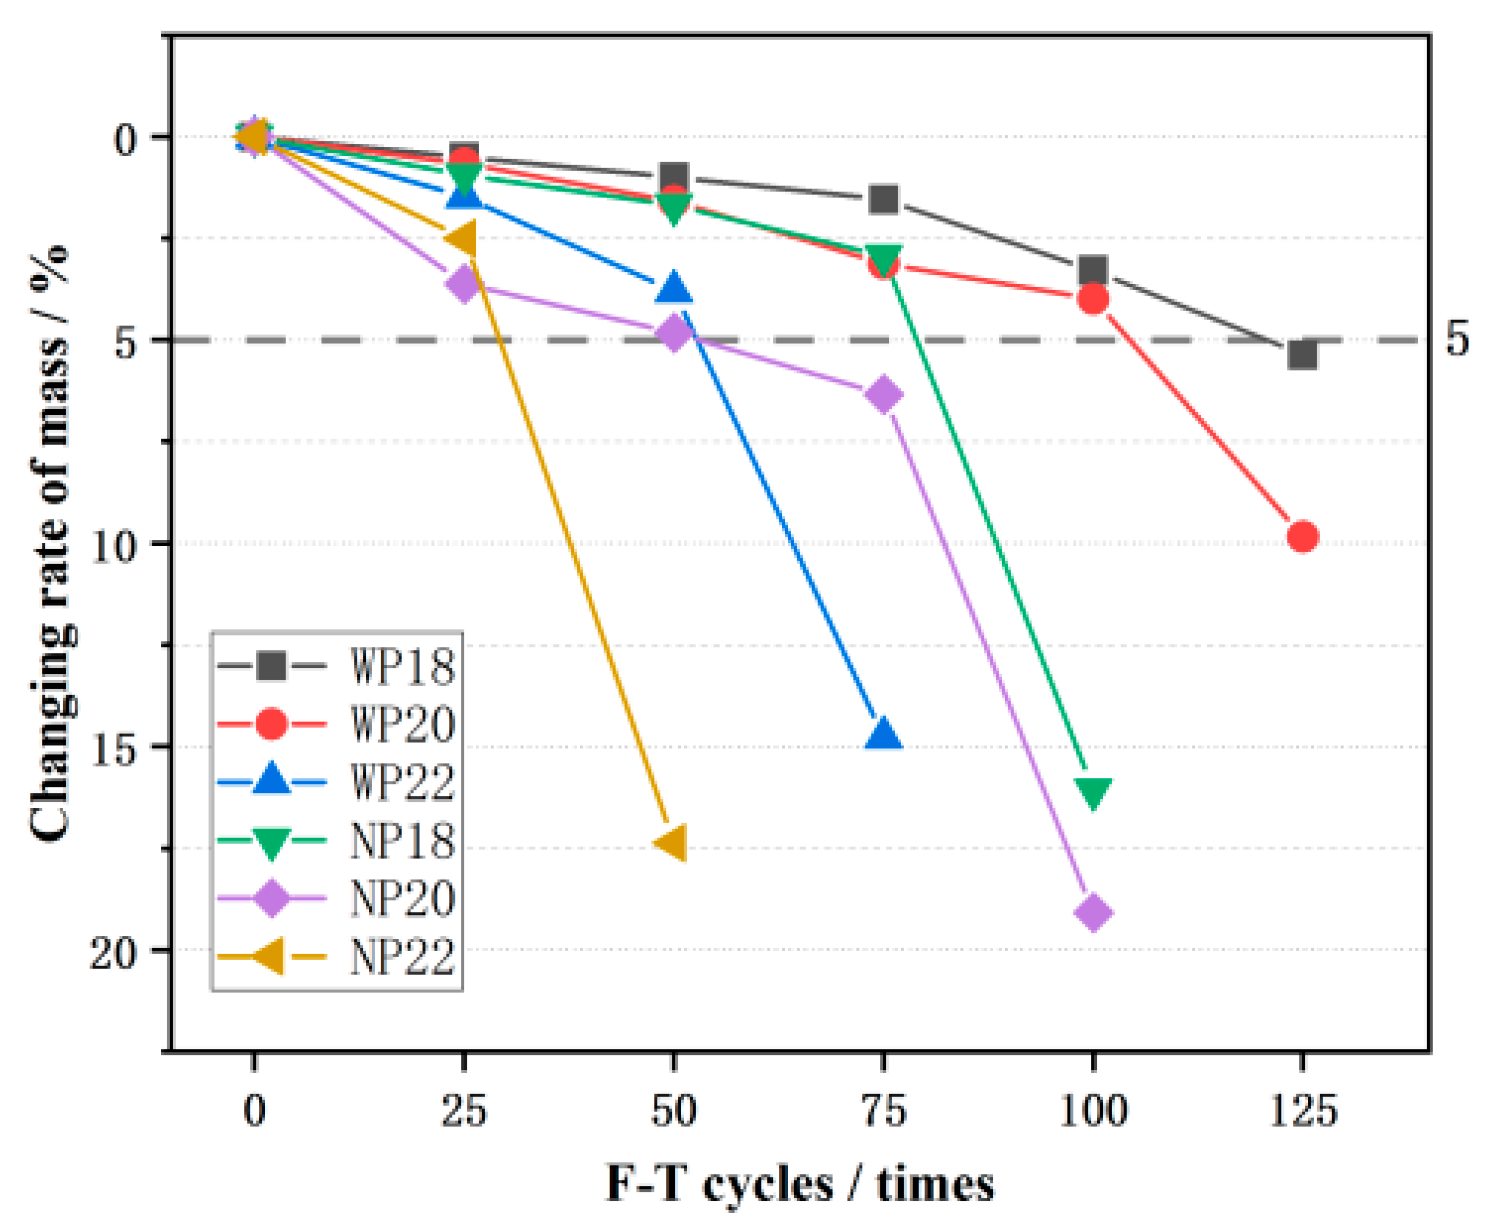
3.2. Mass Loss
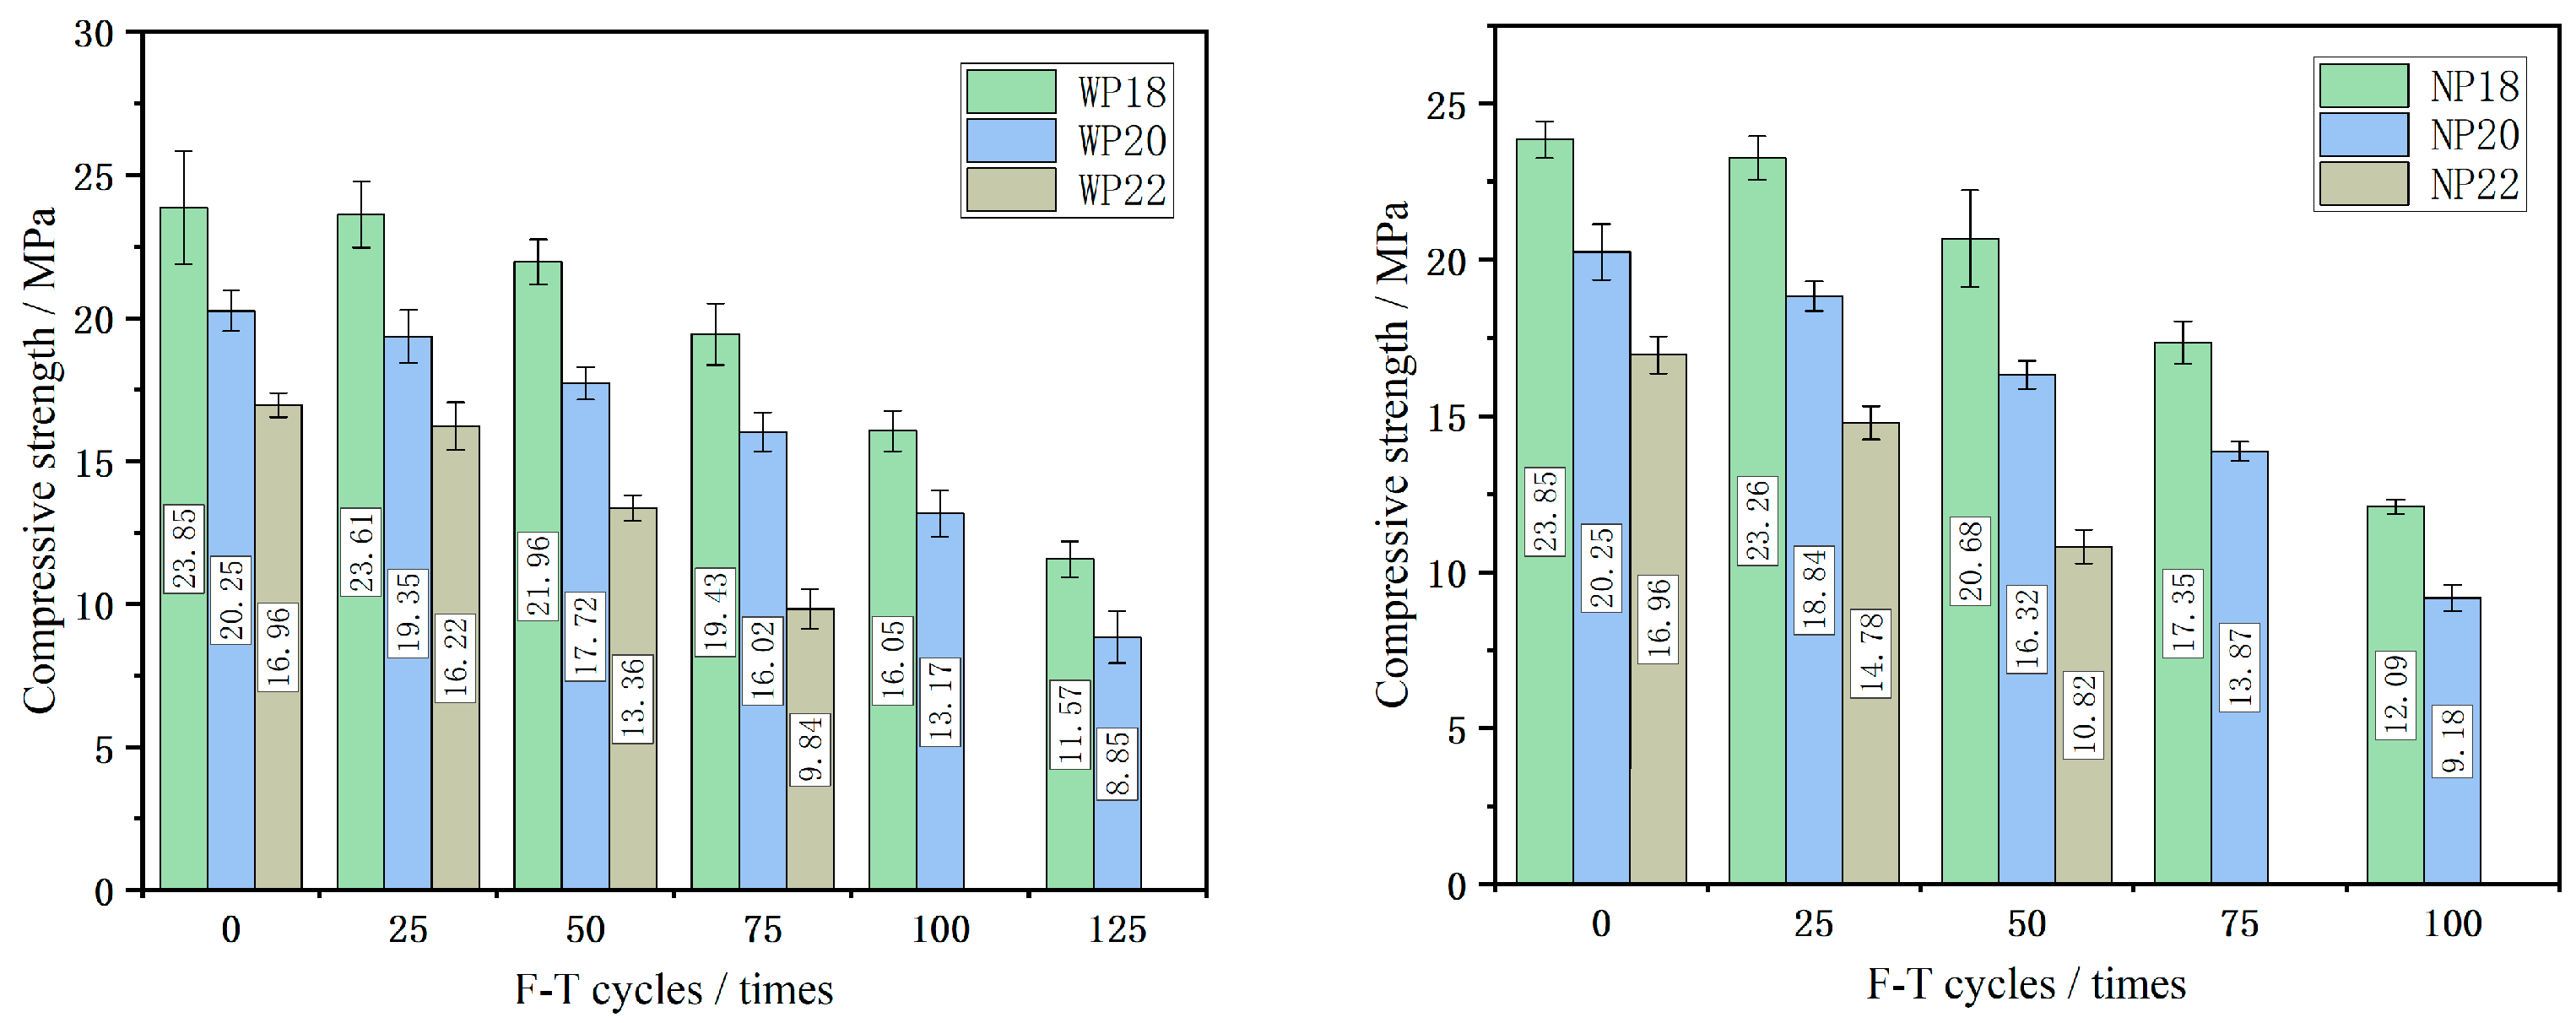
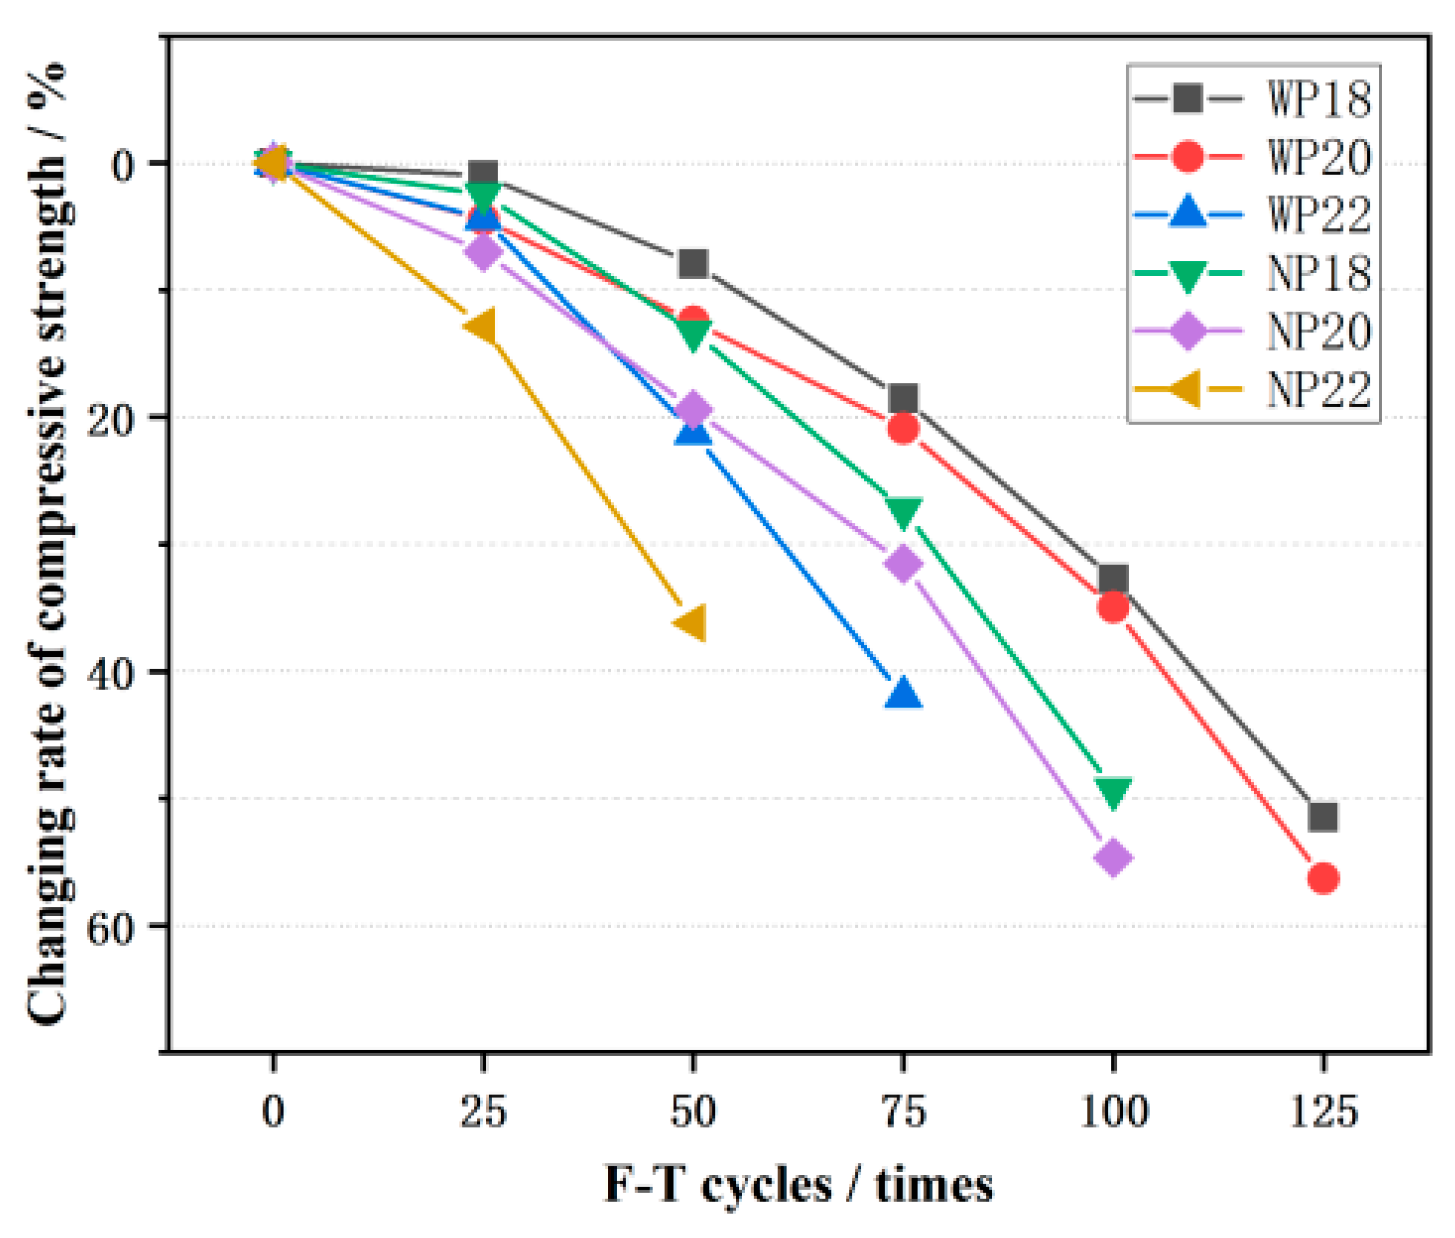
3.3. Compressive Behavior
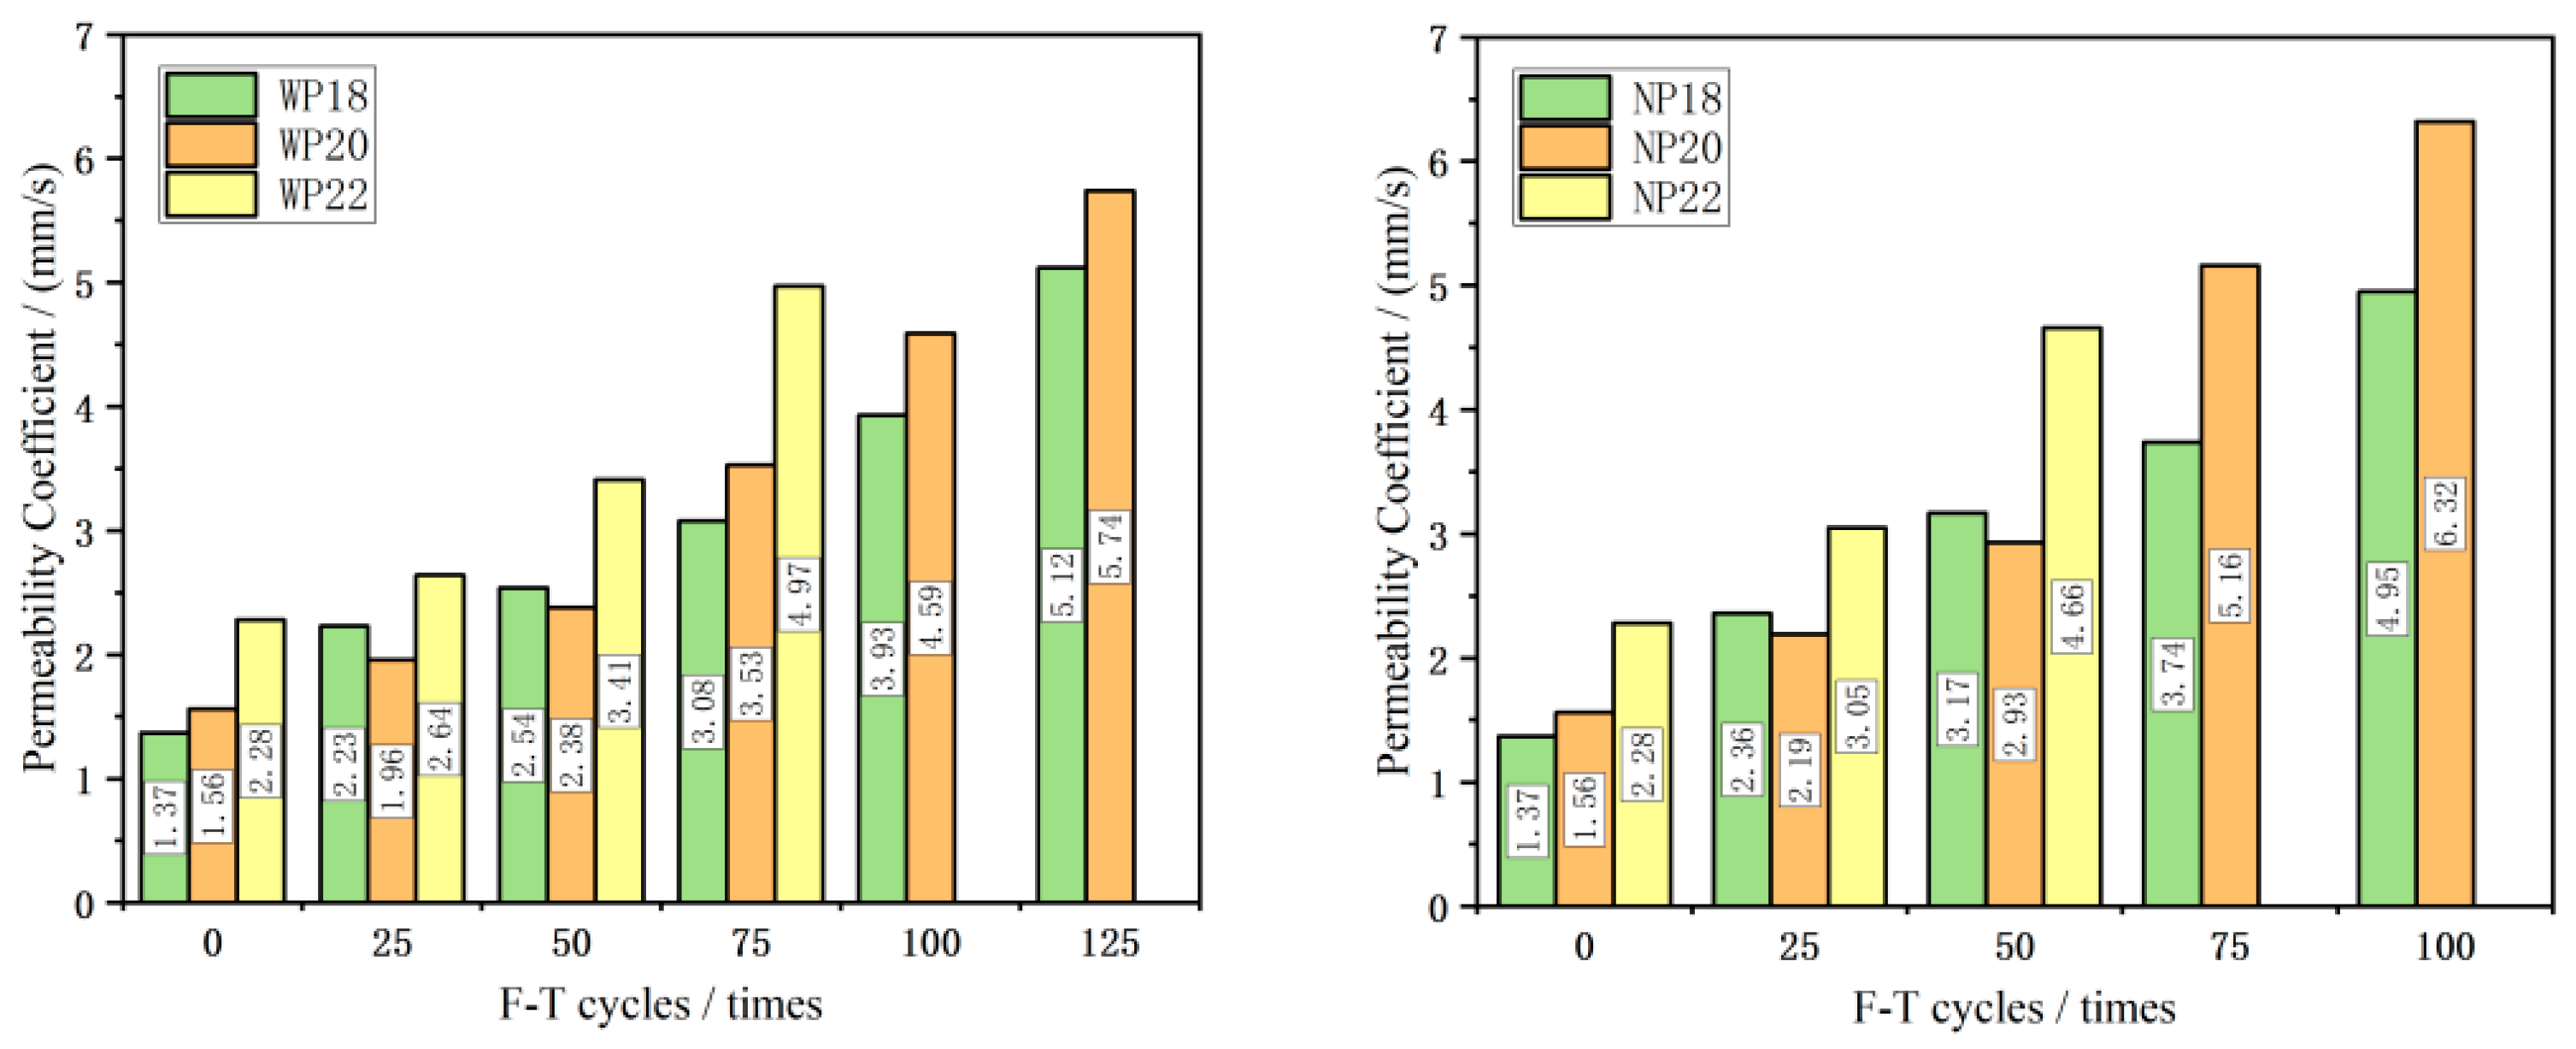
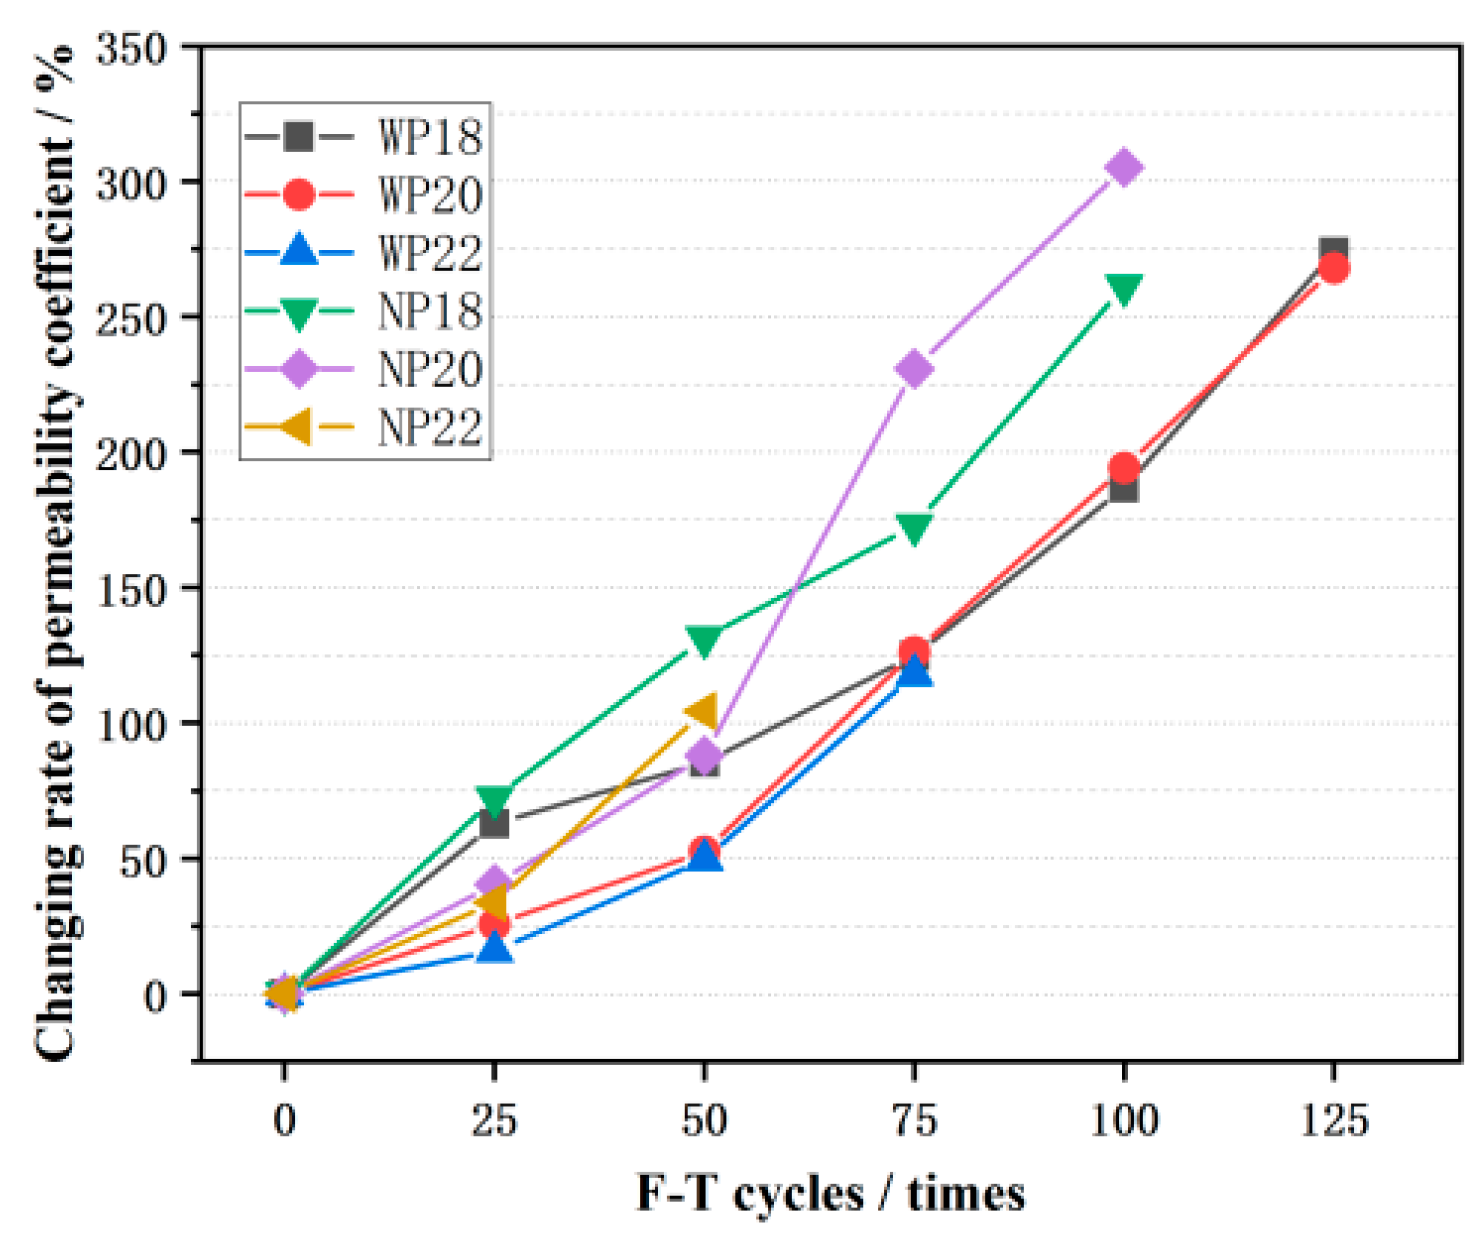
3.4. The Permeability Coefficient
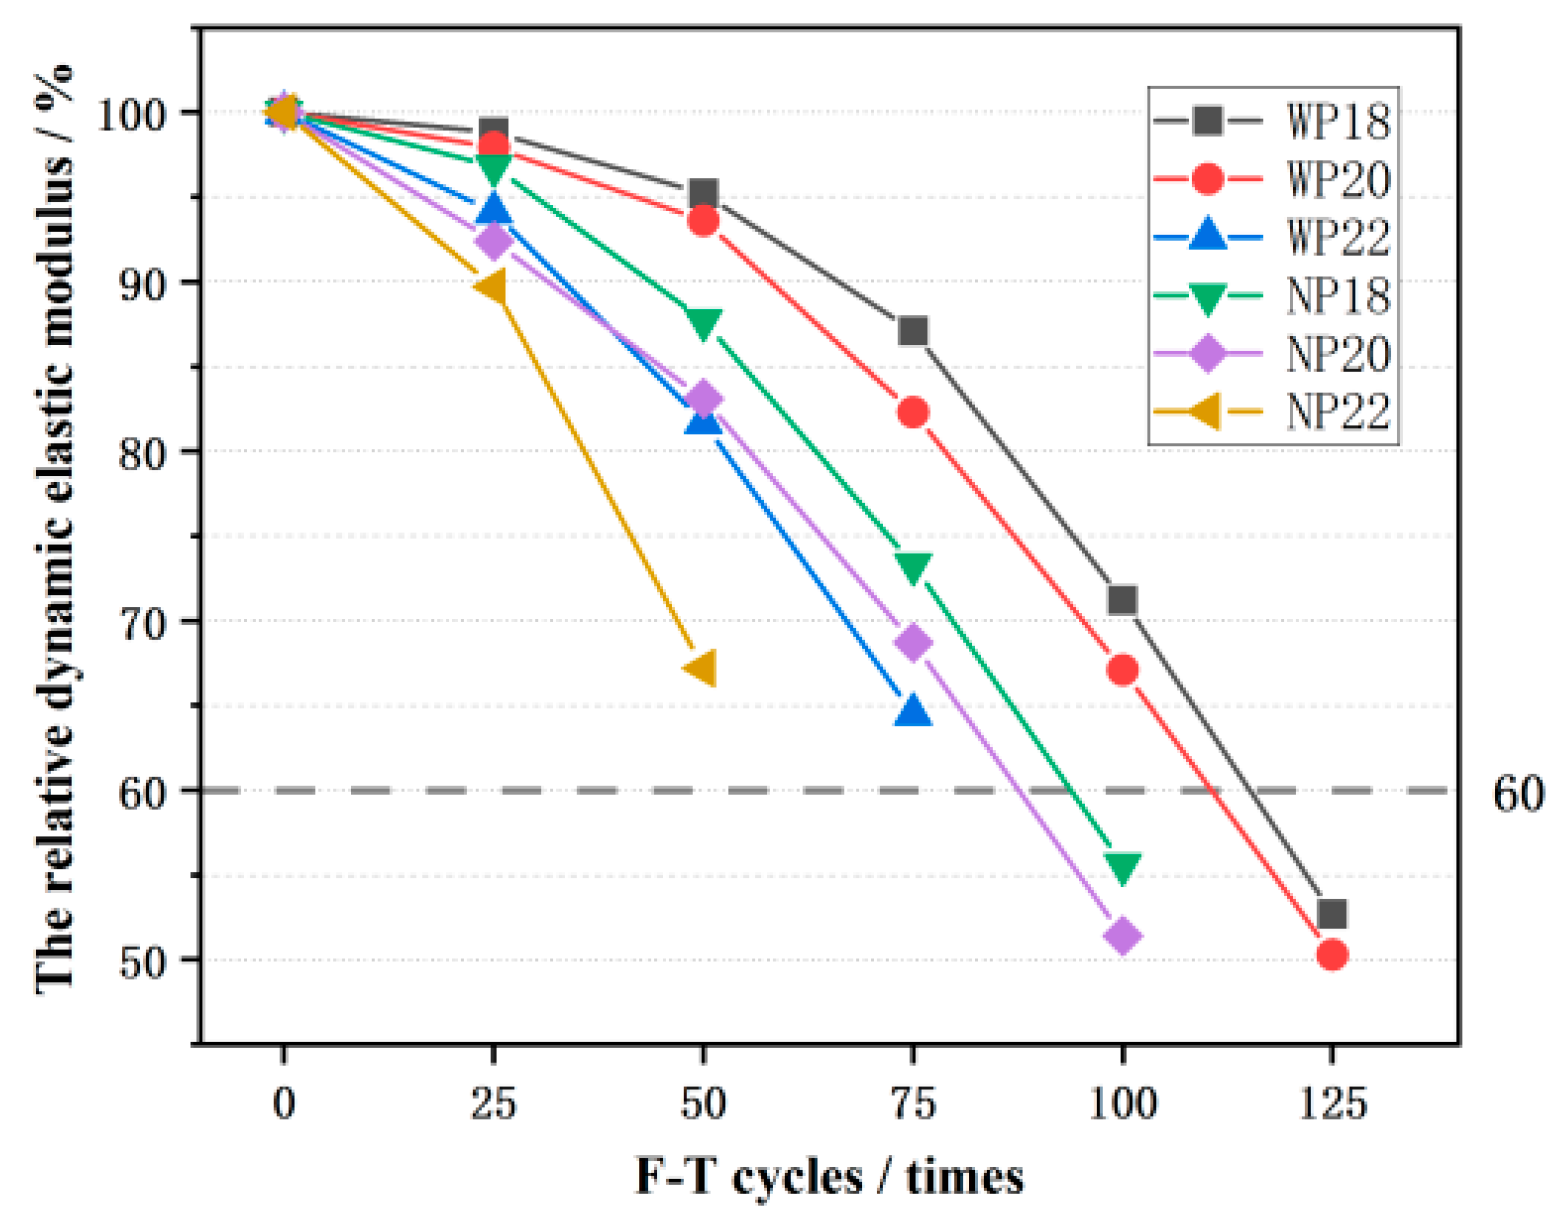
3.5. The Relative Dynamic Elastic Modulus (RDEM)
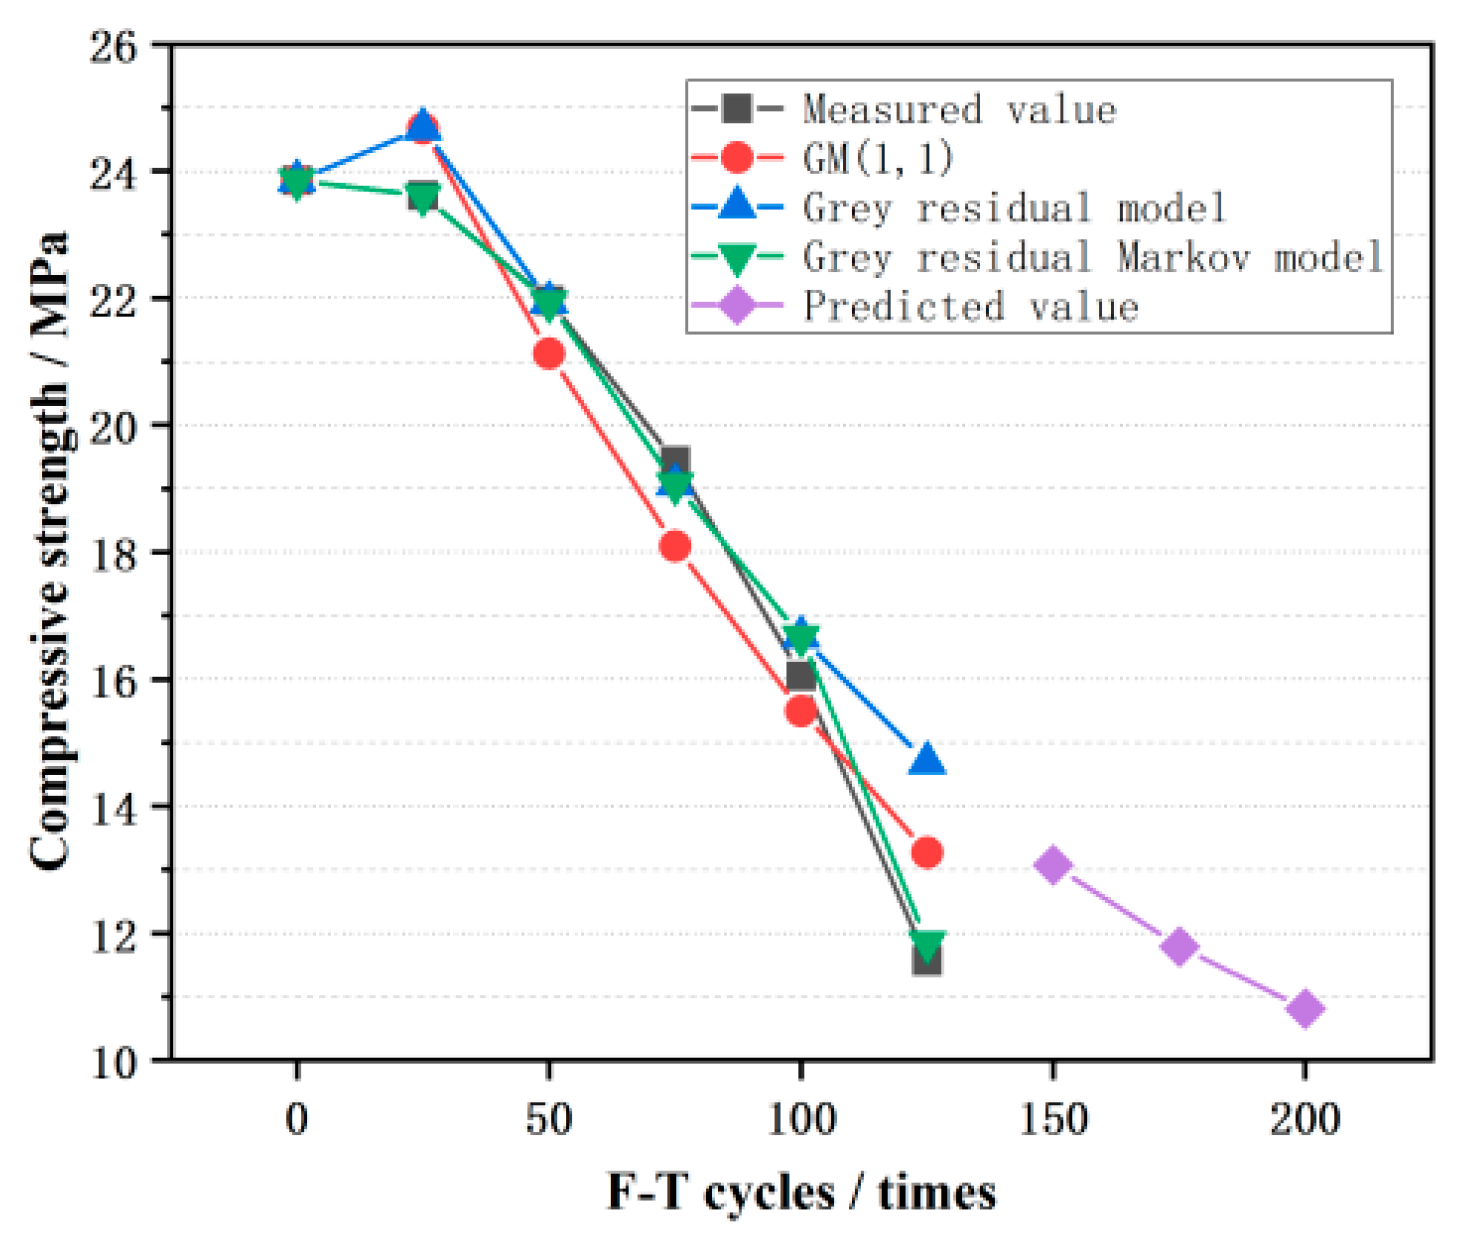
4. Model of Compressive Strength of CGPC after F-T Cycles
4.1. Model Establishment Method
4.1.1. GM (1,1) Model Establishment
4.1.2. Grey Residual Model
4.1.3. Grey Residual–Markov Model
4.1.4. The Relative Error
4.2. Model Establishment of Compressive Strength of CGPC after F-T Cycles
- (1)
- Constructing the original data series:
- (2)
- Obtaining the cumulative sequence and the sequence of adjacent means
- (3)
- Calculating parameters a and b via MATLAB R2023b
- (4)
- The GM (1,1) of the compressive strength CGPC is as follows:
- (5)
- , , and and the relative error of the grey residual model are listed in Table 6.
- (6)
- The relative value of residuals is used to divide it into two states: (−, 0) and (0, ), and the transition probability matrix is calculated as per the state of the residual relative value sequence.
- (7)
4.3. Model Validation and Prediction
5. Conclusions
Author Contributions
Funding
Institutional Review Board Statement
Informed Consent Statement
Data Availability Statement
Conflicts of Interest
References
- Zhou, C.; Wang, J.; Shao, X.; Li, L.; Sun, J.; Wang, X. The feasibility of using ultra-high performance concrete (UHPC) to strengthen RC beams in torsion. J. Mater. Res. Technol. 2023, 24, 9961–9983. [Google Scholar] [CrossRef]
- Elango, K.S.; Gopi, R.; Saravanakumar, R.; Rajeshkumar, V.; Vivek, D.; Raman, S.V. Properties of pervious concrete—A state of the art review. Mater. Today Proc. 2021, 45, 2422–2425. [Google Scholar] [CrossRef]
- El-Hassan, H.; Kianmehr, P.; Zouaoui, S. Properties of pervious concrete incorporating recycled concrete aggregates and slag. Constr. Build. Mater. 2019, 212, 164–175. [Google Scholar] [CrossRef]
- Xiang, J.; Liu, H.; Lu, H.; Gui, F. Degradation Mechanism and Numerical Simulation of Pervious Concrete under Salt Freezing-Thawing Cycle. Materials 2022, 15, 3054. [Google Scholar] [CrossRef] [PubMed]
- Kevern, J.T.; Schaefer, V.R.; Wang, K. Temperature Behavior of Pervious Concrete Systems. Transp. Res. Rec. J. Transp. Res. Board 2009, 2098, 94–101. [Google Scholar] [CrossRef]
- Chen, L.; Chen, Z.; Xie, Z.; Wei, L.; Hua, J.; Huang, L.; Yap, P. Recent developments on natural fiber concrete: A review of properties, sustainability, applications, barriers, and opportunities. Dev. Built Environ. 2023, 16, 100255. [Google Scholar] [CrossRef]
- Nguyen, D.H.; Boutouil, M.; Sebaibi, N.; Baraud, F.; Leleyter, L. Durability of pervious concrete using crushed seashells. Constr. Build. Mater. 2017, 135, 137–150. [Google Scholar] [CrossRef]
- Khankhaje, E.; Salim, M.R.; Mirza, J.; Hussin, M.W.; Rafieizonooz, M. Properties of sustainable lightweight pervious concrete containing oil palm kernel shell as coarse aggregate. Constr. Build. Mater. 2016, 126, 1054–1065. [Google Scholar] [CrossRef]
- Khankhaje, E.; Salim, M.R.; Mirza, J.; Salmiati; Hussin, M.W.; Khan, R.; Rafieizonooz, M. Properties of quiet pervious concrete containing oil palm kernel shell and cockleshell. Appl. Acoust. 2017, 122, 113–120. [Google Scholar] [CrossRef]
- Gao, S.; Huang, K.; Chu, W.; Wang, W. Feasibility Study of Pervious Concrete with Ceramsite as Aggregate Considering Mechanical Properties, Permeability, and Durability. Materials 2023, 16, 5127. [Google Scholar] [CrossRef]
- Zaetang, Y.; Sata, V.; Wongsa, A.; Chindaprasirt, P. Properties of pervious concrete containing recycled concrete block aggregate and recycled concrete aggregate. Constr. Build. Mater. 2016, 111, 15–21. [Google Scholar] [CrossRef]
- Ngohpok, C.; Sata, V.; Satiennam, T.; Klungboonkrong, P.; Chindaprasirt, P. Mechanical Properties, Thermal Conductivity, and Sound Absorption of Pervious Concrete Containing Recycled Concrete and Bottom Ash Aggregates. Ksce J. Civ. Eng. 2018, 22, 1369–1376. [Google Scholar] [CrossRef]
- Chen, X.; Shi, D.; Shen, N.; Li, S.; Liu, S. Experimental Study and Analytical Modeling on Fatigue Properties of Pervious Concrete Made with Natural and Recycled Aggregates. Int. J. Concr. Struct. Mater. 2019, 13, 10. [Google Scholar] [CrossRef]
- Tang, Y.; Wang, Y.; Wu, D.; Chen, M.; Pang, L.; Sun, J.; Feng, W.; Wang, X. Exploring temperature-resilient recycled aggregate concrete with waste rubber: An experimental and multi-objective optimization analysis. Rev. Adv. Mater. Sci. 2023, 62, 123185–123727. [Google Scholar] [CrossRef]
- Toghroli, A.; Mehrabi, P.; Shariati, M.; Trung, N.T.; Jahandari, S.; Rasekh, H. Evaluating the use of recycled concrete aggregate and pozzolanic additives in fiber-reinforced pervious concrete with industrial and recycled fibers. Constr. Build. Mater. 2020, 252, 118997. [Google Scholar] [CrossRef]
- Yu, L.; Xia, J.; Xia, Z.; Gu, J.; Xu, H.; Wang, Y. Axial compressive behavior of basalt and carbon FRP-confined coal gangue concrete. Constr. Build. Mater. 2023, 371, 130803. [Google Scholar] [CrossRef]
- Yu, L.; Xia, J.; Xia, Z.; Chen, M.; Wang, J.; Zhang, Y. Study on the mechanical behavior and micro-mechanism of concrete with coal gangue fine and coarse aggregate. Constr. Build. Mater. 2022, 338, 127626. [Google Scholar] [CrossRef]
- Yu, L.; Xia, J.; Gu, J.; Zhang, S.; Zhou, Y. Degradation Mechanism of Coal Gangue Concrete Suffering from Sulfate Attack in the Mine Environment. Materials 2023, 16, 1234. [Google Scholar] [CrossRef]
- Li, Y.; Liu, S.; Guan, X. Multitechnique investigation of concrete with coal gangue. Constr. Build. Mater. 2021, 301, 124114. [Google Scholar] [CrossRef]
- Wu, C.; Zhang, C.; Li, J.; Wang, X.; Jiang, W.; Yang, S.; Wang, W. A sustainable low-carbon pervious concrete using modified coal gangue aggregates based on ITZ enhancement. J. Clean. Prod. 2022, 377, 134310. [Google Scholar] [CrossRef]
- Wu, C.; Jiang, W.; Zhang, C.; Li, J.; Wu, S.; Wang, X.; Xu, Y.; Wang, W.; Feng, M. Preparation of solid-waste-based pervious concrete for pavement: A two-stage utilization approach of coal gangue. Constr. Build. Mater. 2022, 319, 125962. [Google Scholar] [CrossRef]
- Barišić, I.; Netinger Grubeša, I.; Dokšanović, T.; Zvonarić, M. Influence of Clogging and Unbound Base Layer Properties on Pervious Concrete Drainage Characteristics. Materials 2020, 13, 2455. [Google Scholar] [CrossRef] [PubMed]
- Tsang, C.; Shehata, M.; Lotfy, A. Optimizing a Test Method to Evaluate Resistance of Pervious Concrete to Cycles of Freezing and Thawing in the Presence of Different Deicing Salts. Materials 2016, 9, 878. [Google Scholar] [CrossRef] [PubMed]
- Wu, H.; Liu, Z.; Sun, B.; Yin, J. Experimental investigation on freeze–thaw durability of Portland cement pervious concrete (PCPC). Constr. Build. Mater. 2016, 117, 63–71. [Google Scholar] [CrossRef]
- Vancura, M.; Macdonald, K.; Khazanovich, L. Microscopic analysis of paste and aggregate distresses in pervious concrete in a wet, hard freeze climate. Cem. Concr. Compos. 2011, 33, 1080–1085. [Google Scholar] [CrossRef]
- Kevern, J.T.; Wang, K.; Schaefer, V.R. Effect of Coarse Aggregate on the Freeze-Thaw Durability of Pervious Concrete. J. Mater. Civ. Eng. 2010, 22, 469–475. [Google Scholar] [CrossRef]
- Yang, Z. Freezing-and-Thawing Durability of Pervious Concrete under Simulated Field Conditions. ACI Mater. J. 2011, 108, 187. [Google Scholar] [CrossRef]
- Shu, X.; Huang, B.; Wu, H.; Dong, Q.; Burdette, E.G. Performance comparison of laboratory and field produced pervious concrete mixtures. Constr. Build. Mater. 2011, 25, 3187–3192. [Google Scholar] [CrossRef]
- Taheri, B.M.; Ramezanianpour, A.M.; Sabokpa, S.; Gapele, M. Experimental evaluation of freeze-thaw durability of pervious concrete. J. Build. Eng. 2021, 33, 101617. [Google Scholar] [CrossRef]
- Liu, H.B.; Zhou, S.; Wei, H.B.; Li, W.J.; Xiu, R.; Zhu, B. Mechanical properties, permeability and freeze-thaw durability of low sand rate pervious concrete. J. Phys. Conf. Ser. 2021, 1765, 12022. [Google Scholar] [CrossRef]
- Song, H.; Yao, J.; Xiang, J. The role of aggregate and cement paste in the deterioration of the transitional interface zone of pervious concrete during freeze-thaw cycles. Case Stud. Constr. Mater. 2022, 16, e1086. [Google Scholar] [CrossRef]
- Yu, H.; Ma, H.; Yan, K. An equation for determining freeze-thaw fatigue damage in concrete and a model for predicting the service life. Constr. Build. Mater. 2017, 137, 104–116. [Google Scholar] [CrossRef]
- Qiu, J.; Zhou, Y.; Vatin, N.I.; Guan, X.; Sultanov, S.; Khemarak, K. Damage constitutive model of coal gangue concrete under freeze-thaw cycles. Constr. Build. Mater. 2020, 264, 120720. [Google Scholar] [CrossRef]
- Liu, D.; Tu, Y.; Sas, G.; Elfgren, L. Freeze-thaw damage evaluation and model creation for concrete exposed to freeze–thaw cycles at early-age. Constr. Build. Mater. 2021, 312, 125352. [Google Scholar] [CrossRef]
- Gong, L.; Liang, Y.; Zhang, B.; Gong, X.; Yang, Y. Durability Evaluation of Concrete in Cold and Arid Regions Based on Grey Relational Theory. Adv. Civ. Eng. 2022, 2022, 6287810. [Google Scholar] [CrossRef]
- Yu, B.; Sun, Z.; Qi, L. Freeze-Thaw Splitting Strength Analysis of PAC Based on the Gray-Markov Model. Adv. Mater. Sci. Eng. 2021, 2021, 9954504. [Google Scholar] [CrossRef]
- GB175-2007; Common Portland Cement. China Standards Press: Beijing, China, 2007.
- GB/T 14685-2022; Pebble and Crushed Stone for Construction. China Standards Press: Beijing, China, 2022.
- GB/T 50082-2019; Code for Durability Design of Concrete Structures. China Standards Press: Beijing, China, 2019.
- CJJ/T135-2009; Technical Specification for Pervious Cement Concrete Pavement. China Standards Press: Beijing, China, 2009.
- Li, B.; Cai, L.; Zhu, W. Predicting Service Life of Concrete Structure Exposed to Sulfuric Acid Environment by Grey System Theory. Int. J. Civ. Eng. 2018, 16, 1017–1027. [Google Scholar] [CrossRef]
- Chen, K.; Zhang, T.; Lu, B.; Zheng, X. The application of grey residual error GM(1,1) model baesd on Markvo to aging behavior prediction of plastic. J. Chongqing Univ. 2014, 37, 71–76. (In Chinese) [Google Scholar]
- Wang, J.; Wang, J. Prediction of Short Term Wind Speed Based on Grey Residual Marko Model. Low Volt. Appar. 2022, 12, 78–82. (In Chinese) [Google Scholar] [CrossRef]
- Kang, C.; Gong, L.; Wang, Z.; Yang, Y.; Wang, H. Prediction of hydraulic concrete degradation based on gray residual GM(1,1)-Markov model. Hydro-Sci. Eng. 2021, 1, 95–103. (In Chinese) [Google Scholar]


| Chemical Composition | CaO | SiO2 | Al2O3 | Fe2O3 | MgO | SO3 | Cl− | Others |
|---|---|---|---|---|---|---|---|---|
| (%) | 56.77 | 20.86 | 5.9 | 3.61 | 3.5 | 2.43 | 0.02 | 6.91 |
| Specific Surface Area (m2/kg) | Density (g/cm3) | Compressive Strength (MPa) | Flexural Strength (MPa) | Initial Setting Time (min) | Final Setting Time (min) | Stability | ||
|---|---|---|---|---|---|---|---|---|
| 3d | 28d | 3d | 28d | |||||
| 382 | 3.1 | 32.2 | 61.3 | 6 | 8.6 | 149 | 211 | Qualified |
| Particle Size (mm) | Loose Bulk Density (kg/m3) | Compacted Bulk Density (kg/m3) | Apparent Density (kg/m3) | Void Content (%) | Moisture Content (%) | Water Absorption (%) |
|---|---|---|---|---|---|---|
| 9.5~16 | 1206 | 1405 | 2818 | 44.7 | 0.67 | 2.68 |
| Chemical Composition | SiO2 | Al2O3 | CO3 | Fe2O3 | K2O | CaO | Na2O | MgO | Others |
|---|---|---|---|---|---|---|---|---|---|
| (%) | 61.7 | 19.11 | 5.83 | 4.16 | 3.04 | 2.35 | 2.28 | 0.64 | 0.89 |
| Sample Designation | Designed Porosity | Coal Gangue Aggregate (kg/m3) | Cement (kg/m3) | Water (kg/m3) | PC Reinforcement Agent (kg/m3) |
|---|---|---|---|---|---|
| P18 | 18% | 1376.90 | 540.98 | 156.88 | 17.31 |
| P20 | 20% | 1376.90 | 508.33 | 147.41 | 16.27 |
| P22 | 22% | 1376.90 | 475.68 | 137.95 | 15.22 |
| F-T Cycles | Measured Value (MPa) | ||||
|---|---|---|---|---|---|
| 0 | 23.85 | / | / | / | 23.85 |
| 25 | 23.61 | −1.06 | 1.06 | 1.06 | 24.67 |
| 50 | 21.96 | −0.83 | 0.83 | 0.81 | 21.94 |
| 75 | 19.43 | −1.33 | 1.34 | 0.98 | 19.07 |
| 100 | 16.05 | −0.53 | 0.55 | 1.17 | 16.67 |
| 125 | 11.57 | −1.66 | 1.70 | 1.42 | 14.69 |
| Measured Value (MPa) | Value of GM (1,1) Model | Value of Grey Residual Model | Value of Grey Residual Markov Model | |||
|---|---|---|---|---|---|---|
| Compressive Strength (MPa) | Relative Error | Compressive Strength (MPa) | Relative Error | Compressive Strength (MPa) | Relative Error | |
| 23.85 | 23.85 | 0.00% | 23.85 | 0.00% | 23.85 | 0.00% |
| 23.61 | 24.67 | 4.49% | 24.67 | 4.49% | 23.61 | 0.00% |
| 21.96 | 21.13 | 3.79% | 21.94 | 3.69% | 21.94 | 0.10% |
| 19.43 | 18.09 | 6.87% | 19.07 | 5.02% | 19.07 | 1.85% |
| 16.05 | 15.50 | 3.45% | 16.67 | 7.32% | 16.67 | 3.87% |
| 11.57 | 13.27 | 14.71% | 14.69 | 12.23% | 11.86 | 2.48% |
| Mean relative error | 6.66% | 6.55% | 2.08% | |||
Disclaimer/Publisher’s Note: The statements, opinions and data contained in all publications are solely those of the individual author(s) and contributor(s) and not of MDPI and/or the editor(s). MDPI and/or the editor(s) disclaim responsibility for any injury to people or property resulting from any ideas, methods, instructions or products referred to in the content. |
© 2023 by the authors. Licensee MDPI, Basel, Switzerland. This article is an open access article distributed under the terms and conditions of the Creative Commons Attribution (CC BY) license (https://creativecommons.org/licenses/by/4.0/).
Share and Cite
Wang, Y.; Xia, J.; Li, P.; Yu, L.; Yang, H.; Chen, Y. Experimental Study and Analytical Modeling on Properties of Freeze–Thaw Durability of Coal Gangue Pervious Concrete. Materials 2023, 16, 7104. https://doi.org/10.3390/ma16227104
Wang Y, Xia J, Li P, Yu L, Yang H, Chen Y. Experimental Study and Analytical Modeling on Properties of Freeze–Thaw Durability of Coal Gangue Pervious Concrete. Materials. 2023; 16(22):7104. https://doi.org/10.3390/ma16227104
Chicago/Turabian StyleWang, Yujing, Junwu Xia, Pengxu Li, Linli Yu, Han Yang, and Yidong Chen. 2023. "Experimental Study and Analytical Modeling on Properties of Freeze–Thaw Durability of Coal Gangue Pervious Concrete" Materials 16, no. 22: 7104. https://doi.org/10.3390/ma16227104