
Experimental Study on Repairing the Mechanical Characteristics of Oil-Contaminated Silty Clay in Ancient Dike with Modified Lime Mortar

 ,
,
Abstract
:1. Introduction
2. Methodology and Materials
2.1. Methodology
2.2. Materials
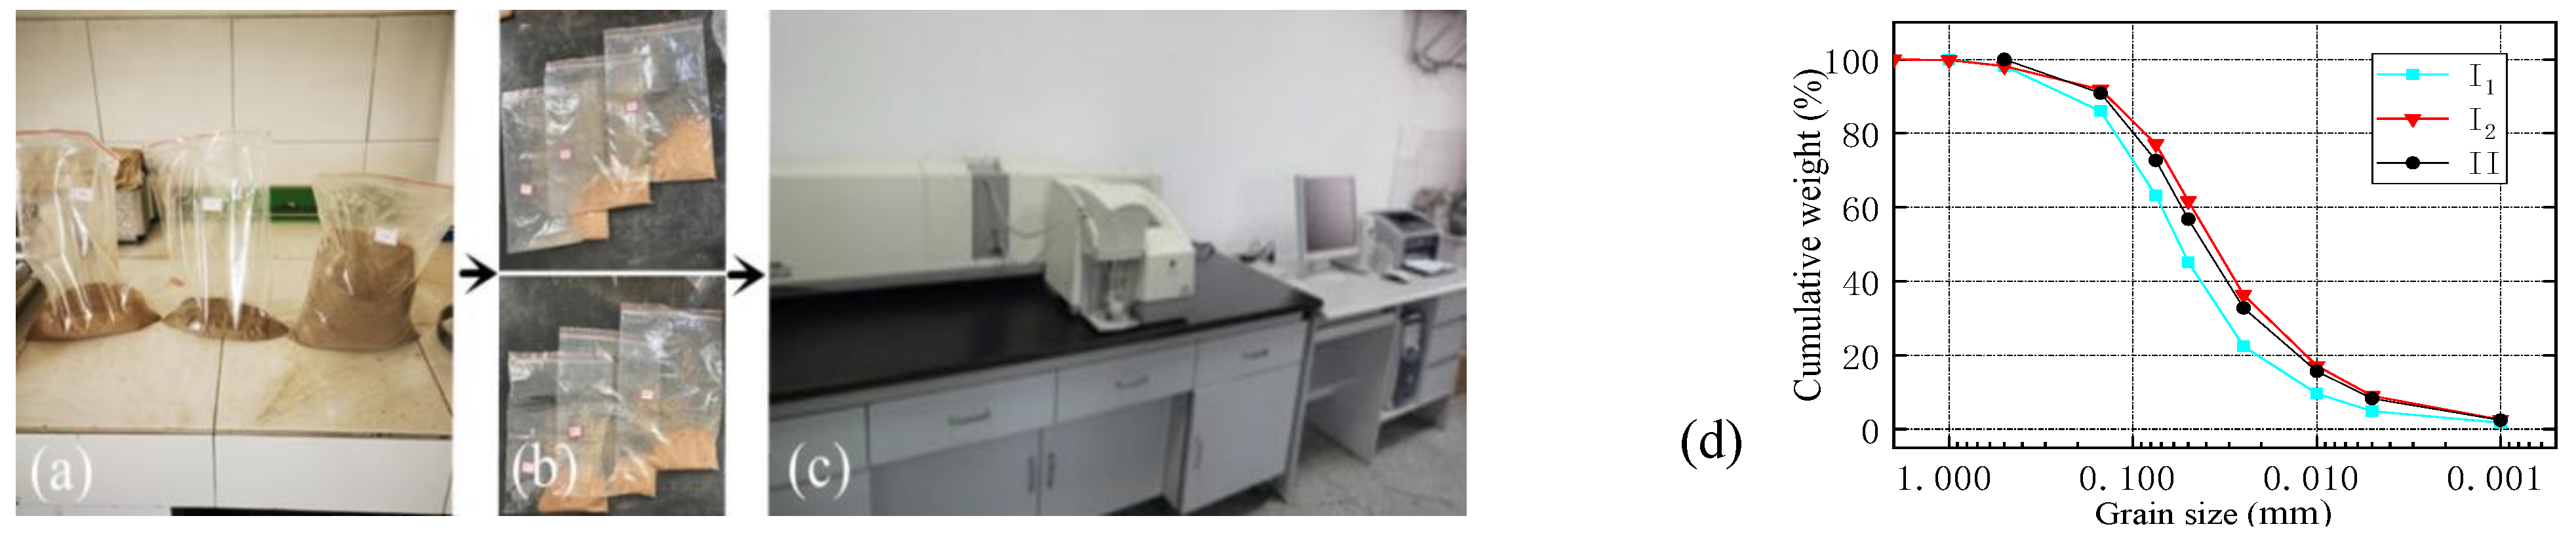
2.2.1. Soil
2.2.2. Oil
2.2.3. Prepare Oil Contaminated Soil
2.3. Test Method
3. Experiment and Analysis
3.1. Characteristics of Oil-Contaminated Soil
3.1.1. Microstructure Test
3.1.2. Strength Property Test
3.2. Properties of MLM with Oil-Contaminated Soil
3.2.1. Effect of MLM Content on Strength Index
3.2.2. Impact of Contaminated Soil Density on Strength Index
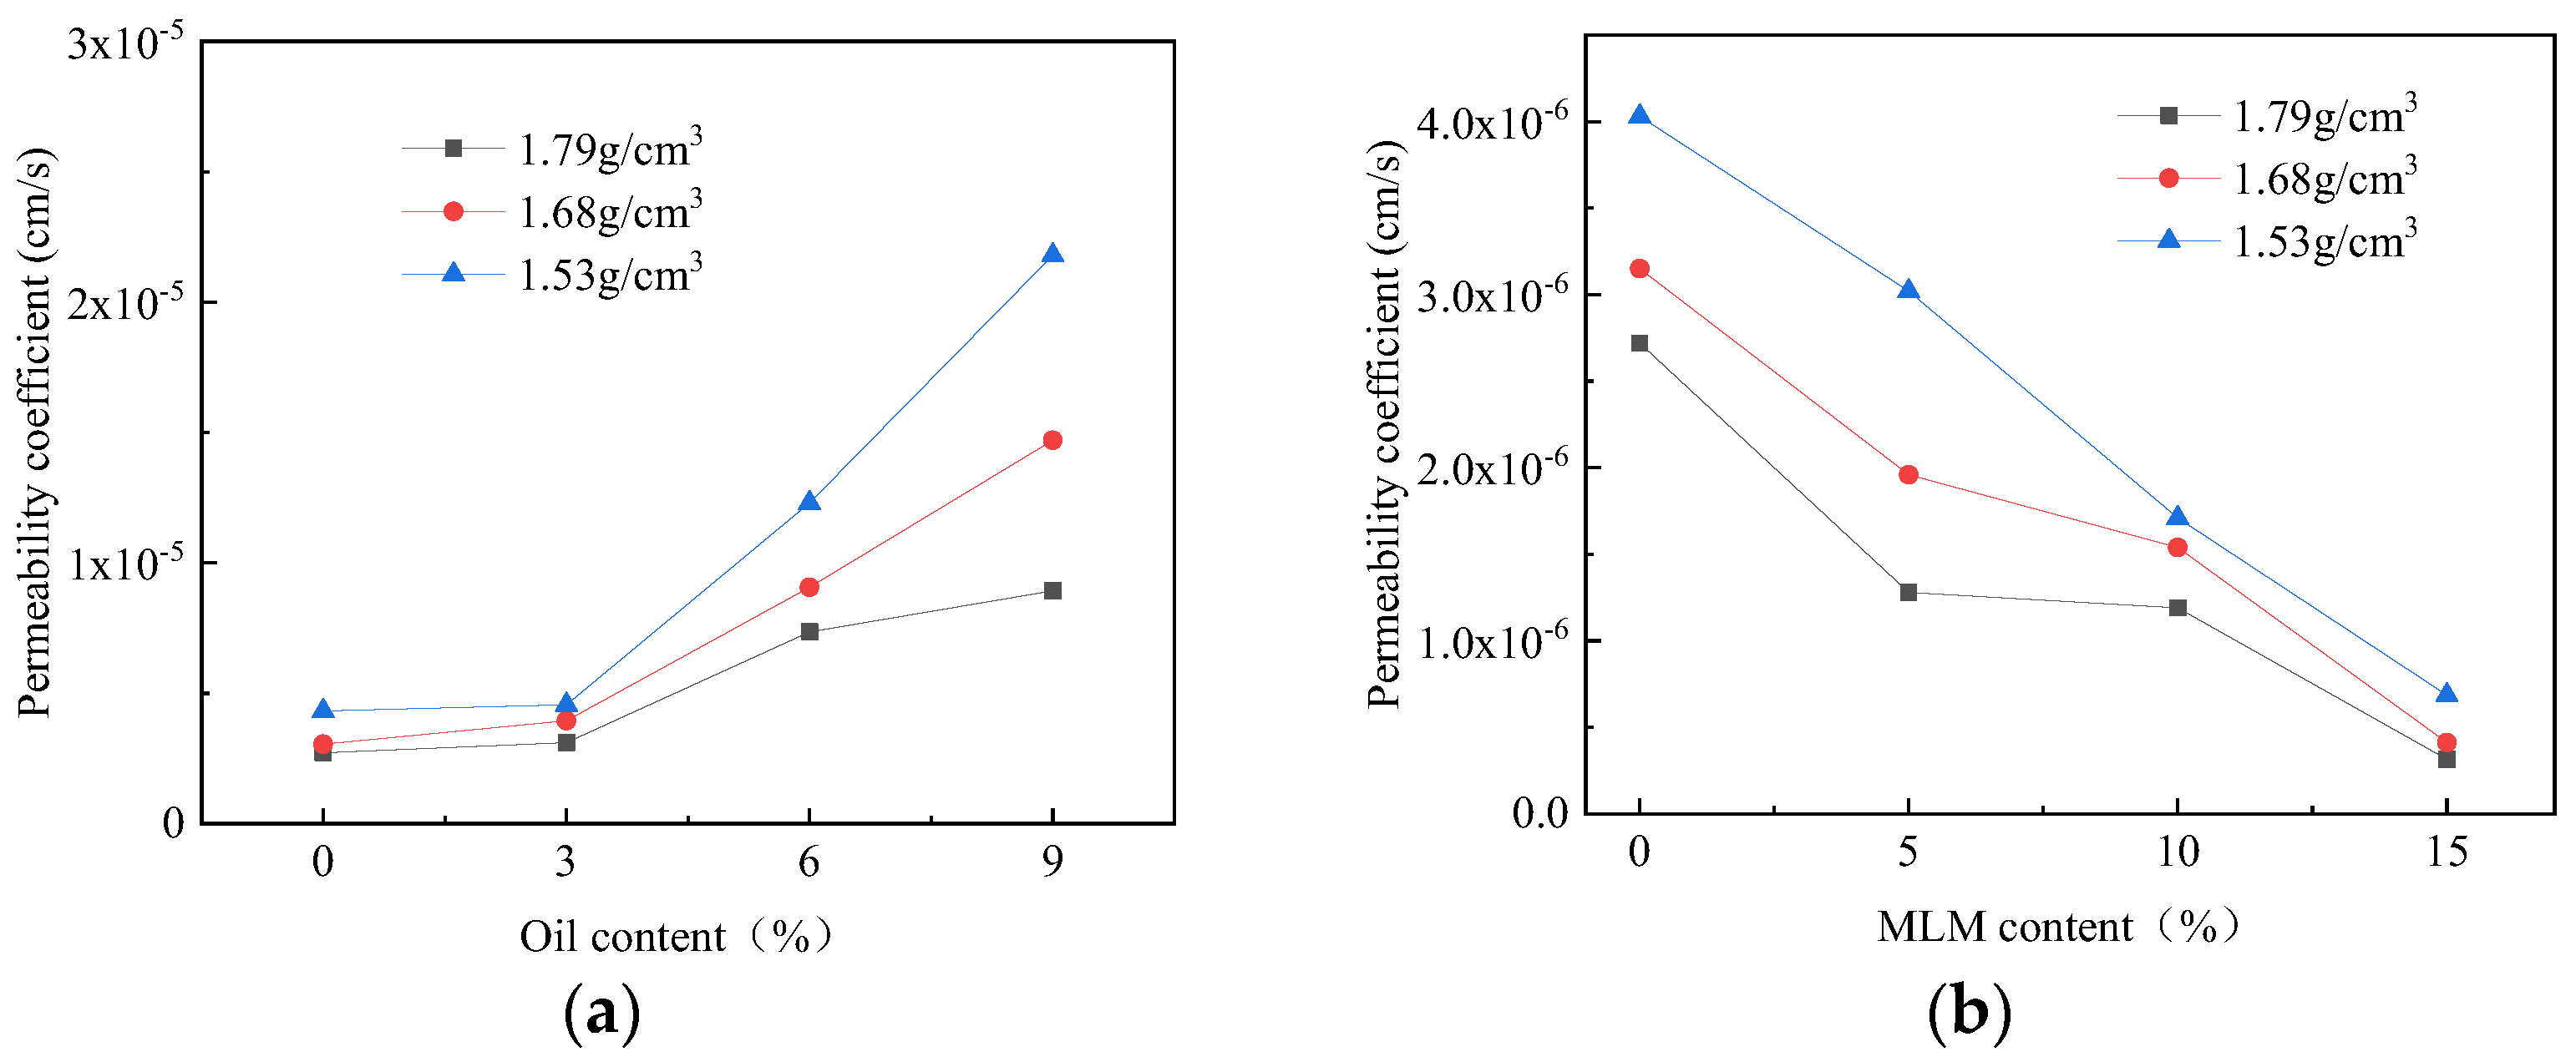
3.2.3. Permeability Test
4. Numerical Simulation Results and Discussion
4.1. Numerical Simulation Results
4.2. Repairing the Flood-Controlled Ancient Dike
5. Conclusions
Author Contributions
Funding
Institutional Review Board Statement
Informed Consent Statement
Data Availability Statement
Acknowledgments
Conflicts of Interest
References
- Zhu, Q.; Tian, M.; Hu, D. Structural restoration of historic water systems and the prevention and mitigation of urban water logging for China’s central region cities. J. Hydraul. Eng. 2022, 53, 798–810. [Google Scholar]
- Bao, J.; Hou, X.; Wang, Y. An analysis of the principles in the restoration and protection of the ancient city wall of China. Res. Herit. Preserv. 2018, 3, 41–44. [Google Scholar]
- Jia, T. The elements of flflood control of ancient city walls: Taking the ancient city wall of Taizhou Fu as an example. Archit. J. 2016, 2, 16–21. [Google Scholar]
- Xia, M.; Yan, S.; Xia, Z. The ancient city of Ezhou and its barrier and the flflood control of the Yangtze River. J. Ezhou Univ. 2013, 20, 64–66. [Google Scholar]
- Wu, Q. Technical Measures for Flood Control in Ancient Cities of China. Anc. Build. Gard. Technol. 1993, 23, 8–13. [Google Scholar]
- Rahman, Z.A.; Hamzah, U.; Taha, M.R.; Ithnain, N.S.; Ahmad, N. Influence of Oil Contamination on Geotechnical Properties of Basaltic Residual Soil. Am. J. Appl. Sci. 2010, 7, 954–961. [Google Scholar] [CrossRef]
- Iqbal, K.; Xu, C.; Nasir, H.; Alam, M.; Farooq, A.; Williams, E.J. Effect of Used Motor Oil and Bitumen as Additive on the Permeability and Mechanical Properties of Low Plastic Soil. Adv. Mater. Sci. Eng. 2020, 2020, 1360197. [Google Scholar] [CrossRef]
- Ostovar, M.; Ghiassi, R.; Mehdizadeh, M.J.; Shariatmadari, N. Effects of Crude Oil on Geotechnical Specification of Sandy Soils. Soil Sediment Contam. Int. J. 2020, 30, 58–73. [Google Scholar] [CrossRef]
- Abousnina, R.; Manalo, A.; Lokuge, W.; Zhang, Z. Effects of light crude oil contamination on the physical and mechanical properties of geopolymer cement mortar. Cem. Concr. Compos. 2018, 90, 136–149. [Google Scholar] [CrossRef]
- Khamehchiyan, M.; Charkhabi, A.H.; Tajik, M. Effects of crude oil contamination on geotechnical properties of clayey and sandy soils. Eng. Geol. 2007, 89, 220–229. [Google Scholar] [CrossRef]
- Chew, S.J.; Lee, C.Y. Simple shear behavior of palm biodiesel contaminated soil. ARPN J. Eng. Appl. Sci. 2010, 5, 6–9. [Google Scholar]
- Heris, M.N.; Aghajani, S.; Hajialilue-Bonab, M.; Molamahmood, H.V. Effects of Lead and Gasoline Contamination on Geotechnical Properties of Clayey Soils. Soil Sediment Contam. Int. J. 2020, 29, 340–354. [Google Scholar] [CrossRef]
- Sim, Y.L.; Lee, C.Y. Behavior of piles in palm biodiesel contaminated mining sand. Int. J. Environ. Sci. 2013, 3, 182230. [Google Scholar]
- Safehian, H.; Rajabi, A.M.; Ghasemzadeh, H. Effect of diesel-contamination on geotechnical properties of illite soil. Eng. Geol. 2018, 241, 55–63. [Google Scholar] [CrossRef]
- Abousnina, R.M.; Manalo, A.; Shiau, J.; Lokuge, W. Effects of light crude oil contamination on the physical and mechanical properties of fine sand. Soil Sediment Contam. Int. J. 2015, 24, 833–845. [Google Scholar] [CrossRef]
- Kermani, M.; Ebadi, T. The Effect of Oil Contamination on the Geotechnical Properties of Fine-Grained Soils. Soil Sediment Contam. Int. J. 2012, 21, 655–671. [Google Scholar] [CrossRef]
- Estabragh, A.; Beytolahpour, I.; Moradi, M.; Javadi, A. Mechanical behavior of a clay soil contaminated with glycerol and ethanol. Eur. J. Environ. Civ. Eng. 2015, 20, 503–519. [Google Scholar] [CrossRef]
- Meegoda, N.J.; Rajapakse, R.A. Long-term and short-term hydraulic conductivities of contaminated clays. J. Environ. Eng. 1994, 119, 725–743. [Google Scholar] [CrossRef]
- Nasehi, S.A.; Uromeihy, A.; Nikudel, M.R.; Morsali, A. Influence of Gas Oil Contamination on Geotechnical Properties of Fine and Coarse-Grained Soils. Geotech. Geol. Eng. 2016, 34, 333–345. [Google Scholar] [CrossRef]
- Al-Adili, A.; Alsoudany, K.Y.; Shakir, A. Investigation of Crude Oil Pollution Effect on Stiffness Characteristics of Sandy and Gypseous Soil. Soil Mech. Found. Eng. 2017, 54, 276–282. [Google Scholar] [CrossRef]
- Nasr, A.M.A. Experimental and Theoretical Studies for the Behavior of Strip Footing on Oil-Contaminated Sand. J. Geotech. Geoenviron. Eng. 2009, 135, 1814–1822. [Google Scholar] [CrossRef]
- Bolouri-Bazaz, M.T.; Bolouri-Bazaz, J. Effect of Hydrocarbon Contamination on Biostabilization of Soil Contaminated with Motor Oil and Gasoline. Geomicrobiol. J. 2021, 38, 467–481. [Google Scholar] [CrossRef]
- Kumar, D.N.; Kumar, P.R. Investigations on alternate lime-pozzolana based mortars for repair of heritage structures. Constr. Build. Mater. 2022, 341, 127776. [Google Scholar] [CrossRef]
- Groot, C.J.W.P.; Gunneweg, J.T.M. Choosing Mortar Compositions for Repointing of Historic Masonry Under Severe Environmental Conditions. In Historic Mortars; Springer International Publishing: Cham, Switzerland, 2018; pp. 143–154. [Google Scholar] [CrossRef]
- Veiga, R. Air lime mortars: What else do we need to know to apply them in conservation and rehabilitation interventions? A review. Constr. Build. Mater. 2017, 157, 132–140. [Google Scholar] [CrossRef]
- Gulotta, D.; Goidanich, S.; Tedeschi, C.; Nijland, T.G.; Toniolo, L. Commercial NHLcontaining mortars for the preservation of historical architecture. Part 1: Compositional and mechanical characterization. Constr. Build. Mater. 2013, 38, 31–42. [Google Scholar] [CrossRef]
- Song, Y.; Zhang, M.; Gan, X.; Dong, S.; Ding, S.; Geng, Y.; Li, J. Experimental Study on Mechanical Strength of Diesel-Contaminated Red Clay Solidified with Lime and Fly Ash. Geofluids 2022, 2022, 3891030. [Google Scholar] [CrossRef]
- Zhang, D.; Zhao, J.; Wang, D.; Xu, C.; Zhai, M.; Ma, X. Comparative study on the properties of three hydraulic lime mortar systems: Natural hydraulic lime mortar, cement-aerial lime-based mortar and slag-aerial lime-based mortar. Constr. Build. Mater. 2018, 186, 42–52. [Google Scholar] [CrossRef]
- Apostolopoulou, M.; Armaghani, D.J.; Bakolas, A.; Douvika, M.G.; Moropoulou, A.; Asteris, P.G. Compressive strength of natural hydraulic lime mortars using soft computing techniques. Procedia Struct. Integr. 2019, 17, 914–923. [Google Scholar] [CrossRef]
- Figueiredo, C.; Ball, R.J.; Lawrence, M. Is BS EN 459-1: 2015 fit for purpose in the context of conservation? J. Build. Limes Forum 2016, 23, 46–52. [Google Scholar]
- Vyšvařil, M.; Žižlavský, T.; Zimmermann, Š.; Bayer, P. Effect of aggregate type on properties of natural hydraulic lime-based mortars. In Materials Science Forum; Trans Tech Publications Ltd.: Wollerau, Switzerland, 2017. [Google Scholar] [CrossRef]
- Hanley, R.; Pavia, S. A study of the work ability of natural hydraulic lime mortars and its influence on strength. Mater. Struct. 2008, 41, 373–381. [Google Scholar] [CrossRef]
- Garijo, L.; Zhang, X.; Ruiz, G.; Ortega, J.J.; Wu, Z. The effects of dosage and production process on the mechanical and physical properties of natural hydraulic lime mortars. Constr. Build. Mater. 2018, 169, 325–334. [Google Scholar] [CrossRef]
- Arizzi, A.; Martinez-Huerga, G.; Sebastian-Pardo, E.; Cultrone, G. Mineralogical, textural and physical-mechanical study of hydraulic lime mortars cured under different moisture conditions. Mater. Constr. 2015, 65, 053. [Google Scholar] [CrossRef]
- Pozo-Antonio, J. Evolution of mechanical properties and drying shrinkage in lime-based and lime cement-based mortars with pure limestone aggregate. Constr. Build. Mater. 2015, 77, 472–478. [Google Scholar] [CrossRef]
- Lanas, J.; Bernal, J.P.; Bello, M.; Galindo, J.A. Mechanical properties of natural hydraulic lime-based mortars. Cem. Concr. Res. 2004, 34, 2191–2201. [Google Scholar] [CrossRef]
- Chever, L.; Pavía, S.; Howard, R. Physical properties of magnesian lime mortars. Mater. Struct. 2009, 43, 283–296. [Google Scholar] [CrossRef]
- Ravi, R.; Thirumalini, S.; Taher, N. Analysis of ancient lime plasters—Reason behind longevity of the Monument Charminar, India a study. J. Build. Eng. 2018, 20, 30–41. [Google Scholar] [CrossRef]
- Yang, Y.; Zhang, S.; Rong, H.; Zhang, L.; Zhang, Y.; Xue, L.; Wang, X.; Yang, J. Study on modification effect and mechanism of lime-based materials on raw soil. J. Funct. Mater. 2019, 4, 4067–4073. [Google Scholar] [CrossRef]
- Ding, S.; Wang, W.; Yang, D.; Wu, C. Research progress and application of modification of raw soil building materials. Build. Blocks Block Build. 2014, 5, 45–48. [Google Scholar]
- Ciancio, D.; Beckett, C.; Carraro, J. Optimum lime content identification for lime-stabilised rammed earth. Constr. Build. Mater. 2013, 53, 59–65. [Google Scholar] [CrossRef]
- Ma, C.; Du, W.; Chen, B. Study on the strength development law of self-compacting soil-based modified materials. New Build. Mater. 2016, 43, 10–13. [Google Scholar]
- Wang, D.; Zentar, R.; Abriak, N.E.; Di, S. Long-term mechanical performance of marine sediments solidified with cement, lime, and fly ash. Mar. Georesources Geotechnol. 2017, 36, 123–130. [Google Scholar] [CrossRef]
- Liu, J.; Sheng, G.; Liu, Y. Effects of the Dosage of Solidified Agent on the Performance of Raw Soil Materials for Wall. J. Shenyang Jianzhu Univ. 2010, 26, 517–521. [Google Scholar]
- Wang, Y.; Duan, X.; Gu, Y.; Wang, S. Experimental Investigation of the Seepage-Induced Failure Process in Granular Soils. Geofluids 2022, 2022, 5703151. [Google Scholar] [CrossRef]
- Wang, Y.; Gu, Y.; Wang, S.; Duan, X. Permeability coeffificient investigation based on fractal characteristics of porous media soil. Hydro Sci. Eng. 2022, 2022, 50–58. [Google Scholar]
- Lin, K.; Akihiro, T. Experimental investigations on suffusion characteristics and its mechanical consequences on saturated cohesionless soil. Soils Found 2014, 54, 713–730. [Google Scholar]
- Richards, K.; Reddy, K. Experimental investigation of initiation of backward erosion piping in soils. Geotechnique 2012, 62, 933–942. [Google Scholar] [CrossRef]
- Wang, Y.; Duan, X.; Gu, Y.; Wang, S. Fractal Characteristics of the Seepage Erosion Process in Porous Soil. Geofluids 2022, 2022, 3383773. [Google Scholar] [CrossRef]
- Tao, H.; Tao, J. Quantitative analysis of piping erosion micro-mechanisms with coupled CFD and DEM method. Acta Geotech. 2017, 12, 573–592. [Google Scholar] [CrossRef]
- Hu, Y.; Ma, P. Mechanism study and fifinite element simulation of three-phase coupling seepage erosion piping. Rock Soil Mech. 2013, 34, 913–921. [Google Scholar]
- Baecher, G.B.; Christian, J.T. Reliability and statistics in Geotechnical Engineering; John Wiley & Sons Ltd.: West Sussex, UK, 2003; pp. 189–194. [Google Scholar]
- Ching, J.; Phoon, K.-K. Establishment of generic transformations for geotechnical design parameters. Struct. Saf. 2012, 35, 52–62. [Google Scholar] [CrossRef]
- Low, B. FORM, SORM, and spatial modeling in geotechnical engineering. Struct. Saf. 2014, 49, 56–64. [Google Scholar] [CrossRef]
- Aguilar-López, J.; Warmink, J.; Schielen, R.; Hulscher, S. Soil stochastic parameter correlation impact in the piping erosion failure estimation of riverine flood defences. Struct. Saf. 2016, 60, 117–129. [Google Scholar] [CrossRef]
- Zhao, T.; Montoya-Noguera, S.; Phoon, K.-K.; Wang, Y. Interpolating spatially varying soil property values from sparse data for facilitating characteristic value selection. Can. Geotech. J. 2018, 55, 171–181. [Google Scholar] [CrossRef]
- Zhang, L.; Li, J.; Li, X.; Zhang, J.; Zhu, H. Rainfall-Induced Soil Slope Failure: Stability Analysis and Probabilistic Assessment; CRC Press, Taylor & Francis Ltd.: London, UK, 2019. [Google Scholar]
- Lanxi Local Records Editorial Committee. Lanxi City Records; Zhejiang People’s Publishing House: Hangzhou, China, 2013. [Google Scholar]
- Wei, Y.; Ding, L. Experiments of the Castor Oil Viscosity Coefficient. Exp. Sci. Technol. 2014, 12, 29–30, 42. [Google Scholar]
- Liang, C.; Wang, N.; Jin, Y.; Li, L. Study on the relation between viscosity and surface tension coefficient of castor oil. Phys. Exp. 2010, 30, 38–41. [Google Scholar]
- Haeri, H.; Sarfarazi, V.; Ebneabbasi, P.; Maram, A.N.; Shahbazian, A.; Marji, M.F.; Mohamadi, A. XFEM and experimental simulation of failure mechanism of non-persistent joints in mortar under compression. Constr. Build. Mater. 2020, 236, 117500. [Google Scholar] [CrossRef]


| Soil | Dry Density /g·cm−3 | Volumetric Water Content/% | Liquid Limit /% | Plastic Limit /% | Plasticity Index | Specific Gravity |
|---|---|---|---|---|---|---|
| Ⅰ1 | 1.53 ± 0.08 | 44.4 ± 2.1 | 44.4 | 27.4 | 17.6 | 2.70 |
| Ⅰ2 | 1.68 ± 0.07 | 41.2 ± 1.5 | 43.5 | 26.2 | 18.4 | 2.65 |
| Ⅱ | 1.79 ± 0.13 | 38.6 ± 1.1 | / | / | / | 2.72 |
| Oil | Density/g·cm−3 | Viscosity Coefficient/Pa·s | Surface Tension/mN·m−1 | Freezing Point/°C |
|---|---|---|---|---|
| Vegetable oil | 0.912 | 11.2 | 34.2 | −5.0 |
| Soil | Dry Density/(g/cm3) | Water Content/% | Oil Content/% | MLM Content/% |
|---|---|---|---|---|
| LO | 1.53, 1.68, 1.79 | 15 ± 1 | 0, 3, 6, 9 | 0 |
| LOM | 1.53, 1.68, 1.79 | 15 ± 1 | 6 | 5, 10, 15 |
| Oil Content/% | Coulomb Line | Friction Angle/° | Cohesion/kPa |
|---|---|---|---|
| 0 | 16.79 | 17.21 | |
| 3 | 17.90 | 24.36 | |
| 6 | 23.80 | 24.53 | |
| 9 | 16.25 | 29.82 |
| MLM Content/% | Coulomb Line | Friction Angle/° | Cohesion/kPa |
|---|---|---|---|
| 0 | 23.80 | 24.53 | |
| 5 | 25.84 | 26.71 | |
| 10 | 30.07 | 32.47 | |
| 15 | 29.03 | 32.32 |
| No. | Name | Thickness /m | Dry Density /kN·m−3 | Friction Angle (Oil Content 6%)/º | Cohesion (Oil Content 6%)/kPa | Initial Permeability Coefficient (Oil Content 6%)/cm·s−1 | Friction Angle (MLM Content 10%)/º | Cohesion(MLM Content 10%)/kPa | Initial Permeability Coefficient (MLM Content 10%)/cm·s−1 |
|---|---|---|---|---|---|---|---|---|---|
| Ⅰ1 | Artificial fill-1 | 3.5 | 15.3 | 22.4 | 18.5 | 1.24 −5 | 26.5 | 22.3 | 1.83 −6 |
| Ⅰ2 | Artificial fill-2 | 4.1 | 16.8 | 23.8 | 24.5 | 9.70 −4 | 30.1 | 32.5 | 1.65 −6 |
| Ⅱ | Sandy gravel | 10.6 | 17.9 | 35.0 | 0 | 4.12 −4 | 35.0 | 0 | 4.12 −4 |
| Ⅲ | Pelitic siltstone | >7 | 20.3 | 40.0 | 56.5 | / | 40.0 | 56.5 | / |
| No. | Oil-Contaminated Soil Test Results | MLM Grouting Repair Test Results | |||
|---|---|---|---|---|---|
| Section | Hole Depth /m | Length /m | Permeability Coefficient/cm·s−1 | Permeability Coefficient/cm·s−1 | |
| 1 | 1 | 1.0–4.0 | 3.00 | 2.47 × 10⁻⁴ | 2.11 × 10⁻⁴ (↓14.6%) |
| 2 | 4.0–8.0 | 4.00 | 6.21 × 10⁻⁵ | 5.29 × 10⁻⁴ (↓14.8%) | |
| 3 | 8.0–12.0 | 4.00 | 2.43 × 10⁻⁴ | 2.38 × 10⁻⁴ | |
| 4 | 12.0–16.0 | 4.00 | 1.11 × 10⁻⁴ | 1.09 × 10⁻⁴ | |
| 2 | 1 | 1.0–4.0 | 3.00 | 2.15 × 10⁻⁴ | 1.96 × 10⁻⁴ (↓8.8%) |
| 2 | 4.0–8.0 | 4.00 | 1.67 × 10⁻⁴ | 1.46 × 10⁻⁴ (↓12.6%) | |
| 3 | 8.0–12.0 | 4.00 | 1.58 × 10⁻⁴ | 1.52 × 10⁻⁴ | |
| 4 | 12.0–16.1 | 4.10 | 1.40 × 10⁻⁴ | 1.39 × 10⁻⁴ | |
Disclaimer/Publisher’s Note: The statements, opinions and data contained in all publications are solely those of the individual author(s) and contributor(s) and not of MDPI and/or the editor(s). MDPI and/or the editor(s) disclaim responsibility for any injury to people or property resulting from any ideas, methods, instructions or products referred to in the content. |
© 2023 by the authors. Licensee MDPI, Basel, Switzerland. This article is an open access article distributed under the terms and conditions of the Creative Commons Attribution (CC BY) license (https://creativecommons.org/licenses/by/4.0/).
Share and Cite
Zhou, J.; Dong, Z.; Dong, Y.; He, X.; Wu, H.; Chen, B.; Mao, Q. Experimental Study on Repairing the Mechanical Characteristics of Oil-Contaminated Silty Clay in Ancient Dike with Modified Lime Mortar. Materials 2023, 16, 3449. https://doi.org/10.3390/ma16093449
Zhou J, Dong Z, Dong Y, He X, Wu H, Chen B, Mao Q. Experimental Study on Repairing the Mechanical Characteristics of Oil-Contaminated Silty Clay in Ancient Dike with Modified Lime Mortar. Materials. 2023; 16(9):3449. https://doi.org/10.3390/ma16093449
Chicago/Turabian StyleZhou, Jianfen, Zhiyong Dong, Yinzhen Dong, Xiaohui He, Hongmei Wu, Bin Chen, and Qian Mao. 2023. "Experimental Study on Repairing the Mechanical Characteristics of Oil-Contaminated Silty Clay in Ancient Dike with Modified Lime Mortar" Materials 16, no. 9: 3449. https://doi.org/10.3390/ma16093449