Author Contributions
Conceptualization, W.H. and Q.Z.; methodology, W.H., W.G., S.L. and Z.Z.; software, W.H. and Z.Z.; validation, W.H., Q.Z. and Z.Z.; formal analysis, W.H. and Z.Z.; resources, W.H. and Q.Z.; data curation, W.H., W.G. and S.L.; writing—original draft preparation, W.H.; writing—review and editing, W.H.; visualization, W.H.; supervision, W.H.; project administration, W.H.; funding acquisition, Q.Z.; Language, Q.Z. All authors have read and agreed to the published version of the manuscript.
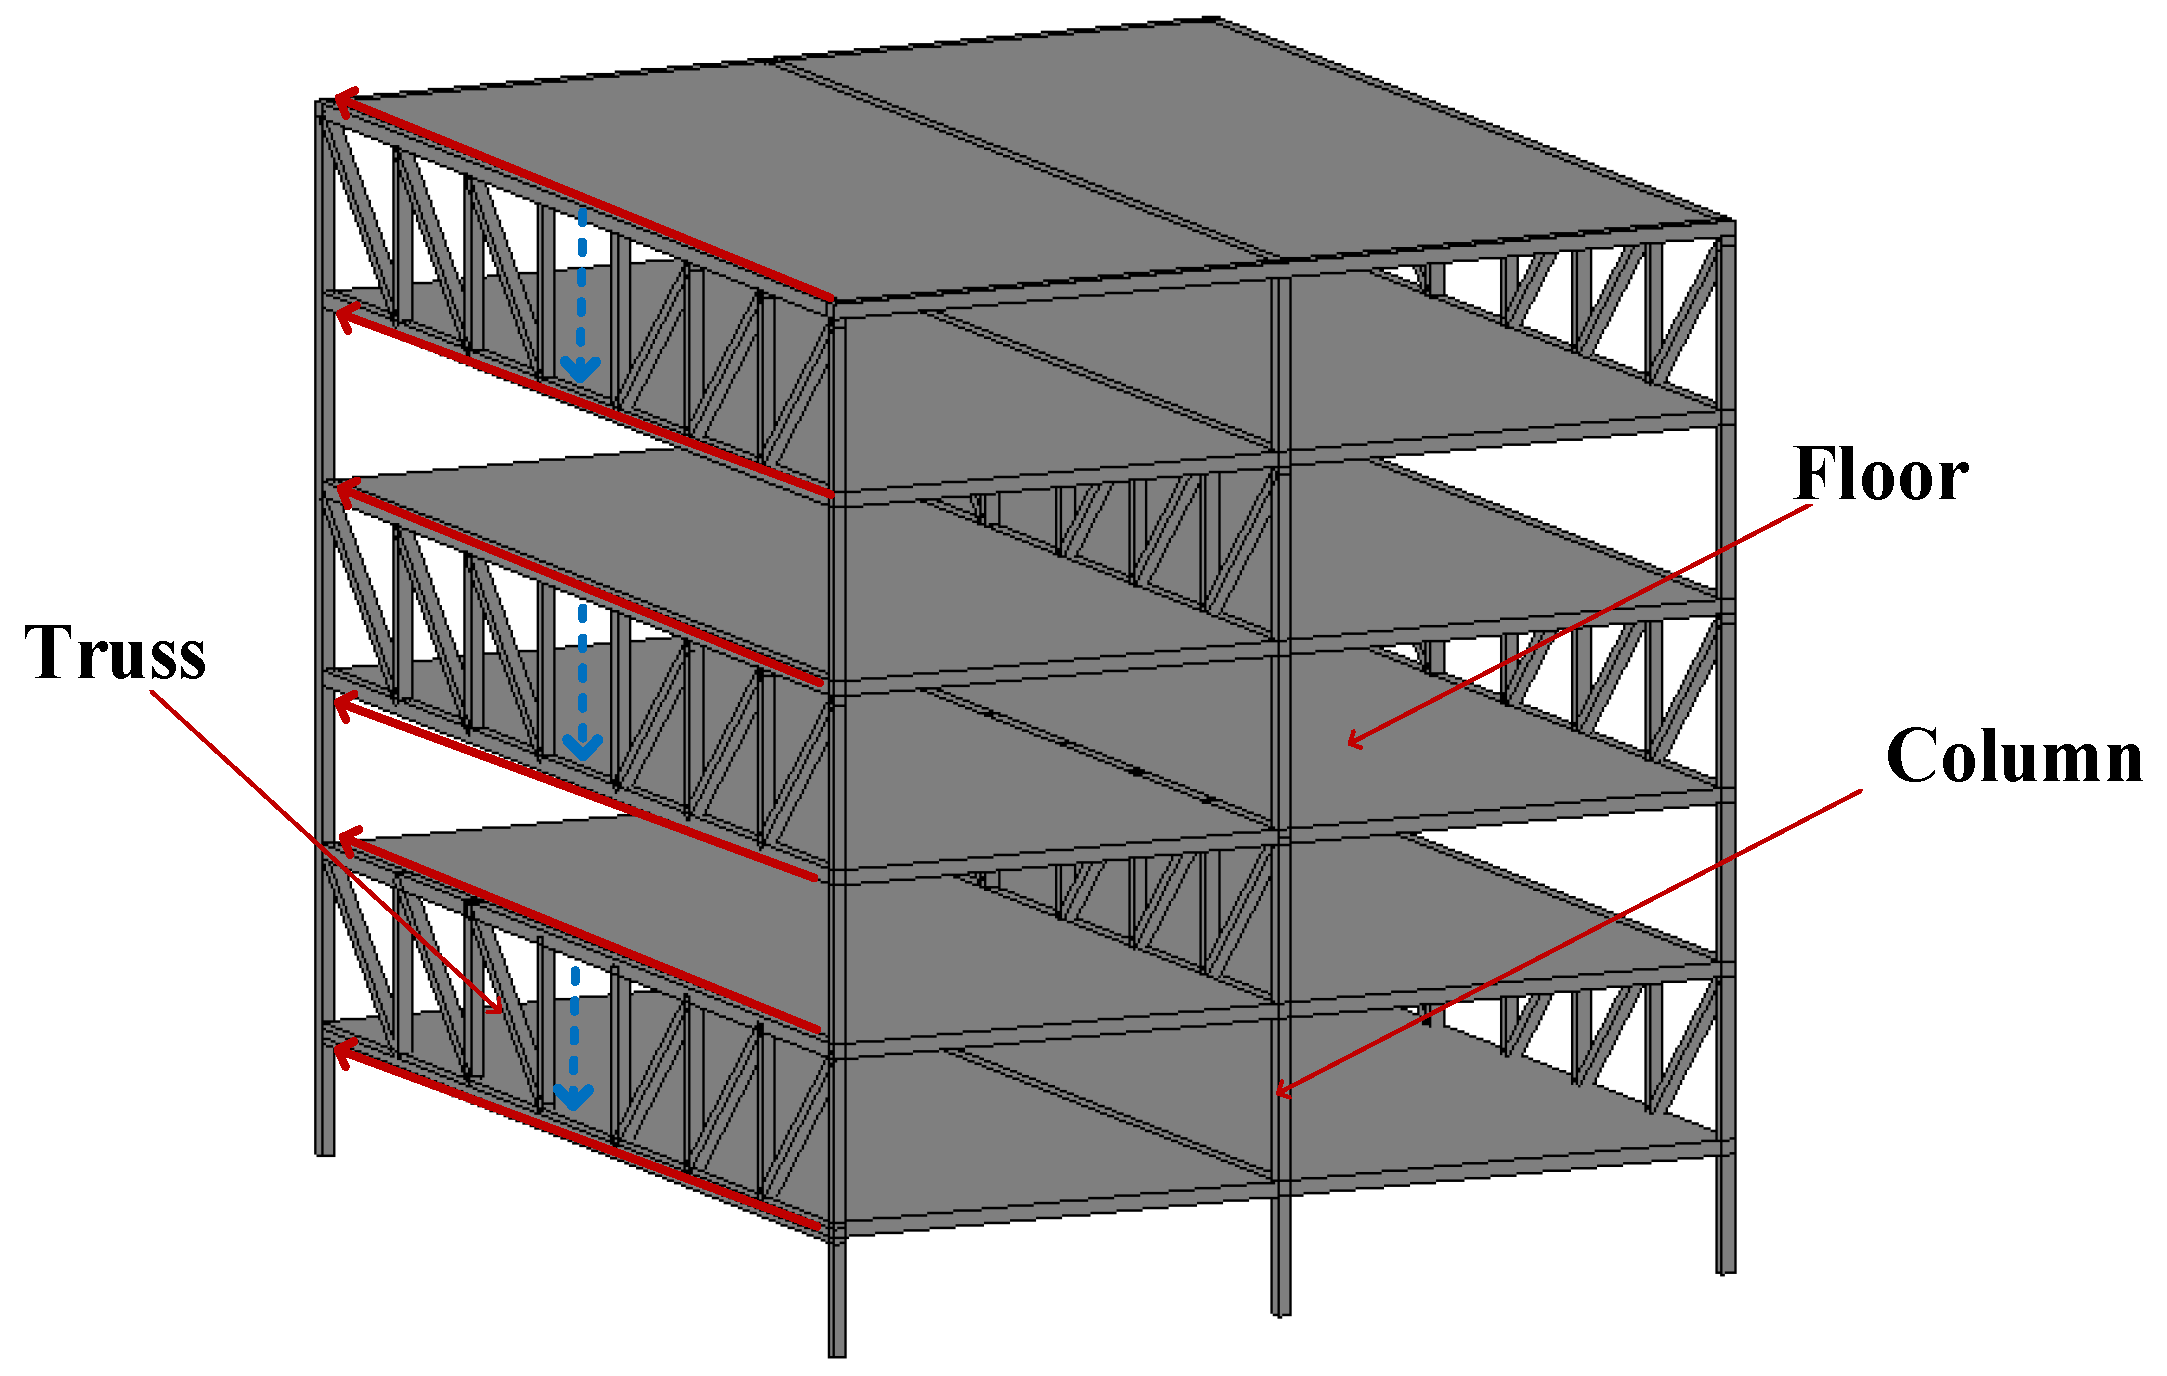
Figure 1.
Horizontal force transmission path of a staggered truss steel framing system.
Figure 1.
Horizontal force transmission path of a staggered truss steel framing system.
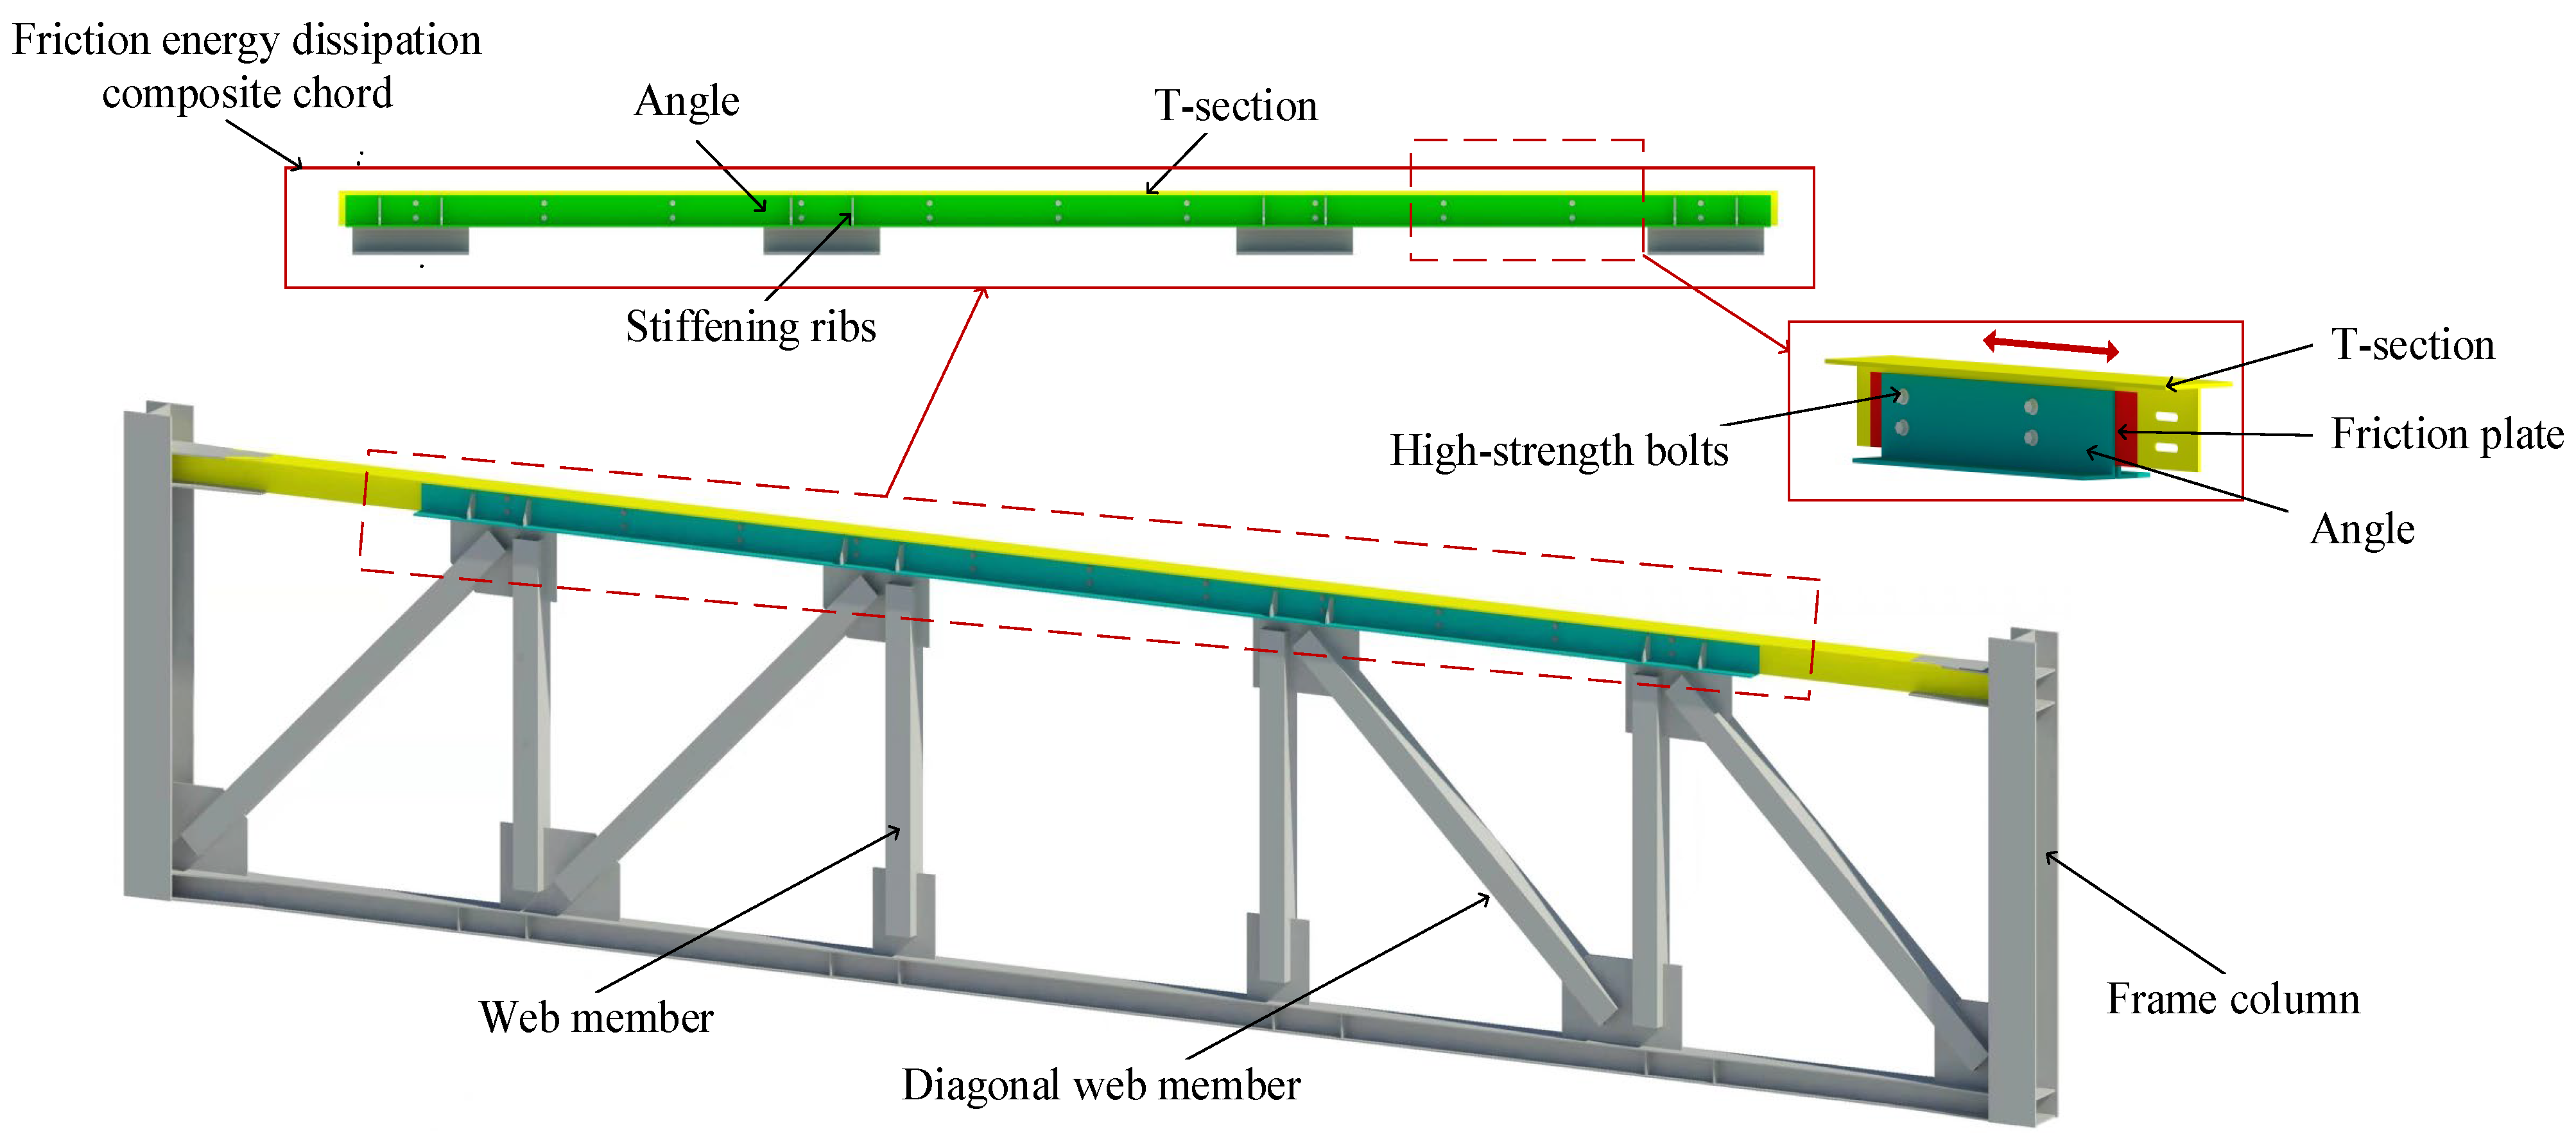
Figure 2.
The structure diagram of the friction energy dissipation composite truss.
Figure 2.
The structure diagram of the friction energy dissipation composite truss.
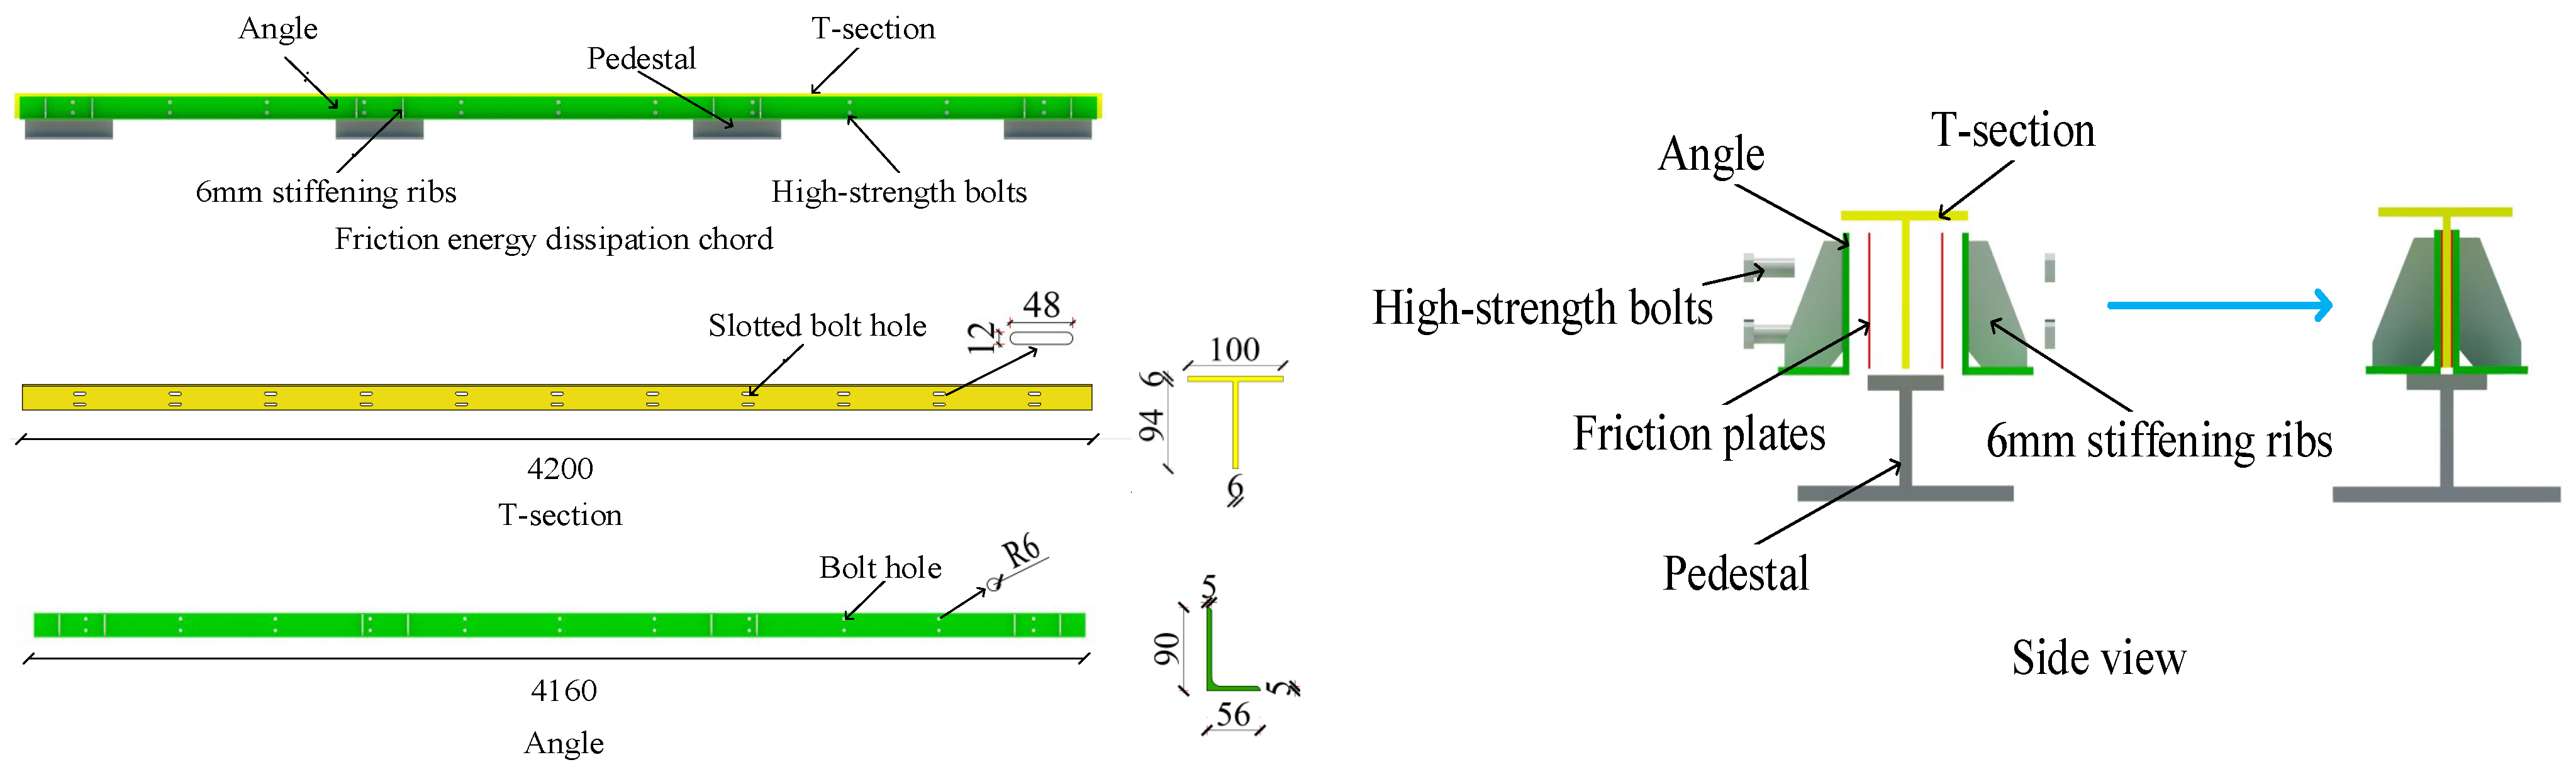
Figure 3.
The structure diagram of the friction energy dissipation composite chord specimen (based on SJ1).
Figure 3.
The structure diagram of the friction energy dissipation composite chord specimen (based on SJ1).
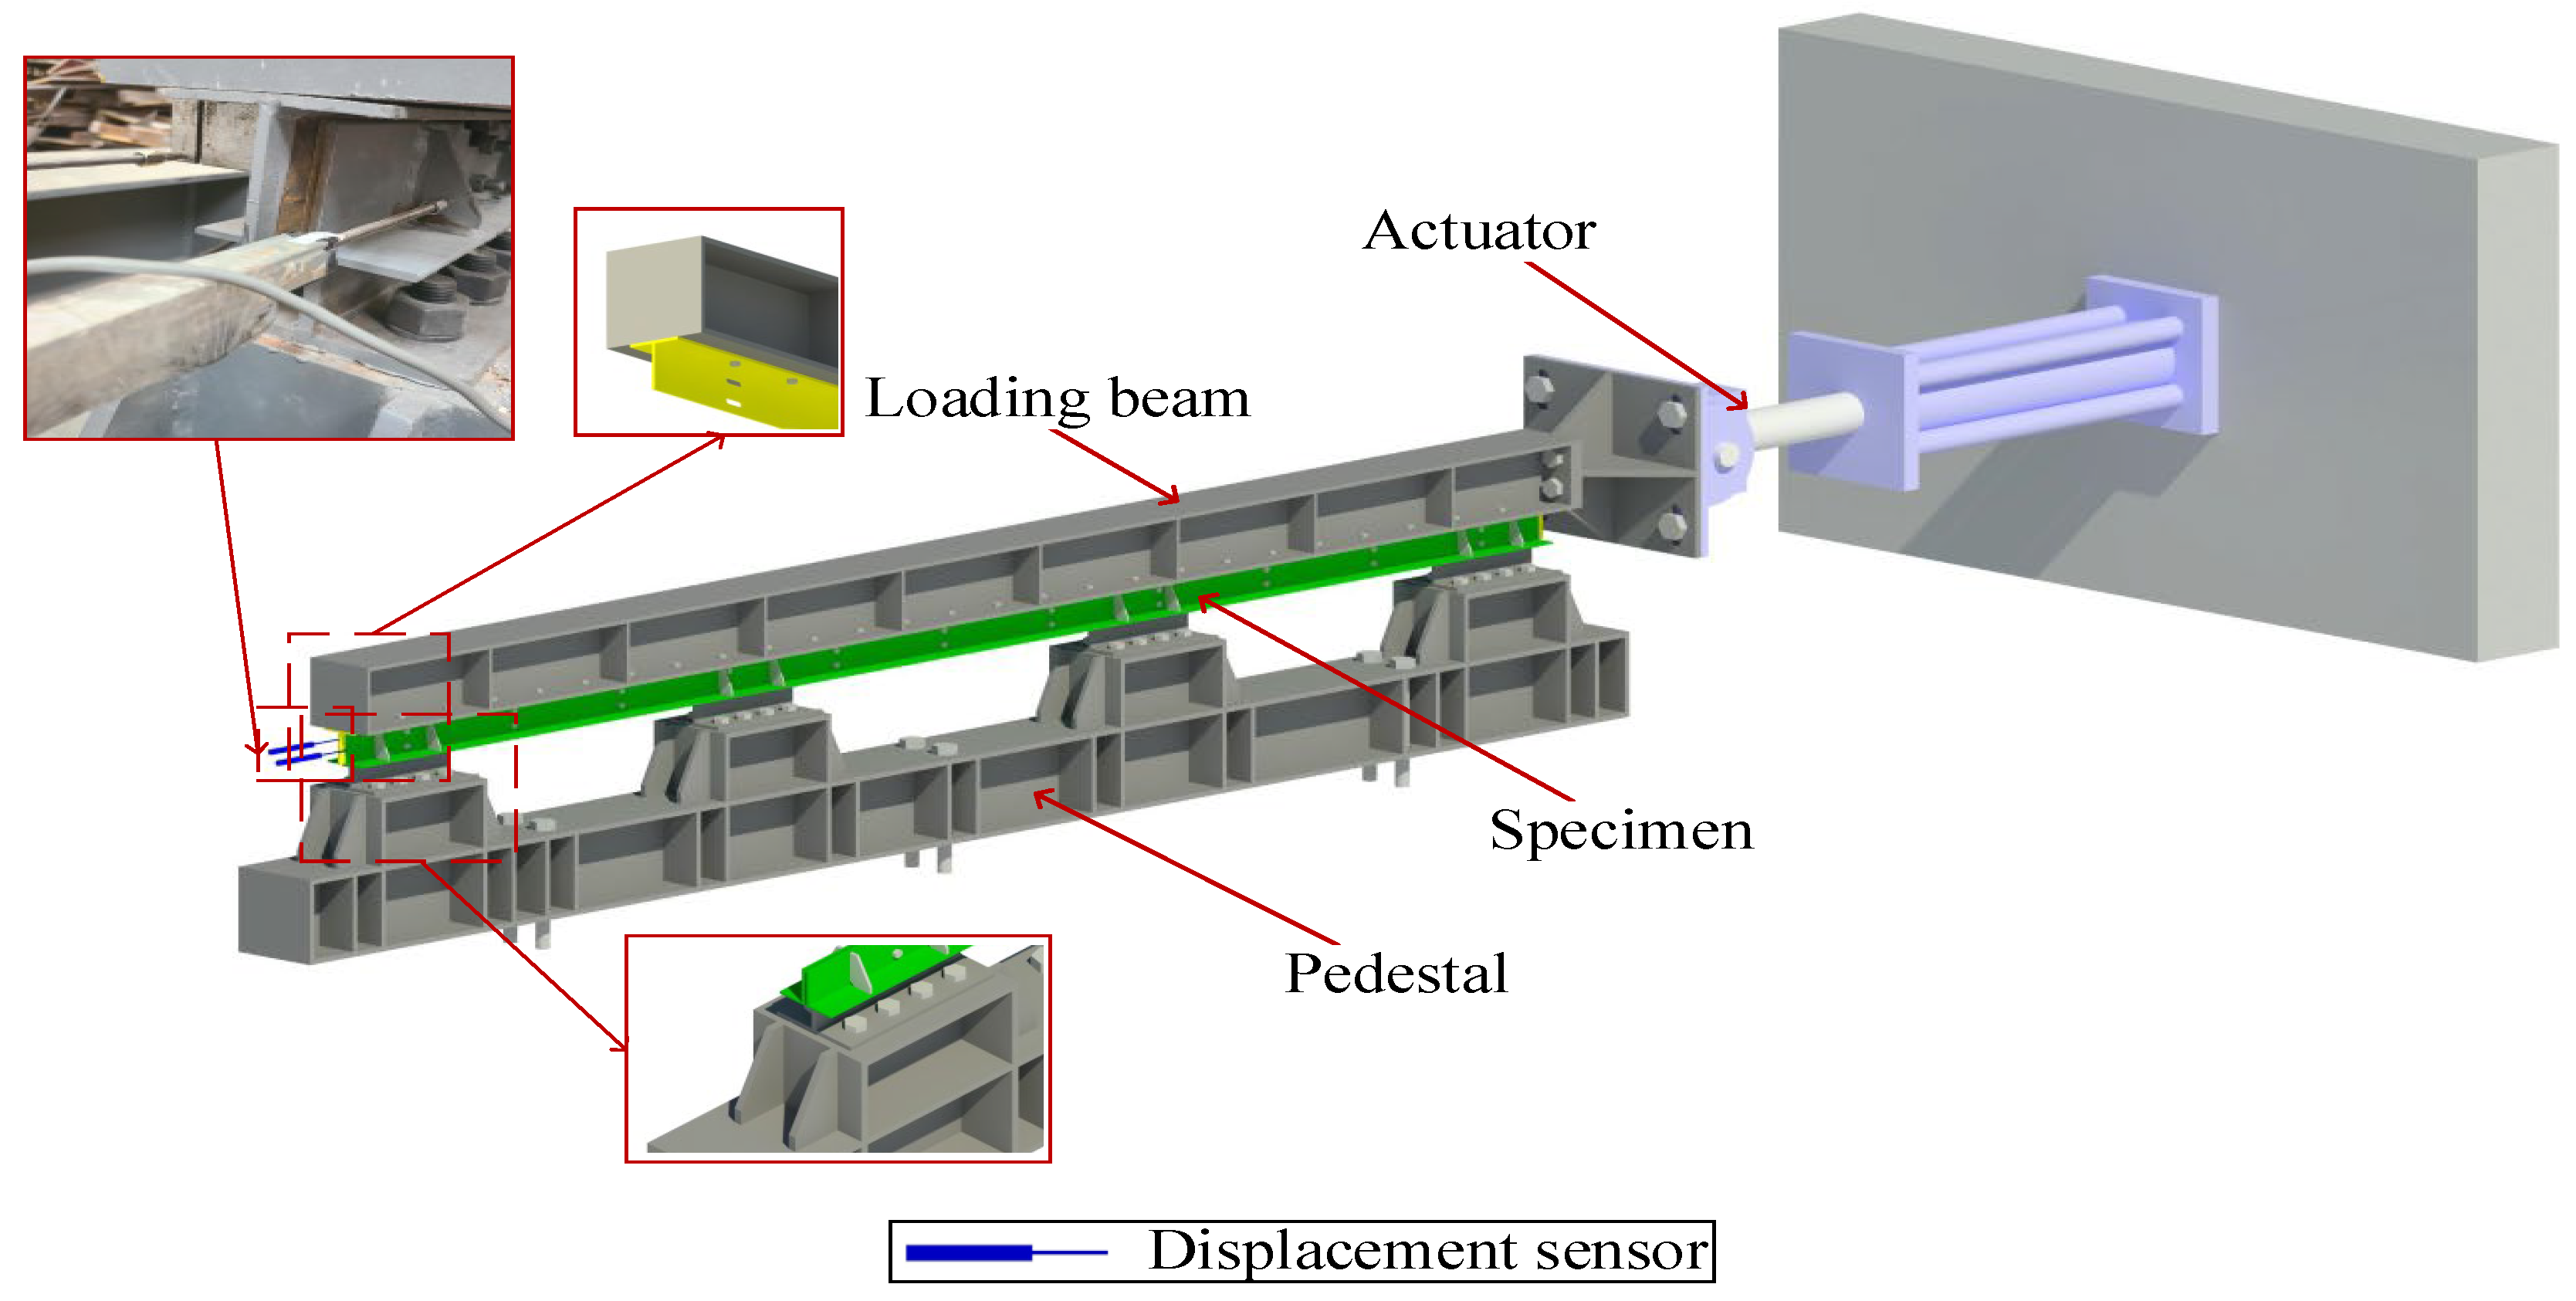
Figure 4.
The loading device diagram of the friction energy dissipation composite chord.
Figure 4.
The loading device diagram of the friction energy dissipation composite chord.
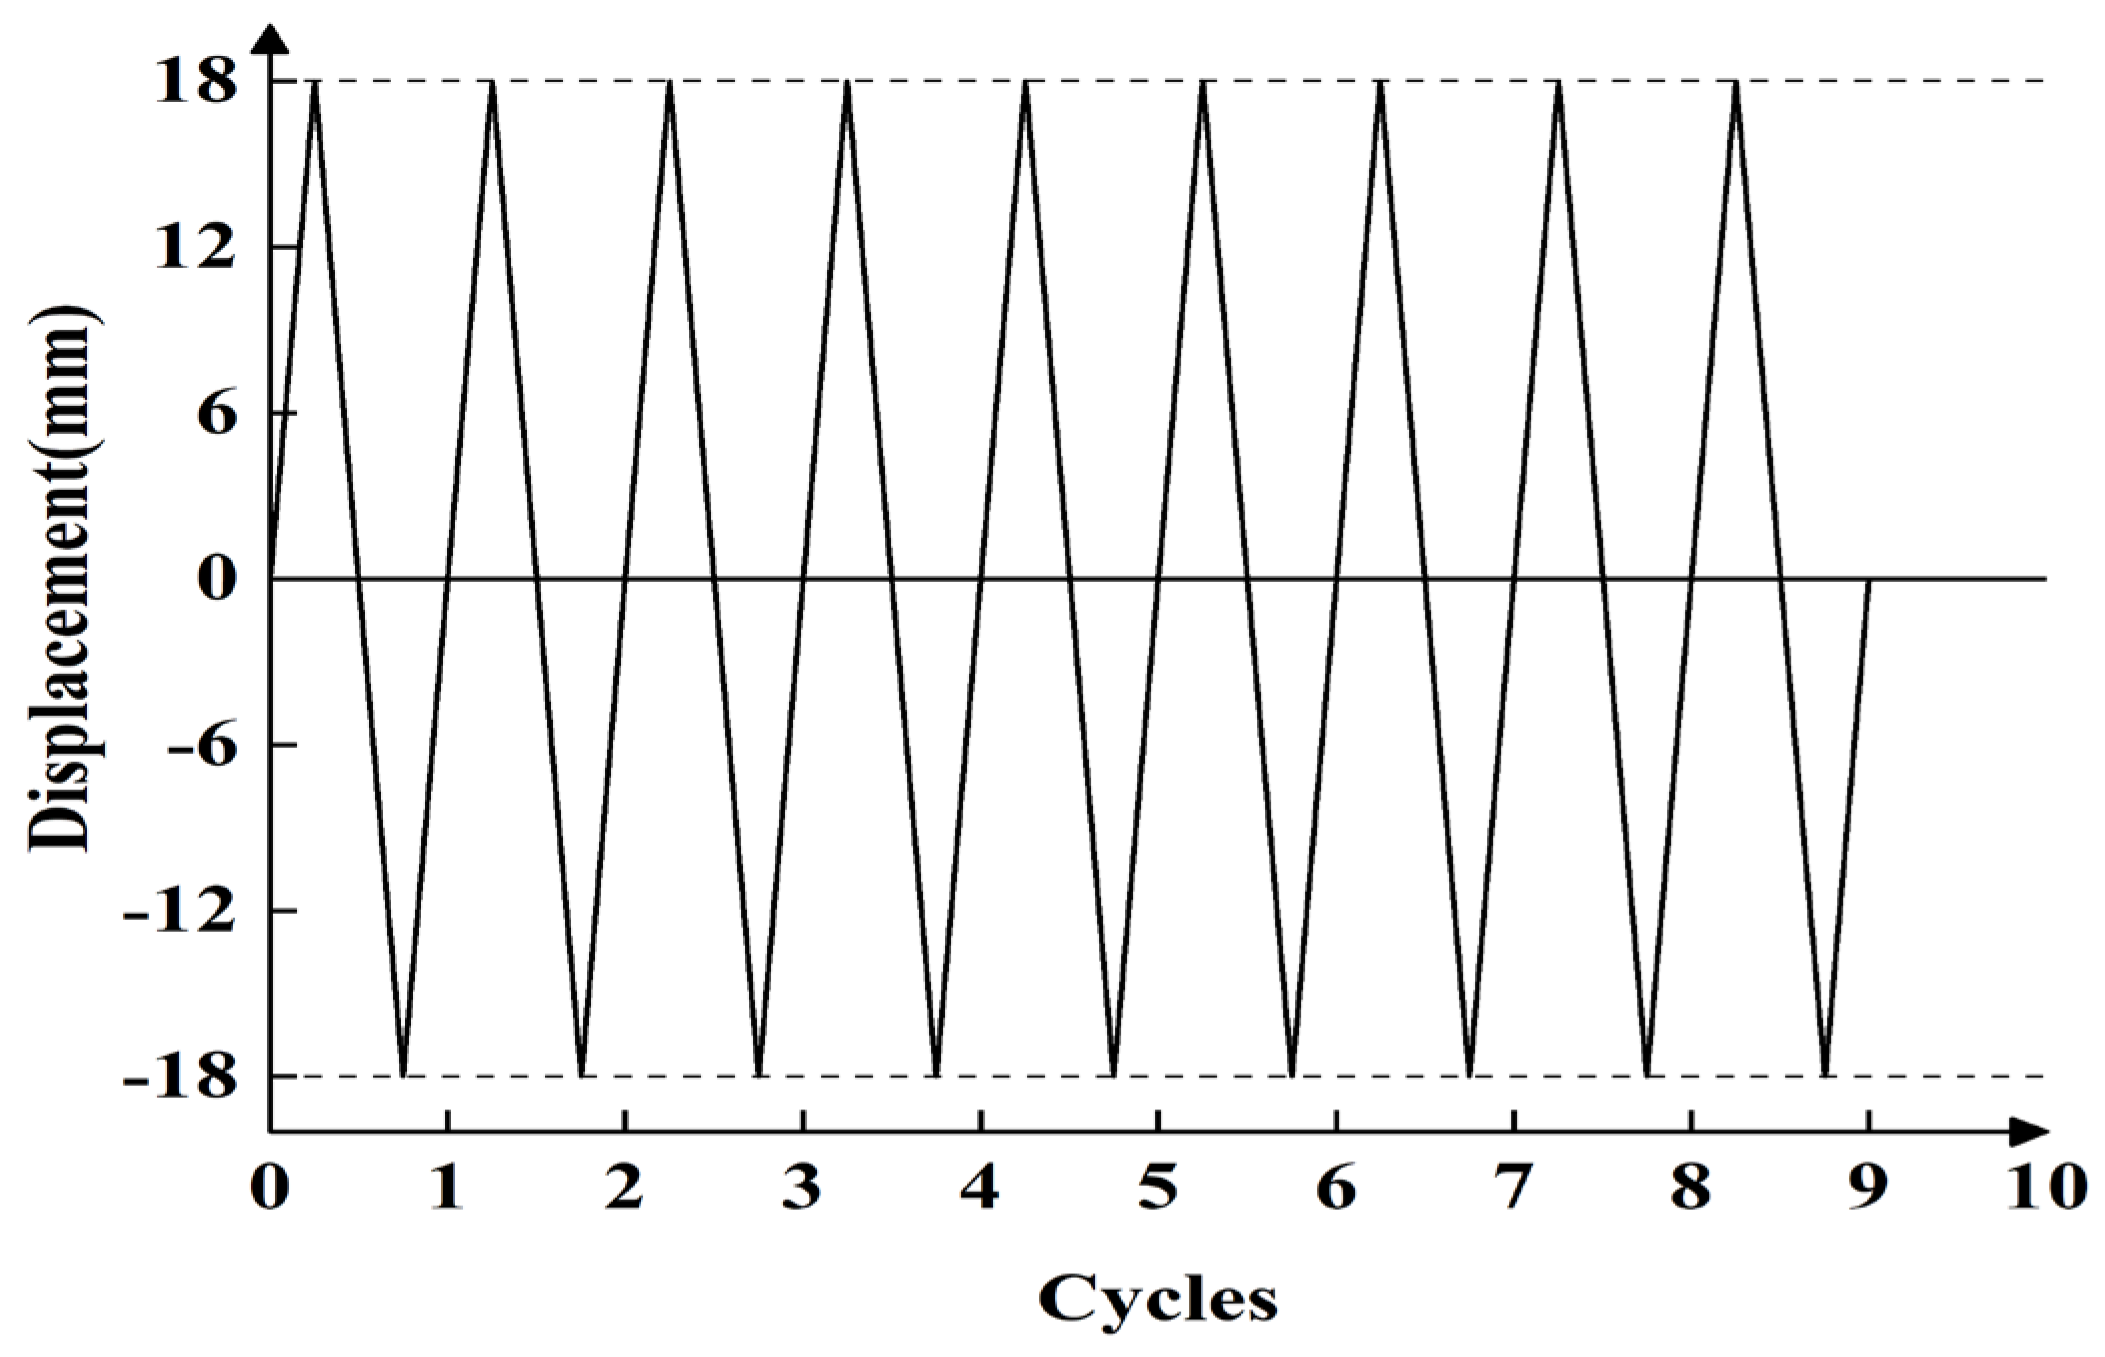
Figure 5.
The test loading protocol of the friction energy dissipation composite chord.
Figure 5.
The test loading protocol of the friction energy dissipation composite chord.
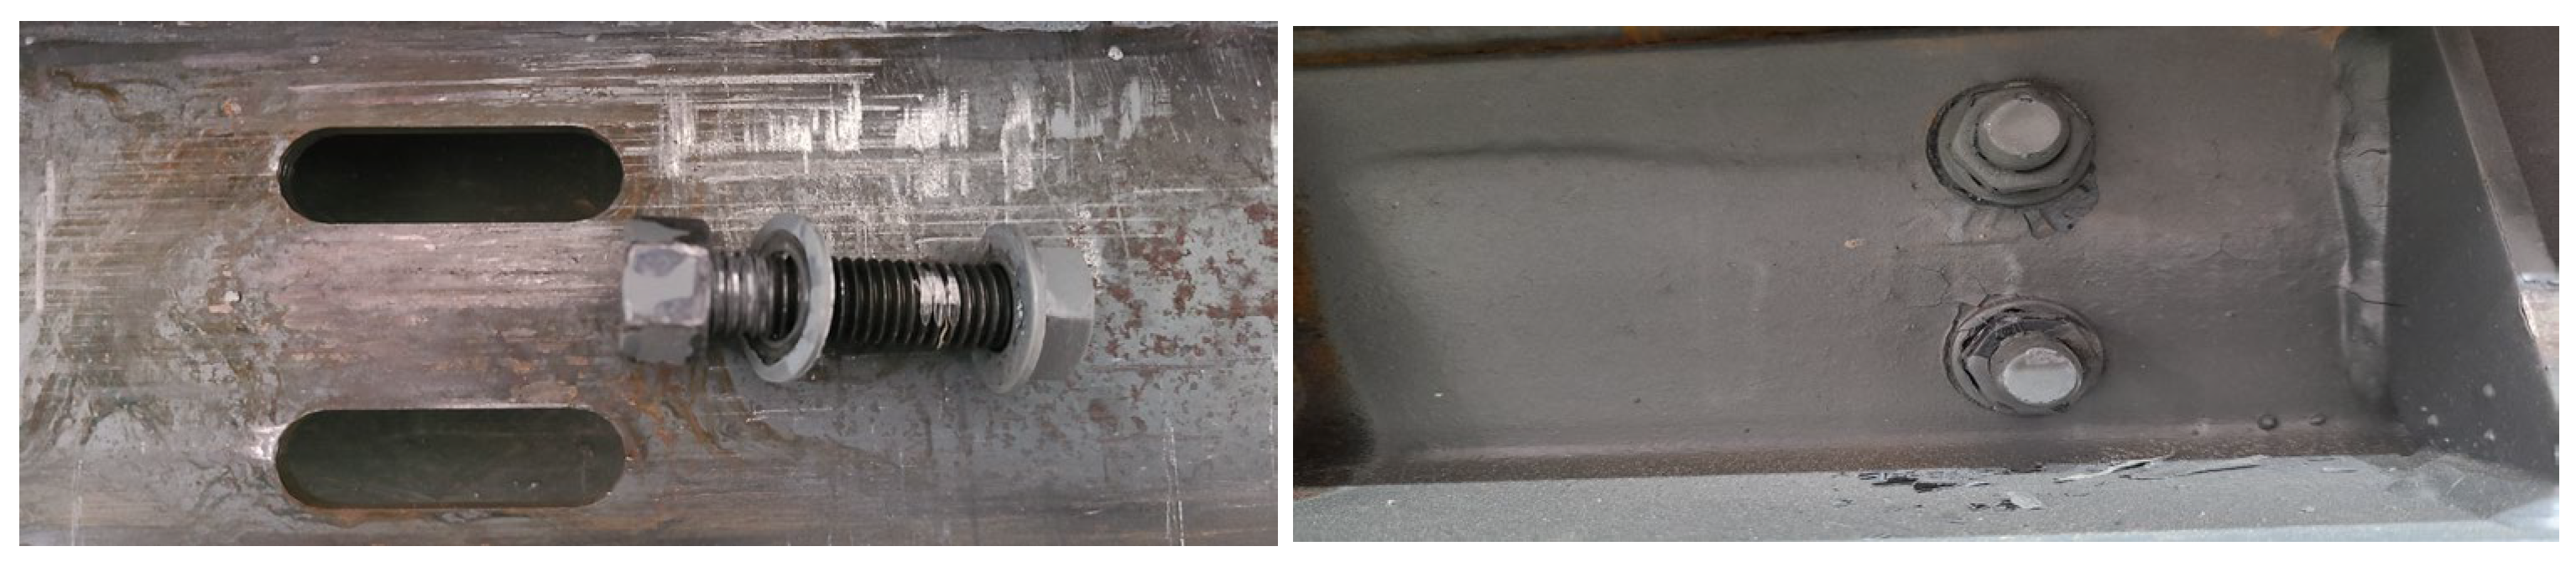
Figure 6.
The test phenomenon of the friction energy dissipation composite chord specimens.
Figure 6.
The test phenomenon of the friction energy dissipation composite chord specimens.
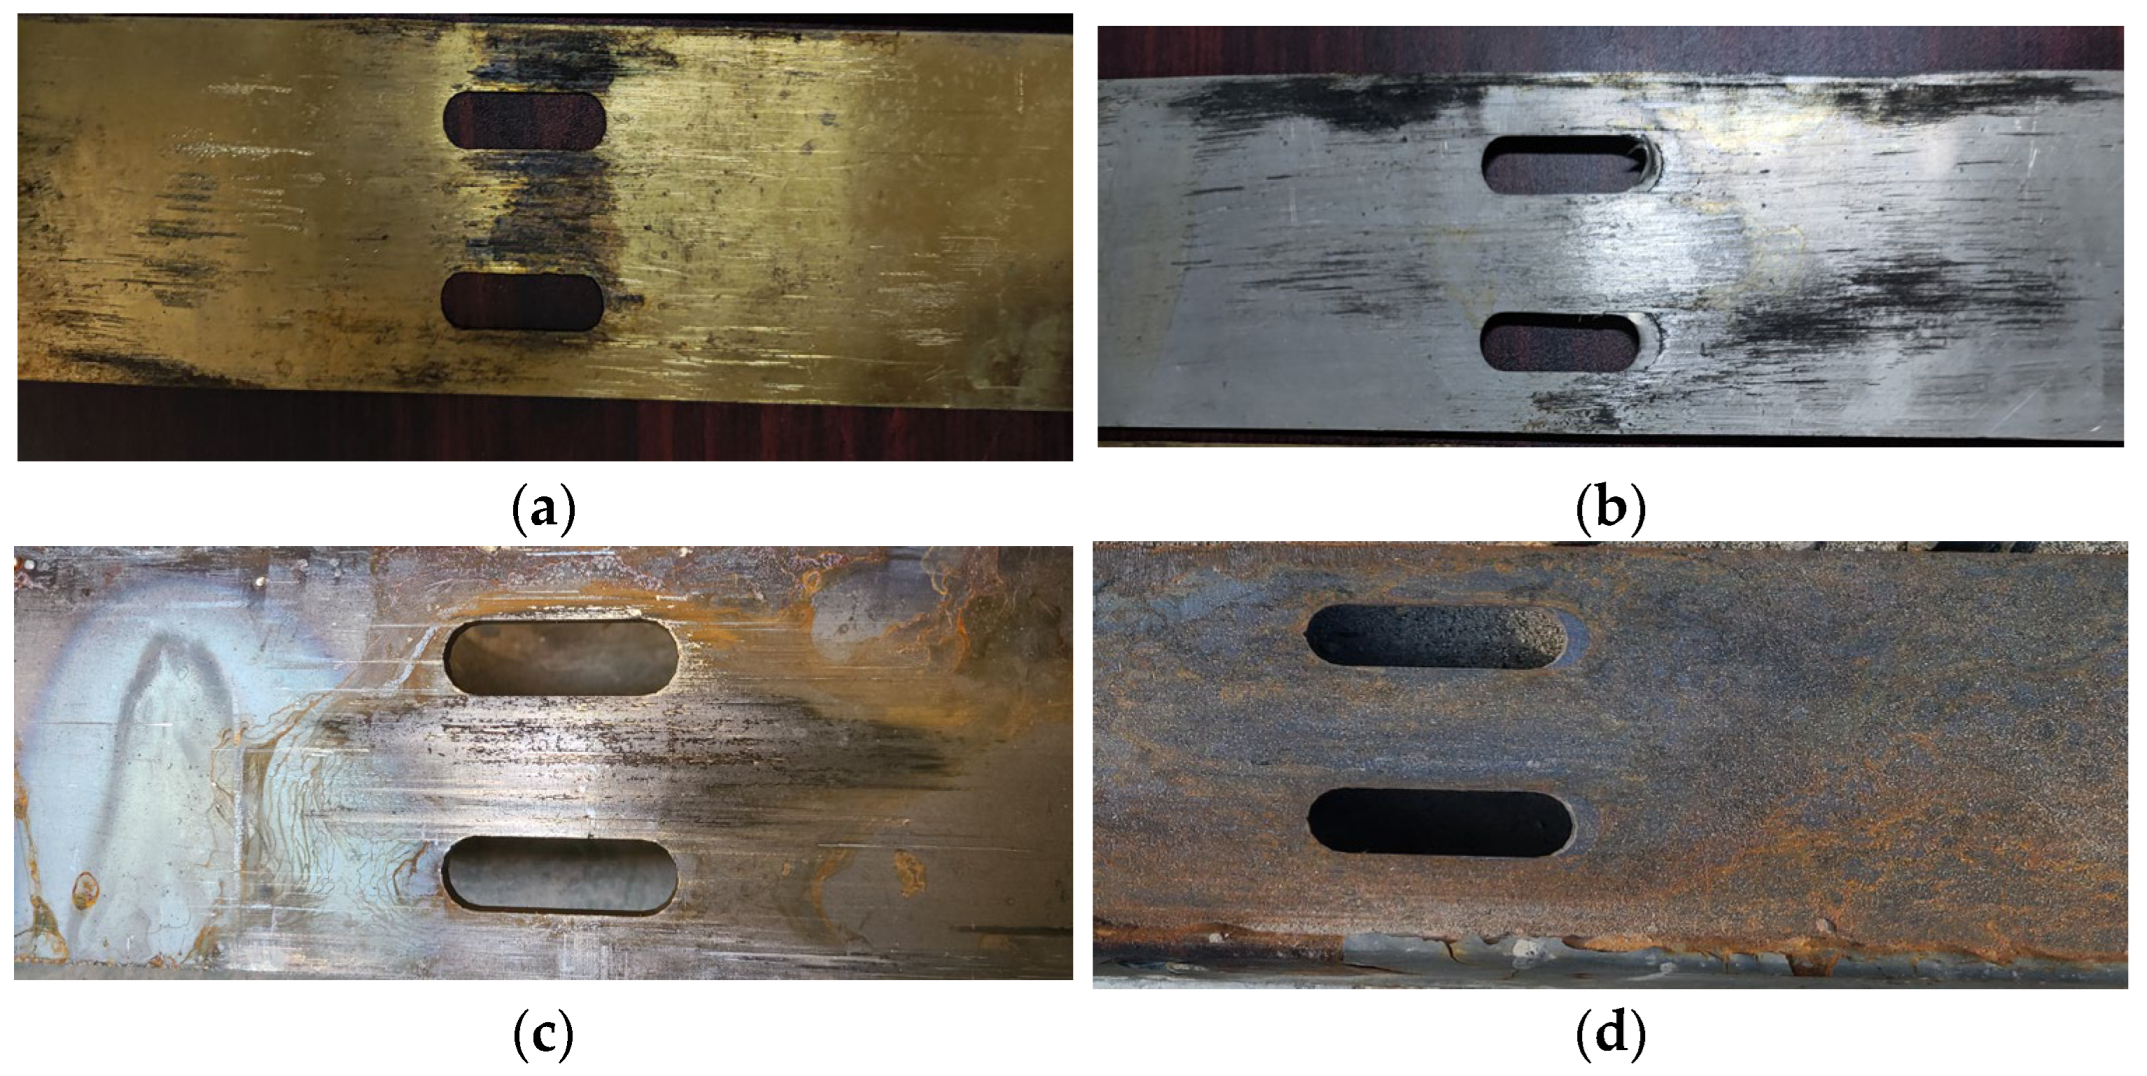
Figure 7.
Scratches of different friction surfaces: (a) SJ1, brass; (b) SJ4, aluminum; (c) SJ5, no friction plates; (d) SJ6, shot blasting.
Figure 7.
Scratches of different friction surfaces: (a) SJ1, brass; (b) SJ4, aluminum; (c) SJ5, no friction plates; (d) SJ6, shot blasting.
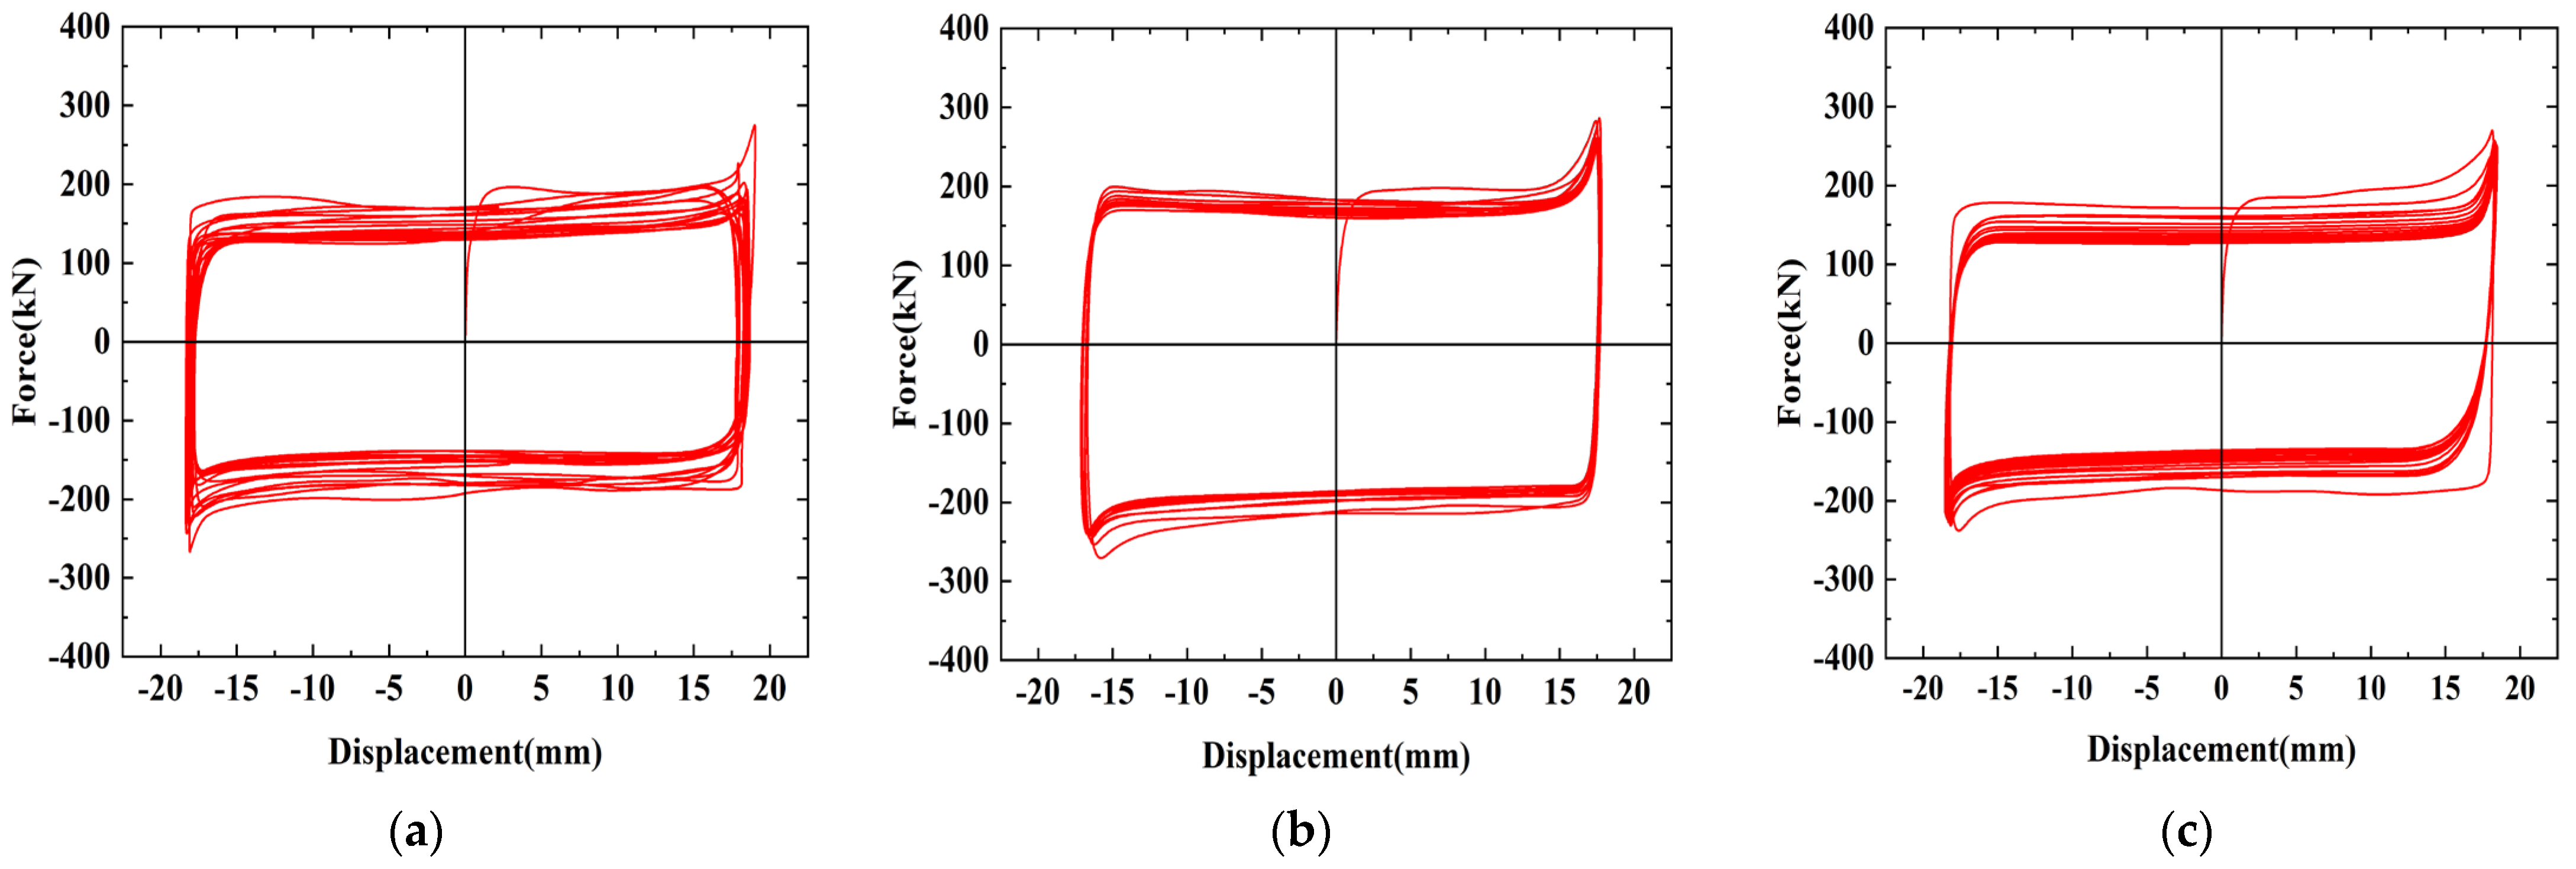
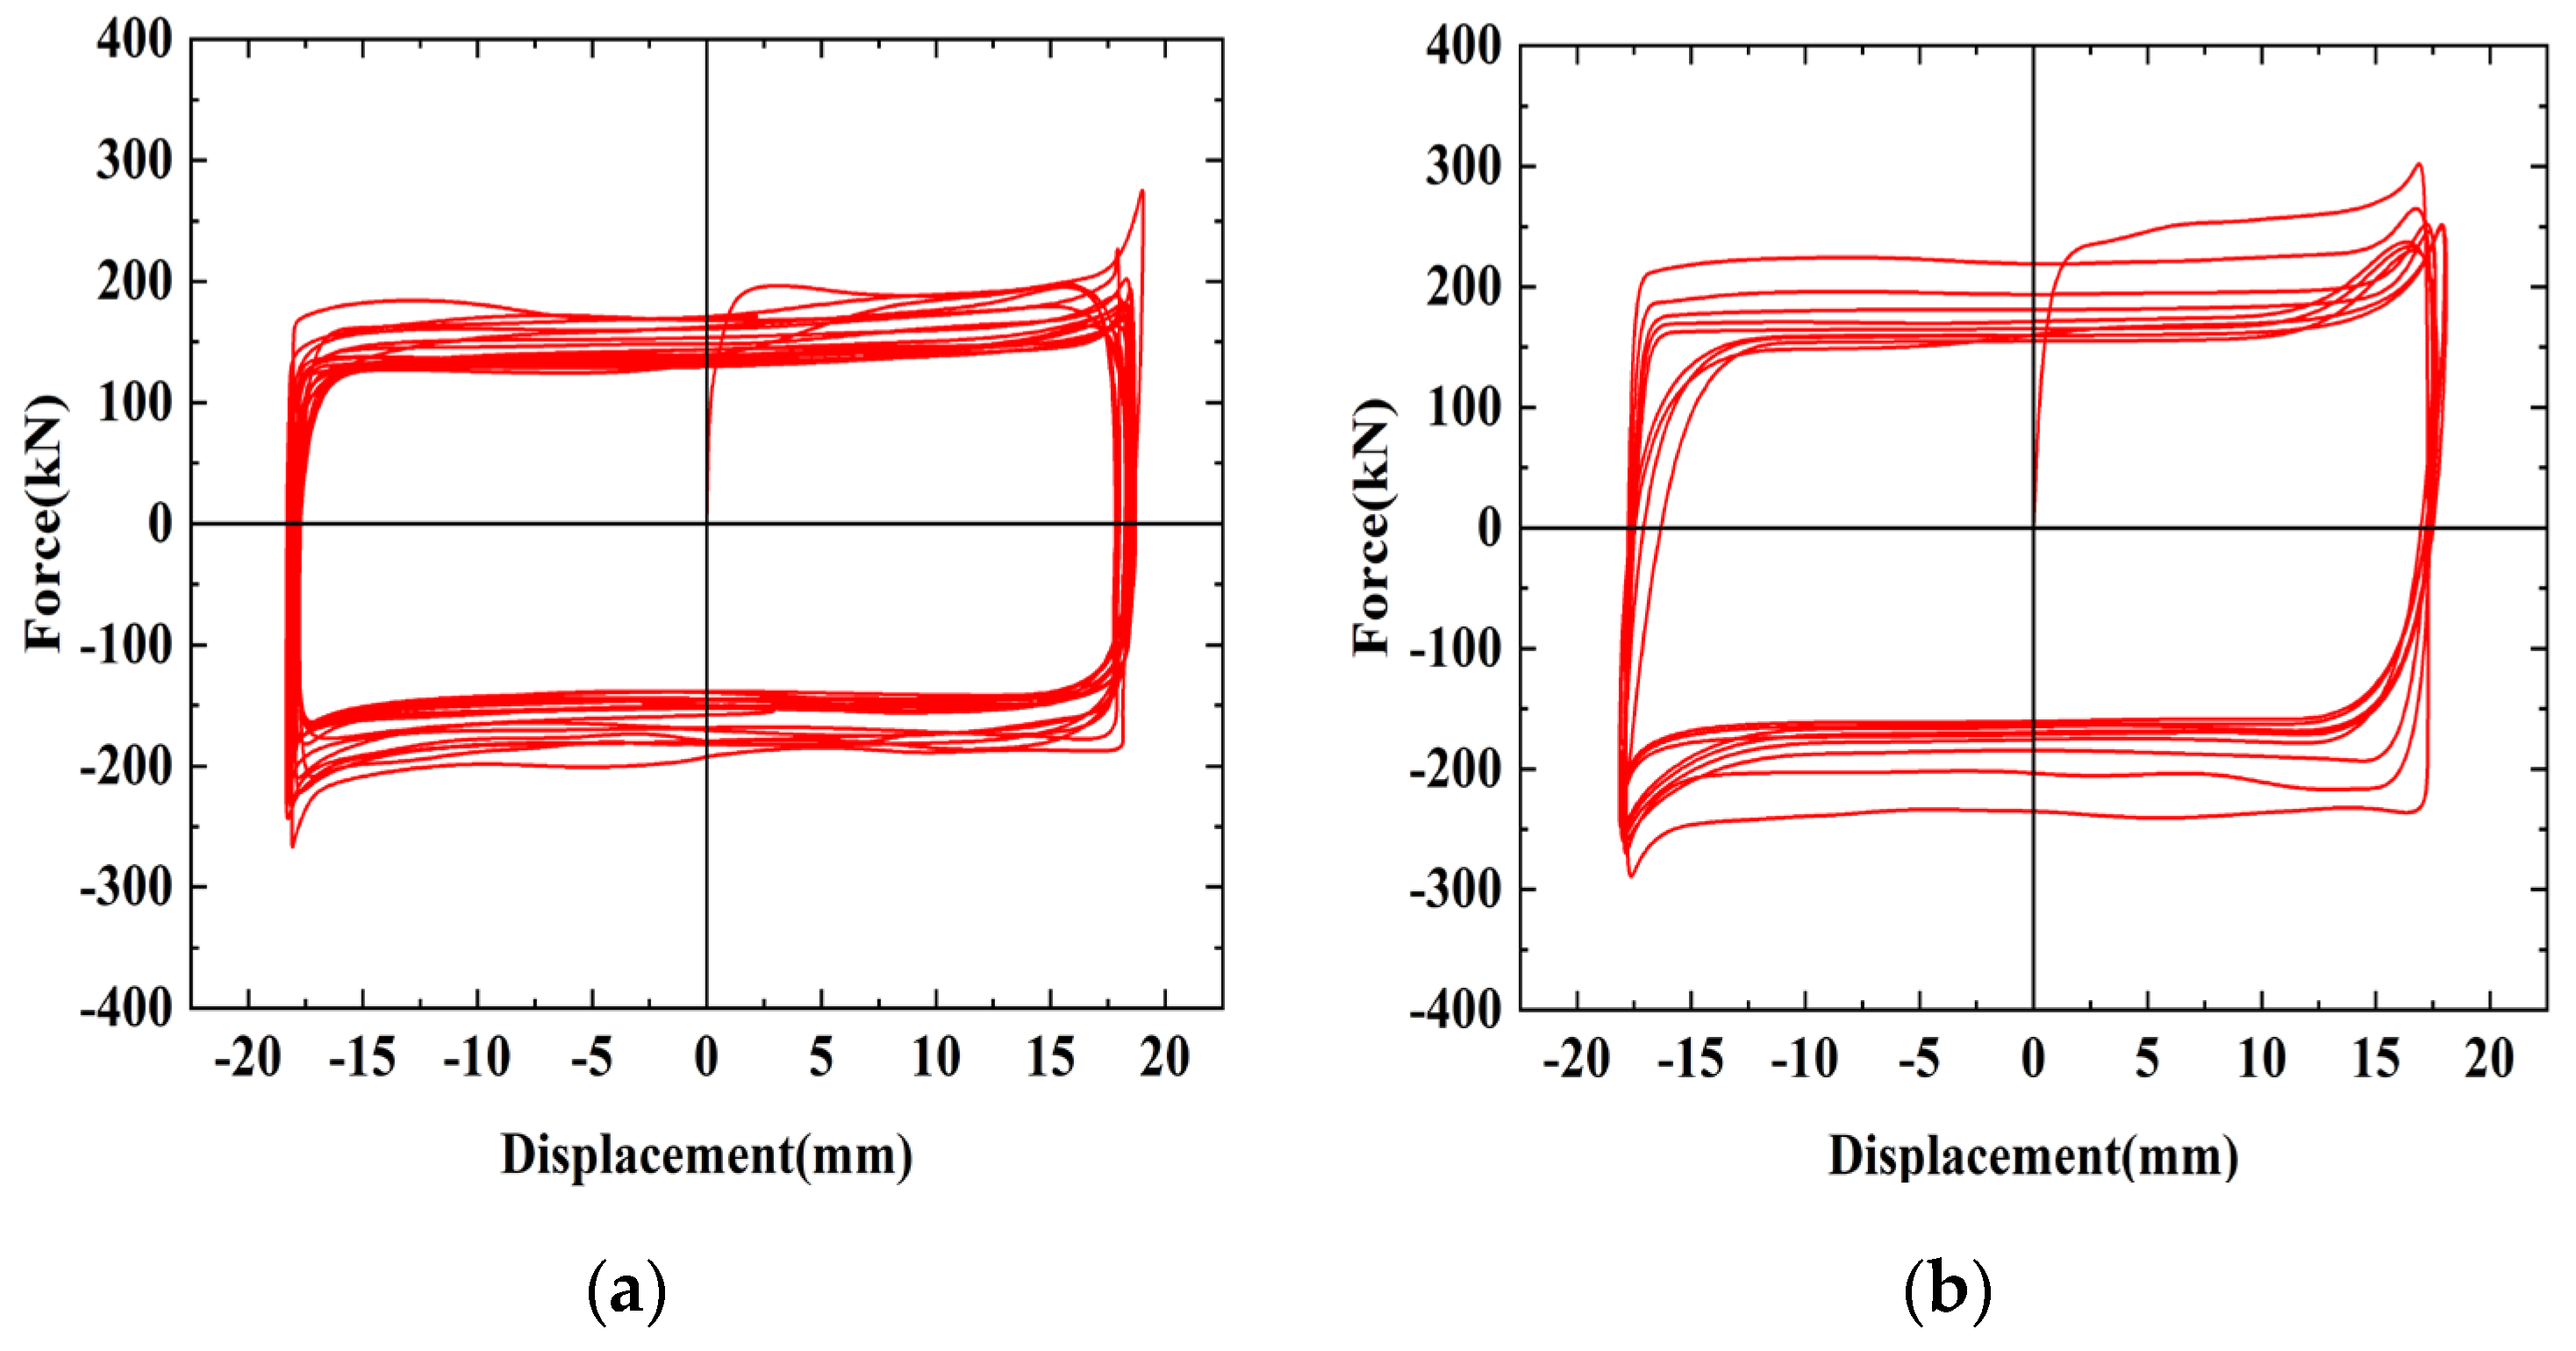
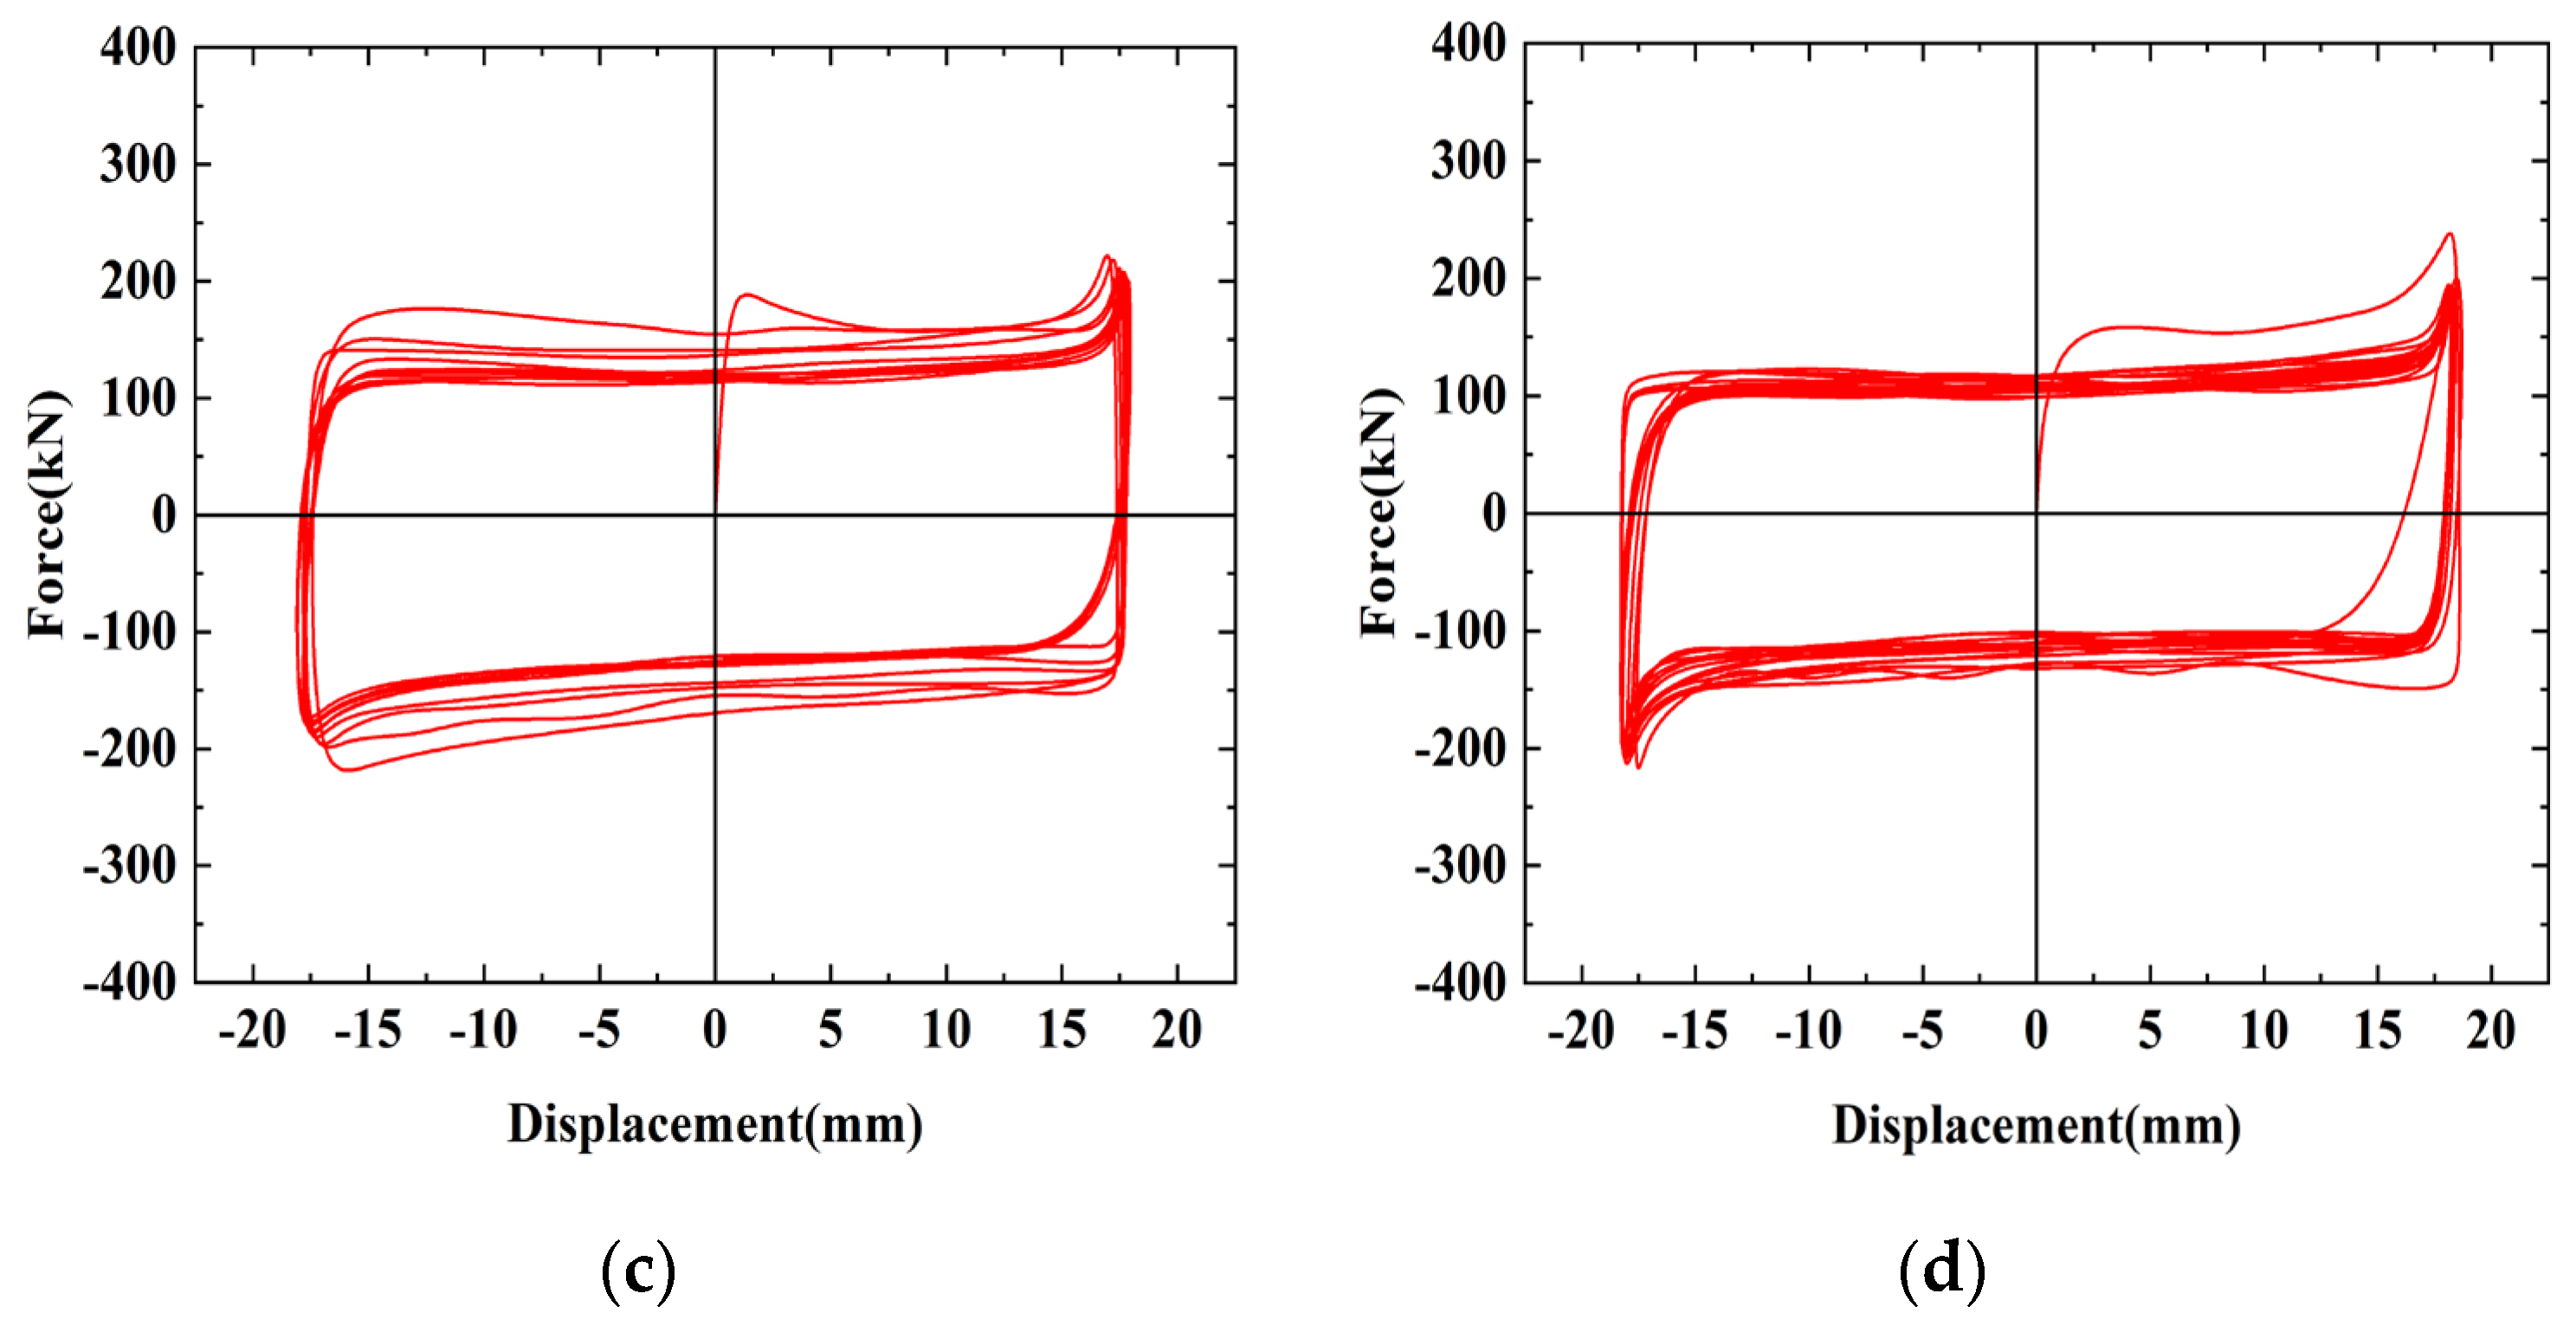
Figure 8.
The hysteresis curves of different numbers of bolts: (a) SJ1, with 22 bolts; (b) SJ2, with 30 bolts; (c) SJ3, with 16 bolts.
Figure 8.
The hysteresis curves of different numbers of bolts: (a) SJ1, with 22 bolts; (b) SJ2, with 30 bolts; (c) SJ3, with 16 bolts.
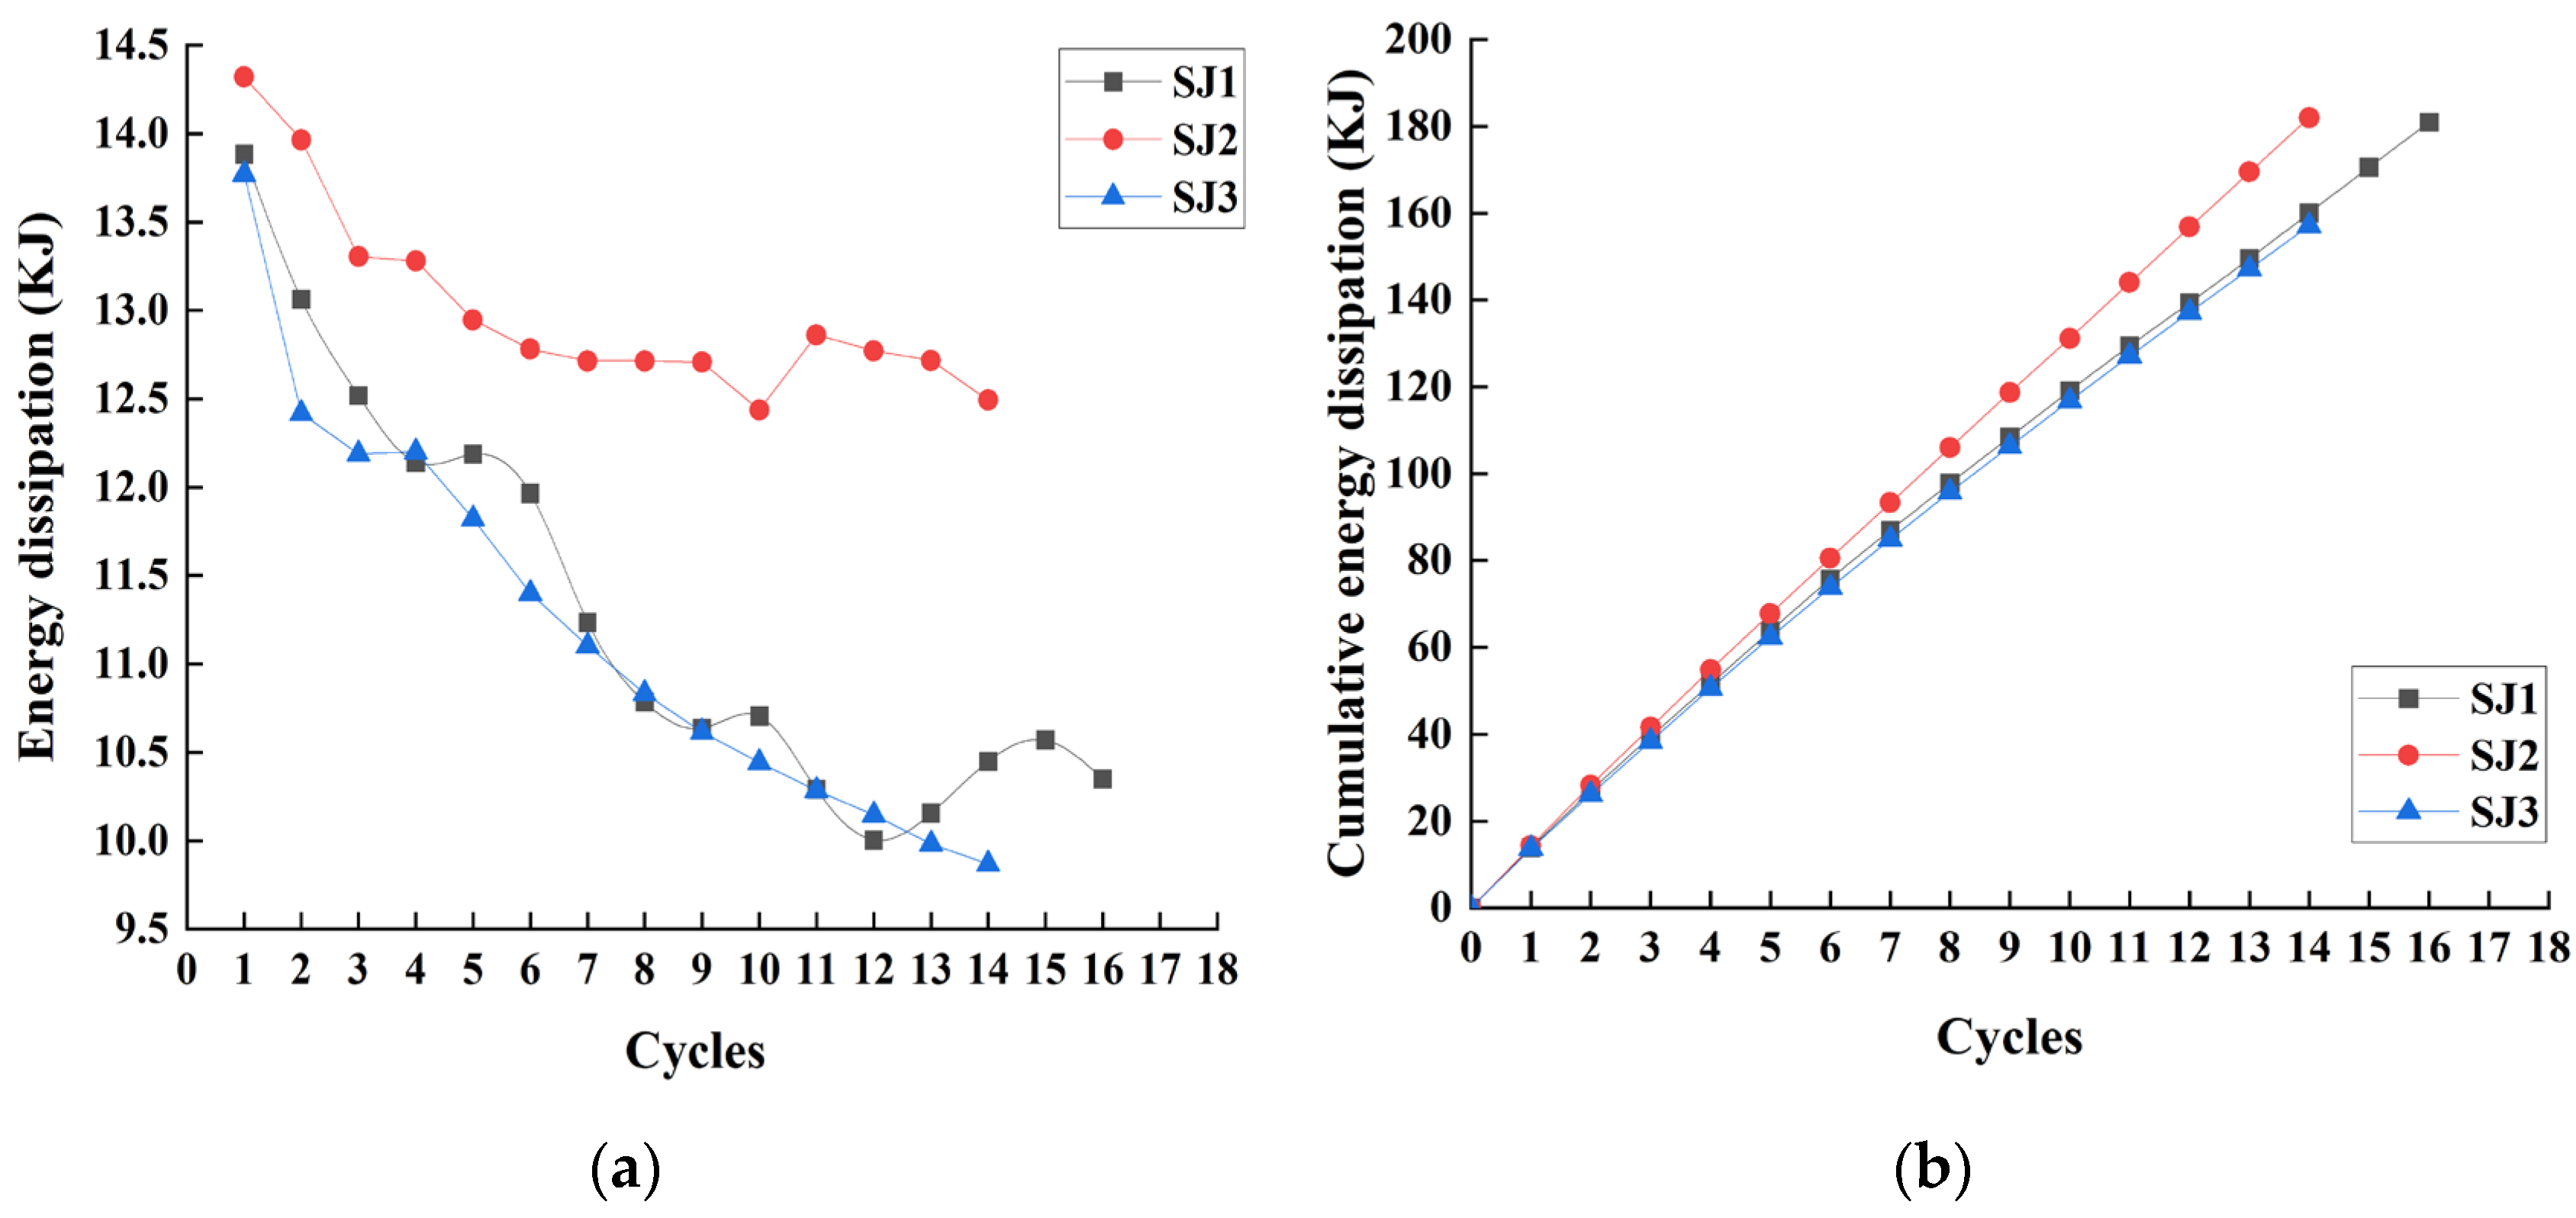
Figure 9.
The energy dissipation analysis of SJ1, SJ2, and SJ3: (a) Energy dissipation; (b) Cumulative energy dissipation.
Figure 9.
The energy dissipation analysis of SJ1, SJ2, and SJ3: (a) Energy dissipation; (b) Cumulative energy dissipation.
Figure 10.
The hysteresis curves of different friction surfaces: (a) SJ1, brass; (b) SJ4, aluminum; (c) SJ5, no friction plates; (d) SJ6, shot blasting.
Figure 10.
The hysteresis curves of different friction surfaces: (a) SJ1, brass; (b) SJ4, aluminum; (c) SJ5, no friction plates; (d) SJ6, shot blasting.
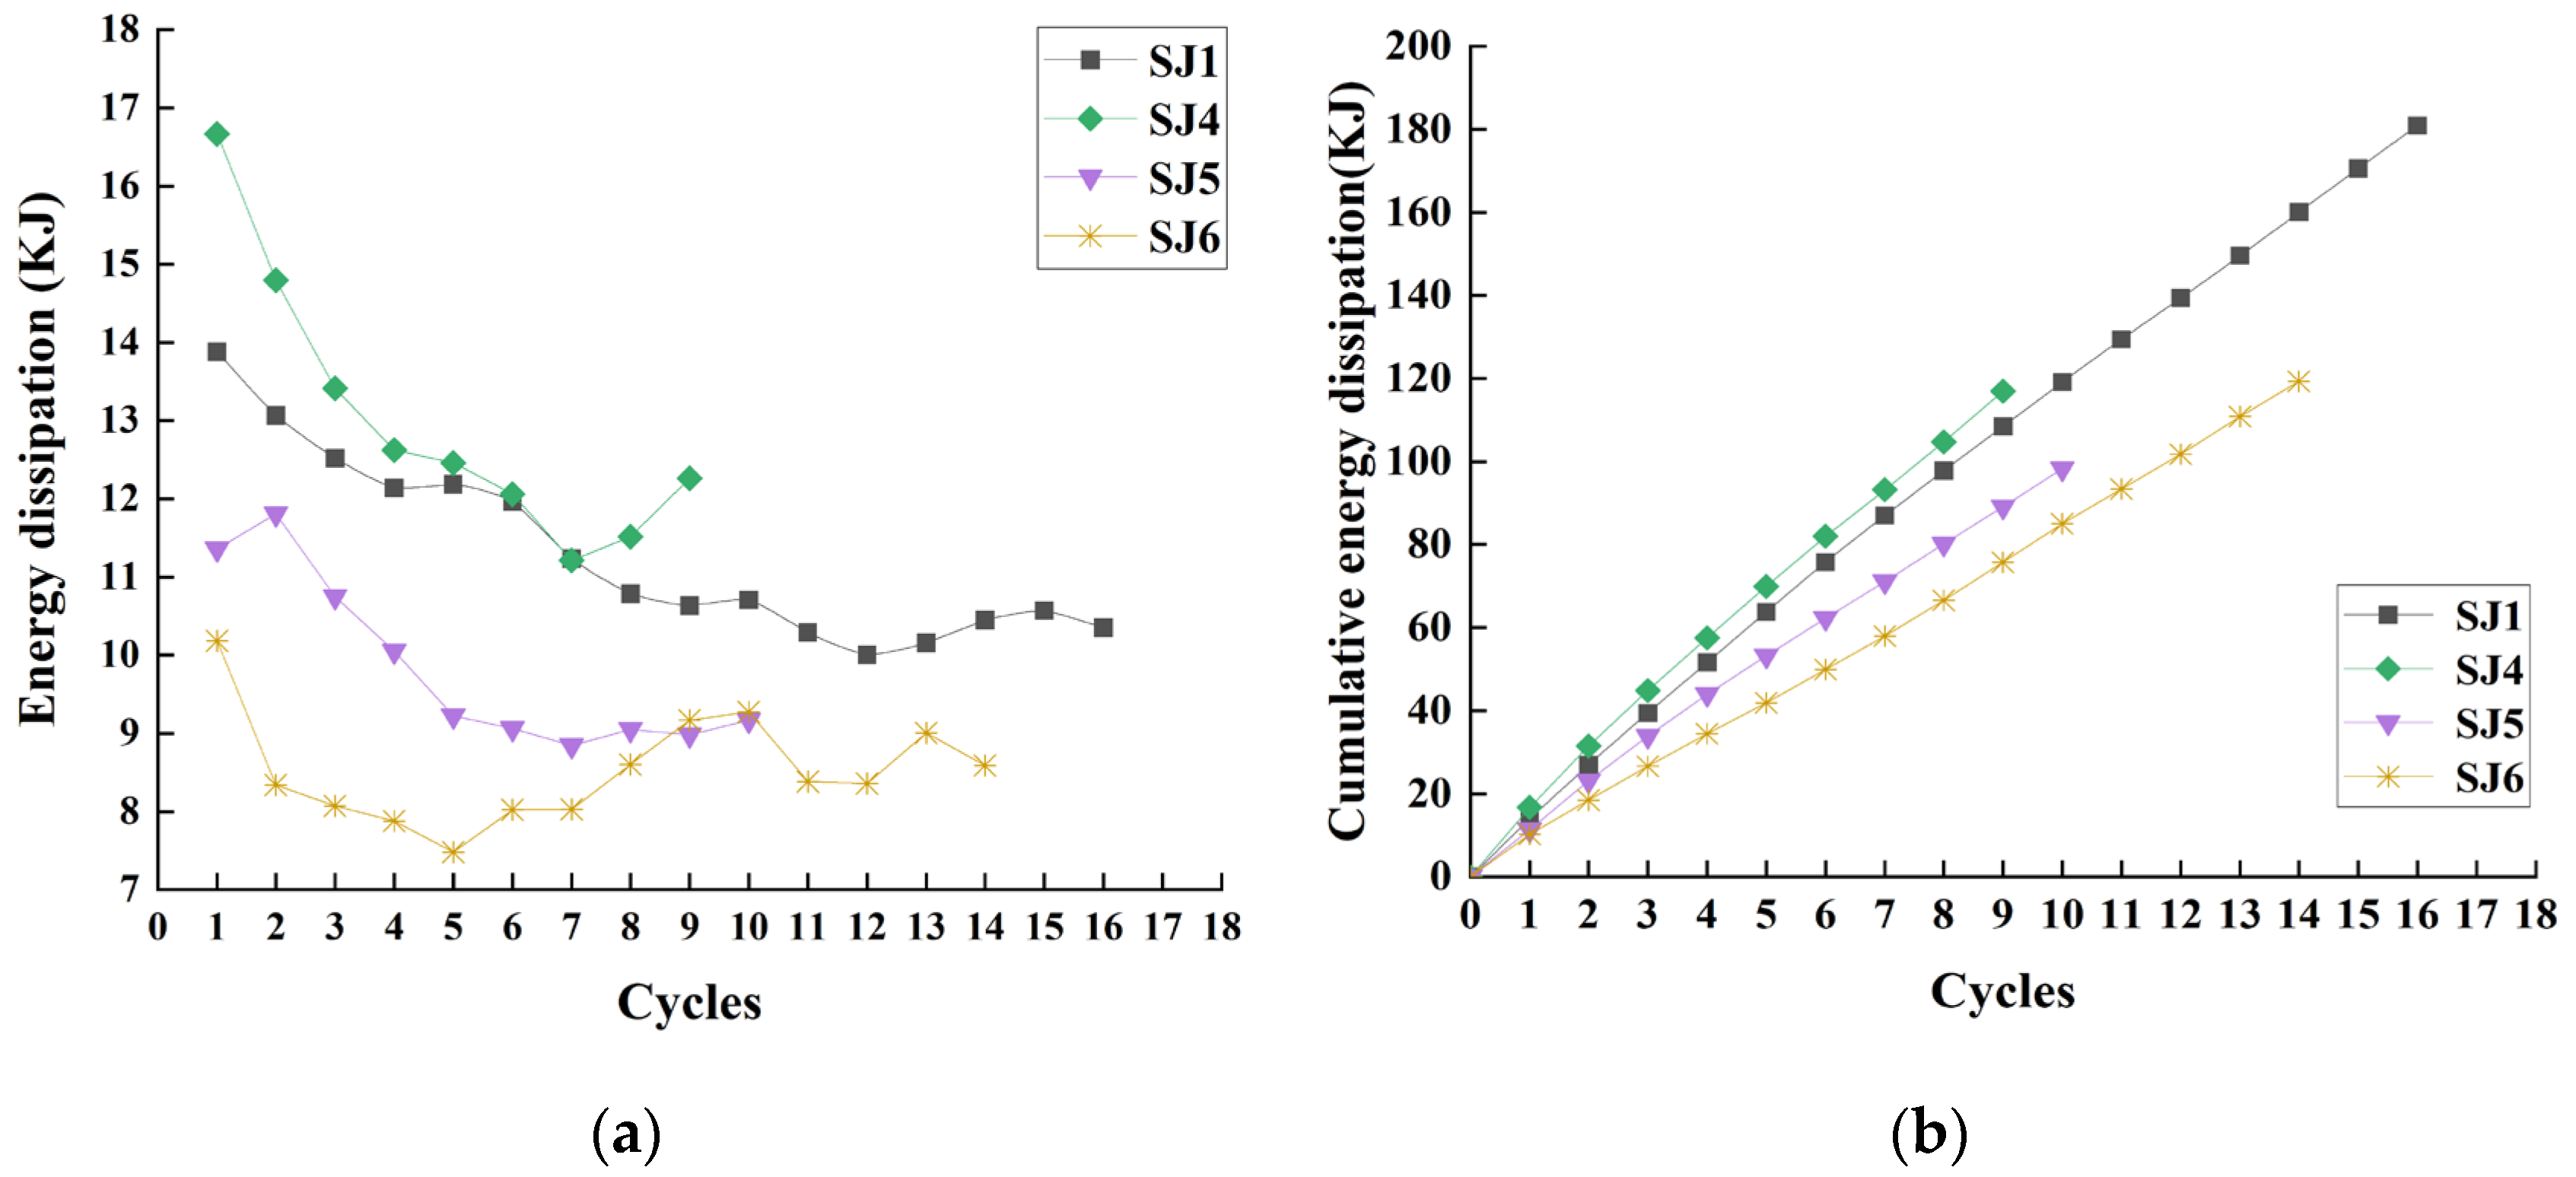
Figure 11.
The energy dissipation analysis of SJ1, SJ4, SJ5, and SJ6: (a) Energy dissipation; (b) Cumulative energy dissipation.
Figure 11.
The energy dissipation analysis of SJ1, SJ4, SJ5, and SJ6: (a) Energy dissipation; (b) Cumulative energy dissipation.
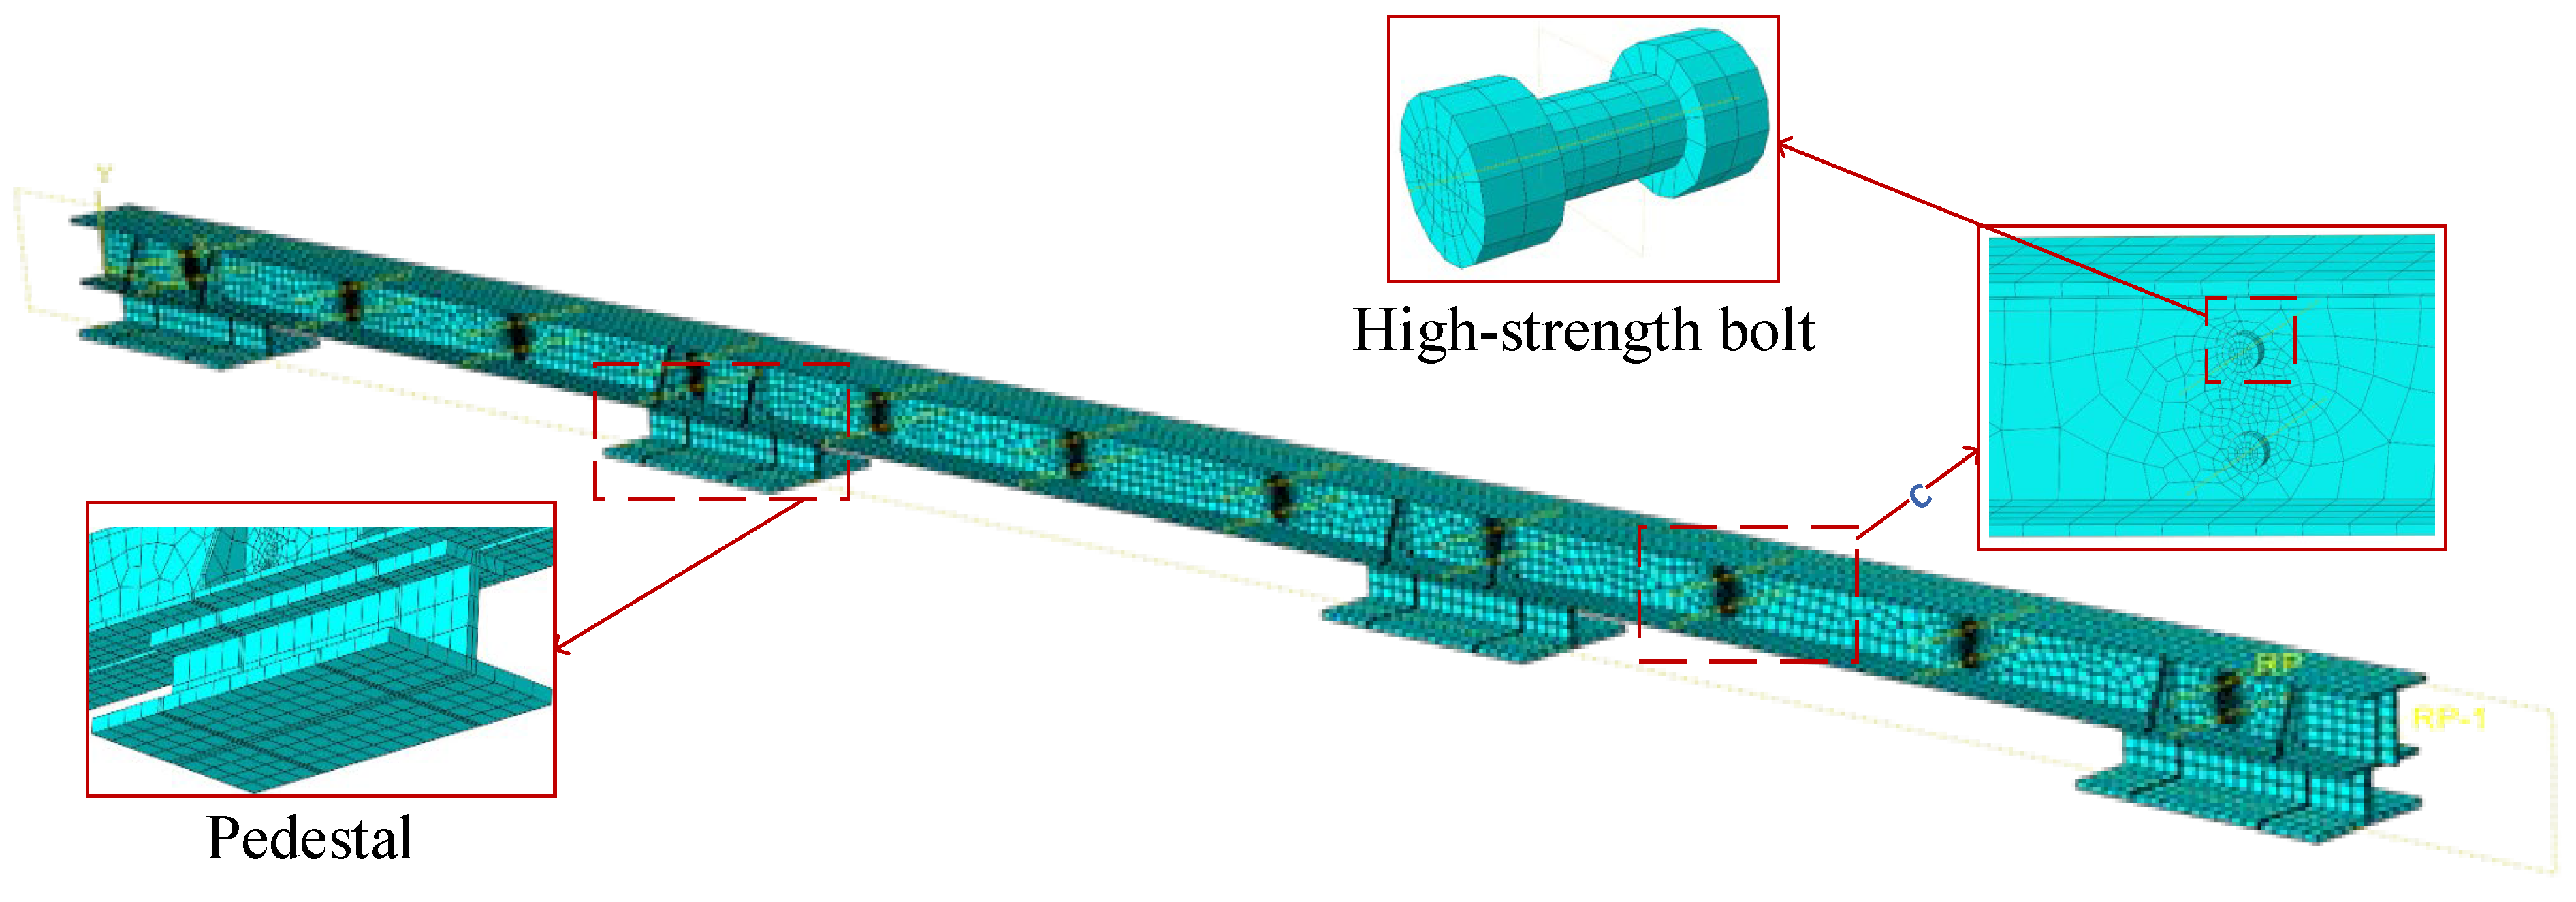
Figure 12.
The finite element model of the friction energy dissipation composite chord.
Figure 12.
The finite element model of the friction energy dissipation composite chord.
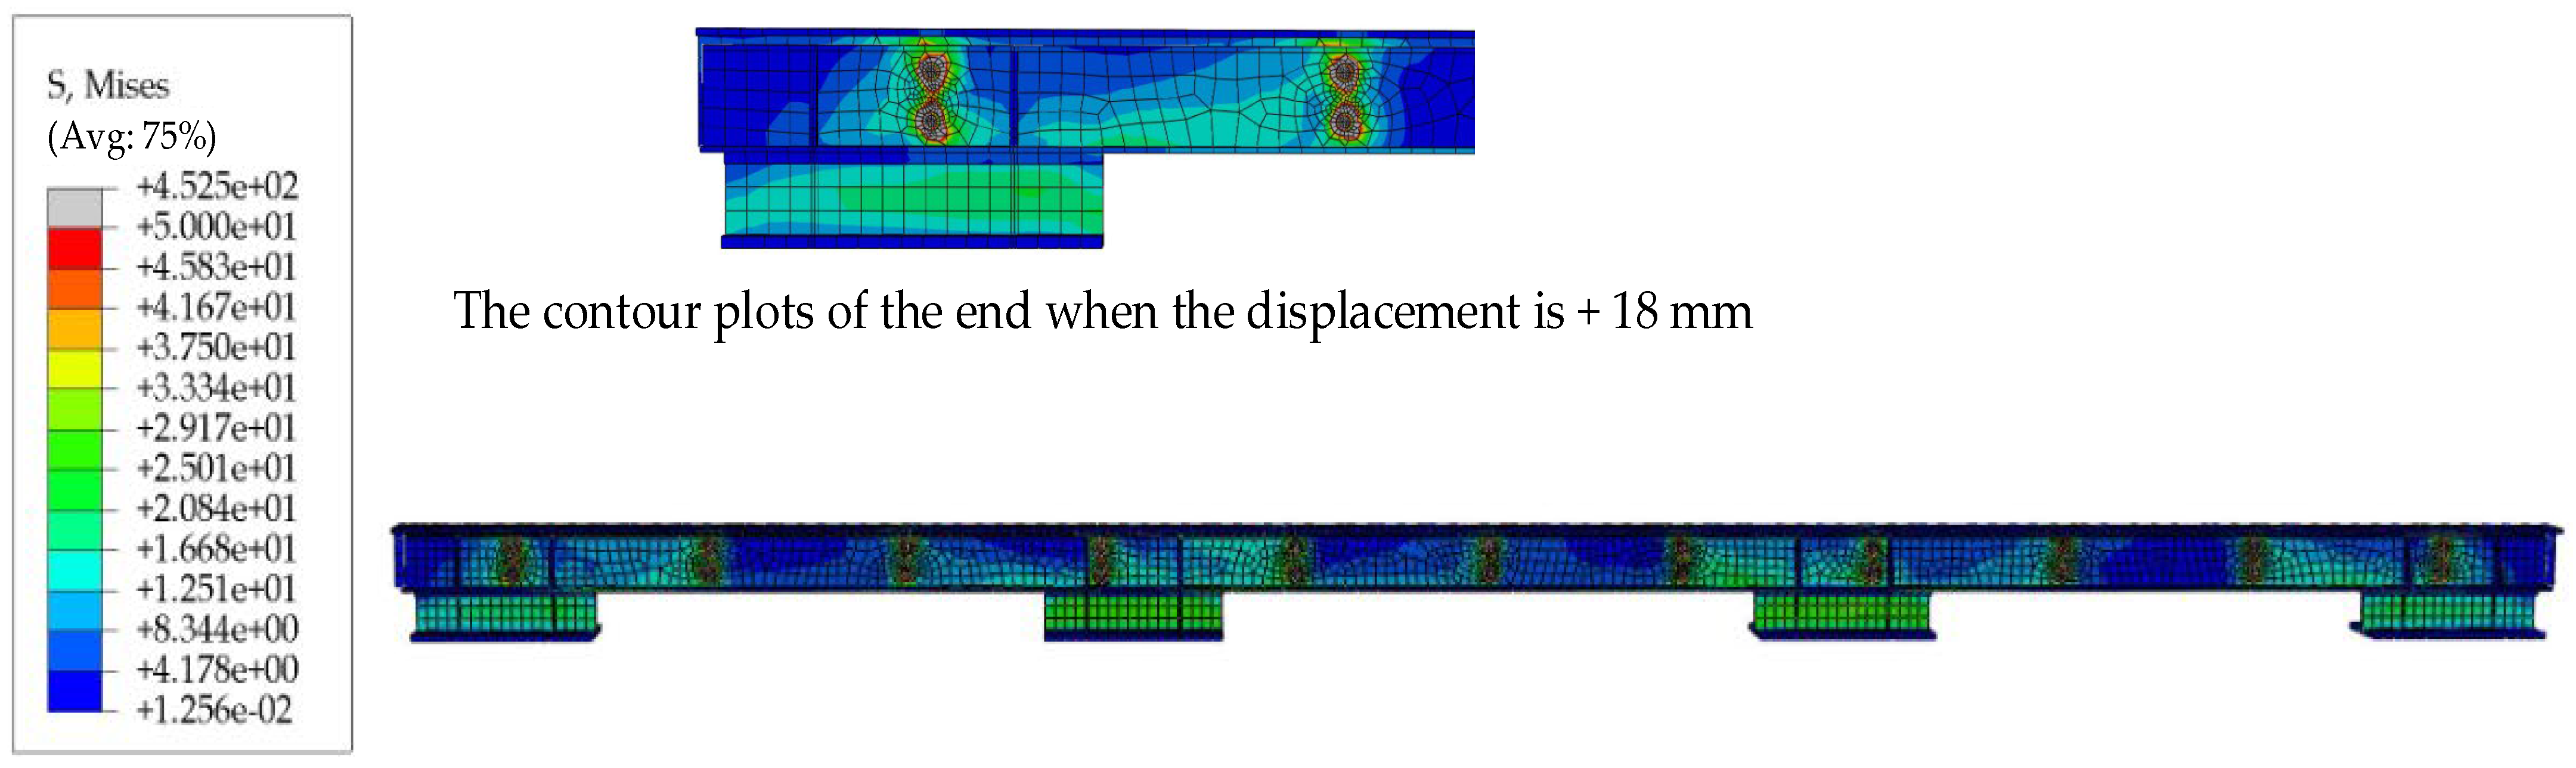
Figure 13.
The contour plots of the finite element model results (based on SJ1).
Figure 13.
The contour plots of the finite element model results (based on SJ1).
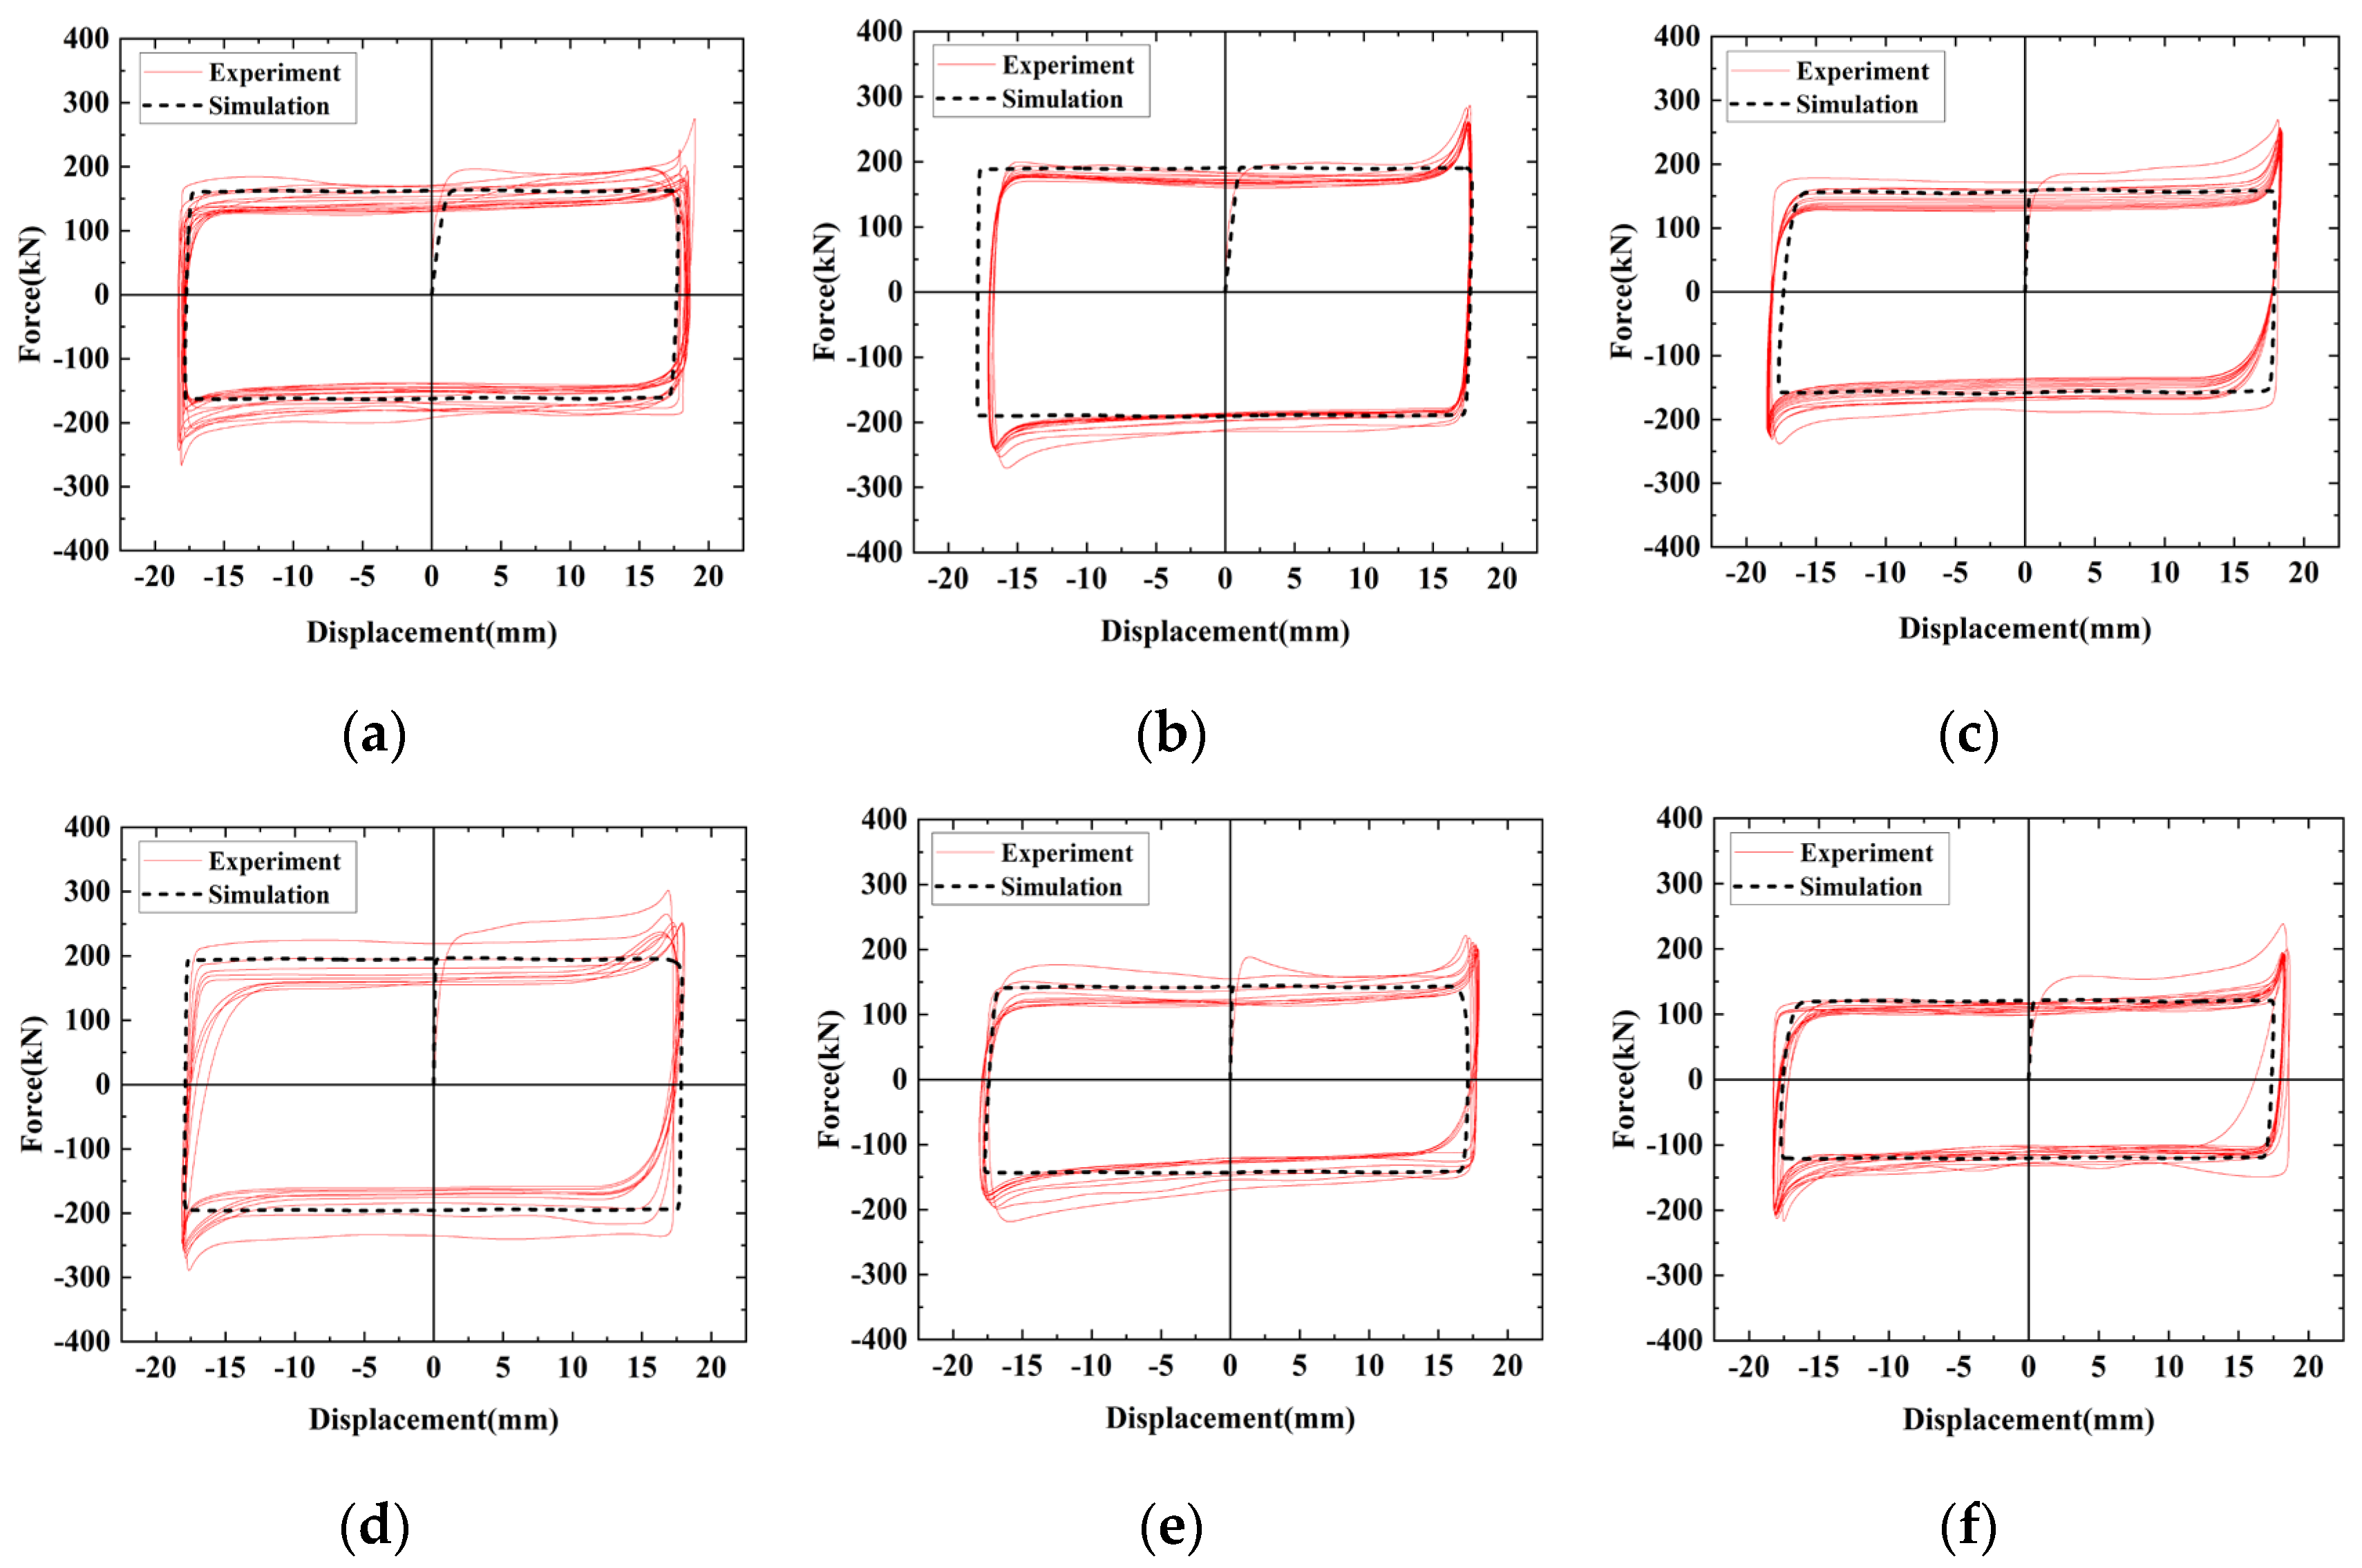
Figure 14.
The comparison of hysteresis curves between the finite element simulation and the experiment: (a) SJ1; (b) SJ2; (c) SJ3; (d) SJ4; (e) SJ5; (f) SJ6.
Figure 14.
The comparison of hysteresis curves between the finite element simulation and the experiment: (a) SJ1; (b) SJ2; (c) SJ3; (d) SJ4; (e) SJ5; (f) SJ6.
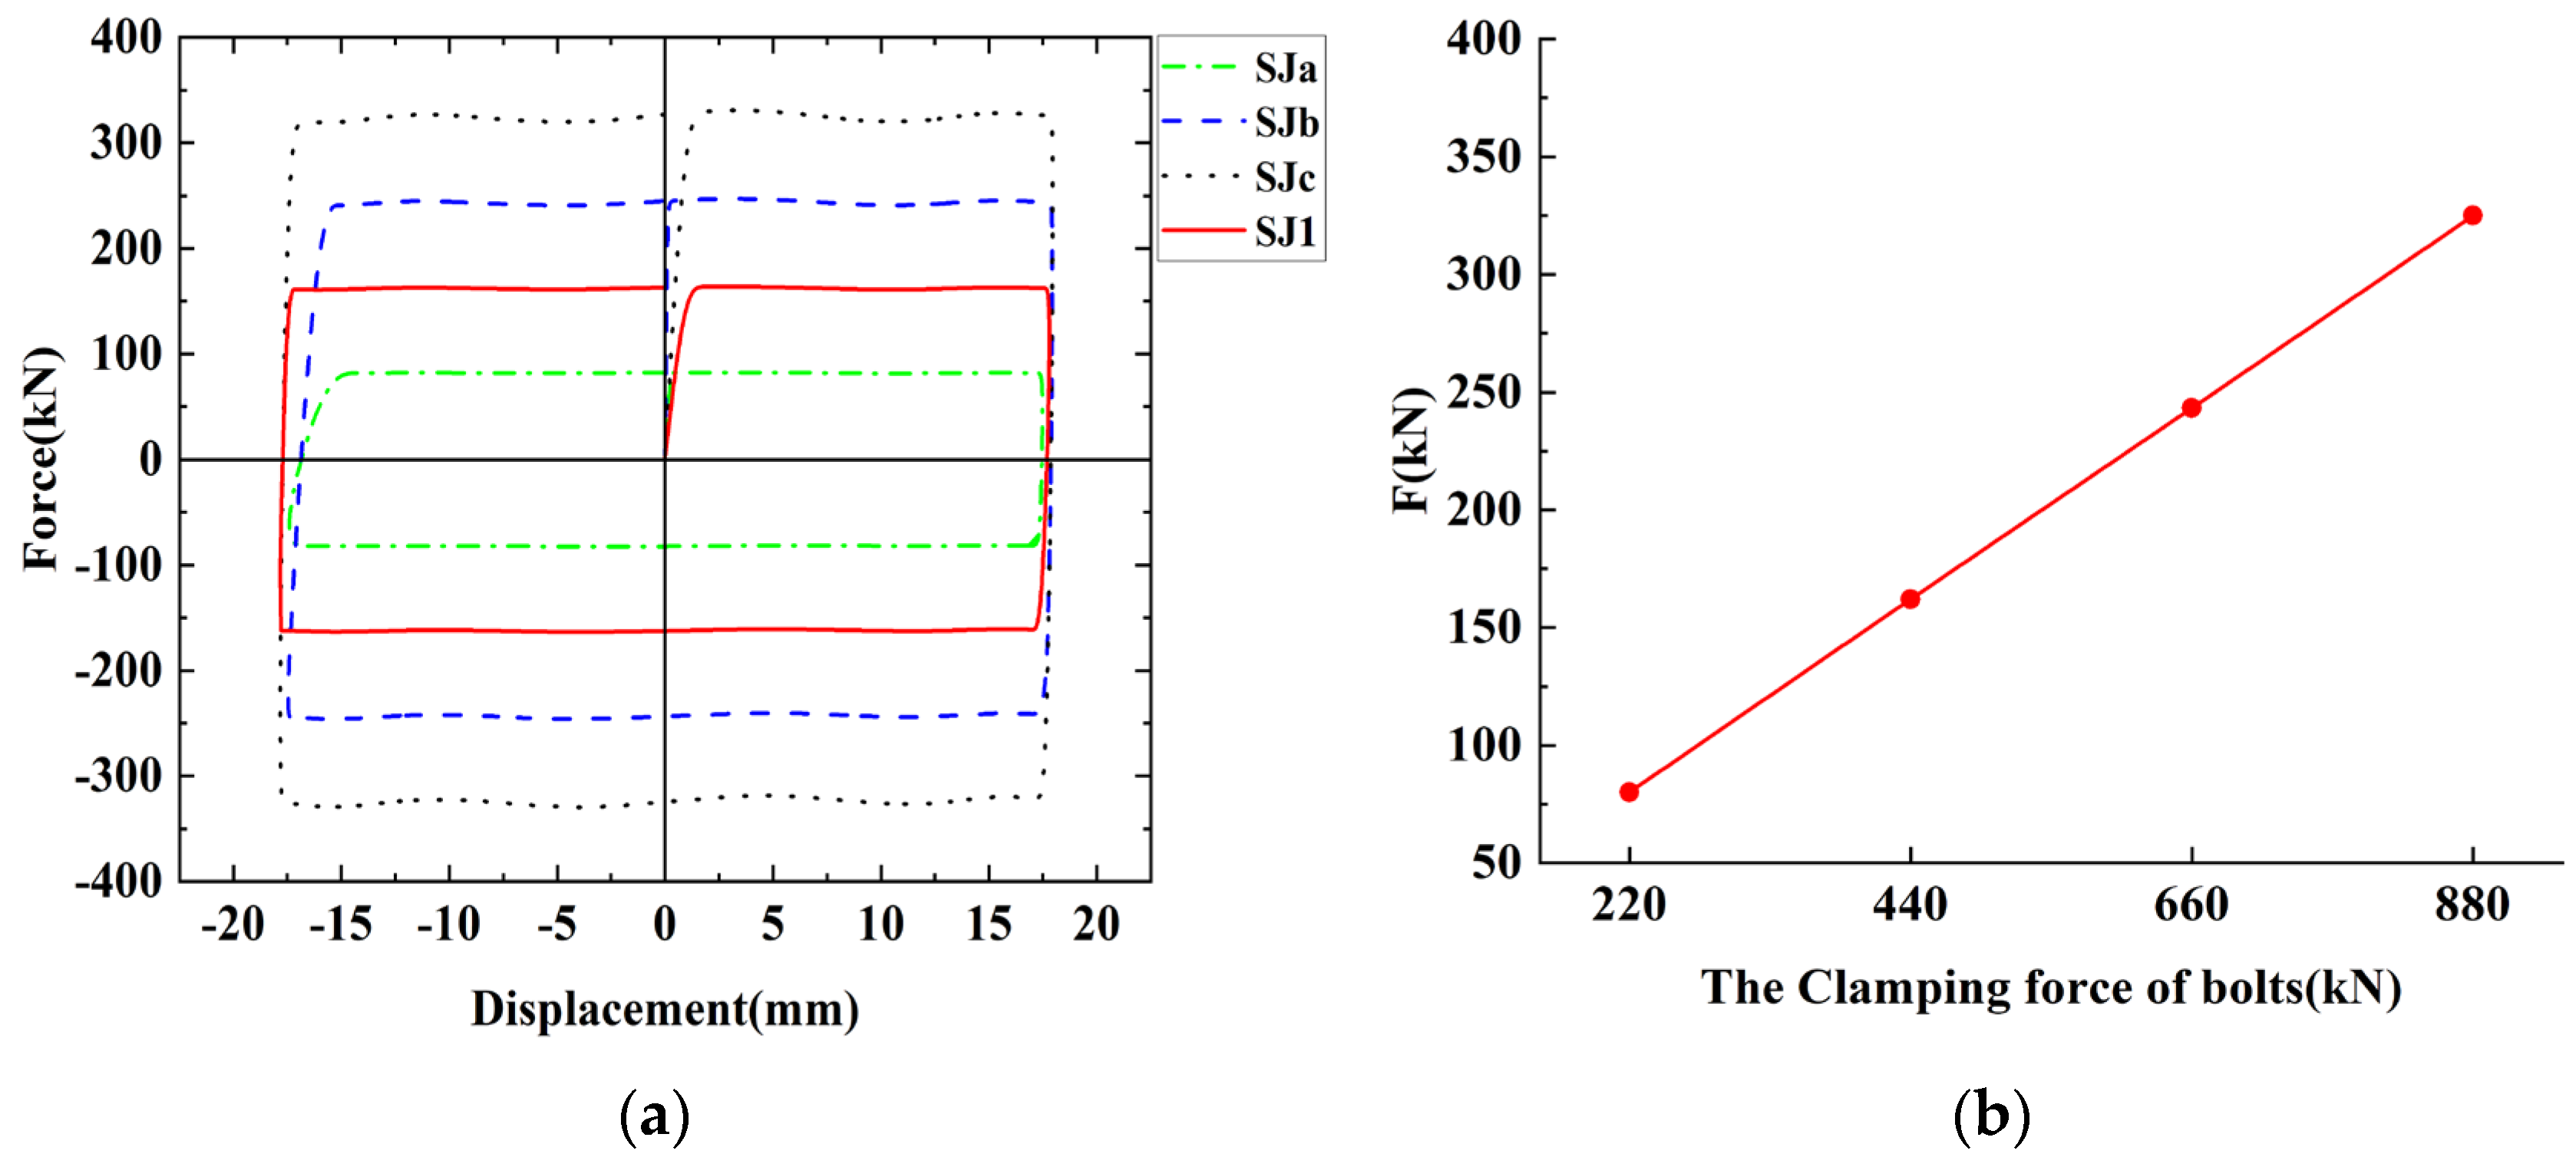
Figure 15.
The comparison of hysteresis curves and average sliding friction force of the finite element simulation with different clamping force of bolts: (a) The comparison of hysteresis curves; (b) The comparison of the average sliding friction force.
Figure 15.
The comparison of hysteresis curves and average sliding friction force of the finite element simulation with different clamping force of bolts: (a) The comparison of hysteresis curves; (b) The comparison of the average sliding friction force.
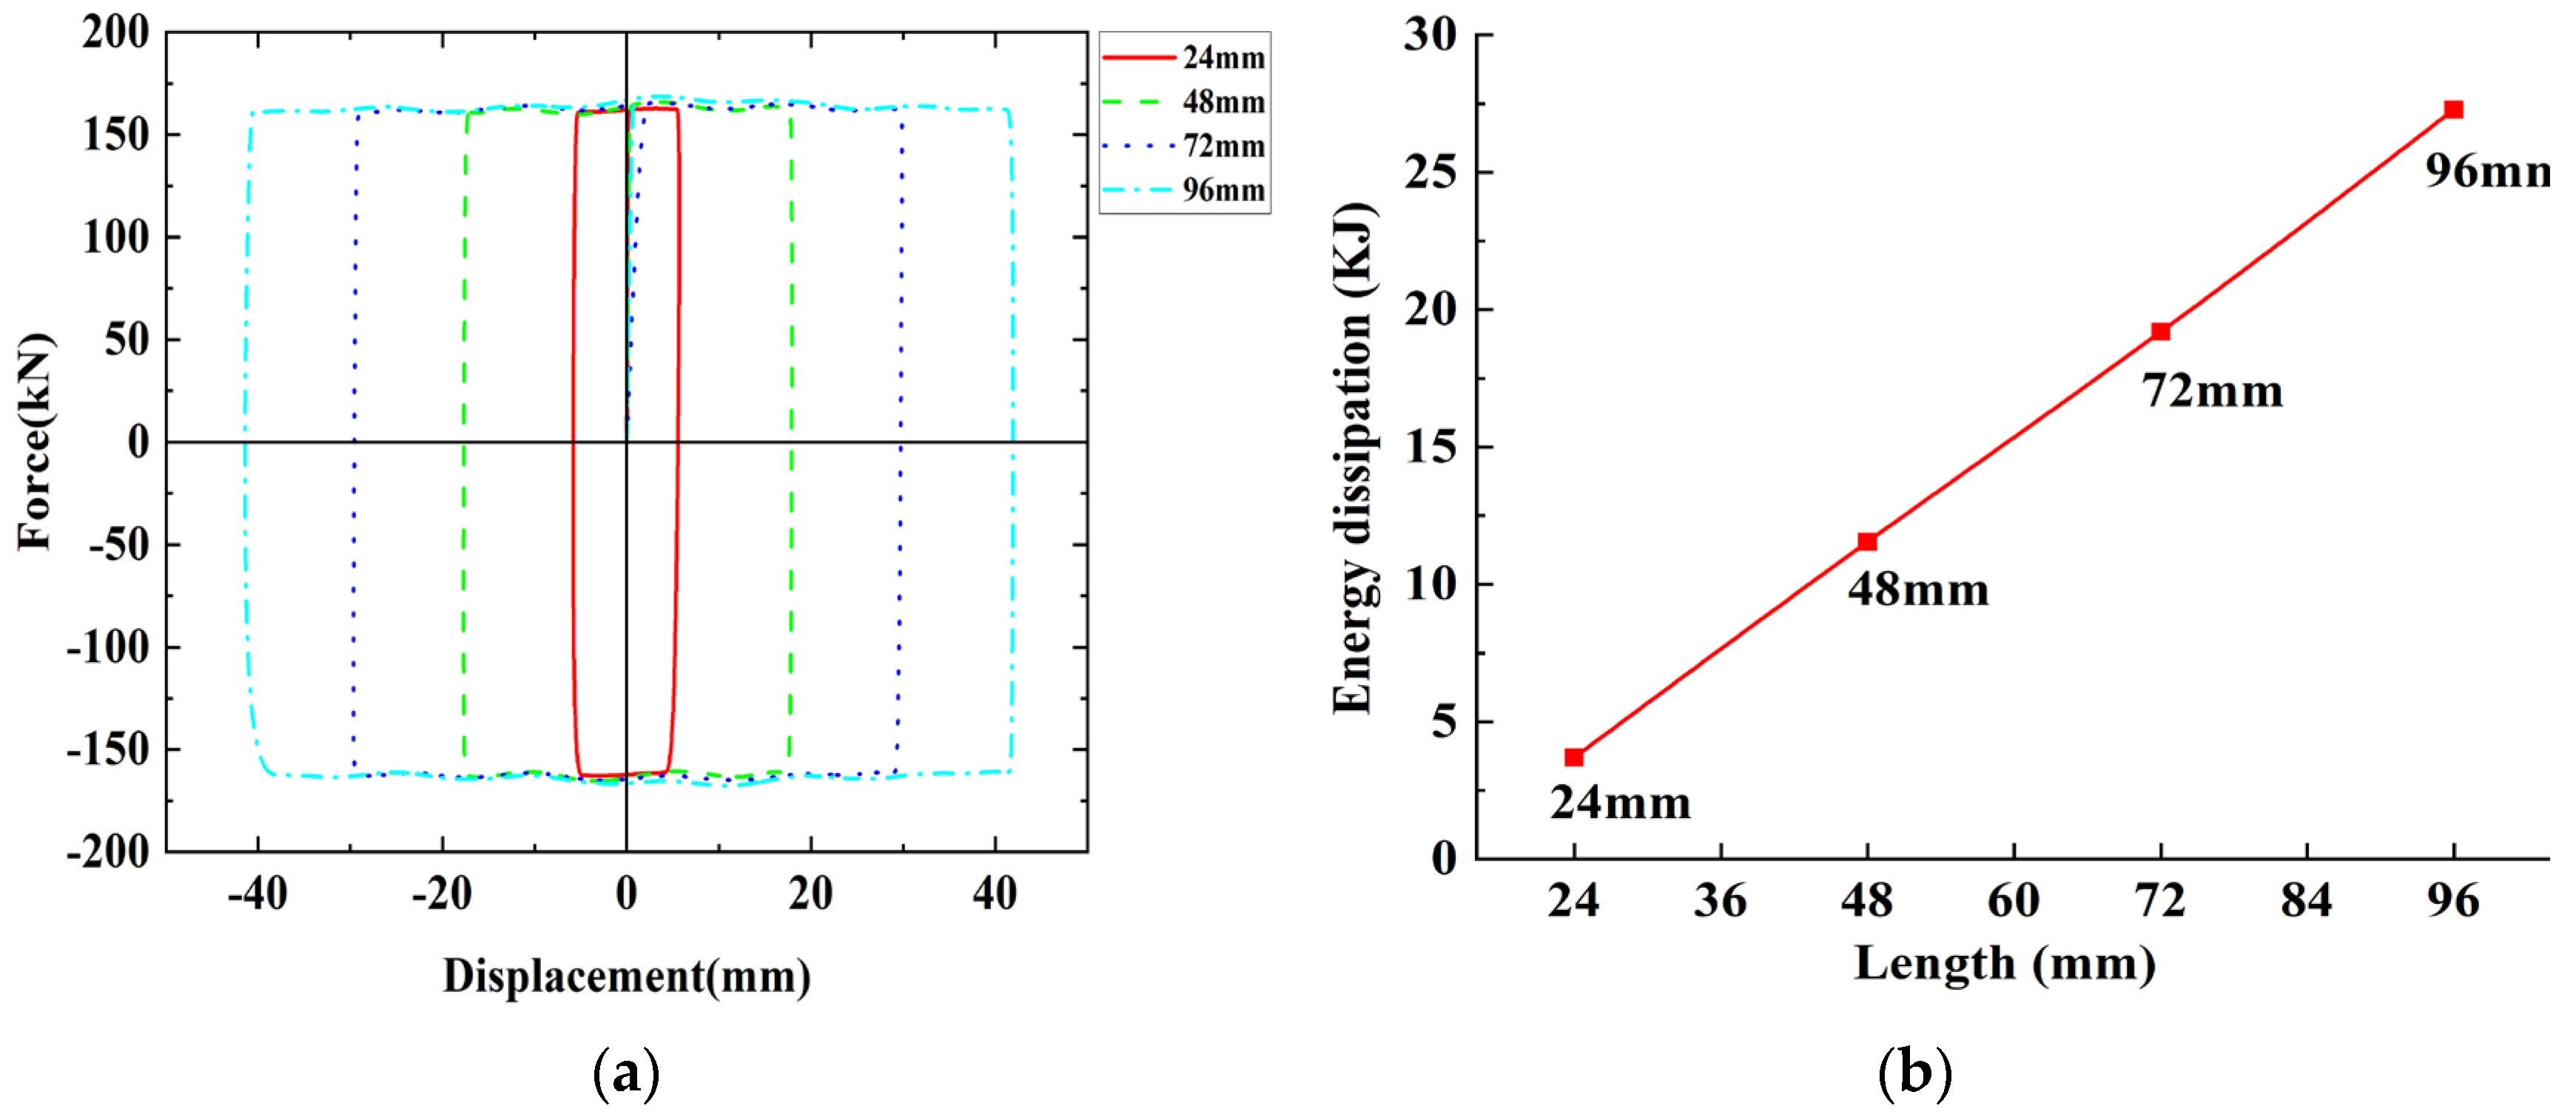
Figure 16.
The comparison of hysteresis curves and energy dissipation of the finite element simulation with different slotted bolt holes length: (a) The comparison of hysteresis curves; (b) The comparison of energy dissipation.
Figure 16.
The comparison of hysteresis curves and energy dissipation of the finite element simulation with different slotted bolt holes length: (a) The comparison of hysteresis curves; (b) The comparison of energy dissipation.
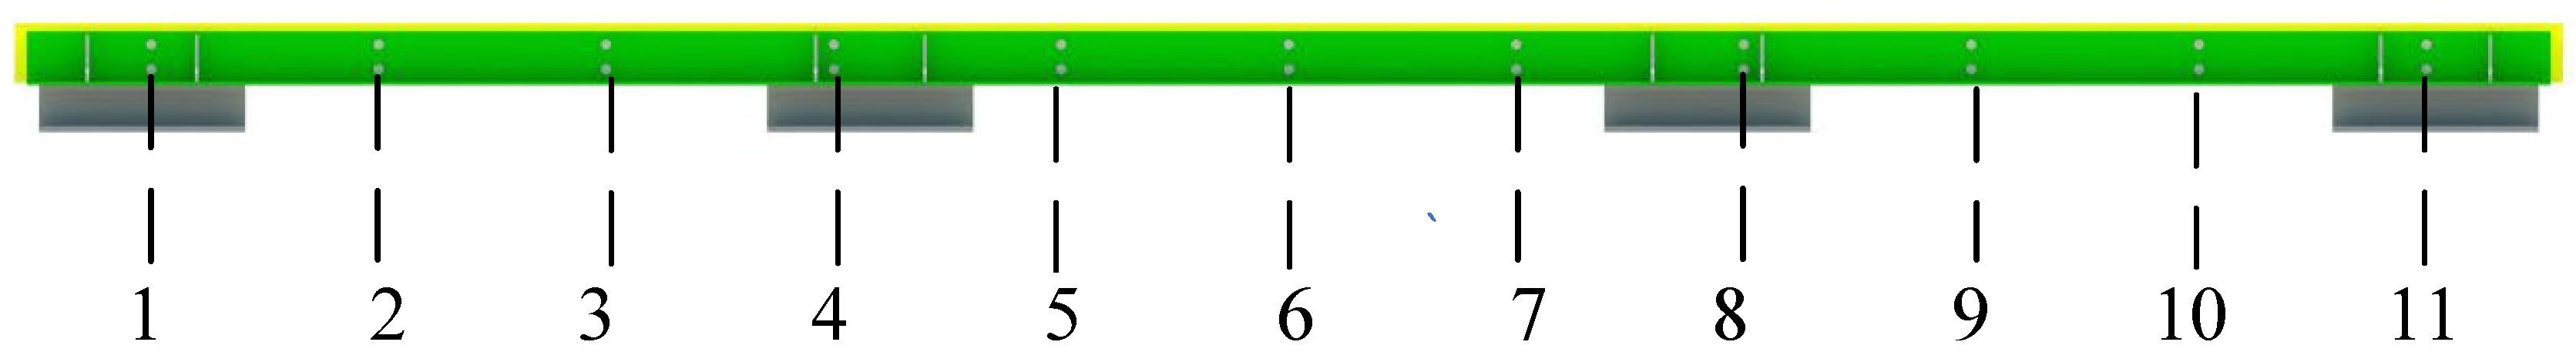
Figure 17.
Area division of the angle steel of friction energy dissipation composite chord.
Figure 17.
Area division of the angle steel of friction energy dissipation composite chord.
Figure 18.
Relationship between friction and displacement in each area of the angle steel of friction energy dissipation composite chord.
Figure 18.
Relationship between friction and displacement in each area of the angle steel of friction energy dissipation composite chord.
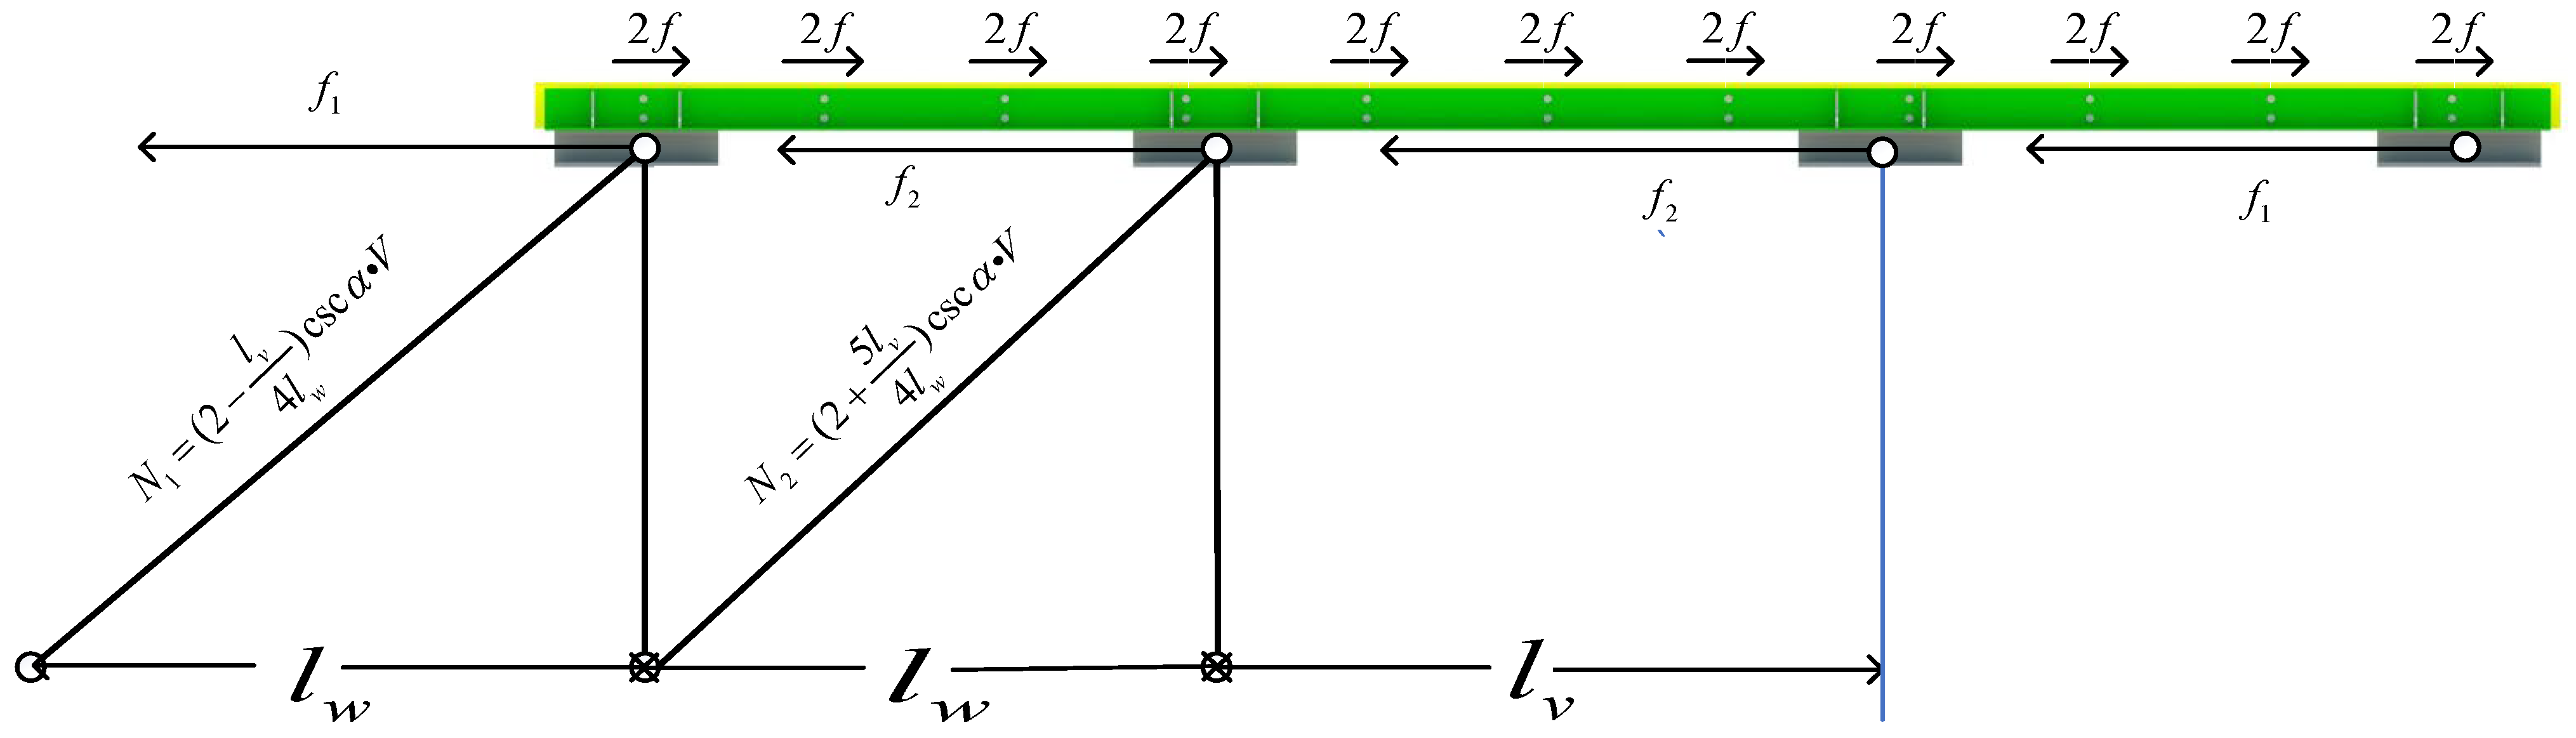
Figure 19.
The axial force analysis of the web member of friction energy dissipation composite chord under horizontal force.
Figure 19.
The axial force analysis of the web member of friction energy dissipation composite chord under horizontal force.
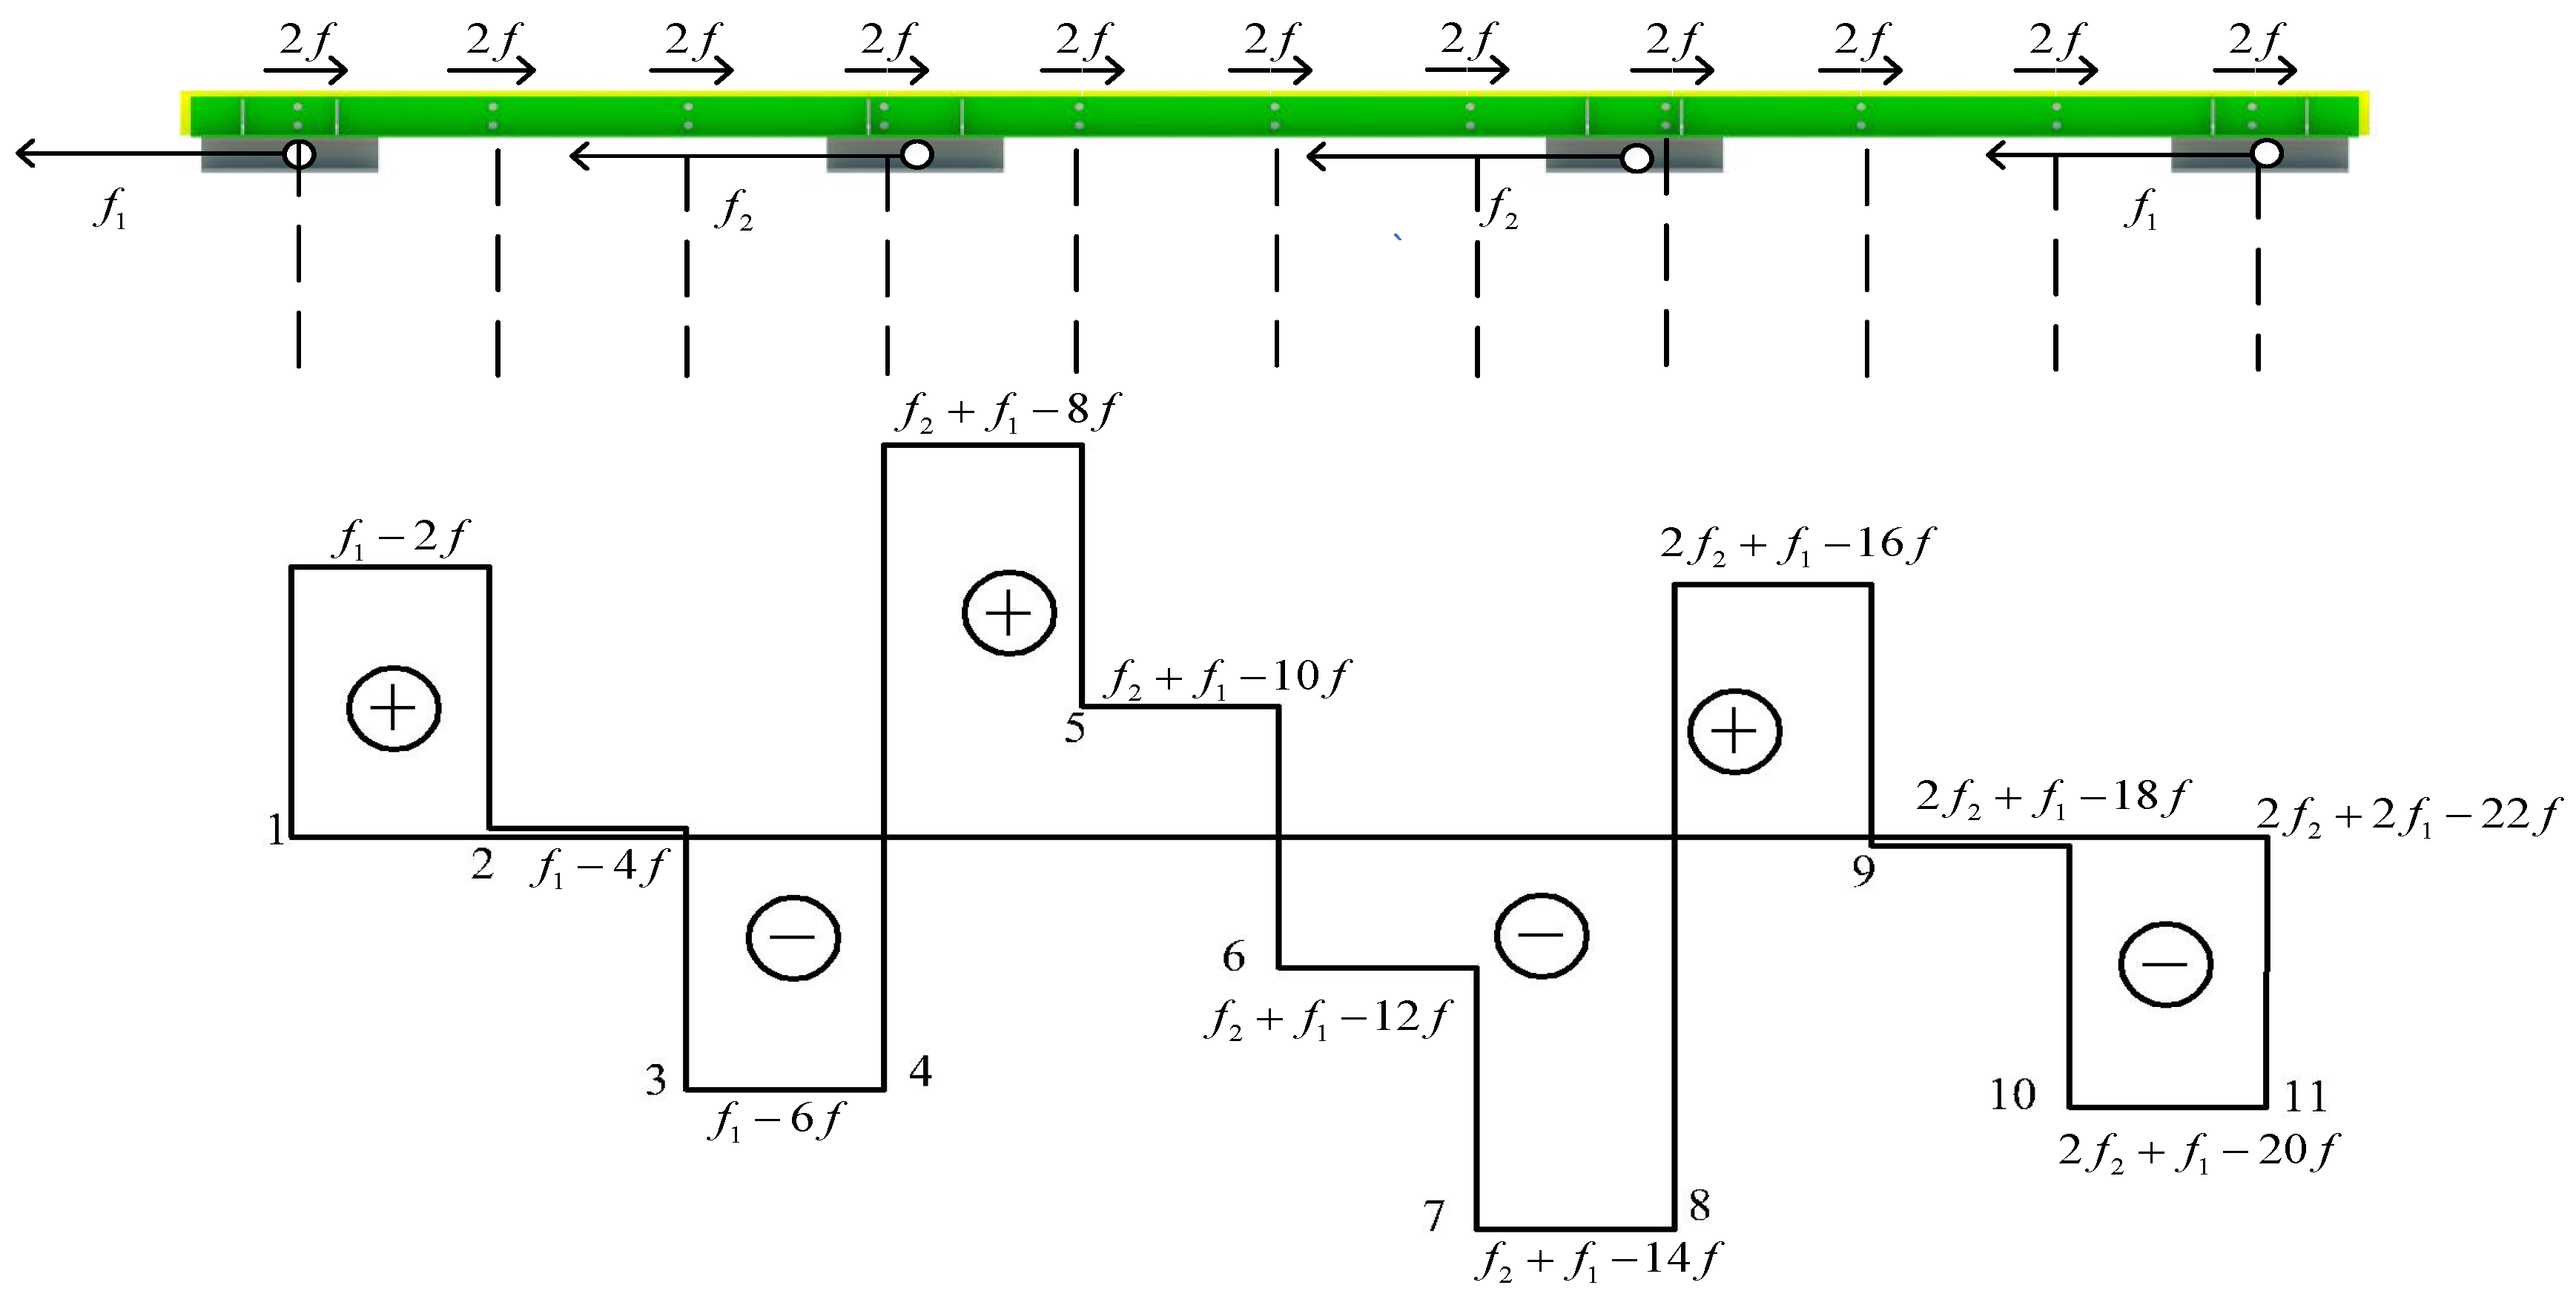
Figure 20.
Axial force of the angle steel of friction energy dissipation composite chord.
Figure 20.
Axial force of the angle steel of friction energy dissipation composite chord.
Table 1.
The details of the friction energy dissipation composite chord specimens.
Table 1.
The details of the friction energy dissipation composite chord specimens.
| Specimens | Number of Bolts | Distance of Bolts/mm | Clamping Forces/kN | Friction Surface | Research Direction |
|---|
| SJ1 | 22 | 375 | 440 | Brass | Comparative analysis of different numbers of bolts |
| SJ2 | 30 | 280 | 440 | Brass |
| SJ3 | 16 | 550 | 440 | Brass |
| SJ1 | 22 | 375 | 440 | Brass | Comparative analysis of different arrangements of friction surfaces |
| SJ4 | 22 | 375 | 440 | Aluminium |
| SJ5 | 22 | 375 | 440 | No friction plate |
| SJ6 | 22 | 375 | 440 | Shot blasting and without friction plate |
Table 2.
The friction non-uniformity coefficient and the influence coefficient of the maximum static friction force .
Table 2.
The friction non-uniformity coefficient and the influence coefficient of the maximum static friction force .
| Specimens | /kN
| /kN
| /kN
| /kN
| | |
|---|
| SJ1 | 153.3 | −166.1 | 199.3 | −178.0 | 0.92 | 1.18 |
| SJ2 | 177.1 | −197.8 | 193.5 | −207.4 | 0.90 | 1.07 |
| SJ3 | 150.5 | −160.2 | 186.1 | −182.7 | 0.94 | 1.19 |
| SJ4 | 190.6 | −194.1 | 230.0 | −232.8 | 0.98 | 1.20 |
| SJ5 | 136.5 | −144.6 | 203.5 | −189.1 | 0.94 | 1.39 |
| SJ6 | 116.5 | −121.0 | 159.4 | −151.9 | 0.96 | 1.31 |
Table 3.
Friction analysis of the friction energy dissipation composite chord specimens.
Table 3.
Friction analysis of the friction energy dissipation composite chord specimens.
| Specimens | /kN
| /kN
| | | | |
|---|
| SJ1 | 192.8 | 138.9 | 1.39 | 160.2 | 16.21 | 10.12% |
| SJ2 | 198.9 | 172.7 | 1.15 | 187.4 | 7.58 | 4.04% |
| SJ3 | 191.3 | 137.1 | 1.40 | 154.9 | 15.77 | 10.18% |
| SJ4 | 231.5 | 155.7 | 1.49 | 192.7 | 24.24 | 12.58% |
| SJ5 | 164.0 | 122.8 | 1.34 | 140.8 | 15.24 | 10.82% |
| SJ6 | 141.5 | 103.9 | 1.36 | 118.8 | 9.64 | 8.11% |
Table 4.
The average sliding friction coefficient of the friction energy dissipation composite chord specimens.
Table 4.
The average sliding friction coefficient of the friction energy dissipation composite chord specimens.
| Specimens | SJ1 | SJ2 | SJ3 | SJ4 | SJ5 | SJ6 |
|---|
| 0.182 | 0.213 | 0.176 | 0.219 | 0.160 | 0.135 |
Table 5.
The comparison of the average sliding friction force values between the finite element simulation and the experiment.
Table 5.
The comparison of the average sliding friction force values between the finite element simulation and the experiment.
| Specimens | Test/kN | Simulation/kN | Error |
|---|
| SJ1 | 159.9 | 162.1 | 1.4% |
| SJ2 | 187.6 | 188.4 | 0.4% |
| SJ3 | 155.2 | 157.2 | 1.3% |
| SJ4 | 192.3 | 186.3 | 3.1% |
| SJ5 | 140.4 | 142.2 | 1.3% |
| SJ6 | 118.9 | 119.4 | 0.4% |
Table 6.
The comparison of the friction force of the finite element simulation with different clamping force of bolts.
Table 6.
The comparison of the friction force of the finite element simulation with different clamping force of bolts.
| FE Model | Clamping Force/kN | Law/kN | Simulation/kN | Error | | C.V |
|---|
| SJ1 | 440 | 160.2 | 162.1 | 1.2% | 0.84 | 0.52% |
| SJa | 220 | 80.08 | 82.0 | 2.4% | 0.26 | 0.32% |
| SJb | 660 | 240.2 | 243.3 | 1.3% | 1.81 | 0.74% |
| SJc | 880 | 320.3 | 325.0 | 1.5% | 2.73 | 0.84% |
Table 7.
The comparison of the friction force of the finite element simulation with different slotted bolt holes length.
Table 7.
The comparison of the friction force of the finite element simulation with different slotted bolt holes length.
| L/mm | Law/kN | Simulation/kN | Error | | C.V |
|---|
| 24 | 160.2 | 162.2 | 1.2% | 0.54 | 0.0033 |
| 48 | 160.2 | 162.2 | 1.2% | 4.11 | 0.0253 |
| 72 | 160.2 | 162.3 | 1.3% | 4.46 | 0.0275 |
| 96 | 160.2 | 163.0 | 1.7% | 4.26 | 0.0261 |
Table 8.
The comparison of axial force between the simulation and the calculation results.
Table 8.
The comparison of axial force between the simulation and the calculation results.
| Force | Simulation/kN | Calculation/kN | Error |
|---|
| 62.86 | 59.17 | −5.87% |
| 97.63 | 100.98 | 3.72% |
| No. 4~No. 5 | 42.96 | 43.67 | 1.63% |
| No. 7~No. 8 | −43.85 | −43.69 | −0.37% |


