1. Introduction
Since the 1950s, it has been known that air entrainment of concrete is the basic technological treatment that largely determines its frost resistance [
1]. The method of determining the parameters of the air pore structure was included in the ASTM C 457 Standard [
2]; now, the basic measurement method is based on the number and length of chords on the surface of the sample. The parameter determining the frost resistance of concrete is the spacing factor of the air bubbles, L. Two factors influence the L parameter: the specific surface area of the air pores (α) and the ratio of the volume of the cement paste to the volume of air in the concrete (P/A). The specific surface area of the pores is a simple relationship directly related to the average length of the measured chords [
2].
Many concrete frost resistance tests performed in the 1990s led to the development of Standard 480, which is based primarily on ASTM C457. A new element has been introduced to the method of estimating the pore size distribution in space (3D), based on the analysis of the chord length distribution (1D) divided into 28 chord length classes. As a result, this method allows for estimating the content of micropores with a diameter of less than 300 μm (the so-called A300) [
3,
4]. Based on the results of research [
5,
6] on the use of polymer microspheres to air-entrain the concrete mix, it can be concluded that concrete can be frost-resistant even when the A
300 micropore content is about 1%. On the other hand, an A
300 condition above 2.0% does not guarantee the spacing of the air bubbles L < 0.20 mm. Many documents assume that concrete frost-resistance criteria concern both the requirement for spacing factor L < 0.20 mm and the content of A
300 > 1.5% [
7,
8] or A
300 > 2.0%, according to Dag Vollset et al. [
9]. However, the micropore content is regarded as an auxiliary criterion of secondary importance by the ACI recommendation and the ASTM C 457 Standard. In these documents, the A
300 criterion is not considered at all.
Air voids in concrete are characterized by a relatively large dimension range, ranging from a few micrometres to a few millimetres. The distribution of the pore dimension is not uniform; most pores (chords) are in the range of up to 200 μm, and there are far fewer above that [
6,
10]. In addition, it can be stated that the distribution of chords is not continuous. In some classes, there are many chords, and, in others, there are few or no chords. In the Saltykov method, the author assumed that there must be at least seven chord classes, but no more than fifteen (the table with coefficients was adapted to manual measurements). Currently, there are no such computational problems, so, theoretically, more classes can be accepted. However, the values of the transfer coefficients are very small, which, with the small number of chords in a class, should not be of significant importance [
11,
12,
13]. The basic observation from microscopic examinations is the fact that, on the plane of the sample surface, there is an overrepresentation of large pores in relation to their number observed in the volume of concrete. Therefore, it is necessary to correct the number of chords in particular classes in the calculation. The aforementioned correction consists in converting the number of 1D chords in a given class to the number of diameters in the 3D space.
Usually, the number of chords in concrete, according to EN-480-11 [
3], ranges from 400 to 1200. In the calculation of the micropore content according to the table of the EN-480-11 Standard, the ninth column (air content in each class) often contains a negative value of the pore volume, which, of course, does not make any physical sense [
3]. The fact that one chord with a length of 3000 μm is equal to 300 chords of 30 μm long shows that taking into account large pores in the calculations has a significant impact on the result of the spacing factor, L. Hence the criticism made by many researchers of the method is that the spacing factor depends very much on one factor, which is the average length of the chords. It has been postulated that the calculations should take into account the actual size distribution of the chord length, and not only the average chord length [
5,
14,
15]. Various approaches to the issue have been proposed, including [
6,
15,
16,
17,
18] and others. In general, the linear traverse method measurements are carried out manually, measuring all the chords that cross air voids. It is interesting to note that the EN 480-11 Standard mentions the possibility of automating such measurements [
3]. This requires a suitable contrast between the air voids and the cement paste and aggregate, which is achieved by covering the surface of the concrete with dark ink and filling the pores with white powder. Fonseca and Scherer presented a comprehensive study on the process of contrasting the surface for testing. They tested various types of white powders with different grain sizes to fill the pores [
16]. In his work, Załocha presented the idea of using automatic image analysis to measure chord lengths with greater accuracy [
17]. The advantage of the automatic approach is that it can provide better reproducibility of the results compared to the classic manual method. This idea was further developed [
6,
16], describing a 2D approach based on two-dimensional cross-sections of pores on the surface of the test sample. As a result, the exact diameter of the pores, not just the chords, could be analysed. Additionally, a qualitative analysis of each measured air void is possible because it is described by many parameters that characterise the shape, e.g., equivalent diameter, circumference, roughness, and elongation.
Hasholt [
18], on the other hand, analysed the air pore structure results from four independent laboratories. In conclusion, the total surface area of air voids parameter performed as well or better than the spacing factor in determination of the frost resistance of concrete. Therefore, the total surface area parameter may be a better indicator of frost resistance.
Theoretically, the content of A
300 could be verified, e.g., by using computed tomography (CT). At present, the resolution of the devices is too small in relation to the dimensions of the small pores, and such an estimation is unreliable [
19].
This article presents an analysis of the air pore structure conducted on 292 pavement concretes (262 concretes used for the analysis and another 30 to verify the results) with different air content. Parameters A, A300, and α were determined by the Rosival linear traverse method, counting the length of the chords according to the EN-480-11 Standard. The aim of the analysis was to determine the relationship between the number of chords in individual classes and the content of A300 micropores. A statistical analysis using the linear multiple regression method made it possible to determine the correlation relationships and the significance of the influence of the selected pore ranges (classes) with the A300 parameter. A positive verification of the obtained regression functions would allow the proposal of a simpler, faster A300 calculation method without using either tedious standard calculations or estimating the air-void distributions.
2. Materials and Methods
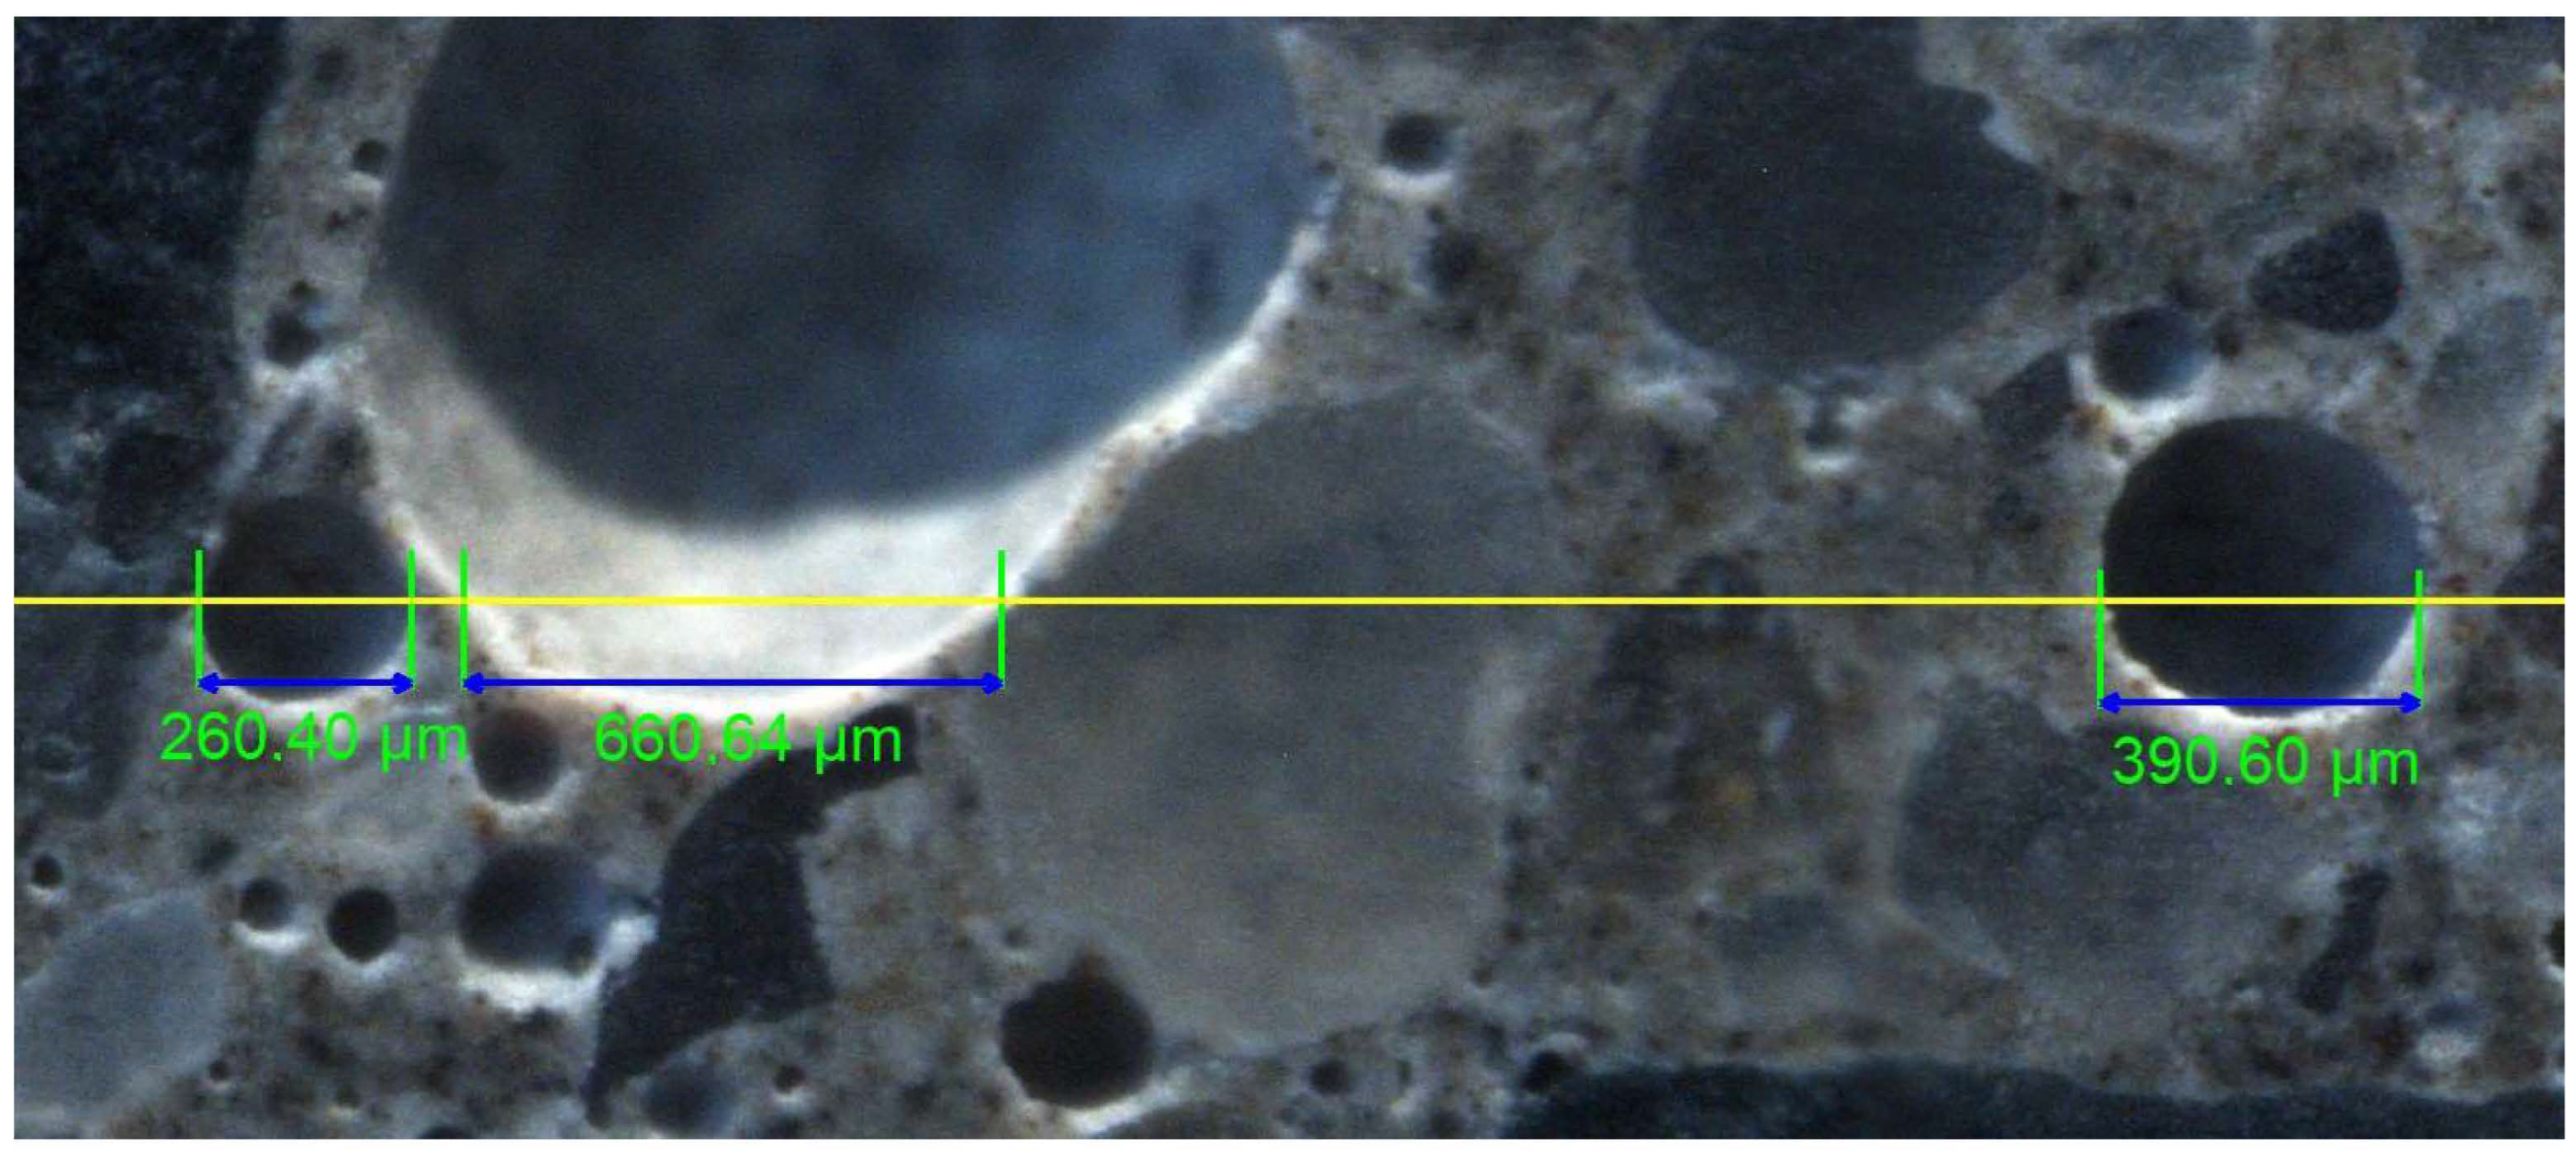
The subject of the analysis is a dataset containing the results of measurements allowing us to characterise the air pore structure in air-entrained concretes. Microscopic examinations were carried out according to the EN-480-11 Standard using the linear traverse method. For each concrete, two 100 × 150 × 40 mm samples were prepared. The test surfaces were ground first with fine corundum powders with thicknesses of #120, #400, #600, and #800. Then, the entire surface was polished. The final surface should have a matte sheen with no visible irregularities between the cement paste and the aggregate. The natural surfaces were examined using a stereoscopic microscope (NIKON SMZ1500) with a mounted camera (NIKON DS-Fi1) and side-lighting to distinguish the air voids (according to the lighting procedure described in ASTM 457). The images were captured while the stage-mounted specimen was moving along the traverse line. A total of 28 frames (1280 × 960 pixels with a resolution of 1.13 μm/px) were merged to form a large colour image, about 80 mm in length. The NIS-Elements software was used to further analyse the output image. On the images of each sample, 15 traverse lines of 1200 mm were drawn, so that the total length of the traverses on the two samples was 2400 mm. Along each traverse, the length of the chords that crossed the air voids was measured manually. The prepared surface with applied traverse line is shown in
Figure 1.
The software records individual chord lengths and allows the exporting of the recorded data to an MS Excel spreadsheet. The output data file is a table containing all the measured chords, the total length of the chords, the total length of the traverse, and the volume of the cement paste (P). All the calculations were performed according to EN 480-11 using a prepared VBA macro in MS Excel software. The result was the essential characteristics of the air-void system: total air content, A, spacing factor, , and air-void specific surface area, α. The EN 480-11 Standard additionally includes a procedure that can be used to determine the air-void distribution in a 3D space. The Standard describes a table to divide chords into 28 length classes (0–4000 μm) and calculate the air content of each class. As a result, the values of the content of micropores, A300, were read directly from the distribution table as the volume attributed to all the air voids with diameters ranging from 0 to 300 μm.
The collected dataset includes parameters determined for 262 concretes, such as air content, A, micropore content, A300, specific surface area, α, and a number of chords, N, (chord length range of 0–4000 μm).
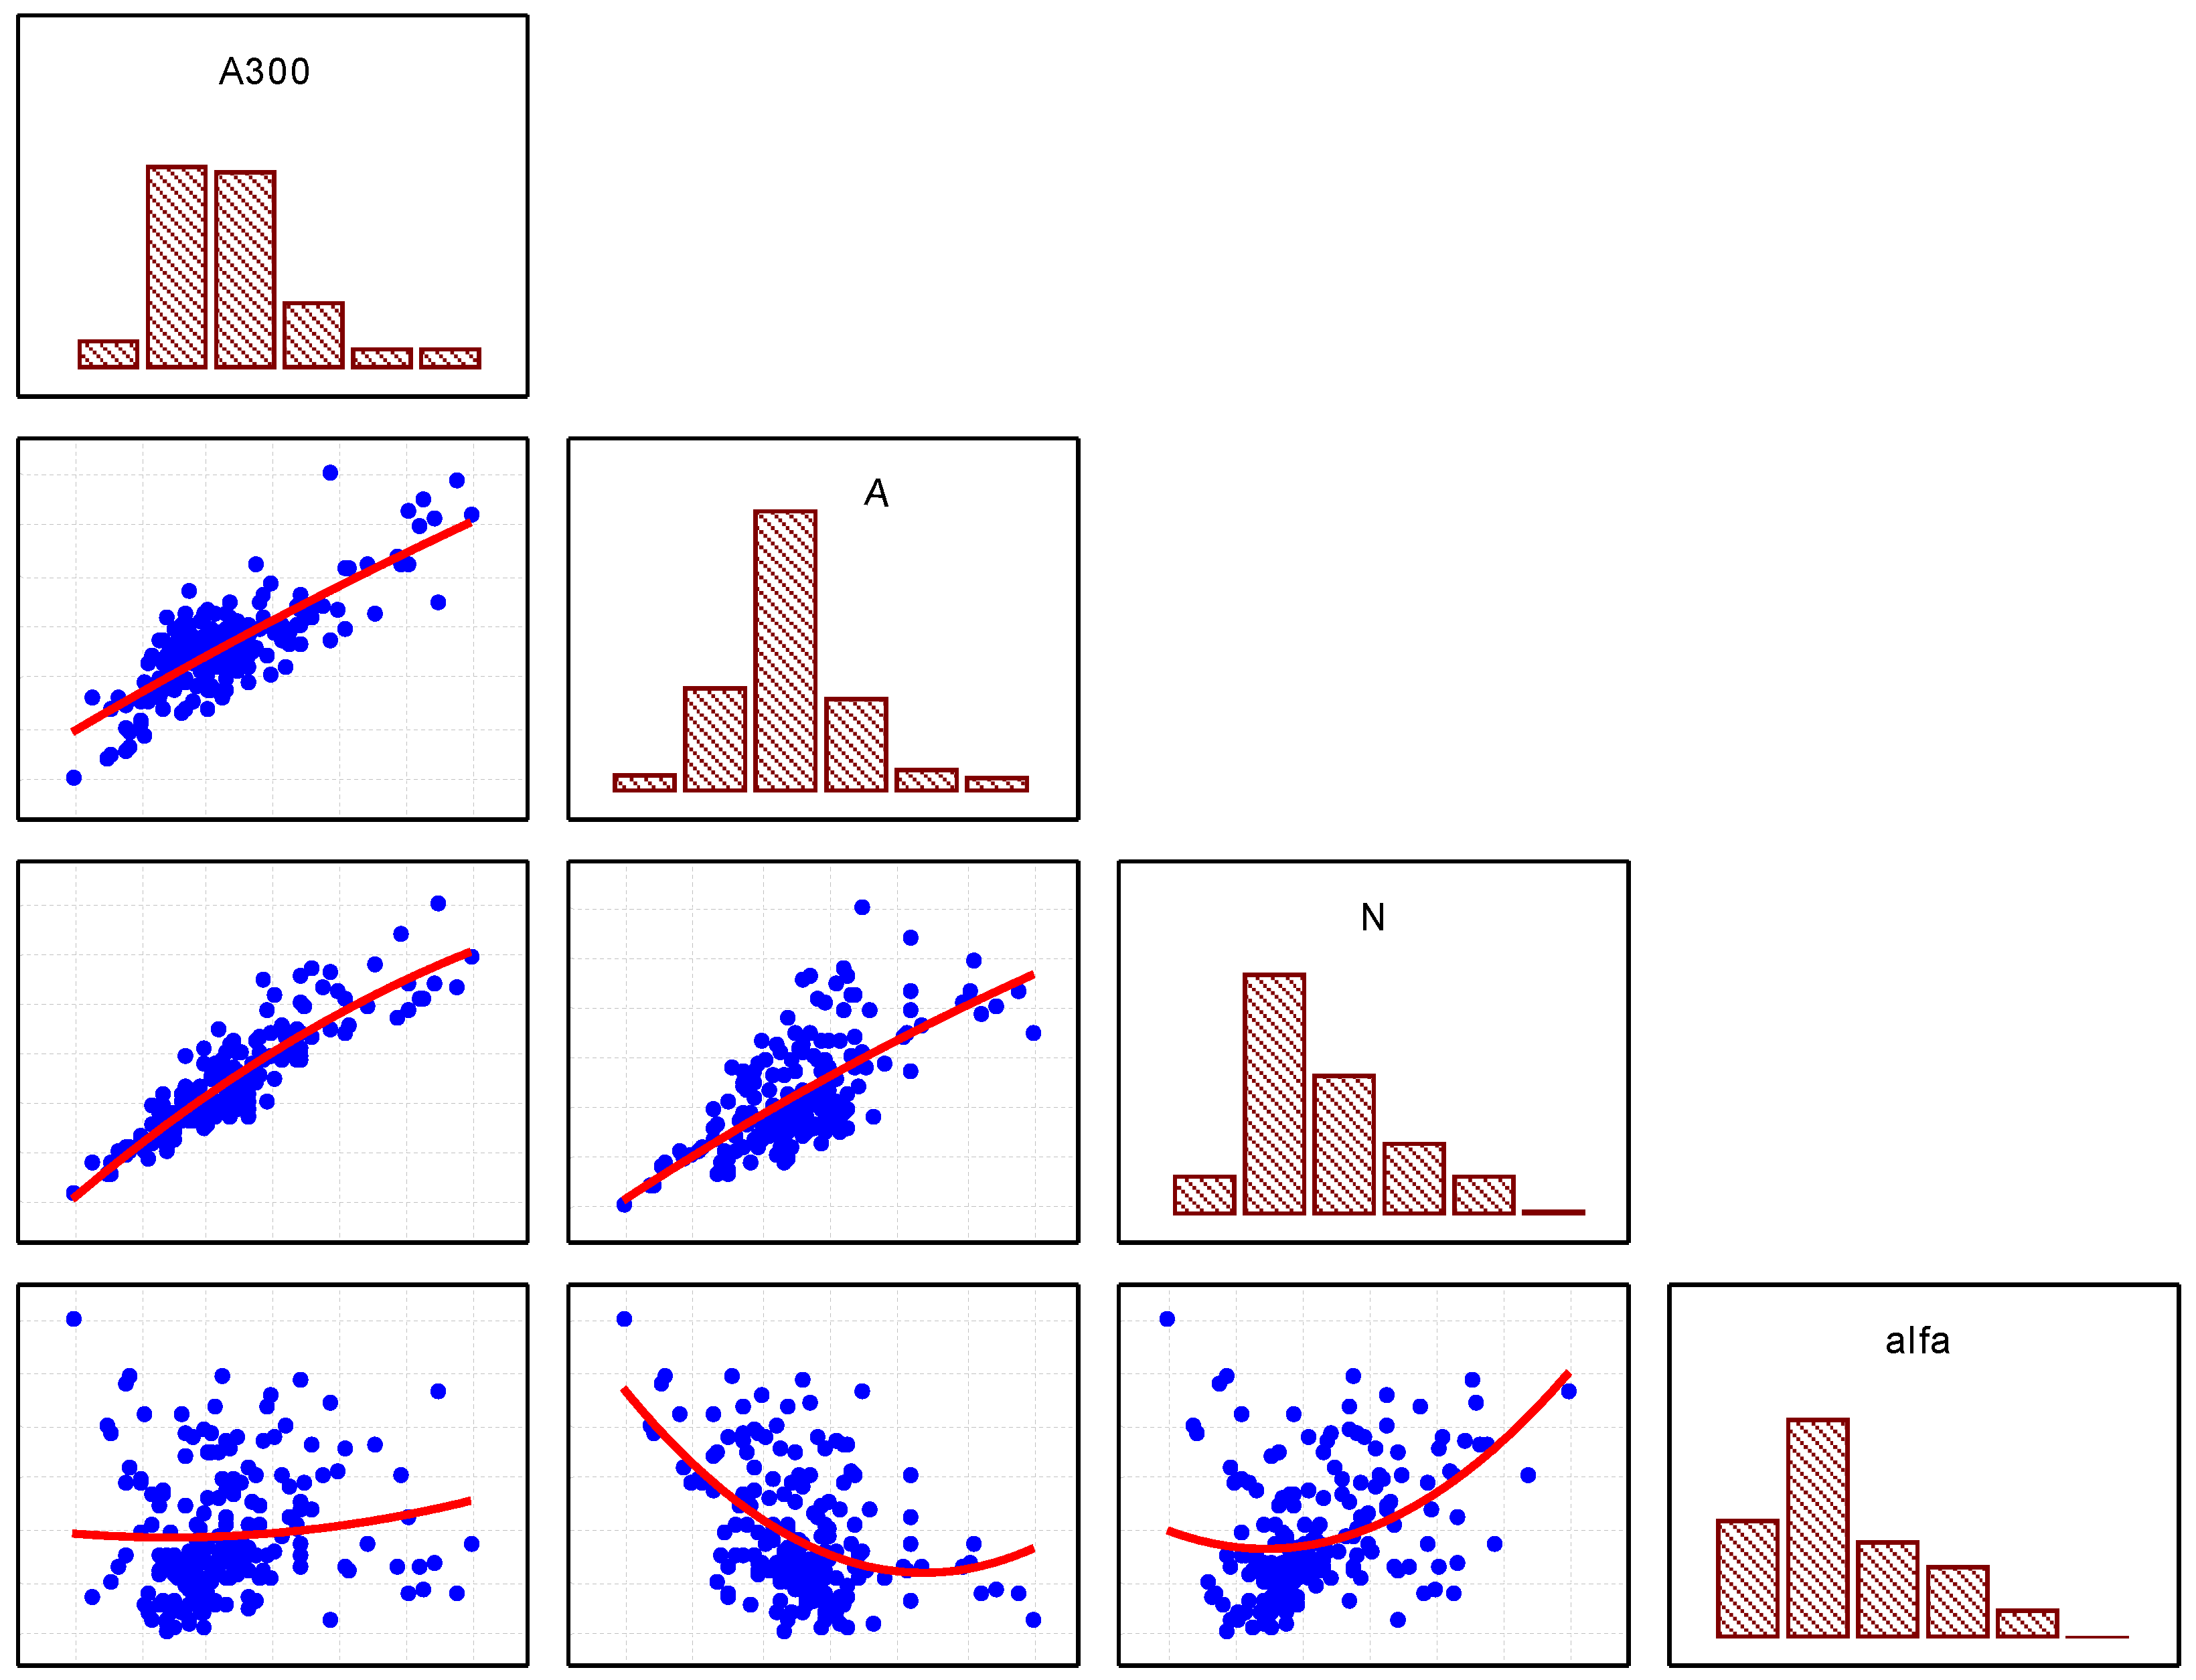
Mathematical analysis of the dataset allows the air pore arrangement to be described using parameters: A, A
300, α, and L. The general characteristics of the set are presented in the form of a matrix diagram (
Figure 2) and in
Table 1.
As the above data indicate, the subject of the analysis is a very large set of concretes characterised by strongly varying air pore structure parameters.
3. Results
The EN-480-11 Standard provides a detailed description of the calculation procedure to determine the pore distribution in a 3D space based on the number and length of chords. On this basis, the A300 micropore content is determined. The calculated value of A300 is only a certain estimate of the actual micropore content of the space.
By observing the pore dimensions on the surface of the polished section, it is found that there is some overrepresentation of larger pores in relation to the actual pore diameter distribution in the 3D space. It is therefore necessary to correct the measured chord lengths to obtain the distribution of the diameters in the space. The starting point for the calculation is the number of chords per class.
Relationship analyses were performed using the classical linear multiple regression method. The basis of the classical regression analysis method is that both the dependent variable and the independent variables are random. The assumption that the random components have a normal distribution allows for statistical inference, i.e., the construction of confidence intervals and the use of statistical tests based on Student’s t-distribution. However, not all independent variables play a significant role in the regression function. The variables for which the regression coefficients are not significantly different from zero should be removed from the model, and a model with fewer explanatory variables should be built. The final linear multiple regression model in which all the regression coefficients are significant will only be obtained in the second or third stage. At each stage, the regression coefficients of a given model are estimated, their statistical significance is checked, and variables with regression coefficients not significantly different from zero are removed. The detection of autocorrelation (testing the hypothesis of the existence of autocorrelation) uses statistical tests such as the von Neumann or Durbin–Watson test.
To obtain a reliable regression function, it is recommended that the number of observations is 10 to 20 times the number of variables in the model. Therefore, a comprehensive dataset was prepared that included information on 262 concretes.
The multiple regression analysis assumed a linear function in the following form:
where:
a0, a1, …, a28—regression coefficients;
c1, c2, …, c28—the number of chords recorded in a given class;
Y—dependent variable (A300 micropore content);
Ttot—the length of the measuring line (total for 2 samples).
The length of the measuring line, T
tot, (
Table 1) ranged from 2438 mm to 2643 mm (mean 2522 mm), which significantly affected the number of chords recorded. Therefore, it was necessary to introduce a conversion factor in the equation, bringing the line length to 2500 mm.
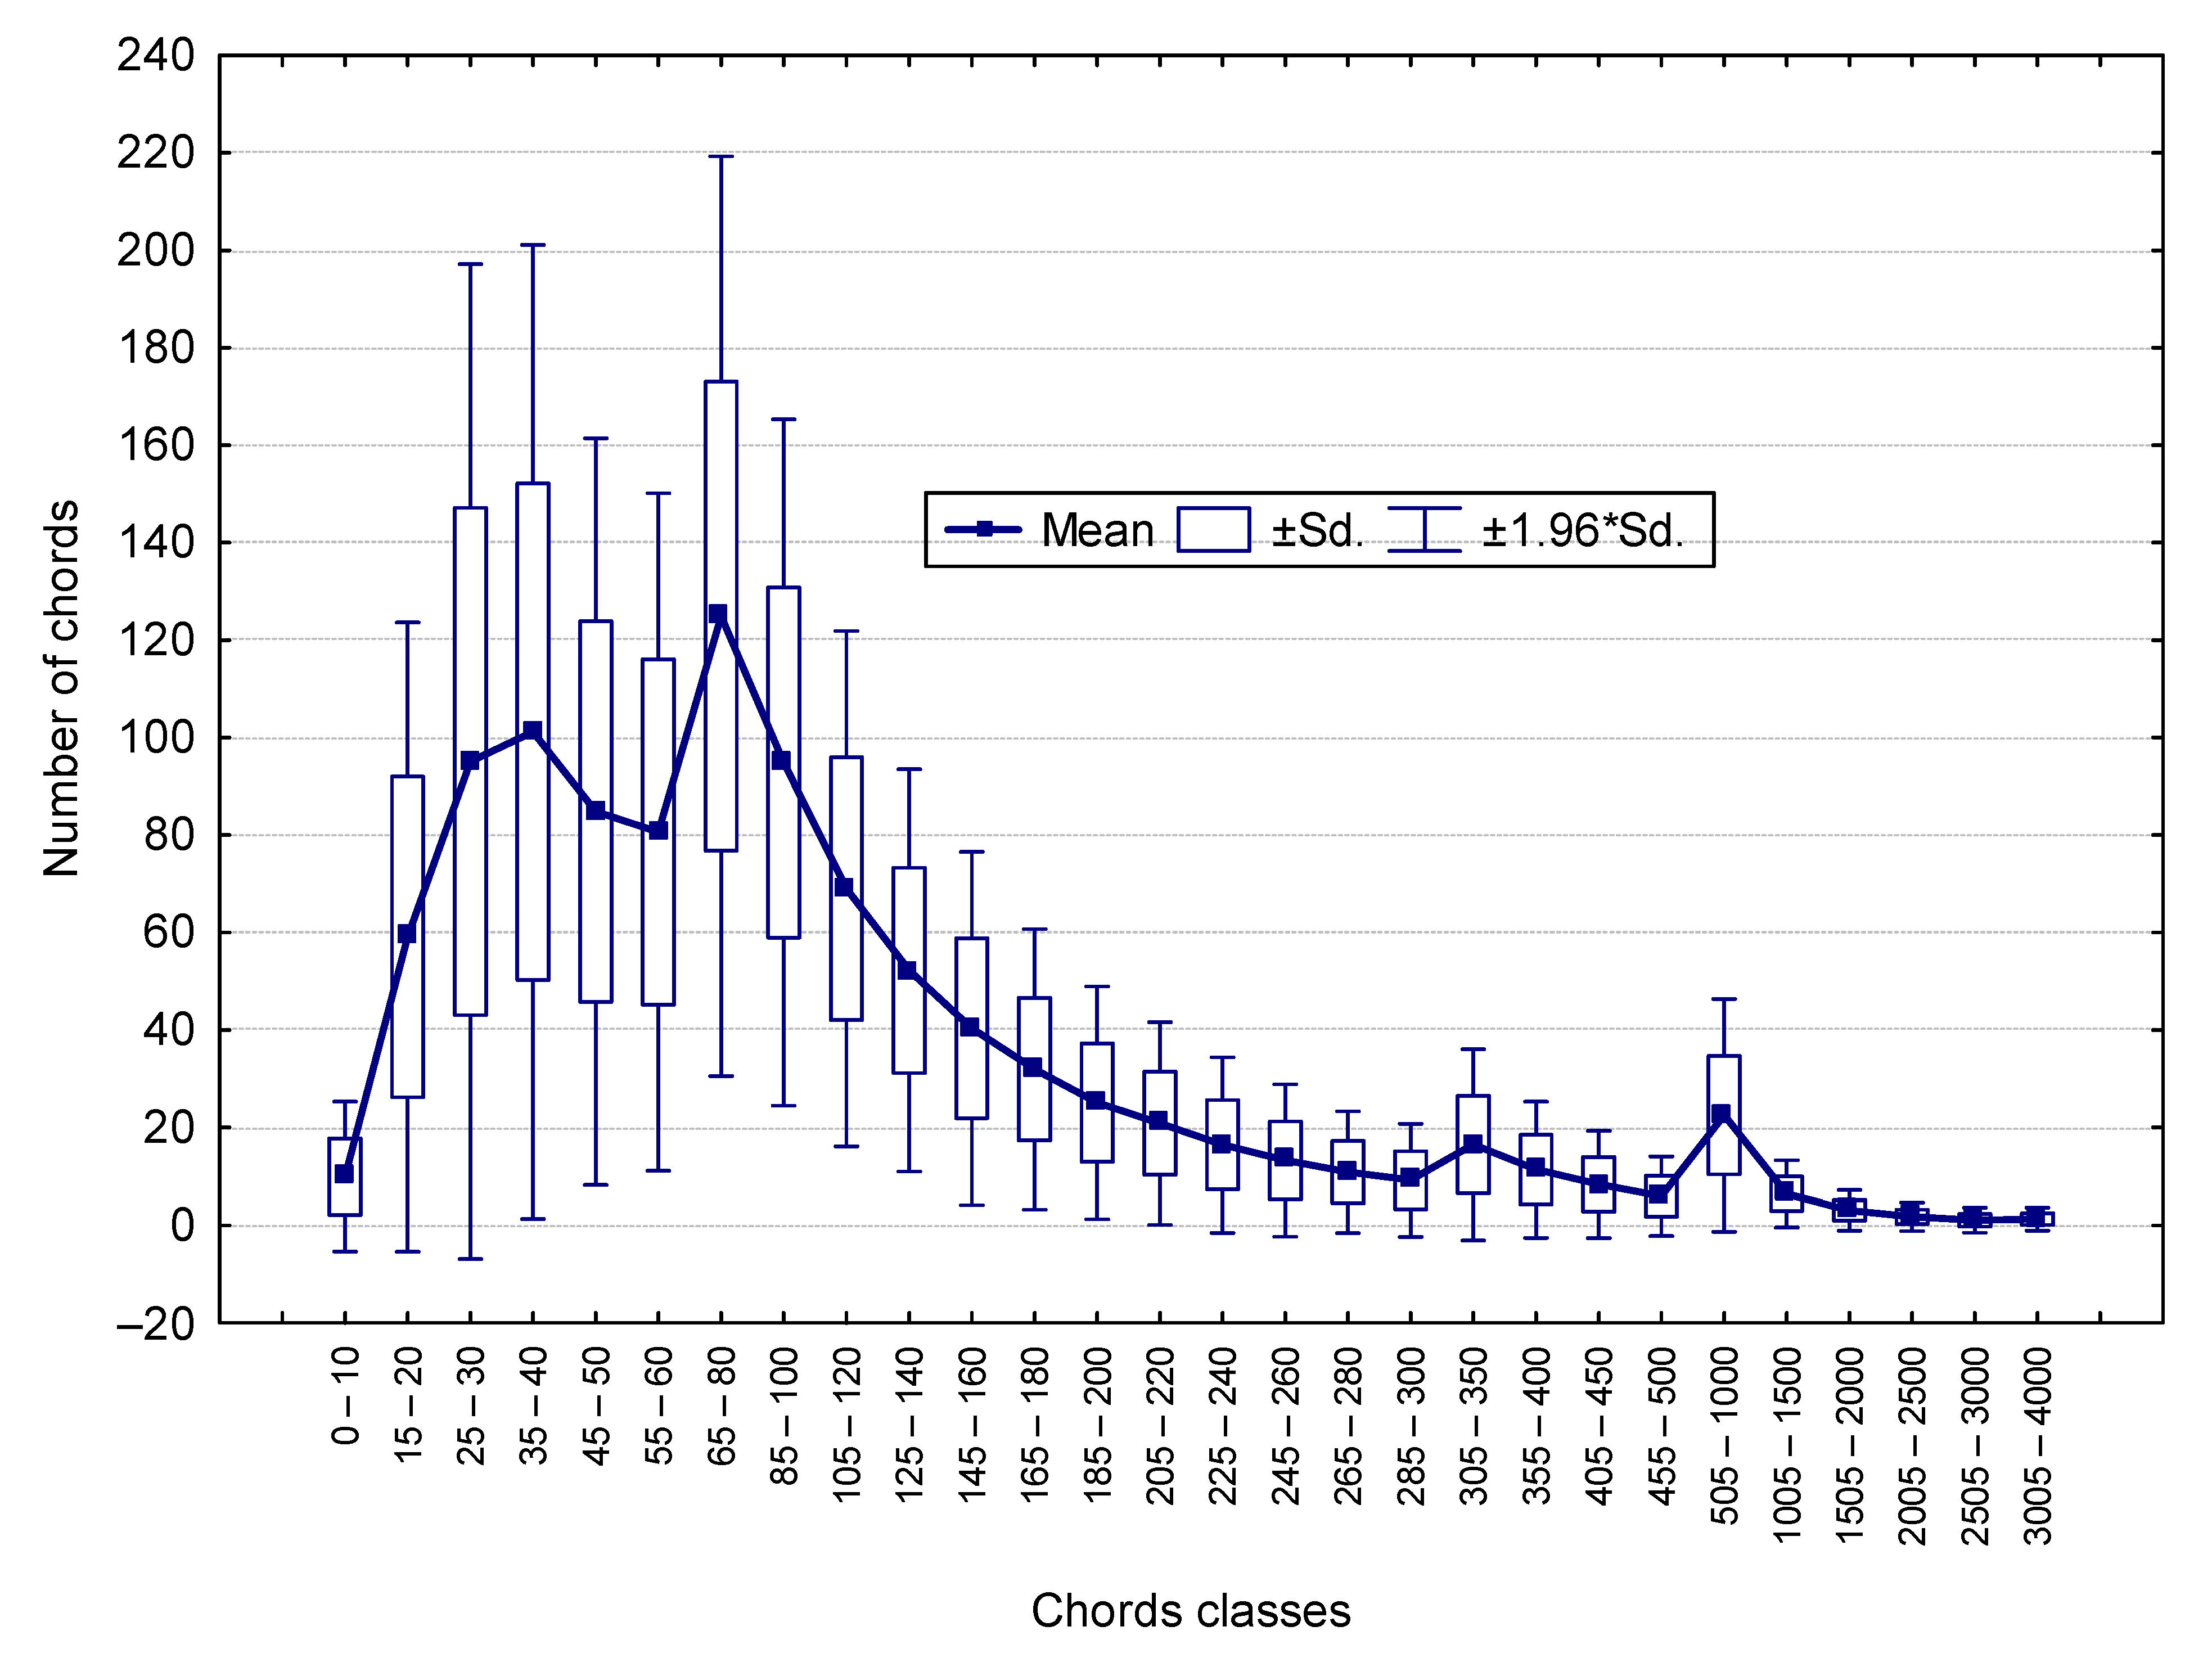
As can be seen in
Figure 3, the distribution of the number of chords in each class varies greatly. The largest number of chords is in the range of up to 200 μm. The larger the dimensions, the smaller the number of chords.
The purpose of the study was to determine the relationship between the number of chords in each class and the micropore content with a diameter of less than 300 μm (A300). The analysis was carried out in three stages, eliminating variables (chord classes) with a non-significant impact on A300 and grouping the others into classes with larger dimension ranges. This led to the development of a linear function with only eight regression coefficients. A number of analyses were carried out to verify the goodness of fit of the function with the measurement data, verifying the possible autocorrelation of the independent variables and the normality of the distribution of the residuals as key conditions for the quality of the relationship obtained. All the statistical calculations were performed using Statistica software.
Stage 1: Analysis of the dataset including all 28 chord classes
The dataset for the calculations is shown schematically in
Table 2.
The multiple regression analysis yielded the following results:
R = 0.99999, R2 = 0.9999, Adj.R2 = 0.9999;
df = 28,233, F = 441694E3, p = 0.0000;
Standard error of estimation: 0.00013, Std. error: 0.000037;
t(233) = −2.233, p = 0.0265;
R—multiple correlation coefficient;
R2—coefficient of determination;
Adj.R2—corrected goodness of fit;
Df—degrees of freedom;
p—significance value.
Stage 2: Analysis of 18 chord classes
In this stage of the study, linear regression function calculations were performed considering only 18 chord classes in the range of 15–350 μm. The following multiple regression results were obtained:
R = 0.9999, R2 = 0.9999, Adj. R2 = 0.9999;
df = 18,243, F = 690648E3, p = 0.0000 Standard error of estimation: 0.00013;
Std. error: 0.0000318, t(243) = −2.732 p = 0.0068.
BETA regression coefficients in
Table 3 refer to the regression function calculated for standardised input variables and B for raw (non-standardised) variables. The values of the Beta coefficients allow a comparison of the relative contribution that each of the independent variables makes to the prediction of the dependent variable. Based on the table of coefficients of the regression function for the 28 pore classes, it was found that only the coefficients corresponding to the chord classes of 15–350 μm have a significant impact on the outcome variable of A
300. Small pores with chords of 0–10 μm have a small volume and number, which has little effect on the volume gain of the A
300 micropores. The pores with larger dimensions, corresponding to chord lengths greater than 350 μm, do not have a significant impact on the A
300 value. According to the stereology assumptions, larger pores can also generate chords in smaller classes, but the number of such pores is too small to affect the A
300. The results obtained provide the basis for reducing the number of necessary chord classes from 28 to 19, and thus the number of corresponding coefficients in the regression (Equation (1)).
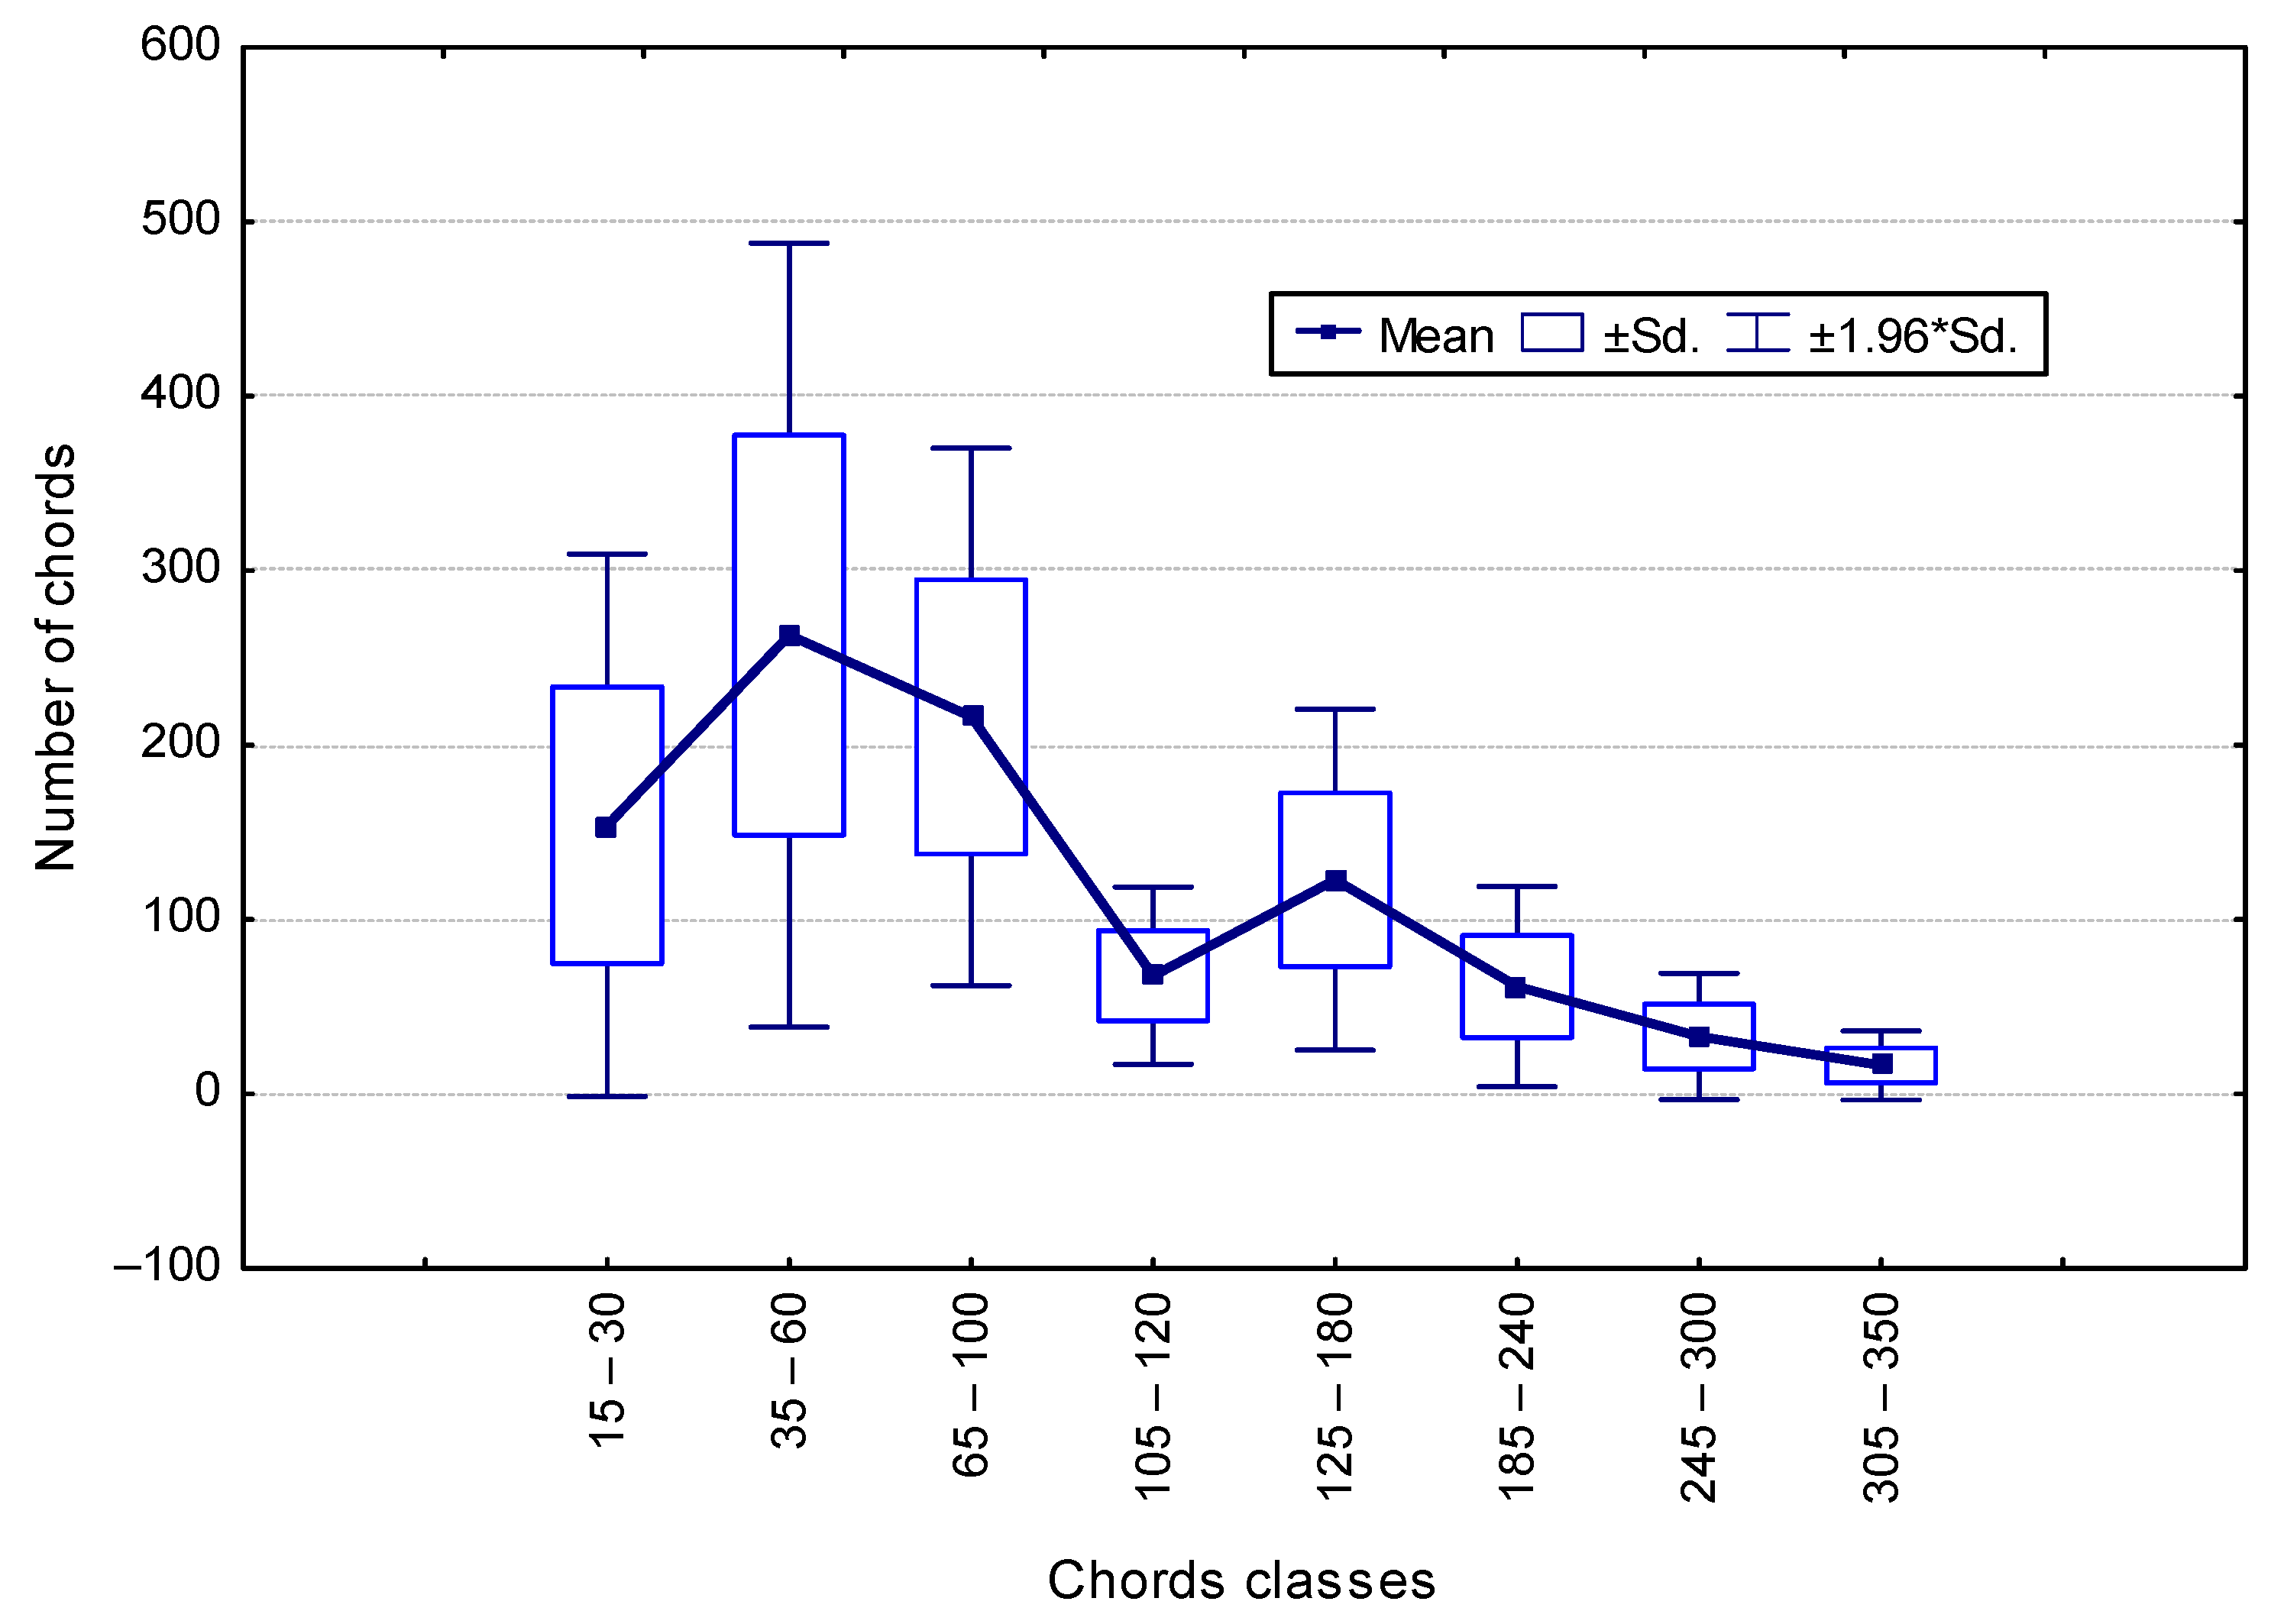
The comparison of the Beta coefficients shows that, for some classes, the values are similar. This was the basis for merging the classes, resulting in a smaller number of them with a larger scope. Only eight classes were separated, for which the results of the calculations are given below.
Figure 4 shows a graph of the chord distribution for the eight classes.
Stage 3: Analysis of eight chord classes
Again, linear regression function calculations were performed, considering only the eight chord classes in the range of 15–350 μm. The following multiple regression results were obtained:
R = 0.9999, R2 = 0.99982, Adj. R2 = 0.99981;
F(8253) = 1714E2, p < 0.0000 Std. estimation error: 0.0125;
Std. error: 0.0028621 t(253) = −0.952 p = 0.3422.
The calculations show that all the regression coefficients are statistically significant (except for the absolute term) as shown in
Table 4. It is interesting to note that the BETA coefficient for class no. 8 (305–350 μm), as in the previous calculation steps, has a negative value. It is clear that these chords are too large to be included in the A
300. The more large pores, the greater the number of chords associated with these pores in the smaller classes. This fact must be taken into account to not overestimate the value of the A
300.
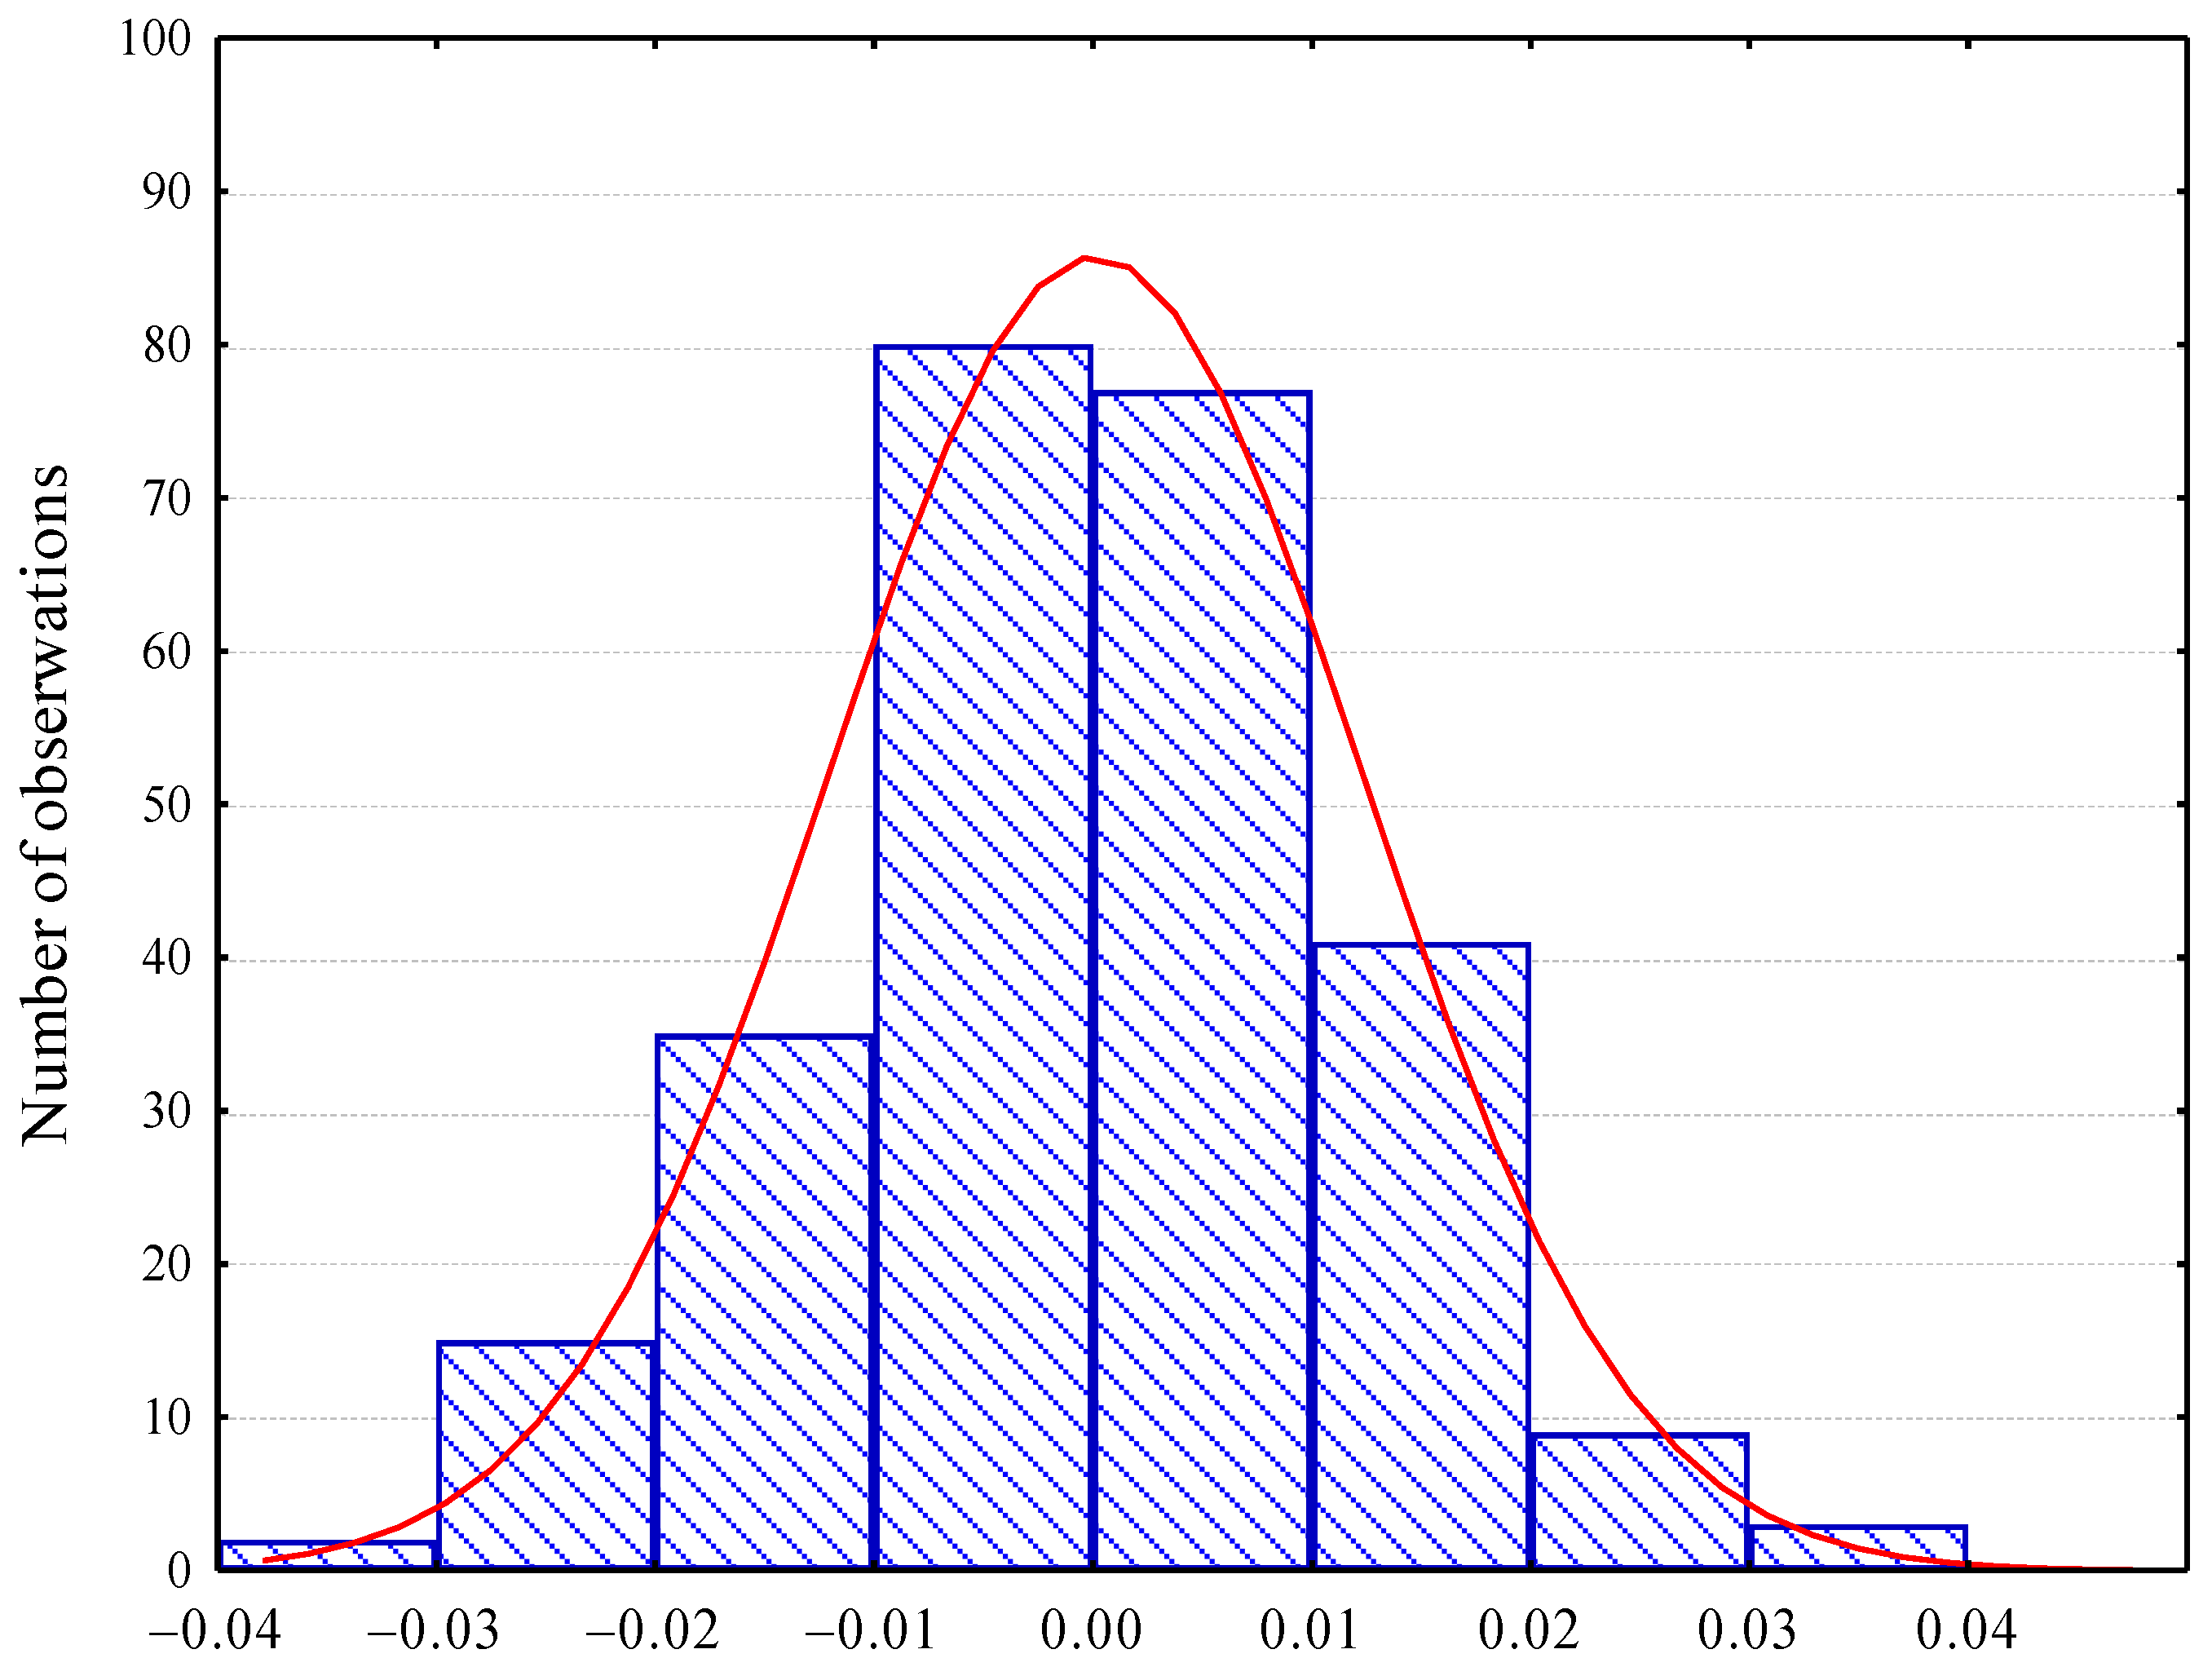
Figure 5 shows a comparison of the distribution of the residuals.
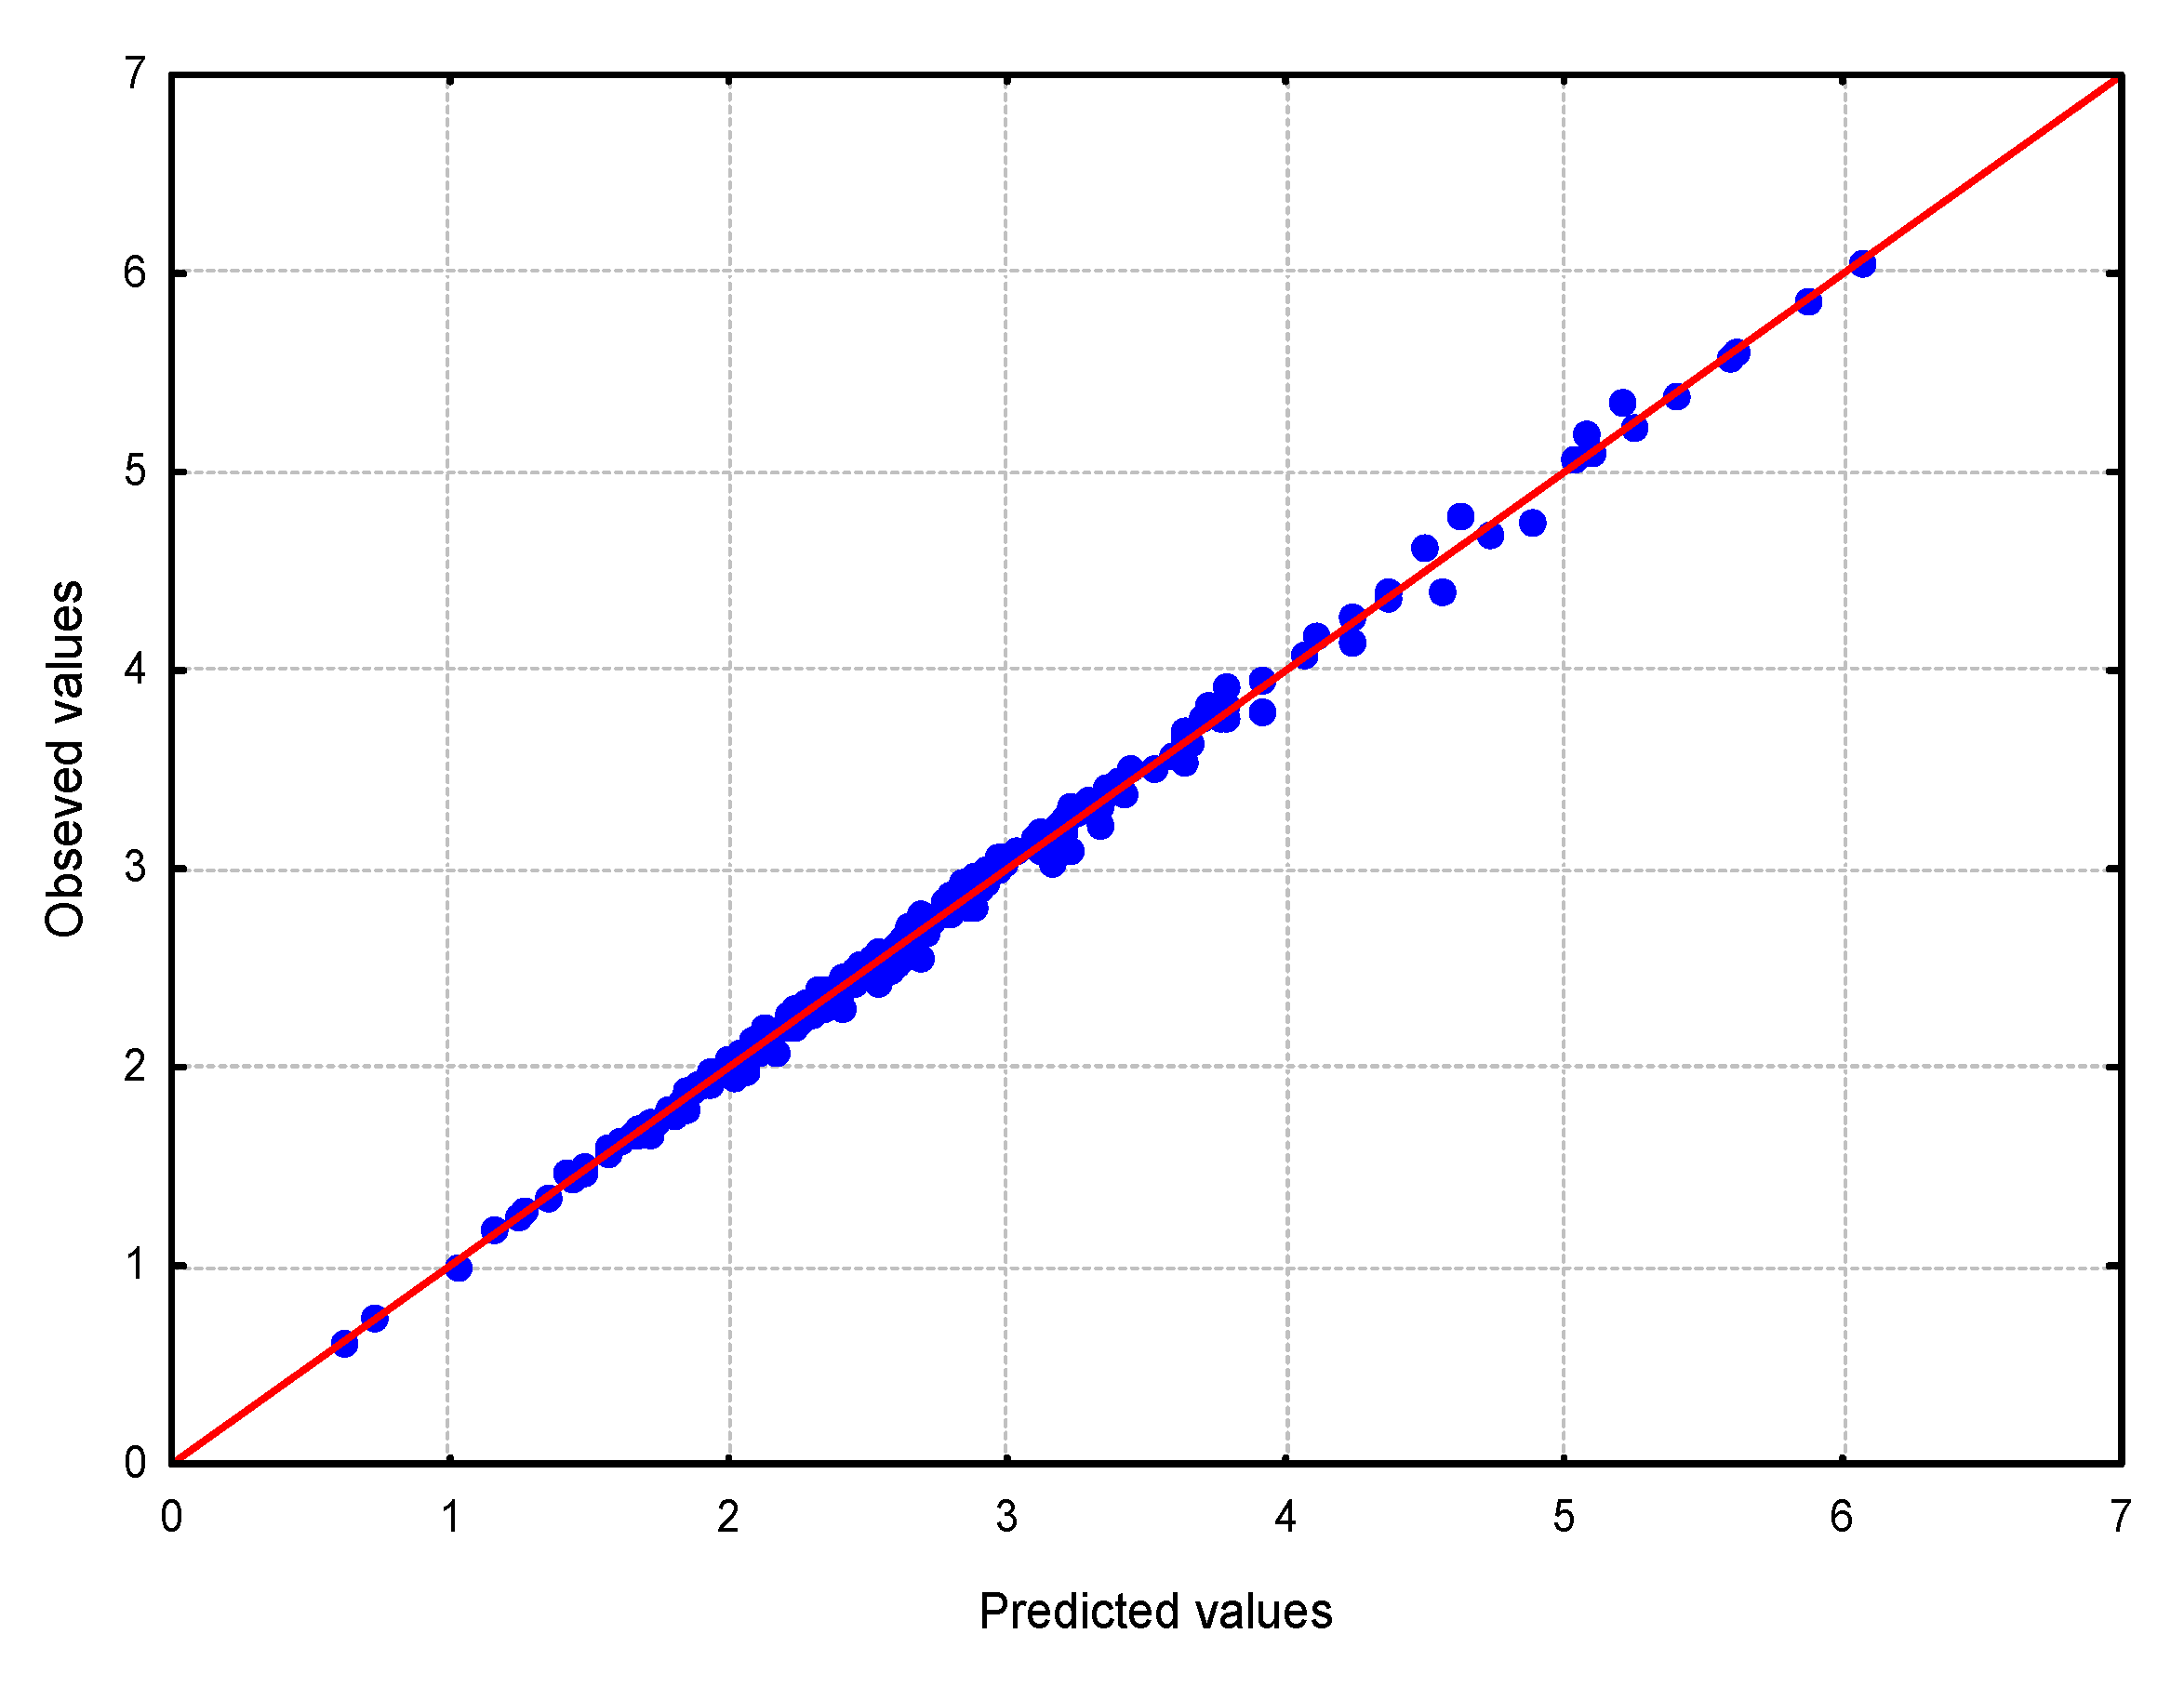
The comparison between the observed values and those calculated from the regression function is shown in
Figure 6. This is confirmed by the very good agreement of the calculation results with the empirical data.
The results of the analysis carried out indicate that the eight independent variables adopted allow for precisely predicting the pore content with diameters below 300 μm (R2 ≈ 1.0). The estimated model meets the assumptions of the least squares method. The analysis of the residuals of the analysed model confirms its validity. The value of the Durbin–Watson test statistic (DW = 1.912) allows us to conclude that there is no autocorrelation of the residuals in the resulting model.
Finally, the linear regression function for the eight separated chord length classes is shown in
Table 5.
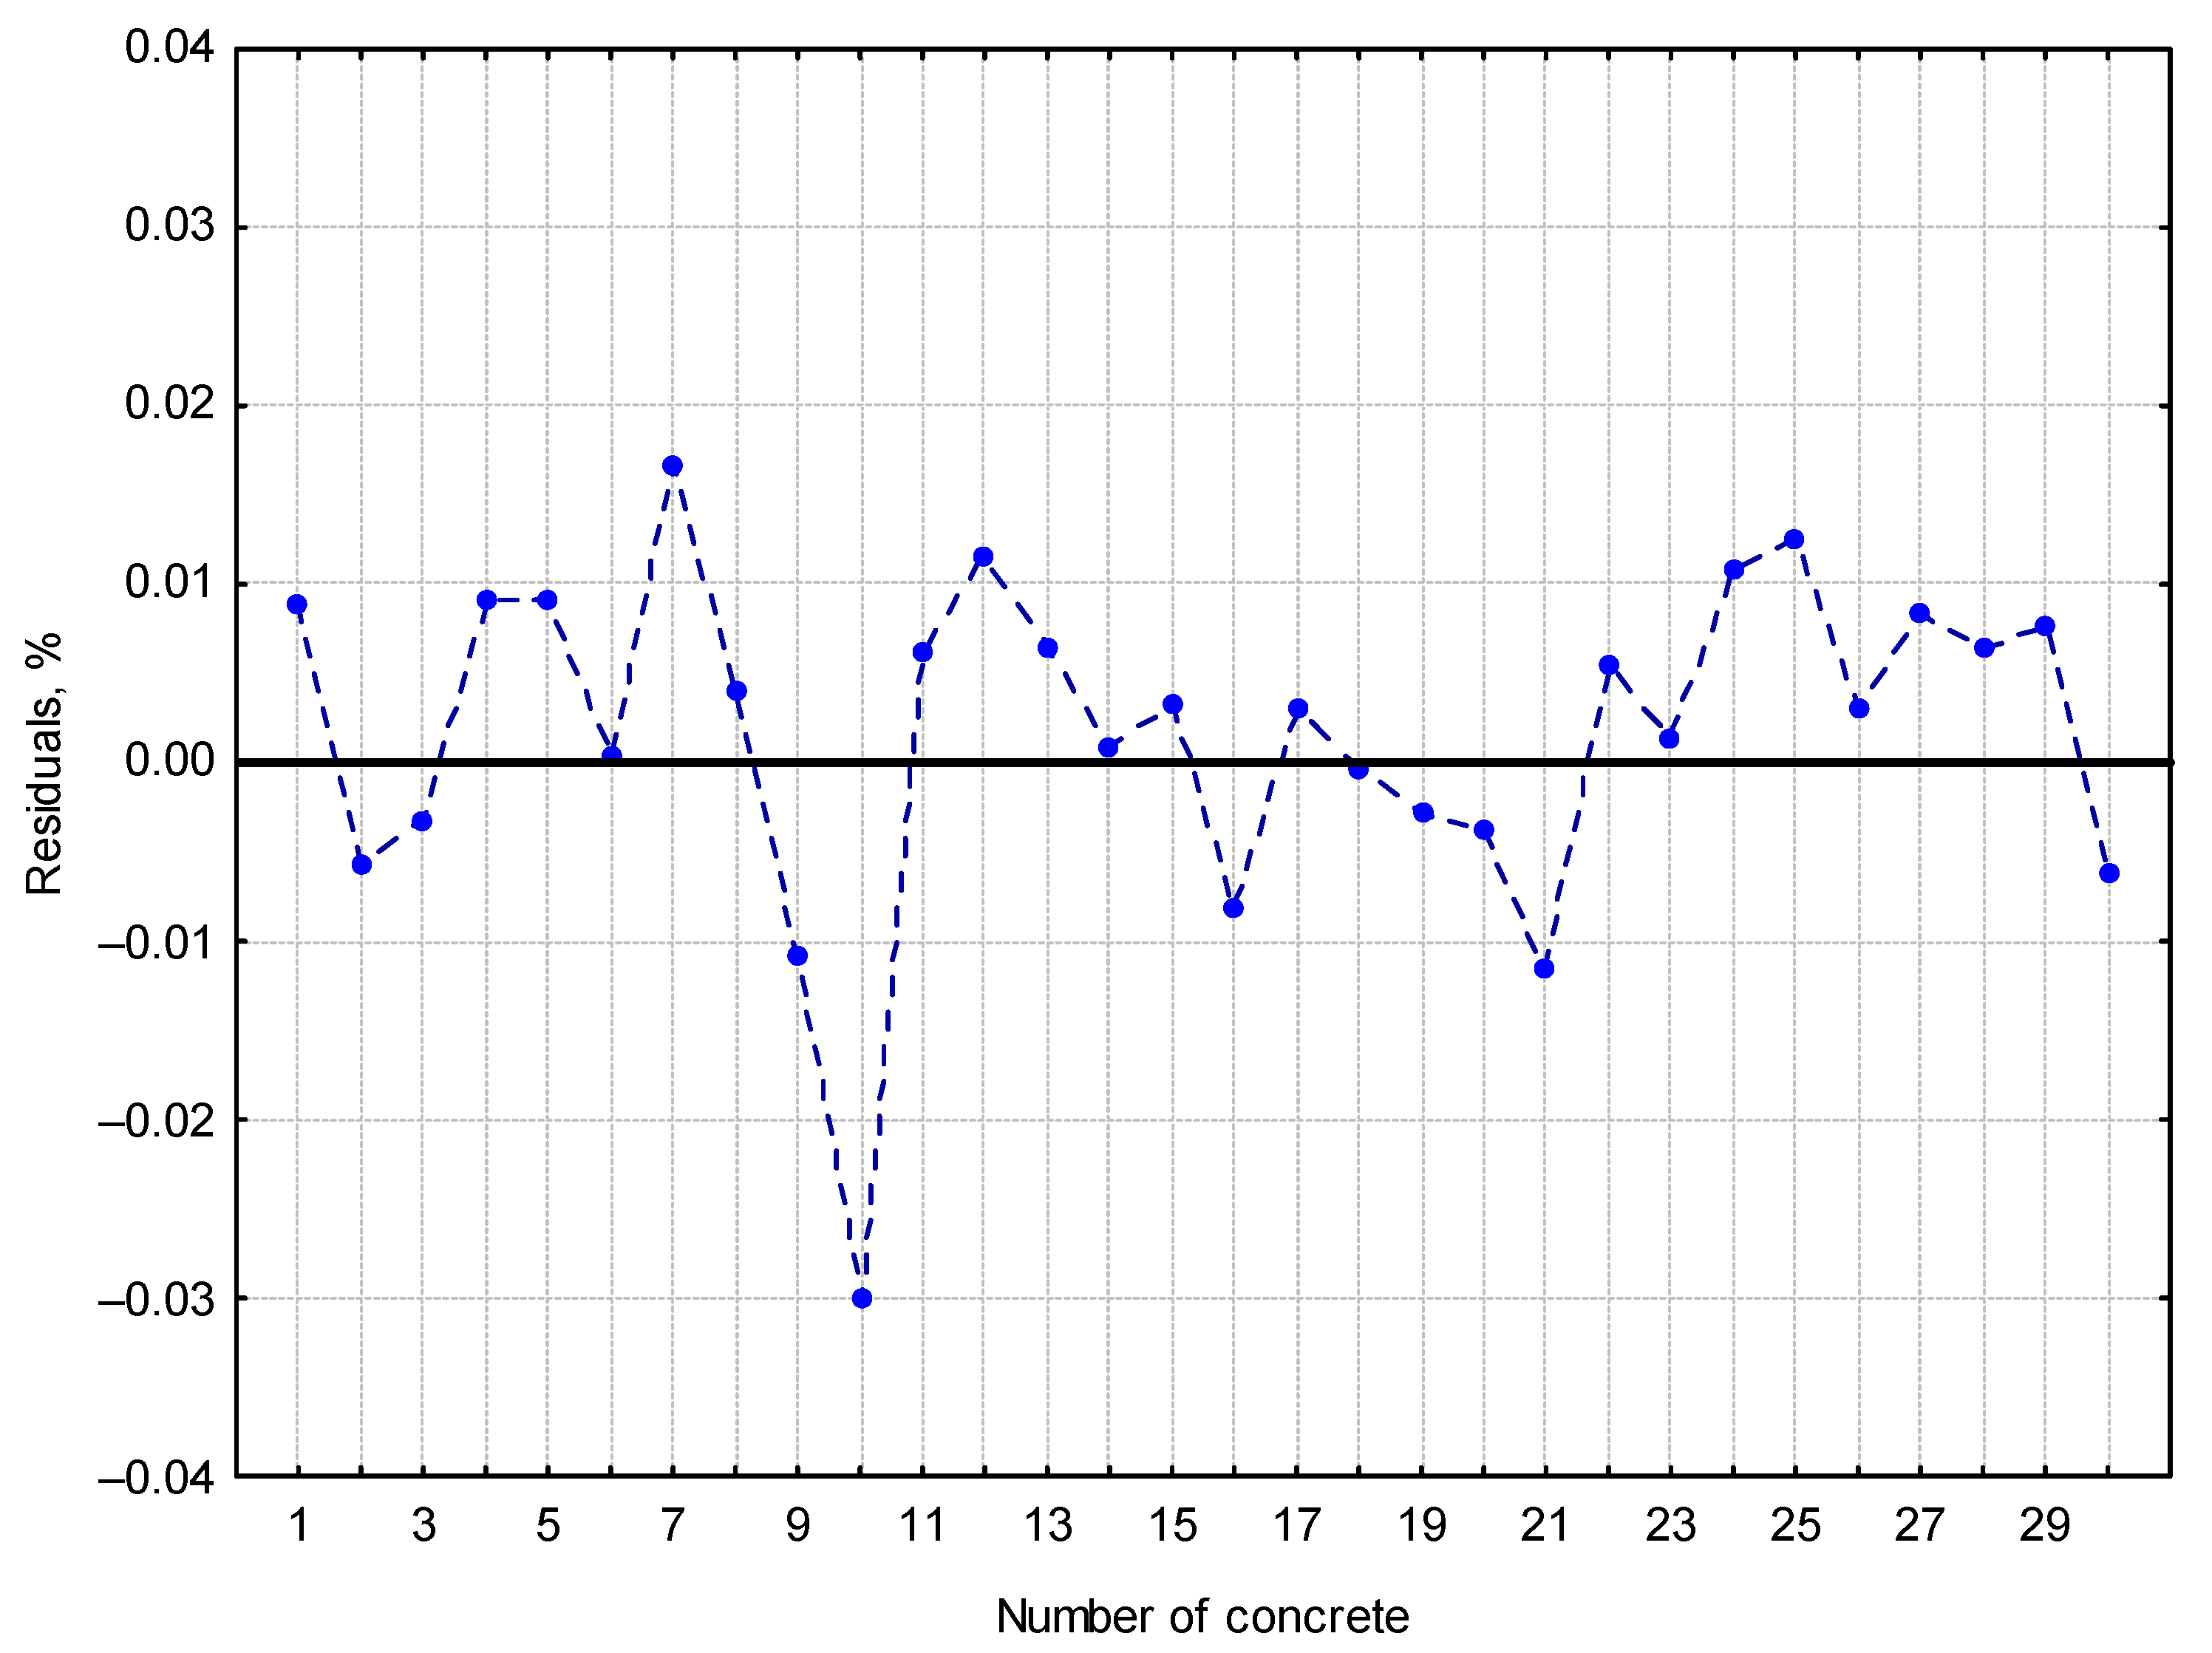
In addition, an attempt was made to verify the function obtained for the data from 30 concretes that were not taken for the above calculations. The maximum difference between the calculation results and the data calculated according to EN-480-11 was 0.03%, as shown in
Figure 7.


