

Correlation between Orientation Spread and Ear Forming of As-Annealed AA5151 Aluminum Alloy

Abstract
:
1. Introduction
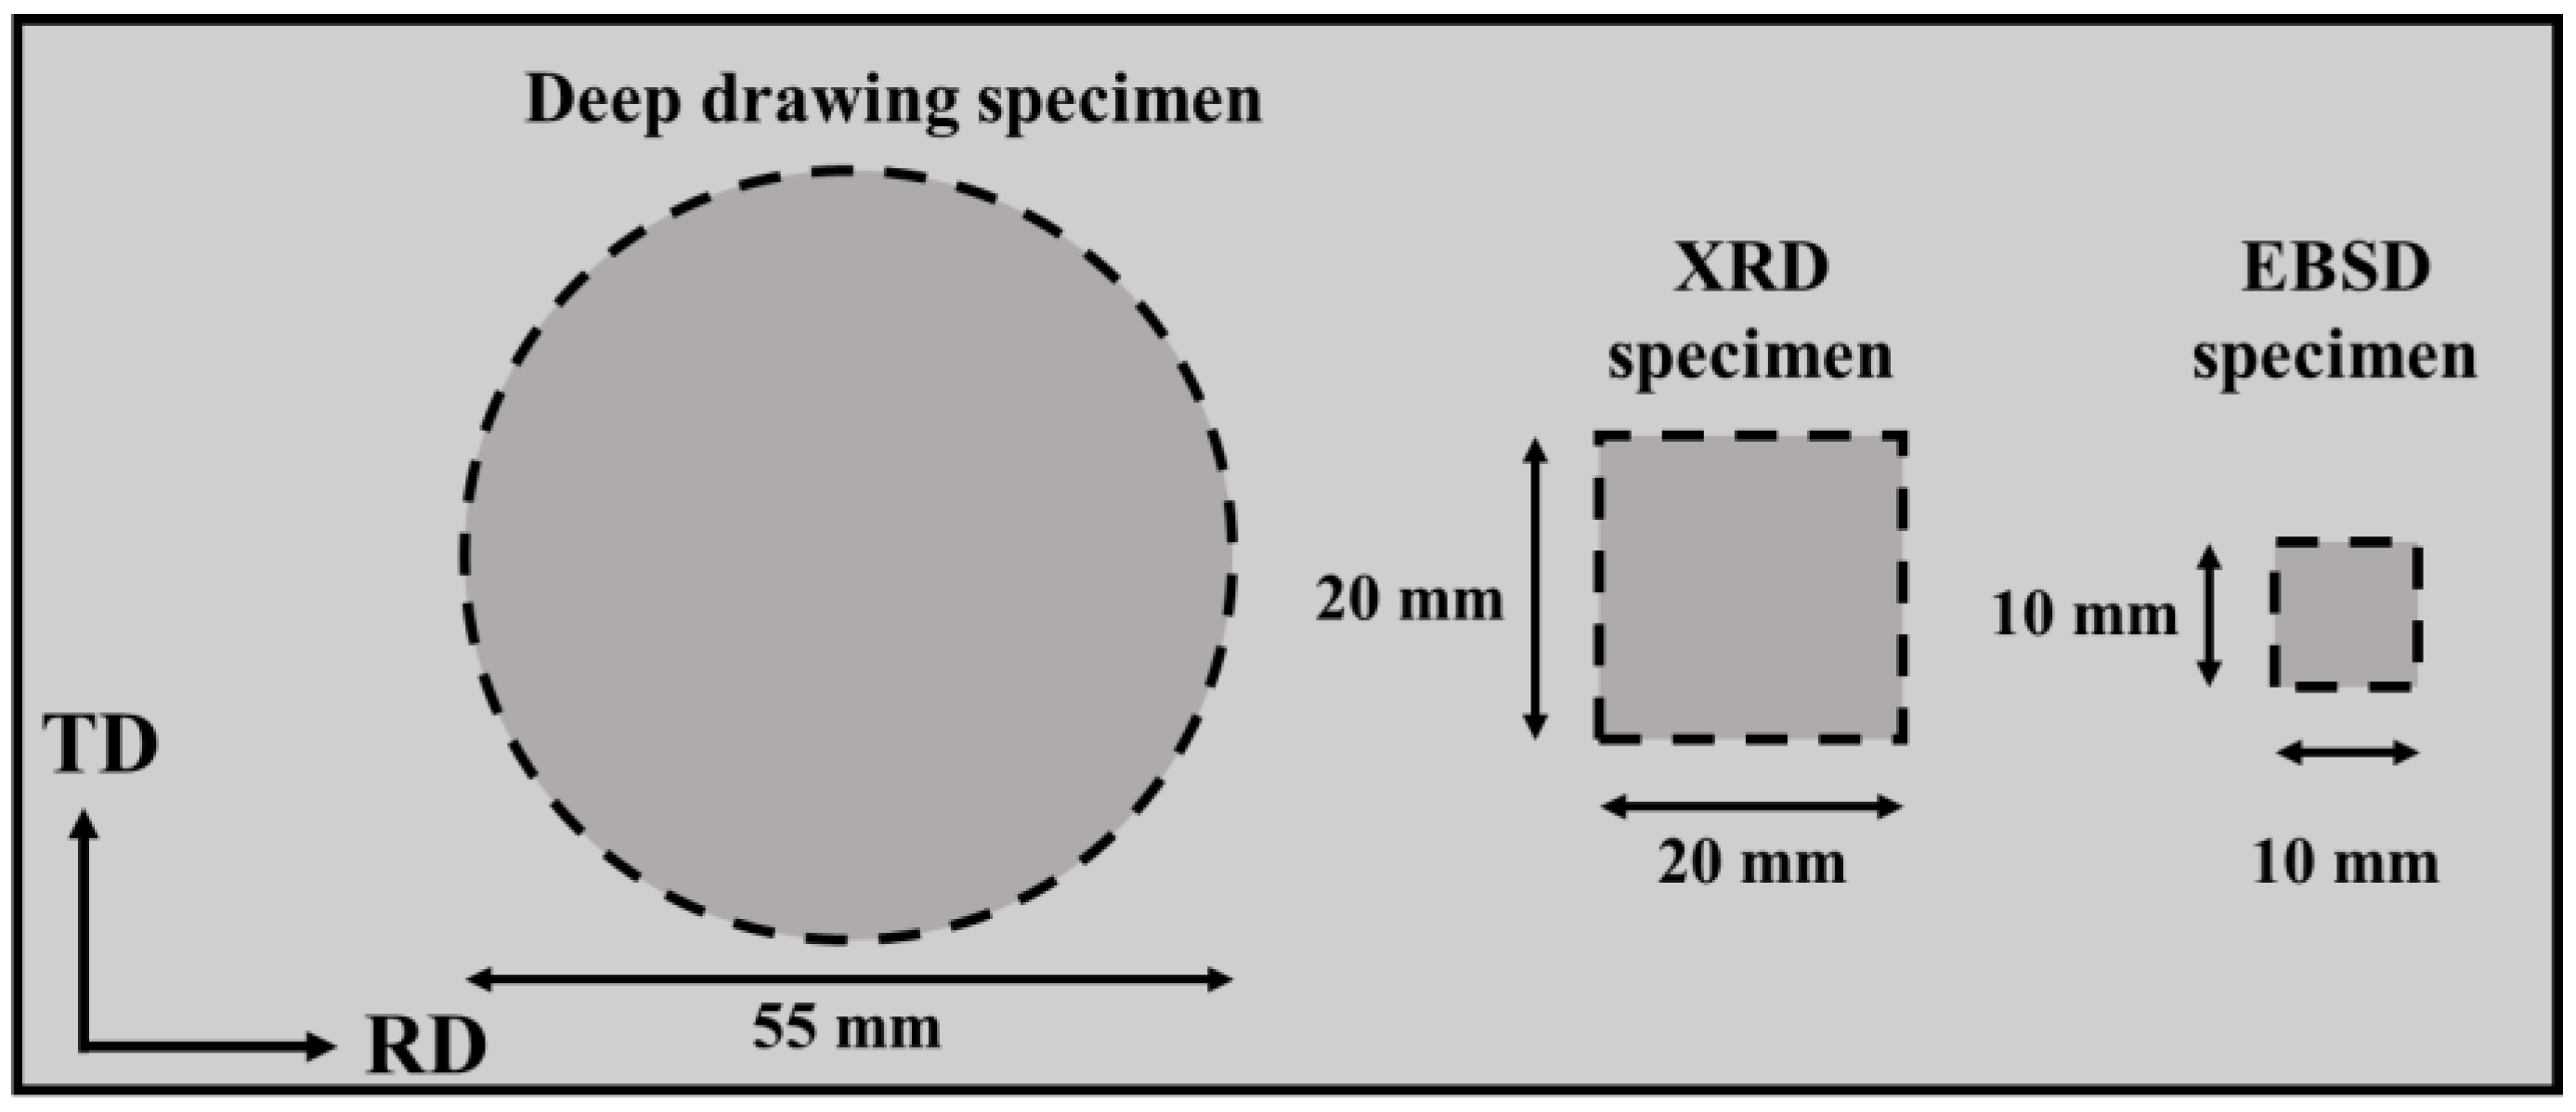
2. Experiments
3. Estimation Method of the Cup Height
4. Results and Discussion
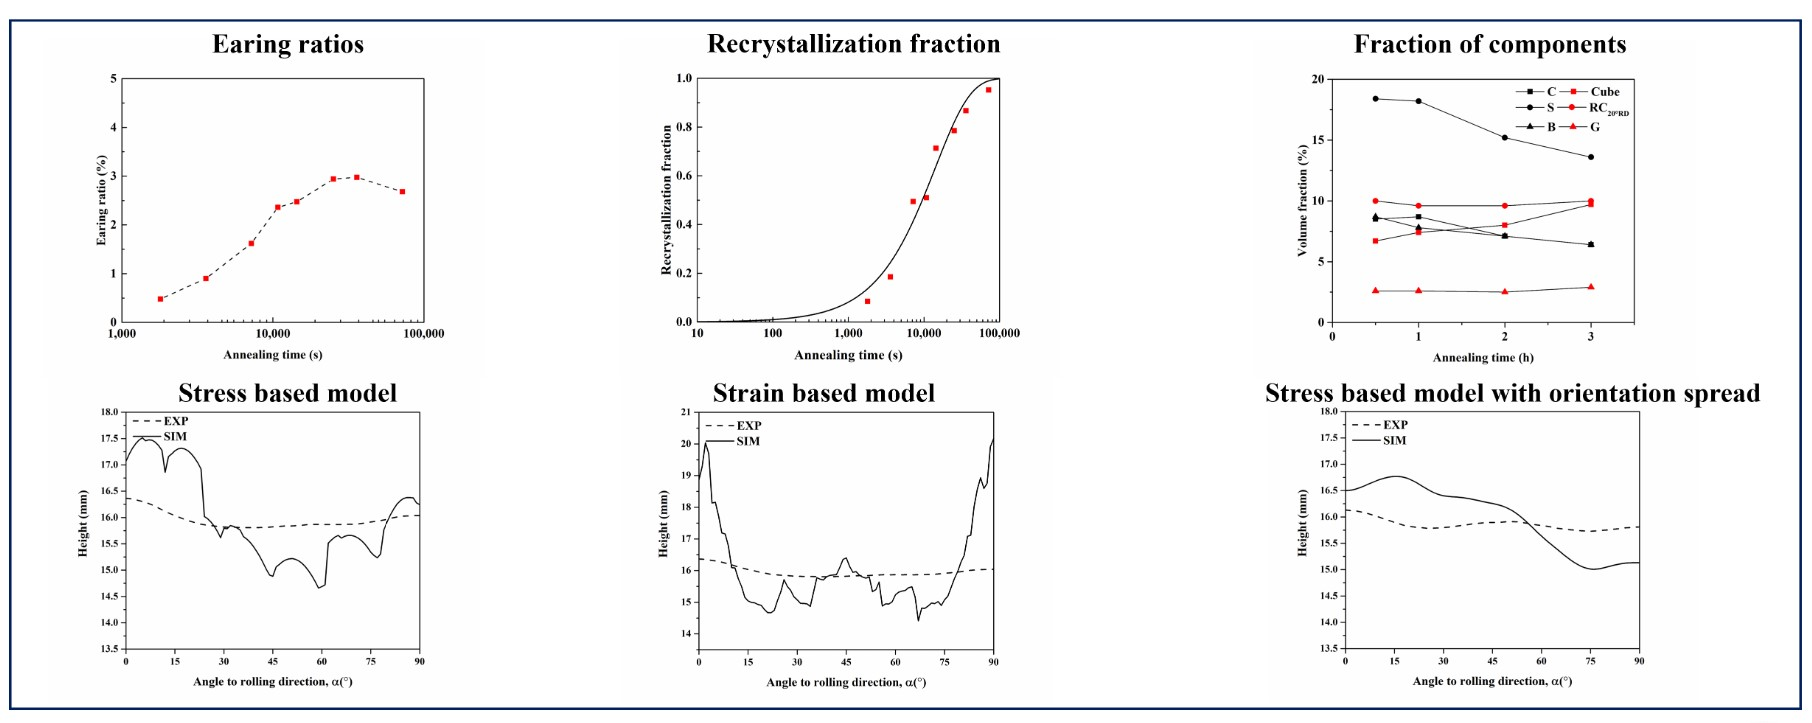
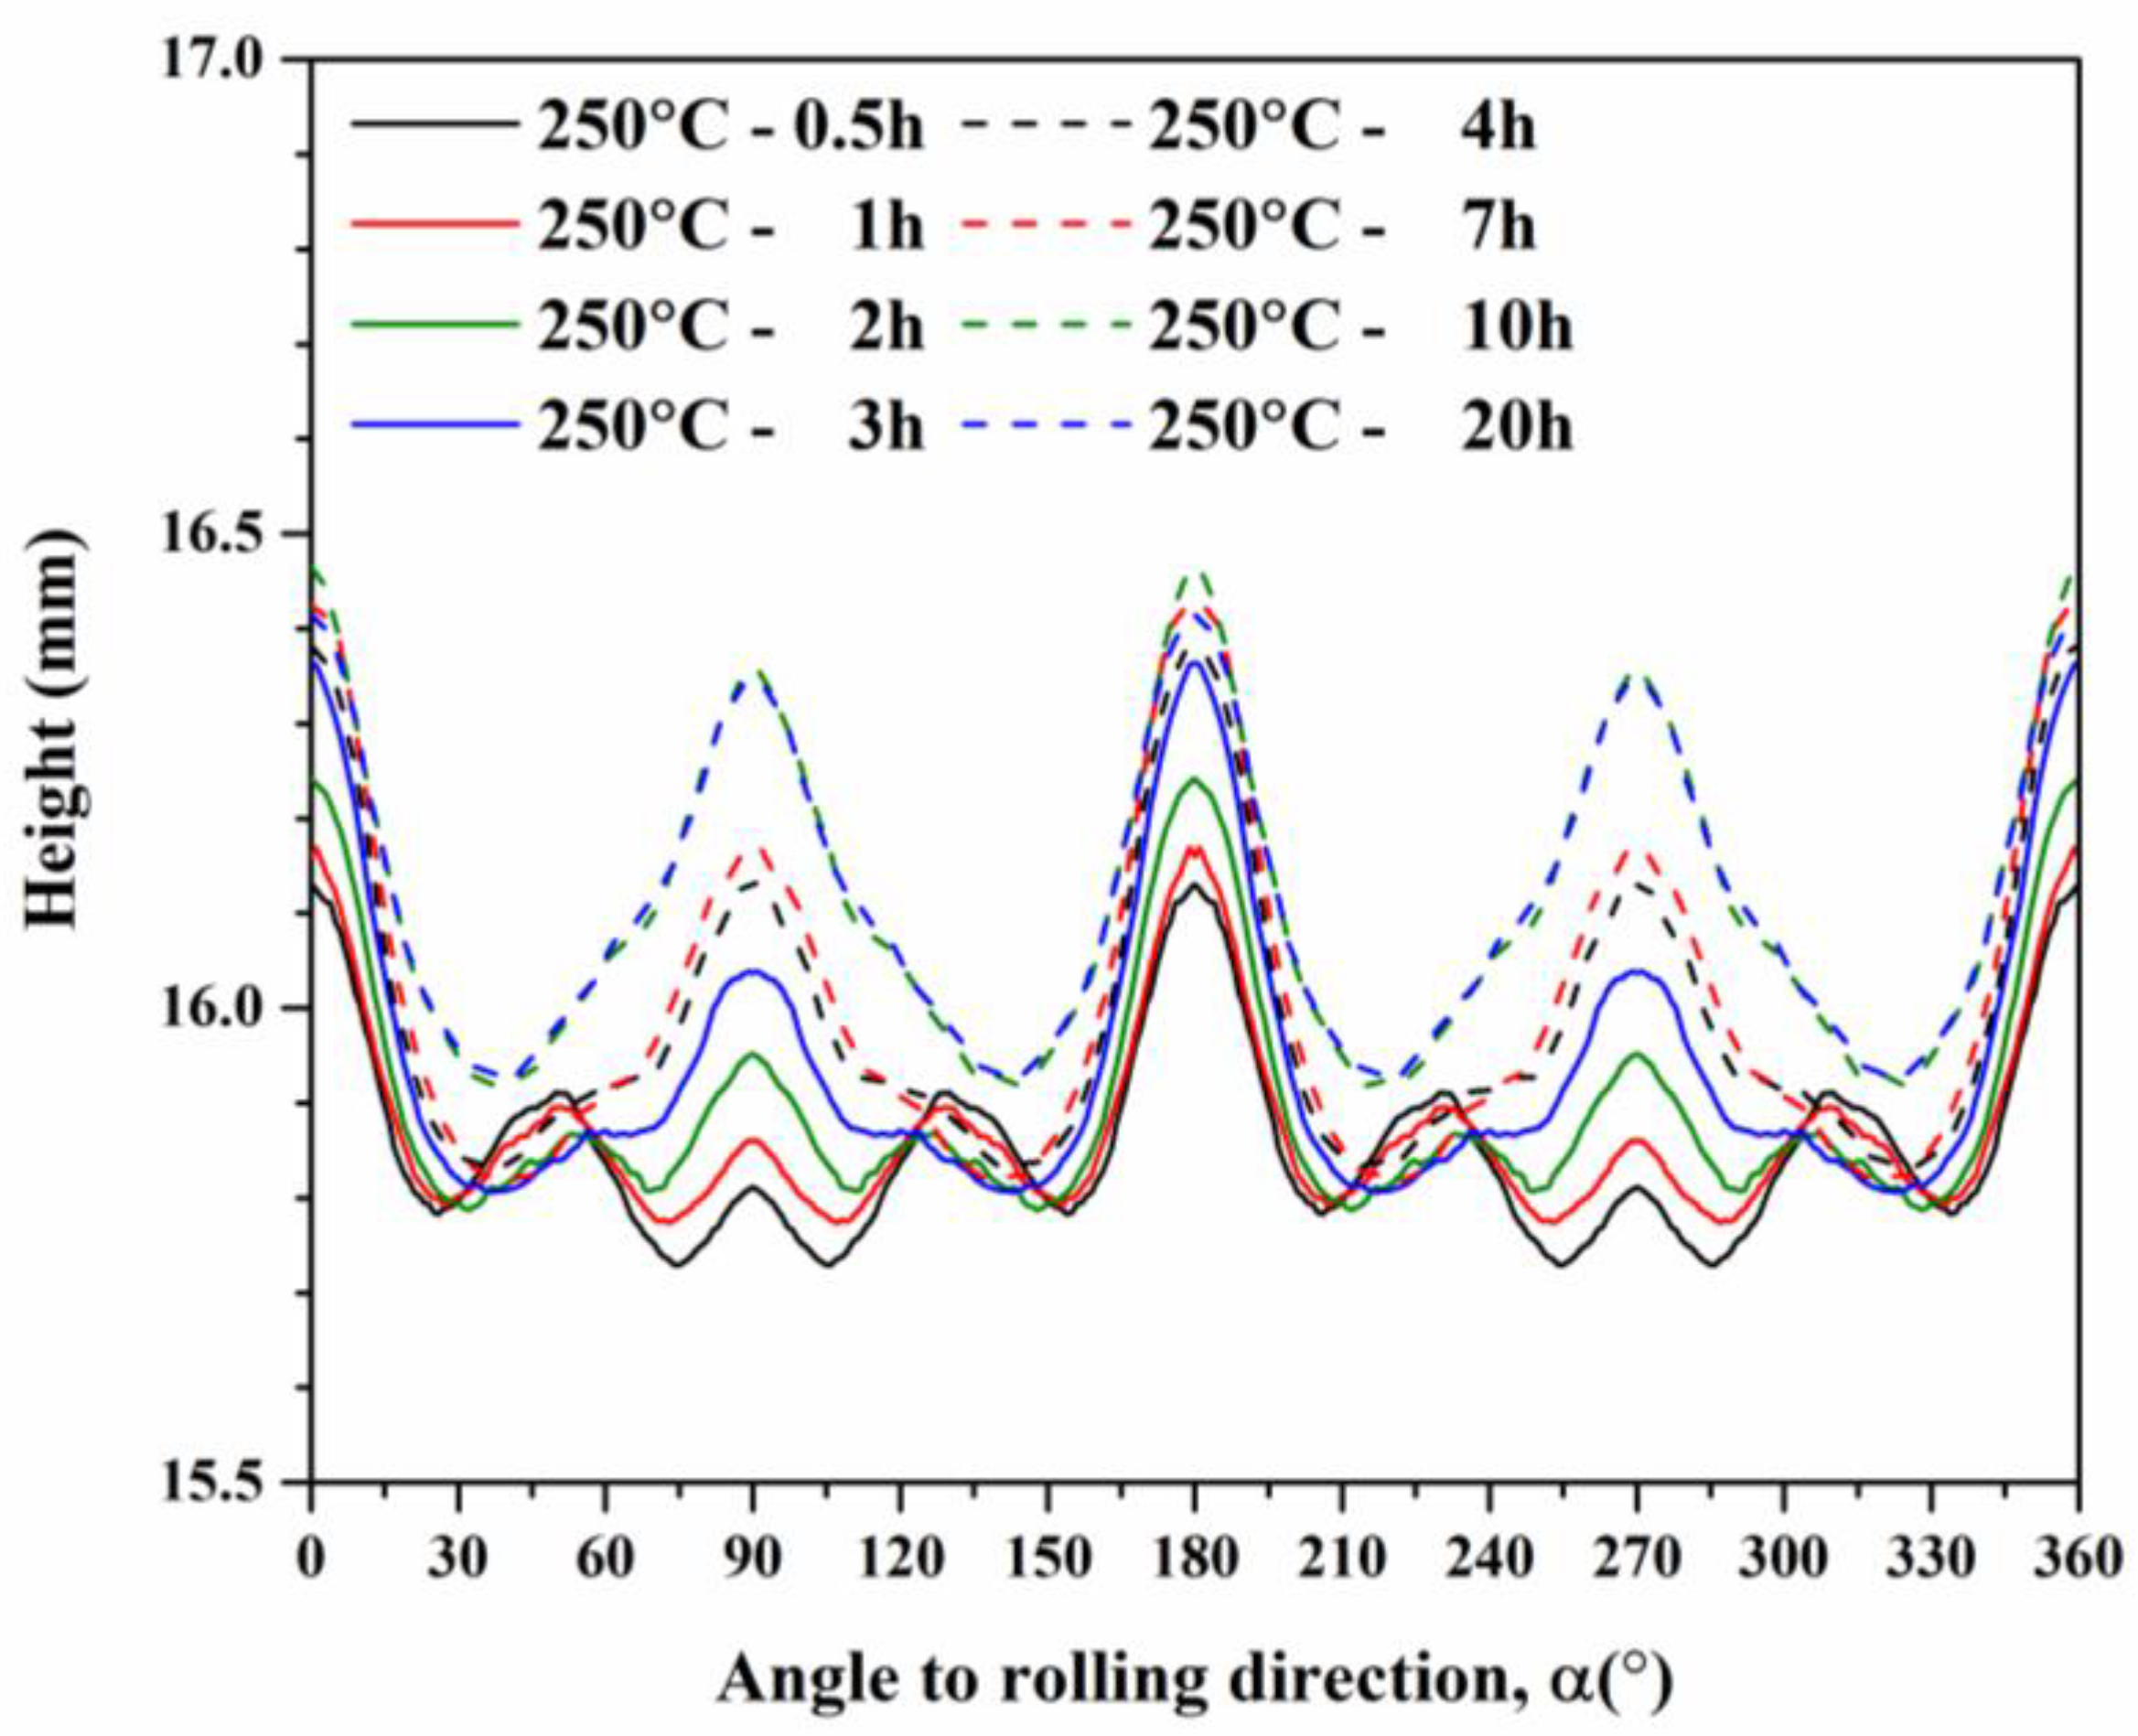
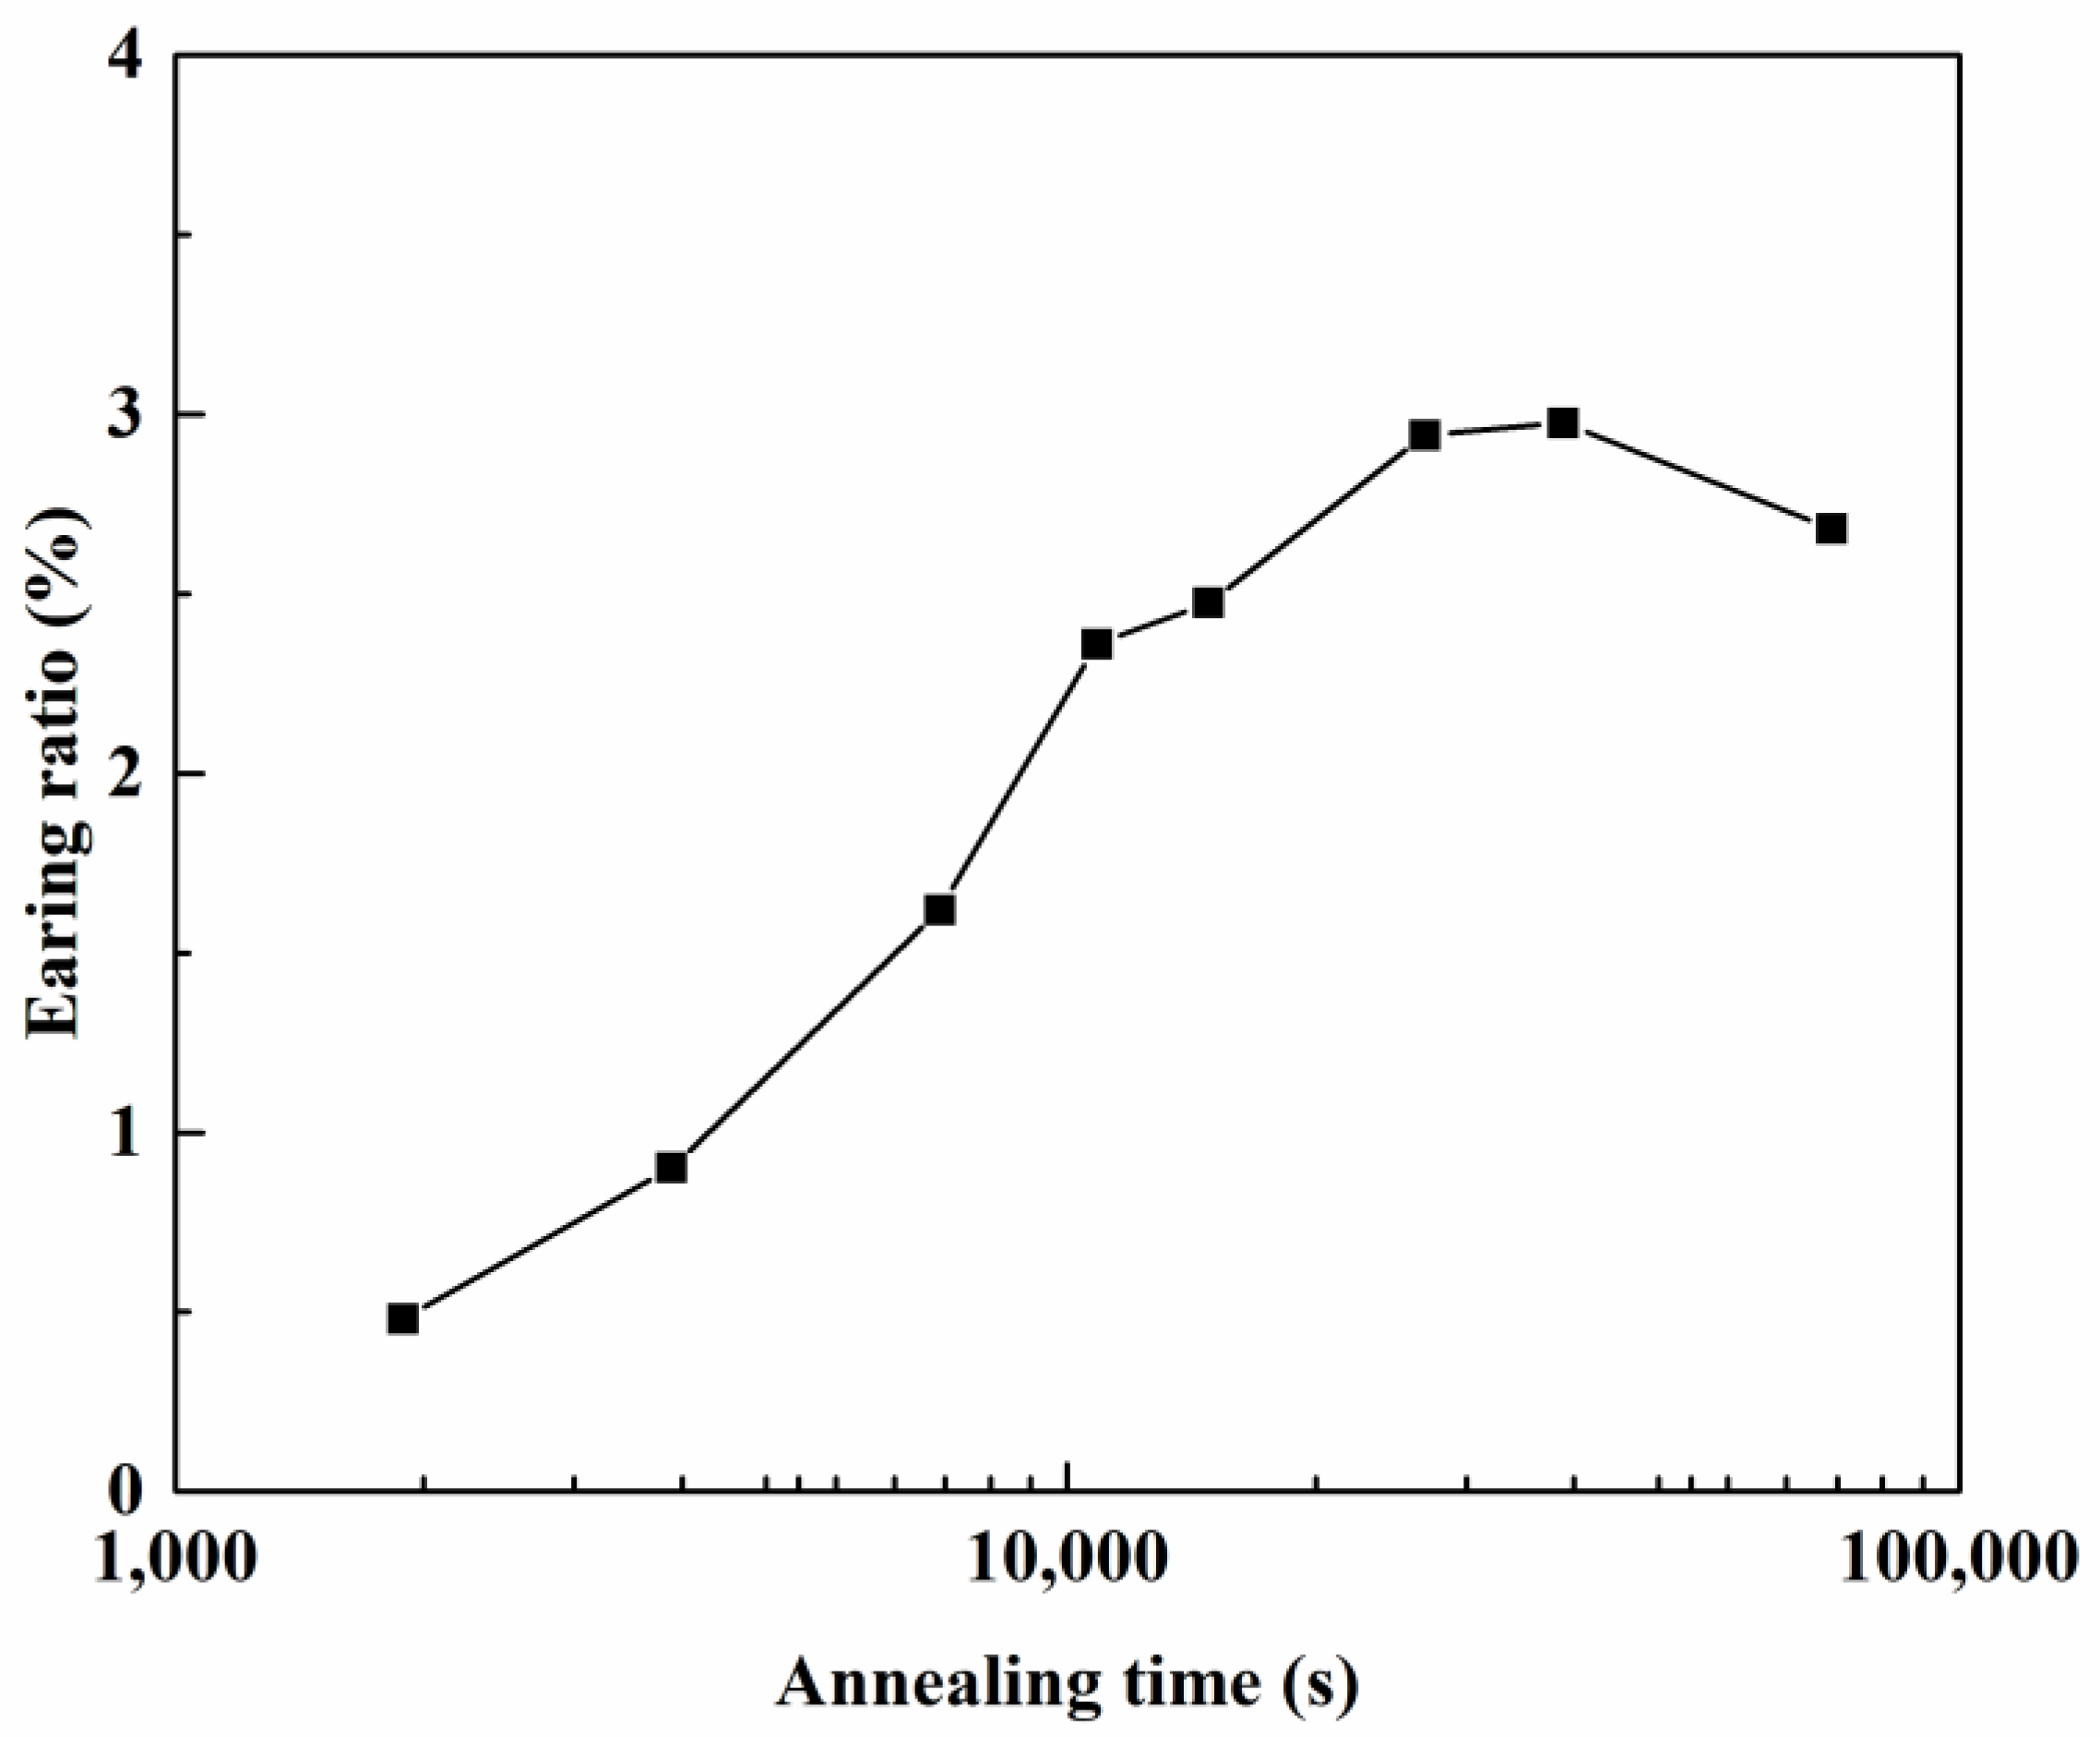
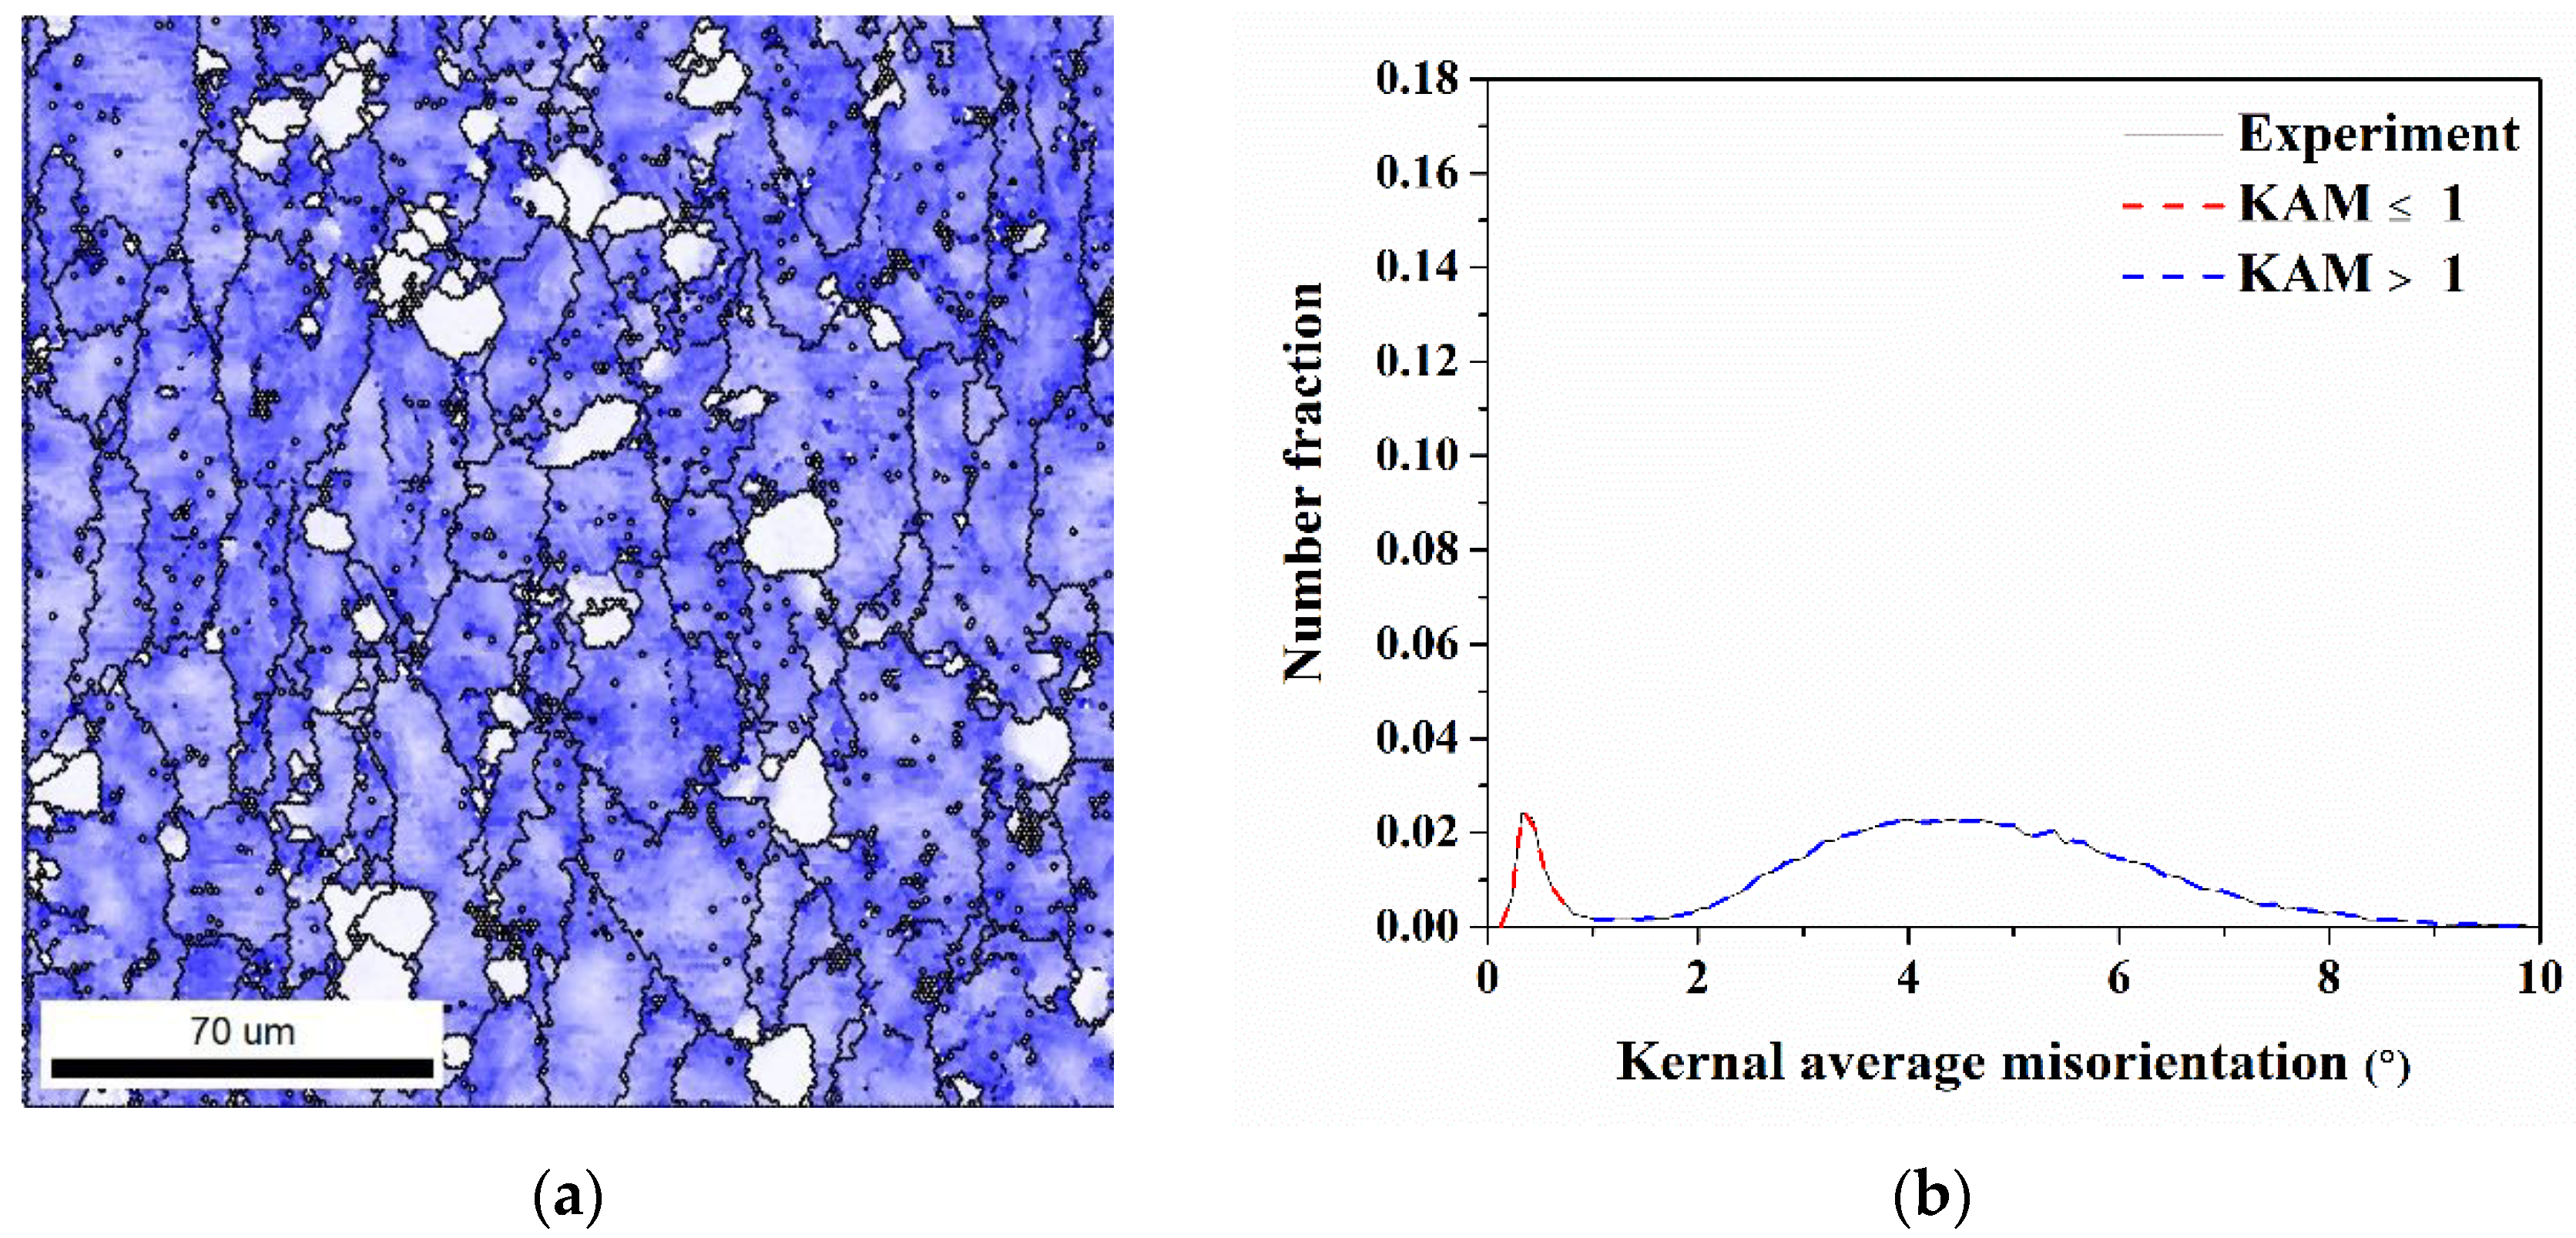
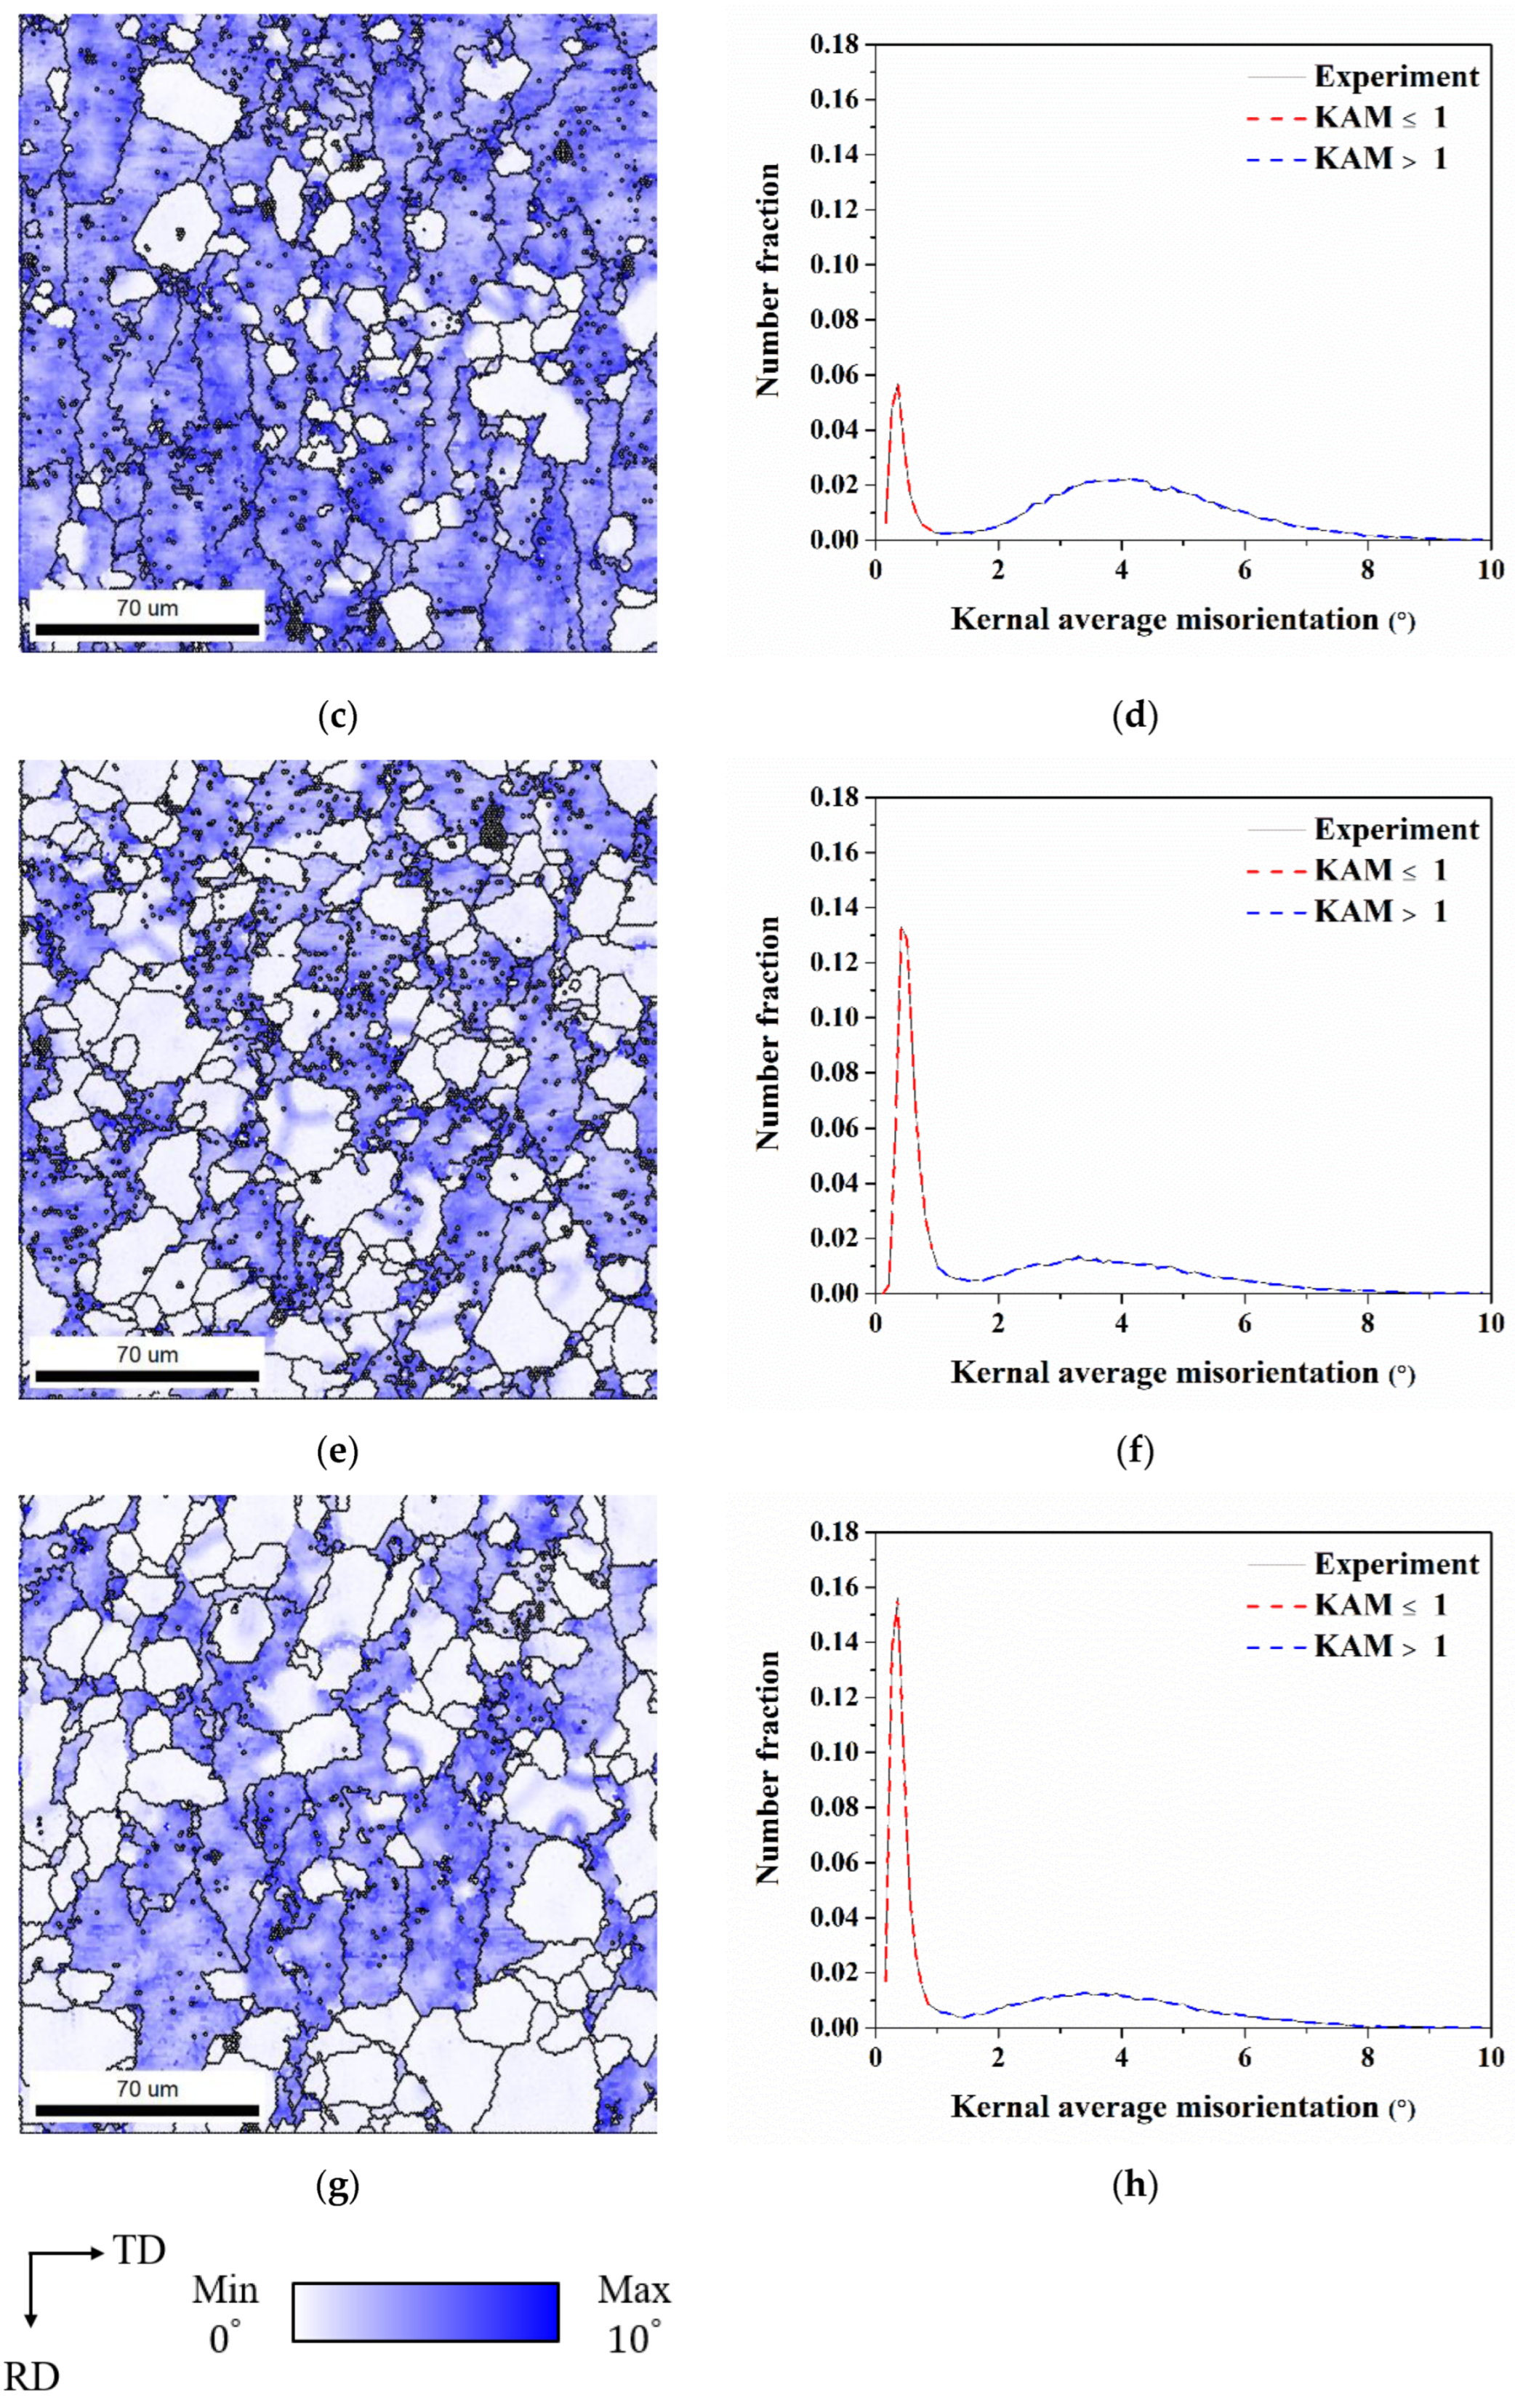
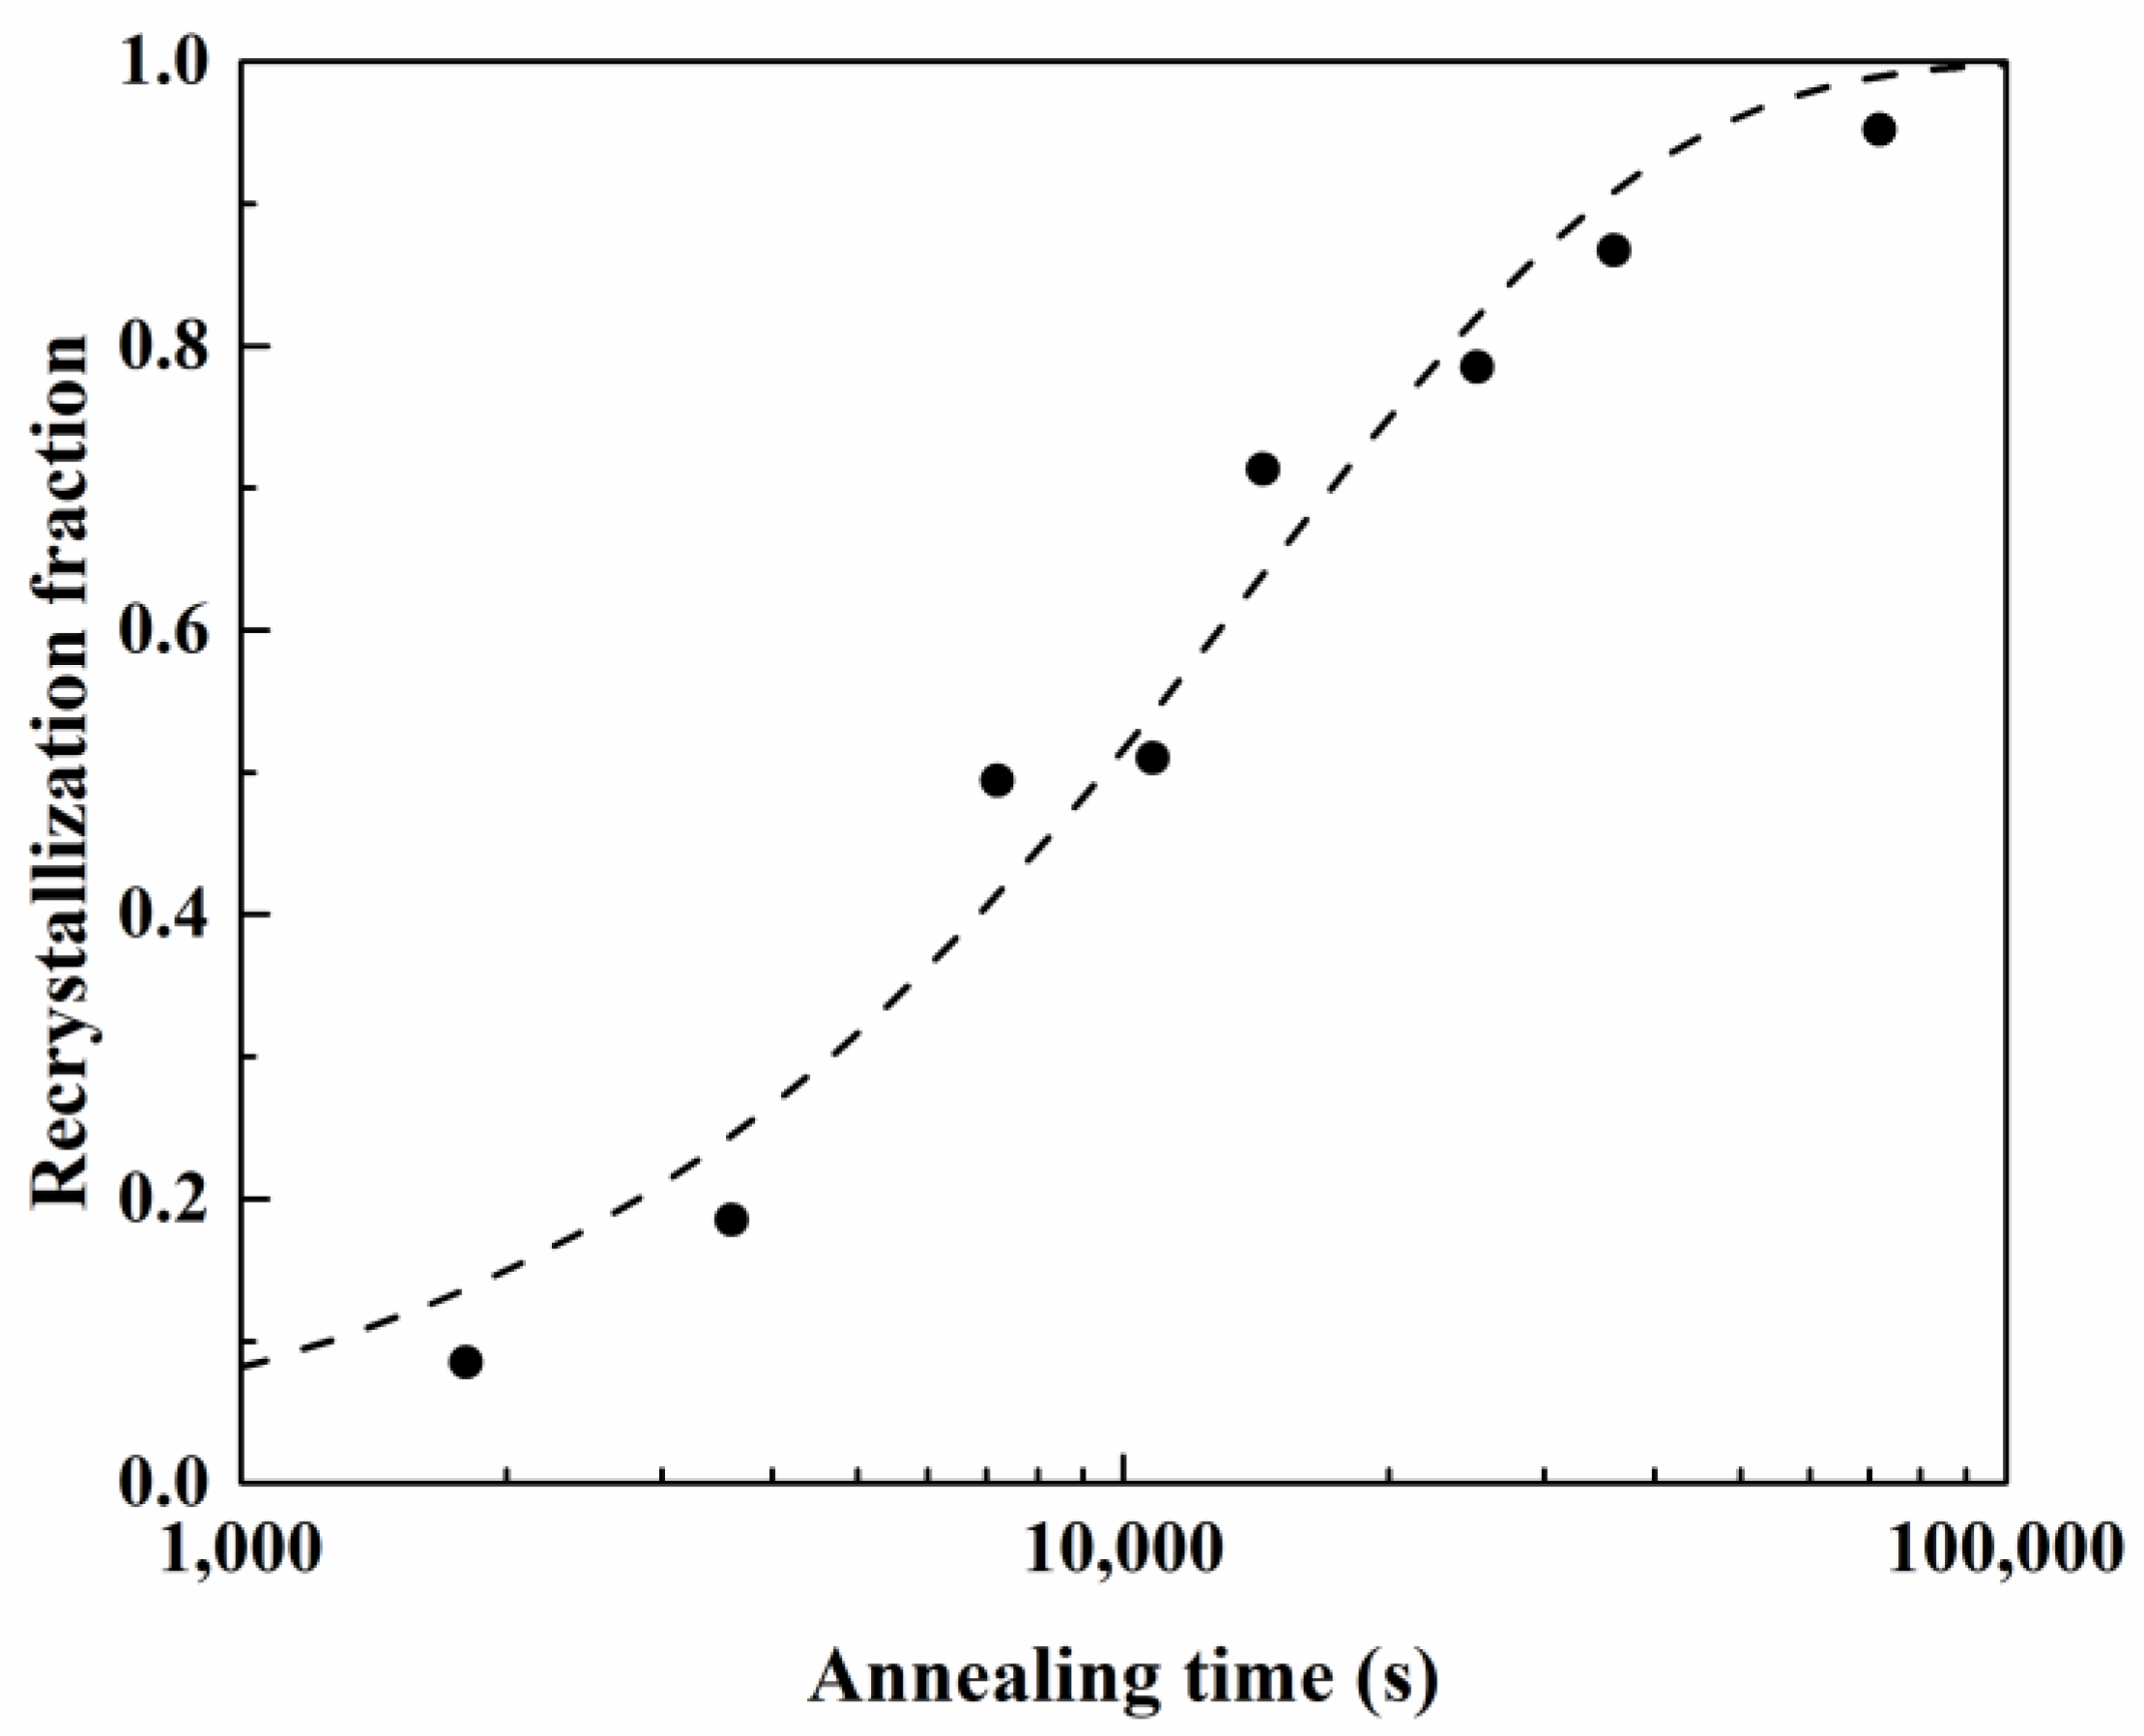
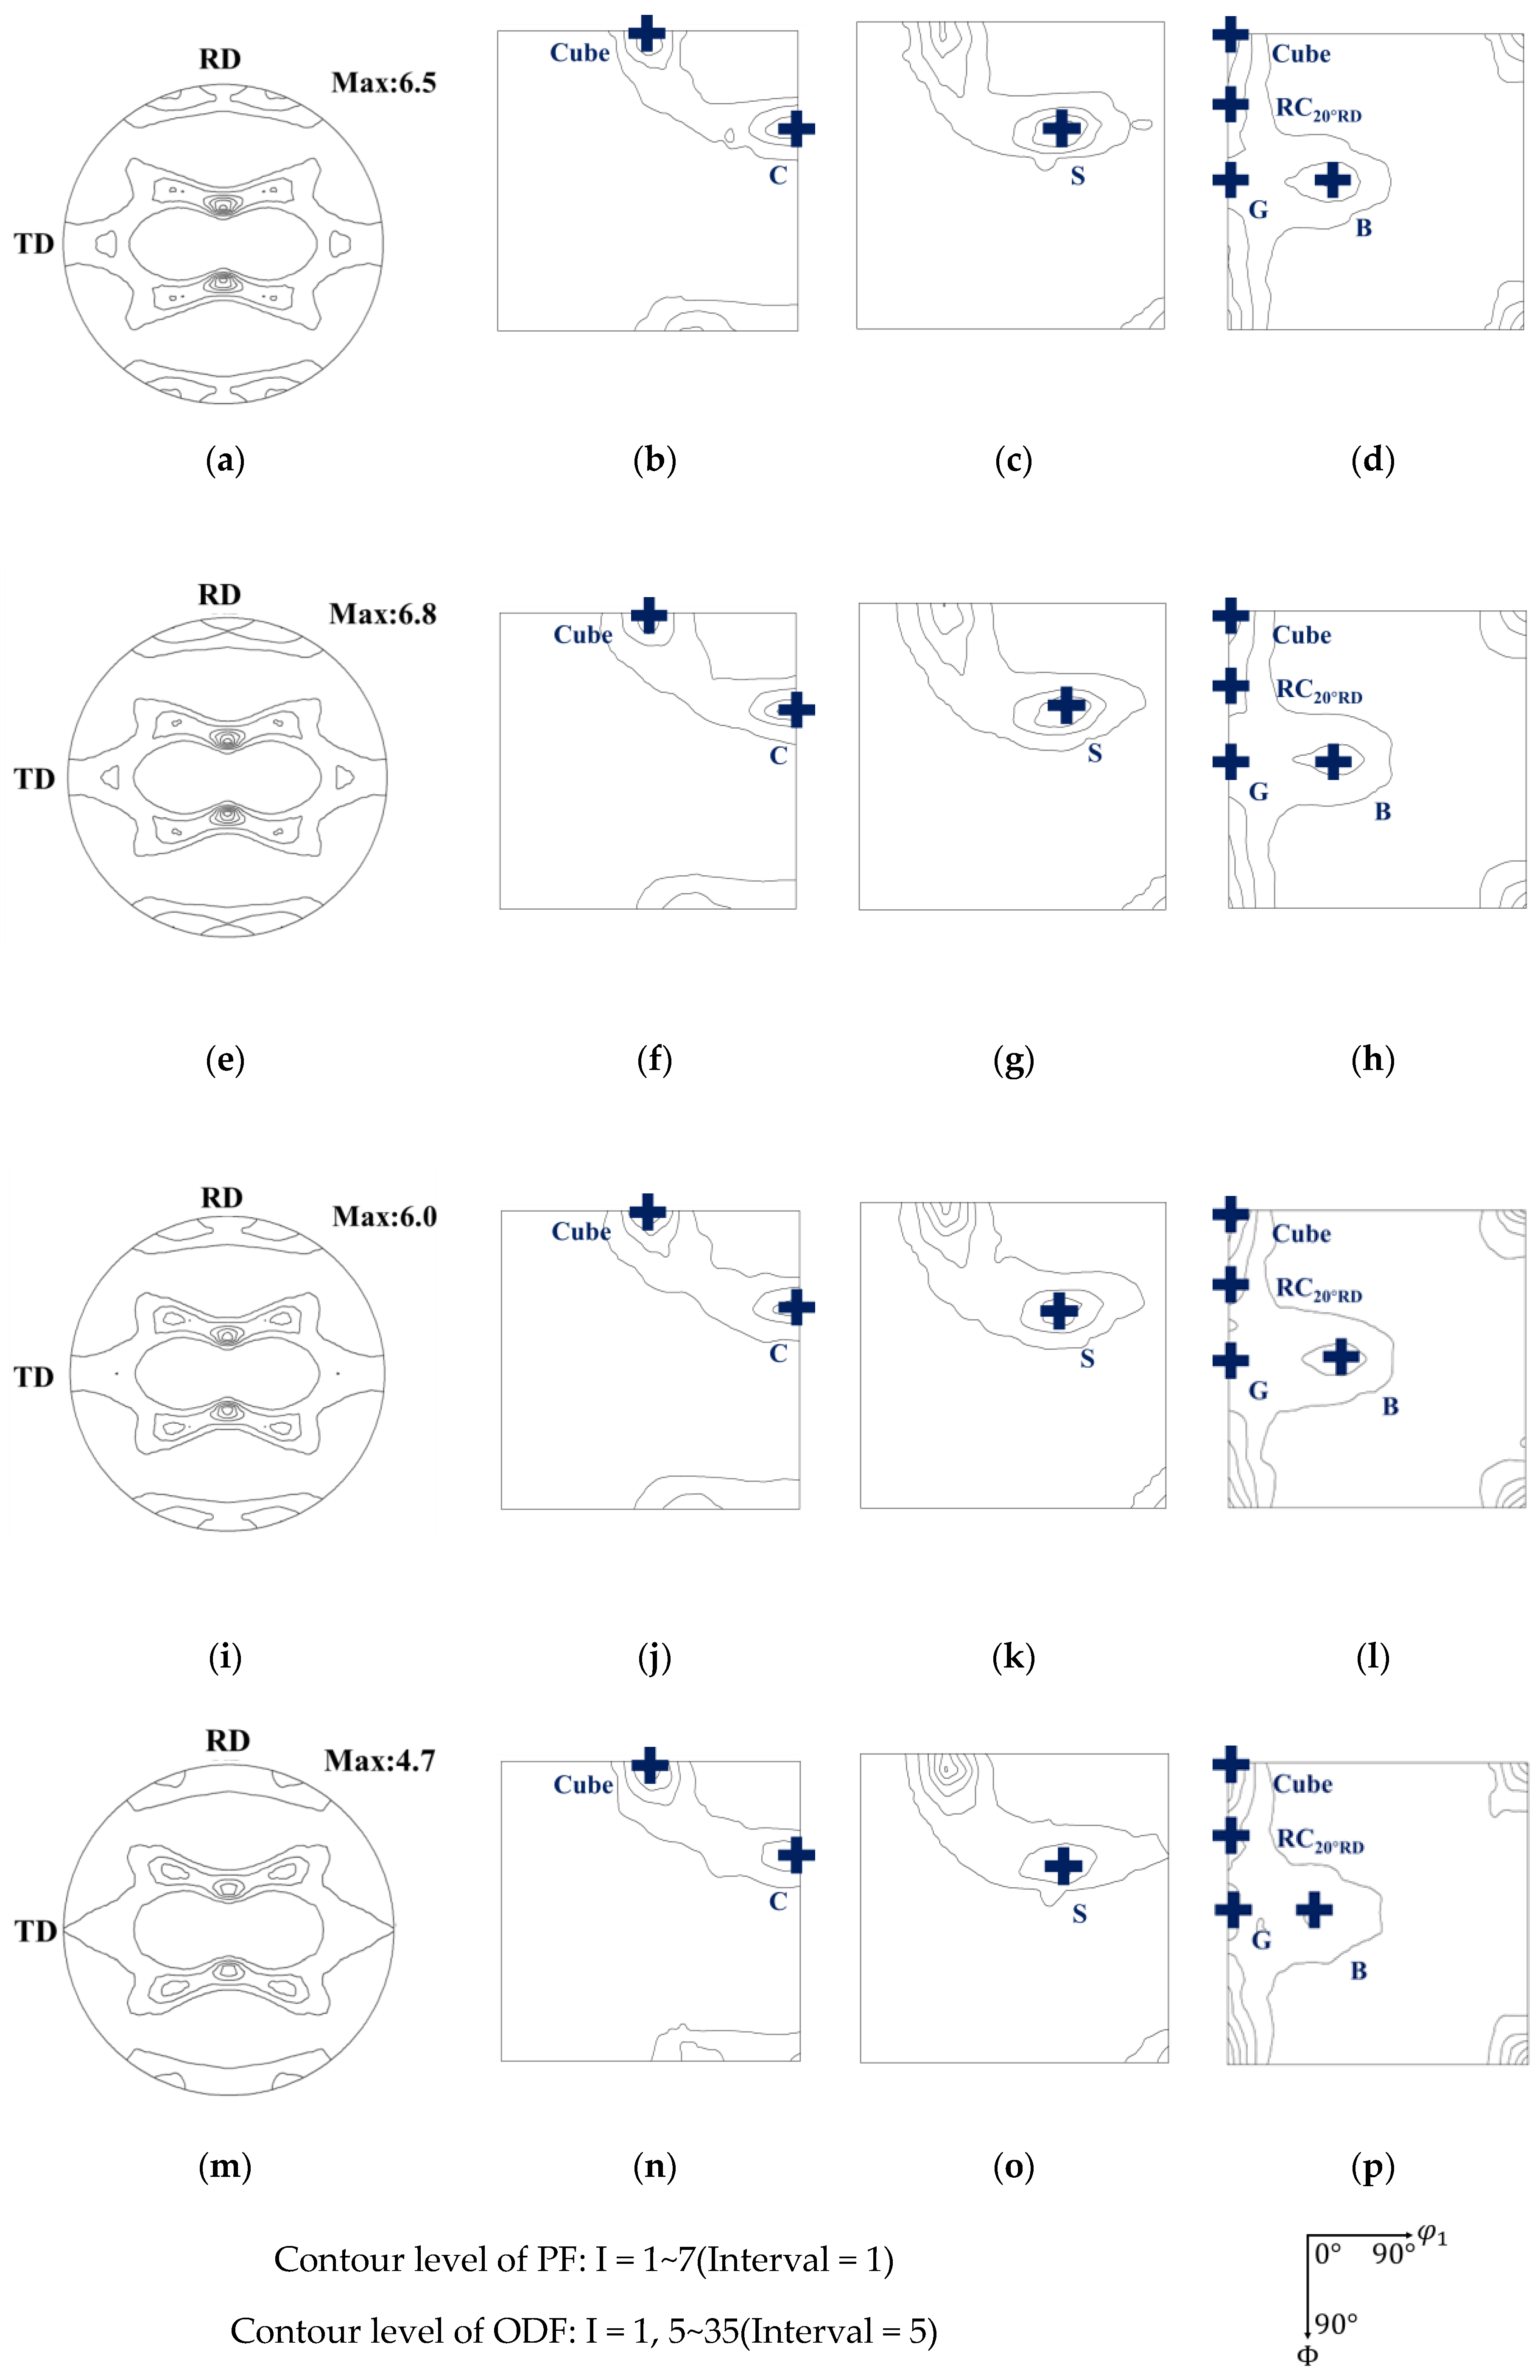
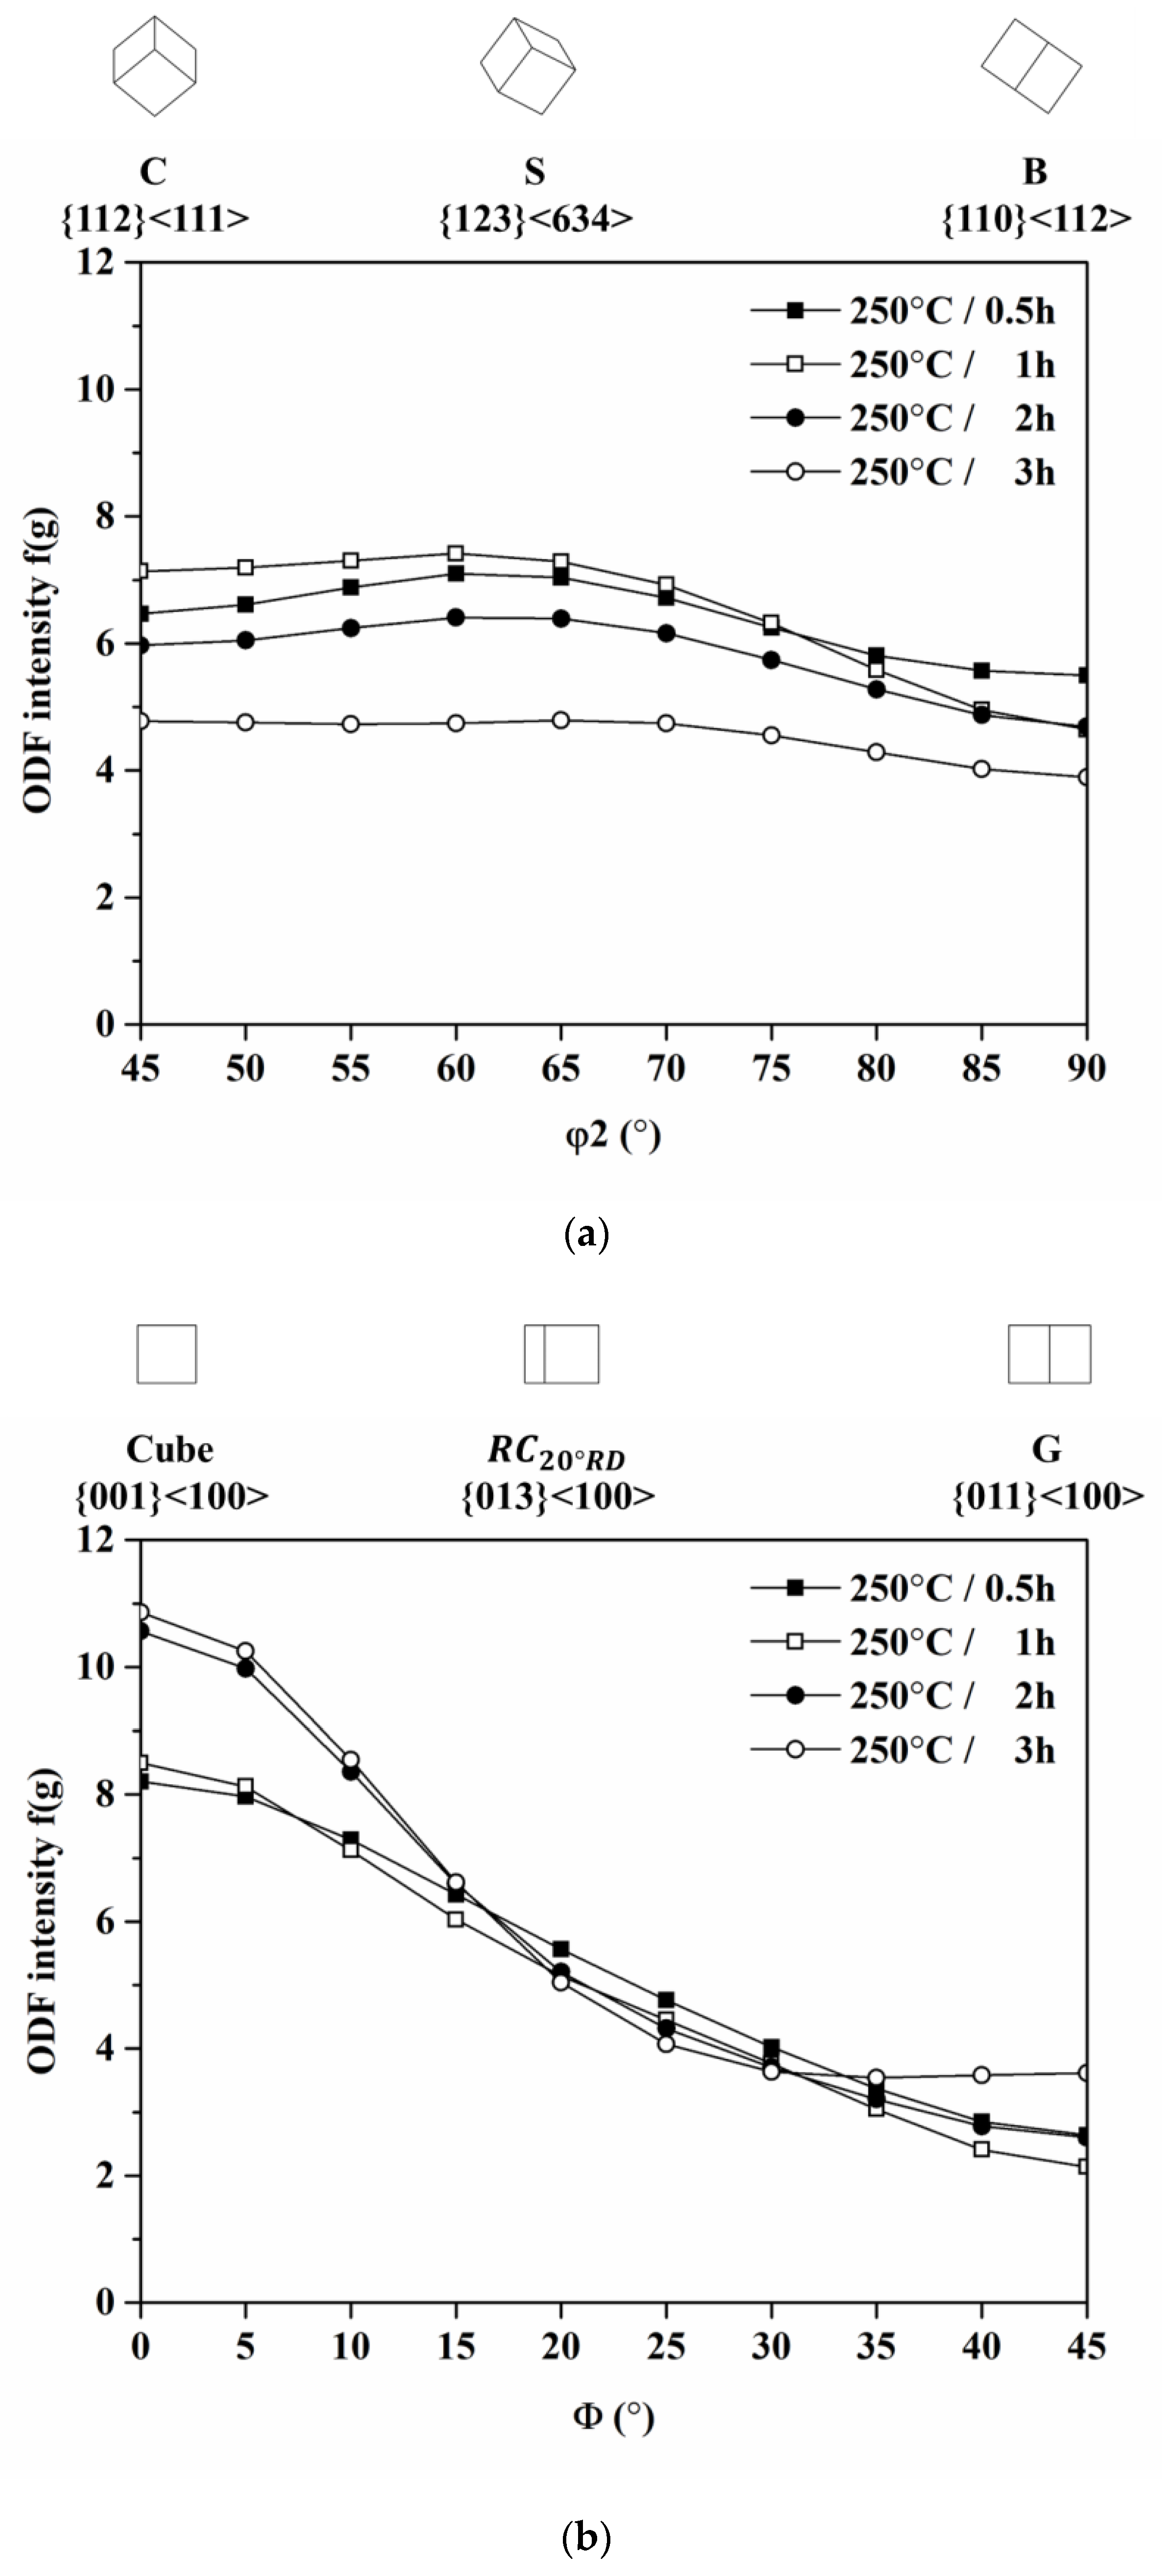
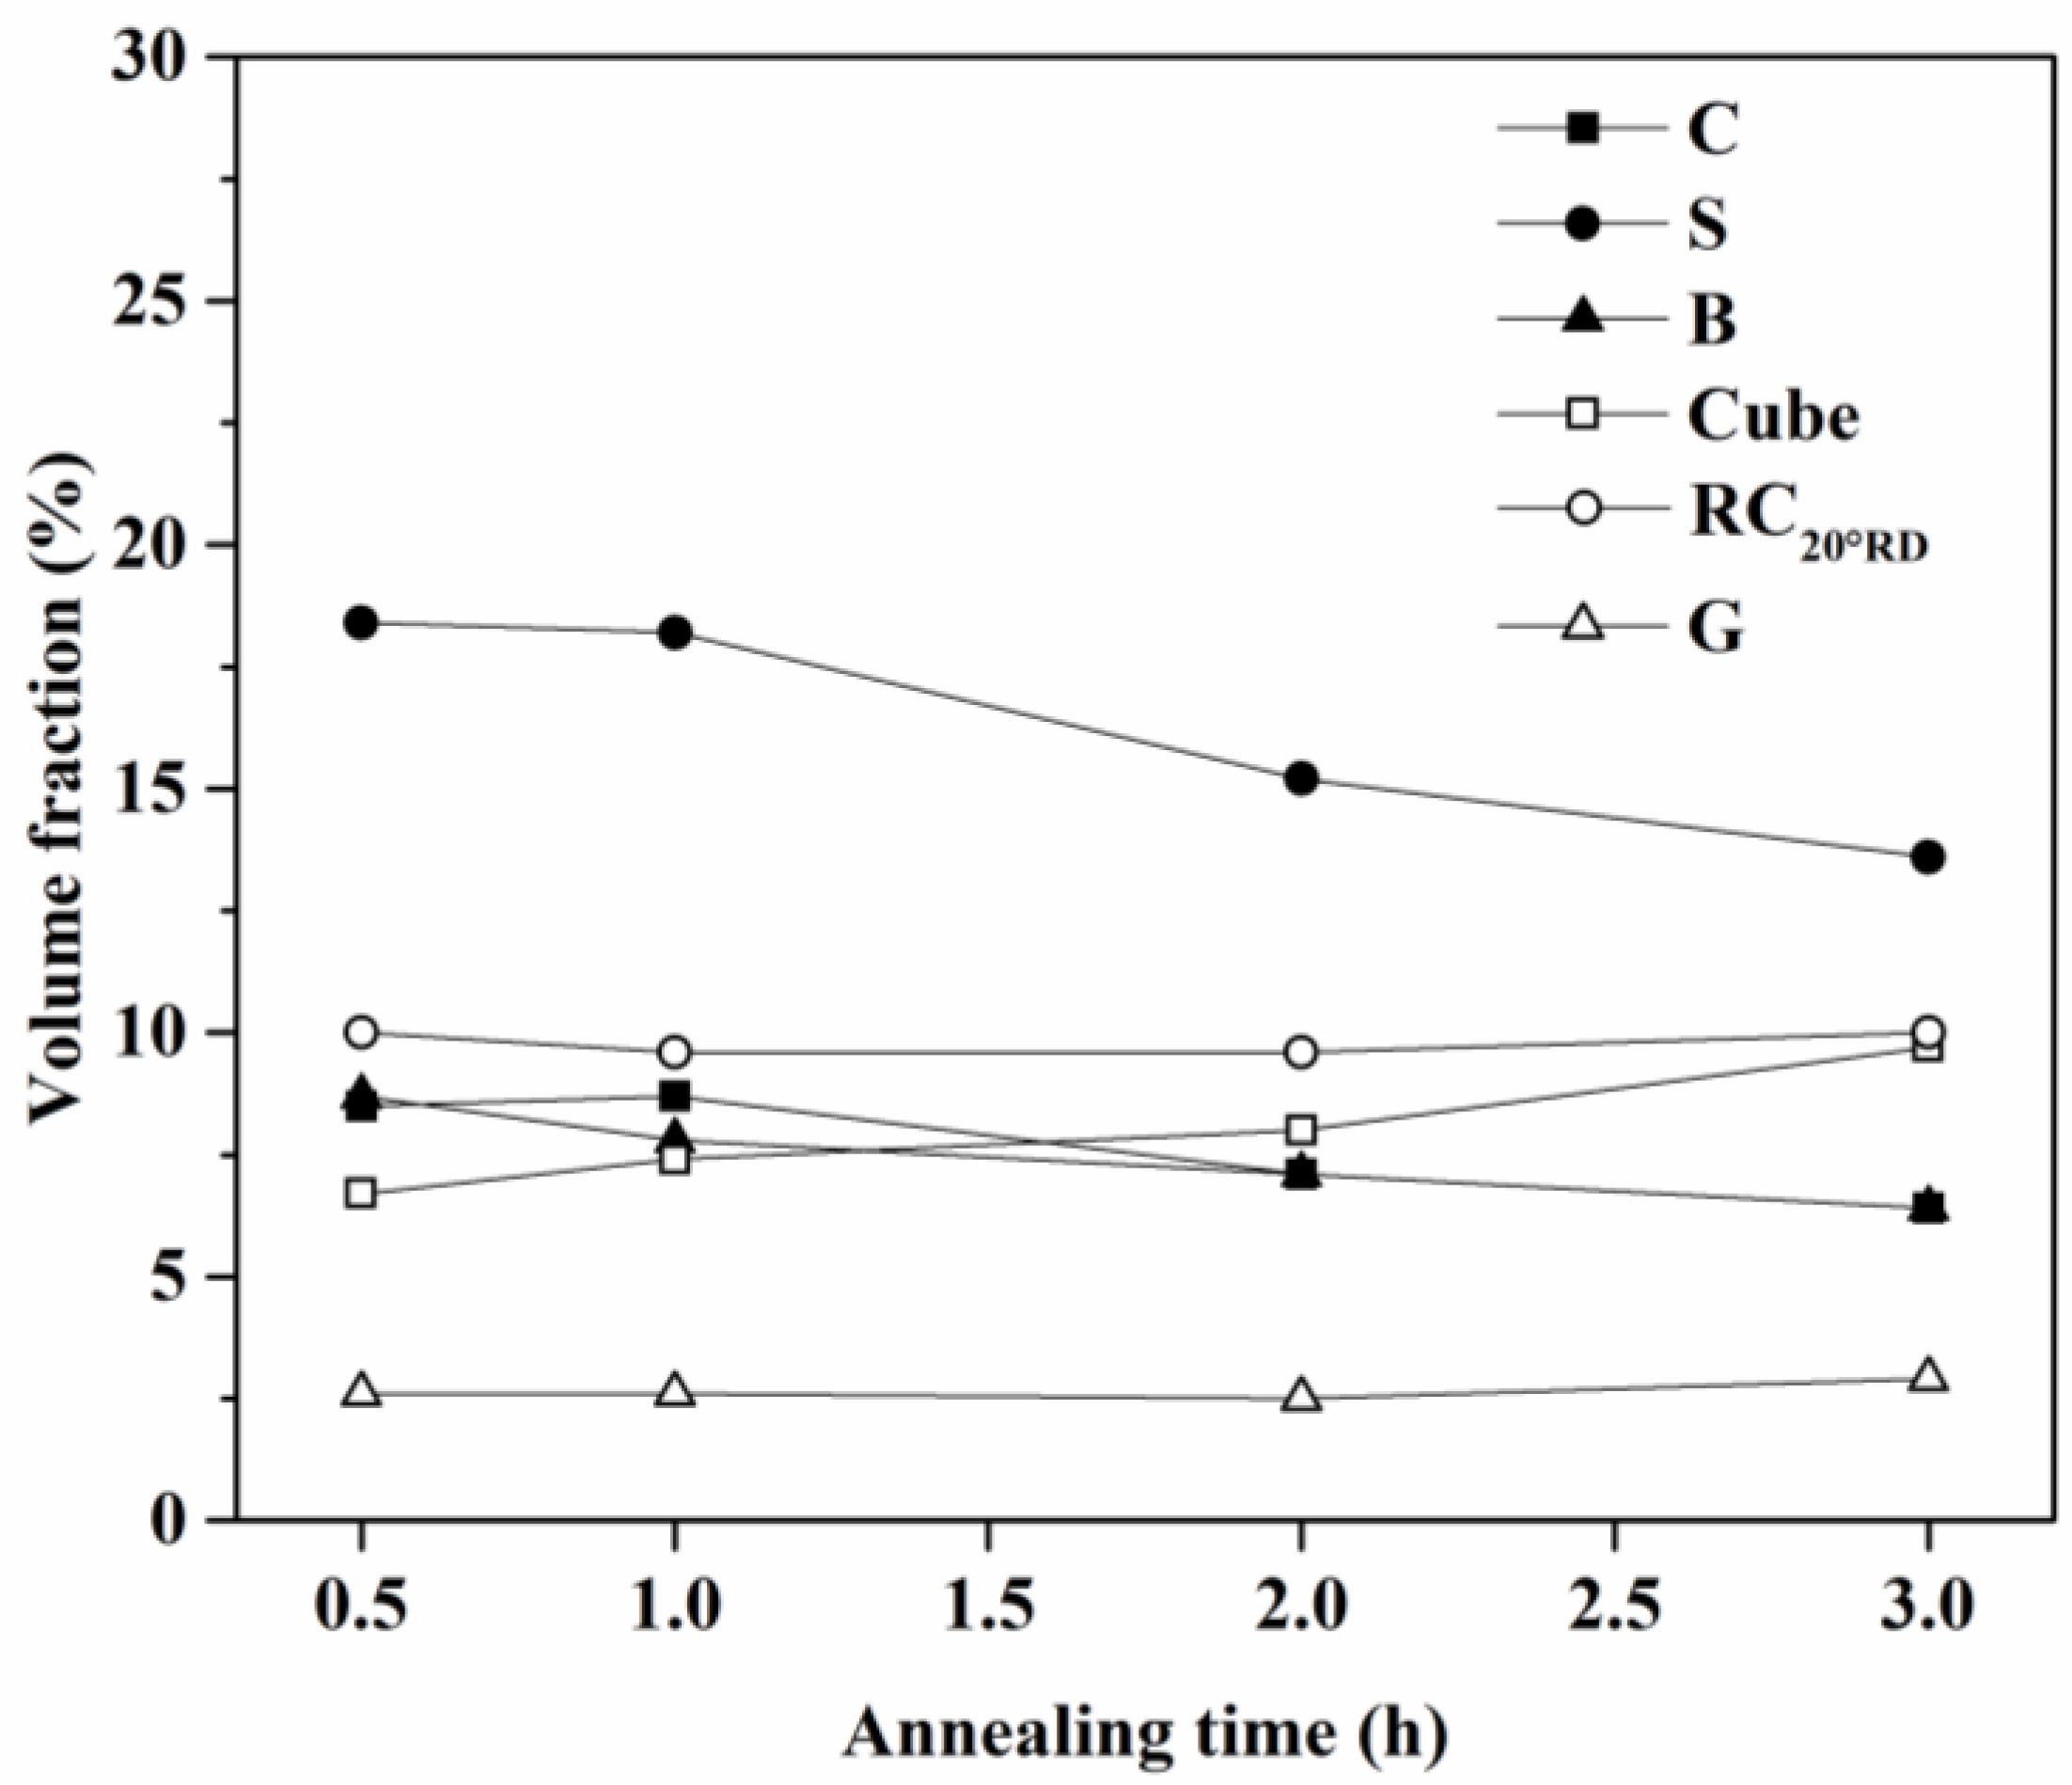
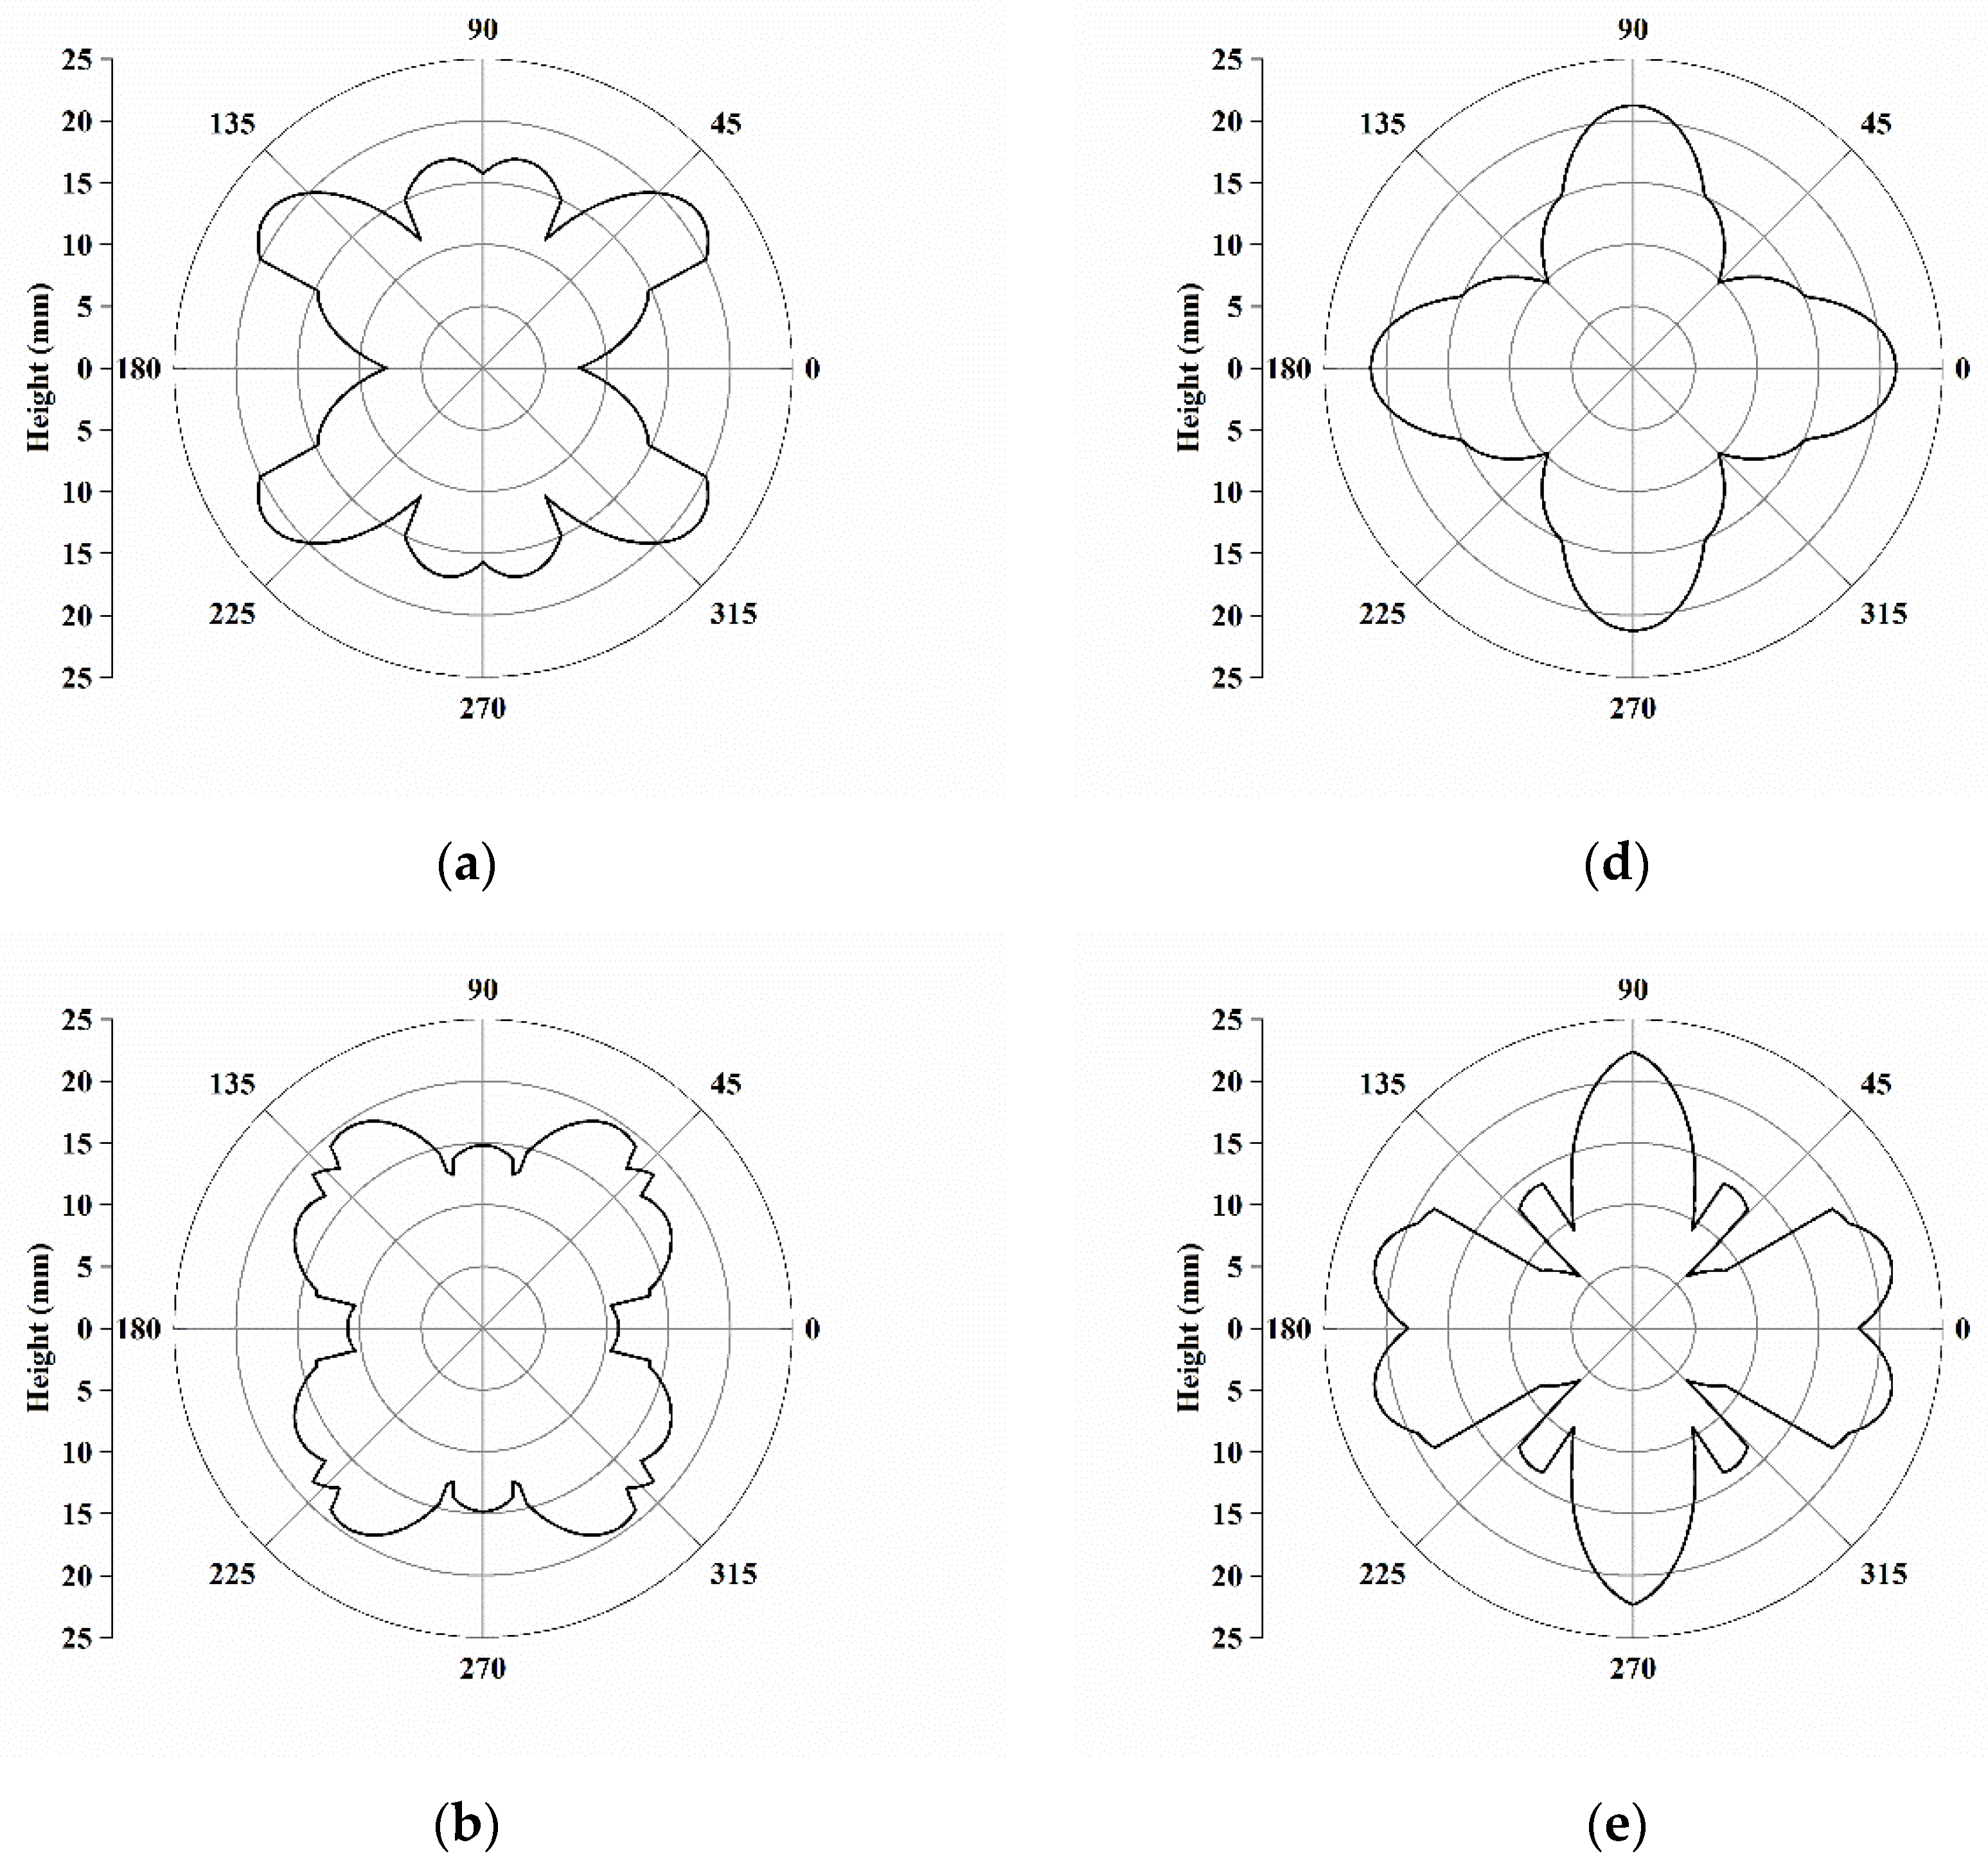
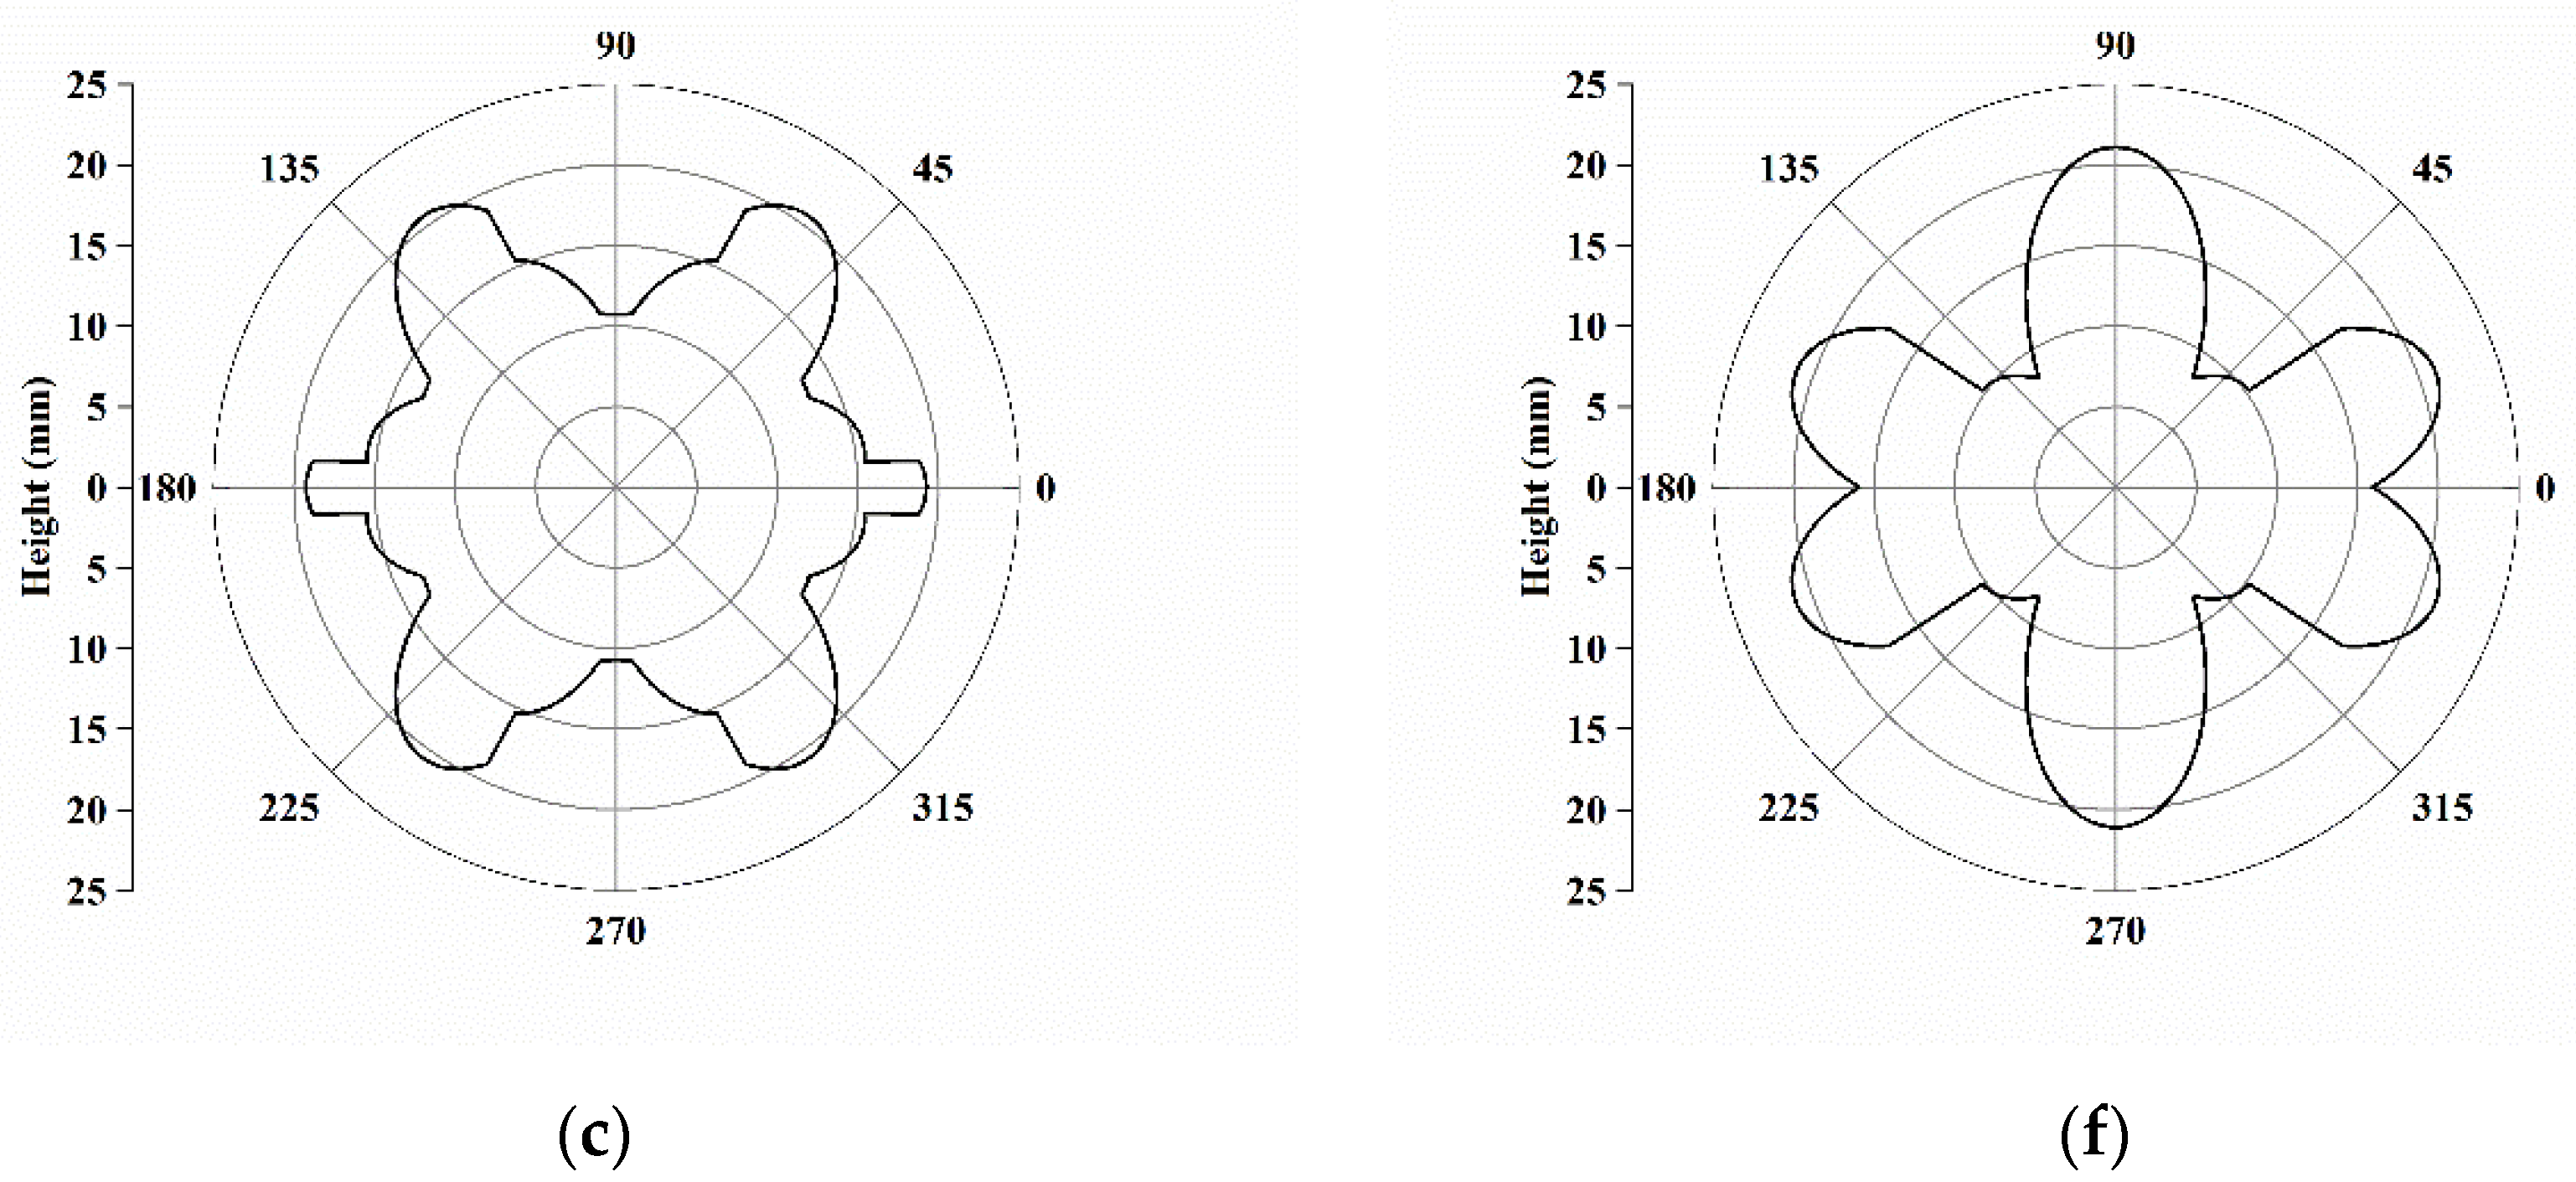
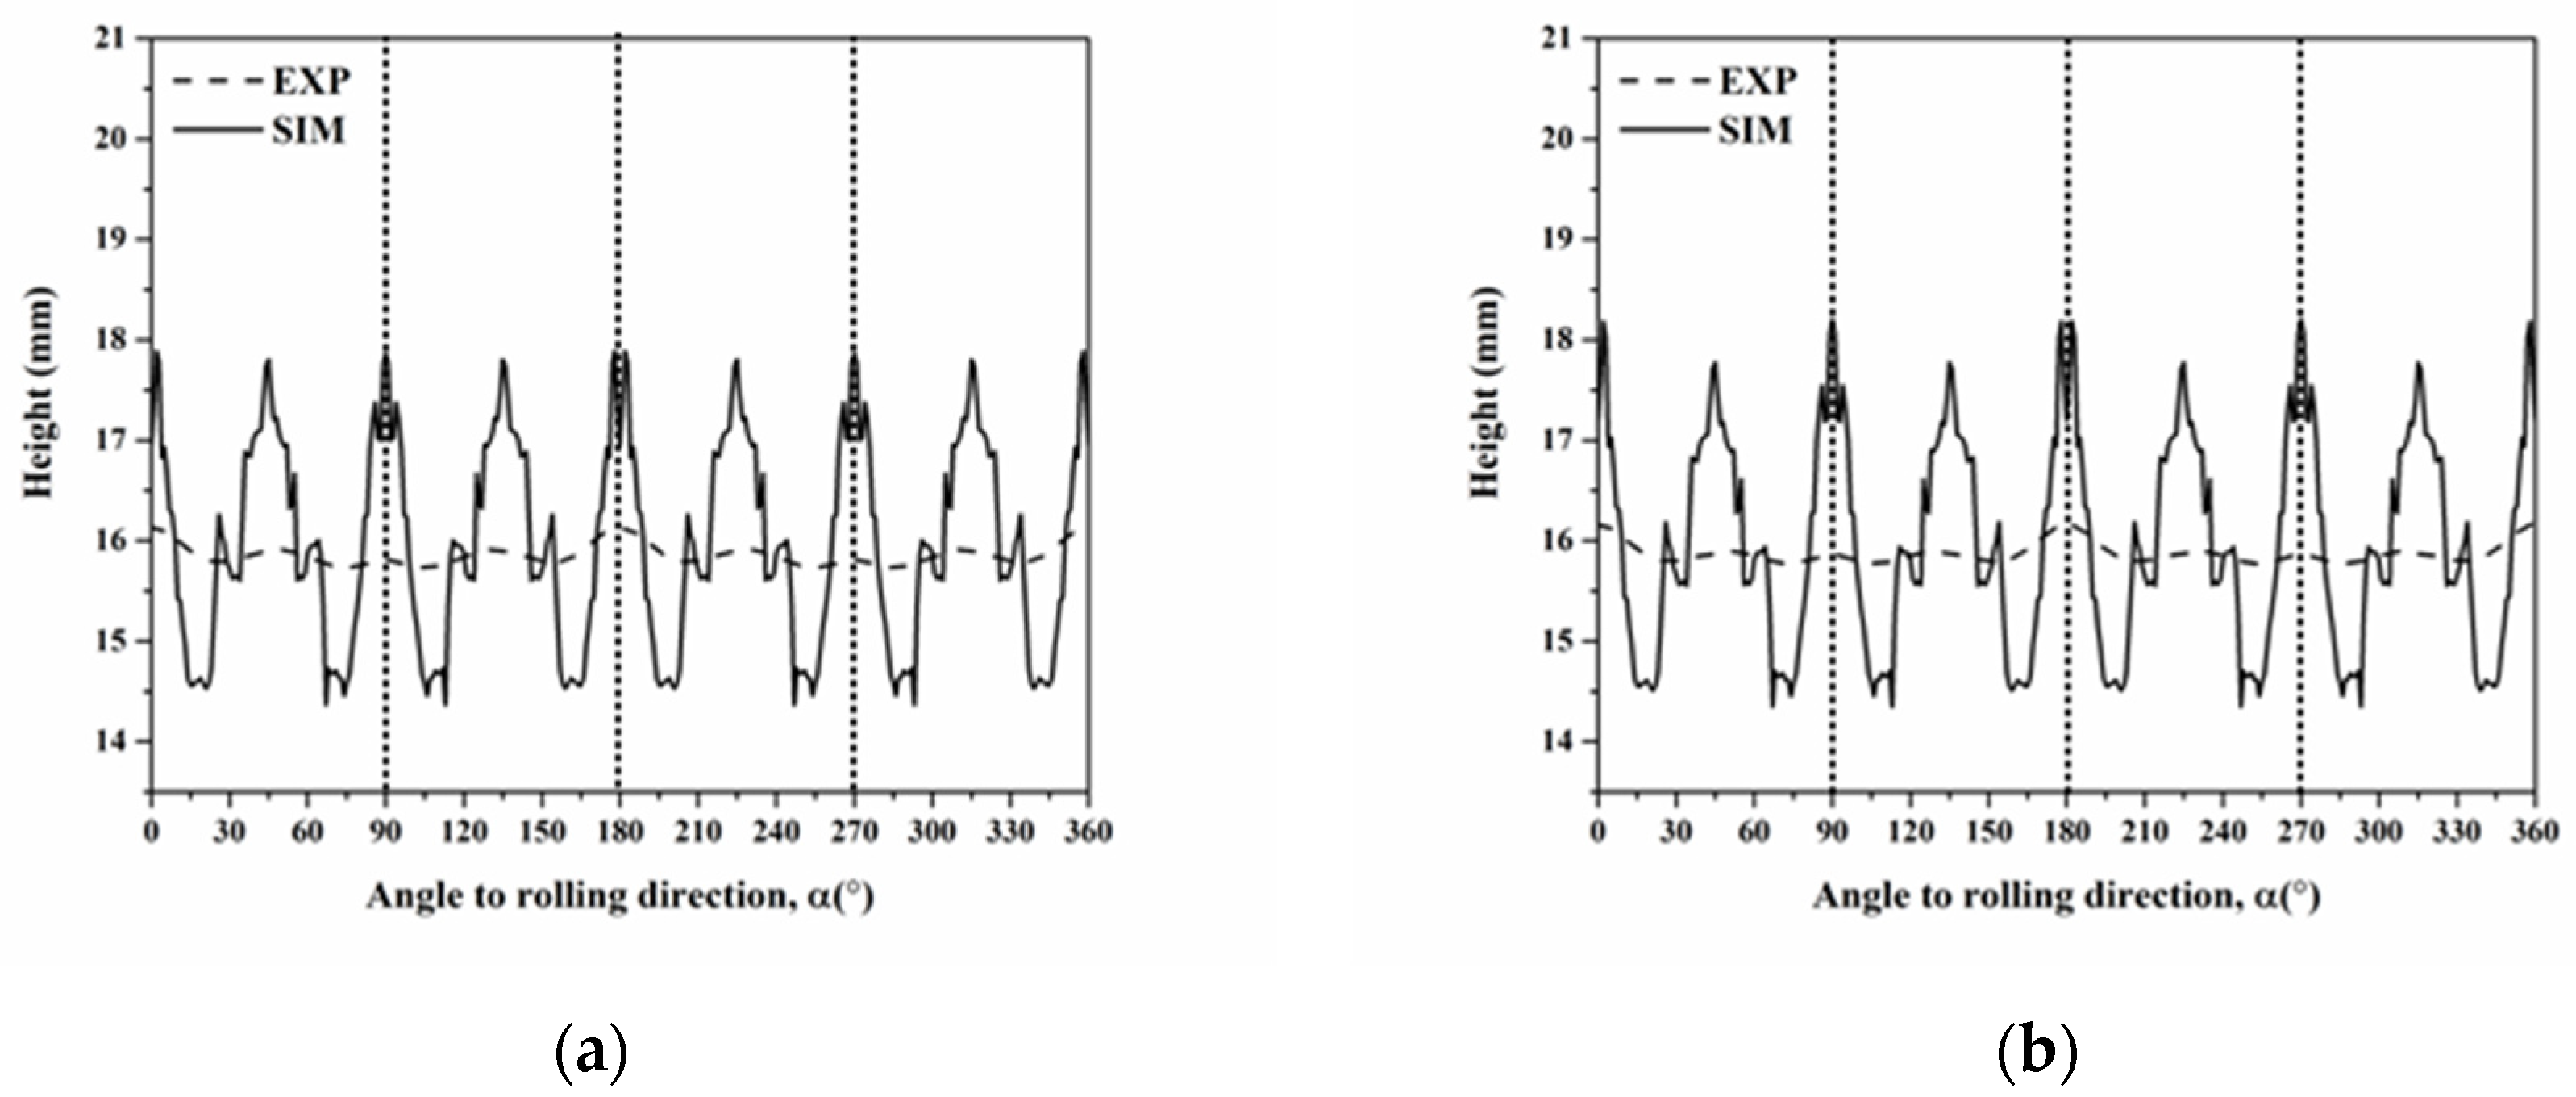
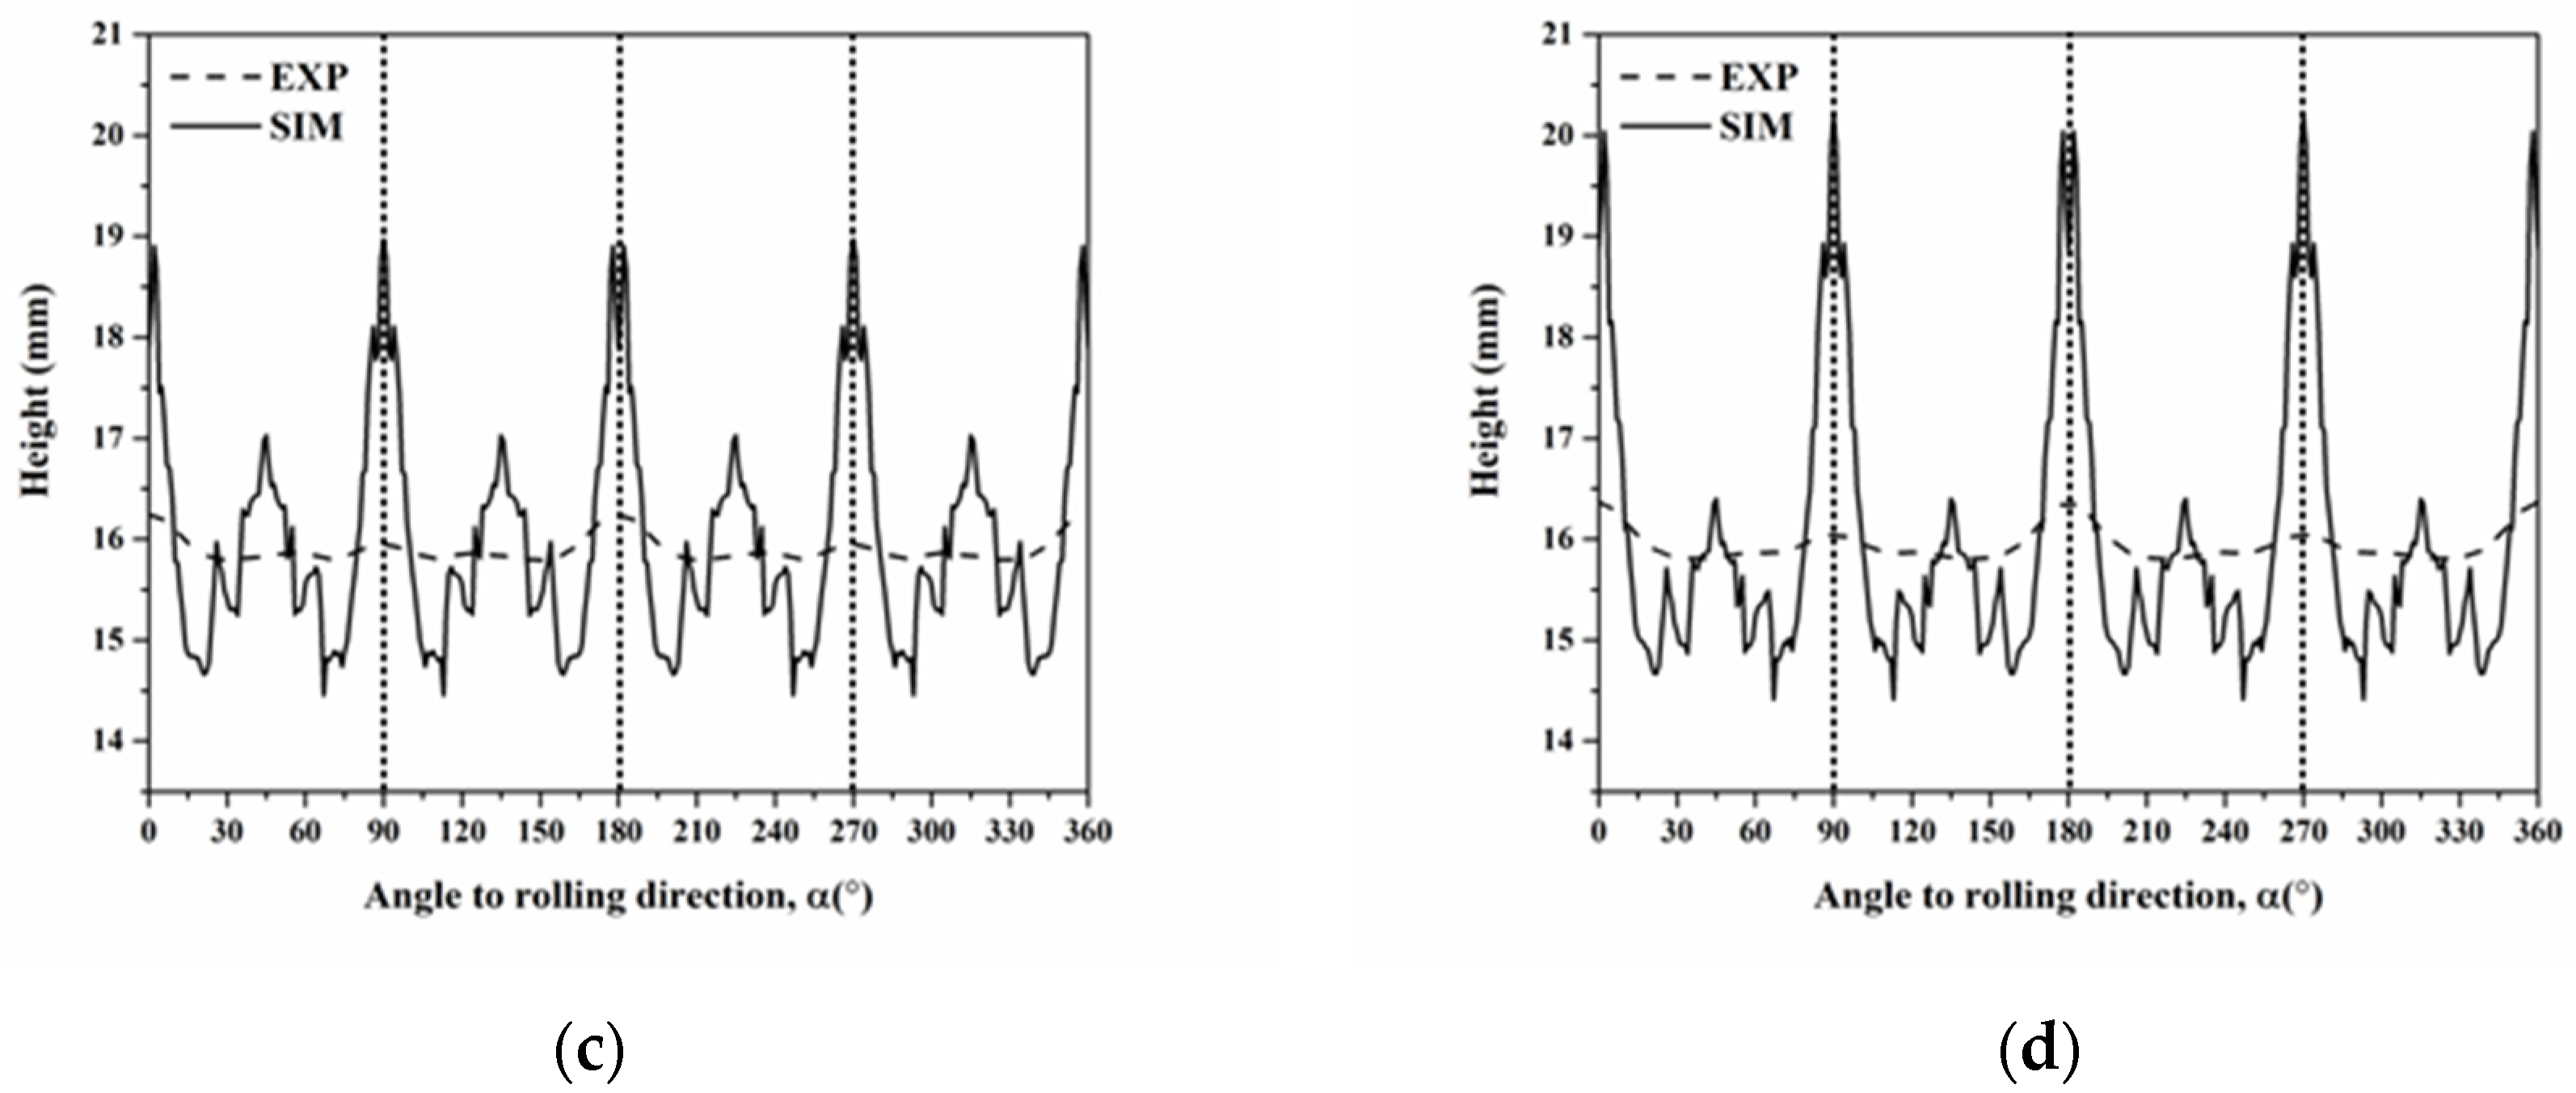
4.1. Correlation between Earing and Recrystallization Texture
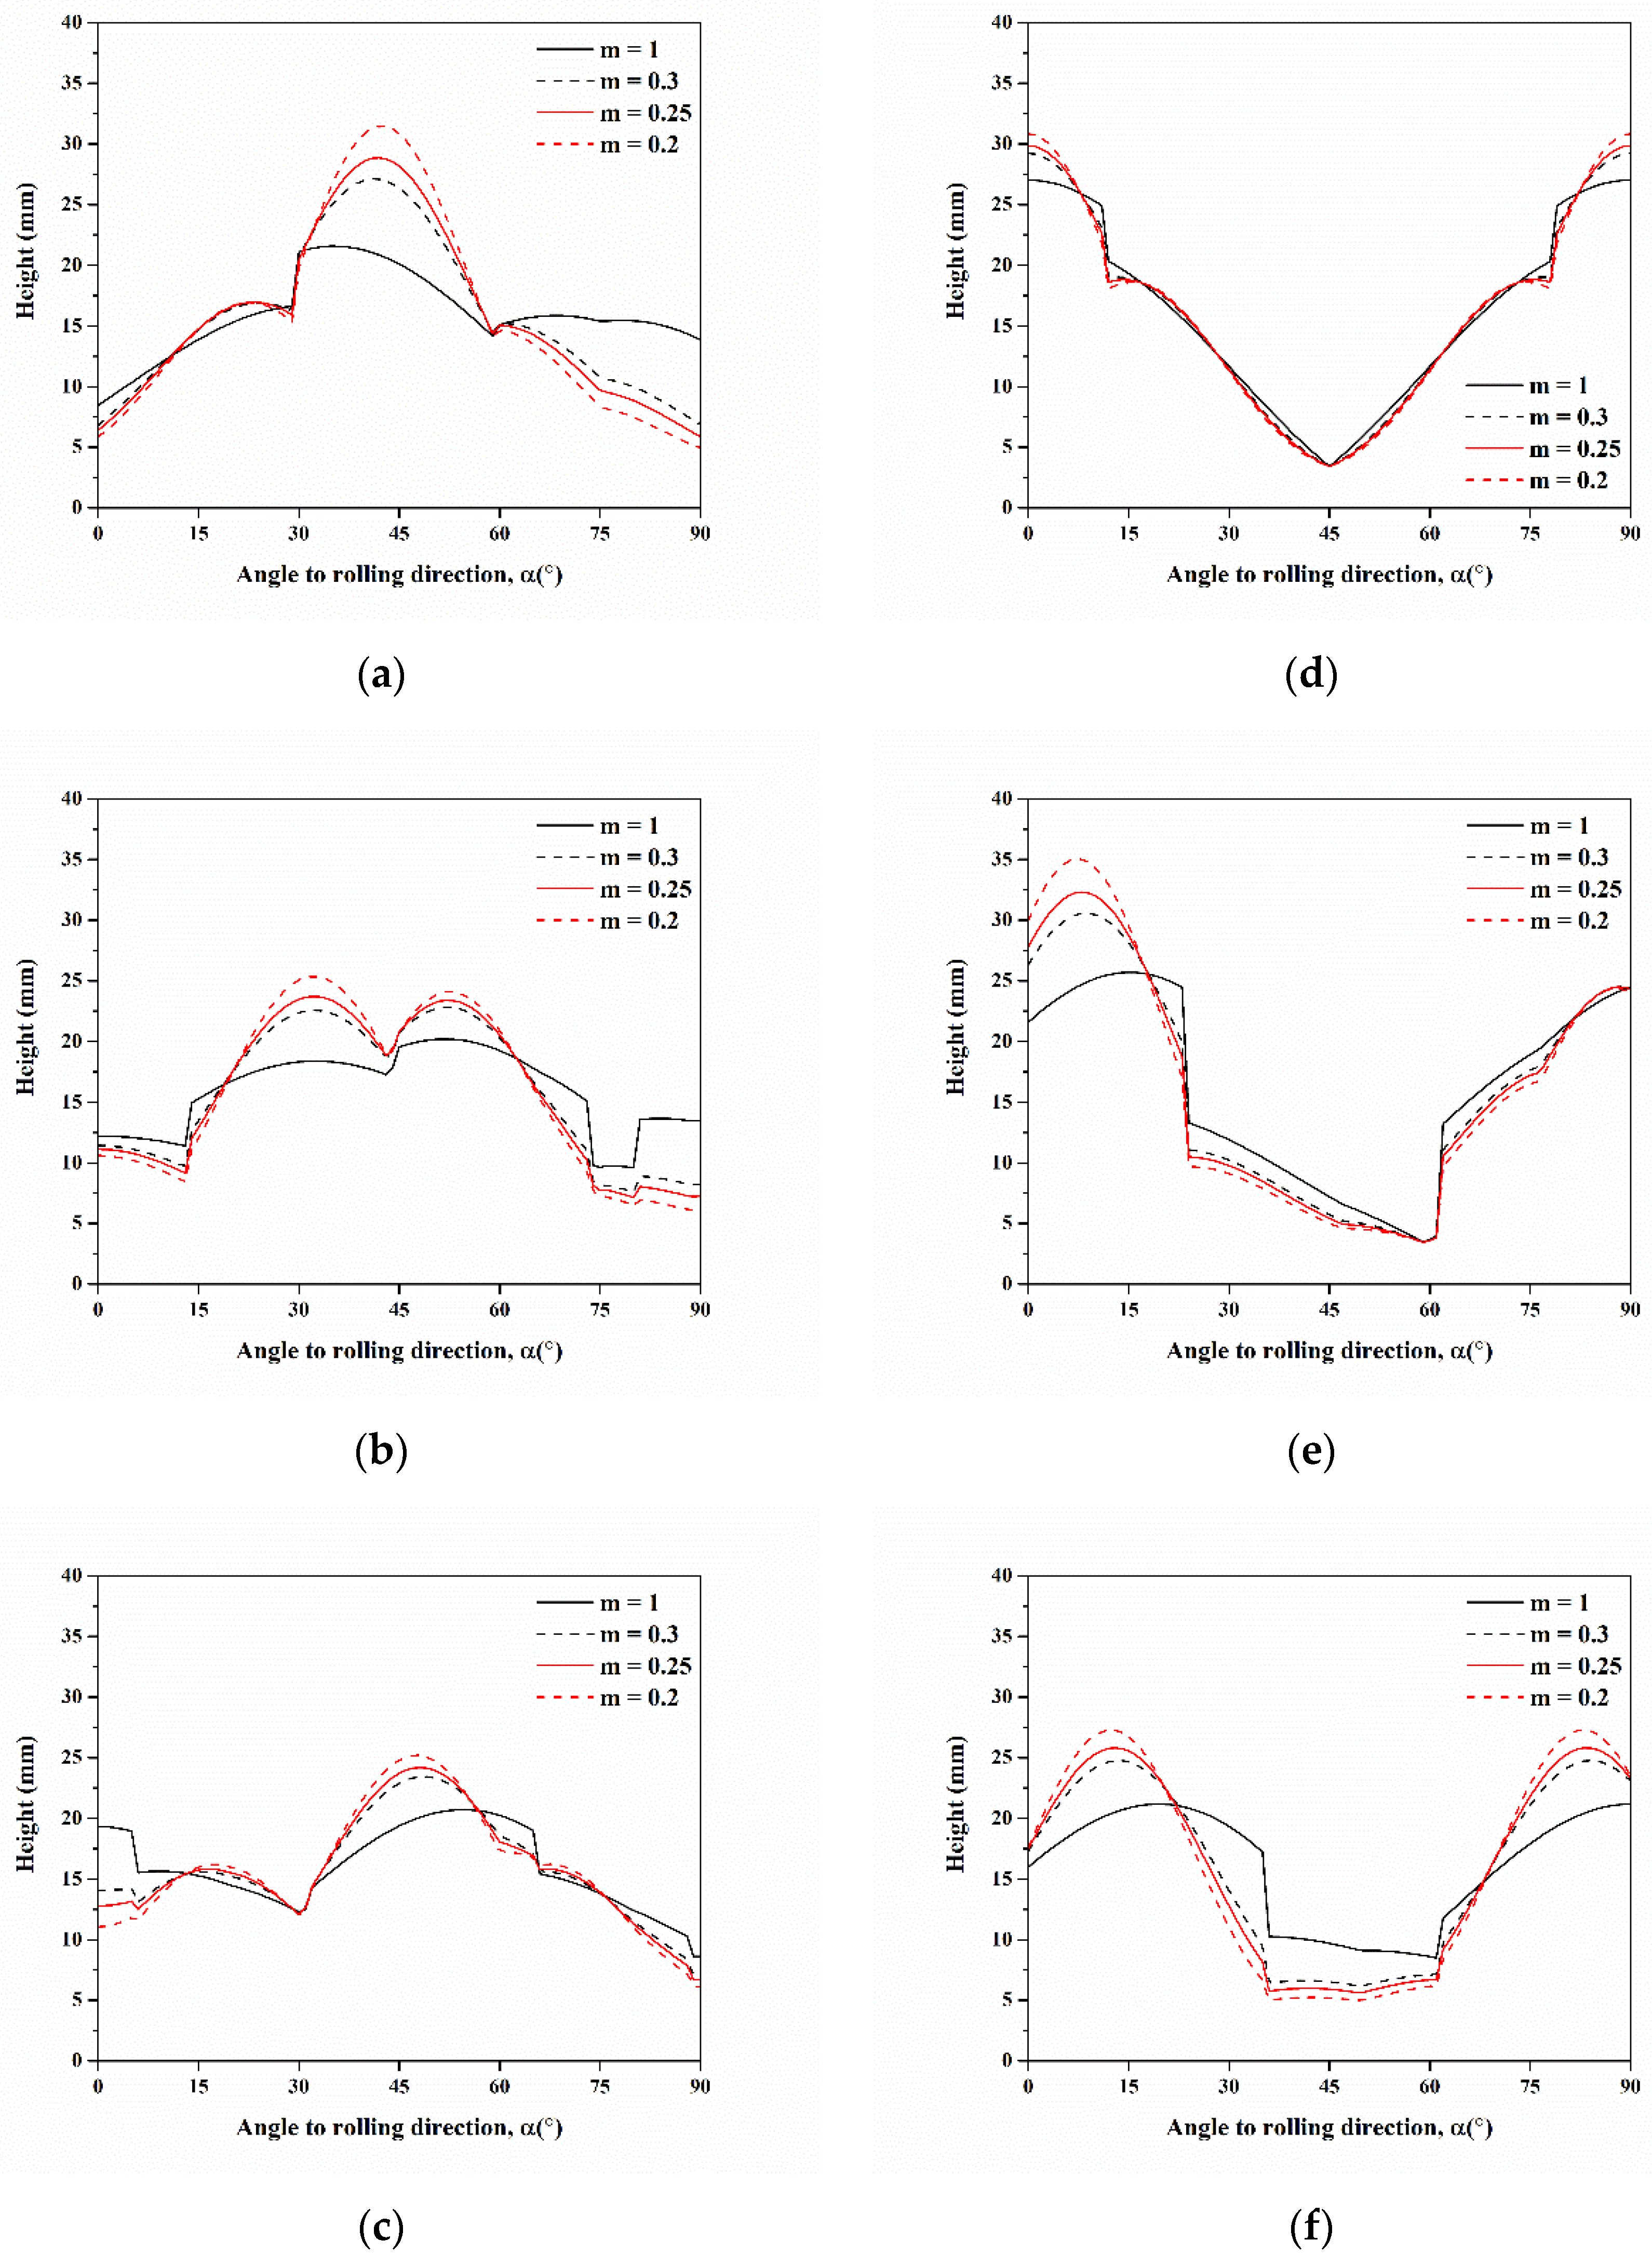
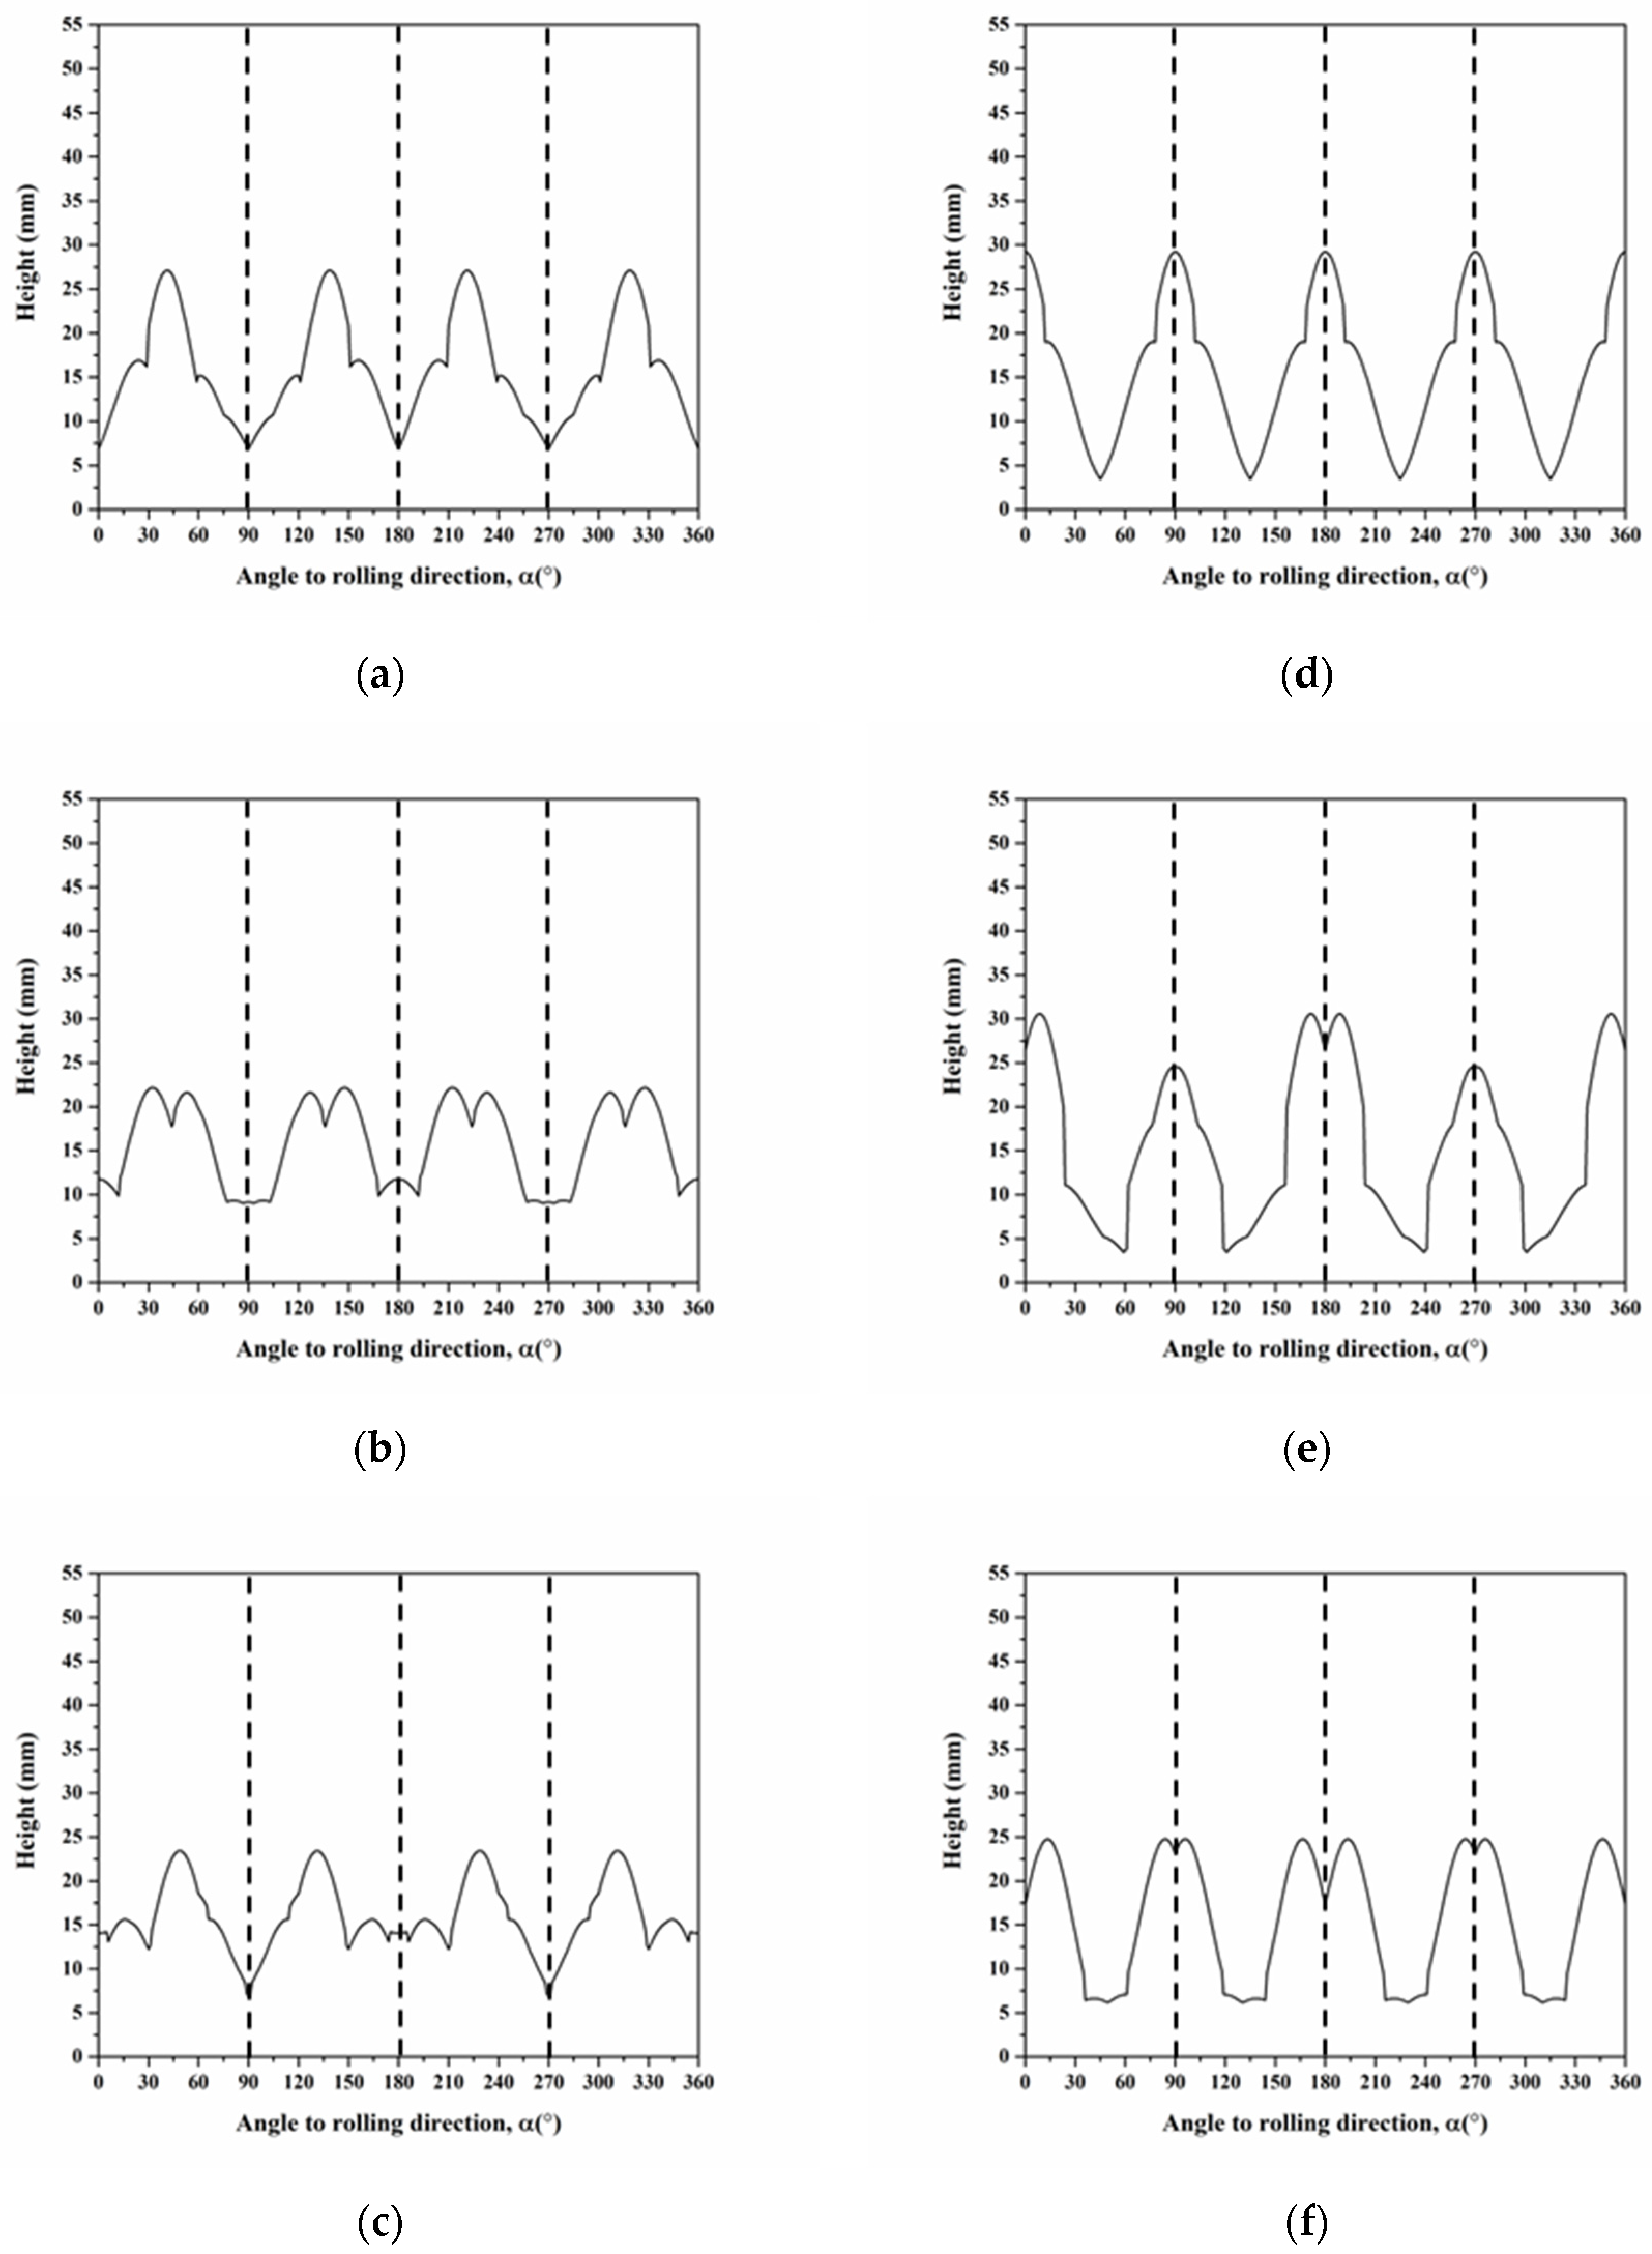
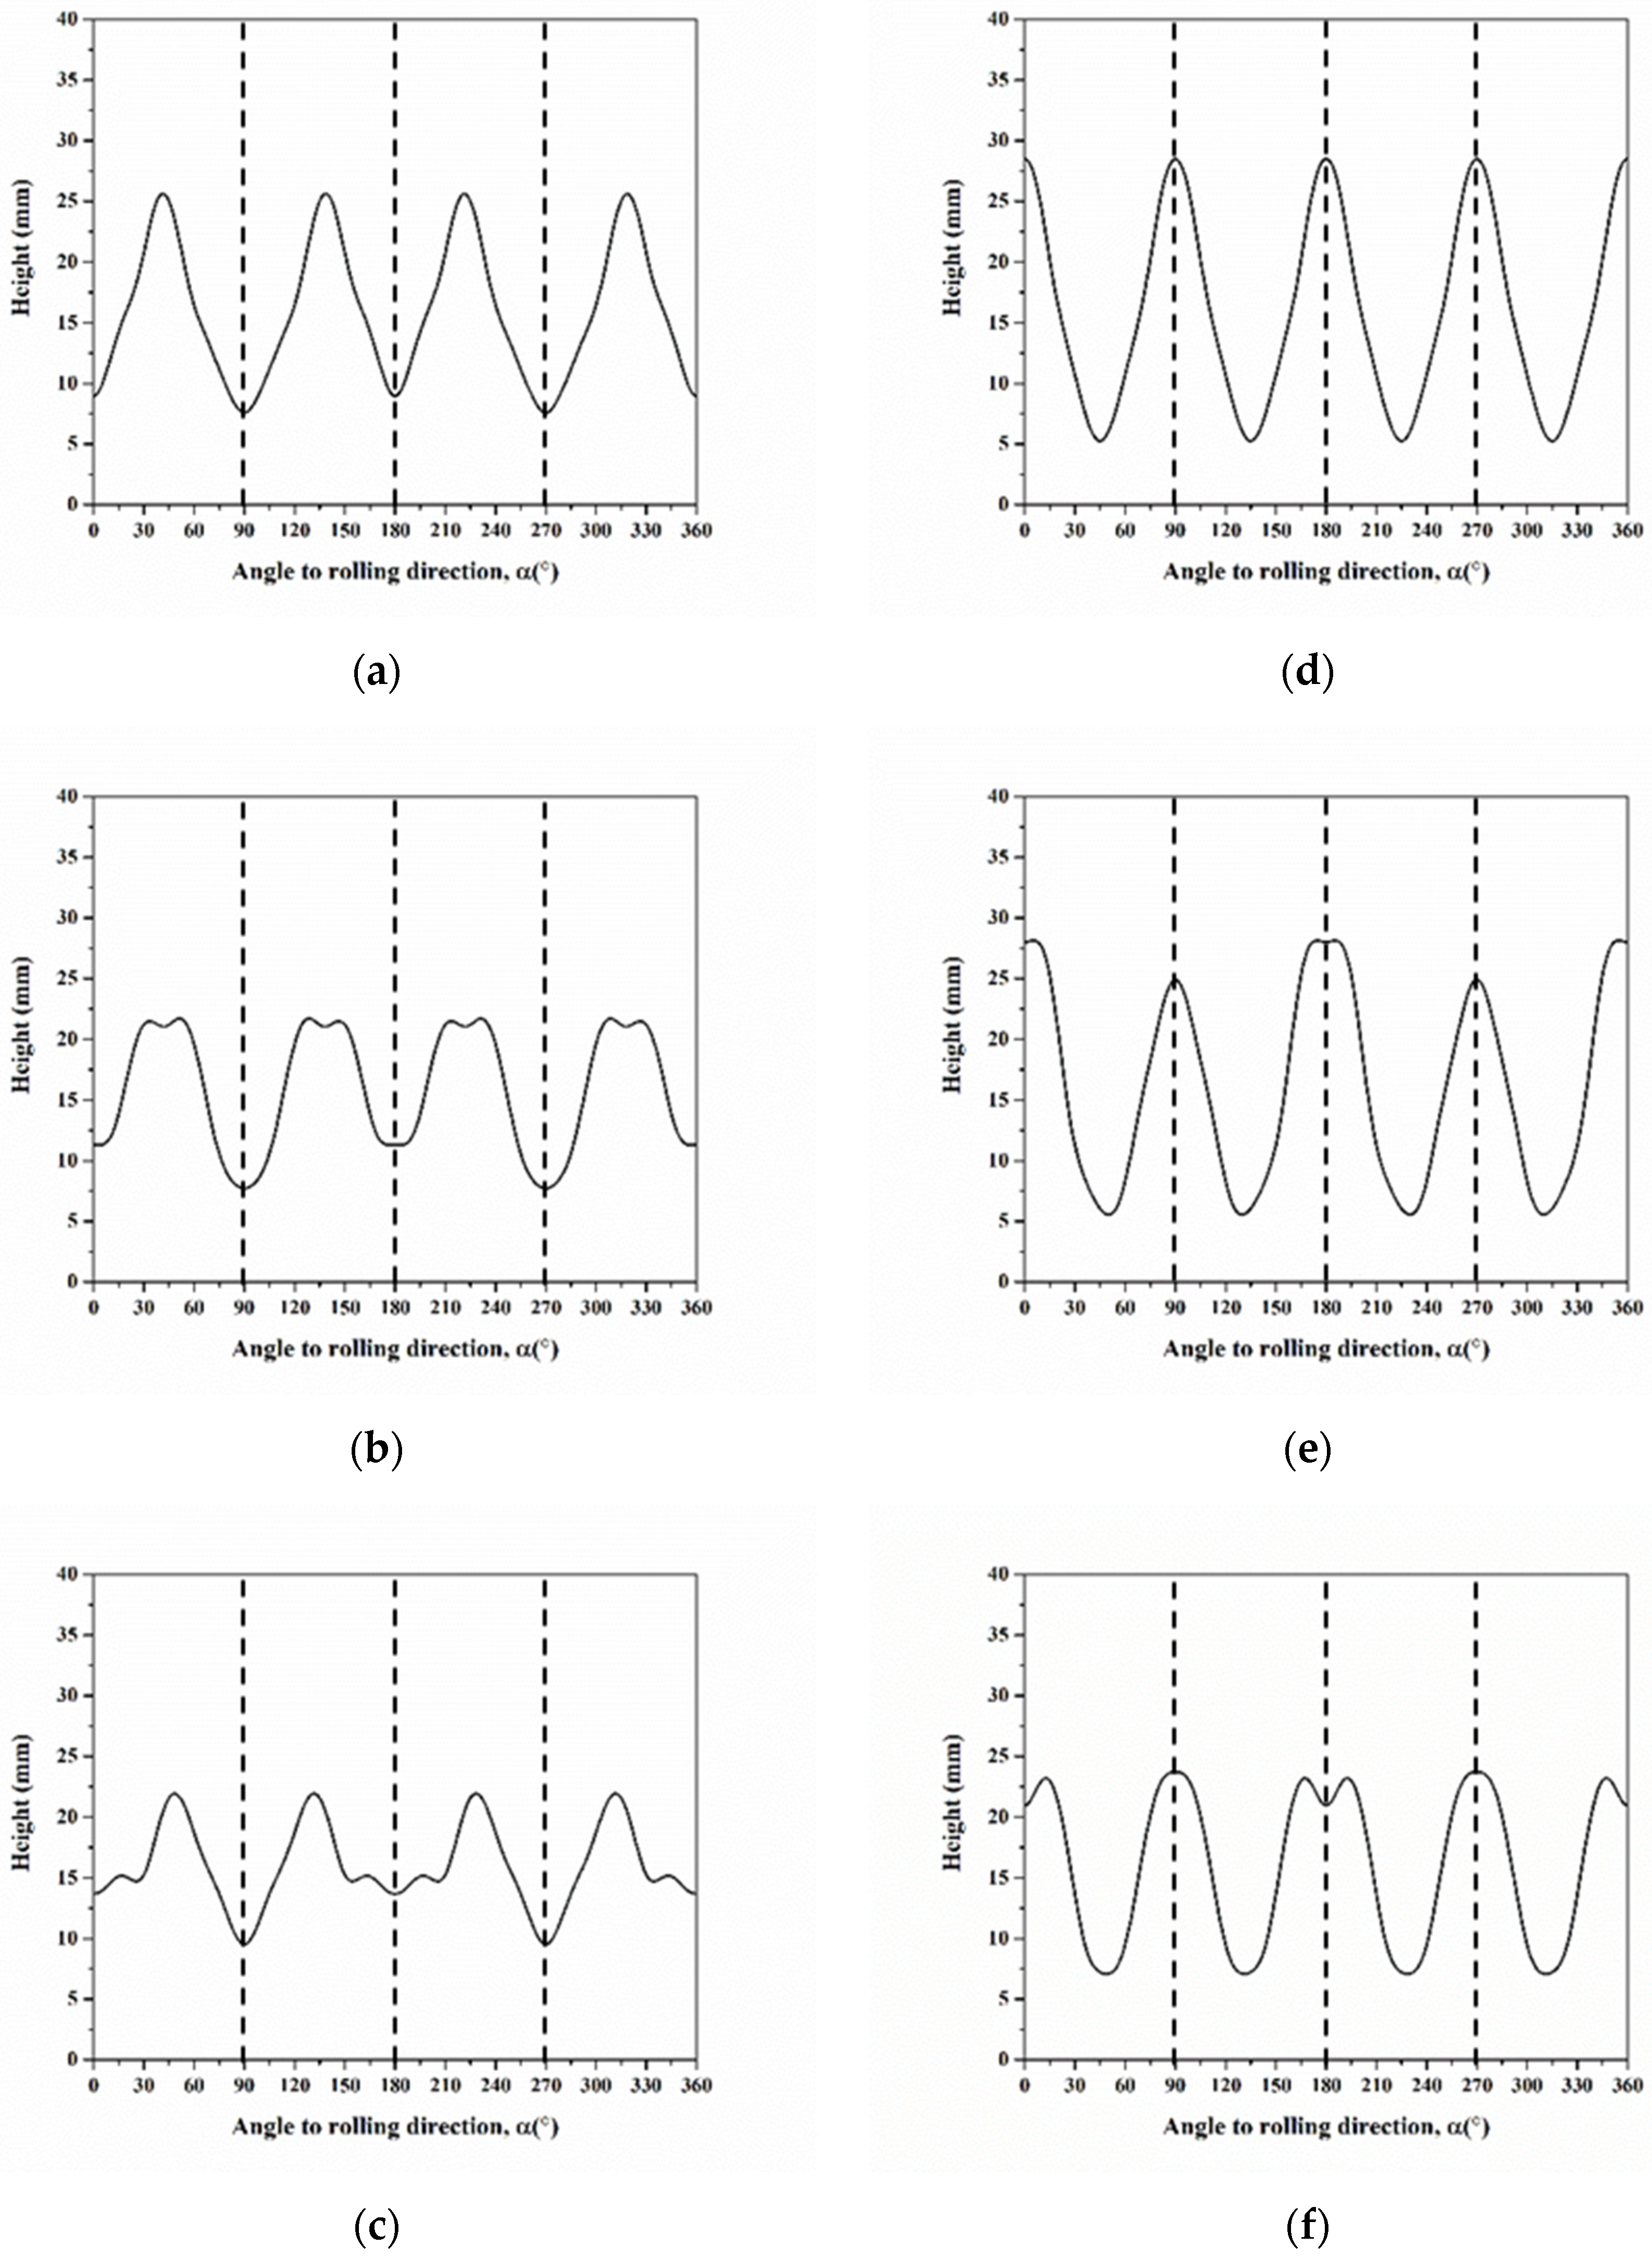
4.2. Effect of Activated Slip Systems on the Cup Height
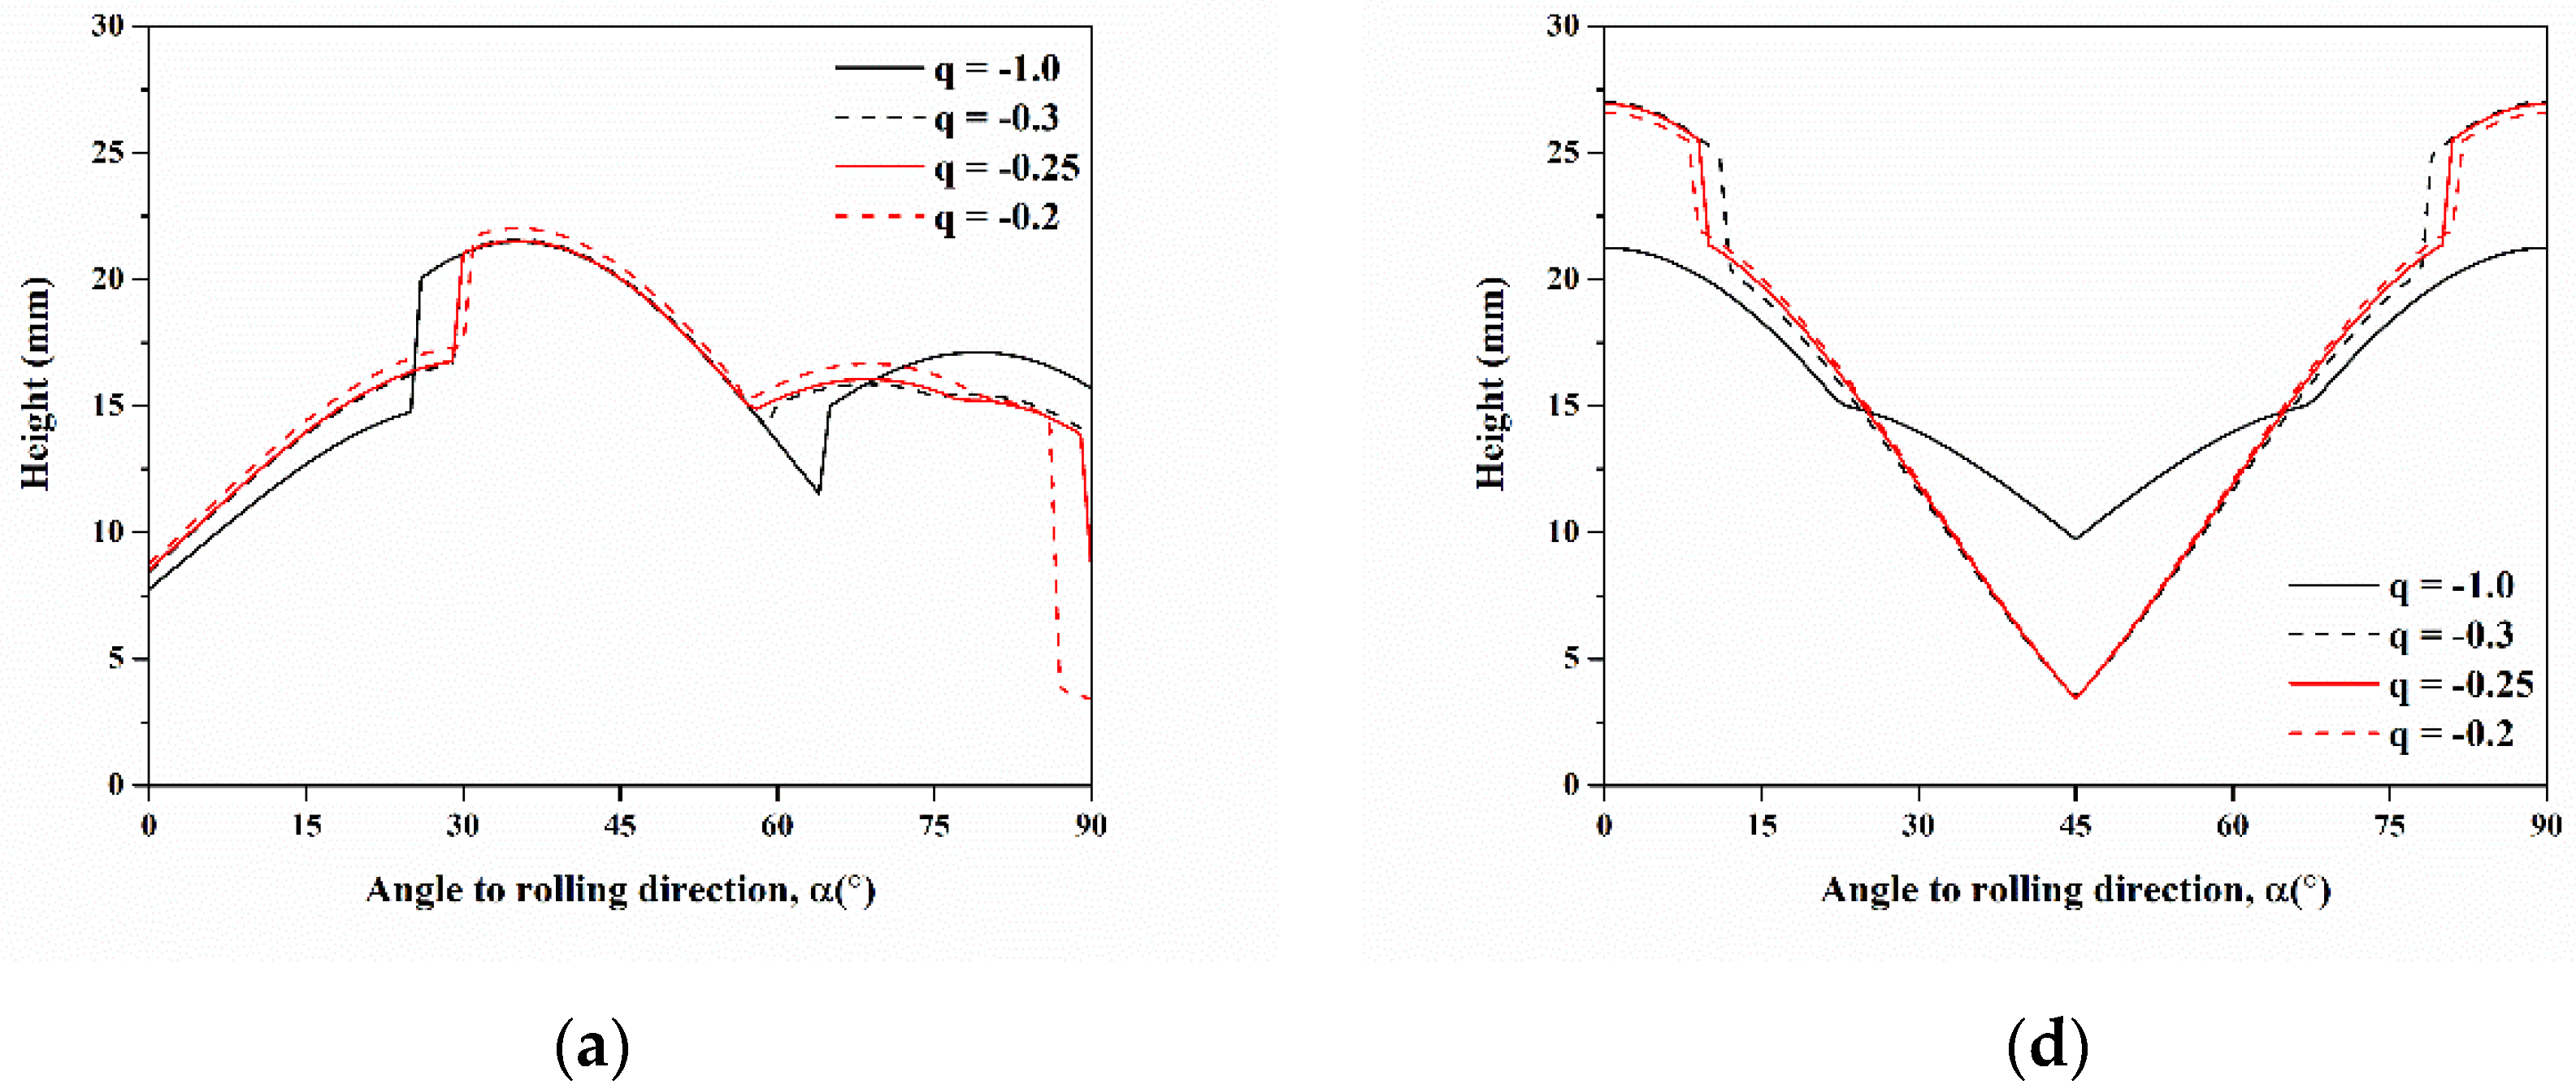
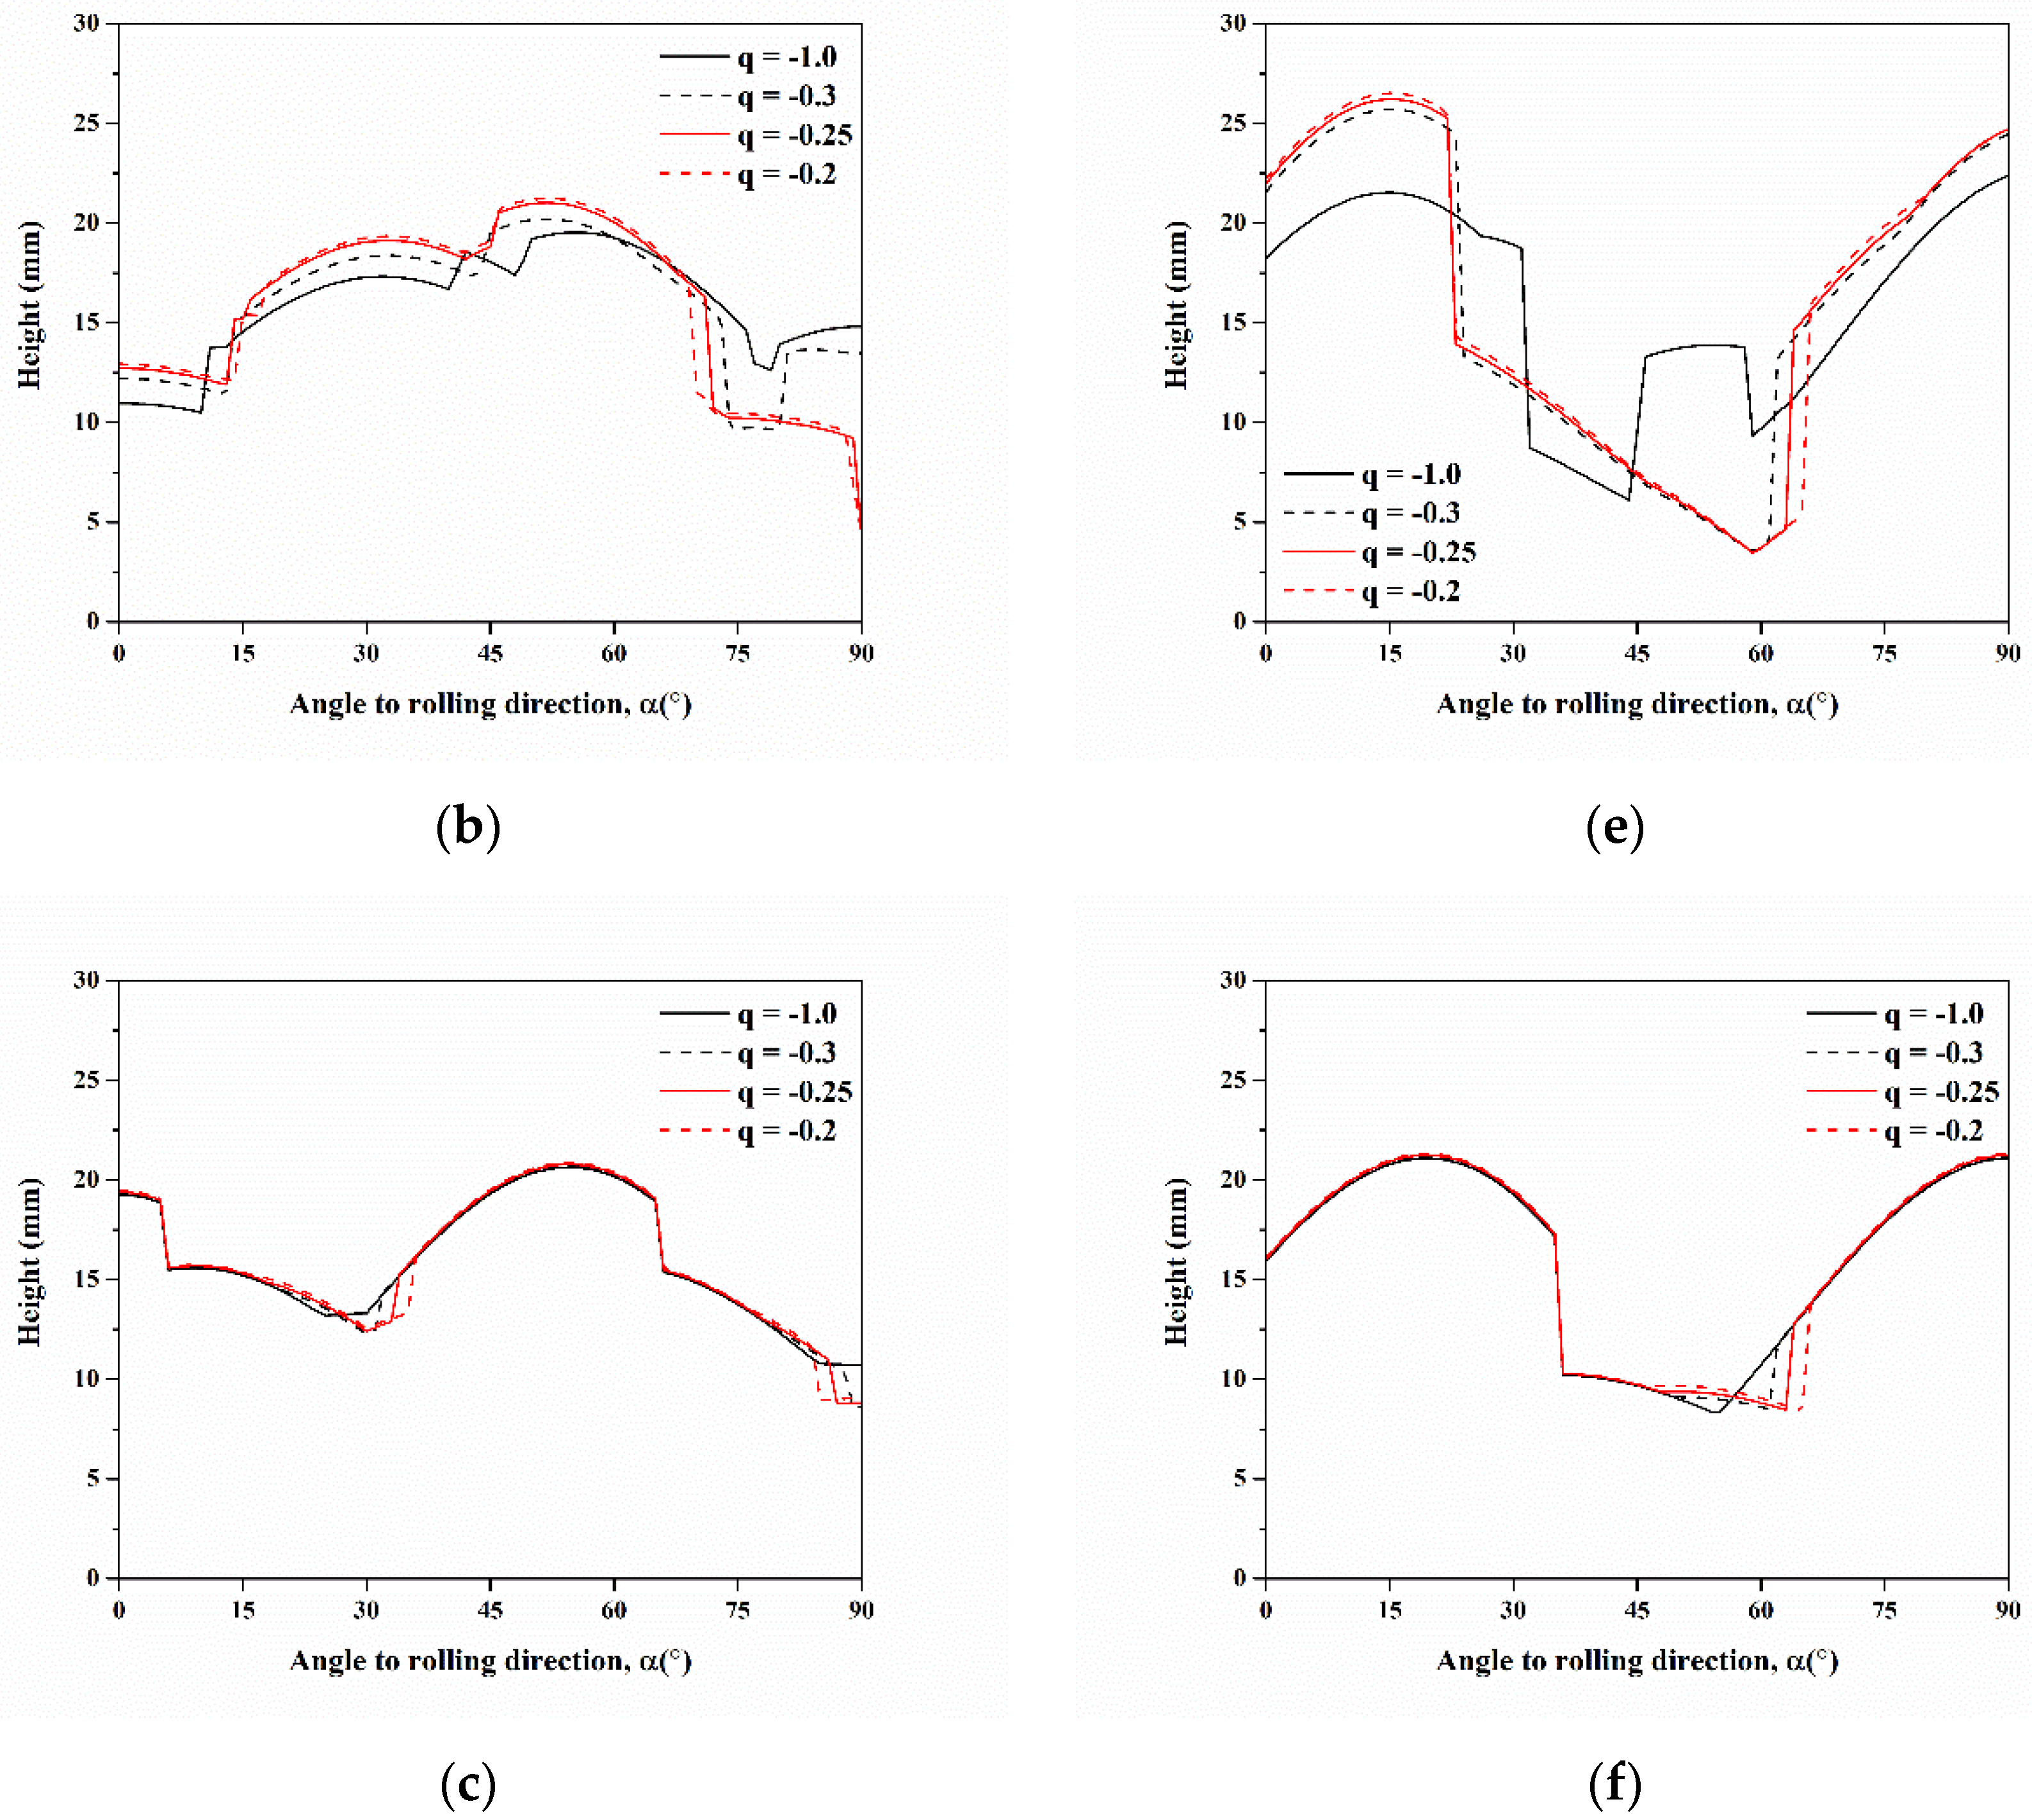
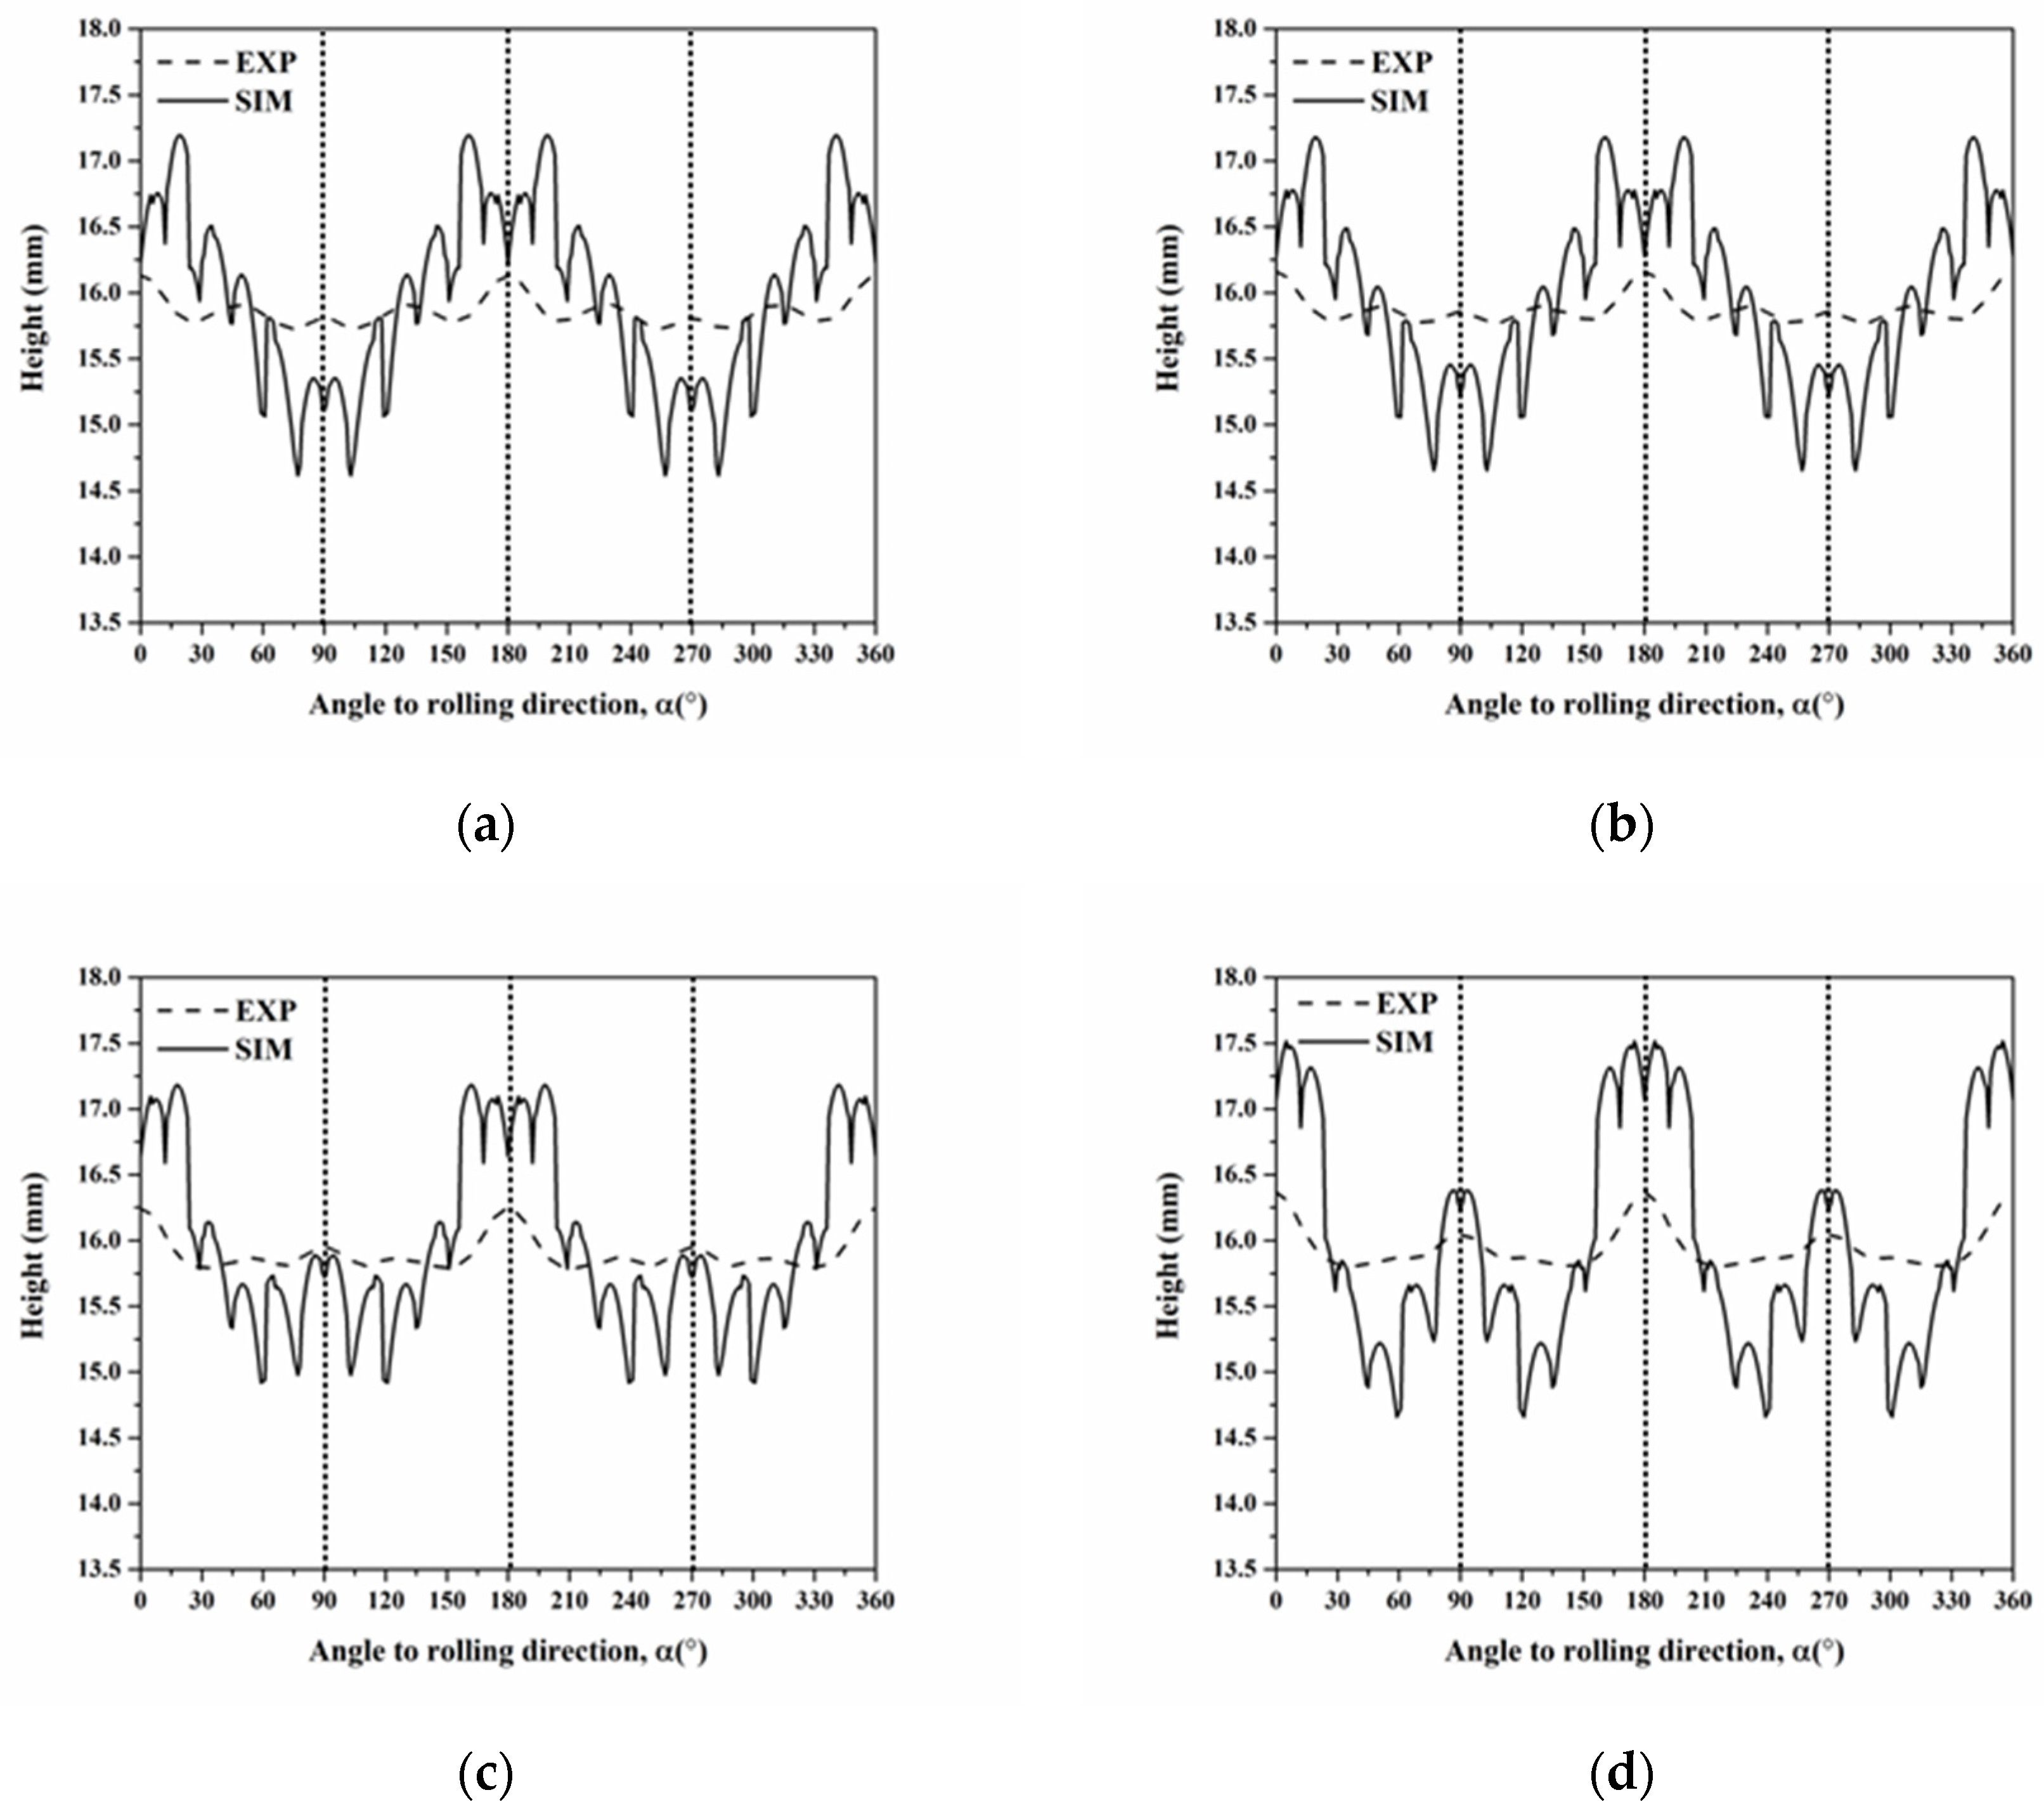
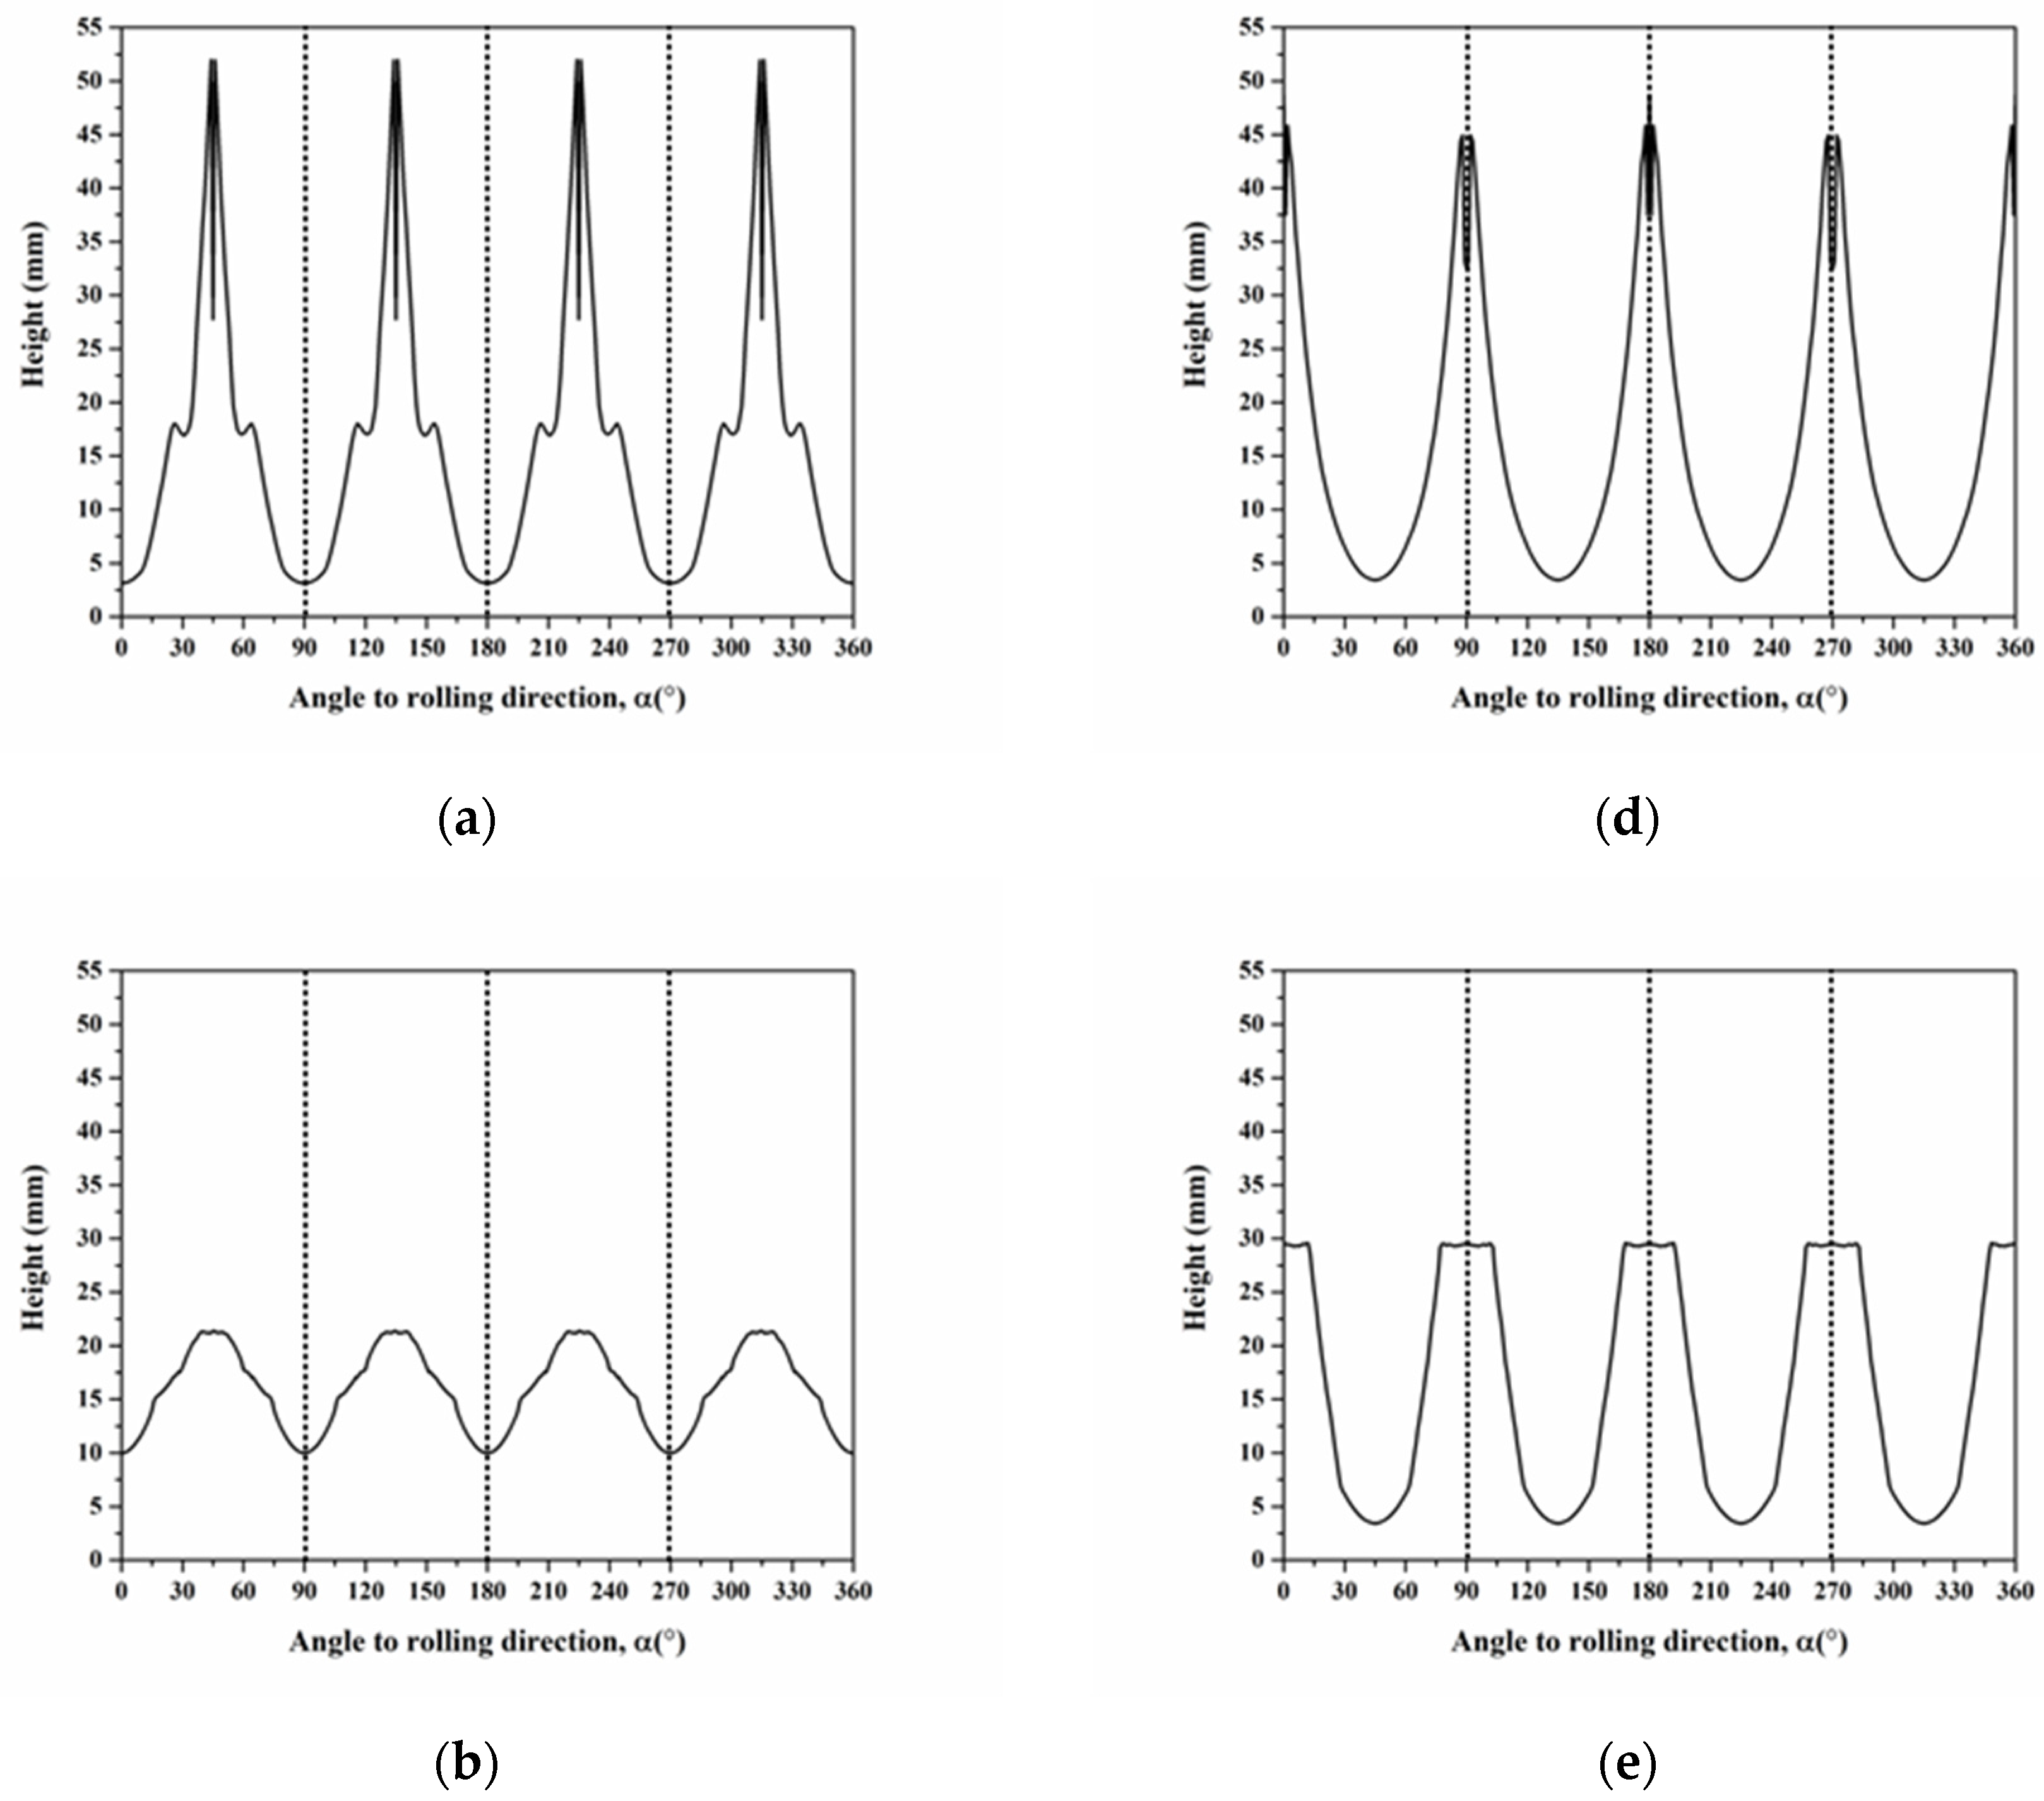
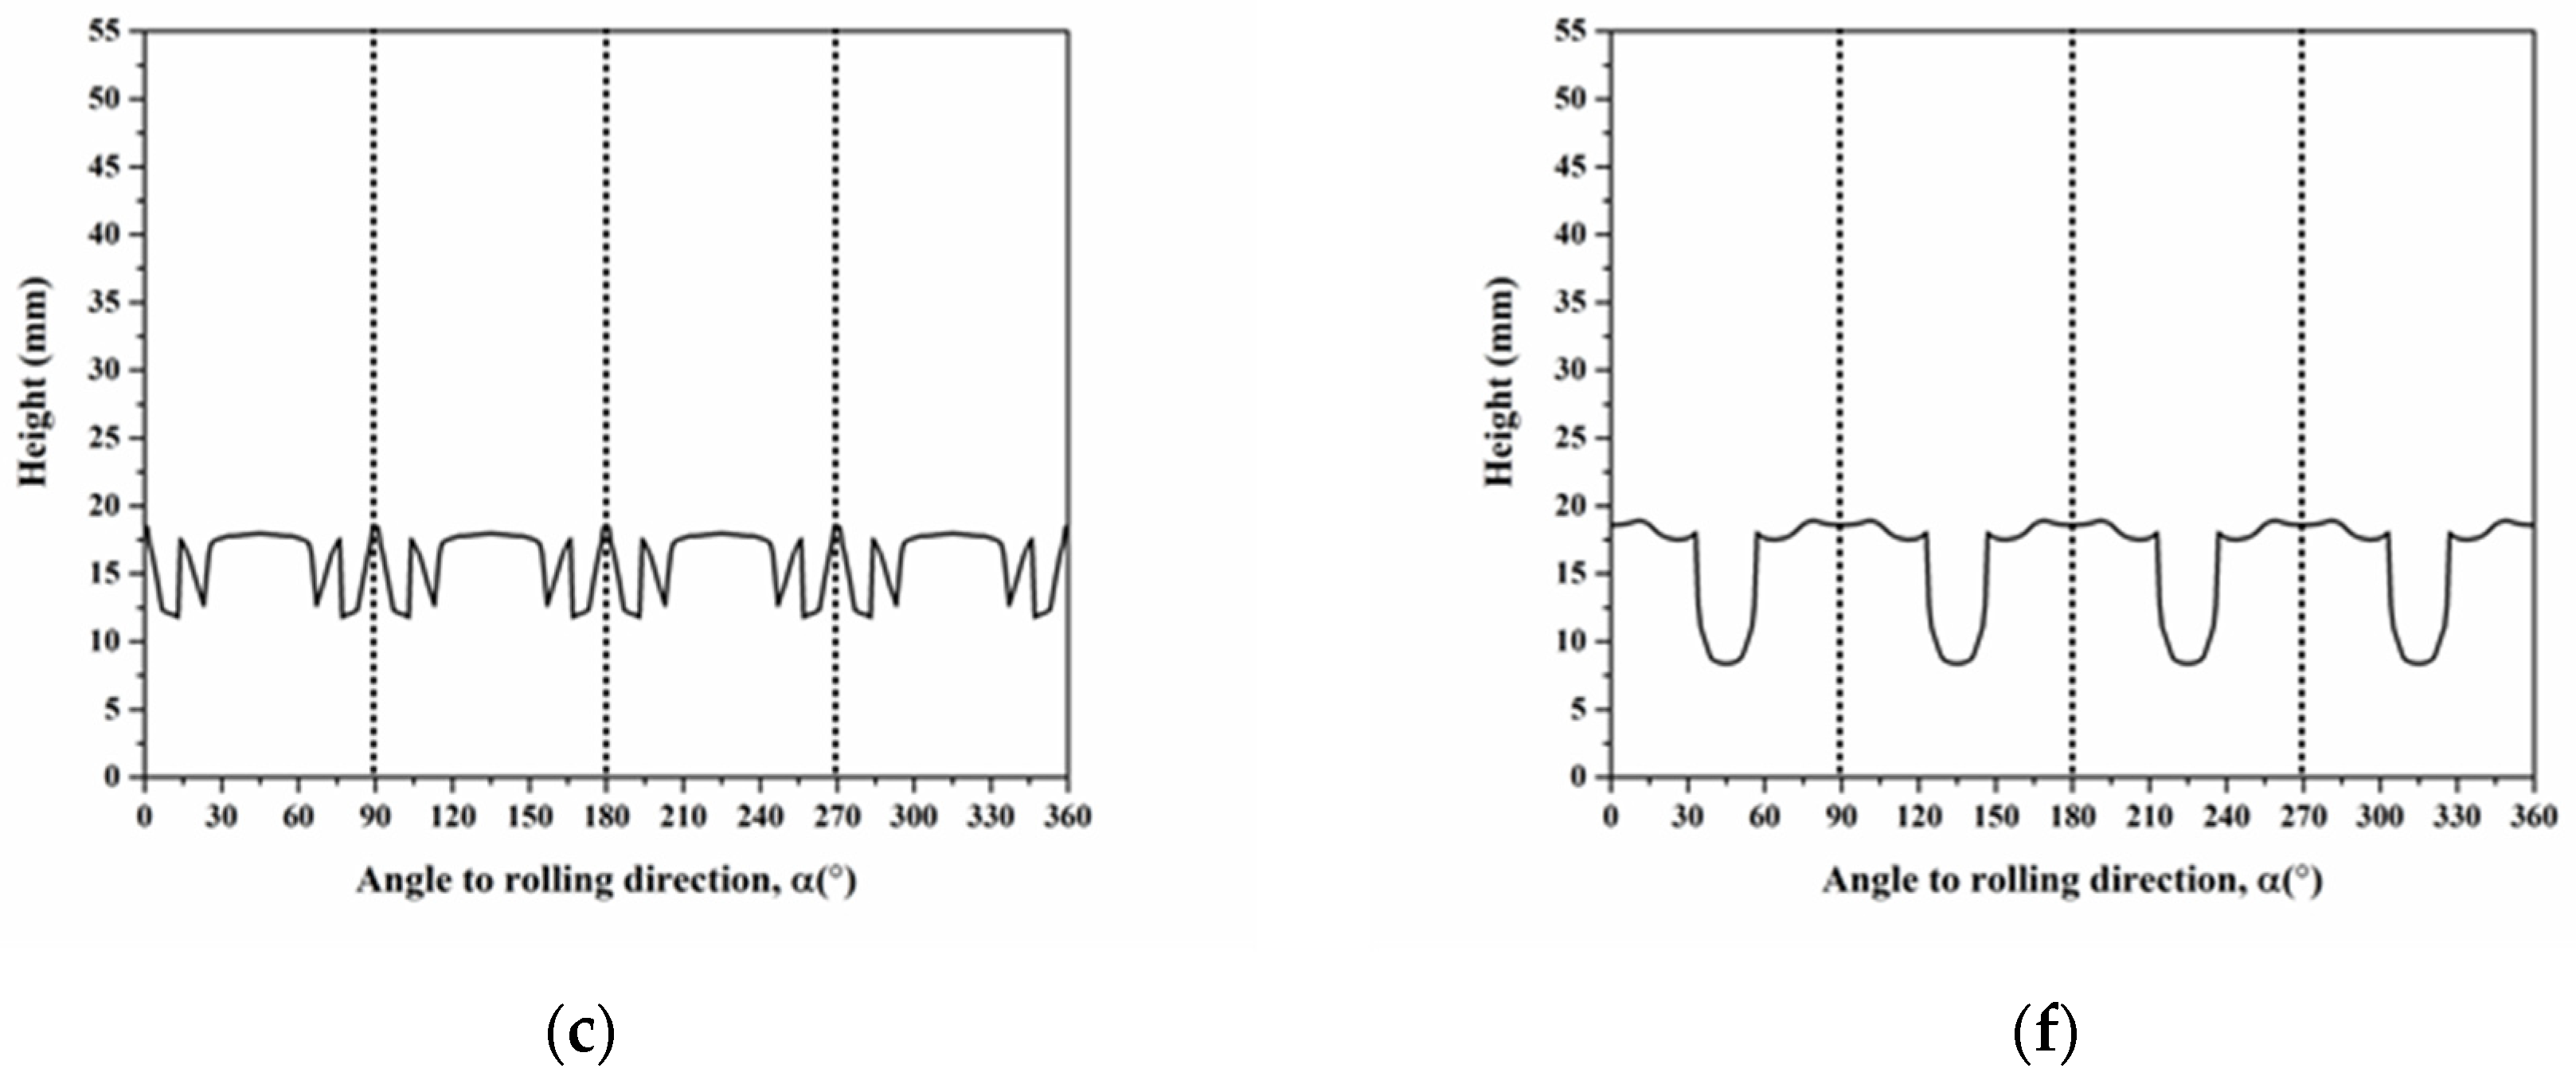
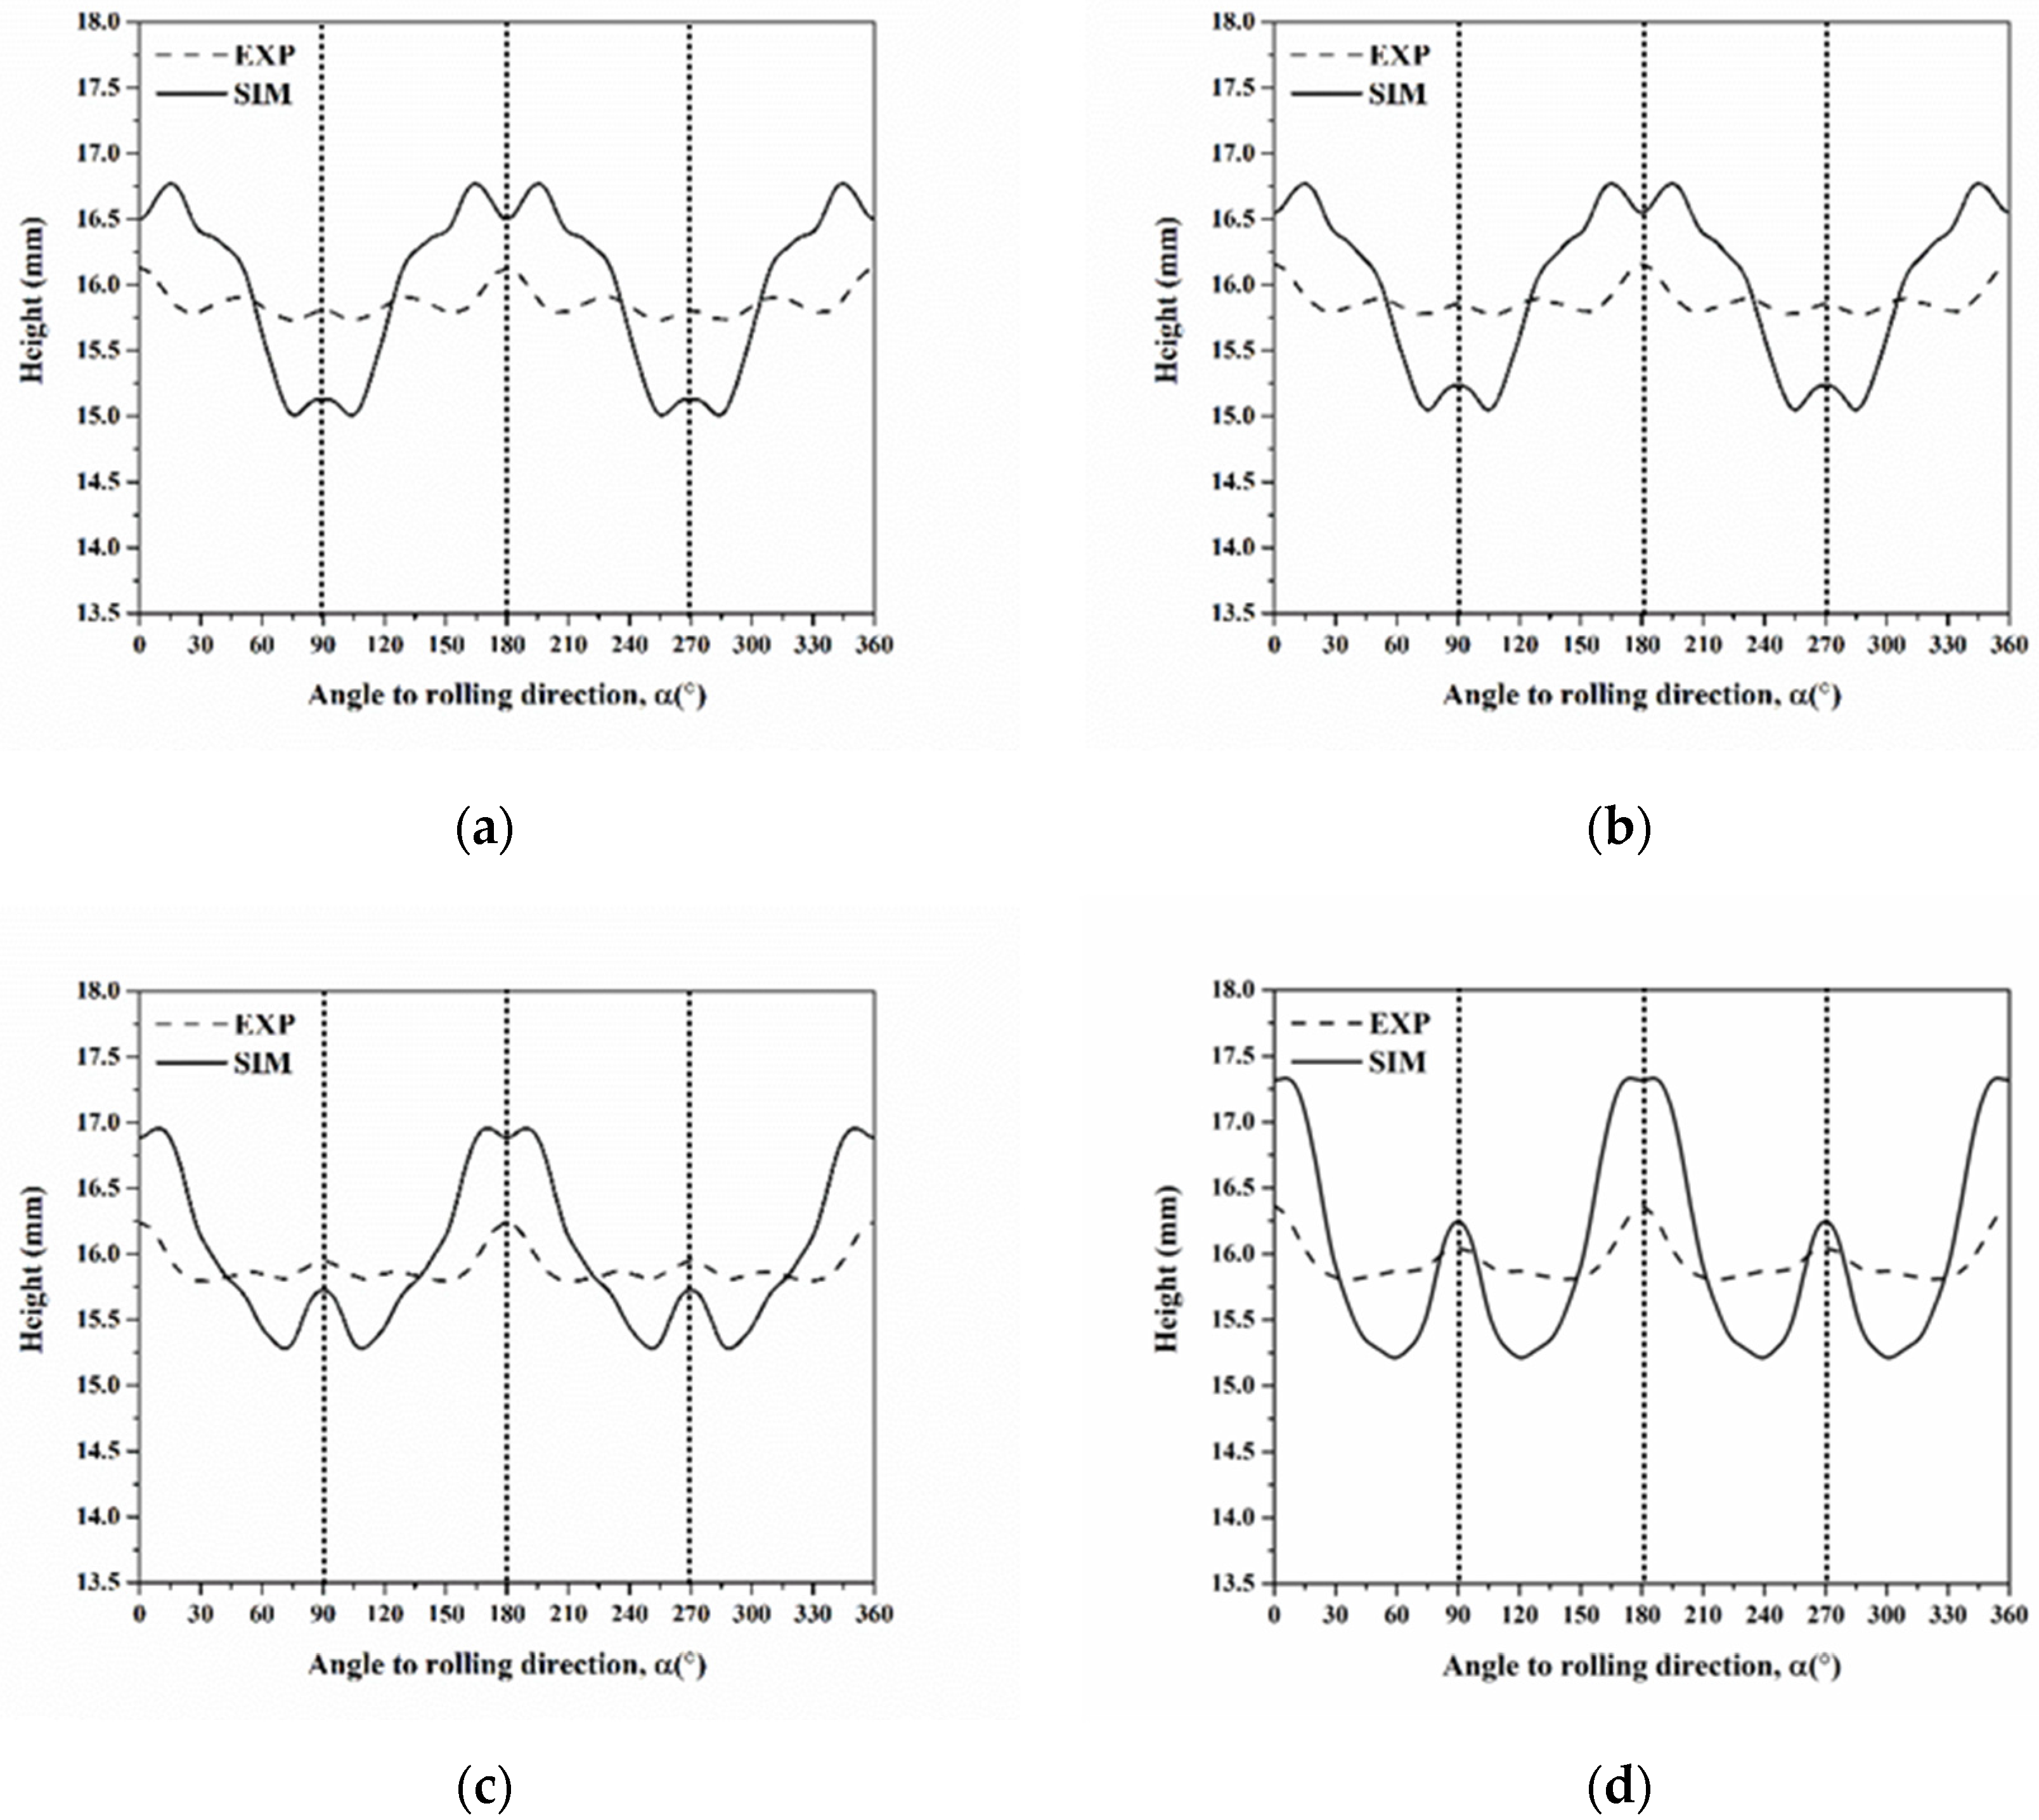
4.3. Effect of Orientation Spread on the Cup Height
5. Conclusions
Author Contributions
Funding
Institutional Review Board Statement
Informed Consent Statement
Data Availability Statement
Acknowledgments
Conflicts of Interest
References
- Hosford, W.F.; Duncan, J.L. The aluminum beverage can. Sci. Am. 1994, 271, 48–53. [Google Scholar] [CrossRef]
- Inal, K.; Wu, P.; Neale, K. Simulation of earing in textured aluminum sheets. Int. J. Plast. 2000, 16, 635–648. [Google Scholar] [CrossRef]
- Wilson, D. Controlled directionality of mechanical properties in sheet metals. Metall. Rev. 1969, 14, 175–188. [Google Scholar] [CrossRef]
- Krupkowski, A.; Kawinski, S. The Phenomenon of Anisotropy in Annealed Polycrystalline Metals. J. Inst. Met. 1949, 75, 869–880. [Google Scholar]
- Lankford, W. New criteria for predicting the press performance of deep drawing sheets. Trans. ASM 1950, 42, 1197–1232. [Google Scholar]
- Fukui, S.; Kudo, H. The earing in deep-drawing and directionality in tension-test of sheet metal. Rep. Inst. Sci. Tech. Univ. Tokyo 1950, 4, 33. [Google Scholar]
- Hill, R. A theory of the yielding and plastic flow of anisotropic metals. Proc. R. Soc. Lond. Ser. A Math. Phys. Sci. 1948, 193, 281–297. [Google Scholar]
- Barlat, F.; Lege, D.J.; Brem, J.C. A six-component yield function for anisotropic materials. Int. J. Plast. 1991, 7, 693–712. [Google Scholar] [CrossRef]
- Barlat, F.; Panchanadeeswaran, S.; Richmond, O. Earing in cup drawing face-centered cubic single crystals and polycrystals. Met. Mater. Trans. A 1991, 22, 1525–1534. [Google Scholar] [CrossRef]
- Barlat, F.; Maeda, Y.; Chung, K.; Yanagawa, M.; Brem, J.; Hayashida, Y.; Lege, D.; Matsui, K.; Murtha, S.; Hattori, S.; et al. Yield function development for aluminum alloy sheets. J. Mech. Phys. Solids 1997, 45, 1727–1763. [Google Scholar] [CrossRef]
- Barlat, F.; Aretz, H.; Yoon, J.; Karabin, M.; Brem, J.; Dick, R. Linear transfomation-based anisotropic yield functions. Int. J. Plast. 2005, 21, 1009–1039. [Google Scholar] [CrossRef]
- Yoon, J.; Barlat, F.; Chung, K.; Pourboghrat, F.; Yang, D. Influence of initial back stress on the earing prediction of drawn cups for planar anisotropic aluminum sheets. J. Mater. Process. Technol. 1998, 80–81, 433–437. [Google Scholar] [CrossRef]
- Yoon, J.; Barlat, F.; Chung, K.; Pourboghrat, F.; Yang, D. Earing predictions based on asymmetric nonquadratic yield function. Int. J. Plast. 2000, 16, 1075–1104. [Google Scholar] [CrossRef]
- Yoon, J.; Barlat, F.; Dick, R.; Karabin, M. Prediction of six or eight ears in a drawn cup based on a new anisotropic yield function. Int. J. Plast. 2006, 22, 174–193. [Google Scholar] [CrossRef]
- Zhang, S.; Jensen, M.; Danckert, J.; Nielsen, K.; Kang, D.; Lang, L. Analysis of the hydromechanical deep drawing of cylindrical cups. J. Mater. Process. Technol. 2000, 103, 367–373. [Google Scholar] [CrossRef]
- Salehinia, I.; Shahani, A. Effect of sheet anisotropy on the wear in deep-drawing process of a cylindrical cup. Int. J. Mech. Sci. 2009, 51, 856–868. [Google Scholar] [CrossRef]
- Lequeu, P. Earing control and deformation processing of aluminium alloys. Texture Stress Microstruct. 1991, 14, 1019–1024. [Google Scholar] [CrossRef] [Green Version]
- Kanetake, N.; Tozawa, Y.; Otani, T. Calculations from texture of earing in deep drawing for fcc metal sheets. Int. J. Mech. Sci. 1983, 25, 337–345. [Google Scholar] [CrossRef]
- Hu, J.; Marciniak, Z.; Duncan, J. Mechanics of Sheet Metal Forming; Butterworth-Heinemann: Oxford, UK, 2002. [Google Scholar]
- Tucker, G. Texture and earing in deep drawing of aluminium. Acta Metall. 1961, 9, 275–286. [Google Scholar] [CrossRef]
- Lin, D.; Daniel, D.; Jonas, J. Simulation of earing in textured materials. Mater. Sci. Eng. A 1991, 131, 161–170. [Google Scholar] [CrossRef]
- Li, S.; Zhang, X.; Zhou, H.; Gottstein, G. Crystallographic analysis of the influence of stress state on earing behavior in deep drawing of face-centered cubic metals. Metall. Mater. Trans. A 1997, 28, 785–793. [Google Scholar] [CrossRef]
- Hu, J.; Ishikawa, T.; Ikeda, K. Analysis on earing behavior of textured pure aluminum and A5083 alloy sheets. J. Mater. Process. Technol. 1998, 83, 200–208. [Google Scholar] [CrossRef]
- Clarke, A.; Van Houtte, P.; Saimoto, S. A Quantitative Analysis of Earing during Deep Drawing of Tin Plate Steel and Aluminum. in Materials Science Forum. Trans. Tech. Publ. 1994, 157, 1953–1960. [Google Scholar]
- Yoon, J.; Cazacu, O. Anisotropic yield function capable of predicting eight ears. AIP Conf. Proc. 2011, 1383, 6–91. [Google Scholar]
- Chung, K.; Kim, D.; Park, T. Analytical derivation of earing in circular cup drawing based on simple tension properties. Eur. J. Mech.-A/Solids 2011, 30, 275–280. [Google Scholar] [CrossRef]
- Baldwin, W.; Howald, T.; Ross, A. Relative triaxial deformation rates. Met. Technol. 1945, 12, 1–24. [Google Scholar]
- Roberts, W. Texture control in sheet metal. Sheet Metal Ind. 1966, 43, 237–245. [Google Scholar]
- Da Costa Viana, C.; Davies, G.; Kallend, J. The prediction of earing behavior and formability limits from texture data. Textures Mater. 1978, 2, 447–453. [Google Scholar]
- Rodrigues, P.; Bate, P. Textures in Non-Ferrous Metals and Alloys; TMS: Warrendale, PA, USA, 1985; p. 173. [Google Scholar]
- Van Houtte, P.; Cauwenberg, G.; Aernoudt, E. Analysis of the earing behaviour of aluminium 3004 alloys by means of a single model based on yield loci calculated from orientation distribution functions. Mater. Sci. Eng. 1987, 95, 115–124. [Google Scholar] [CrossRef]
- Benke, M.; Hlavacs, A.; Petho, D.; Angel, D.; Sepsi, M.; Nagy, E.; Mertinger, V. A simple correlation between texture and earing. IOP Conf. Ser. Mater. Sci. Eng. 2018, 426, 012003. [Google Scholar] [CrossRef]
- Benke, M.; Schweitzer, B.; Hlavacs, A.; Mertinger, V. Prediction of earing of cross-rolled Al sheets from {h00} pole figures. Metals 2020, 10, 192. [Google Scholar] [CrossRef] [Green Version]
- Saimoto, S.; Van Houtte, P.; Reesor, D.; Clarke, P. Textural evolution during draw-cup tests of thick aluminum 3004 alloy sheet. Textures Microstruct. 1991, 14, 1233–1238. [Google Scholar] [CrossRef] [Green Version]
- Delikanli, K. The Effects of Annealing Parameters on Earing for Aluminum Alloy. Yekarum 2014, 2, 15–19. [Google Scholar]
- Humphreys, F.J.; Hatherly, M. Recrystallization and Related Annealing Phenomena; Elsevier: Amsterdam, The Netherlands, 2012. [Google Scholar]
- Engler, O.; Hirsch, J. Polycrystal-plasticity simulation of six and eight ears in deep-drawn aluminum cups. Mater. Sci. Eng. A 2007, 452, 640–651. [Google Scholar] [CrossRef]
- Engler, O.; Aegerter, J. Texture and anisotropy in the Al–Mg alloy AA 5005–Part II: Correlation of texture and anisotropic properties. Mater. Sci. Eng. A 2014, 618, 663–671. [Google Scholar] [CrossRef]
- Association, L.M.R.I. Standardization of a testing method on work-hardening exponent and plastic anisotropy coefficient of aluminum and aluminum alloy sheet. J. Jpn. Inst. Light Met. 1977, 27, 348–364. [Google Scholar]
- Van Houtte, P. A comprehensive mathematical formulation of an extended Taylor–Bishop–Hill model featuring relaxed constraints, the Renouard–Wintenberger theory and a strain rate sensitivity model. Texture Stress Microstruct. 1988, 8, 313–350. [Google Scholar] [CrossRef]


| Alloy | Si | Fe | Cu | Mn | Mg | Cr | Zn | Ti | Al |
|---|---|---|---|---|---|---|---|---|---|
| AA5151 | 0.2 | 0.35 | 0.15 | 0.1 | 1.50–2.10 | 0.1 | 0.15 | 0.1 | Bal. |
| Radius of blank () | 27.50 |
| Thickness of blank () | 0.25 |
| Radius of Punch () | 16.50 |
| Radius of punch profile () | 3.18 |
| Radius of die () | 16.83 |
| Radius of die entry () | 2.50 |
| Texture Component | Miller Index |
|---|---|
| C | {2 2 5}<5 5 4> |
| S | {1 2 4}<2 1 1> |
| B | {0 1 1}<5 2 2> |
| Cube | {0 0 1}<1 0 0> |
| r-Cube | {0 4 11}<1 0 0> |
| G | {0 1 1}<1 0 0> |
| Time (h) | C | S | B | Cube | r-Cube | G | Earing Ratio |
|---|---|---|---|---|---|---|---|
| 0.5 | 8.5 | 18.4 | 8.7 | 6.7 | 10 | 2.6 | 0.48 |
| 1 | 8.7 | 18.2 | 7.8 | 7.4 | 9.6 | 2.6 | 0.9 |
| 2 | 7.1 | 15.2 | 7.1 | 8 | 9.6 | 2.5 | 1.62 |
| 3 | 6.4 | 13.6 | 6.4 | 9.7 | 10 | 2.9 | 2.36 |
Disclaimer/Publisher’s Note: The statements, opinions and data contained in all publications are solely those of the individual author(s) and contributor(s) and not of MDPI and/or the editor(s). MDPI and/or the editor(s) disclaim responsibility for any injury to people or property resulting from any ideas, methods, instructions or products referred to in the content. |
© 2023 by the authors. Licensee MDPI, Basel, Switzerland. This article is an open access article distributed under the terms and conditions of the Creative Commons Attribution (CC BY) license (https://creativecommons.org/licenses/by/4.0/).
Share and Cite
Hsiao, S.-C.; Li, C.-Y.; Chang, C.-I.; Tseng, T.-Y.; Pan, Y.-T.; Kuo, J.-C. Correlation between Orientation Spread and Ear Forming of As-Annealed AA5151 Aluminum Alloy. Materials 2023, 16, 2408. https://doi.org/10.3390/ma16062408
Hsiao S-C, Li C-Y, Chang C-I, Tseng T-Y, Pan Y-T, Kuo J-C. Correlation between Orientation Spread and Ear Forming of As-Annealed AA5151 Aluminum Alloy. Materials. 2023; 16(6):2408. https://doi.org/10.3390/ma16062408
Chicago/Turabian StyleHsiao, Shih-Chieh, Chia-Yu Li, Chih-I Chang, Tien-Yu Tseng, Yeong-Tsuen Pan, and Jui-Chao Kuo. 2023. "Correlation between Orientation Spread and Ear Forming of As-Annealed AA5151 Aluminum Alloy" Materials 16, no. 6: 2408. https://doi.org/10.3390/ma16062408