
Estimation of Shear Modulus and Hardness of High-Entropy Alloys Made from Early Transition Metals Based on Bonding Parameters

Abstract
:1. Introduction
2. Materials and Methods
3. Results and Discussion
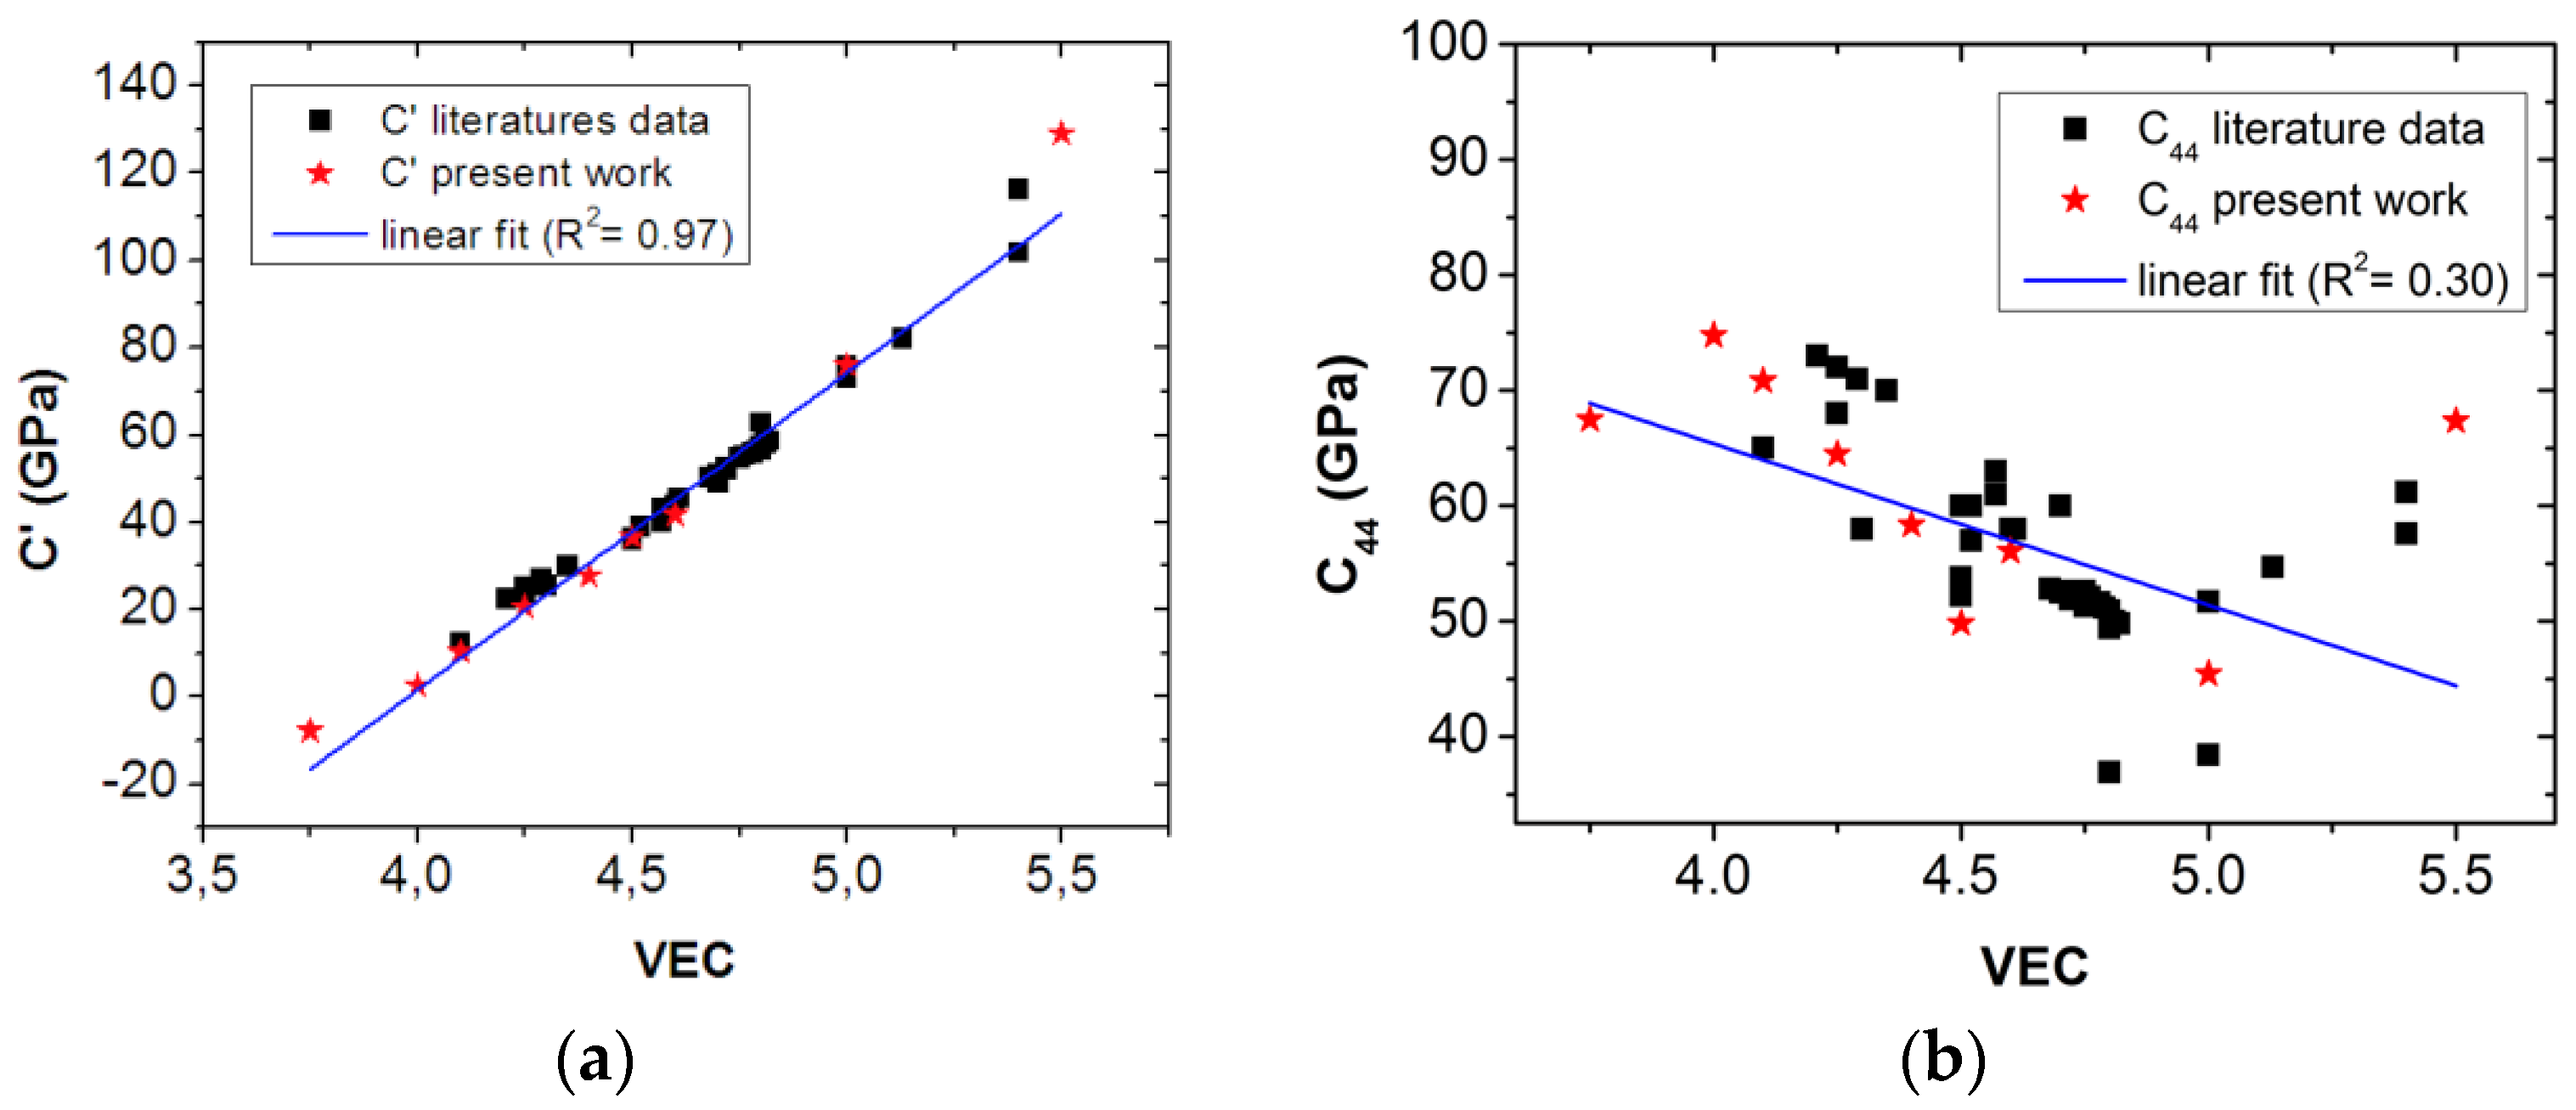
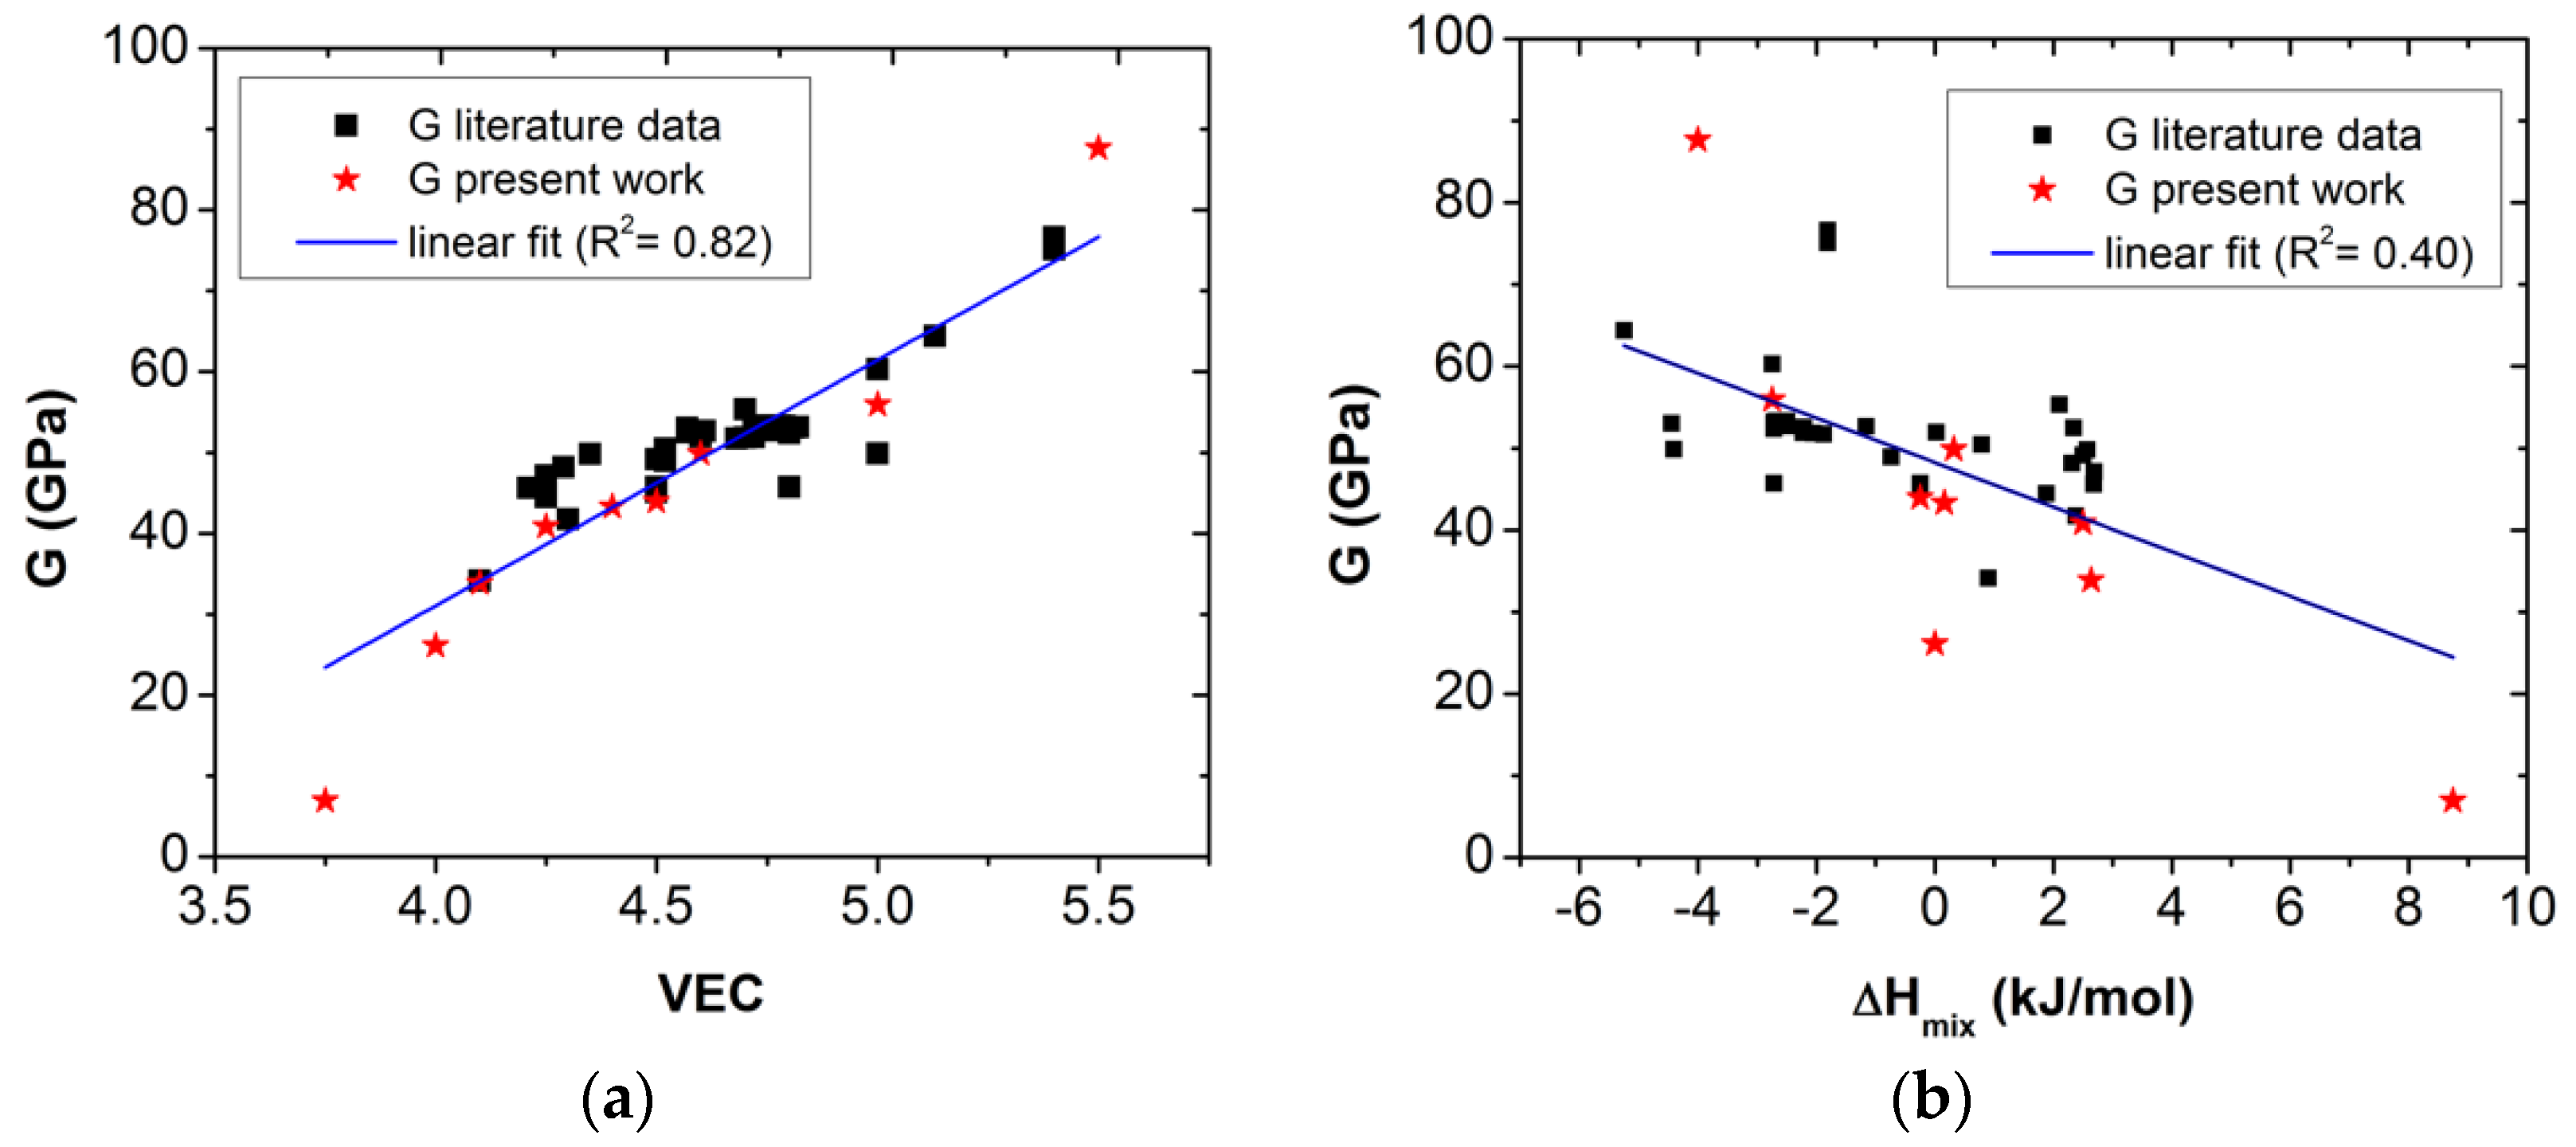
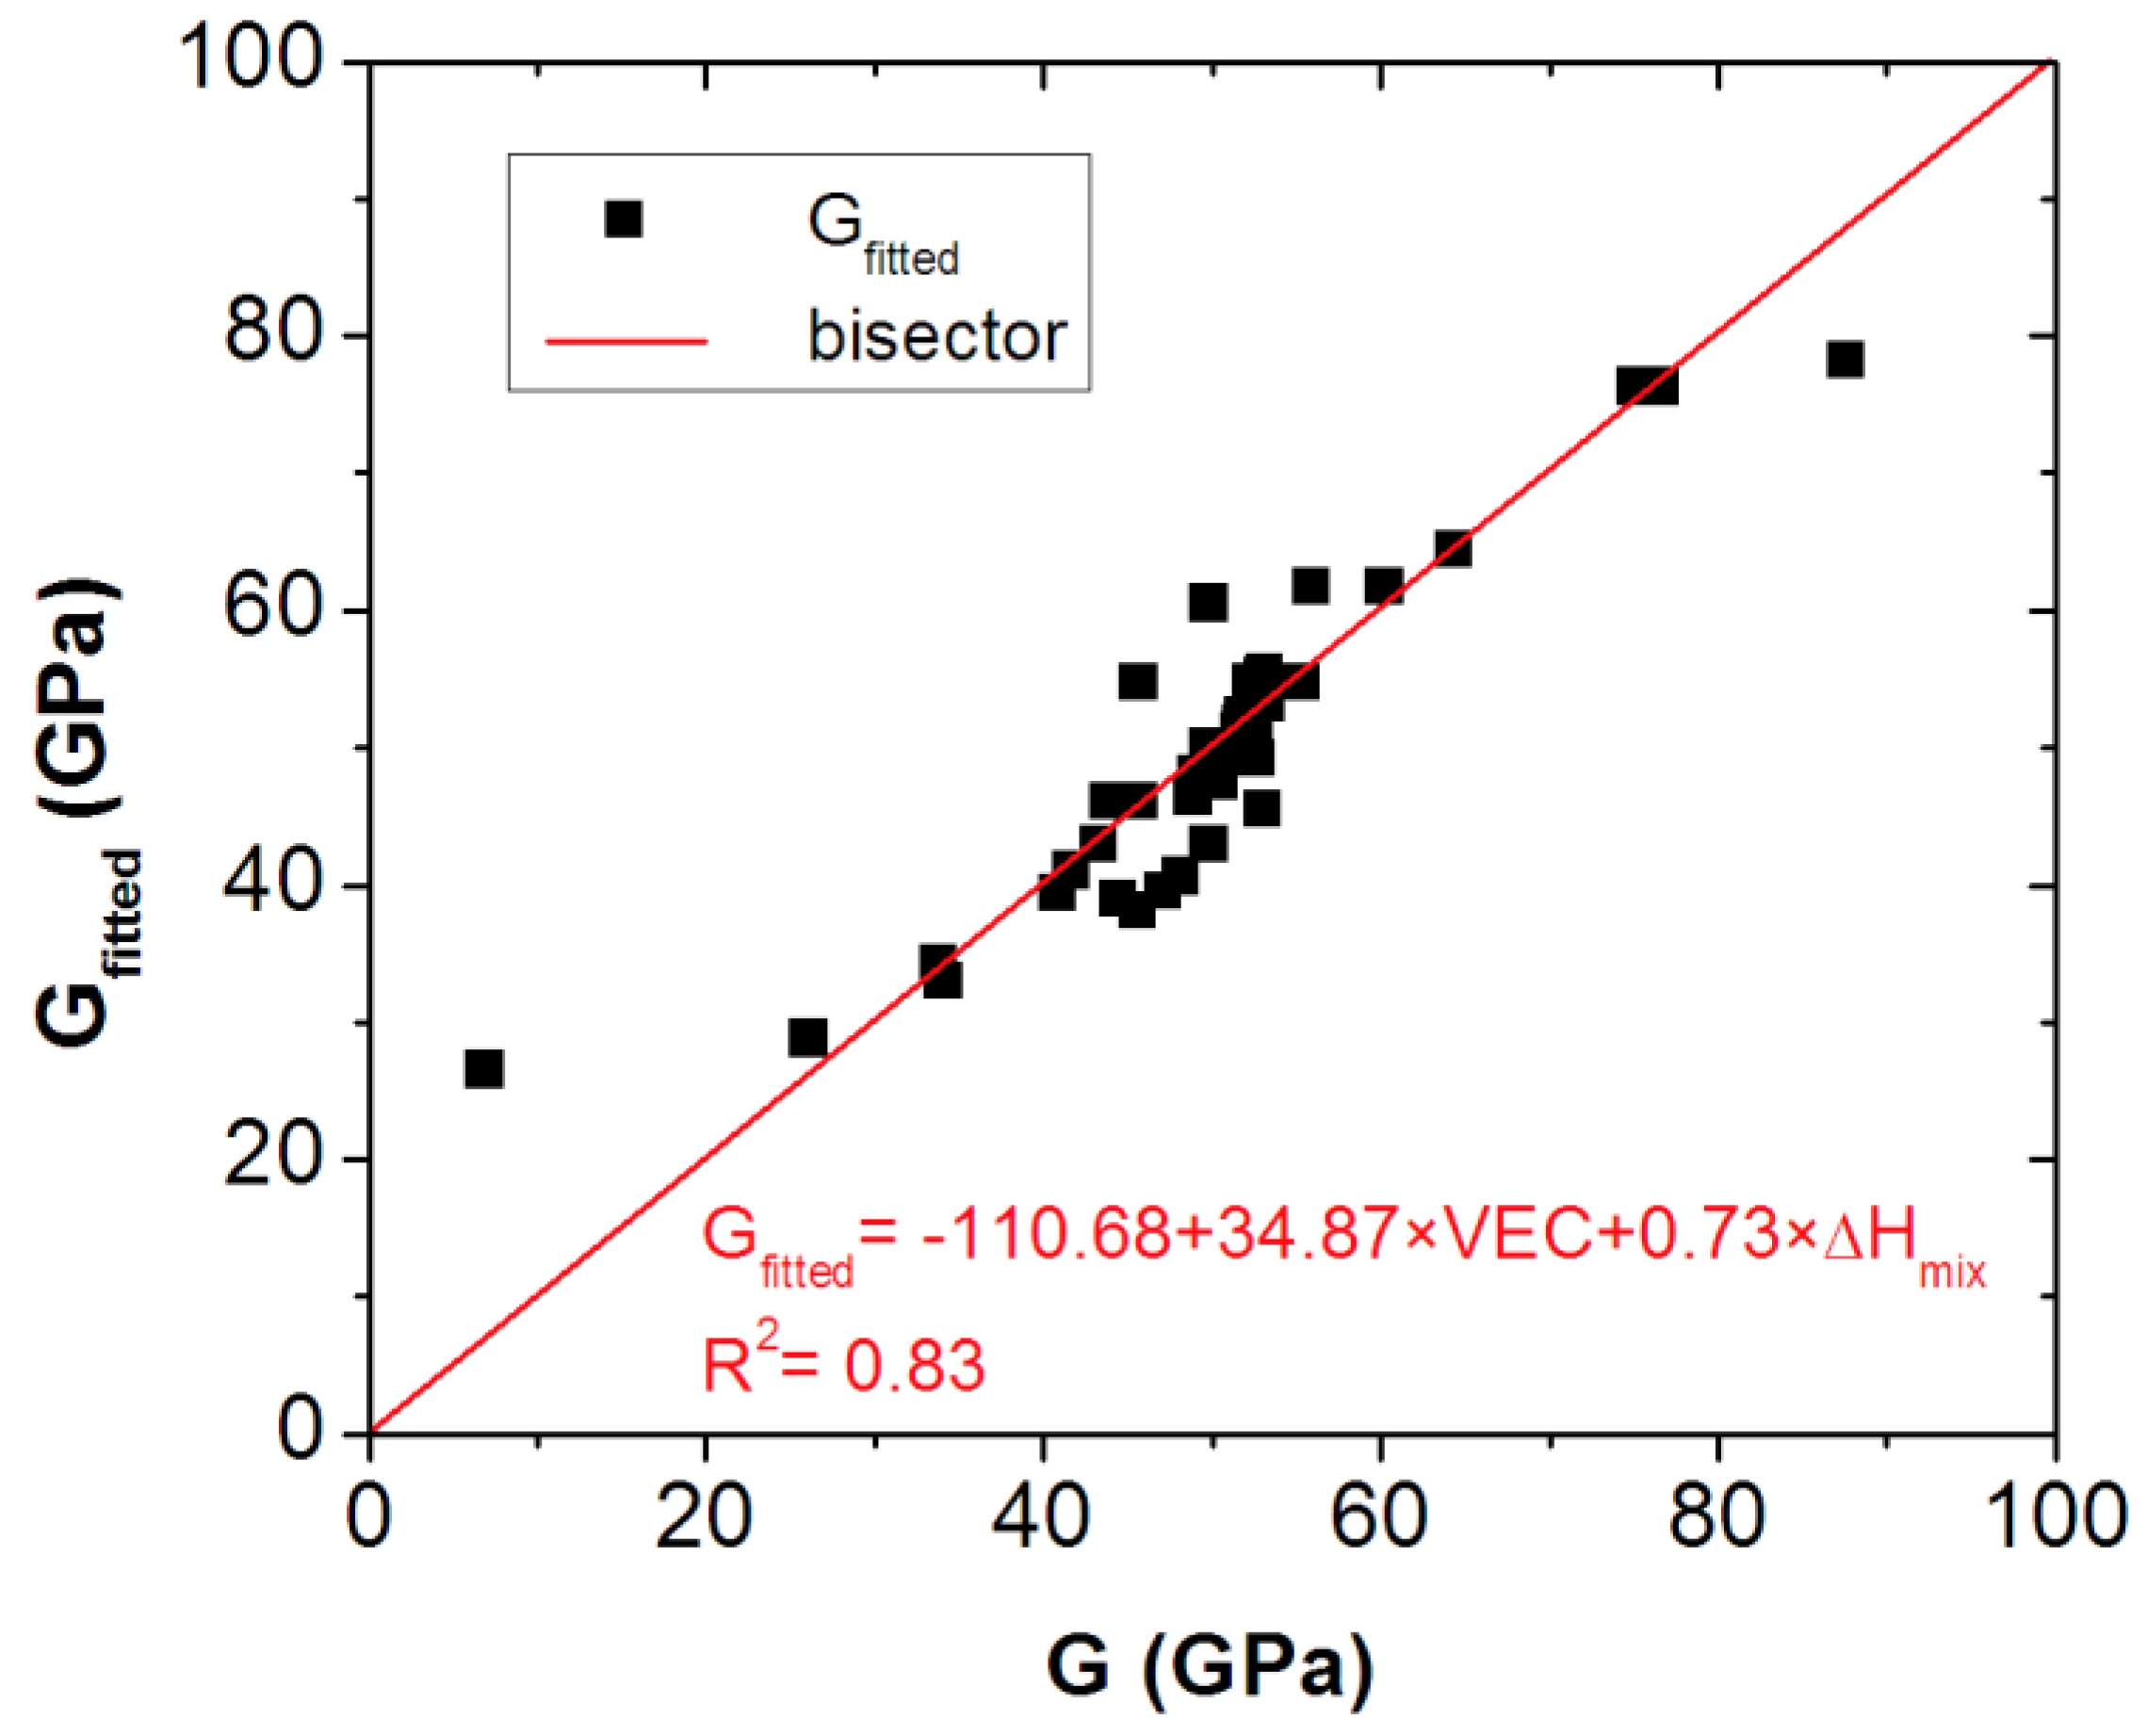
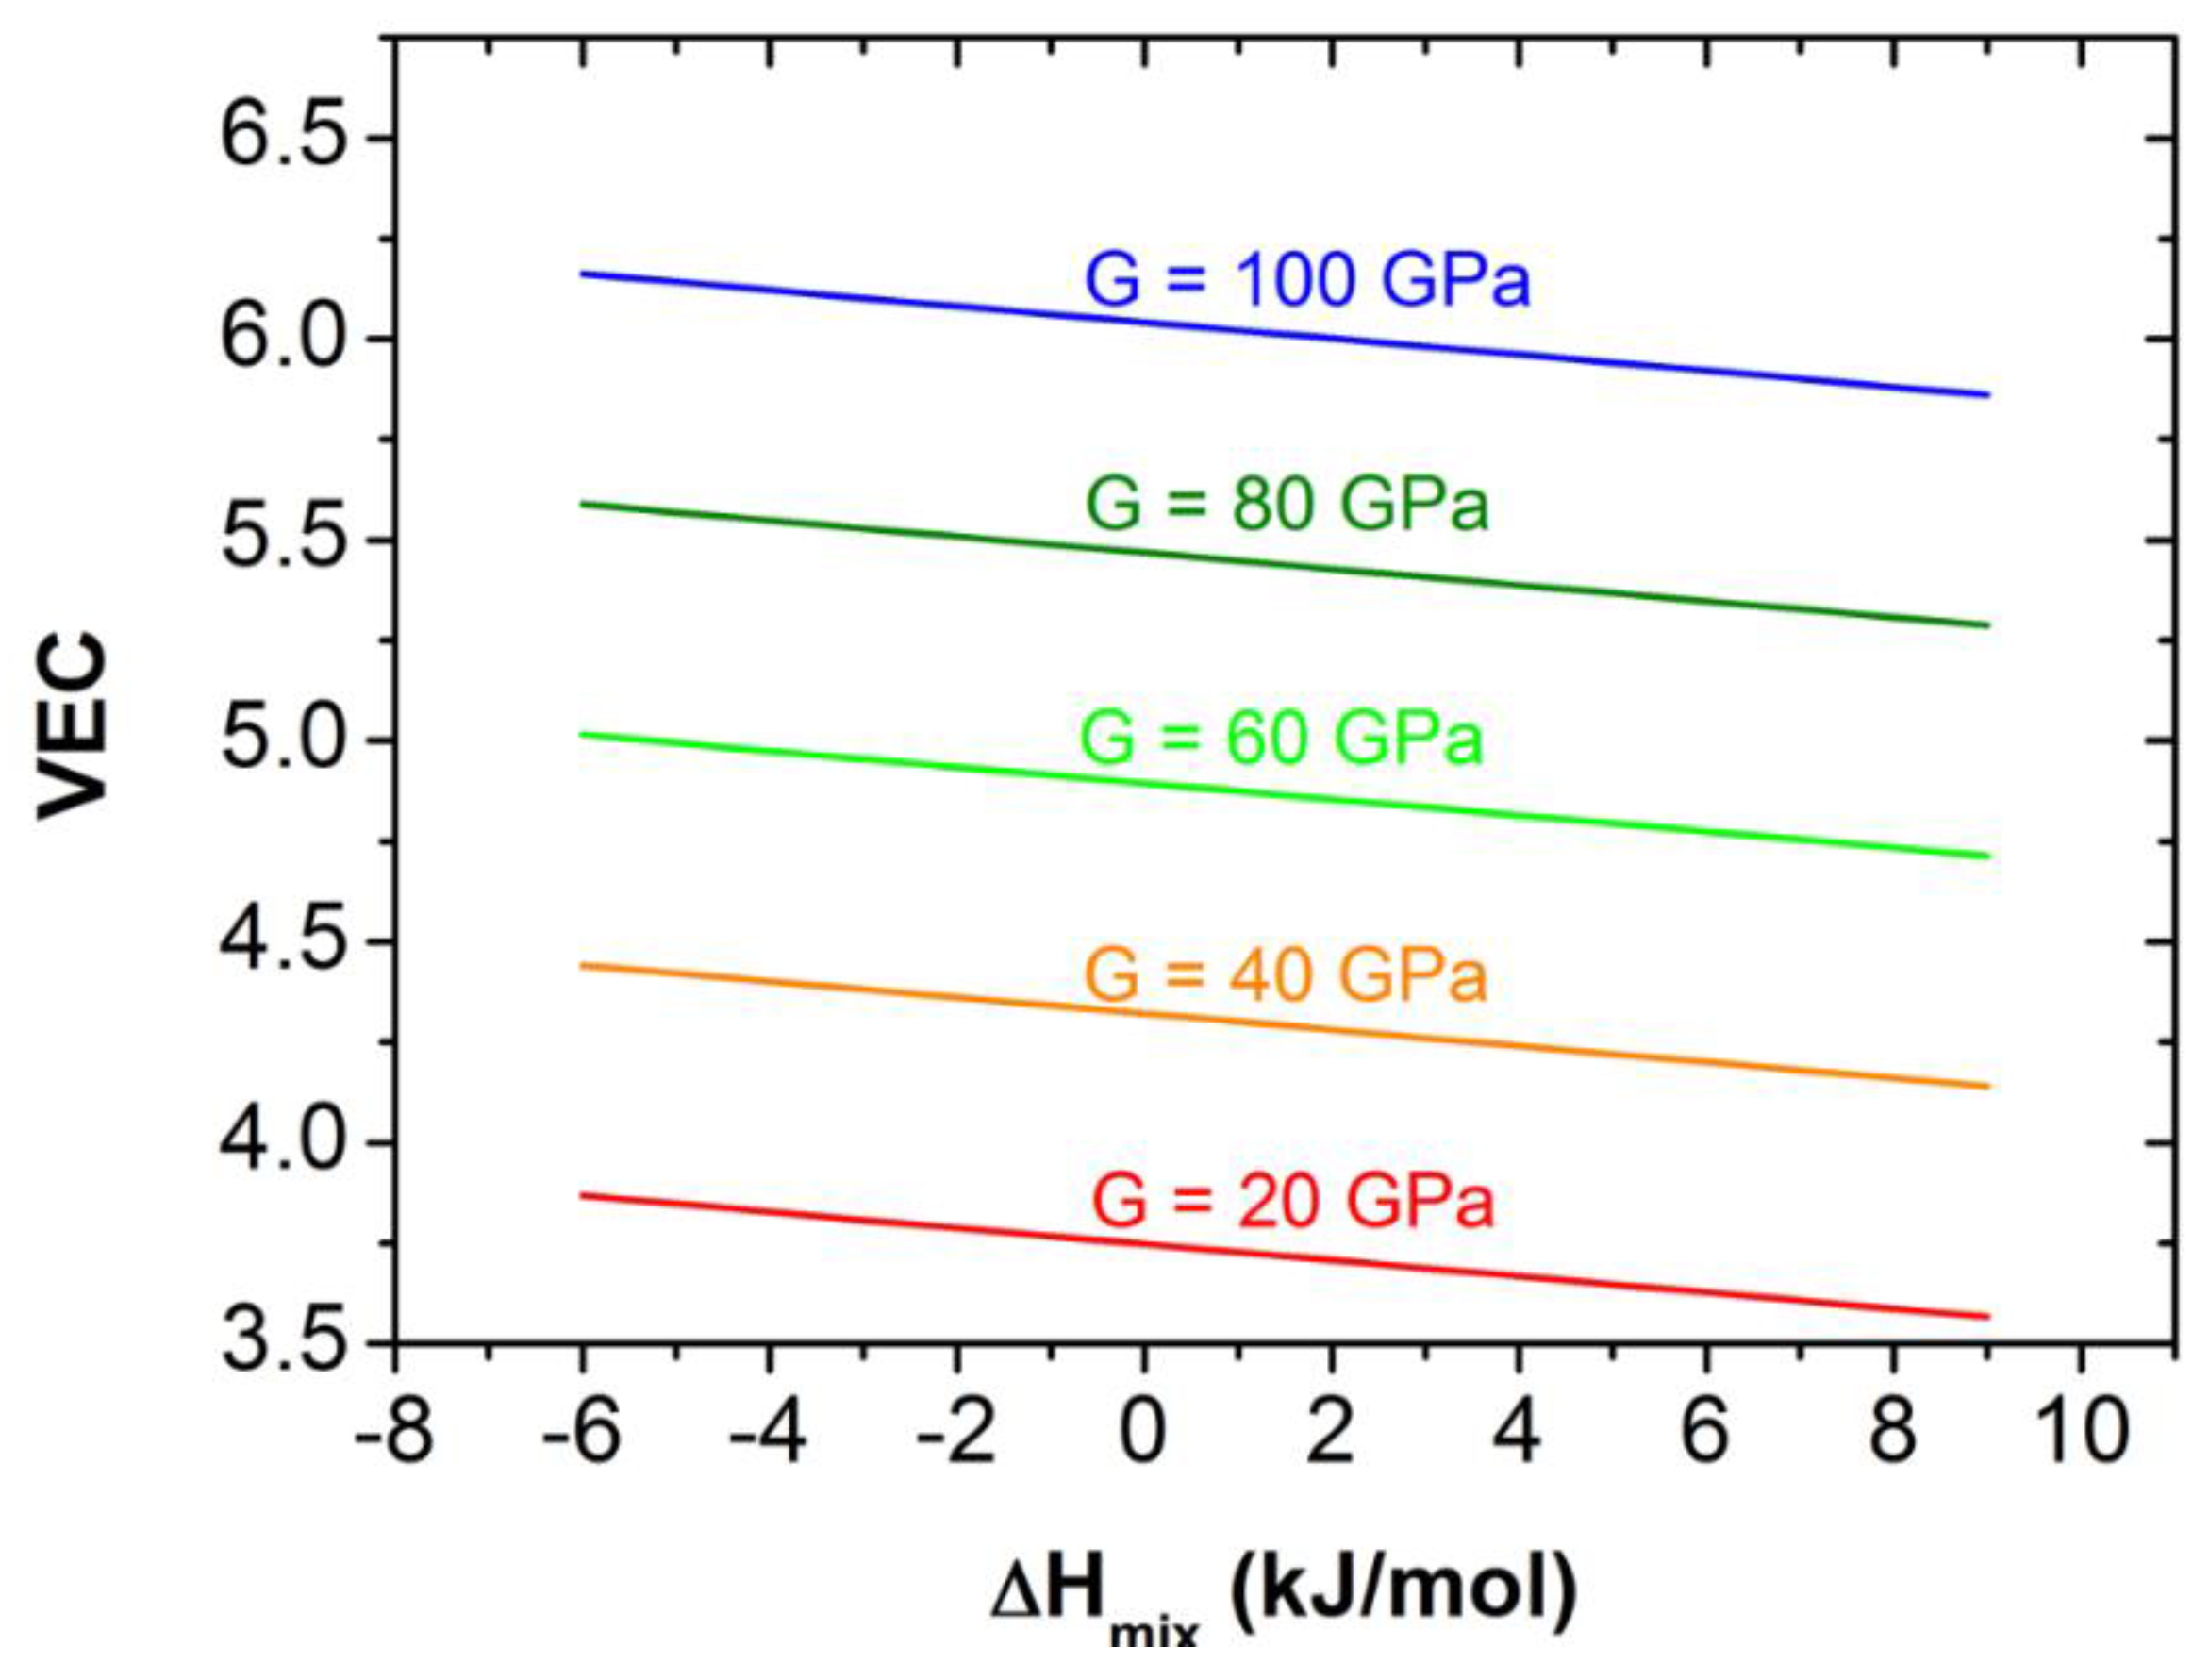
3.1. Estimation of Shear Modulus, G, Based on Bonding Parameters
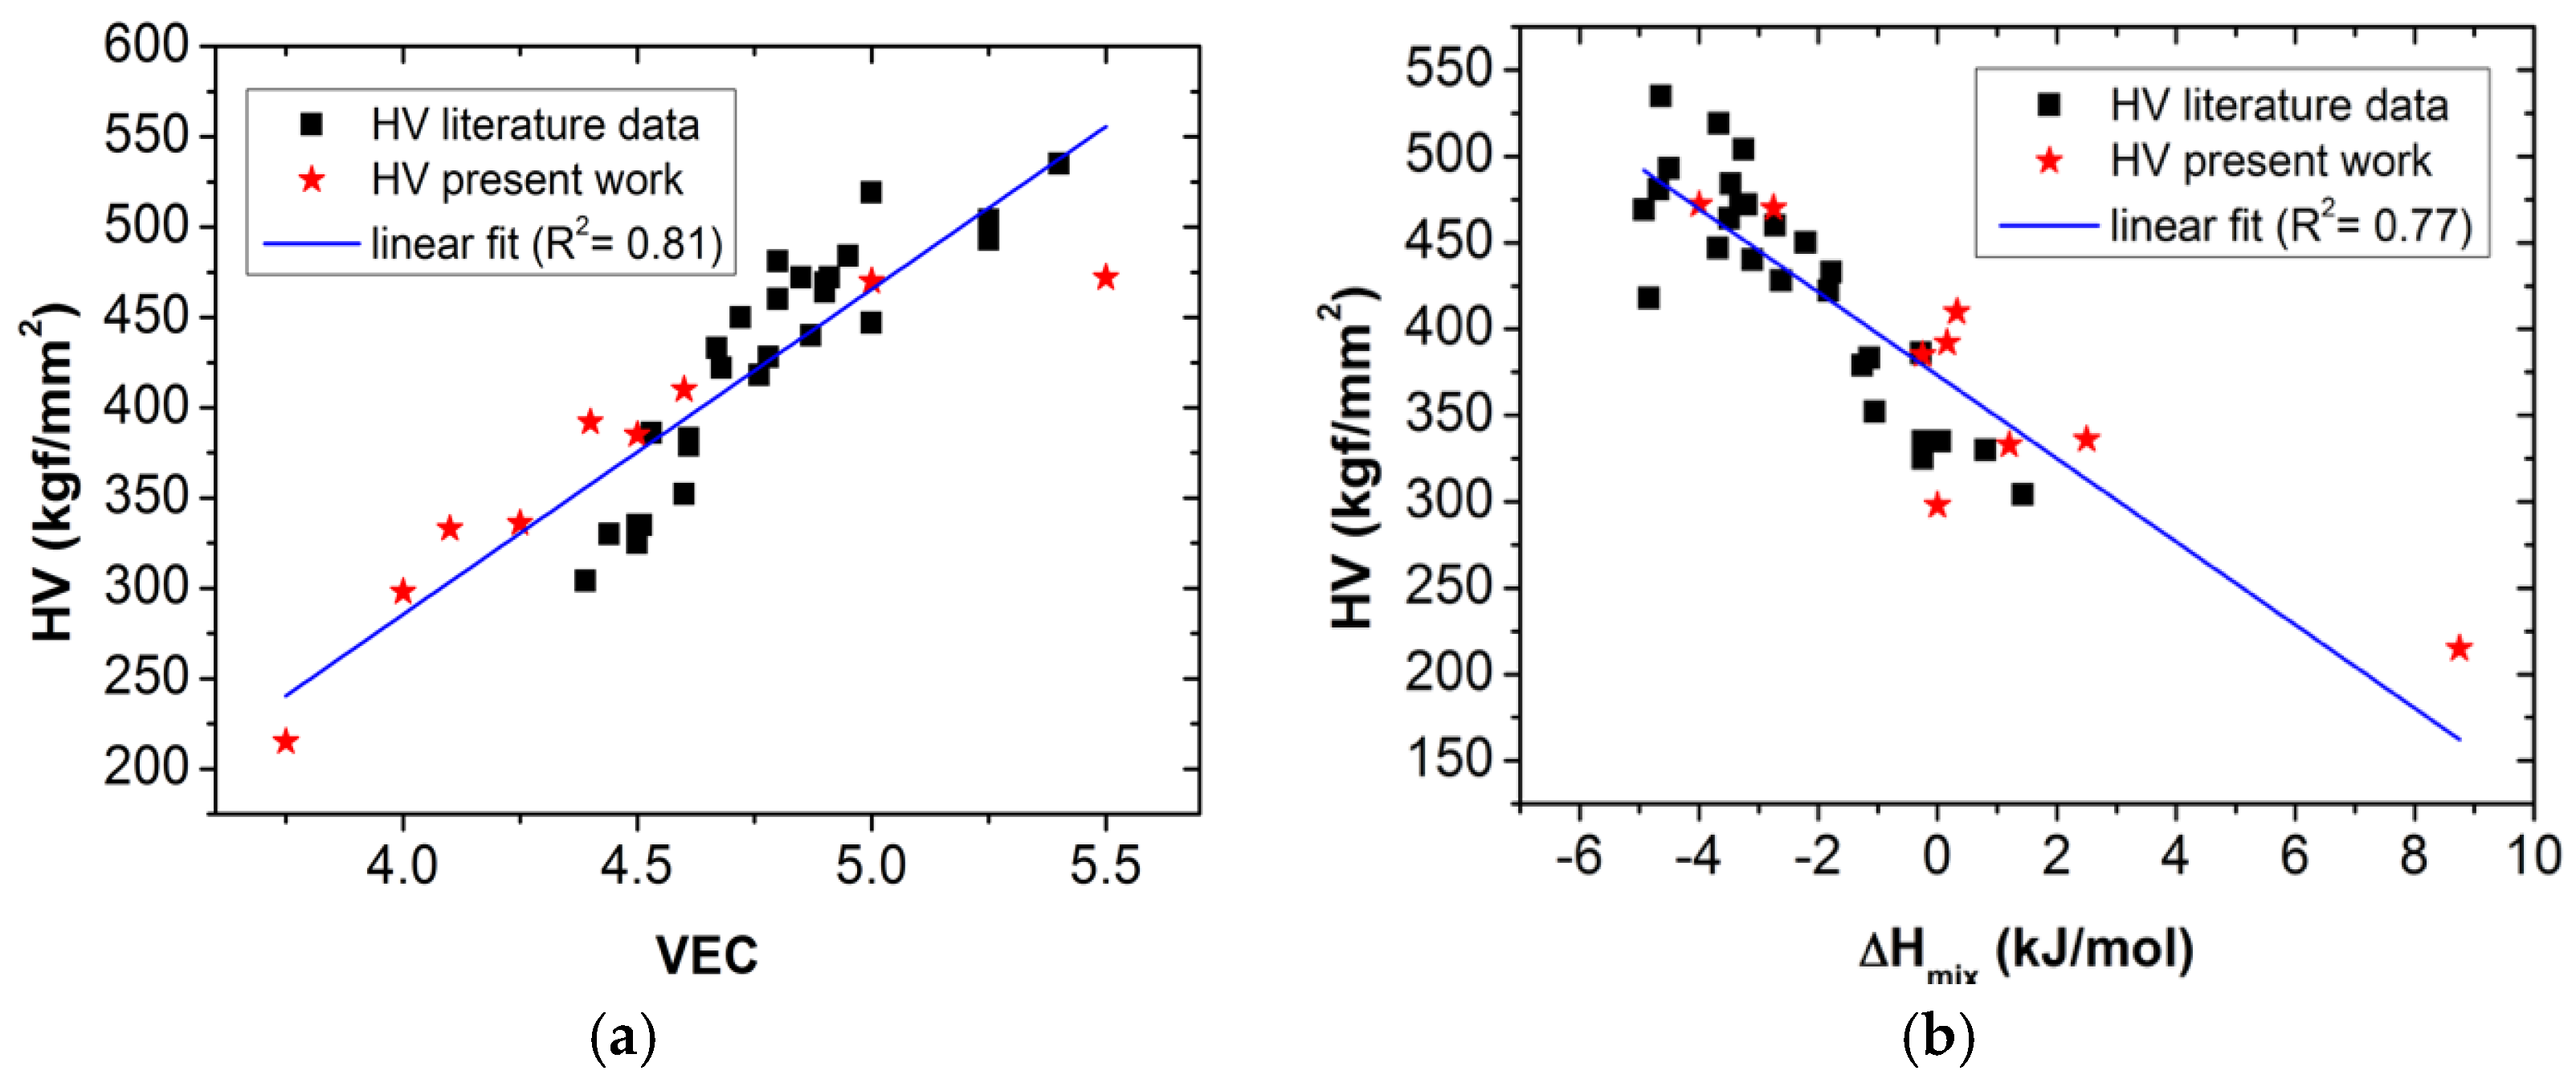
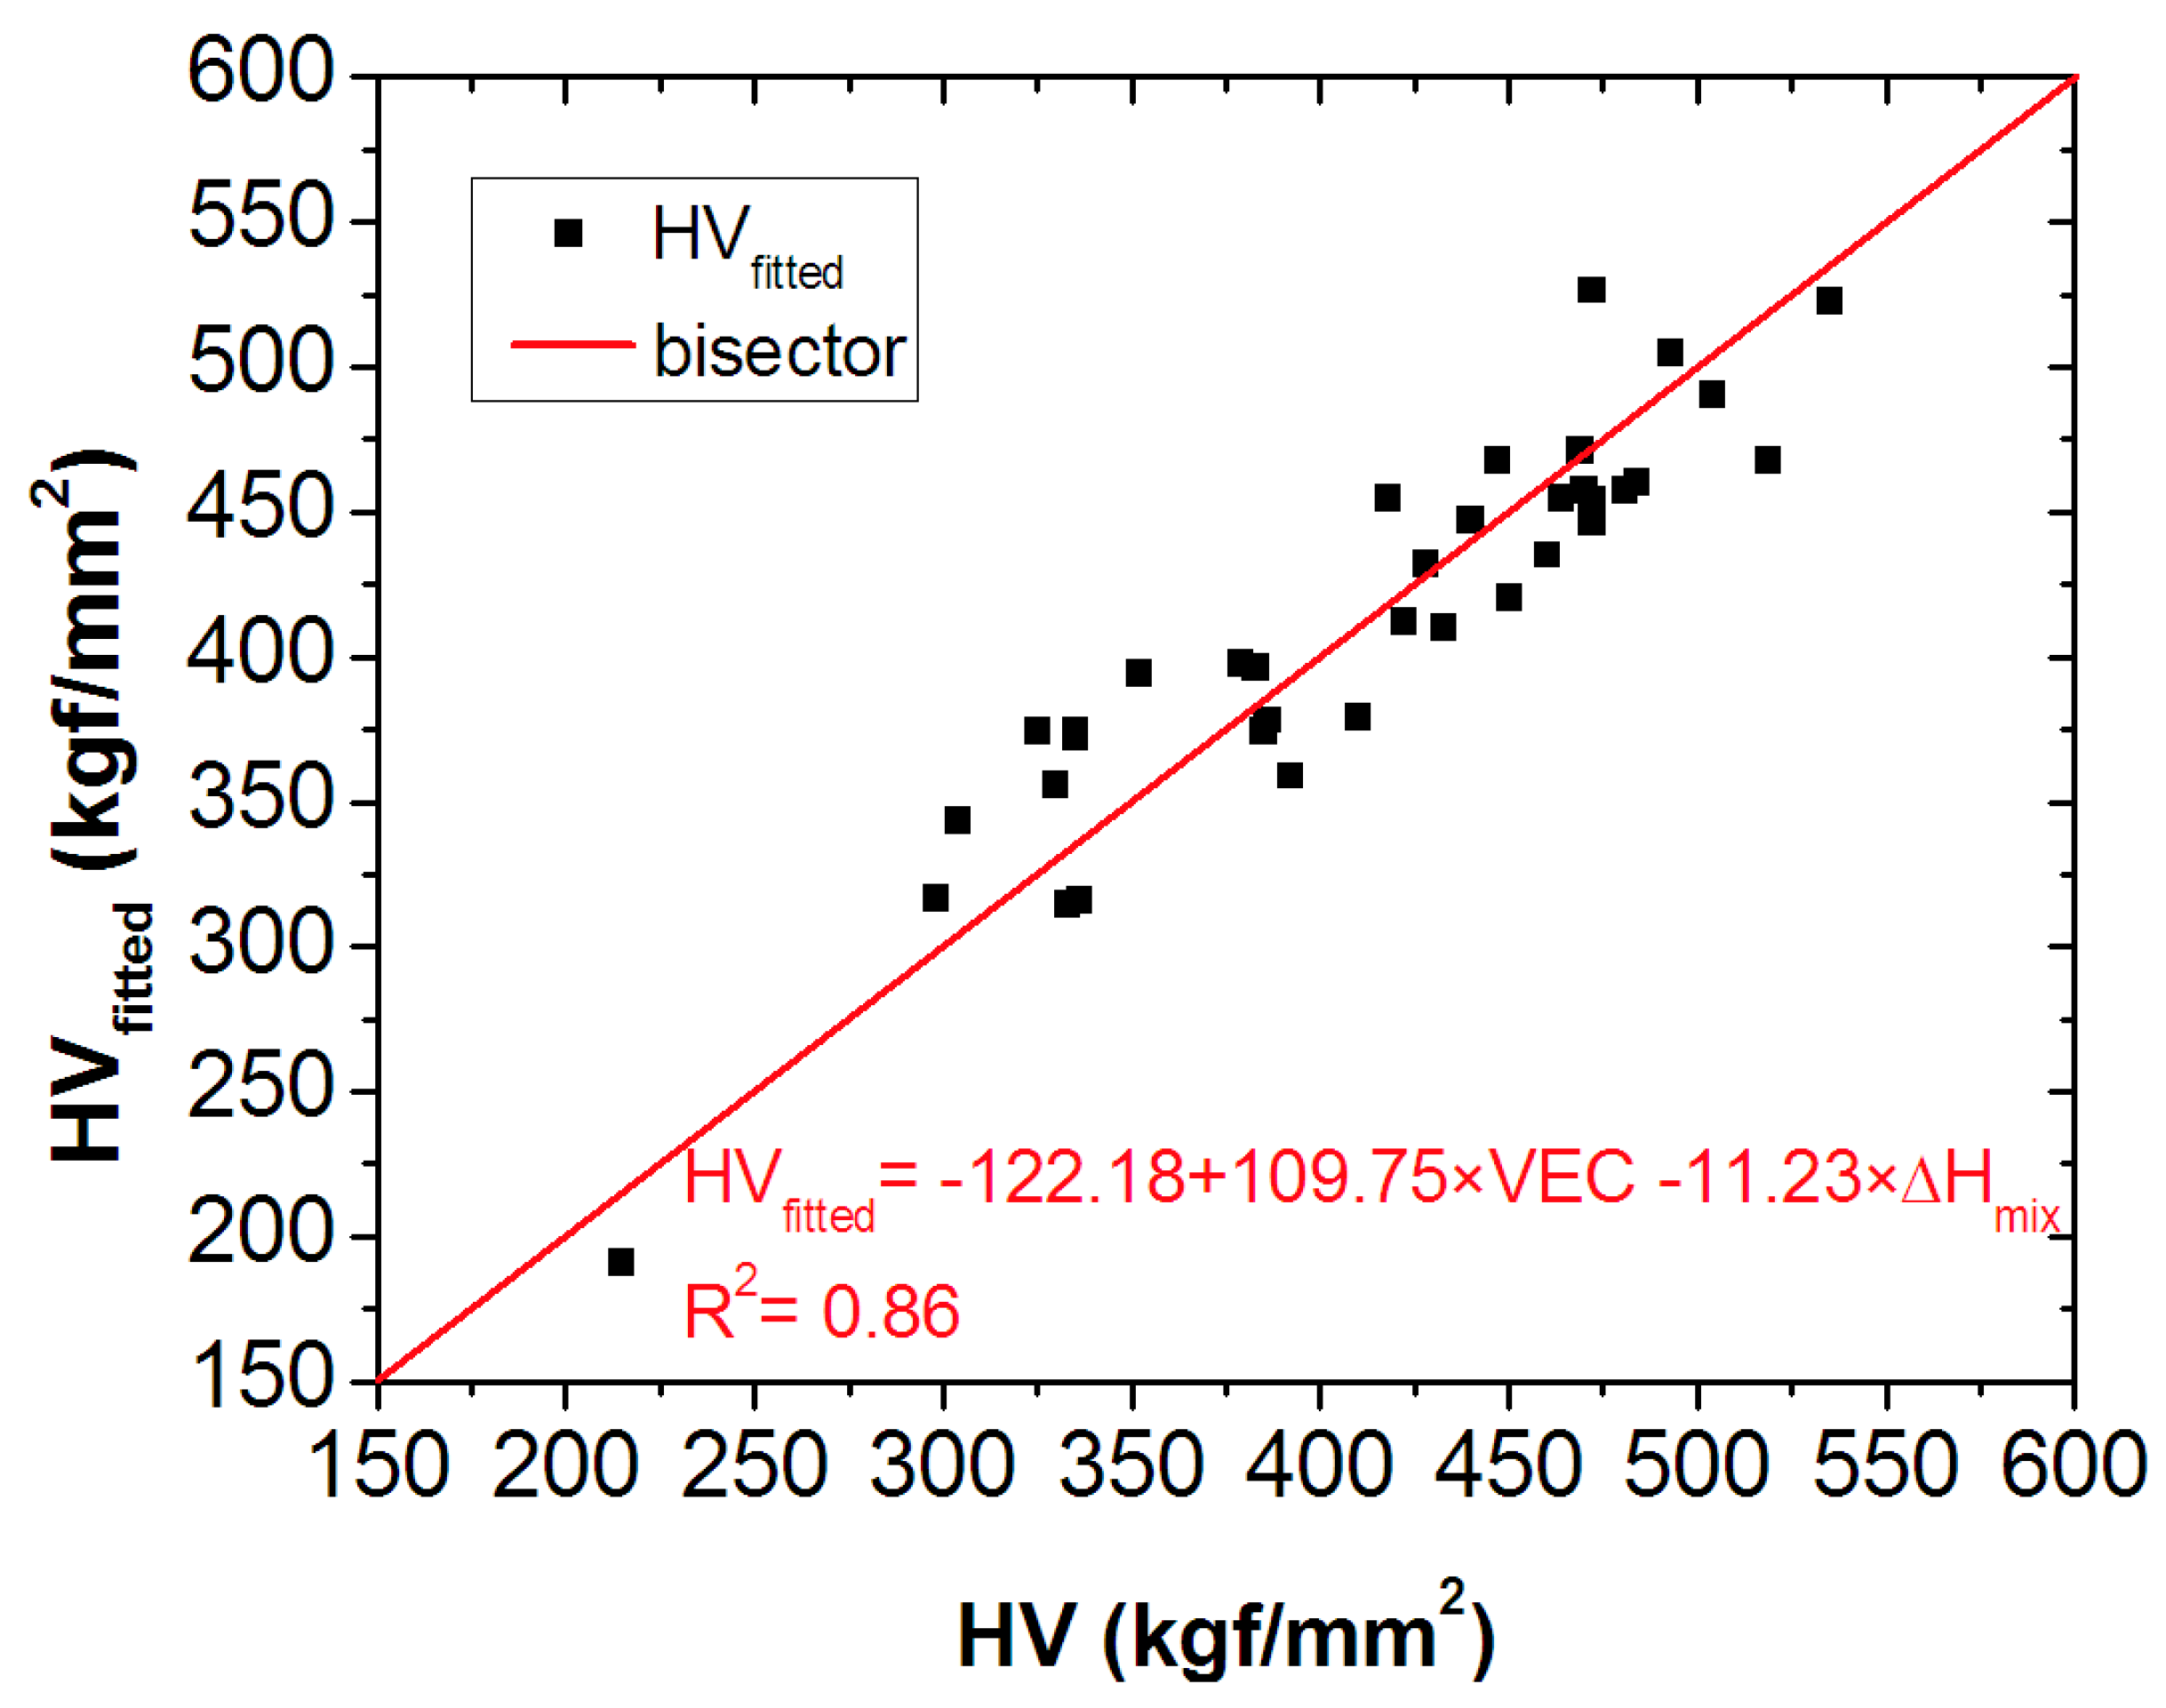
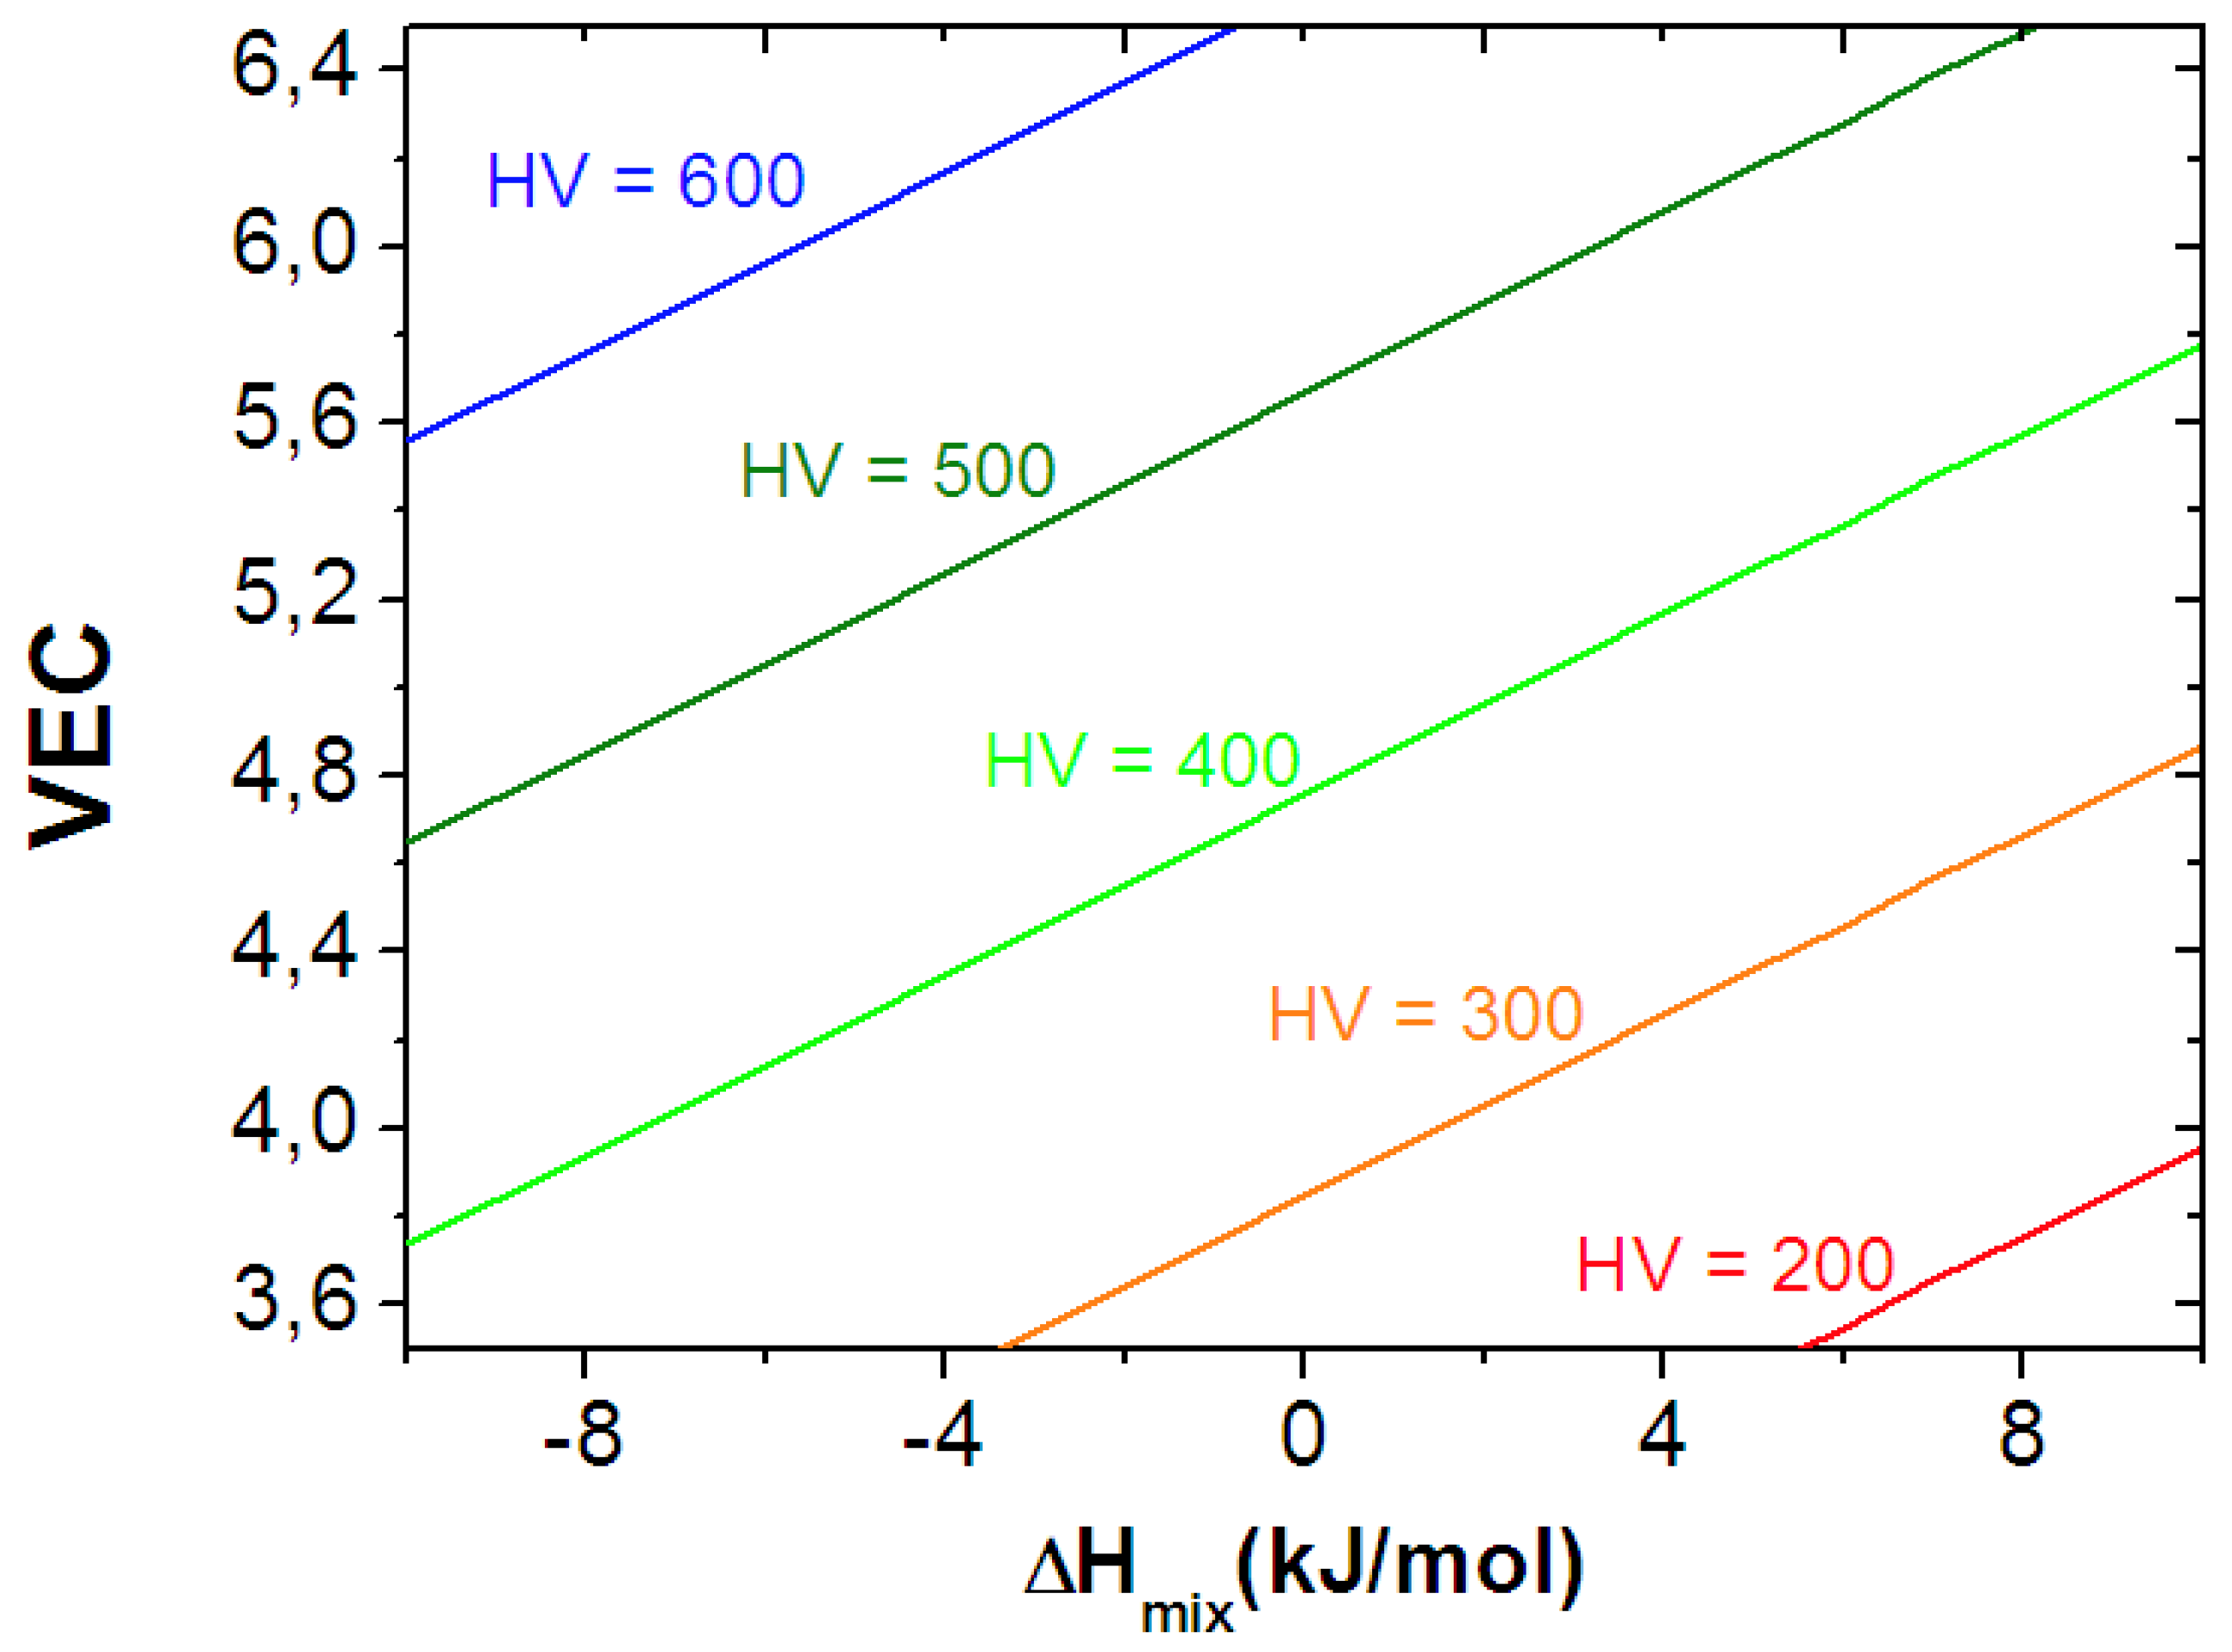
3.2. Estimation of HV, Based on Bonding Parameters
4. Conclusions
Author Contributions
Funding
Data Availability Statement
Conflicts of Interest
References
- Yeh, J.W.; Chen, S.K.; Lin, S.J.; Gan, J.Y.; Chin, T.S.; Shun, T.T.; Tsau, C.H.; Chang, S.Y. Nanostructured high-entropy alloys with multiple principal elements: Novel alloy design concepts and outcomes. Adv. Eng. Mater. 2004, 6, 299–303. [Google Scholar] [CrossRef]
- Miracle, D.B.; Miller, J.D.; Senkov, O.N.; Woodward, C.; Uchic, M.D.; Tiley, J. Exploration and development of high entropy alloys for structural applications. Entropy 2014, 16, 494–525. [Google Scholar] [CrossRef]
- Lu, Y.; Dong, Y.; Guo, S.; Jiang, L.; Kang, H.; Wang, T.; Wen, B.; Wang, Z.; Jie, J.; Cao, Z.; et al. A Promising New Class of High-Temperature Alloys: Eutectic High-Entropy Alloys. Sci. Rep. 2014, 4, 6200. [Google Scholar] [CrossRef] [PubMed] [Green Version]
- Senkov, O.N.; Scott, J.M.; Senkova, S.V.; Miracle, D.B.; Woodward, C.F. Microstructure and room temperature properties of a high-entropy TaNbHfZrTi alloy. J. Alloys Compd. 2011, 509, 6043–6048. [Google Scholar] [CrossRef]
- Liao, W.B. High Strength and Deformation Mechanisms of Al0.3CoCrFeNi High-Entropy Alloy Thin Films Fabricated by Magnetron Sputtering. Entropy 2019, 21, 146. [Google Scholar] [CrossRef] [Green Version]
- Zhang, H.; Siu, K.W.; Liao, W.; Wang, Q. In situ mechanical characterization of CoCrCuFeNi high-entropy alloy micro/nano-pillars for their size-dependent mechanical behavior. Mater. Res. Express. 2016, 3, 094002. [Google Scholar] [CrossRef]
- Hsu, Y.J.; Chiang, W.C.; Wu, J.K. Corrosion behavior of FeCoNiCrCux high-entropy alloys in 3.5% sodium chloride solution. Mater. Chem. Phys. 2005, 92, 112–117. [Google Scholar] [CrossRef]
- Huang, P.; Yeh, J.W. Multi-Principal Element Alloys with Improved Oxidation and Wear Resistance for Thermal Spray Coating. Adv. Eng. Mater. 2004, 6, 74–78. [Google Scholar] [CrossRef]
- Fazakas, É.; Wang, J.Q.; Zadorozhnyy, V.; Louzguine-Luzgin, D.V.; Varga, L.K. Microstructural evolution and corrosion behavior of Al25Ti 25Ga25Be25equi-molar composition alloy. Mater. Corros. 2014, 65, 691–695. [Google Scholar] [CrossRef]
- Senkov, O.N.; Miracle, D.B.; Chaput, K.J.; Couzinie, J.-P. Development and exploration of refractory high entropy alloys—A review. J. Mater. Res. 2018, 153, 1–37. [Google Scholar] [CrossRef] [Green Version]
- Thompson, R.P.; Clegg, W.J. Predicting whether a material is ductile or brittle. Curr. Opin. Solid State Mater. Sci. 2018, 22, 100–108. [Google Scholar] [CrossRef]
- Grimvall, G. Thermophysical Properties of Materials; Elsevier: Amsterdam, The Netherlands, 1999. [Google Scholar]
- Takeuchi, A.I. Classification of bulk metallic glasses by atomic size difference, heat of mixing and period of constituent elements and its application to characterization of the main alloying element. Mater. Trans. 2005, 46, 2817–2829. [Google Scholar] [CrossRef] [Green Version]
- Schönecker, S.; Li, X.; Wei, D.; Nozaki, S.; Kato, H.; Vitos, L.; Li, X. Harnessing elastic anisotropy to achieve low-modulus refractory high-entropy alloys for biomedical applications. Mater. Design. 2022, 215, 110430. [Google Scholar] [CrossRef]
- Tian, L.-Y.; Wang, G.; Harris, J.S.; Irving, D.L.; Zhao, J.; Vitos, L. Alloying effect on the elastic properties of refractory high-entropy alloys. Mater. Des. 2017, 114, 243–279. [Google Scholar] [CrossRef]
- Tian, F.; Varga, L.K.; Chen, N.; Shen, J.; Vitos, L. Ab initio design of elastically isotropic TiZrNbMoVx high-entropy alloys. J. All. Compd. 2014, 599, 19–25. [Google Scholar] [CrossRef]
- Tian, F.; Wang, D.; Shen, J.; Wang, Y. An ab initio investgation of ideal tensile and shear strength of TiVNbMo high-entropy alloy. Mater. Lett. 2016, 166, 271–275. [Google Scholar] [CrossRef]
- Zheng, S.; Feng, W.; Wang, S. Elastic properties of high entropy alloys by MaxEnt approach. Comput. Mater. Sci. 2018, 142, 332–337. [Google Scholar] [CrossRef]
- Mu, Y.K.; Liu, H.X.; Liu, Y.H.; Zhang, X.W.; Jiang, Y.H.; Dong, T. An ab initio and experimental studies of the structure, mechanical parameters and state density on the refractory high-entropy alloy systems. J. Alloys Compd. 2017, 714, 668–696. [Google Scholar] [CrossRef]
- Cao, P.; Ni, X.; Tian, F.; Varga, L.K.; Vitos, L. Ab initio study of AlxMoNbTiV high-entropy alloys. J. Phys. Condens. Matter. 2015, 27, 075401. [Google Scholar] [CrossRef]
- Fazakas, E.; Zadorozhnyy, V.; Varga, L.K.; Inoue, A.; Louzguine-Luzgin, D.V.; Tian, F.; Vitos, L. Experimental and theoretical study of Ti20Zr20Hf20Nb20X20 (X = V or Cr) refractory high-entropy alloys. Int. J. Refract. Metals Hard Mater. 2014, 47, 131–138. [Google Scholar] [CrossRef]
- Vitos, L. The EMTO Method and Applications in Computational Quantum Mechanics for Materials Engineers; Springer: London, UK, 2007. [Google Scholar]
- Takashi, S.; Tadahiko, F.; Jung-Hwan, H.; Shigeru, K.; Kazuaki, N.; Nobuaki, S.; Rong, C.; Akira, Y.; Kazuhiko, I.; Yoshiki, S.; et al. Multifunctional Alloys Obtained via a Dislocation-Free Plastic Deformation Mechanism. Science 2003, 300, 464–467. [Google Scholar]
- Senkov, O.N.; Senkova, S.V.; Miracle, D.B.; Woodward, C. Mechanical properties of low-density, refractory multi-principal element alloys of the Cr–Nb–Ti–V–Zr system. Mater. Sci. Eng. A 2013, 565, 51–62. [Google Scholar] [CrossRef]
- Wu, Y.D.; Cai, Y.H.; Chen, X.H.; Wang, T.; Si, J.J.; Wang, L.; Wang, Y.D.; Hui, X.D. Phase composition and solid solution strengthening effect in TiZrNbMoV high-entropy alloys. Mater. Des. 2015, 83, 651–660. [Google Scholar] [CrossRef]
- Yao, H.W.; Qiao, J.W.; Hawk, J.A.; Zhou, H.F.; Chen, M.W.; Gao, M.C. Mechanical properties of refractory high-entropy alloys: Experiments and modeling. J. All. Compd. 2017, 696, 1139–1150. [Google Scholar] [CrossRef]
- Tabor, D. The Hardness of Metals; Oxford University Press: London, UK, 1951. [Google Scholar]


| Alloys | Ref | VEC | C11 | C12 | C44 | C′ | ΔHmix | G | Gfitted |
|---|---|---|---|---|---|---|---|---|---|
| Y25Ti25Zr25Hf25 | pw | 3.75 | 70.40 | 85.94 | 67.48 | −7.77 | 8.75 | 6.95 | 26.21 |
| Ti33.33Zr33.33Hf33.34 | pw | 4.00 | 99.99 | 94.67 | 74.76 | 2.66 | 0.00 | 26.12 | 28.80 |
| Ti45Zr45Nb5Ta5 | [14] | 4.10 | 112.00 | 87.00 | 65.00 | 12.50 | 0.90 | 34.13 | 32.92 |
| Ti30Zr30Hf30Nb10 | pw | 4.10 | 114.88 | 94.34 | 70.83 | 10.27 | 2.64 | 33.85 | 34.14 |
| Ti26.3Zr26.3Hf26.3Nb10.55Ta10.55 | [14] | 4.21 | 145.00 | 100.00 | 73.00 | 22.50 | 2.68 | 45.63 | 38.00 |
| Ti25Zr25Hf25Nb12.5Ta12.5 | [14] | 4.25 | 151.00 | 101.00 | 72.00 | 25.00 | 2.69 | 47.15 | 39.40 |
| Ti37.5Zr25Ta12.5Hf12.5Nb12.5 | [14] | 4.25 | 146.00 | 99.00 | 68.00 | 23.50 | 1.88 | 44.45 | 38.83 |
| Ti25Zr25Hf25Nb25 | pw | 4.25 | 136.20 | 95.06 | 64.48 | 20.57 | 2.50 | 40.85 | 39.27 |
| Ti23.8Zr23.8Hf23.8Nb14.3Ta14.3 | [14] | 4.29 | 156.00 | 102.00 | 71.00 | 27.00 | 2.31 | 48.19 | 40.53 |
| Ti35Zr35Nb25Ta5 | [14] | 4.30 | 142.00 | 91.00 | 58.00 | 25.50 | 2.38 | 41.71 | 40.93 |
| Ti21.7Zr21.7Hf21.7Nb17.45Ta17.45 | [14] | 4.35 | 164.00 | 104.00 | 70.00 | 30.00 | 2.57 | 49.83 | 42.80 |
| Ti20Zr20Hf20Nb20V20 | pw | 4.40 | 149.70 | 94.20 | 58.35 | 27.75 | 0.16 | 43.30 | 42.86 |
| NbTiVZr | [15] | 4.50 | 166.10 | 93.80 | 52.20 | 36.15 | −0.25 | 45.05 | 46.06 |
| NbTiVZr | [16] | 4.50 | 166.40 | 94.70 | 53.80 | 35.85 | −0.25 | 45.72 | 46.06 |
| Ti25Nb25Ta25Zr25 | [14] | 4.50 | 174.00 | 101.00 | 60.00 | 36.50 | 2.50 | 49.16 | 47.99 |
| Ti25Zr25V25Nb25 | pw | 4.50 | 165.26 | 92.22 | 49.80 | 36.52 | −0.25 | 43.98 | 46.06 |
| Ti25Nb25Ta25Zr25 | [14] | 4.50 | 174.00 | 101.00 | 60.00 | 36.50 | 2.50 | 49.16 | 47.99 |
| Ti30.5Zr30.5Nb13Ta13Mo13 | [14] | 4.52 | 175.00 | 97.00 | 57.00 | 39.00 | −0.74 | 48.96 | 46.41 |
| Ti34Zr20Nb20Ta20Mo6 | [14] | 4.52 | 180.00 | 102.00 | 60.00 | 39.00 | 0.79 | 50.48 | 47.49 |
| Ti21.67Zr21.67Nb21.66Ta35 | [14] | 4.57 | 187.00 | 107.00 | 63.00 | 40.00 | 2.34 | 52.51 | 50.31 |
| Ti23.8Zr23.8Hf23.8Cr4.8Mo23.8 | [14] | 4.57 | 192.00 | 106.00 | 61.00 | 43.00 | −4.45 | 53.03 | 45.56 |
| Ti30Zr20Nb20Ta20Mo10 | [14] | 4.60 | 192.00 | 104.00 | 58.00 | 44.00 | 0.02 | 51.93 | 49.74 |
| Ti20Zr20V20Nb20Ta20 | pw | 4.60 | 185.98 | 102.36 | 56.08 | 41.81 | 0.32 | 49.86 | 49.95 |
| Ti39.4Nb15.15Ta15.15Zr15.15Mo15.15 | [14] | 4.61 | 195.00 | 104.00 | 58.00 | 45.50 | −1.16 | 52.63 | 49.26 |
| Mo0.8NbTiZr | [16] | 4.68 | 199.00 | 98.70 | 52.80 | 50.15 | -1.88 | 51.72 | 51.20 |
| TiZrNbMo0.8 | [17] | 4.68 | 199.00 | 98.70 | 52.80 | 50.15 | −1.88 | 51.72 | 51.20 |
| Mo0.8NbTiV0.2Zr | [16] | 4.70 | 200.80 | 99.00 | 52.50 | 50.90 | −2.05 | 51.85 | 51.77 |
| Ti15Zr15Nb35Ta35 | [14] | 4.70 | 210.00 | 112.00 | 60.00 | 49.00 | 2.10 | 55.33 | 54.68 |
| TiZrNbMo0.8V0.2 | [17] | 4.70 | 200.80 | 99.00 | 52.50 | 50.90 | −2.05 | 51.85 | 51.77 |
| Mo0.9NbTiZr | [16] | 4.72 | 204.30 | 99.50 | 52.60 | 52.40 | −2.21 | 52.52 | 52.36 |
| TiZrNbMo0.9 | [17] | 4.72 | 204.30 | 99.50 | 52.60 | 52.40 | −2.21 | 52.52 | 52.36 |
| Mo0.8NbTiV0.5Zr | [16] | 4.72 | 203.70 | 100.00 | 51.90 | 51.85 | −2.23 | 51.88 | 52.35 |
| TiZrNbMo0.8V0.5 | [17] | 4.72 | 203.70 | 100.00 | 51.90 | 51.85 | −2.23 | 51.88 | 52.35 |
| MoNbTiZr | [15] | 4.75 | 209.80 | 99.90 | 51.30 | 54.95 | −2.50 | 52.73 | 53.20 |
| MoNbTiZr | [16] | 4.75 | 209.90 | 101.00 | 52.60 | 54.45 | −2.50 | 53.33 | 53.20 |
| TiZrNbMo | [17] | 4.75 | 209.90 | 101.00 | 52.60 | 54.45 | −2.50 | 53.33 | 53.20 |
| MoNbTiV0.25Zr | [16] | 4.76 | 211.00 | 100.60 | 52.10 | 55.20 | −2.60 | 53.32 | 53.48 |
| TiZrNbMoV0.25 | [17] | 4.76 | 211.00 | 100.60 | 52.10 | 55.20 | −2.60 | 53.32 | 53.48 |
| MoNbTiV0.5Zr | [16] | 4.78 | 212.20 | 100.30 | 51.60 | 55.95 | −2.67 | 53.30 | 54.13 |
| TiZrNbMoV0.50 | [17] | 4.78 | 212.20 | 100.30 | 51.60 | 55.95 | -2.67 | 53.30 | 54.13 |
| MoNbTiV0.75Zr | [16] | 4.79 | 213.20 | 100.30 | 51.20 | 56.45 | −2.70 | 53.24 | 54.46 |
| TiZrNbMoV0.75 | [17] | 4.79 | 213.20 | 100.30 | 51.20 | 56.45 | −2.70 | 53.24 | 54.46 |
| MoNbTiVZr | [16] | 4.80 | 213.70 | 100.70 | 50.90 | 56.50 | −2.72 | 53.07 | 54.79 |
| MoNbTiVZr | [15] | 4.80 | 215.00 | 100.50 | 49.40 | 57.25 | −2.72 | 52.40 | 54.79 |
| MoNbTiVZr | [18] | 4.80 | 231.00 | 105.60 | 36.90 | 62.70 | −2.72 | 45.70 | 54.79 |
| TiZrNbMoV1.00 | [17] | 4.80 | 213.70 | 100.70 | 50.90 | 56.50 | −2.72 | 53.07 | 54.79 |
| MoNbTiV1.25Zr | [16] | 4.81 | 218.00 | 101.90 | 50.00 | 58.05 | −2.72 | 53.08 | 55.14 |
| TiZrNbMoV1.25 | [17] | 4.81 | 218.00 | 101.90 | 50.00 | 58.05 | −2.72 | 53.08 | 55.14 |
| MoNbTiV1.5Zr | [16] | 4.82 | 219.30 | 102.20 | 49.80 | 58.55 | −2.71 | 53.13 | 55.50 |
| TiZrNbMoV1.50 | [17] | 4.82 | 219.30 | 102.20 | 49.80 | 58.55 | −2.71 | 53.13 | 55.50 |
| CrMoNbTaTiVZr | [19] | 5.00 | 261.40 | 115.10 | 38.40 | 73.15 | −4.41 | 49.85 | 60.58 |
| MoNbTiV | [20] | 5.00 | 265.50 | 114.00 | 51.70 | 75.75 | −2.75 | 60.27 | 61.75 |
| Ti25V25Nb25Mo25 | pw | 5.00 | 264.13 | 112.11 | 45.45 | 76.01 | −2.75 | 55.92 | 61.75 |
| CrMoNbTaTiVWZr | [19] | 5.13 | 286.10 | 121.90 | 54.70 | 82.10 | −5.25 | 64.39 | 64.53 |
| MoNbTaVW | [18] | 5.40 | 392.70 | 160.10 | 57.60 | 116.30 | −1.81 | 76.63 | 76.35 |
| MoNbTaVW | [21] | 5.40 | 380.80 | 177.30 | 61.20 | 101.75 | −1.81 | 75.11 | 76.35 |
| V25Nb25Mo25W25 | pw | 5.50 | 390.15 | 131.97 | 67.35 | 129.09 | −4.00 | 87.66 | 78.31 |
| Alloys | Ref | VEC | HV | ΔHmix | HV Fitted |
|---|---|---|---|---|---|
| Nb28.3Ti24.5V23Zr24.2 | [24] | 4.51 | 335 | 0.05 | 376 |
| Nb22.6Ti19.4V37.2Zr20.8 | [24] | 4.60 | 352 | −1.05 | 397 |
| Cr24.6Nb26.7Ti23.9Zr24.8 | [24] | 4.76 | 418 | −4.84 | 451 |
| Cr20.2Nb20Ti19.9V19.6Zr20.3 | [24] | 4.80 | 481 | −4.68 | 454 |
| Y25Ti25Zr25Hf25 | pw | 3.75 | 215 | 8.75 | 204 |
| Ti33.33Zr33.33Hf33.34 | pw | 4.00 | 298 | 0.00 | 315 |
| Ti30Zr30Hf30Nb10 | pw | 4.10 | 333 | 1.20 | 316 |
| Ti25Zr25Hf25Nb25 | pw | 4.25 | 336 | 2.50 | 322 |
| Ti20Zr20Hf20Nb20V20 | pw | 4.40 | 392 | 0.16 | 362 |
| Ti25Zr25V25Nb25 | pw | 4.50 | 385 | −0.25 | 377 |
| Ti20Zr20V20Nb20Ta20 | pw | 4.60 | 410 | 0.32 | 384 |
| Ti25V25Nb25Mo25 | pw | 5.00 | 470 | −2.75 | 461 |
| V25Nb25Mo25W25 | pw | 5.50 | 472 | −4.00 | 532 |
| TiZrNbV | [25] | 4.50 | 325 | −0.25 | 377 |
| TiZrNbVMo0.3 | [25] | 4.61 | 379 | −1.26 | 399 |
| TiZrNbVMo0.5 | [25] | 4.67 | 433 | −1.78 | 412 |
| TiZrNbVMo0.7 | [25] | 4.72 | 450 | −2.21 | 422 |
| TiZrNbVMo1.0 | [25] | 4.80 | 460 | −2.72 | 436 |
| TiZrNbVMo1.3. | [25] | 4.87 | 440 | −3.10 | 448 |
| TiZrNbVMo1.5 | [25] | 4.91 | 472 | −3.31 | 455 |
| TiZrNbVMo1.7 | [25] | 4.95 | 484 | −3.47 | 461 |
| TiZrNbVMo2.0 | [25] | 5.00 | 519 | −3.67 | 469 |
| TiZrNbV0.3 | [25] | 4.39 | 304 | 1.43 | 349 |
| TiZrNbV0.3Mo0.1 | [25] | 4.44 | 330 | 0.80 | 361 |
| TiZrNbV0.3Mo0.3 | [25] | 4.53 | 386 | −0.28 | 381 |
| TiZrNbV0.3Mo0.5 | [25] | 4.61 | 383 | −1.14 | 398 |
| TiZrNbV0.3Mo0.7 | [25] | 4.68 | 422 | −1.83 | 413 |
| TiZrNbV0.Mo1.03 | [25] | 4.78 | 428 | −2.62 | 432 |
| TiZrNbV0.3Mo1.3 | [25] | 4.85 | 472 | −3.20 | 447 |
| TiZrNbV0.3Mo1.5 | [25] | 4.90 | 464 | −3.49 | 455 |
| NbCrMo0.5Ta0,5TiZr | [25] | 4.90 | 469 | −4.92 | 469 |
| MoNbTaV | [26] | 5.25 | 504 | −3.25 | 495 |
| NbTaVW | [26] | 5.25 | 493 | −4.50 | 507 |
| NbTaTiVW | [26] | 5.00 | 447 | −3.68 | 469 |
| MoNbTaVW | [26] | 5.40 | 535 | −4.64 | 526 |
| NbTiVZr | [26] | 4.50 | 335 | −0.25 | 377 |
Disclaimer/Publisher’s Note: The statements, opinions and data contained in all publications are solely those of the individual author(s) and contributor(s) and not of MDPI and/or the editor(s). MDPI and/or the editor(s) disclaim responsibility for any injury to people or property resulting from any ideas, methods, instructions or products referred to in the content. |
© 2023 by the authors. Licensee MDPI, Basel, Switzerland. This article is an open access article distributed under the terms and conditions of the Creative Commons Attribution (CC BY) license (https://creativecommons.org/licenses/by/4.0/).
Share and Cite
Temesi, O.; Varga, L.K.; Li, X.; Vitos, L.; Chinh, N.Q. Estimation of Shear Modulus and Hardness of High-Entropy Alloys Made from Early Transition Metals Based on Bonding Parameters. Materials 2023, 16, 2311. https://doi.org/10.3390/ma16062311
Temesi O, Varga LK, Li X, Vitos L, Chinh NQ. Estimation of Shear Modulus and Hardness of High-Entropy Alloys Made from Early Transition Metals Based on Bonding Parameters. Materials. 2023; 16(6):2311. https://doi.org/10.3390/ma16062311
Chicago/Turabian StyleTemesi, Ottó, Lajos K. Varga, Xiaoqing Li, Levente Vitos, and Nguyen Q. Chinh. 2023. "Estimation of Shear Modulus and Hardness of High-Entropy Alloys Made from Early Transition Metals Based on Bonding Parameters" Materials 16, no. 6: 2311. https://doi.org/10.3390/ma16062311