
Graphene/PVDF Nanocomposite-Based Accelerometer for Detection of Low Vibrations
Abstract
:1. Introduction
2. Sensing Mechanism
3. Experimental Method
3.1. Materials Preparation
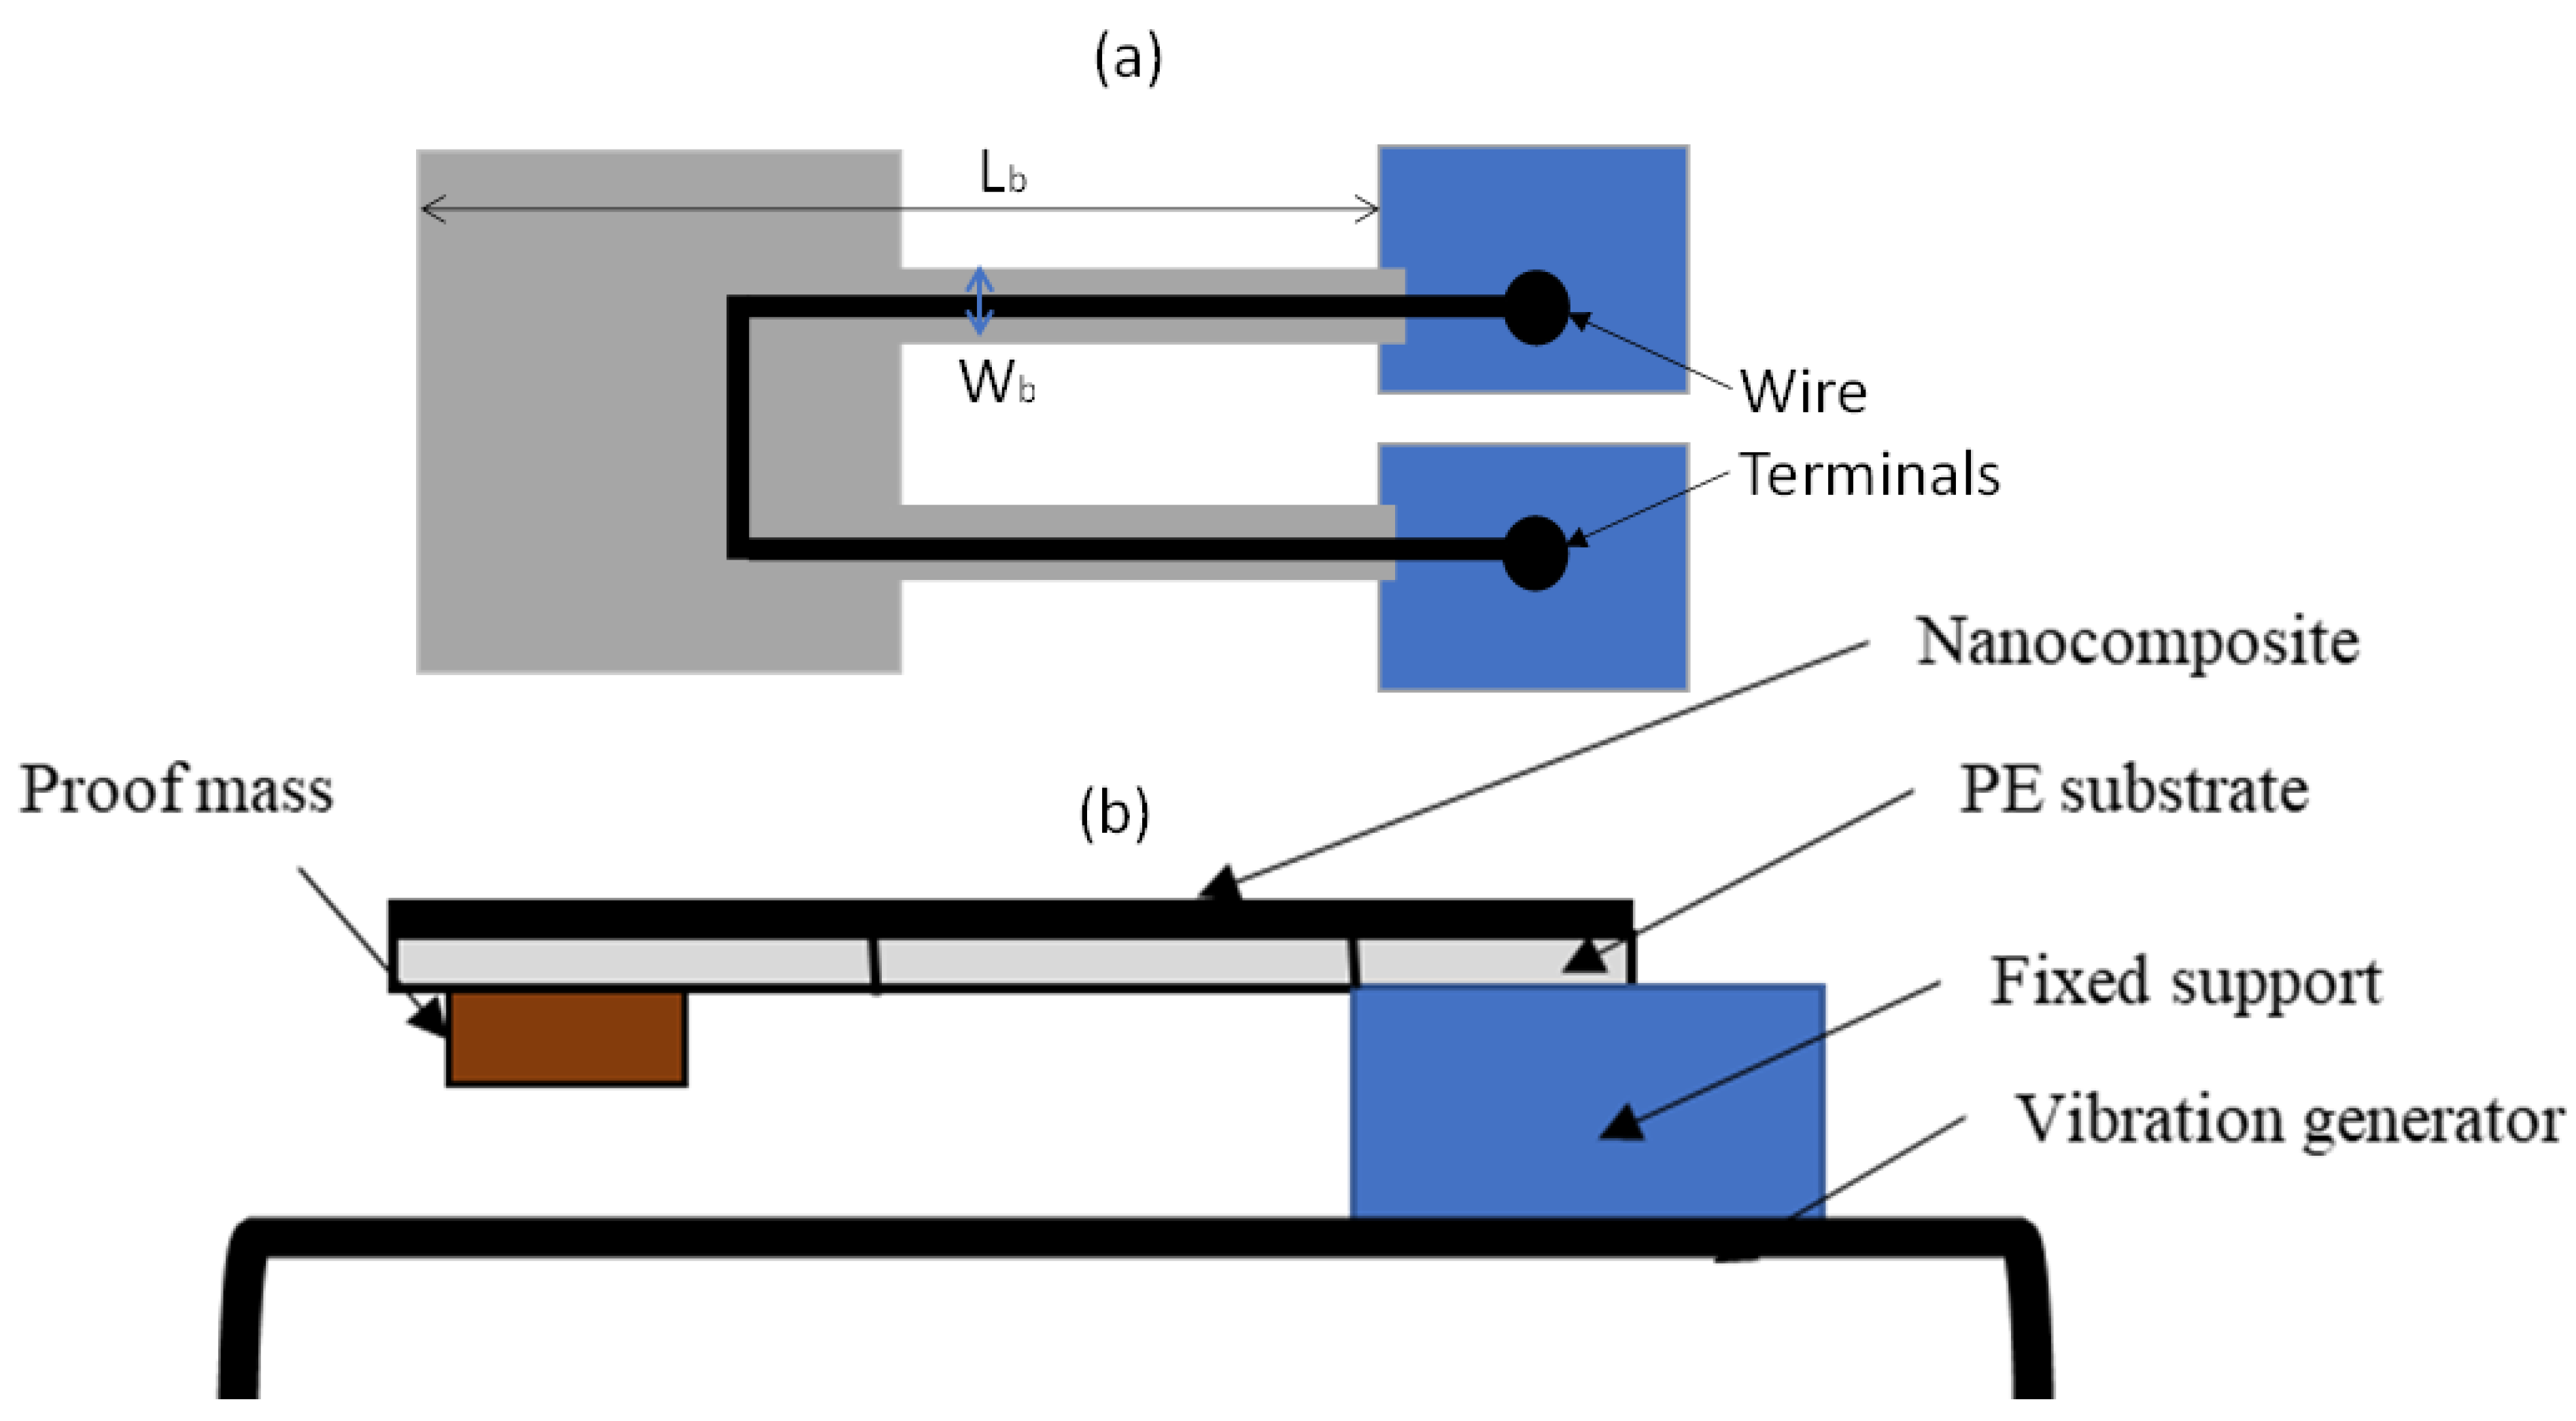
3.2. Design and Fabrication of Accelerometer
3.3. Resonance Frequency Calculation
4. Result and Discussion
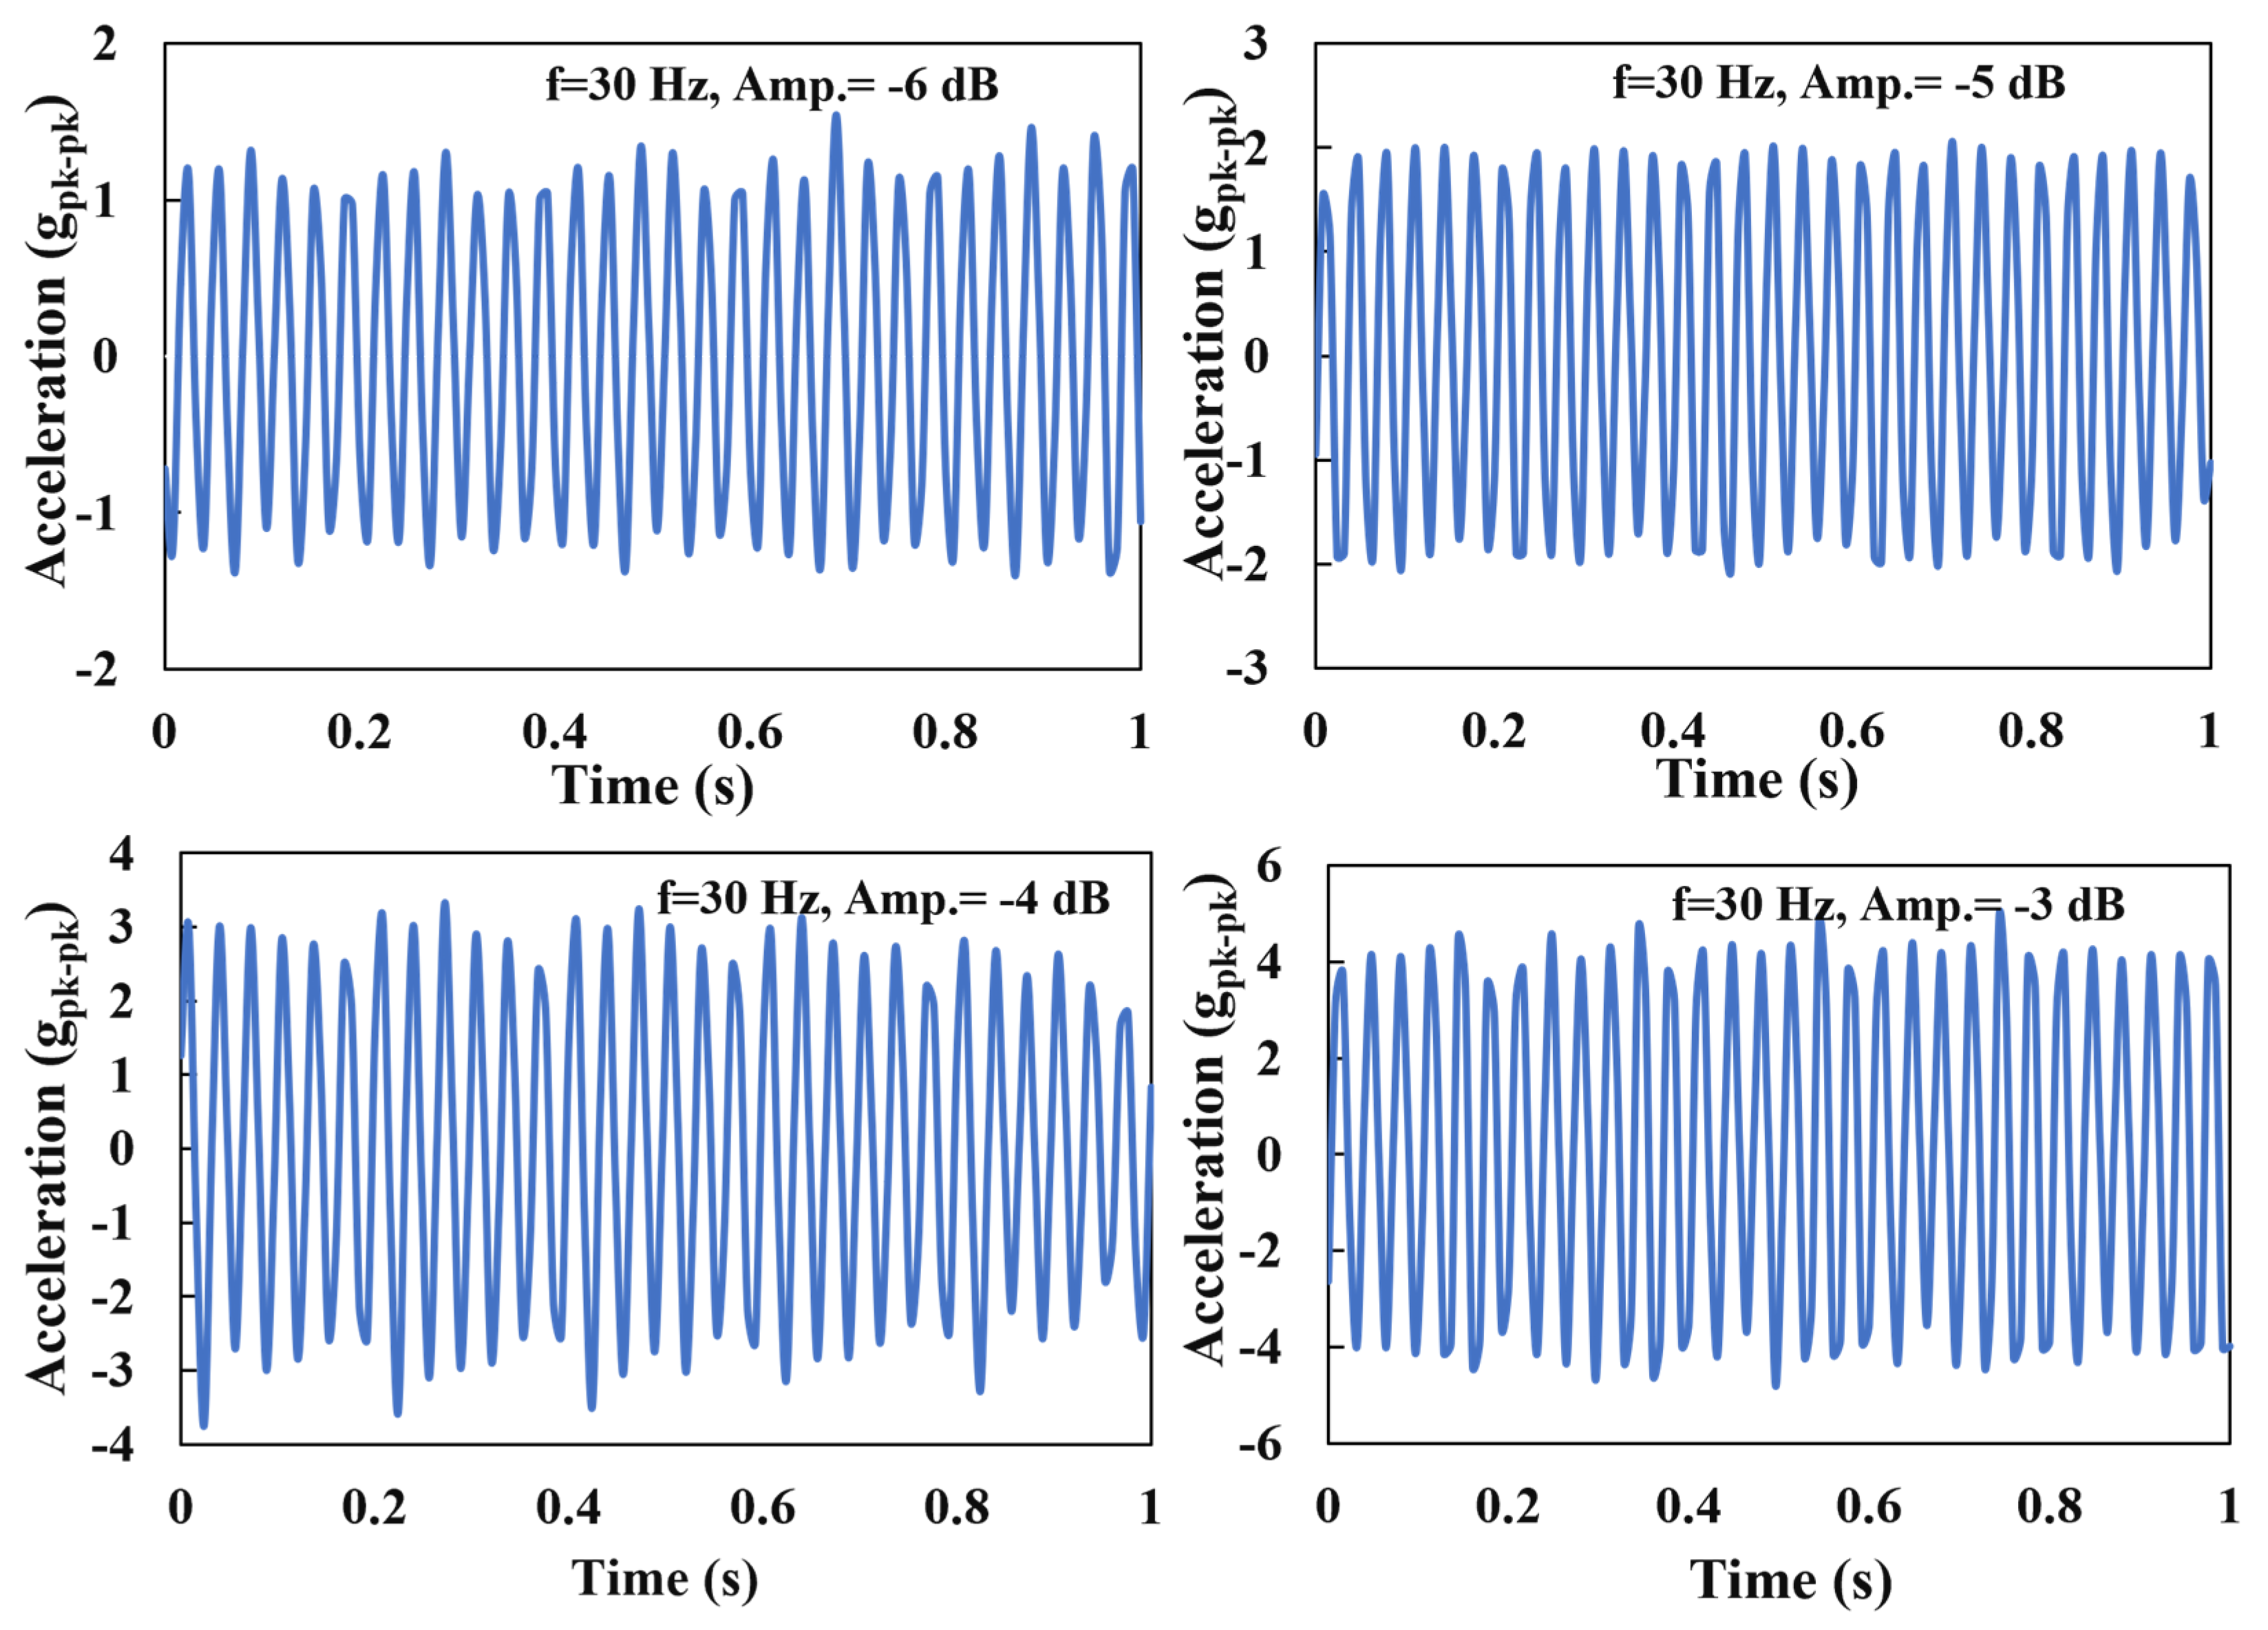
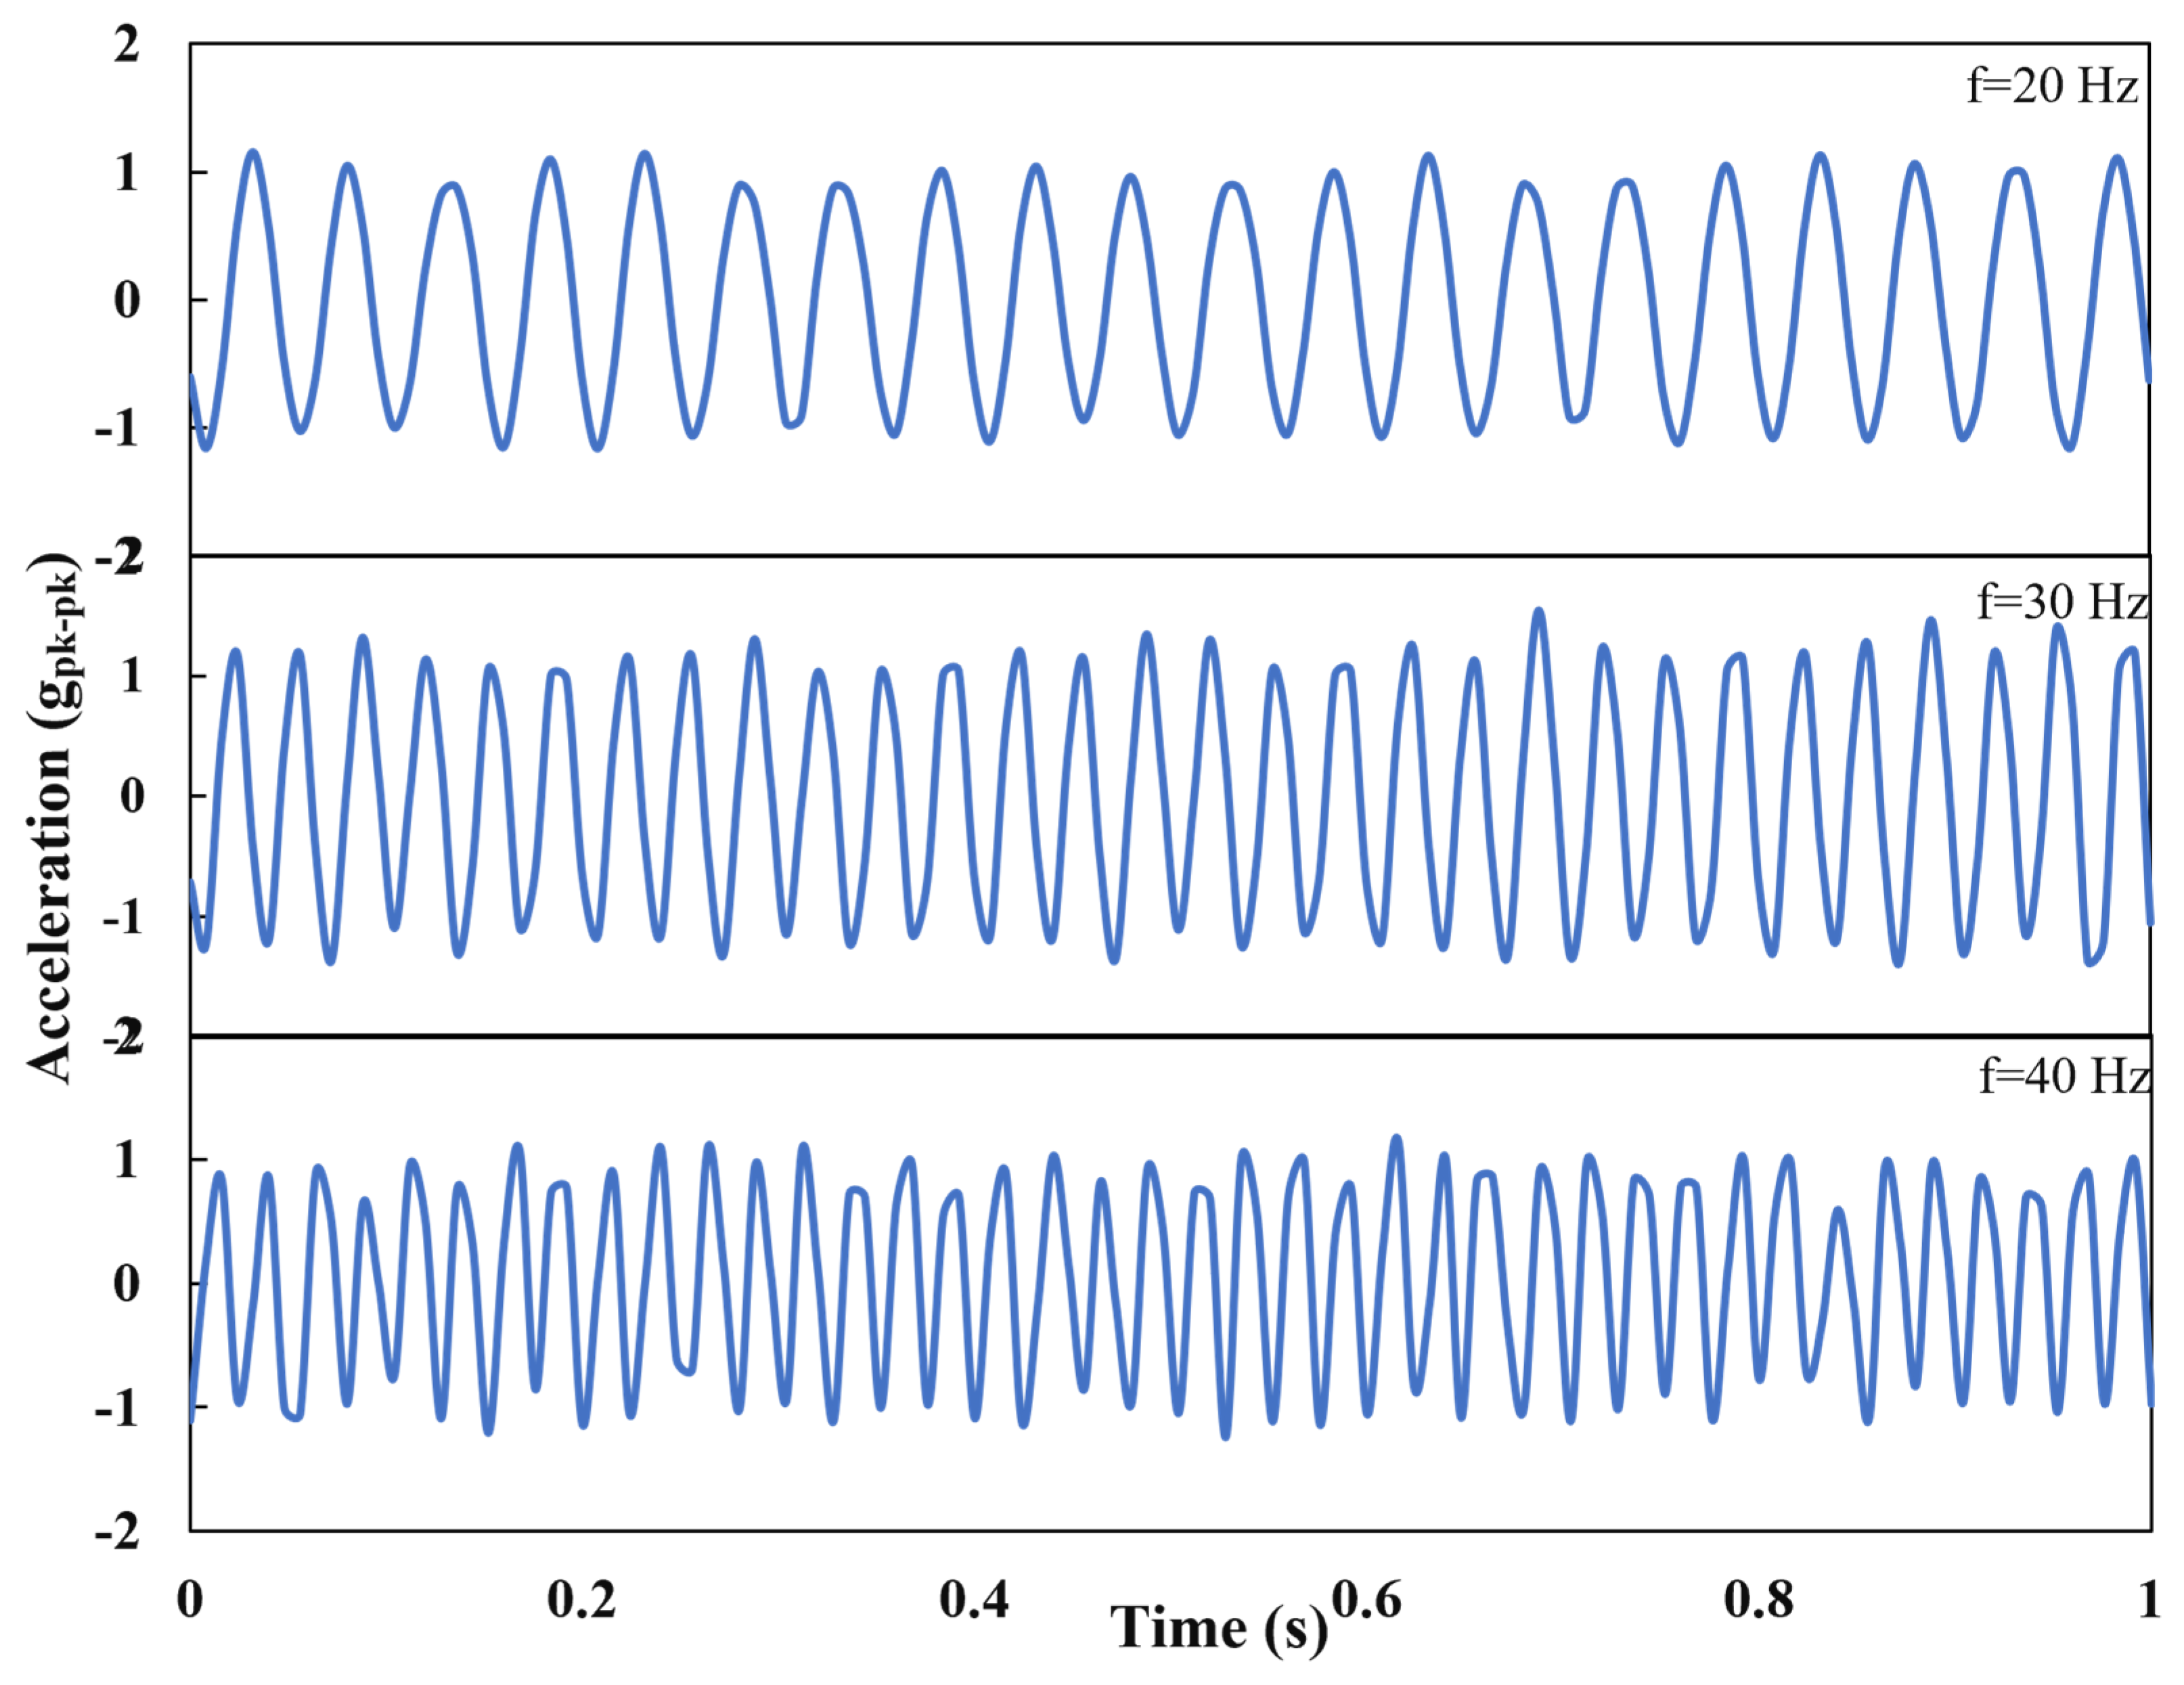
4.1. Acceleration Response
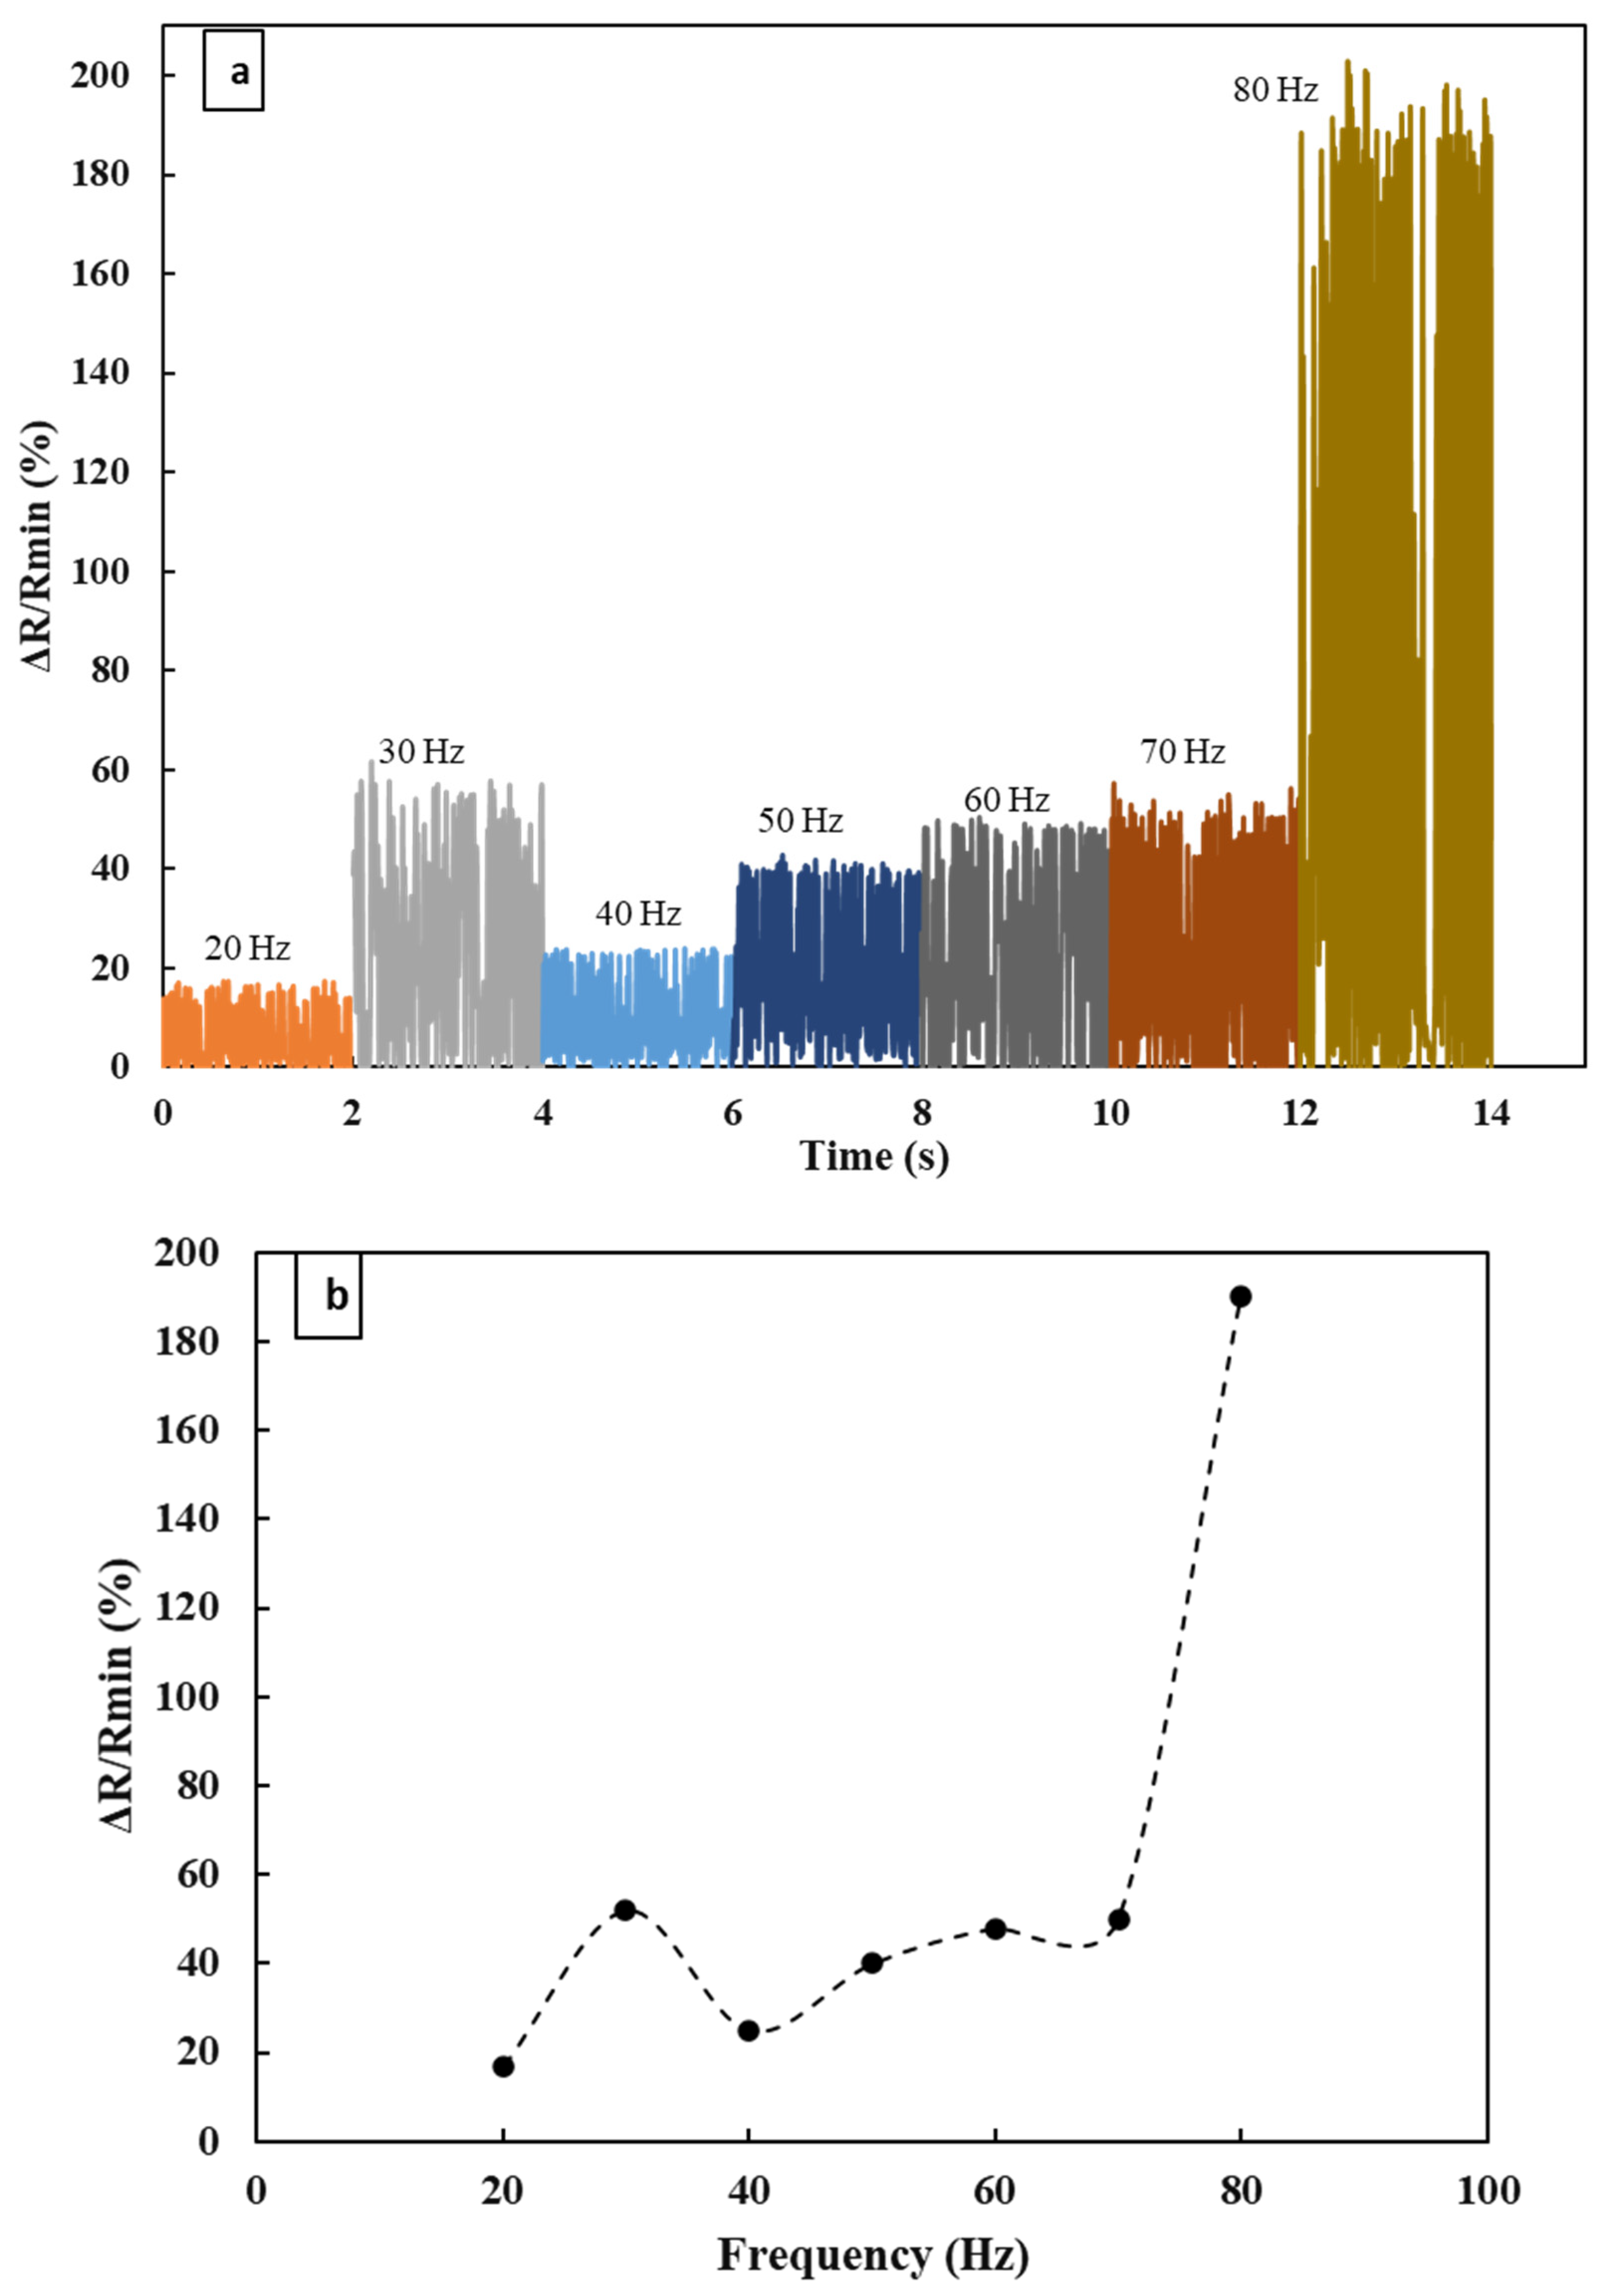
4.2. Resonance
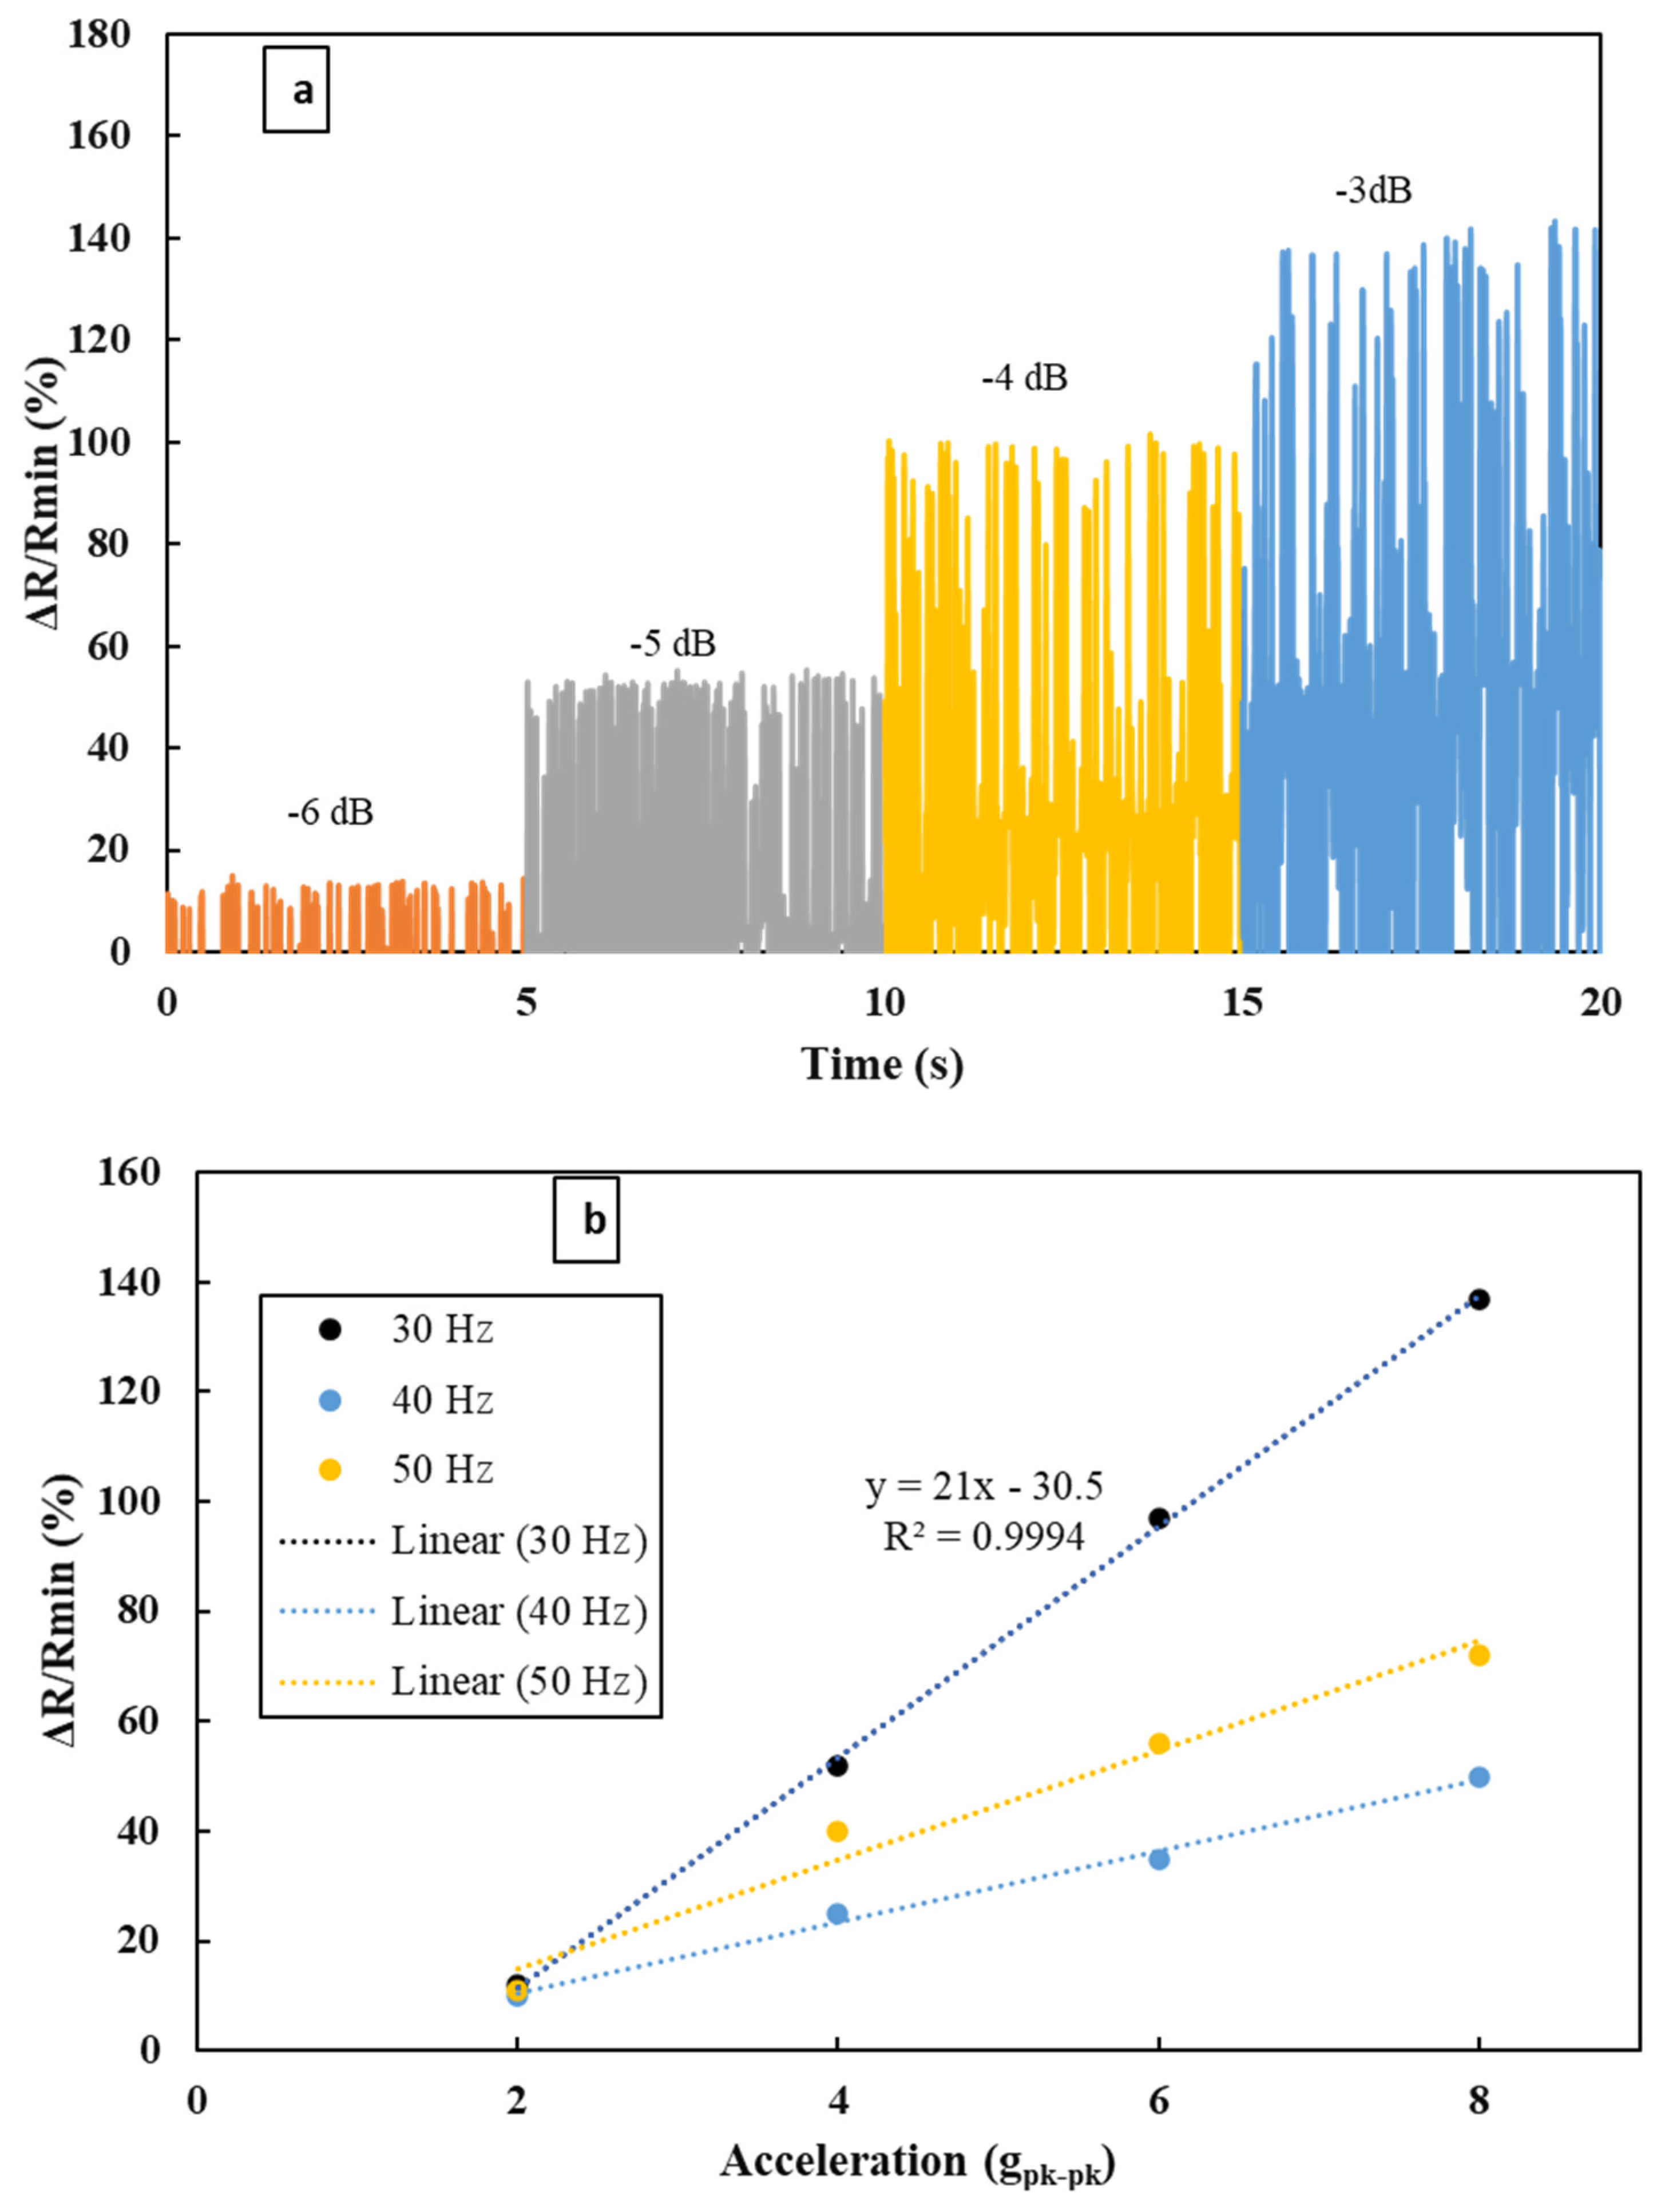
4.3. Sensitivity
5. Conclusions
Author Contributions
Funding
Institutional Review Board Statement
Informed Consent Statement
Data Availability Statement
Acknowledgments
Conflicts of Interest
References
- Keshavarzi, M.; Hasani, J.Y. Design and optimization of fully differential capacitive MEMS accelerometer based on surface micromachining. Microsyst. Technol. 2019, 25, 1369–1377. [Google Scholar] [CrossRef]
- Patel, S.; Park, H.; Bonato, P.; Chan, L.; Rodgers, M. A review of wearable sensors and systems with application in rehabilitation. J. Neuroeng. Rehabil. 2012, 9, 21. [Google Scholar] [CrossRef]
- Bao, L.; Intille, S.S. Activity Recognition from User-Annotated Acceleration Data. In Pervasive Computing. Pervasive 2004. Lecture Notes in Computer Science, volume 3001; Ferscha, A., Mattern, F., Eds.; Springer: Berlin/Heidelberg, Germany, 2004. [Google Scholar] [CrossRef]
- Schäfer, H.; Graeger, V.; Kobs, R. Temperature-independent pressure sensors using polycrystalline silicon strain gauges. Sens. Actuators 1989, 17, 521–527. [Google Scholar] [CrossRef]
- Obermeier, E.; Kopystynski, P. Polysilicon as a material for microsensor applications. Sens. Actuators A Phys. 1992, 30, 149–155. [Google Scholar] [CrossRef]
- Medeiros, K.A.R.; Barbosa, C.R.H.; de Oliveira, E.C. Flow Measurement by Piezoelectric Accelerometers: Application in the Oil Industry. Pet. Sci. Technol. 2015, 33, 1402–1409. [Google Scholar] [CrossRef]
- Sabato, A.; Niezrecki, C.; Fortino, G. Wireless MEMS-Based Accelerometer Sensor Boards for Structural Vibration Monitoring: A Review. IEEE Sens. J. 2017, 17, 226–235. [Google Scholar] [CrossRef]
- Amorebieta, J.; Ortega-Gomez, A.; Durana, G.; Fernández, R.; Antonio-Lopez, E.; Schülzgen, A.; Zubia, J.; Amezcua-Correa, R.; Villatoro, J. Highly sensitive multicore fiber accelerometer for low frequency vibration sensing. Sci. Rep. 2020, 10, 16180. [Google Scholar] [CrossRef]
- Zheng, D.; Liu, Y.; Guo, Z.; Zhao, X.; Fan, S. Theory and experiment research for ultra-low frequency maglev vibration sensor. Rev. Sci. Instrum. 2015, 86, 105001. [Google Scholar] [CrossRef]
- Mukhiya, R.; Santosh, M.; Sharma, A.; Kumar, S.S.; Bose, S.; Gopal, R.; Pant, B. Fabrication and characterization of a bulk micromachined polysilicon piezoresistive accelerometer. Mater. Today Proc. 2022, 48, 619–621. [Google Scholar] [CrossRef]
- Li, Z.; Fan, X.; Yi, J.; Tan, S.; Zhang, Z.; Lu, T.; Zhang, L.; Zhu, W. Outstanding Piezoelectric Sensitivity of Poly (Vinylidene-Trifluoroethylene) for Acceleration Sensor Application. IEEE Trans. Dielectr. Electr. Insul. 2022, 29, 808–814. [Google Scholar] [CrossRef]
- Tian, B.; Liu, H.; Yang, N.; Zhao, Y.; Jiang, Z. Design of a Piezoelectric Accelerometer with High Sensitivity and Low Transverse Effect. Sensors 2016, 16, 1587. [Google Scholar] [CrossRef] [PubMed]
- Hewa-Kasakarage, N.N.; Kim, D.; Kuntzman, M.L.; Hall, N.A. Micromachined piezoelectric accelerometers via epitaxial silicon cantilevers and bulk silicon proof masses. J. Microelectromechanical Syst. 2013, 22, 1438–1446. [Google Scholar] [CrossRef]
- Tims, A.C.; Davidson, R.L.; Timme, R.W. High sensitivity piezoelectric accelerometer. Rev. Sci. Instrum. 2008, 46, 554. [Google Scholar] [CrossRef]
- Kamentser, B. New generation of strain gauge accelerometers. Kamentser, B. New generation of strain gauge accelerometers. SAE Tech. Pap. 1994, 942151. [Google Scholar] [CrossRef]
- Gao, X.; Wang, Y.; Yuan, B.; Yuan, Y.; Dai, Y.; Xu, G. Low-cost vibration sensor based on dual fiber Bragg gratings and light intensity measurement. Appl. Opt. 2013, 52, 6782–6787. [Google Scholar] [CrossRef]
- Zhang, J.; Qiao, X.; Hu, M.; Feng, Z.; Gao, H.; Yang, Y. Flextensional fiber Bragg grating-based accelerometer for low frequency vibration measurement. Chin. Opt. Lett. 2011, 9, 090607. [Google Scholar] [CrossRef]
- Andrew Swartz, R.; Lynch, J.P.; Zerbst, S.; Sweetman, B.; Rolfes, R. Structural monitoring of wind turbines using wireless sensor networks. Smart Struct. Syst. 2010, 6, 183–196. [Google Scholar] [CrossRef]
- Cho, S.; Yun, C.B.; Lynch, J.P.; Zimmerman, A.T.; Spencer Jr, B.F.; Nagayama, T. Smart Wireless Sensor Technology for Structural Health Monitoring of Civil Structures|Request PDF. Steel Struct. 2008, 8, 267–275. [Google Scholar]
- Sabato, A.; Feng, M.Q. Feasibility of Frequency-Modulated Wireless Transmission for a Multi-Purpose MEMS-Based Accelerometer. Sensors 2014, 14, 16563–16585. [Google Scholar] [CrossRef]
- Maharjan, M.; Samoei, V.K.; Amili, O.; Sano, K.; Honma, H.; Jayatissa, A.H. Design and Fabrication of a Graphene/Polyvinylidene Fluoride Nanocomposite-Based Airflow Sensor. ACS Omega 2022, 7, 7981–7988. [Google Scholar] [CrossRef]
- Veena, S.; Rai, N.; Morey, A.M.R.; Suresh, H.L.; Shaik, H. Design and Simulation of MEMS Based Capacitive Accelerometer. Lect. Notes Netw. Syst. 2022, 244, 207–223. [Google Scholar]
- Amjadi, M.; Pichitpajongkit, A.; Lee, S.; Ryu, S.; Park, I. Highly Stretchable and Sensitive Strain Sensor Based on Silver Nanowire–Elastomer Nanocomposite. ACS Nano 2014, 8, 5154–5163. [Google Scholar] [CrossRef] [PubMed]
- Wang, W.; Jayatissa, A.H. Comparison study of graphene based conductive nanocomposites using poly(methyl methacrylate) and polypyrrole as matrix materials. J. Mater. Sci. Mater. Electron. 2015, 26, 7780–7783. [Google Scholar] [CrossRef]
- Itapu, B.; Jayatissa, A. A Review in Graphene/Polymer Composites. Chem. Sci. Int. J. 2018, 23, 1–16. [Google Scholar] [CrossRef]
- Wang, W.; Jayatissa, A.H. Computational and experimental study of electrical conductivity of graphene/poly(methyl methacrylate) nanocomposite using Monte Carlo method and percolation theory. Synth. Met. 2015, 204, 141–147. [Google Scholar] [CrossRef]
- Shahbaz, M.A.; Warsi, Z.H.; Irshad, S.M.; Irshad, S.T.; Jawed, S.A. Design and analysis of CMOS MEMS based single proof mass Tri-axial capacitive accelerometer with readout integrated circuit. In Proceedings of the 2017 First International Conference on Latest Trends in Electrical Engineering and Computing Technologies (INTELLECT), Karachi, Pakistan, 15–16 November 2017; pp. 1–8. [Google Scholar]
- Li, P.; Li, X.; Li, E.; Shen, Q.; Chang, H. Design and fabrication of an in-plane SOI MEMS accelerometer with a high yield rate. In Proceedings of the 10th IEEE International Conference on Nano/Micro Engineered and Molecular Systems, Xi’an, China, 7–11 April 2015; pp. 511–514. [Google Scholar]


| Principle | Sensitivity (V/g) | Range (g) | BW (Hz) | Ref. |
|---|---|---|---|---|
| PZT | 9 mV/g | – | – | Tian et al. [12] |
| 15.6 mV/g | – | 60–1.5 k | Nishshanka et al. [13] | |
| 2.82 | – | 2–500 | Tims et al. [14] | |
| Strain | - | 0–5 | <100 | Kamentse et al. [15] |
| FBG | 0.135 | 0.1–2 | 80–800 | Gao et al. [16] |
| 0.362 | <0.5 | 1–10 | Zhang et al. [17] | |
| MEMS | 2 | ±1 | 0–50 | Swartz et al. [18] |
| 1 | ±2 | 0–50 | Cho et al. [19] | |
| 1.2 | ±3 | 0.2–1500 | Sabato et al. [20] | |
| Others | - | - | 0.2–0.4 | Zheng et al. [9] |
| Parameters | Symbols | Values |
|---|---|---|
| Length and width of the spring beam | Wb × Lb | 1.5 mm × 10 mm |
| Mass | m | 0.2 g |
| Young’s modulus | E | 1.08 × 10⁹ Pa |
| Thickness of beam | ts | 105 μm |
Disclaimer/Publisher’s Note: The statements, opinions and data contained in all publications are solely those of the individual author(s) and contributor(s) and not of MDPI and/or the editor(s). MDPI and/or the editor(s) disclaim responsibility for any injury to people or property resulting from any ideas, methods, instructions or products referred to in the content. |
© 2023 by the authors. Licensee MDPI, Basel, Switzerland. This article is an open access article distributed under the terms and conditions of the Creative Commons Attribution (CC BY) license (https://creativecommons.org/licenses/by/4.0/).
Share and Cite
Maharjan, S.; Samoei, V.K.; Jayatissa, A.H. Graphene/PVDF Nanocomposite-Based Accelerometer for Detection of Low Vibrations. Materials 2023, 16, 1586. https://doi.org/10.3390/ma16041586
Maharjan S, Samoei VK, Jayatissa AH. Graphene/PVDF Nanocomposite-Based Accelerometer for Detection of Low Vibrations. Materials. 2023; 16(4):1586. https://doi.org/10.3390/ma16041586
Chicago/Turabian StyleMaharjan, Surendra, Victor K. Samoei, and Ahalapitiya H. Jayatissa. 2023. "Graphene/PVDF Nanocomposite-Based Accelerometer for Detection of Low Vibrations" Materials 16, no. 4: 1586. https://doi.org/10.3390/ma16041586