
Nondestructive Evaluation for Hydration and Setting Time of Gypsum Modified Calcium Sulfoaluminate Cement Paste

Abstract
:1. Introduction
2. Experimental Program
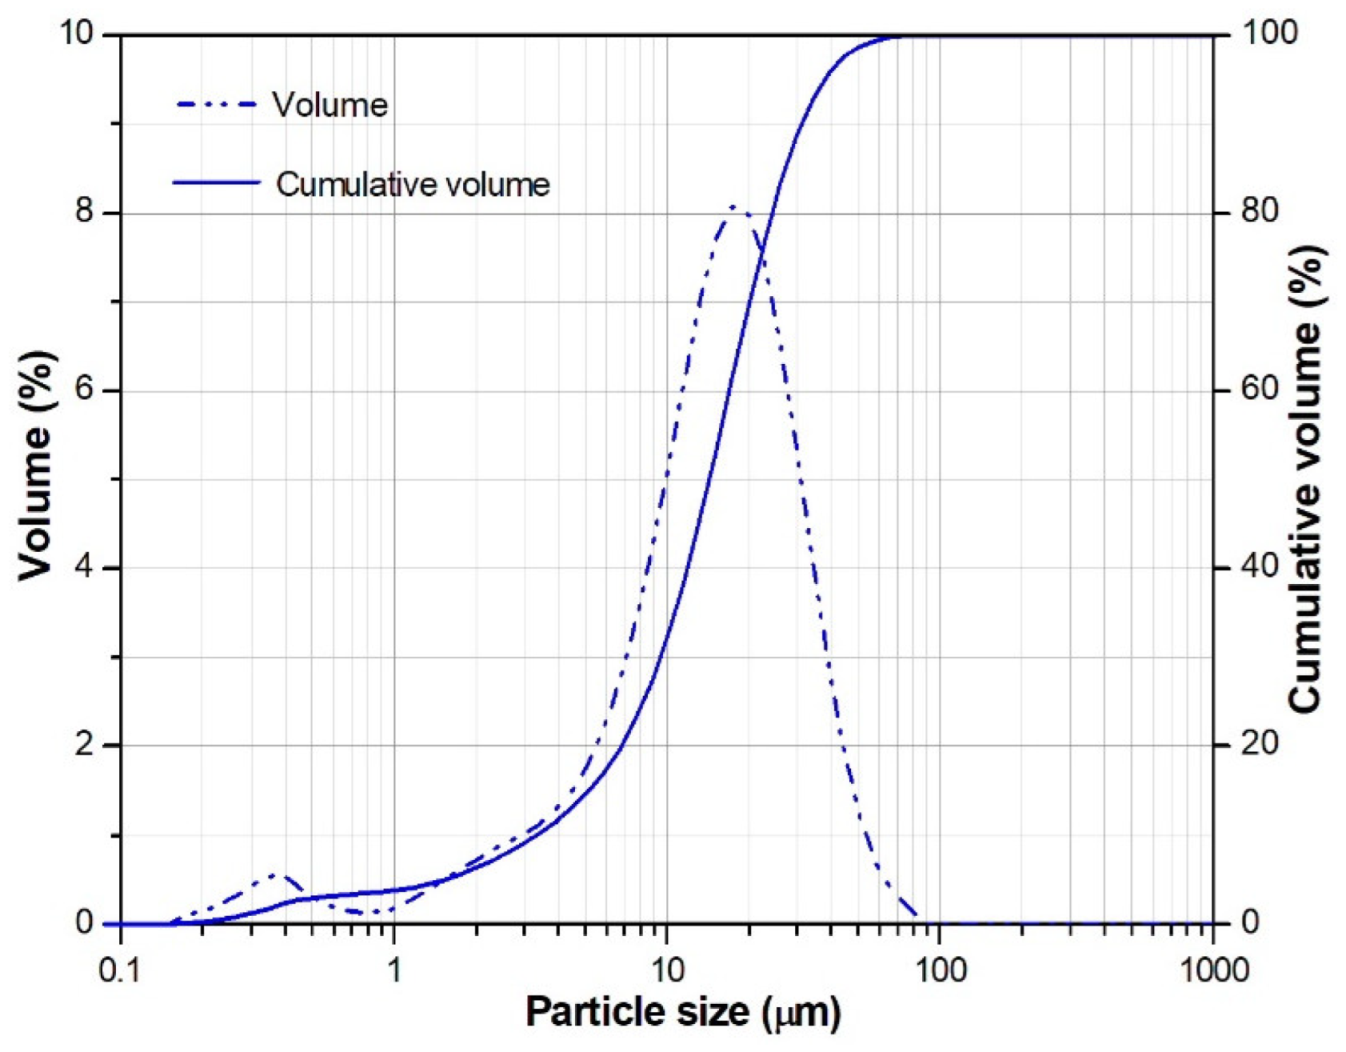
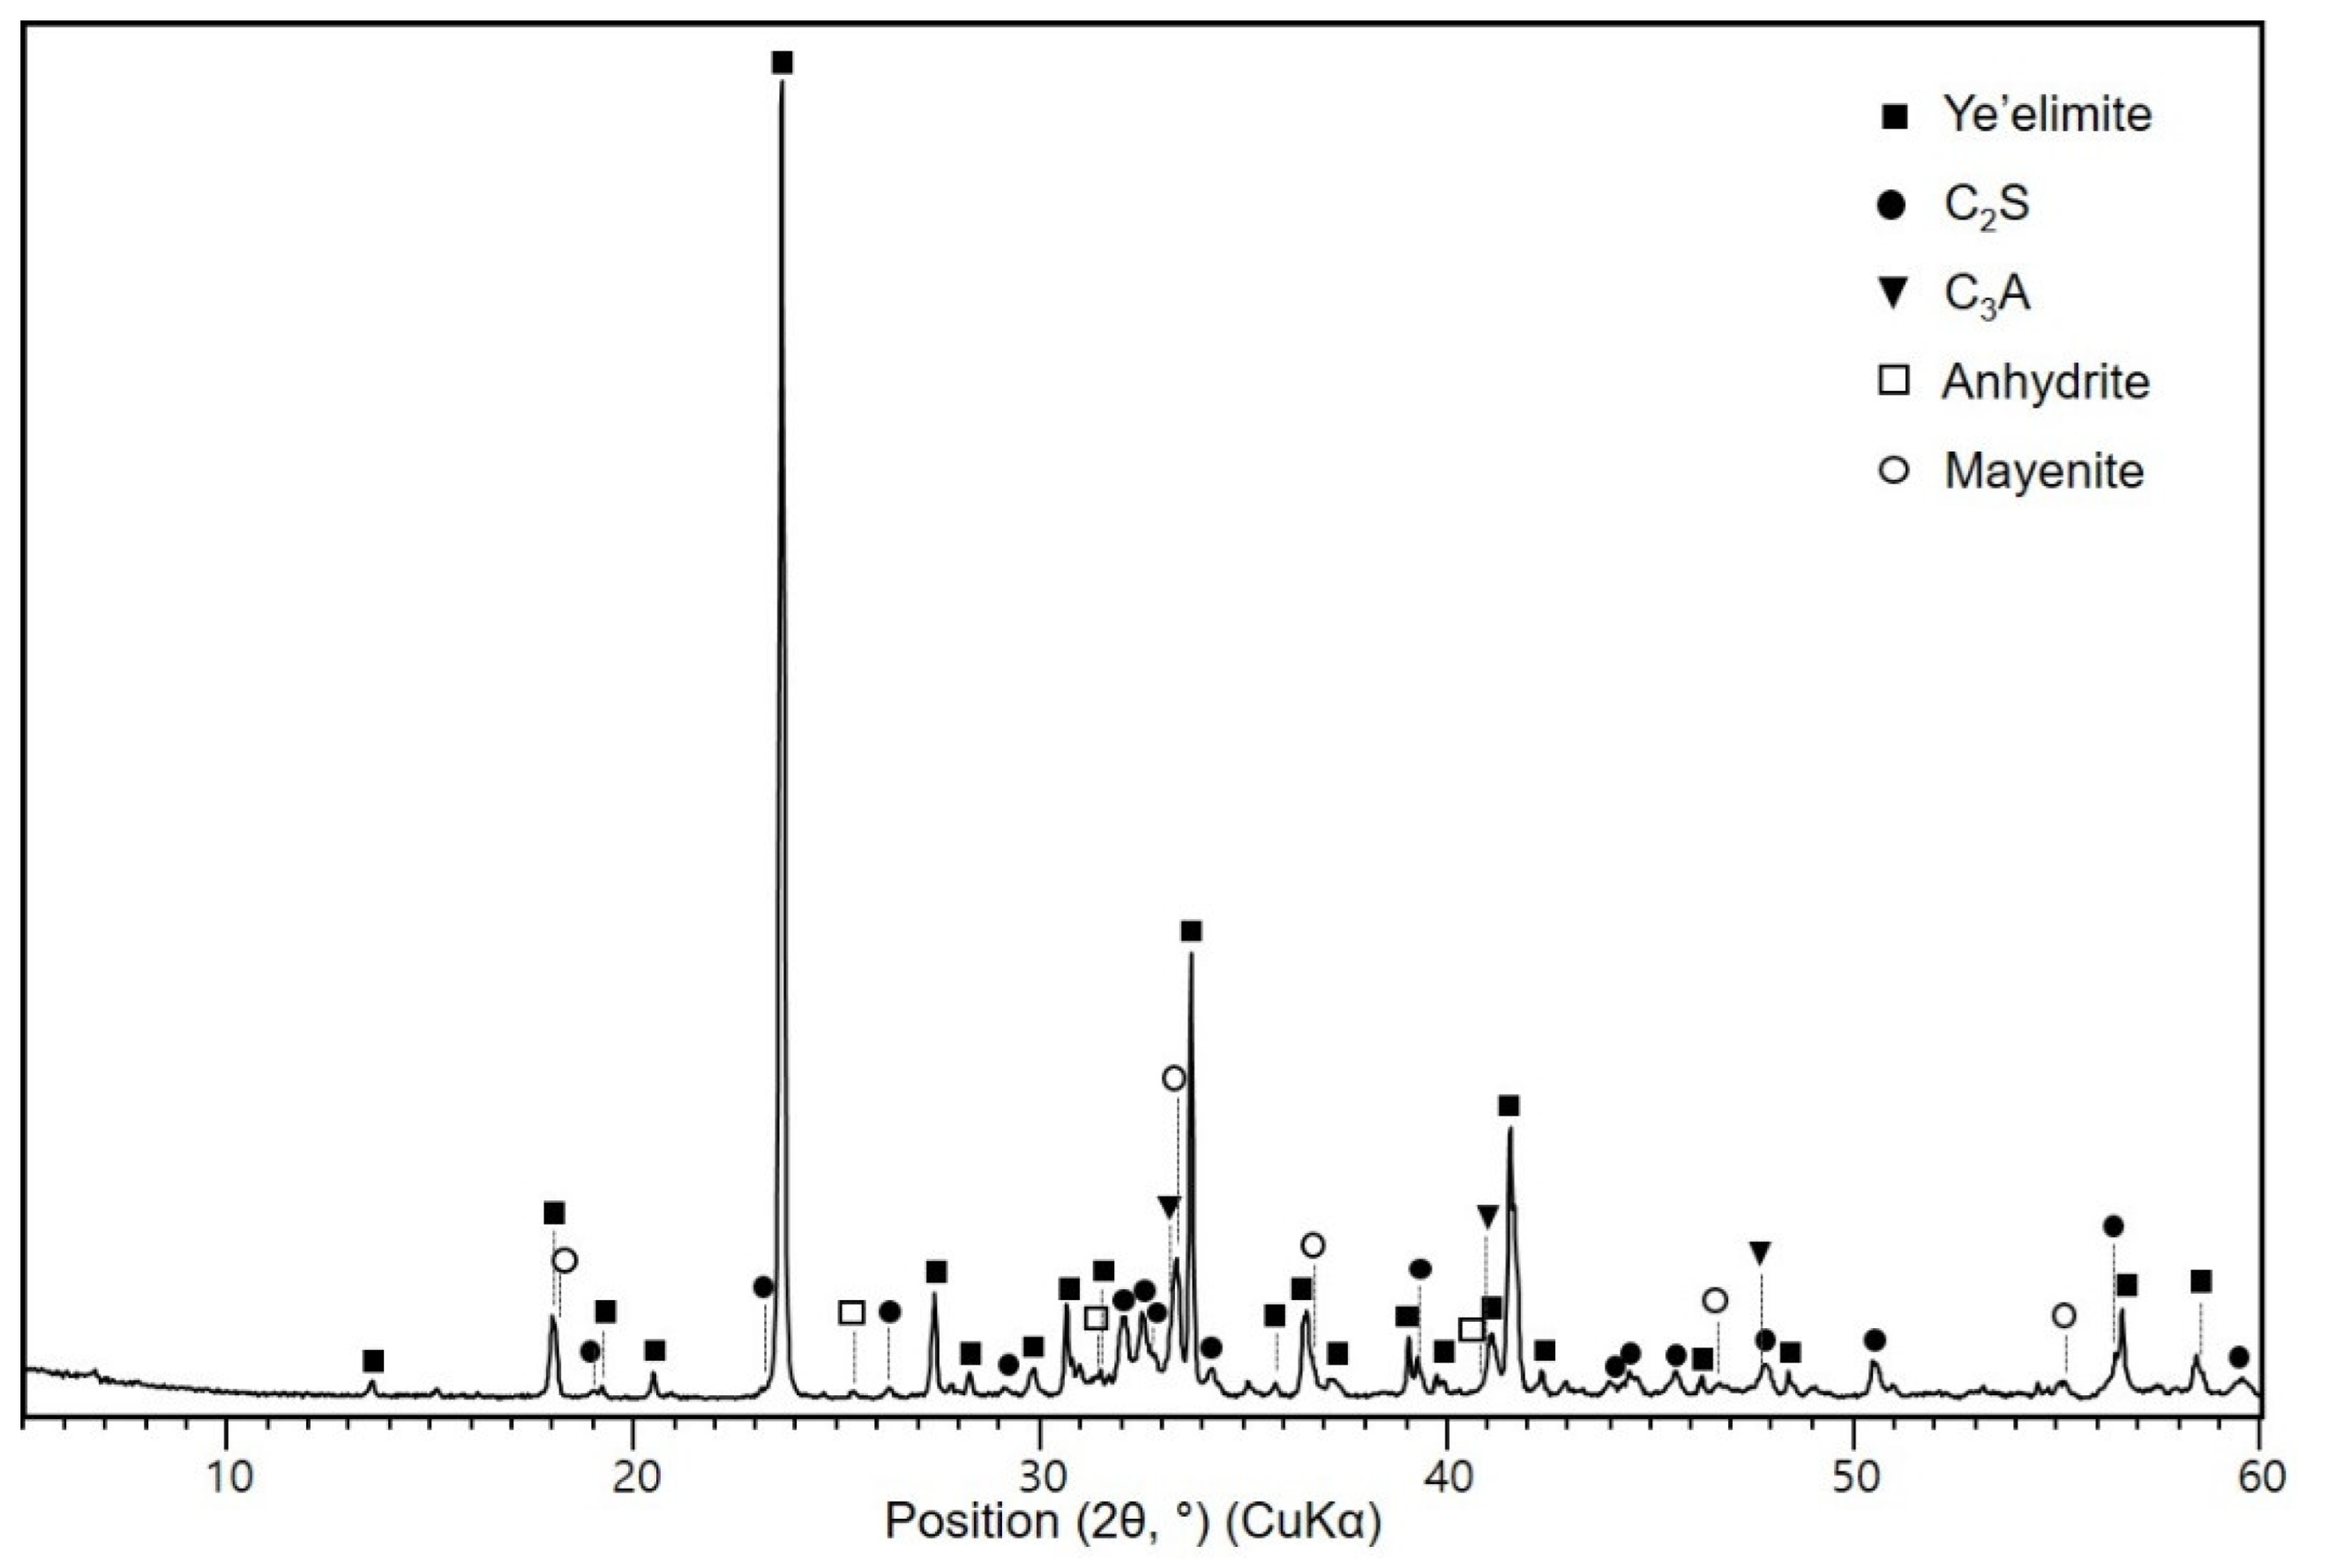
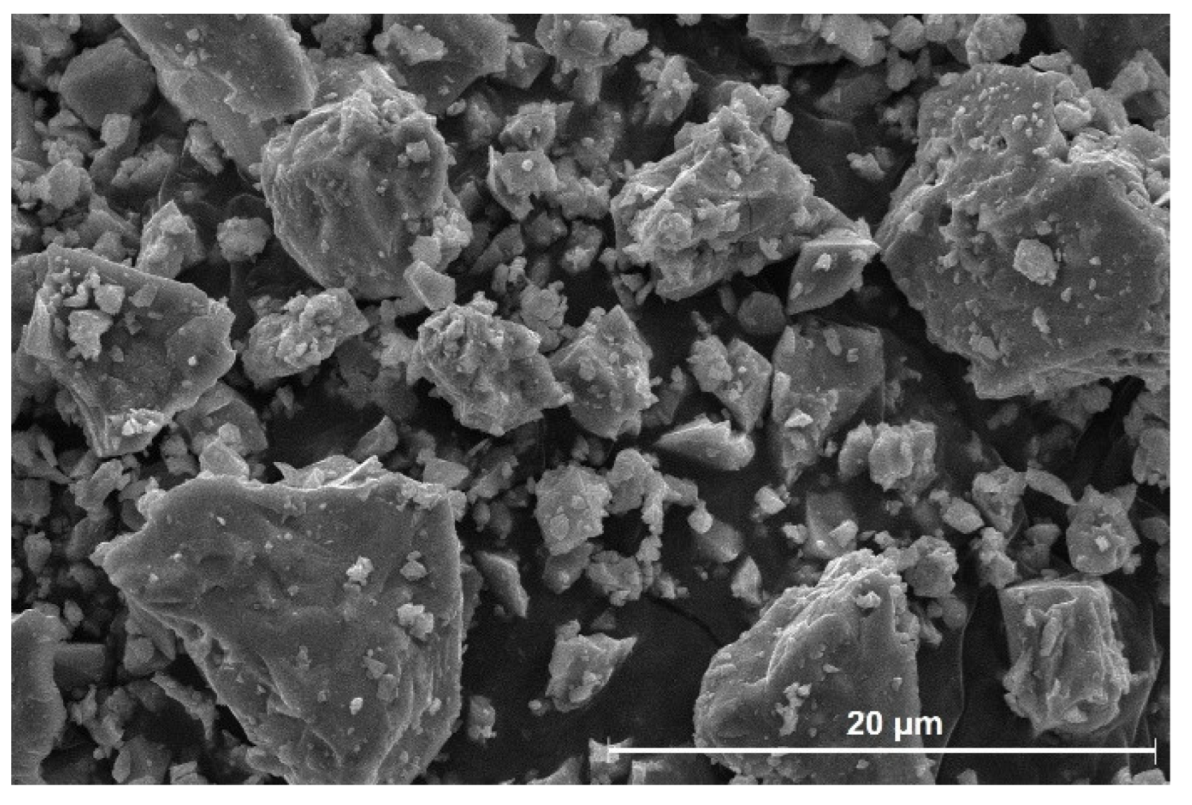
2.1. Materials
2.2. Sample Preparation
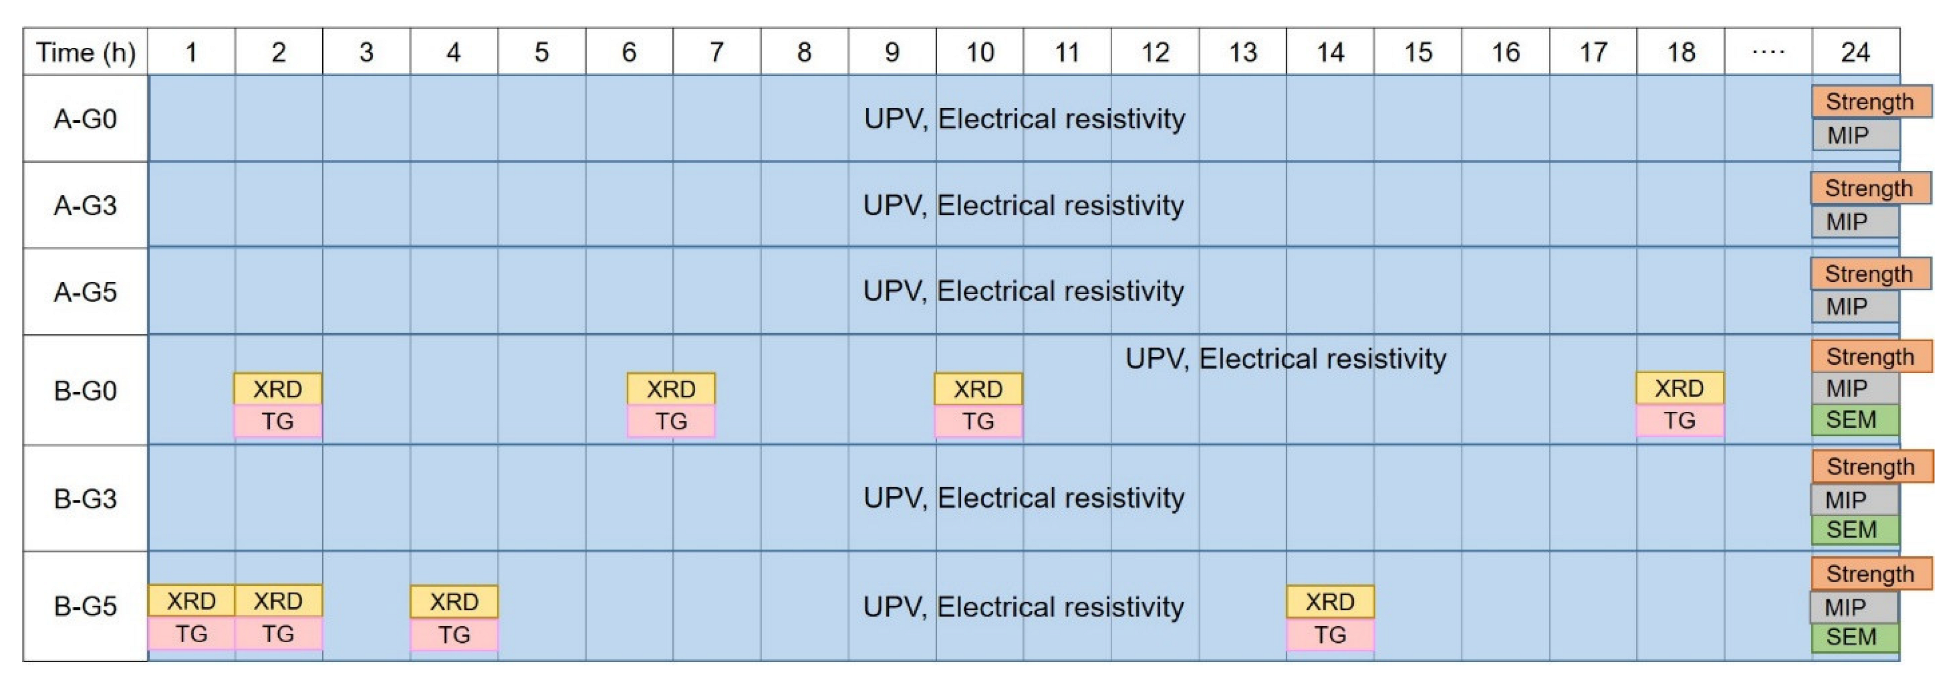
2.3. Test Method
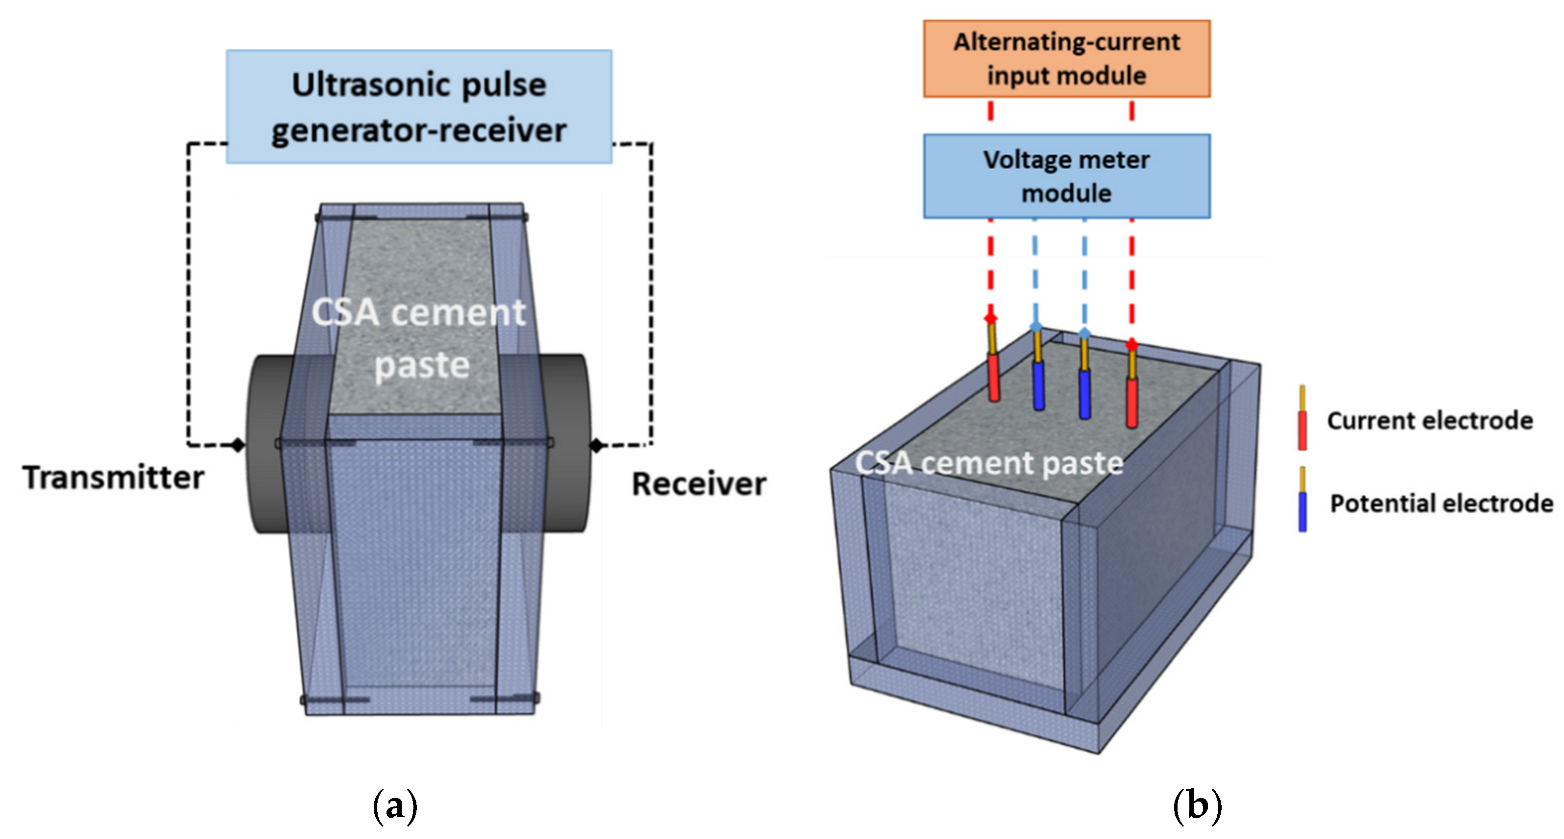
2.3.1. UPV
2.3.2. Electrical Resistivity
2.3.3. Pretreatment for XRD, TG, MIP, and SEM
2.3.4. XRD
2.3.5. TG
2.3.6. MIP
2.3.7. Compressive Strength
2.3.8. SEM
3. Results and Discussion
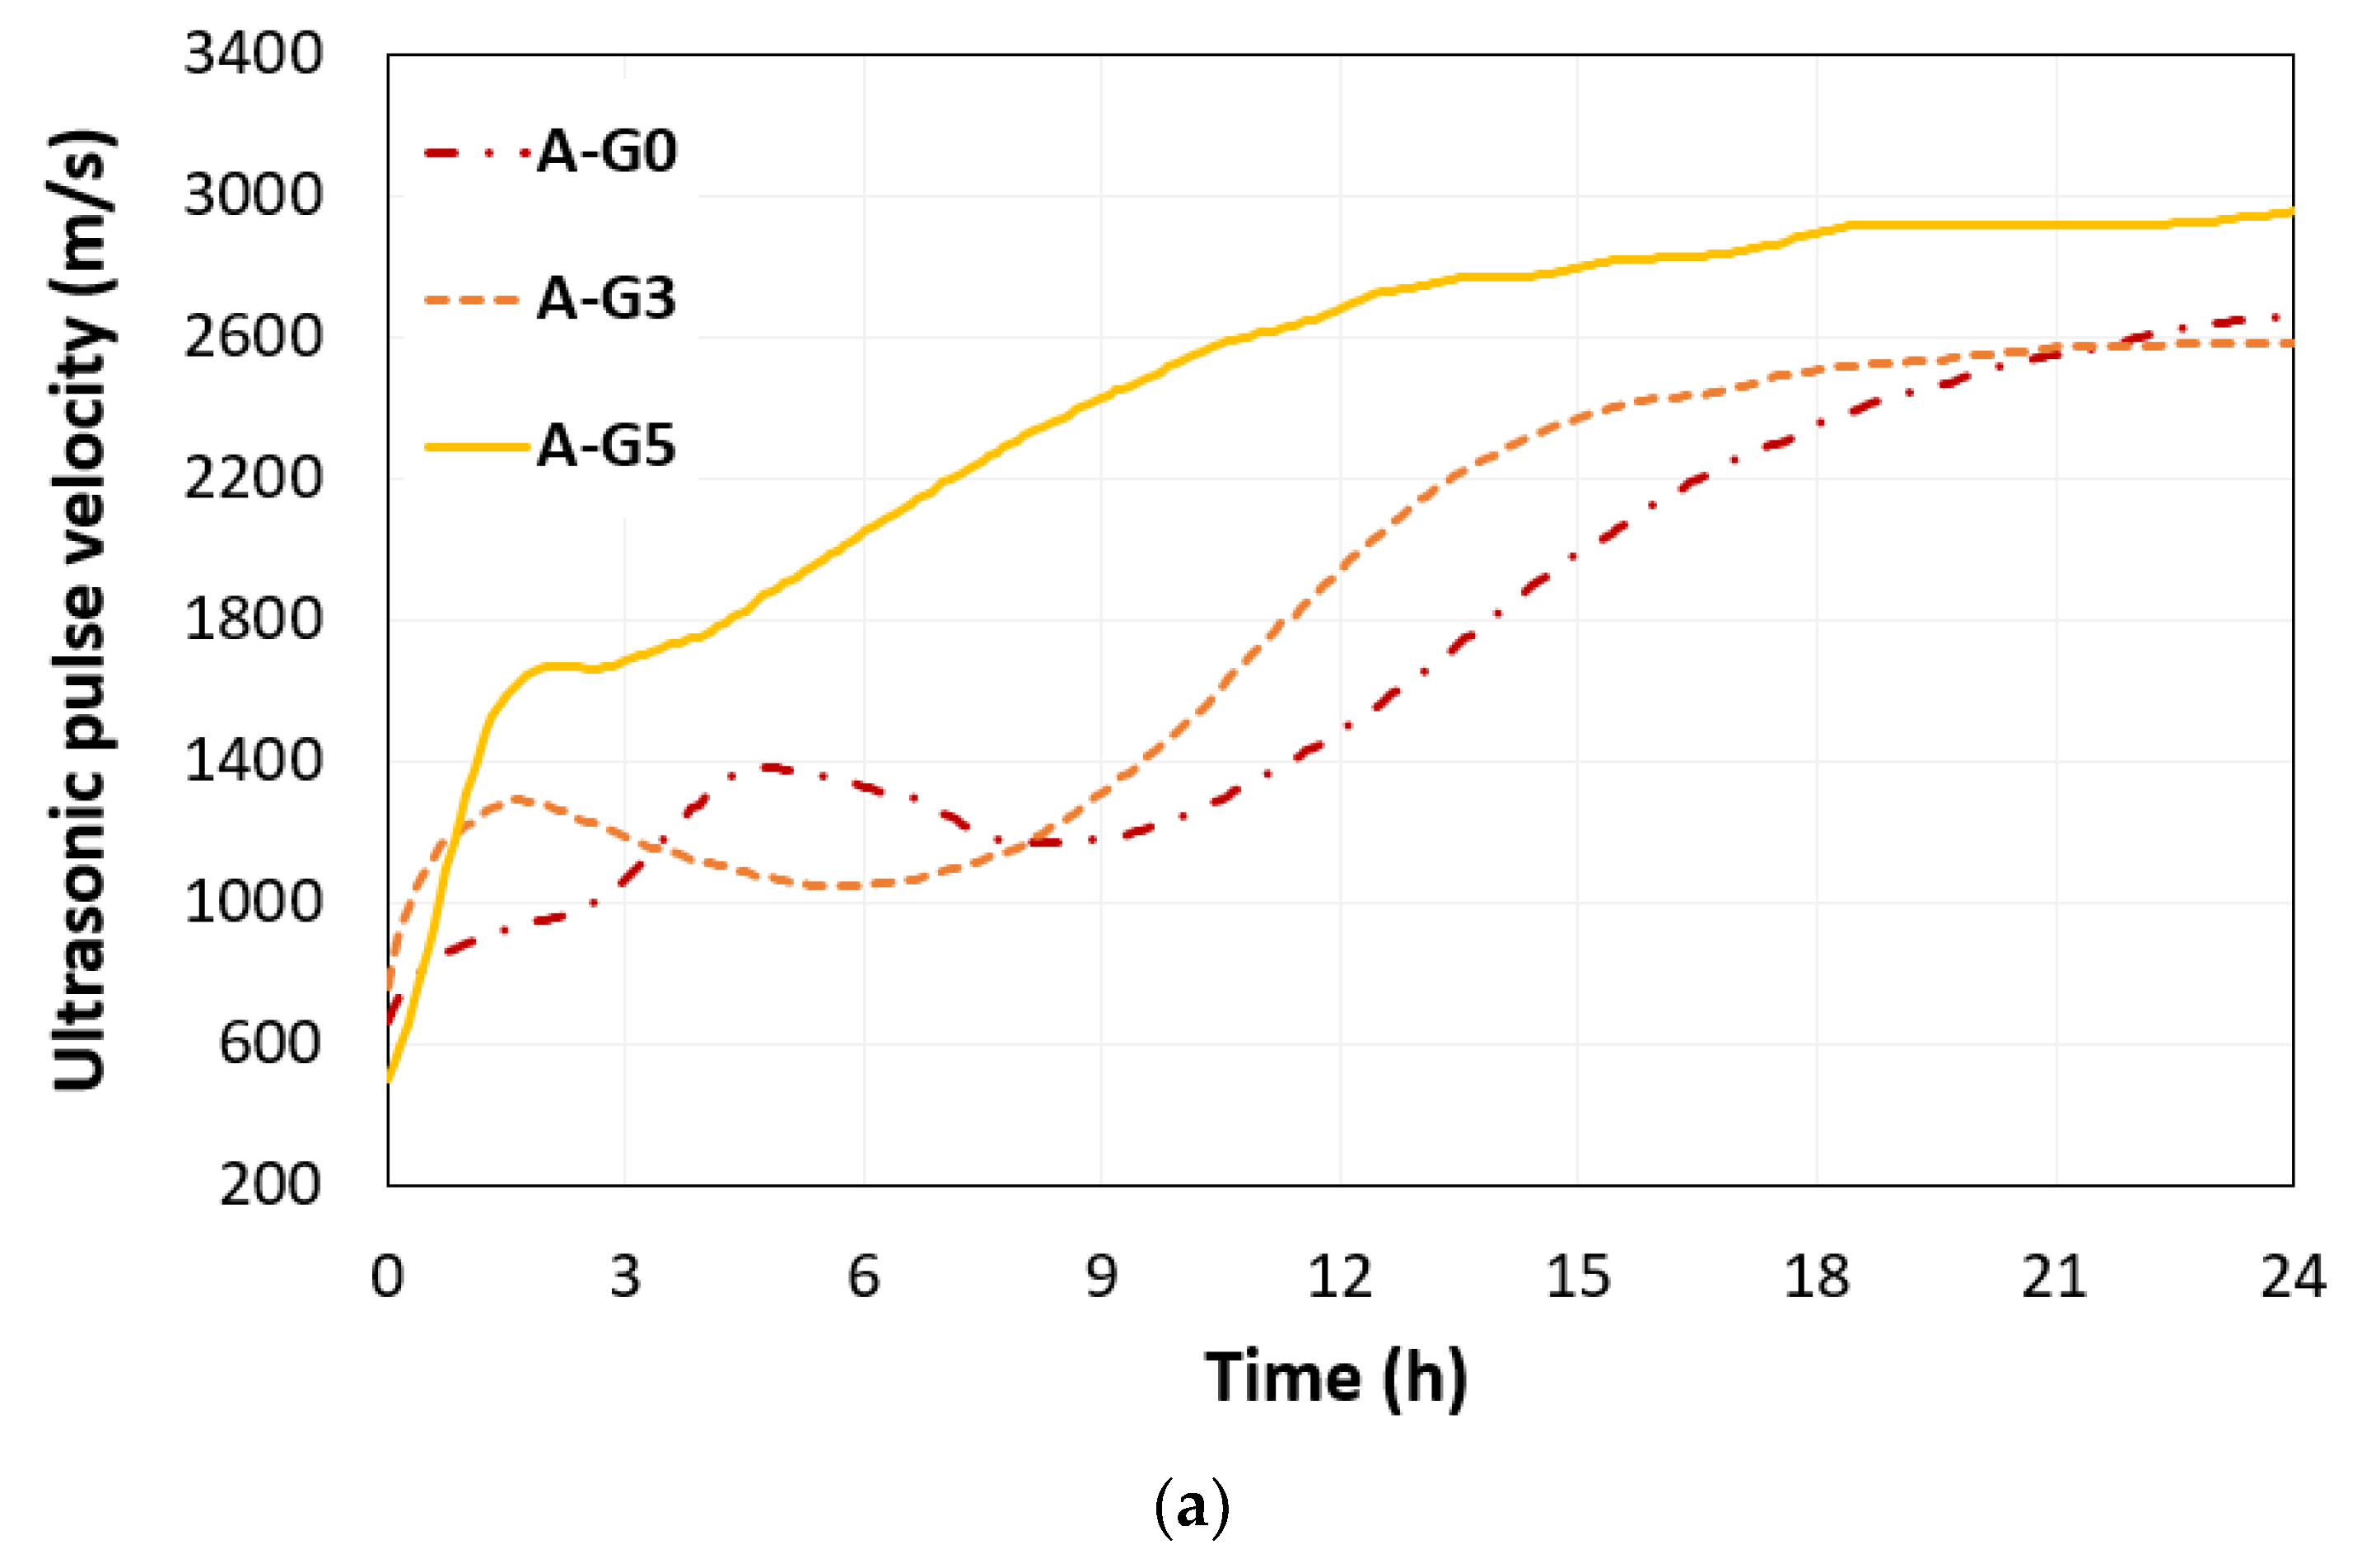
3.1. UPV
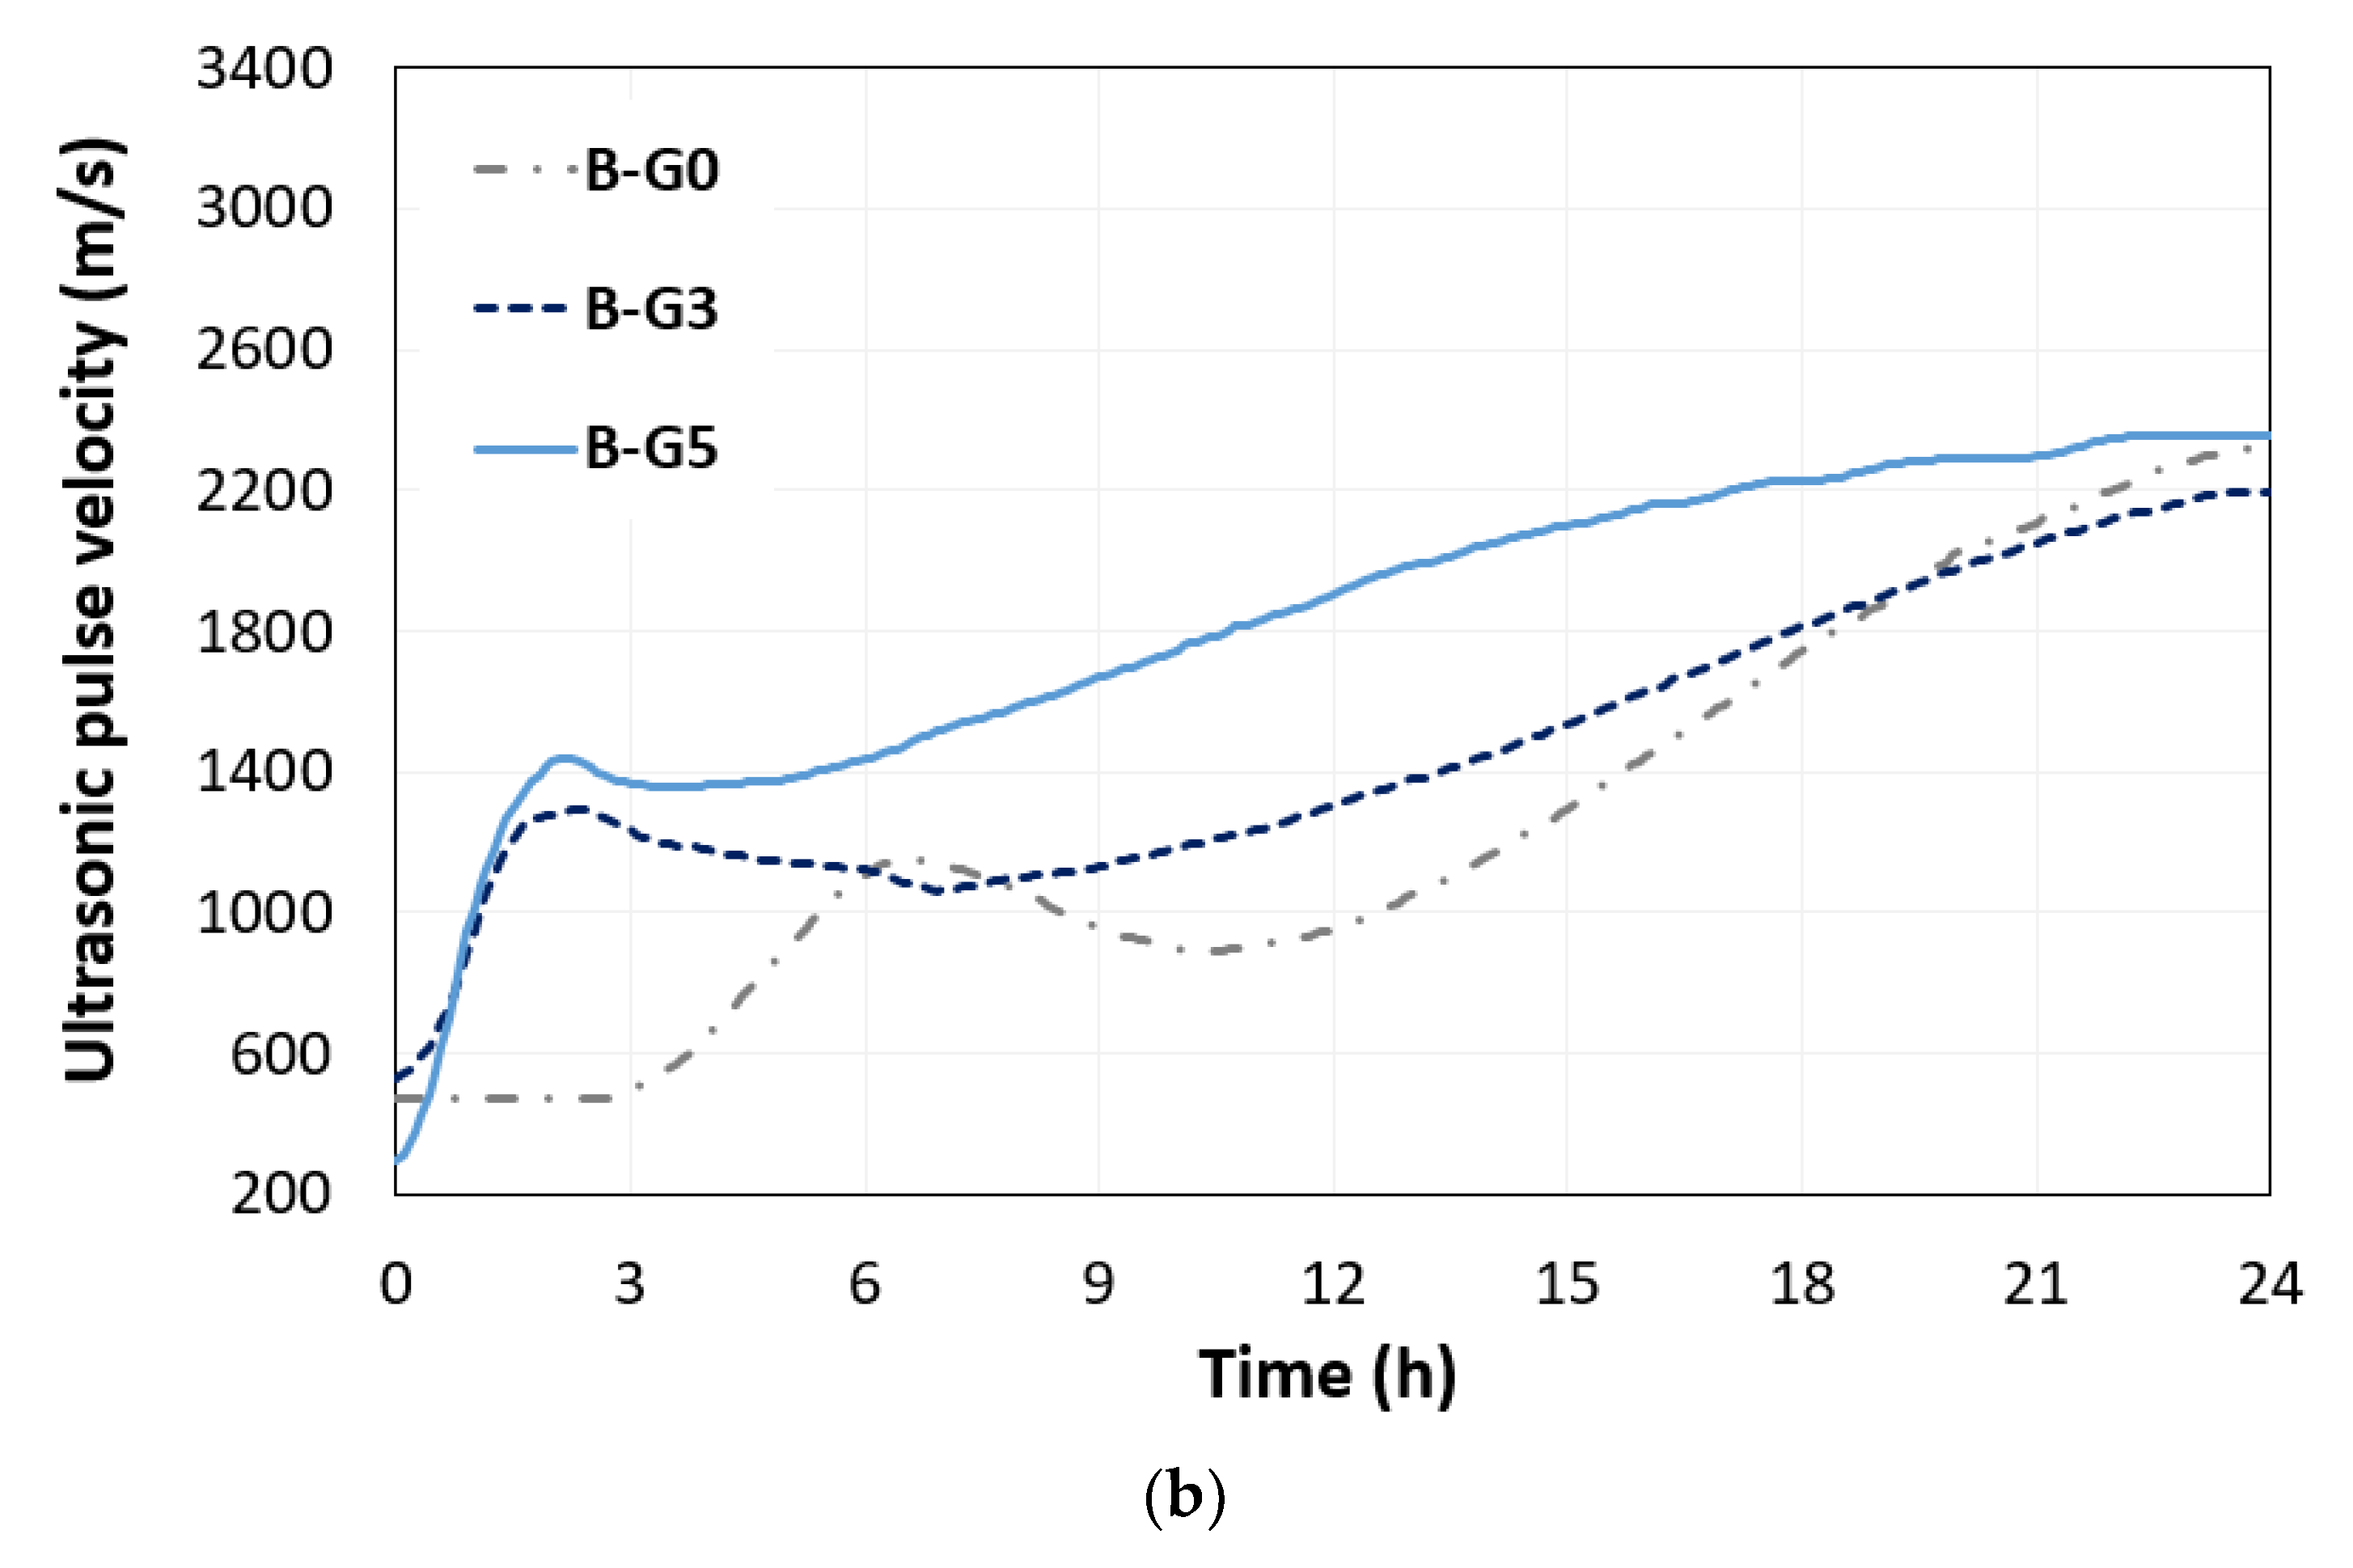
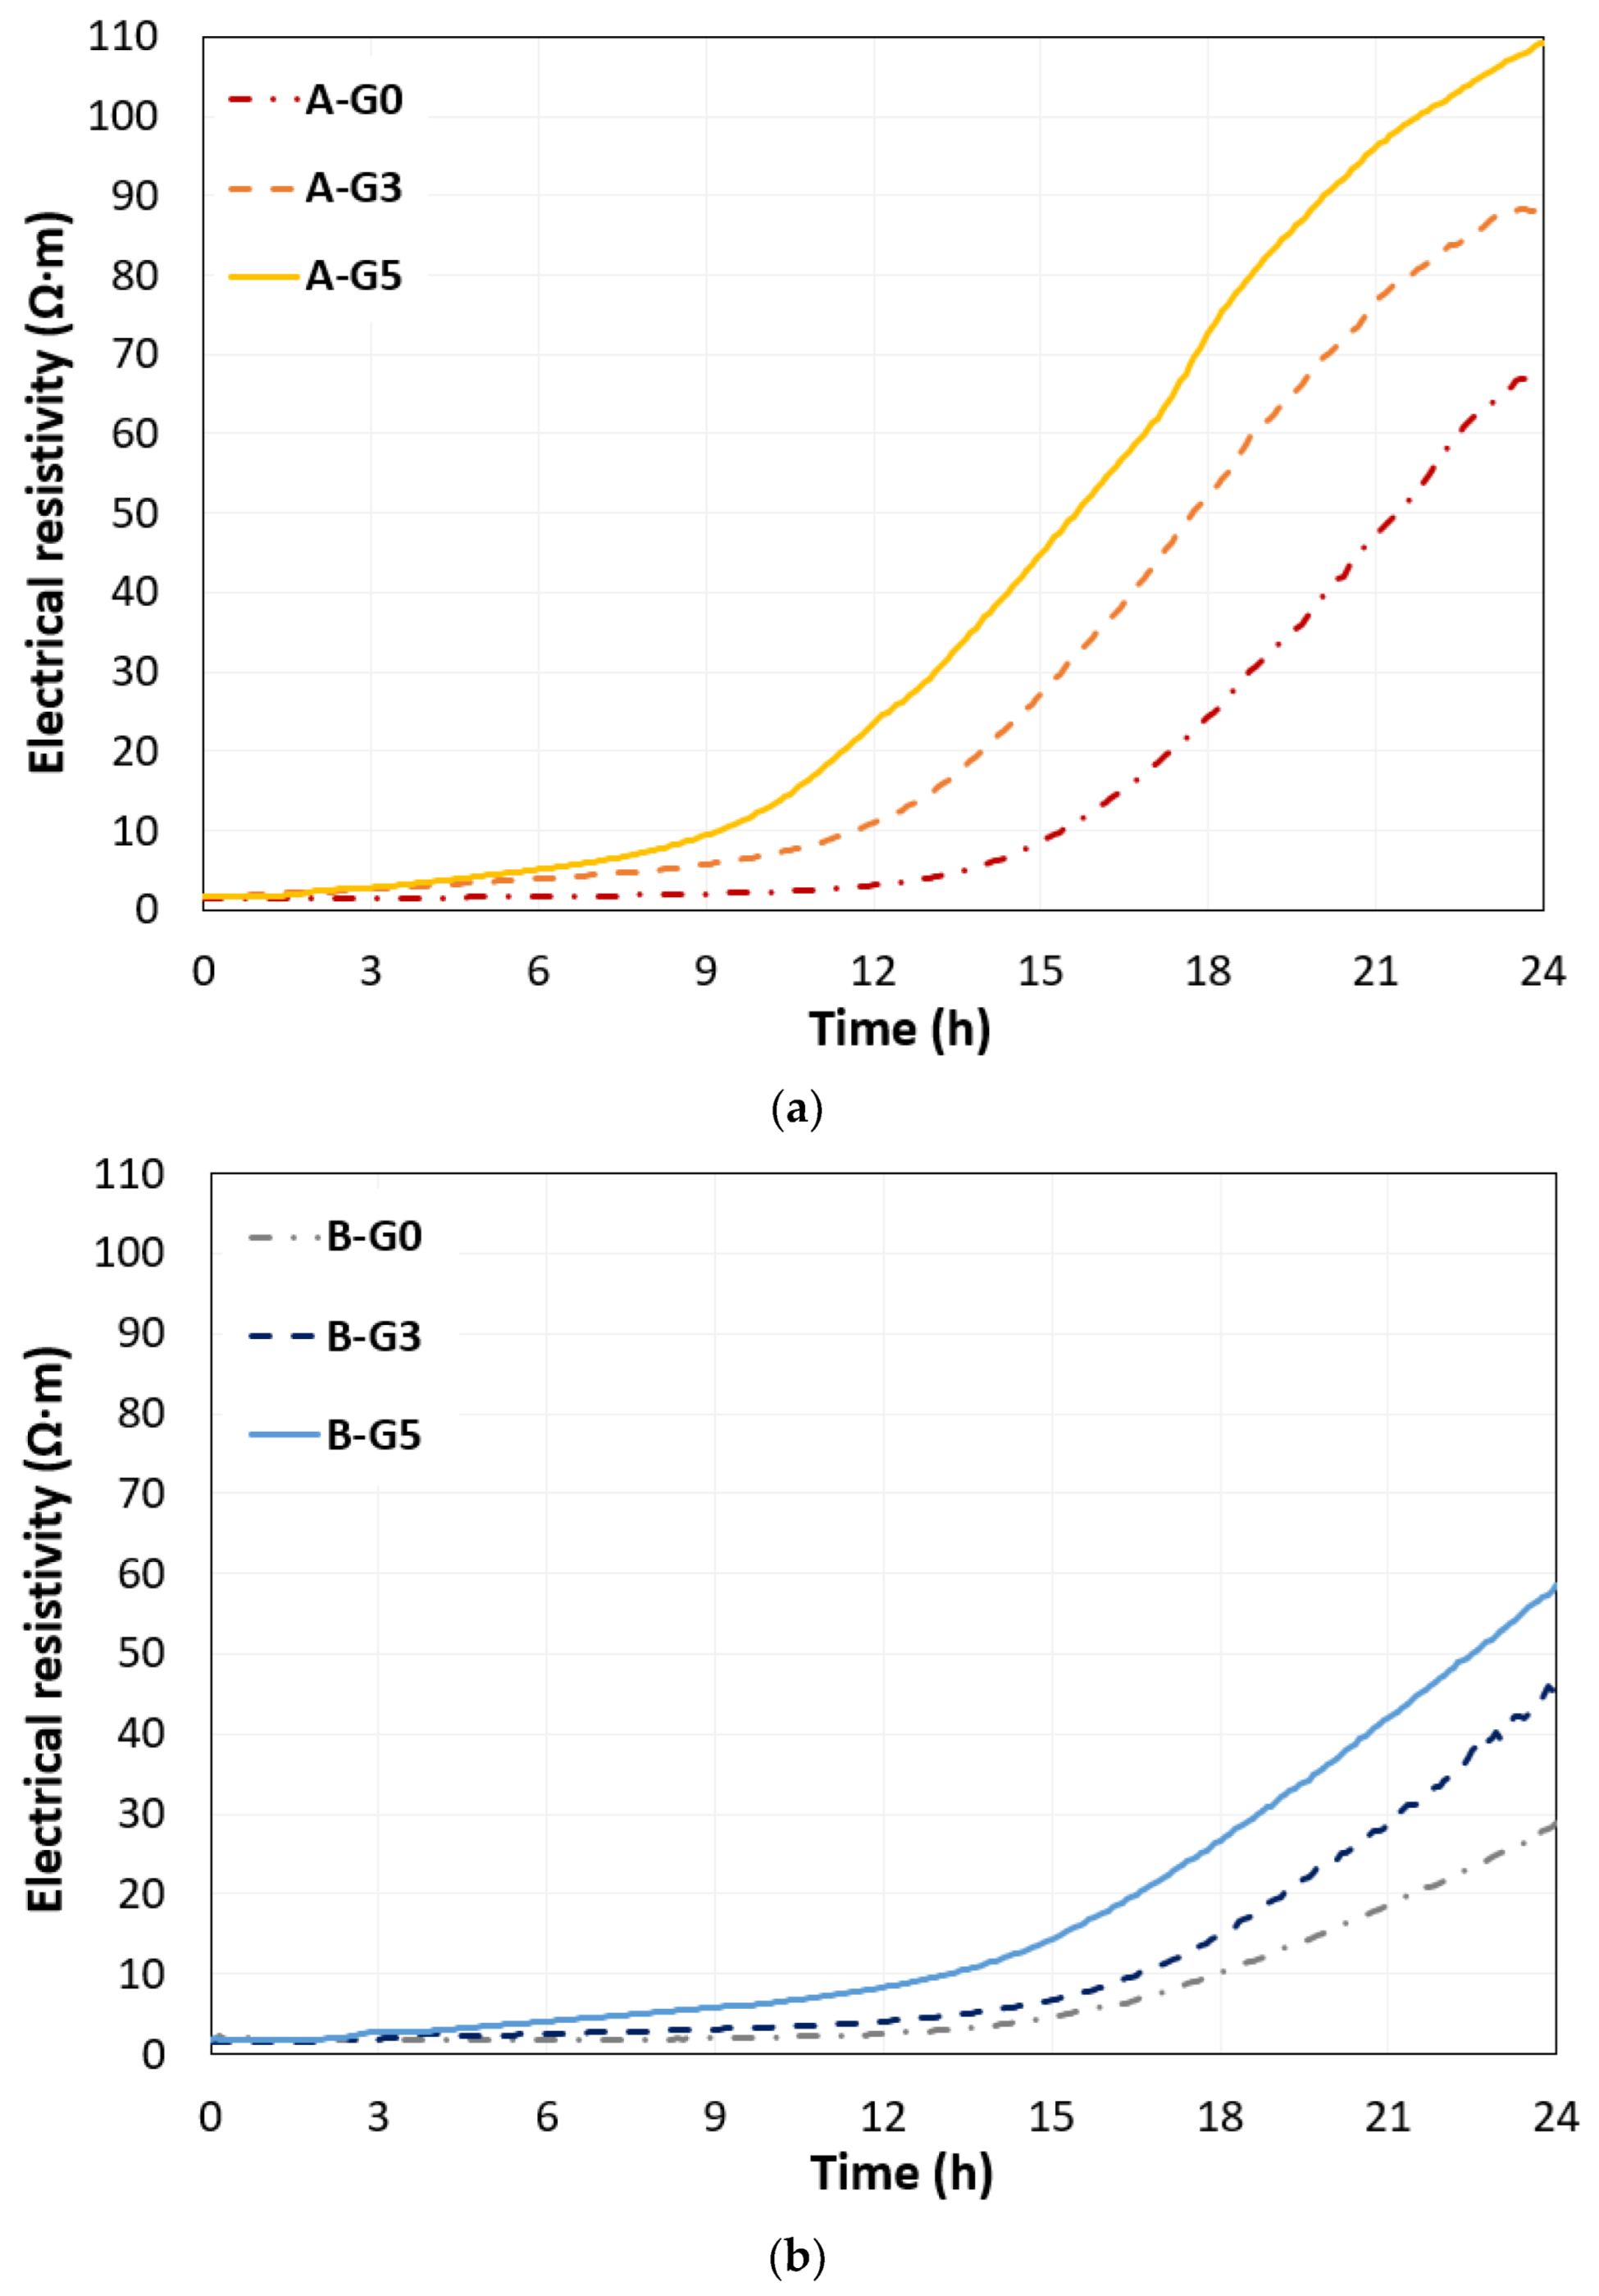
3.2. Electrical Resistivity
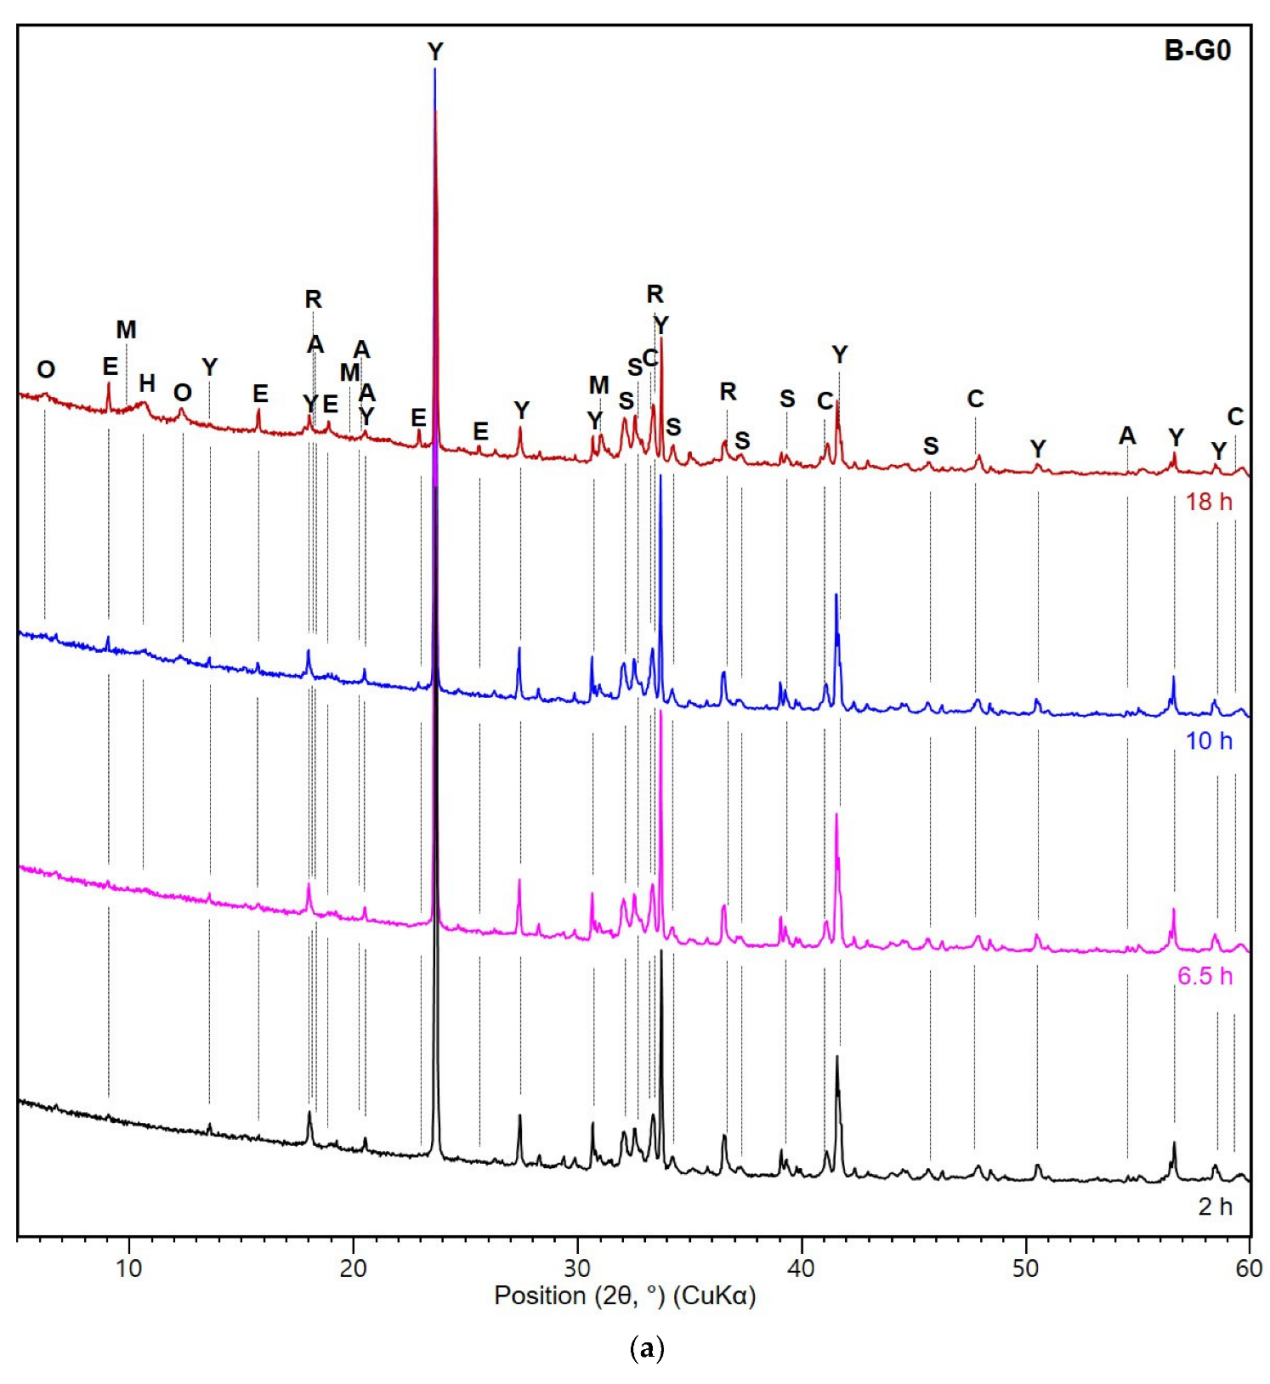
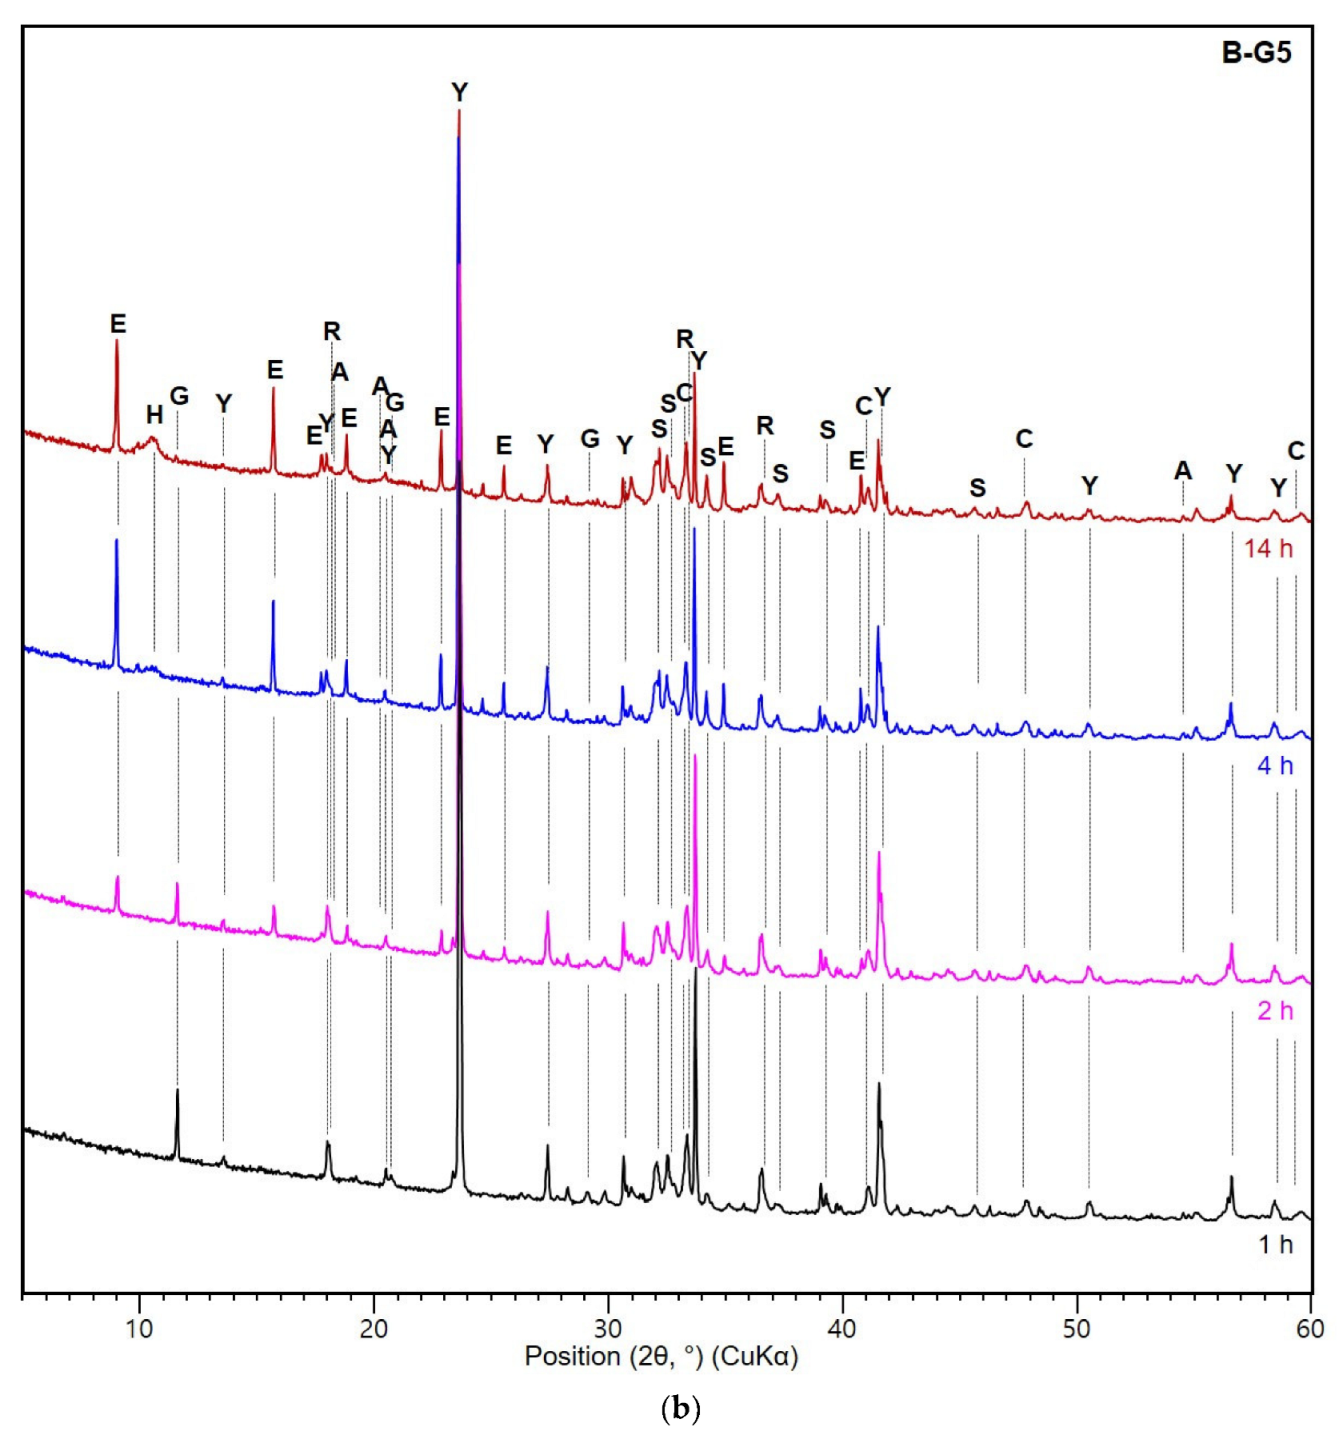
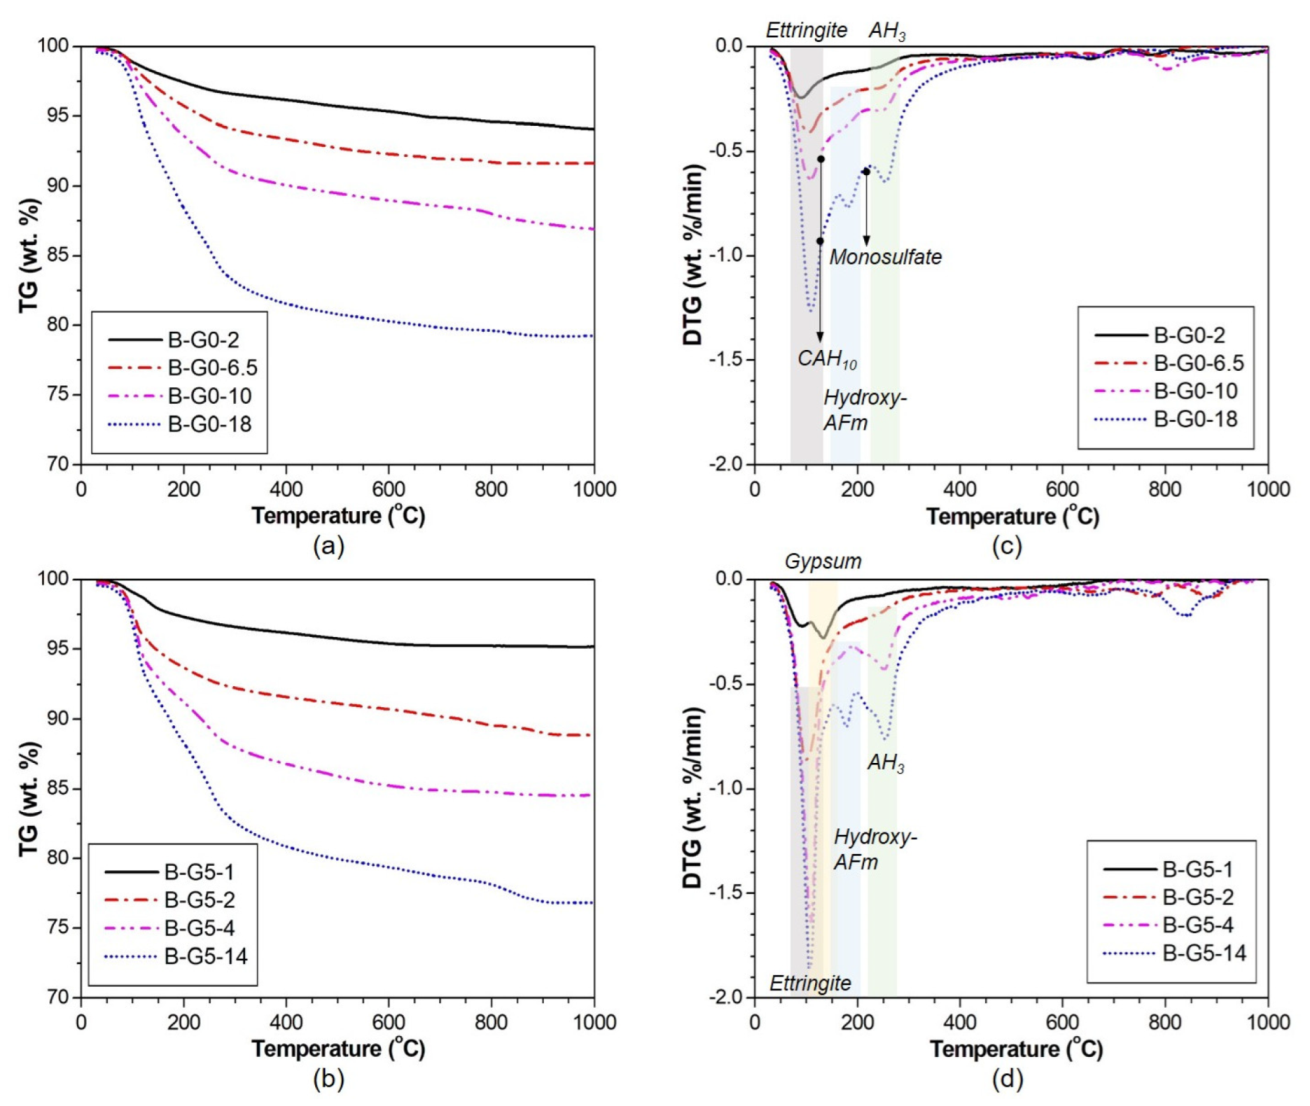
3.3. XRD and TG Analysis
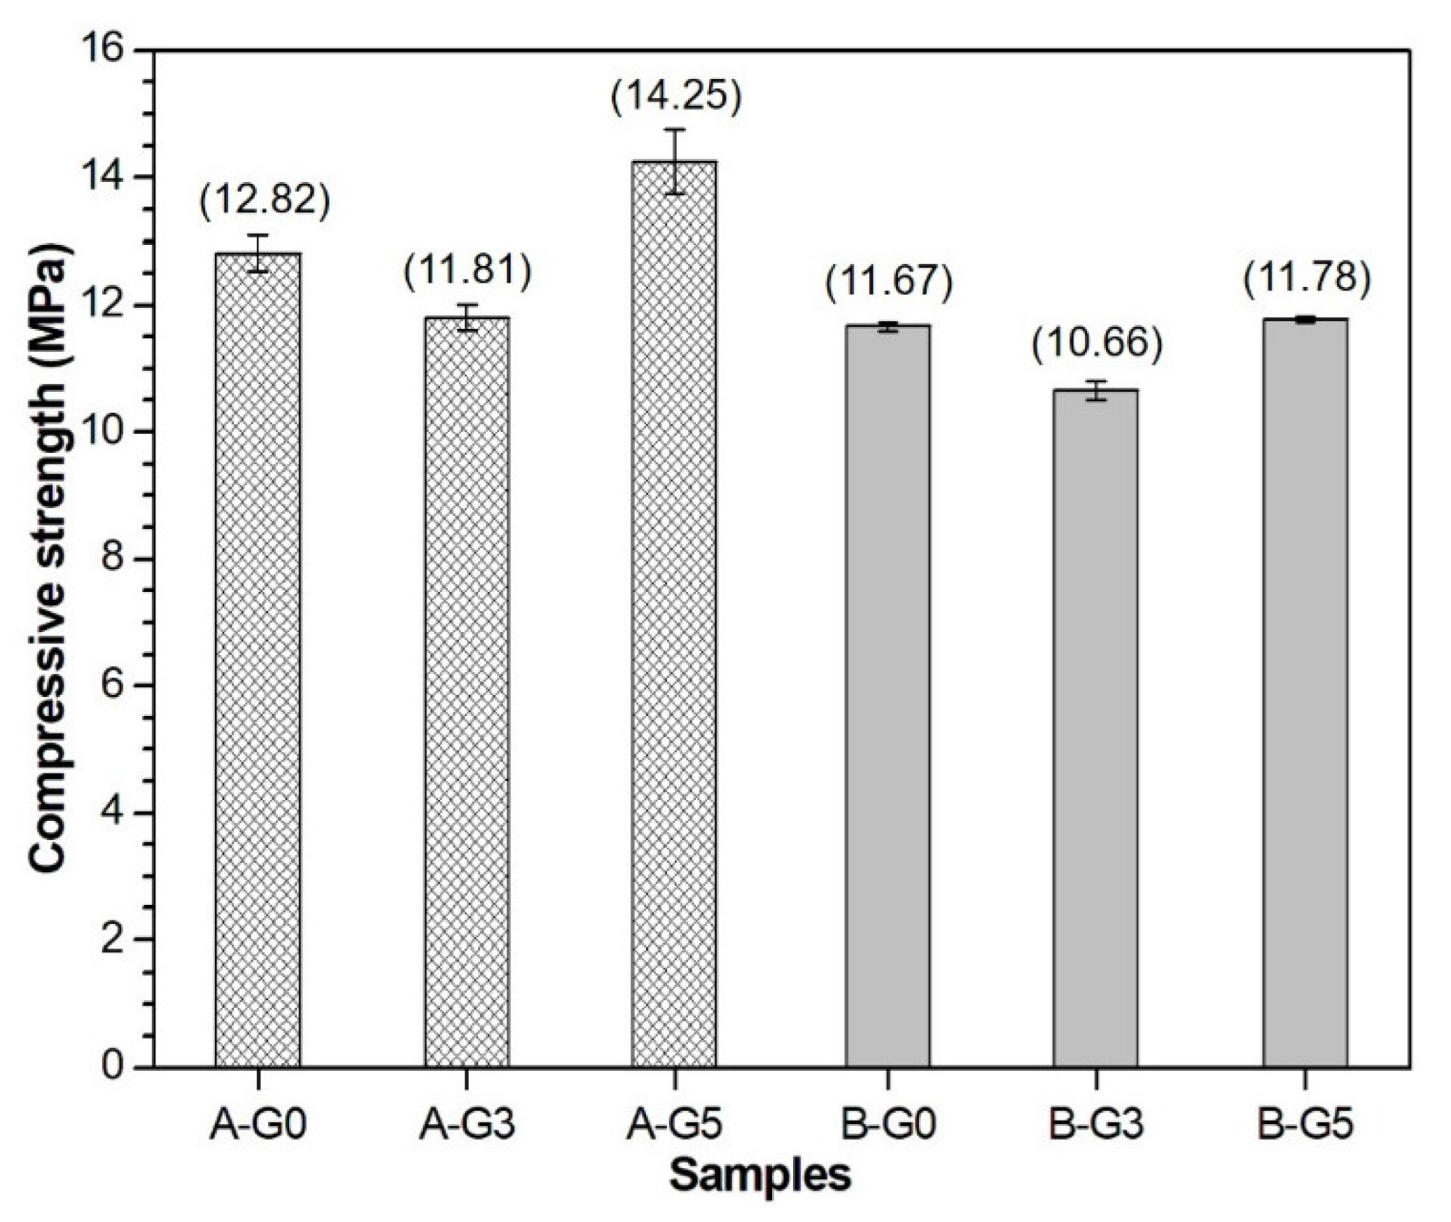
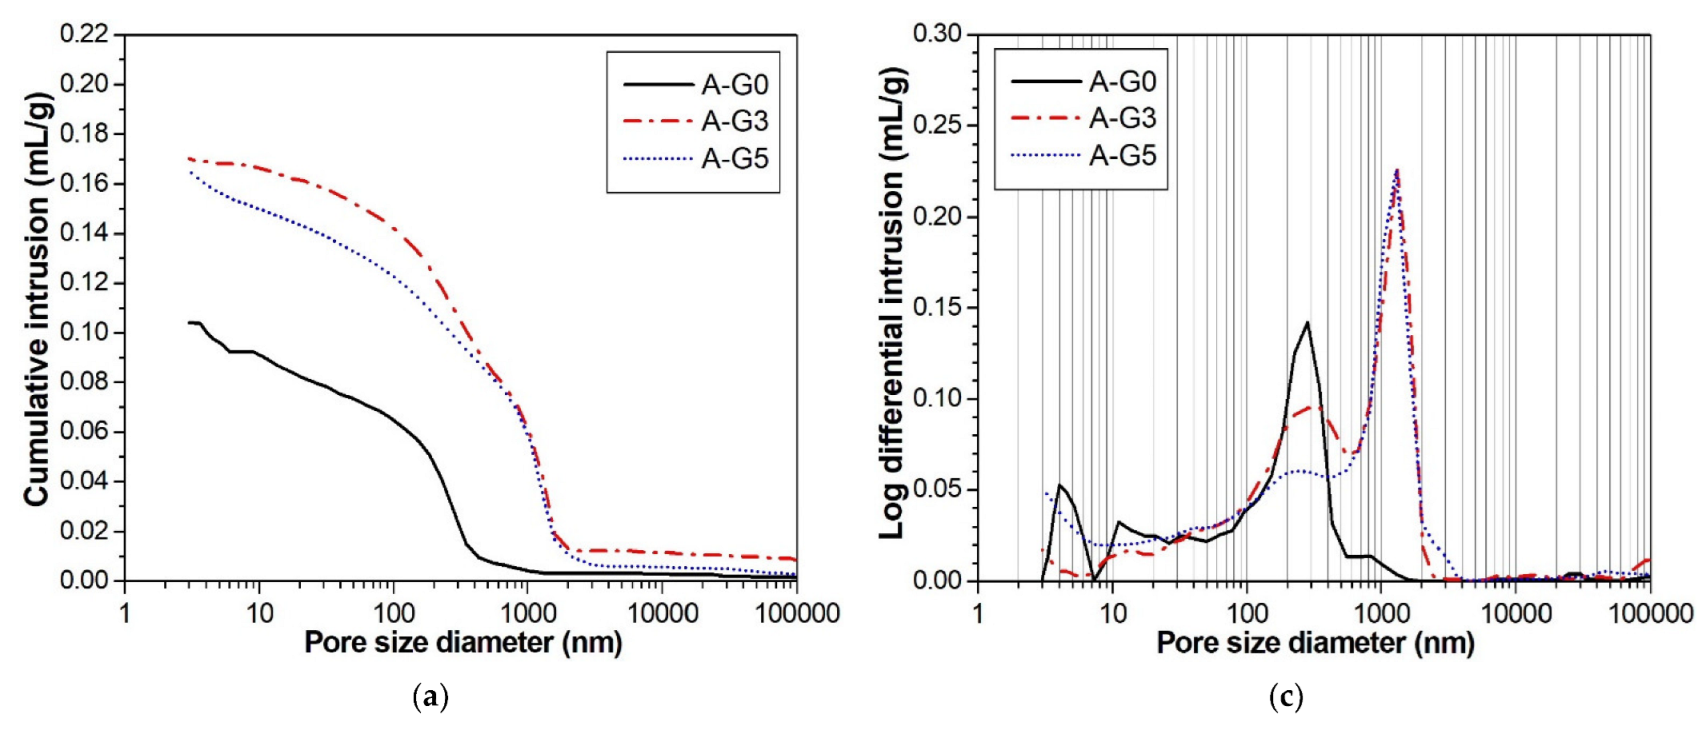
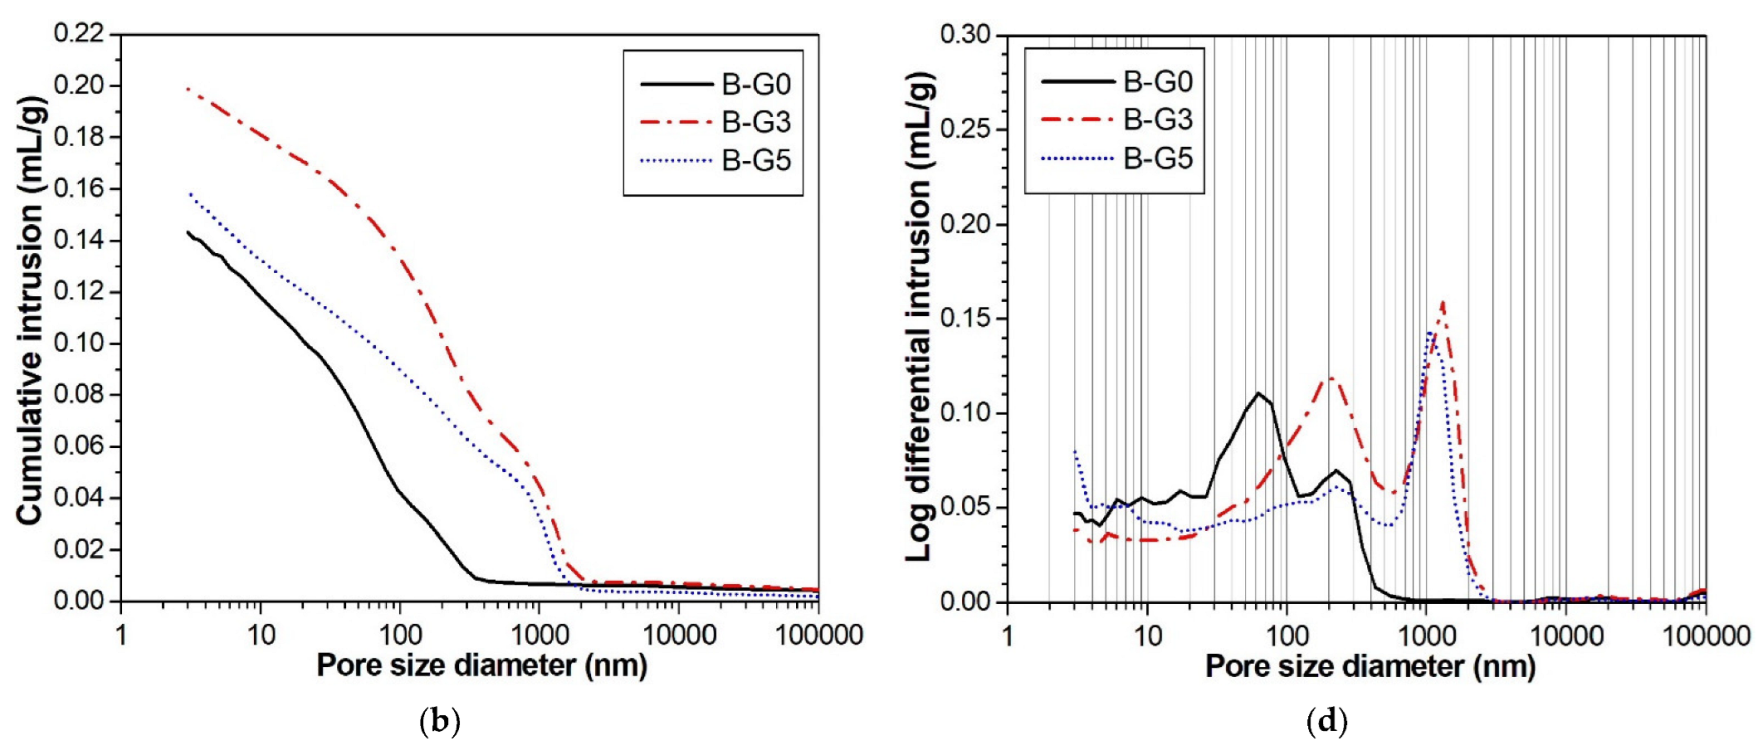
3.4. Compressive Strength and MIP Results
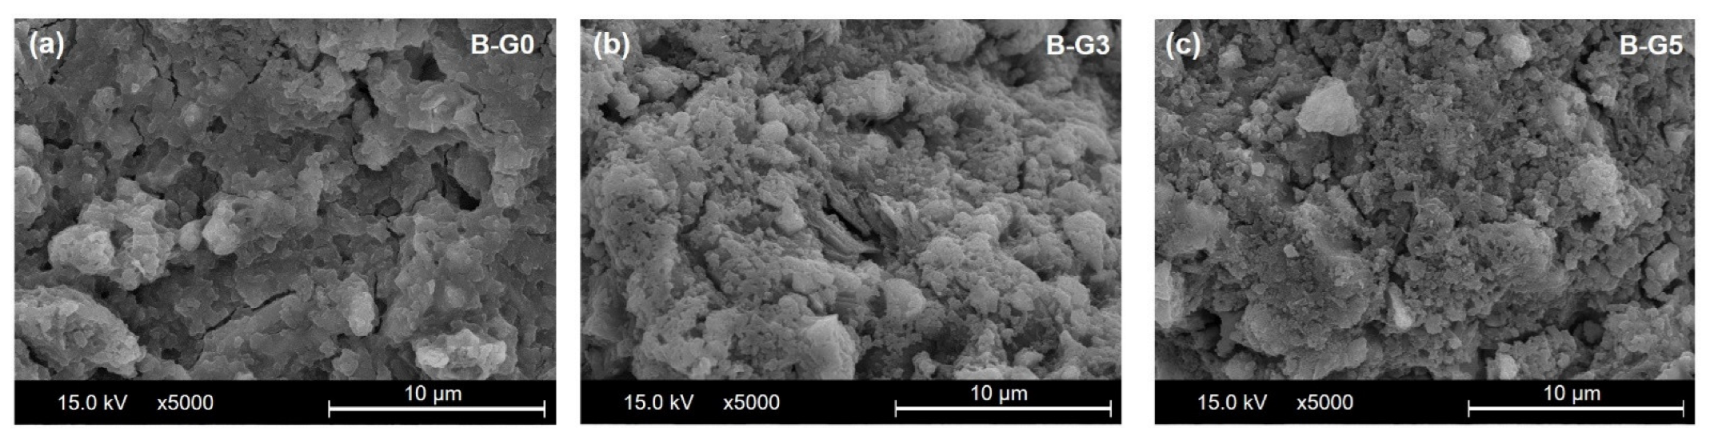
3.5. SEM
4. Conclusions
- (1)
- The amount of added gypsum influenced the hydration and microstructural evolution of the CSA cement paste. The addition of 3% and 5% gypsum to the CSA cement led to an early set of solid-phase networks in the short path for the propagation of ultrasonic waves.
- (2)
- The addition of 5% gypsum in CSA cement paste with w/s of 0.5 promoted the growth of ettringite crystals, up to 6 h. This phenomenon was identified by the changed UPV including converged time and the obtained rising time by monitored electrical resistivity during 24 h.
- (3)
- The 5% addition of gypsum induces a beneficial effect for strength development. A relatively dense structure is formed in the hydration products.
- (4)
- Below a gypsum content of 5% in the CSA cement paste, the total porosity increased, and the compressive strength decreased.
- (5)
- A lower water-to-solid ratio resulted in a higher compressive strength for the CSA cement pastes regardless of the addition of gypsum. In addition, the addition of a certain amount of gypsum to the CSA cement can lead to a high production of ettringite but hardly influences the early strength of the CSA cement paste.
Author Contributions
Funding
Institutional Review Board Statement
Informed Consent Statement
Data Availability Statement
Conflicts of Interest
References
- Amran, M.; Makul, N.; Fediuk, R.; Lee, Y.H.; Vatin, N.I.; Lee, Y.Y.; Mohammed, K. Global carbon recoverability experiences from the cement industry. Case Stud. Constr. Mater. 2022, 17, e01439. [Google Scholar] [CrossRef]
- Ma, Z.; Shen, J.; Wang, C.; Wu, H. Characterization of sustainable mortar containing high-quality recycled manufactured sand crushed from recycled coarse aggregate. Cem. Concr. Compos. 2022, 132, 104629. [Google Scholar] [CrossRef]
- Mobili, A.; Telesca, A.; Marroccoli, M.; Tittarelli, F. Calcium sulfoaluminate and alkali-activated fly ash cements as alternative to Portland cement: Study on chemical, physical-mechanical, and durability properties of mortars with the same strength class. Constr. Build. Mater. 2020, 246, 118436. [Google Scholar] [CrossRef]
- Winnefeld, F.; Lothenbach, B. Hydration of calcium sulfoaluminate cements—Experimental findings and thermodynamic modelling. Cem. Concr. Res. 2010, 40, 1239–1247. [Google Scholar] [CrossRef]
- Shen, Y.; Chen, X.; Zhang, W.; Li, X.; Qian, J. Influence of ternesite on the properties of calcium sulfoaluminate cements blended with fly ash. Constr. Build. Mater. 2018, 193, 221–229. [Google Scholar] [CrossRef]
- Bolaños-Vásquez, I.; Trauchessec, R.; Tobón, J.I.; Lecomte, A. Influence of the ye’elimite/anhydrite ratio on PC-CSA hybrid cements. Mater. Today Commun. 2020, 22, 100778. [Google Scholar] [CrossRef]
- Zhang, J.; Li, G.; Ye, W.; Chang, Y.; Liu, Q.; Song, Z. Effects of ordinary Portland cement on the early properties and hydration of calcium sulfoaluminate cement. Constr. Build. Mater. 2018, 186, 1144–1153. [Google Scholar] [CrossRef]
- Hargis, C.W.; Lothenbach, B.; Müller, C.J.; Winnefeld, F. Carbonation of calcium sulfoaluminate mortars. Cem. Concr. Compos. 2017, 80, 123–134. [Google Scholar] [CrossRef]
- Zhang, Y.; Chang, J. Microstructural evolution of aluminum hydroxide gel during the hydration of calcium sulfoaluminate under different alkali concentrations. Constr. Build. Mater. 2018, 180, 655–664. [Google Scholar] [CrossRef]
- Ioannou, S.; Reig, L.; Paine, K.; Quillin, K. Properties of a ternary calcium sulfoaluminate–calcium sulfate–fly ash cement. Cem. Concr. Res. 2014, 56, 75–83. [Google Scholar] [CrossRef] [Green Version]
- ASTM C191-08; Standard Test Methods for Time of Setting of Hydraulic Cement by Vicat Needle. ASTM Int.: West Conshohocken, PA, USA, 2008.
- ASTM C403-08; Standard Test Methods for Time of Setting of Concrete Mixtures by Penetration Resistance. ASTM Int.: West Conshohocken, PA, USA, 2008.
- Xiao, L.; Li, Z. Early-age hydration of fresh concrete monitored by non-contact electrical resistivity measurement. Cem. Concr. Res. 2008, 38, 312–319. [Google Scholar] [CrossRef]
- Ylmén, R.; Jäglid, U.; Steenari, B.-M.; Panas, I. Early hydration and setting of Portland cement monitored by IR, SEM and Vicat techniques. Cem. Concr. Res. 2009, 39, 433–439. [Google Scholar] [CrossRef]
- Yim, H.J.; Lee, H.; Kim, J.H. Evaluation of mortar setting time by using electrical resistivity measurements. Constr. Build. Mater. 2017, 146, 679–686. [Google Scholar] [CrossRef]
- Zhang, W.; Zhang, Y.; Liu, L.; Zhang, G.; Liu, Z. Investigation of the influence of curing temperature and silica fume content on setting and hardening process of the blended cement paste by an improved ultrasonic apparatus. Constr. Build. Mater. 2012, 33, 32–40. [Google Scholar] [CrossRef]
- Yim, H.J.; Kim, J.H.; Shah, S.P. Ultrasonic monitoring of the setting of cement-based materials: Frequency dependence. Constr. Build. Mater. 2014, 65, 518–525. [Google Scholar] [CrossRef]
- Schwarz, N.; DuBois, M.; Neithalath, N. Electrical conductivity based characterization of plain and coarse glass powder modified cement pastes. Cem. Concr. Compos. 2007, 29, 656–666. [Google Scholar] [CrossRef]
- Topçu, İ.B.; Uygunoğlu, T.; Hocaoğlu, İ. Electrical conductivity of setting cement paste with different mineral admixtures. Constr. Build. Mater. 2012, 28, 414–420. [Google Scholar] [CrossRef]
- Yim, H.J.; Bae, Y.H.; Kim, J.H. Method for evaluating segregation in self-consolidating concrete using electrical resistivity measurements. Constr. Build. Mater. 2020, 232, 117283. [Google Scholar] [CrossRef]
- Yim, H.J.; Bae, Y.H.; Jun, Y. Hydration and microstructural characterization of early-age cement paste with ultrasonic wave velocity and electrical resistivity measurements. Constr. Build. Mater. 2021, 303, 124508. [Google Scholar] [CrossRef]
- Winnefeld, F.; Lothenbach, B. Phase equilibria in the system Ca4Al6O12SO4—Ca2SiO4—CaSO4—H2O referring to the hydration of calcium sulfoaluminate cements. RILEM Tech. Lett. 2016, 1, 10–16. [Google Scholar] [CrossRef]
- Telesca, A.; Marroccoli, M.; Pace, M.L.; Tomasulo, M.; Valenti, G.L.; Monteiro, P.J.M. A hydration study of various calcium sulfoaluminate cements. Cem. Concr. Compos. 2014, 53, 224–232. [Google Scholar] [CrossRef]
- Sha, W.; Pereira, G.B. Differential scanning calorimetry study of hydrated ground granulated blast-furnace slag. Cem. Concr. Res. 2001, 31, 327–329. [Google Scholar] [CrossRef]
- Gastaldi, D.; Bertola, F.; Irico, S.; Paul, G.; Canonico, F. Hydration behavior of cements with reduced clinker factor in mixture with sulfoaluminate binder. Cem. Concr. Res. 2021, 139, 106261. [Google Scholar] [CrossRef]
- Chen, J.; Liang, C.; Li, B.; Wang, E.; Li, G.; Hou, X. The effect of nano-γAl2O3 additive on early hydration of calcium aluminate cement. Constr. Build. Mater. 2018, 158, 755–760. [Google Scholar] [CrossRef]
- Vassileva, C.G.; Vassilev, S.V. Behaviour of inorganic matter during heating of Bulgarian coals: 1. Lignites. Fuel Process. Technol. 2005, 86, 1297–1333. [Google Scholar] [CrossRef]
- Park, H.; Jeong, Y.; Jun, Y.; Jeong, J.-H.; Oh, J.E. Strength enhancement and pore-size refinement in clinker-free CaO-activated GGBFS systems through substitution with gypsum. Cem. Concr. Compos. 2016, 68, 57–65. [Google Scholar] [CrossRef]
- Batic, O.R.; Milanesi, C.A.; Maiza, P.J.; Marfil, S.A. Secondary ettringite formation in concrete subjected to different curing conditions. Cem. Concr. Res. 2000, 30, 1407–1412. [Google Scholar] [CrossRef]


| CaO | SiO2 | Al2O3 | MgO | SO3 | Fe2O3 | K2O | Na2O | P2O5 | TiO2 | LOI |
|---|---|---|---|---|---|---|---|---|---|---|
| 44.73 | 7.58 | 33.51 | 1.31 | 7.76 | 2.07 | 0.60 | 0.33 | 0.13 | 1.59 | 0.55 |
| Density (g/cm3) | Blaine Fineness (m2/kg) | Median Particle Size (μm) |
|---|---|---|
| 2.84 | 446 | 14.3 |
| Phase | Ye’elimite | C2S | C3A | Anhydrite | Mayenite |
|---|---|---|---|---|---|
| wt.% | 63.9 | 18.8 | 9.6 | 0.4 | 7.3 |
| Sample Label | w/s | CSA (%) | Gypsum (%) |
|---|---|---|---|
| A-G0 | 0.50 | 100 | 0 |
| A-G3 | 97 | 3 | |
| A-G5 | 95 | 5 | |
| B-G0 | 0.55 | 100 | 0 |
| B-G3 | 97 | 3 | |
| B-G5 | 95 | 5 |
Disclaimer/Publisher’s Note: The statements, opinions and data contained in all publications are solely those of the individual author(s) and contributor(s) and not of MDPI and/or the editor(s). MDPI and/or the editor(s) disclaim responsibility for any injury to people or property resulting from any ideas, methods, instructions or products referred to in the content. |
© 2023 by the authors. Licensee MDPI, Basel, Switzerland. This article is an open access article distributed under the terms and conditions of the Creative Commons Attribution (CC BY) license (https://creativecommons.org/licenses/by/4.0/).
Share and Cite
Jun, Y.; Ahn, Y.-R.; Jeon, D.; Yim, H.J. Nondestructive Evaluation for Hydration and Setting Time of Gypsum Modified Calcium Sulfoaluminate Cement Paste. Materials 2023, 16, 920. https://doi.org/10.3390/ma16030920
Jun Y, Ahn Y-R, Jeon D, Yim HJ. Nondestructive Evaluation for Hydration and Setting Time of Gypsum Modified Calcium Sulfoaluminate Cement Paste. Materials. 2023; 16(3):920. https://doi.org/10.3390/ma16030920
Chicago/Turabian StyleJun, Yubin, Yu-Rhee Ahn, Dongho Jeon, and Hong Jae Yim. 2023. "Nondestructive Evaluation for Hydration and Setting Time of Gypsum Modified Calcium Sulfoaluminate Cement Paste" Materials 16, no. 3: 920. https://doi.org/10.3390/ma16030920