
ZnTe Crystal Multimode Cryogenic Thermometry Using Raman and Luminescence Spectroscopy

Abstract
:1. Introduction
2. Experimental
3. Results and Discussion
4. Conclusions
Author Contributions
Funding
Institutional Review Board Statement
Informed Consent Statement
Data Availability Statement
Acknowledgments
Conflicts of Interest
References
- Xu, M.; Zou, X.; Su, Q.; Yuan, W.; Cao, C.; Wang, Q.; Zhu, X.; Feng, W.; Li, F. Ratiometric Nanothermometer in Vivo Based on Triplet Sensitized Upconversion. Nat. Commun. 2018, 9, 2698. [Google Scholar] [CrossRef] [PubMed]
- Okabe, K.; Inada, N.; Gota, C.; Harada, Y.; Funatsu, T.; Uchiyama, S. Intracellular Temperature Mapping with a Fluorescent Polymeric Thermometer and Fluorescence Lifetime Imaging Microscopy. Nat. Commun. 2012, 3, 705. [Google Scholar] [CrossRef] [PubMed]
- Fischer, L.H.; Harms, G.S.; Wolfbeis, O.S. Upconverting Nanoparticles for Nanoscale Thermometry. Angew. Chem. Int. Ed. 2011, 50, 4546–4551. [Google Scholar] [CrossRef]
- Brites, C.D.S.; Lima, P.P.; Silva, N.J.O.; Millán, A.; Amaral, V.S.; Palacio, F.; Carlos, L.D. A Luminescent Molecular Thermometer for Long-Term Absolute Temperature Measurements at the Nanoscale. Adv. Mater. 2010, 22, 4499–4504. [Google Scholar] [CrossRef] [PubMed]
- Dramićanin, M.D. Trends in Luminescence Thermometry. J. Appl. Phys. 2020, 128, 40902. [Google Scholar] [CrossRef]
- Shang, Y.; Han, Q.; Hao, S.; Chen, T.; Zhu, Y.; Wang, Z.; Yang, C. Dual-Mode Upconversion Nanoprobe Enables Broad-Range Thermometry from Cryogenic to Room Temperature. ACS Appl. Mater. Interfaces 2019, 11, 42455–42461. [Google Scholar] [CrossRef] [PubMed]
- De, A.; Dwij, V.; Sathe, V.; Hernández-Rodríguez, M.A.; Carlos, L.D.; Ranjan, R. Synergistic Use of Raman and Photoluminescence Signals for Optical Thermometry with Large Temperature Sensitivity. Phys. B Condens. Matter 2022, 626, 413455. [Google Scholar] [CrossRef]
- Jaque, D.; Vetrone, F. Luminescence Nanothermometry. Nanoscale 2012, 4, 4301–4326. [Google Scholar] [CrossRef]
- Quintanilla, M.; Liz-Marzan, L.M. Guiding Rules for Selecting a Nanothermometer. Nano Today 2018, 19, 126–145. [Google Scholar] [CrossRef]
- Kolesnikov, I.E.; Mamonova, D.V.; Kurochkin, M.A.; Medvedev, V.A.; Kolesnikov, E.Y. Ratiometric Dual-Center Gd2O3: Tb3+/Eu3+ Nanothermometers with Enhanced Thermometric Performances. J. Alloys Compd. 2022, 922, 166182. [Google Scholar] [CrossRef]
- Stefańska, J.; Bednarkiewicz, A.; Marciniak, L. Advancements in Excited State Absorption-Based Luminescence Thermometry. J. Mater. Chem. C 2022, 10, 5744–5782. [Google Scholar] [CrossRef]
- Shamsieva, A.V.; Kolesnikov, I.E.; Strelnik, I.D.; Gerasimova, T.P.; Kalinichev, A.A.; Katsyuba, S.A.; Musina, E.I.; Lähderanta, E.; Karasik, A.A.; Sinyashin, O.G. Fresh Look on the Nature of Dual-Band Emission of Octahedral Copper-Iodide Clusters—Promising Ratiometric Luminescent Thermometers. J. Phys. Chem. C 2019, 123, 25863–25870. [Google Scholar] [CrossRef]
- Kolesnikov, I.E.; Afanaseva, E.V.; Kurochkin, M.A.; Vaishlia, E.I.; Kalinichev, A.A.; Kolesnikov, E.Y.; Lähderanta, E. Upconverting NIR-to-NIR LuVO4: Nd3+/Yb3+ Nanophosphors for High-Sensitivity Optical Thermometry. ACS Appl. Mater. Interfaces 2022, 14, 1757–1764. [Google Scholar] [CrossRef]
- Suo, H.; Zhao, X.; Zhang, Z.; Wang, Y.; Sun, J.; Jin, M.; Guo, C. Rational Design of Ratiometric Luminescence Thermometry Based on Thermally Coupled Levels for Bioapplications. Laser Photon. Rev. 2021, 15, 2000319. [Google Scholar] [CrossRef]
- Kumar, K.; Stefanczyk, O.; Chorazy, S.; Nakabayashi, K.; Ohkoshi, S. Ratiometric Raman and Luminescent Thermometers Constructed from Dysprosium Thiocyanidometallate Molecular Magnets. Adv. Opt. Mater. 2022, 10, 2201675. [Google Scholar] [CrossRef]
- Baffou, G.; Bon, P.; Savatier, J.; Polleux, J.; Zhu, M.; Merlin, M.; Rigneault, H.; Monneret, S. Thermal Imaging of Nanostructures by Quantitative Optical Phase Analysis. ACS Nano 2012, 6, 2452–2458. [Google Scholar] [CrossRef] [PubMed]
- Baffou, G.; Polleux, J.; Rigneault, H.; Monneret, S. Super-Heating and Micro-Bubble Generation around Plasmonic Nanoparticles under Cw Illumination. J. Phys. Chem. C 2014, 118, 4890–4898. [Google Scholar] [CrossRef]
- Bon, P.; Belaid, N.; Lagrange, D.; Bergaud, C.; Rigneault, H.; Monneret, S.; Baffou, G. Three-Dimensional Temperature Imaging around a Gold Microwire. Appl. Phys. Lett. 2013, 102, 244103. [Google Scholar] [CrossRef]
- Kolesnikov, I.E.; Mamonova, D.V.; Kurochkin, M.A.; Kolesnikov, E.Y.; Lähderanta, E.; Manshina, A.A. YVO4 Nanoparticles Doped with Eu3+ and Nd3+ for Optical Nanothermometry. ACS Appl. Nano Mater. 2021, 4, 12481–12489. [Google Scholar] [CrossRef]
- van Swieten, T.P.; van Omme, T.; van den Heuvel, D.J.; Vonk, S.J.W.; Spruit, R.G.; Meirer, F.; Garza, H.H.P.; Weckhuysen, B.M.; Meijerink, A.; Rabouw, F.T. Mapping Elevated Temperatures with a Micrometer Resolution Using the Luminescence of Chemically Stable Upconversion Nanoparticles. ACS Appl. Nano Mater. 2021, 4, 4208–4215. [Google Scholar] [CrossRef]
- Bradac, C.; Lim, S.F.; Chang, H.; Aharonovich, I. Optical Nanoscale Thermometry: From Fundamental Mechanisms to Emerging Practical Applications. Adv. Opt. Mater. 2020, 8, 2000183. [Google Scholar] [CrossRef]
- Jahanbazi, F.; Mao, Y. Recent Advances on Metal Oxide-Based Luminescence Thermometry. J. Mater. Chem. C 2021, 9, 16410–16439. [Google Scholar] [CrossRef]
- Pan, Y.; Xie, X.; Huang, Q.; Gao, C.; Wang, Y.; Wang, L.; Yang, B.; Su, H.; Huang, L.; Huang, W. Inherently Eu2+/Eu3+ Codoped Sc2O3 Nanoparticles as High-Performance Nanothermometers. Adv. Mater. 2018, 30, 1705256. [Google Scholar] [CrossRef] [PubMed]
- Sekulić, M.; Đorđević, V.; Ristić, Z.; Medić, M.; Dramićanin, M.D. Highly Sensitive Dual Self-Referencing Temperature Readout from the Mn4+/Ho3+ Binary Luminescence Thermometry Probe. Adv. Opt. Mater. 2018, 17, 1800552. [Google Scholar] [CrossRef]
- Maciejewska, K.; Marciniak, L. Multimodal Stokes and Anti-Stokes Luminescent Thermometers Based on GdP5O14 Co-Doped with Cr3+ and Nd3+ Ions. Chem. Eng. J. 2020, 402, 126197. [Google Scholar] [CrossRef]
- Kolesnikov, I.E.; Kurochkin, M.A.; Meshkov, I.N.; Akasov, R.A.; Kalinichev, A.A.; Kolesnikov, E.Y.; Gorbunova, Y.G.; Lähderanta, E. Water-Soluble Multimode Fluorescent Thermometers Based on Porphyrins Photosensitizers. Mater. Des. 2021, 203, 109613. [Google Scholar] [CrossRef]
- Ćirić, A.; Marciniak, Ł.; Dramićanin, M.D. Luminescence Intensity Ratio Squared—A New Luminescence Thermometry Method for Enhanced Sensitivity. J. Appl. Phys. 2022, 131, 114501. [Google Scholar] [CrossRef]
- Jiang, Y.; Tong, Y.; Chen, S.; Zhang, W.; Hu, F.; Wei, R.; Guo, H. A Three-Mode Self-Referenced Optical Thermometry Based on up-Conversion Luminescence of Ca2MgWO6: Er3+, Yb3+ Phosphors. Chem. Eng. J. 2021, 413, 127470. [Google Scholar] [CrossRef]
- Liu, J.; Yue, X.; Wang, Z.; Zhang, X.; Xu, Y. Coumarin 7 Functionalized Europium-Based Metal–Organic-Framework Luminescent Composites for Dual-Mode Optical Thermometry. J. Mater. Chem. C 2020, 8, 13328–13335. [Google Scholar] [CrossRef]
- Marciniak, L.; Elzbieciak-Piecka, K.; Kniec, K.; Bednarkiewicz, A. Assessing Thermometric Performance of Sr2CeO4 and Sr2CeO4: Ln3+ (Ln3+ = Sm3+, Ho3+, Nd3+, Yb3+) Nanocrystals in Spectral and Temporal Domain. Chem. Eng. J. 2020, 388, 124347. [Google Scholar] [CrossRef]
- Kolesnikov, I.; Mamonova, D.; Kurochkin, M.; Medvedev, V.; Kolesnikov, E. Low-Doped LaVO4: Eu3+ Phosphor for Multimode Optical Thermal Sensing. Phys. Chem. Chem. Phys. 2022, 24, 27940–27948. [Google Scholar] [CrossRef] [PubMed]
- Kolesnikov, I.E.; Kalinichev, A.A.; Kurochkin, M.A.; Kolesnikov, E.Y.; Lähderanta, E. Porphyrins as Efficient Ratiometric and Lifetime-Based Contactless Optical Thermometers. Mater. Des. 2019, 184, 108188. [Google Scholar] [CrossRef]
- Maturi, F.E.; Brites, C.D.S.; Ximendes, E.C.; Mills, C.; Olsen, B.; Jaque, D.; Ribeiro, S.J.L.; Carlos, L.D. Going Above and Beyond: A Tenfold Gain in the Performance of Luminescence Thermometers Joining Multiparametric Sensing and Multiple Regression. Laser Photon. Rev. 2021, 15, 2100301. [Google Scholar] [CrossRef]
- Ximendes, E.; Marin, R.; Carlos, L.D.; Jaque, D. Less Is More: Dimensionality Reduction as a General Strategy for More Precise Luminescence Thermometry. Light Sci. Appl. 2022, 11, 237. [Google Scholar] [CrossRef] [PubMed]
- Aseev, V.A.; Borisevich, D.A.; Khodasevich, M.A.; Kuz’menko, N.K.; Fedorov, Y.K. Calibration of Temperature by Normalized Up-Conversion Fluorescence Spectra of Germanate Glasses and Glass Ceramics Doped with Erbium and Ytterbium Ions. Opt. Spectrosc. 2021, 129, 297–302. [Google Scholar] [CrossRef]
- Gupta, S.K.; Kumar, S.; Auluck, S. Structural, Electronic and Optical Properties of High Pressure Stable Phases of ZnTe. Phys. B Condens. Matter 2009, 404, 3789–3794. [Google Scholar] [CrossRef]
- Saeeda, N.A.; Uonisb, M.M. Preparation of Zinc Telluride Thin Films Using Chemical Bath Depositon. Chalcogenide Lett. 2022, 19, 61–64. [Google Scholar] [CrossRef]
- Iqbal, M.F.; Ain, Q.U.; Yaqoob, M.M.; Zhu, P.; Wang, D. Temperature Dependence of Exciton–Phonon Coupling and Phonon Anharmonicity in ZnTe Thin Films. J. Raman Spectrosc. 2022, 53, 1265–1274. [Google Scholar] [CrossRef]
- Suthar, D.; Sharma, R.; Sharma, A.; Thakur, A.; Kannan, M.D.; Dhaka, M.S. Effect of Thermal Annealing on Physical Properties of Cu-Doped ZnTe Thin Films: Functionality as Interface Layer. J. Alloys Compd. 2022, 918, 165756. [Google Scholar] [CrossRef]
- Schall, M.; Jepsen, P.U. Above-Band Gap Two-Photon Absorption and Its Influence on Ultrafast Carrier Dynamics in ZnTe and CdTe. Appl. Phys. Lett. 2002, 80, 4771–4773. [Google Scholar] [CrossRef]
- Castillon, V.J.; Herington, M.; Morton, I.; Tuttle, S.; Melfi, M.; Sahiner, M. Addition of ZnTe in ITO/CdS/CdTe, ITO/CdS/Si/CdTe, and ITO/CdS/SiGe/CdTe Thin Films Using WxAMPS and Pulsed Laser Deposition. Bull. Am. Phys. Soc. 2022, 2022, G00-010. [Google Scholar]
- Camacho, J.; Cantarero, A.; Hernandez-Calderon, I.; González, L. Raman Spectroscopy and Photoluminescence of ZnTe Thin Films Grown on GaAs. J. Appl. Phys. 2002, 92, 6014–6018. [Google Scholar] [CrossRef]
- Lü, H.-Y.; Mu, Q.; Zhang, L.; Lü, Y.-J.; Ji, Z.-W.; Feng, Z.-H.; Xu, X.-G.; Guo, Q.-X. Photoluminescence Characteristics of ZnTe Bulk Crystal and ZnTe Epilayer Grown on GaAs Substrate by MOVPE. Chin. Phys. B 2015, 24, 124207. [Google Scholar] [CrossRef]
- Kwietniak, M.; Oka, Y.; Kushida, T. Temperature Dependence of Raman Scattering and Exciton Luminescence Spectra in ZnTe. J. Phys. Soc. Japan 1978, 44, 558–564. [Google Scholar] [CrossRef]
- Luo, M.; VanMil, B.L.; Tompkins, R.P.; Myers, T.H.; Giles, N.C. Photoluminescence of ZnTe and ZnTe: Cr Grown by Molecular-Beam Epitaxy. J. Appl. Phys. 2005, 97, 13518. [Google Scholar] [CrossRef]
- Fröhlich, D.; Nöthe, A.; Reimann, K. Determination of Valence Band Parameters in ZnTe; Volume 125, Number 2 October 1; De Gruyter: Berlin, Germany, 2022; pp. 653–658. ISBN 3112496345. [Google Scholar]
- Kobayashi, S.; Sugimoto, K.; Tsuboi, K.; Kobayashi, M. Crystal Quality Improvement of ZnTe (1 1 0) Thin Film Prepared on Sapphire by Increasing Nuclei Density on Substrate Surface. J. Cryst. Growth 2022, 596, 126825. [Google Scholar] [CrossRef]
- Ćirić, A.; Dramićanin, M.D. LumTHools-Software for Fitting the Temperature Dependence of Luminescence Emission Intensity, Lifetime, Bandshift, and Bandwidth and Luminescence Thermometry and Review of the Theoretical Models. J. Lumin. 2022, 252, 119413. [Google Scholar] [CrossRef]
- Rudin, S.; Reinecke, T.L.; Segall, B. Temperature-Dependent Exciton Linewidths in Semiconductors. Phys. Rev. B 1990, 42, 11218. [Google Scholar] [CrossRef]
- Verbin, S.Y.; Klochikhin, A.A.; Permogorov, S.A.; Reznitskii, A.N. Determination of the Frohlich Interaction Constant from the Exciton Spectra. Sov. Phys. Solid State 1980, 22, 1221–1225. [Google Scholar]
- Agekyan, V.F.; Borisov, E.V.; Vorobjev, L.E.; Melentyev, G.A.; Nykänen, H.; Riuttanen, L.; Serov, A.Y.; Suihkonen, S.; Svensk, O.; Filisofov, N.G. Optical and Electrical Properties of GaN: Si-Based Microstructures with a Wide Range of Doping Levels. Phys. Solid State 2015, 57, 787–793. [Google Scholar] [CrossRef]
- Kolesnikov, I.E.; Kalinichev, A.A.; Kurochkin, M.A.; Mamonova, D.V.; Kolesnikov, E.Y.; Kurochkin, A.V.; Lähderanta, E.; Mikhailov, M.D. New Strategy for Thermal Sensitivity Enhancement of Nd 3+ -Based Ratiometric Luminescence Thermometers. J. Lumin. 2017, 192, 40–46. [Google Scholar] [CrossRef]
- Ansari, A.A.; Parchur, A.K.; Nazeeruddin, M.K.; Tavakoli, M.M. Luminescent Lanthanide Nanocomposites in Thermometry: Chemistry of Dopant Ions and Host Matrices. Coord. Chem. Rev. 2021, 444, 214040. [Google Scholar] [CrossRef]
- Rakov, N.; Maciel, G.S.; Xiao, M. Erbium Doped Gadolinium Oxyorthosilicate Powder for Optical Thermometry at the Visible and Near-Infrared. J. Lumin. 2022, 252, 119365. [Google Scholar] [CrossRef]
- DAVID, J.O. Linear Regression; Springer: Berlin/Heidelberg, Germany, 2019; ISBN 3319856081. [Google Scholar]


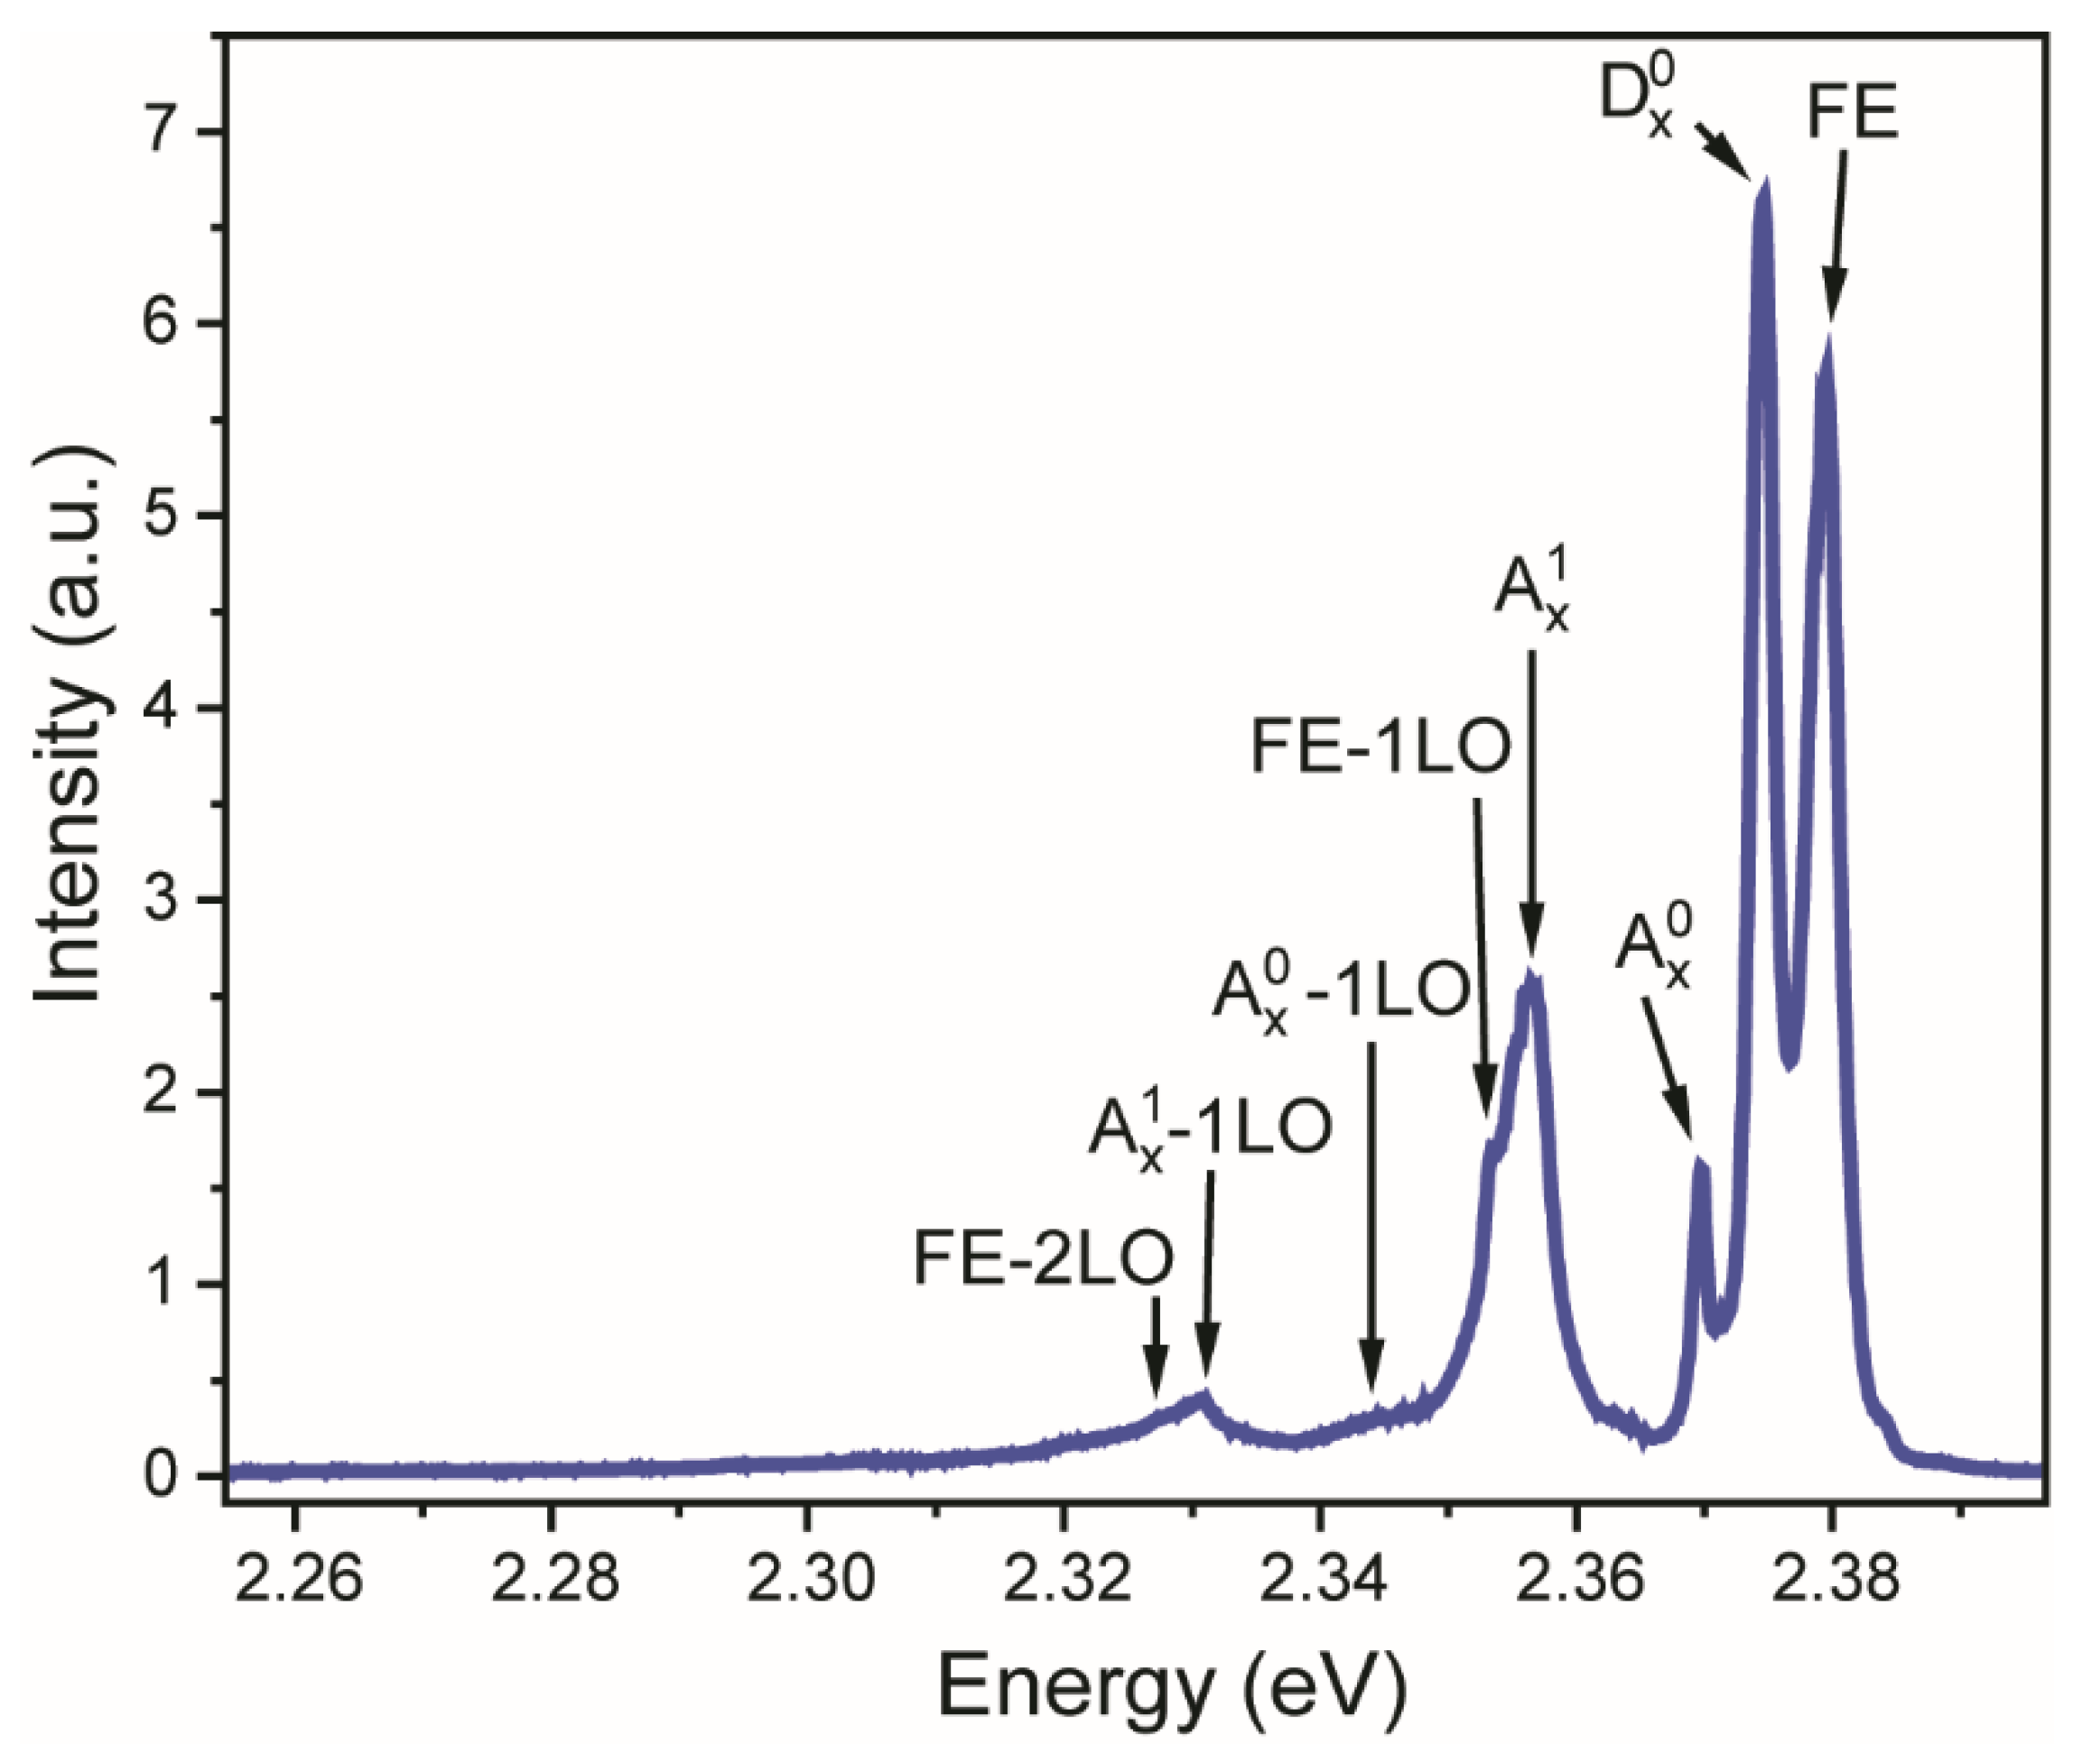
| Emission Assignment | Symbol | Energy Position, eV |
|---|---|---|
| Free exciton | FE | 2.3796 |
| Exciton bound to neutral donor | 2.3746 | |
| Exciton bound to neutral acceptor | 2.3698 | |
| Exciton bound to charged acceptor | 2.3567 | |
| First phonon replica of free exciton | FE-1LO | 2.3535 |
| First phonon replica of exciton bound to neutral acceptor | -1LO | 2.3439 |
| First phonon replica of exciton bound to charged acceptor | -1LO | 2.3307 |
| Second phonon replica of free exciton | FE-1LO | 2.3273 |
| Material | Sensing Parameter | Sr (% K) | ΔT (K) |
|---|---|---|---|
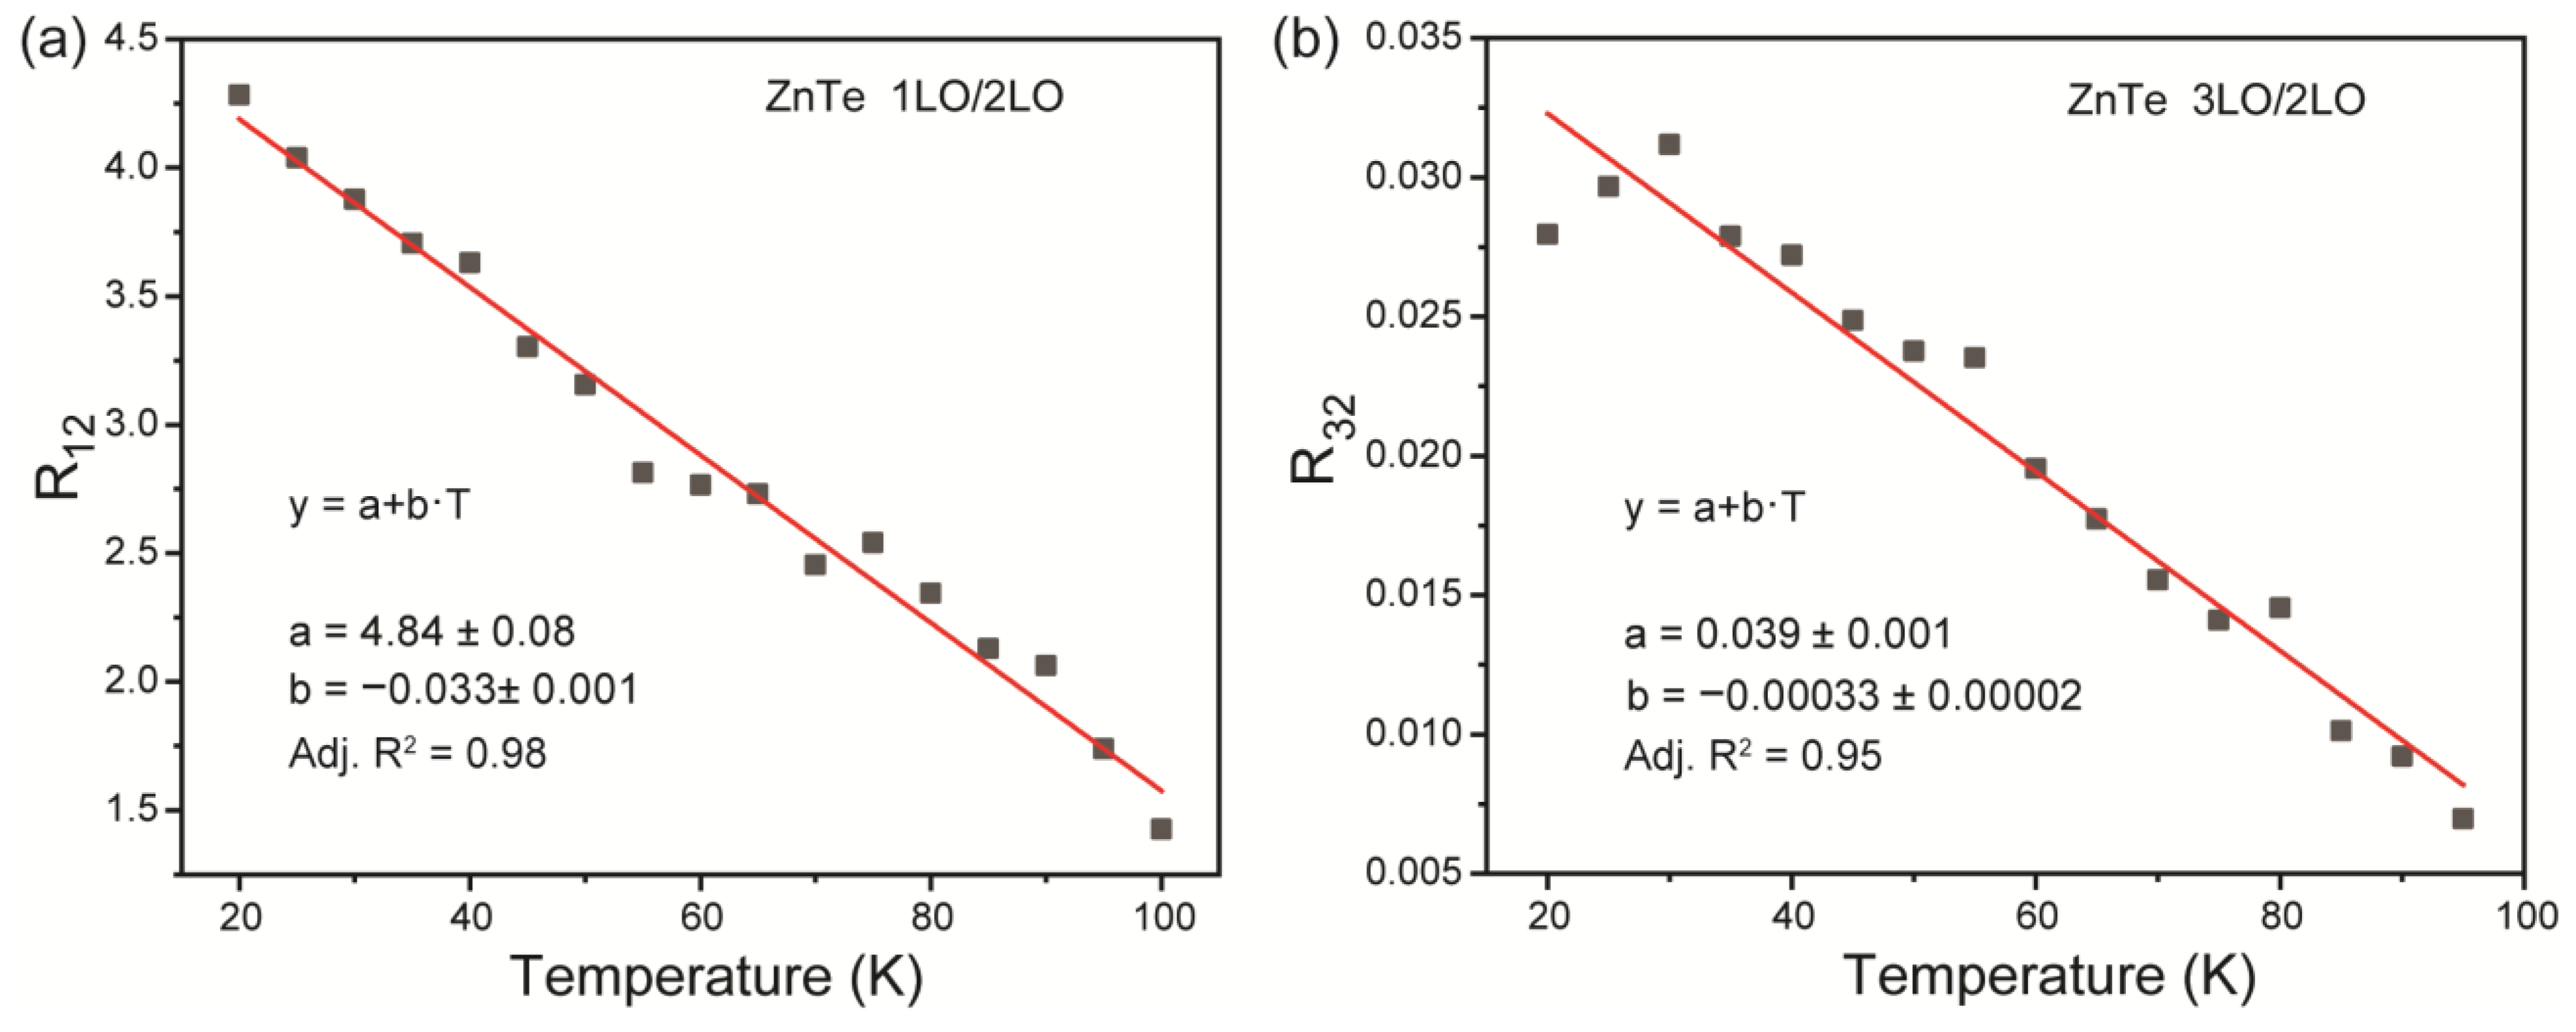
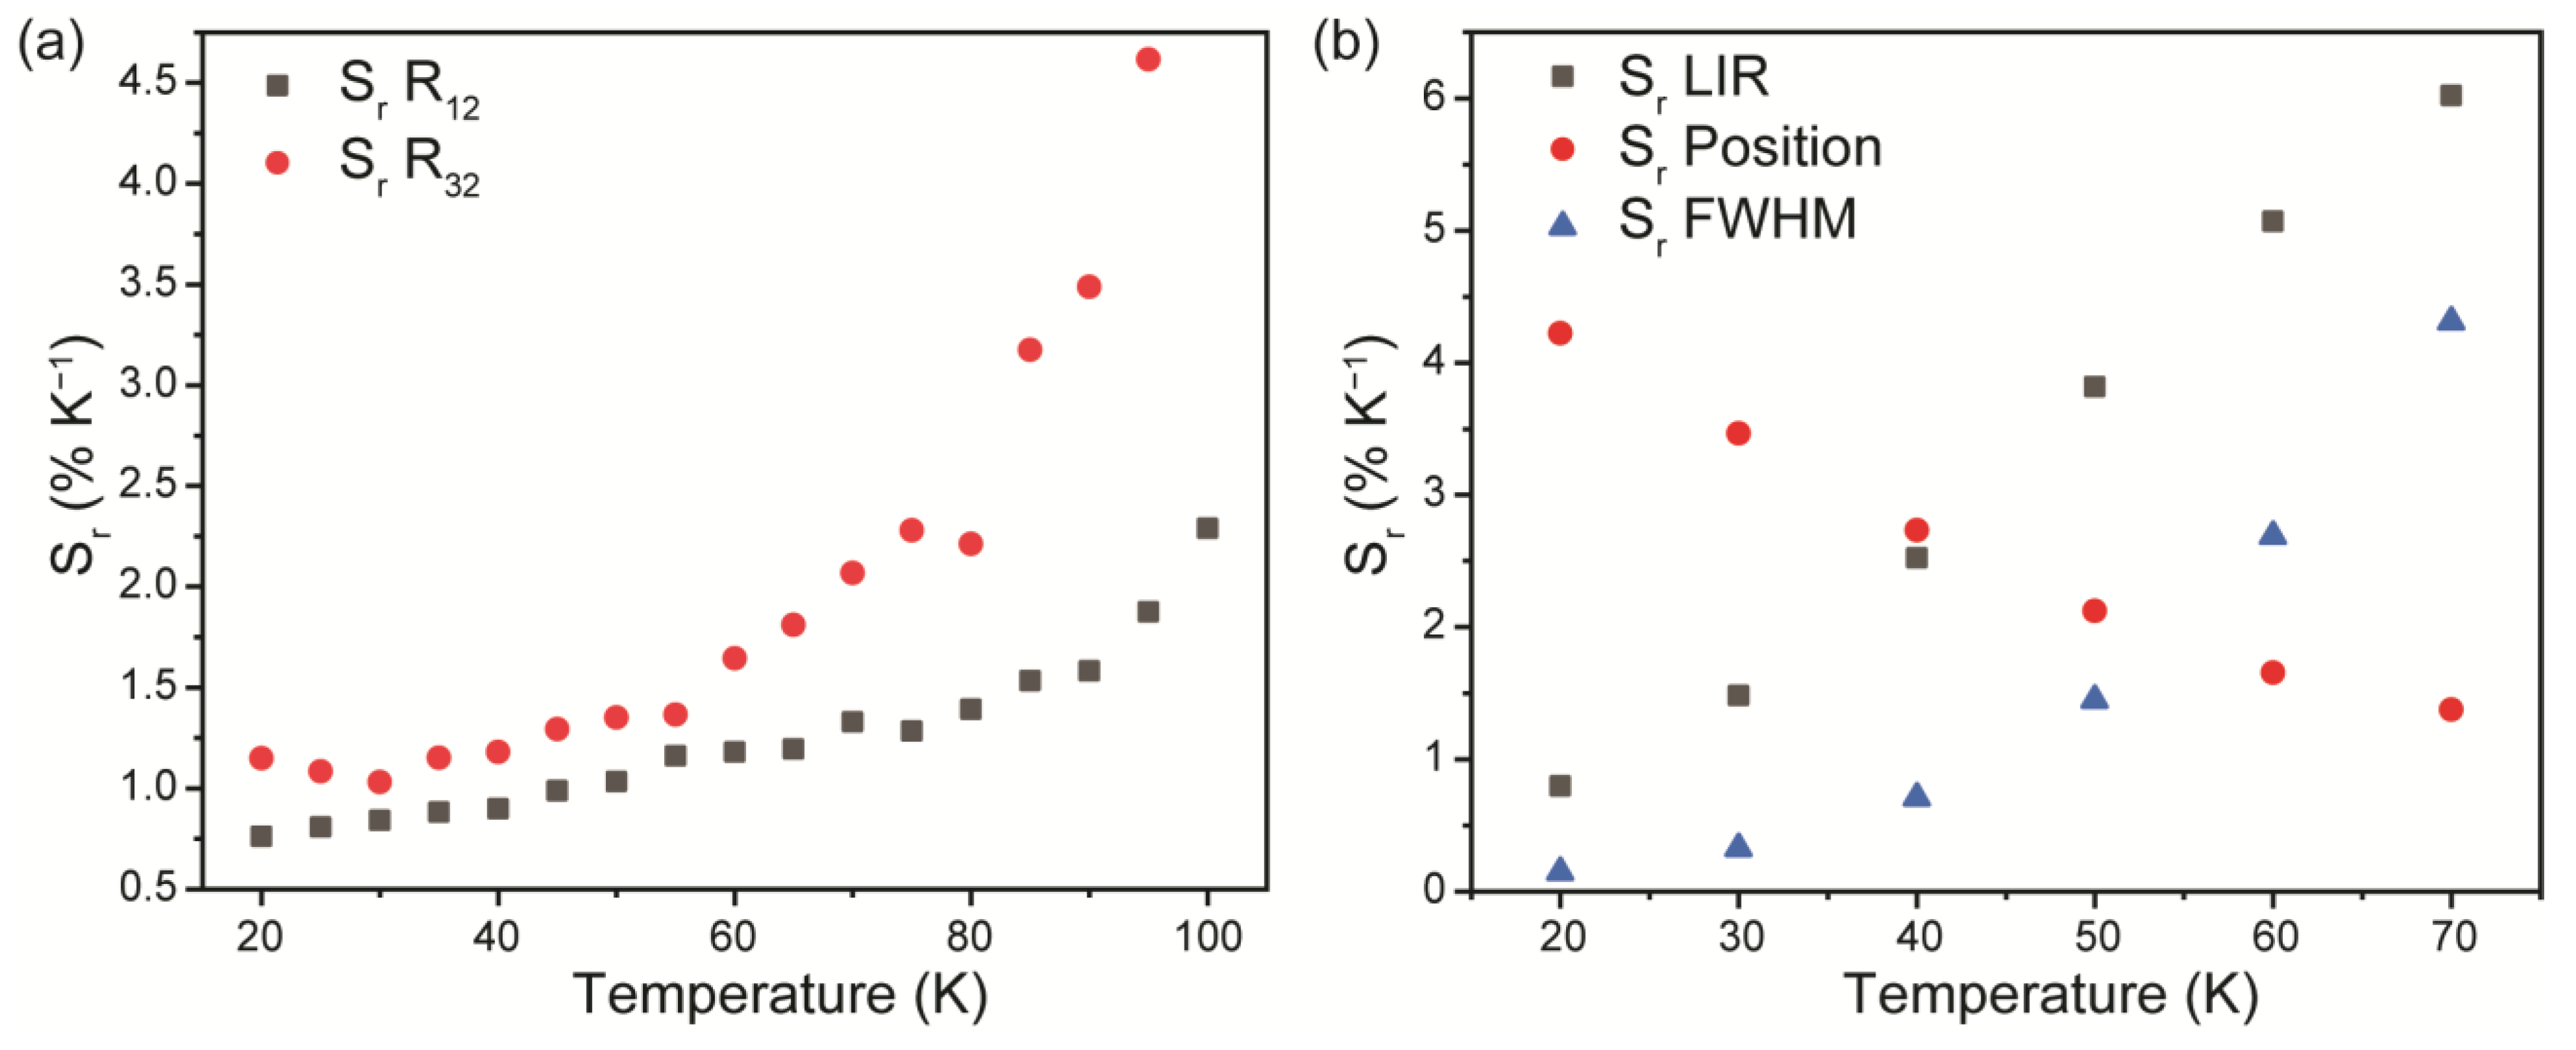
| ZnTe | R12 (Raman) | 1.04 | 0.16 |
| R32 (Raman) | 1.35 | 0.79 | |
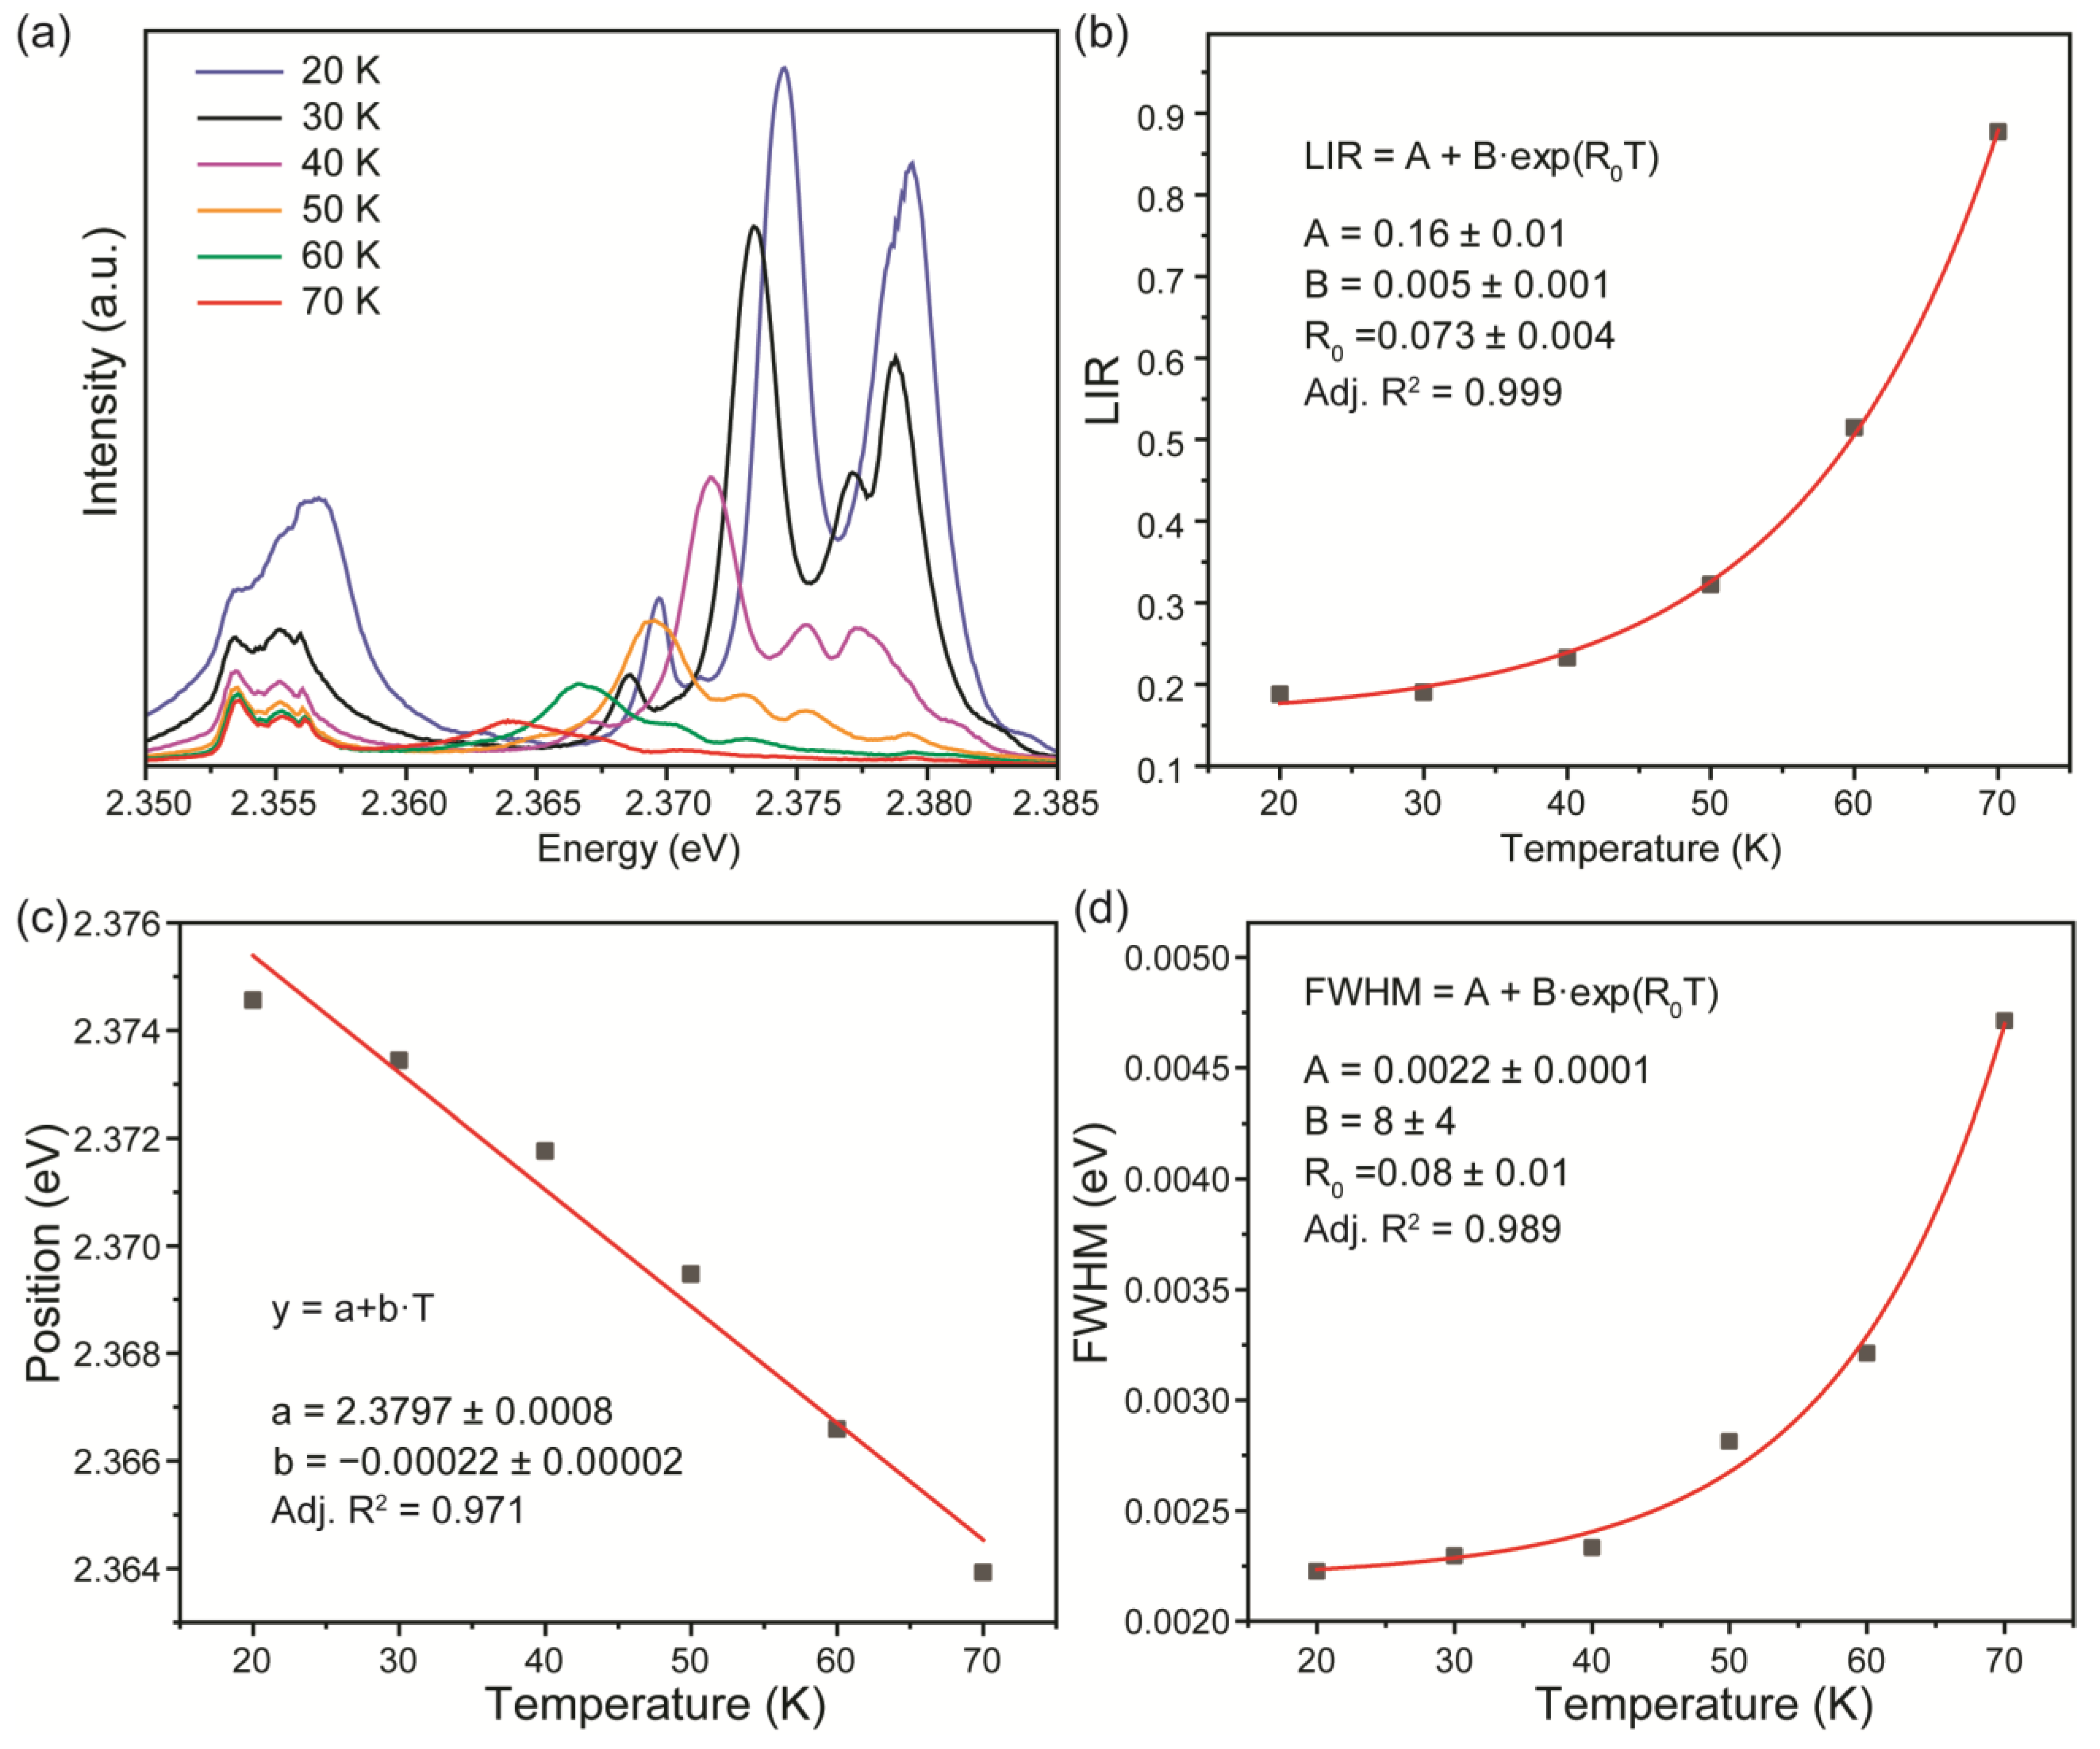
| LIR (luminescence) | 3.82 | 0.12 | |
| Position (luminescence) | 2.12 | – | |
| FWHM (luminescence) | 1.45 | – | |
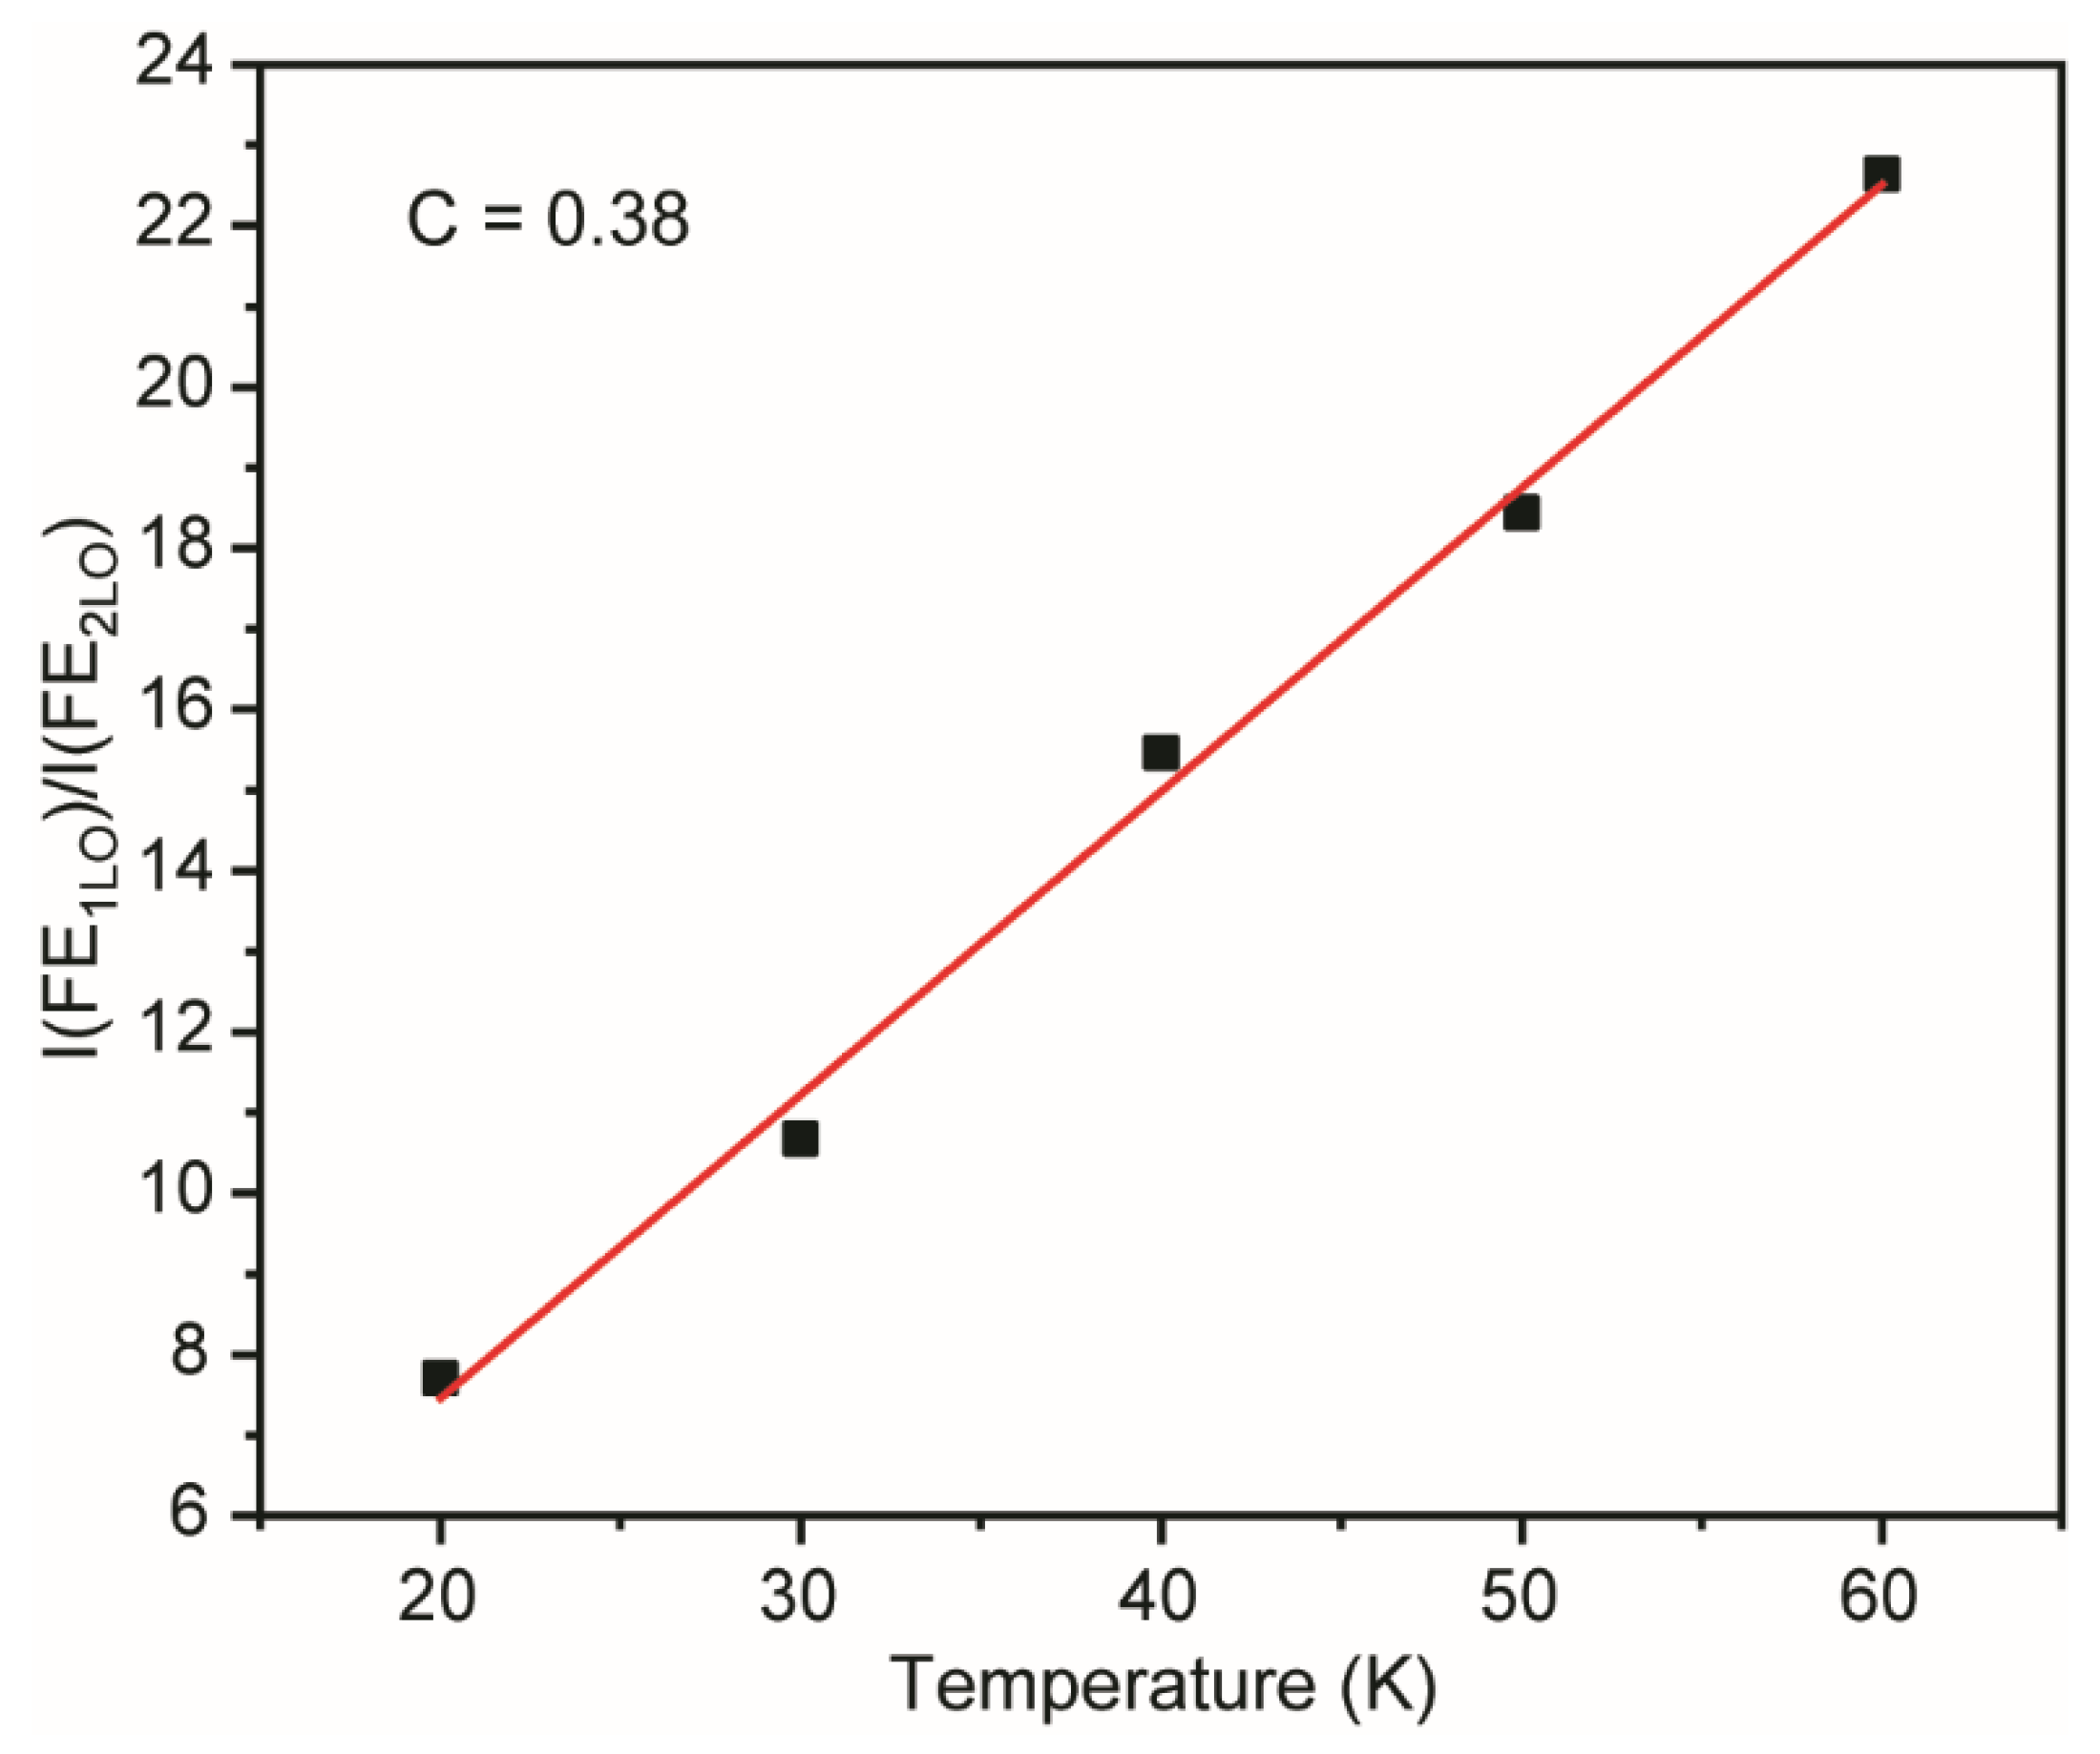
| MLR (Raman) | 15.44 | 0.07 |
Disclaimer/Publisher’s Note: The statements, opinions and data contained in all publications are solely those of the individual author(s) and contributor(s) and not of MDPI and/or the editor(s). MDPI and/or the editor(s) disclaim responsibility for any injury to people or property resulting from any ideas, methods, instructions or products referred to in the content. |
© 2023 by the authors. Licensee MDPI, Basel, Switzerland. This article is an open access article distributed under the terms and conditions of the Creative Commons Attribution (CC BY) license (https://creativecommons.org/licenses/by/4.0/).
Share and Cite
Borisov, E.V.; Kalinichev, A.A.; Kolesnikov, I.E. ZnTe Crystal Multimode Cryogenic Thermometry Using Raman and Luminescence Spectroscopy. Materials 2023, 16, 1311. https://doi.org/10.3390/ma16031311
Borisov EV, Kalinichev AA, Kolesnikov IE. ZnTe Crystal Multimode Cryogenic Thermometry Using Raman and Luminescence Spectroscopy. Materials. 2023; 16(3):1311. https://doi.org/10.3390/ma16031311
Chicago/Turabian StyleBorisov, Evgenii V., Alexey A. Kalinichev, and Ilya E. Kolesnikov. 2023. "ZnTe Crystal Multimode Cryogenic Thermometry Using Raman and Luminescence Spectroscopy" Materials 16, no. 3: 1311. https://doi.org/10.3390/ma16031311