
The Workability and Mechanical Performance of Fly Ash Cenosphere–Desert Sand Ceramsite Concrete: An Experimental Study and Analysis


Abstract
:1. Introduction
2. Materials and Methods
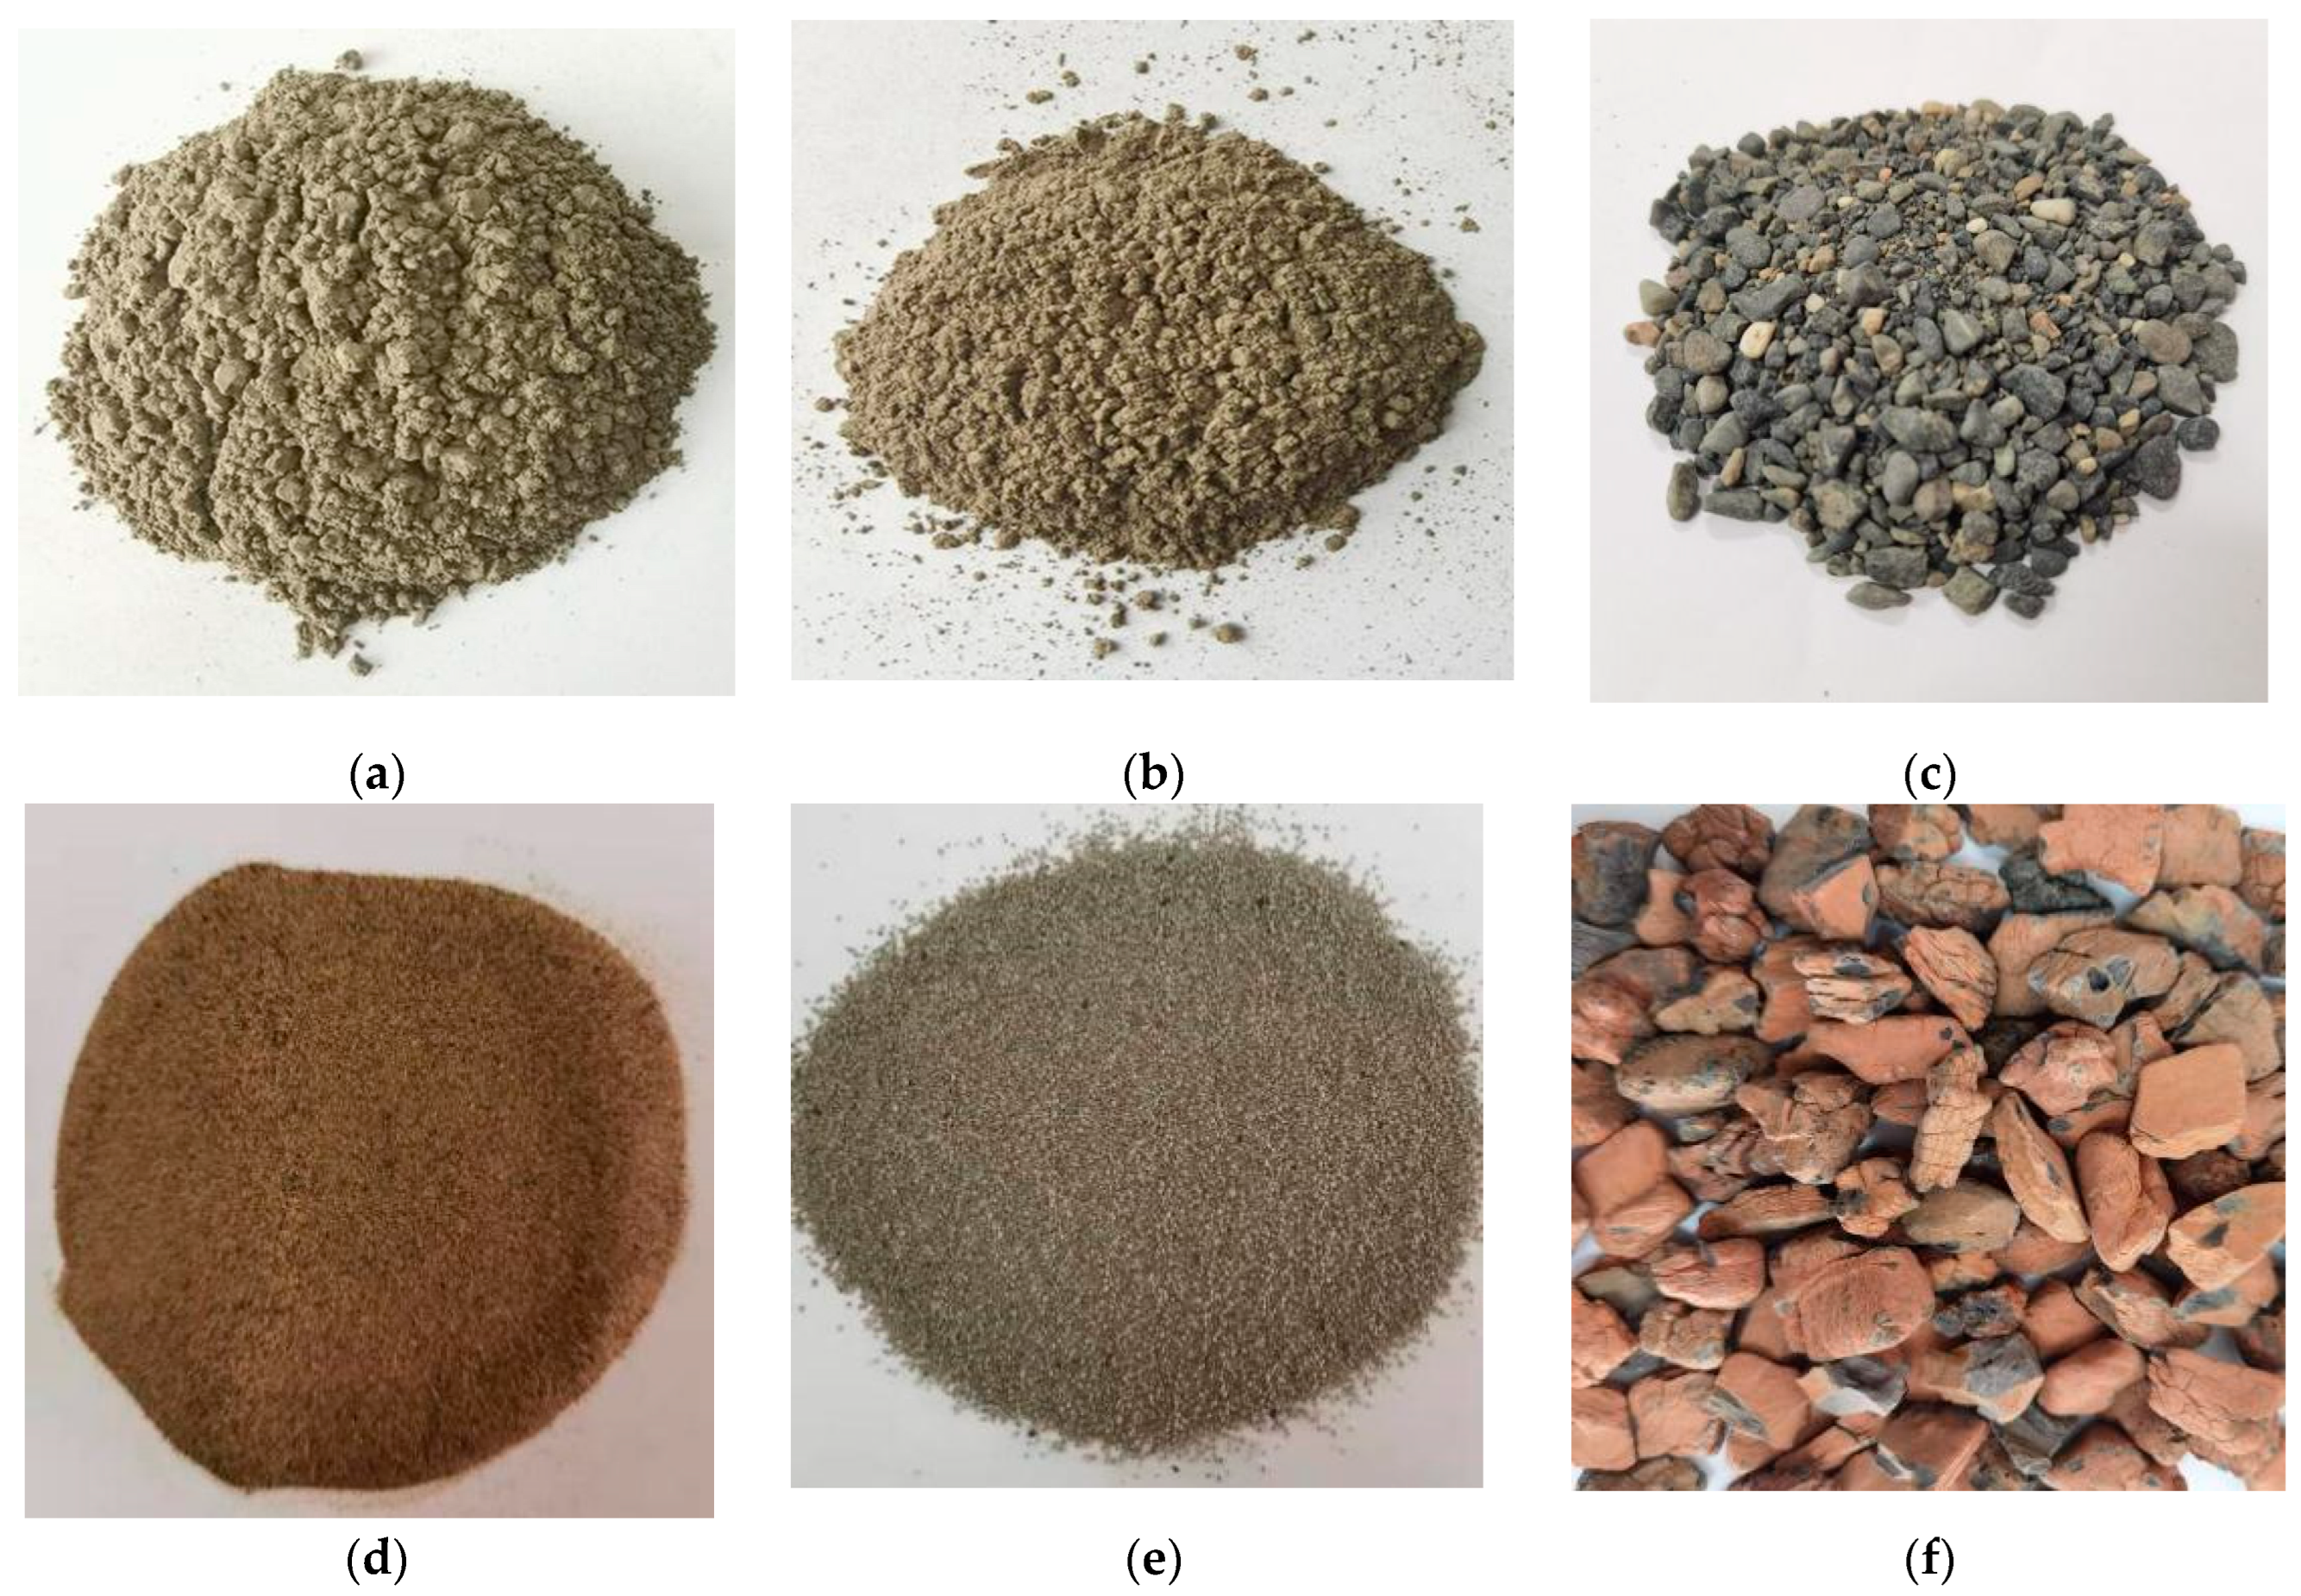
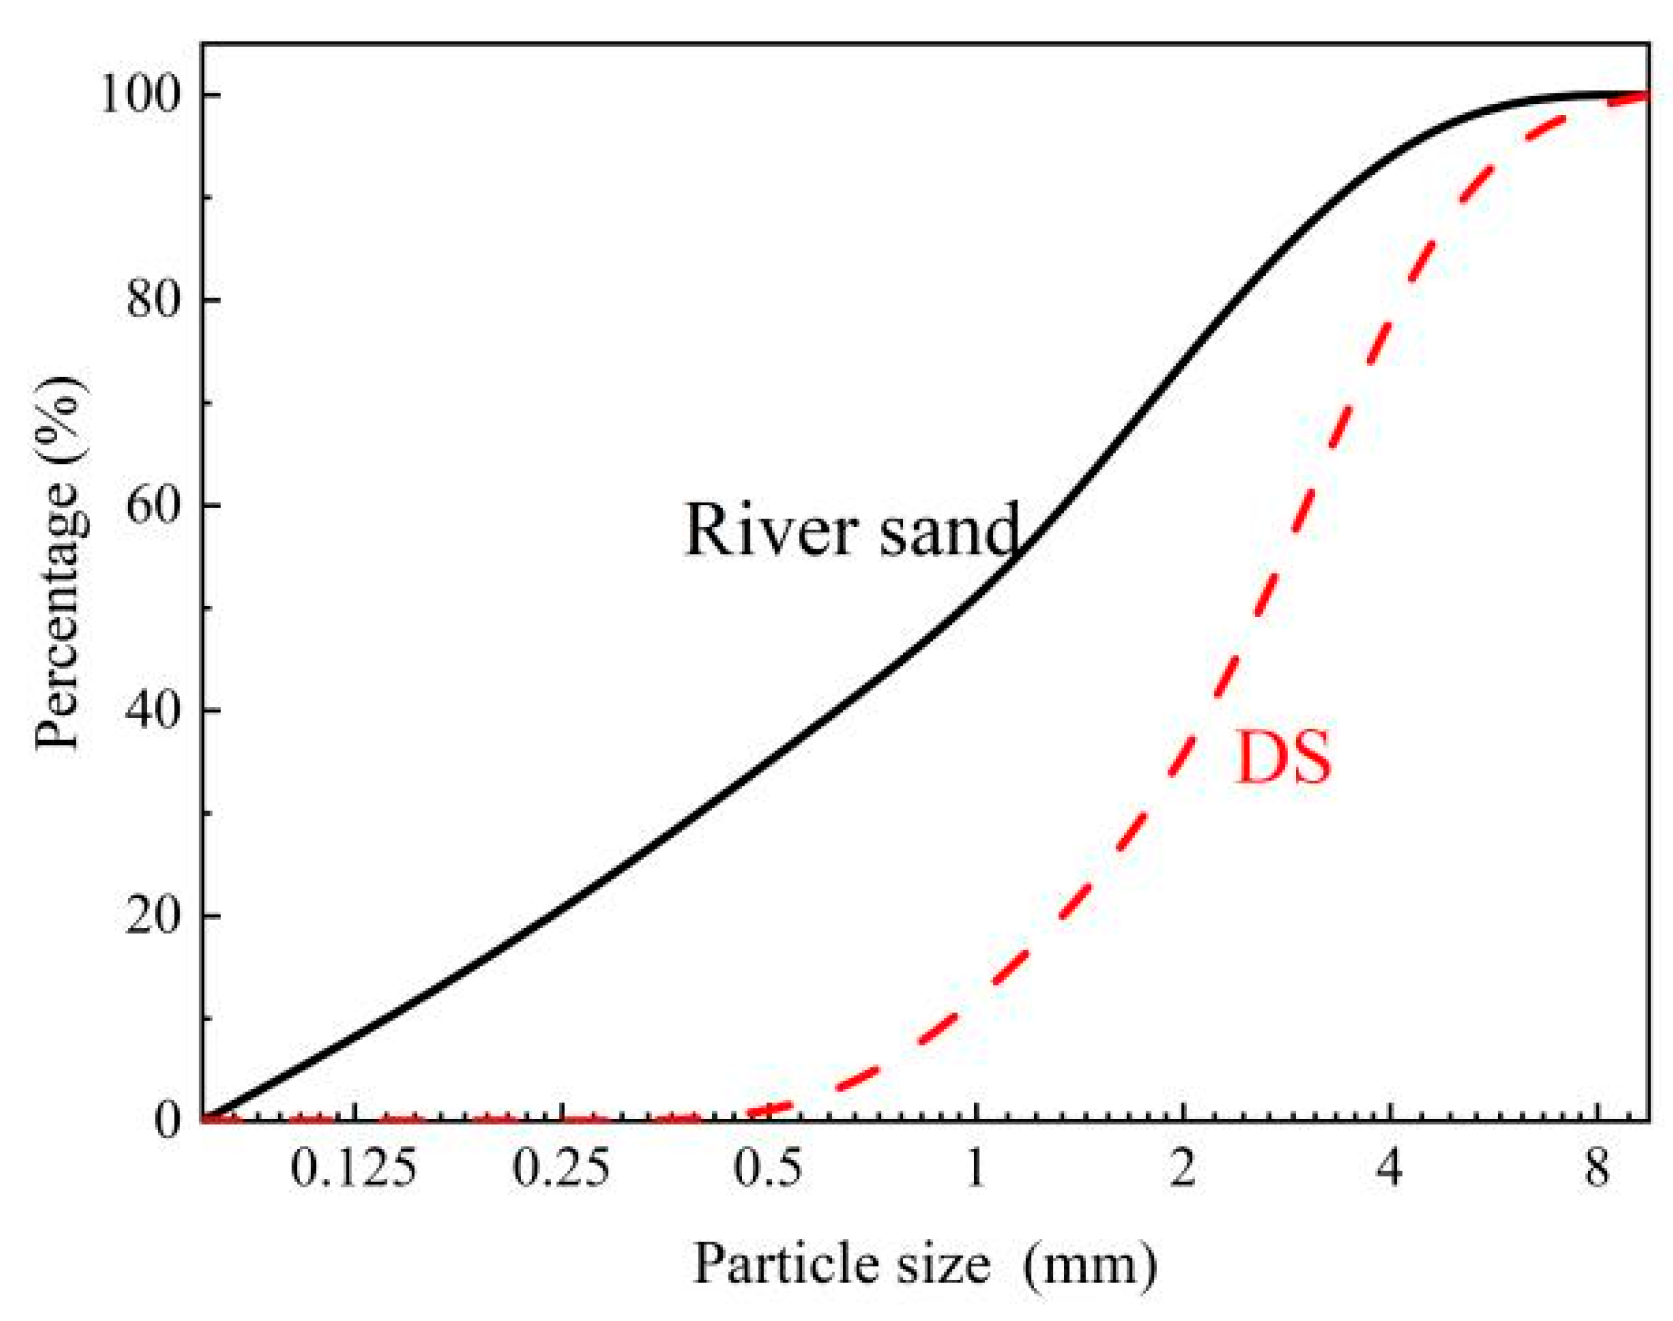
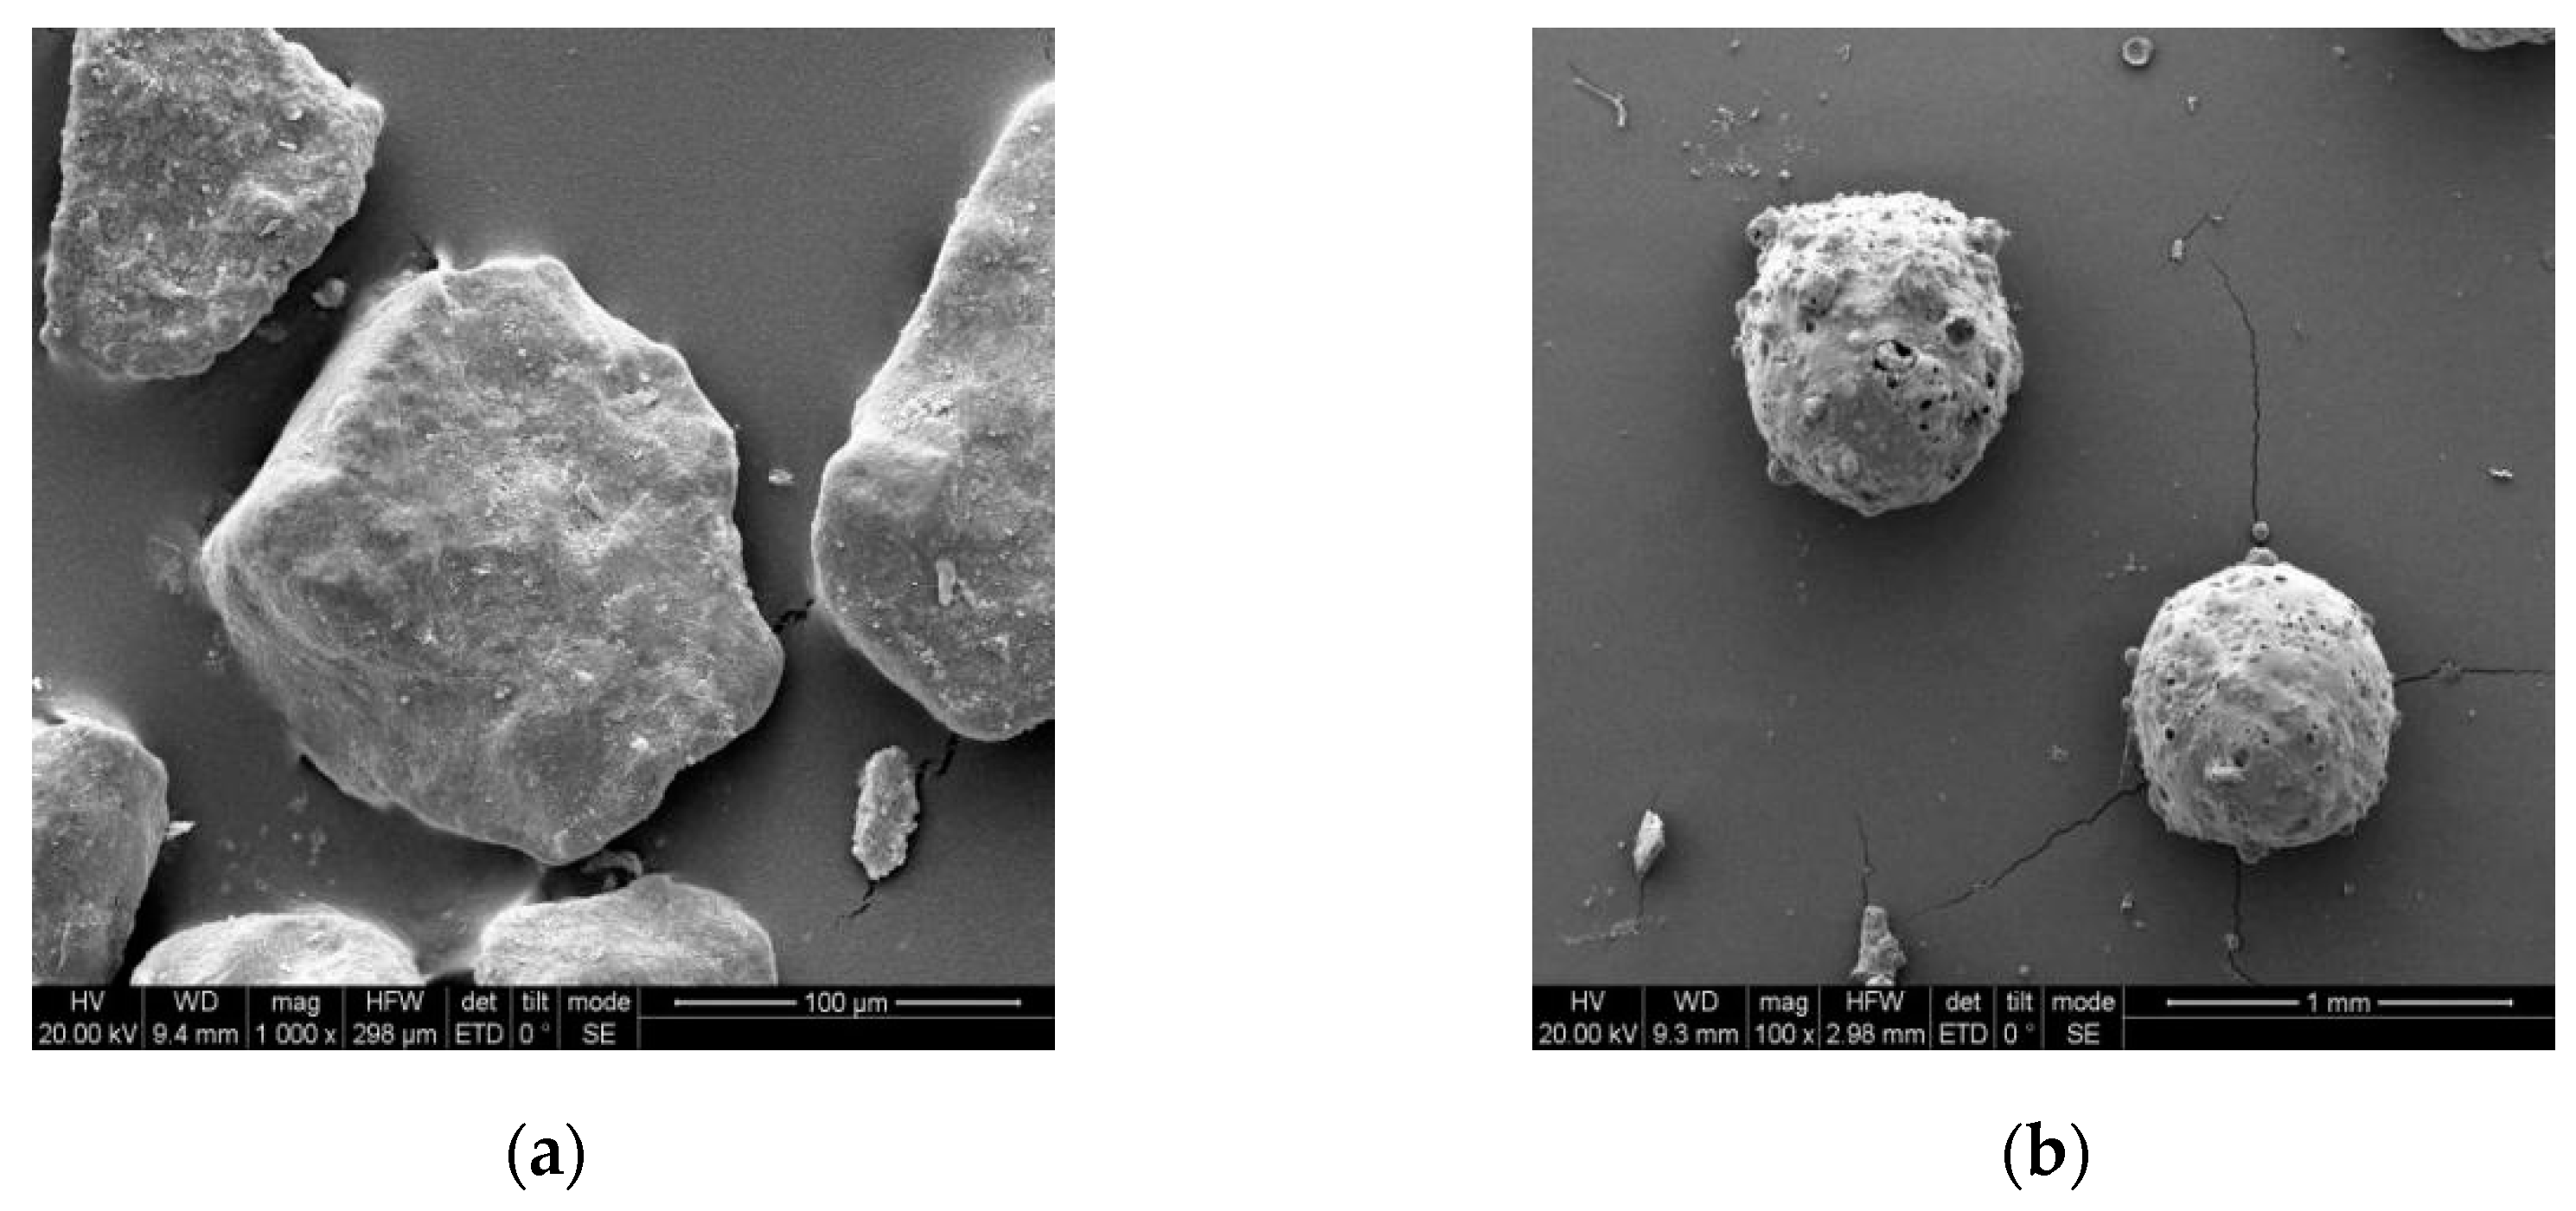
2.1. Materials
2.2. Orthogonal Test Design
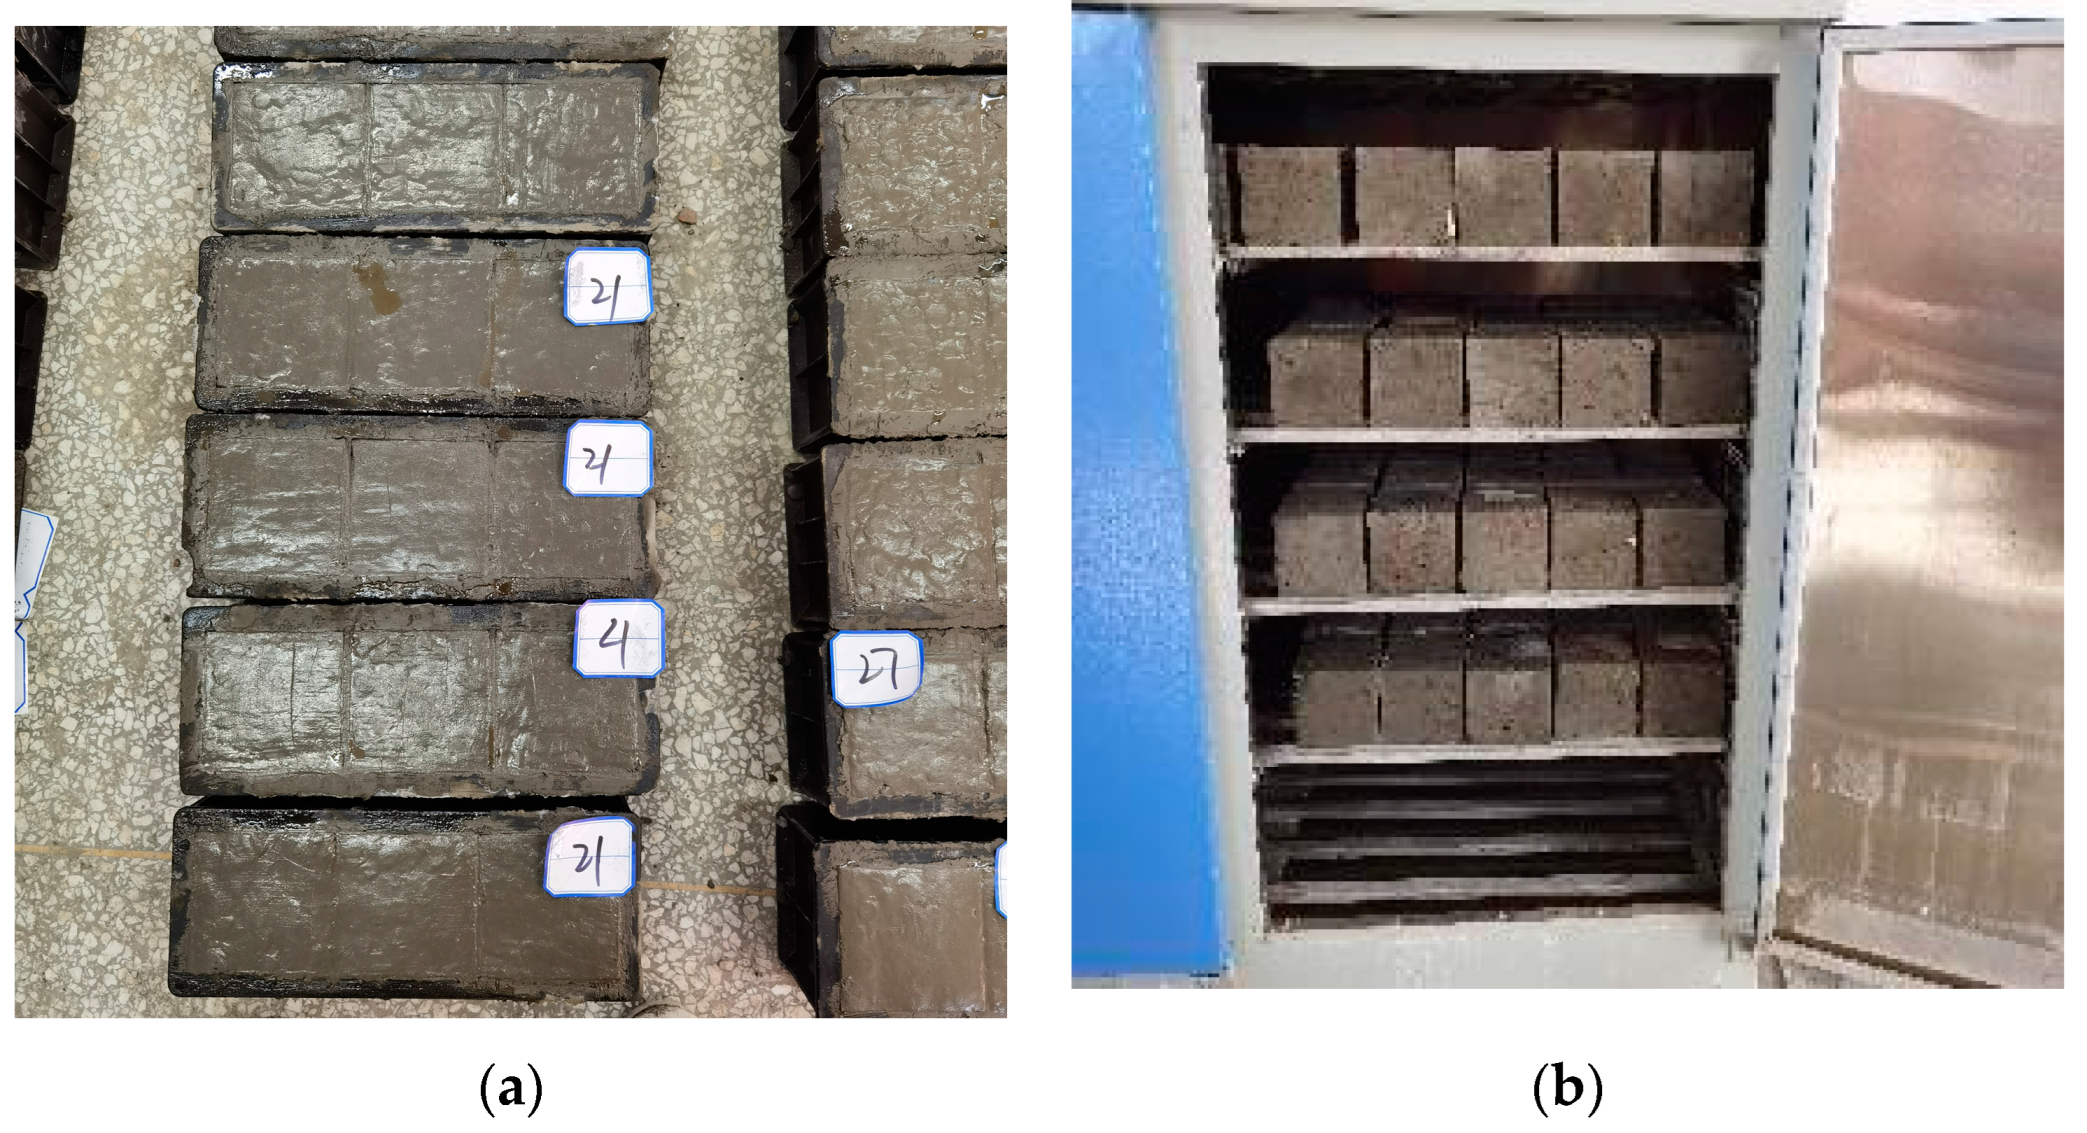
2.3. Specimen Preparation
2.4. Test Methods
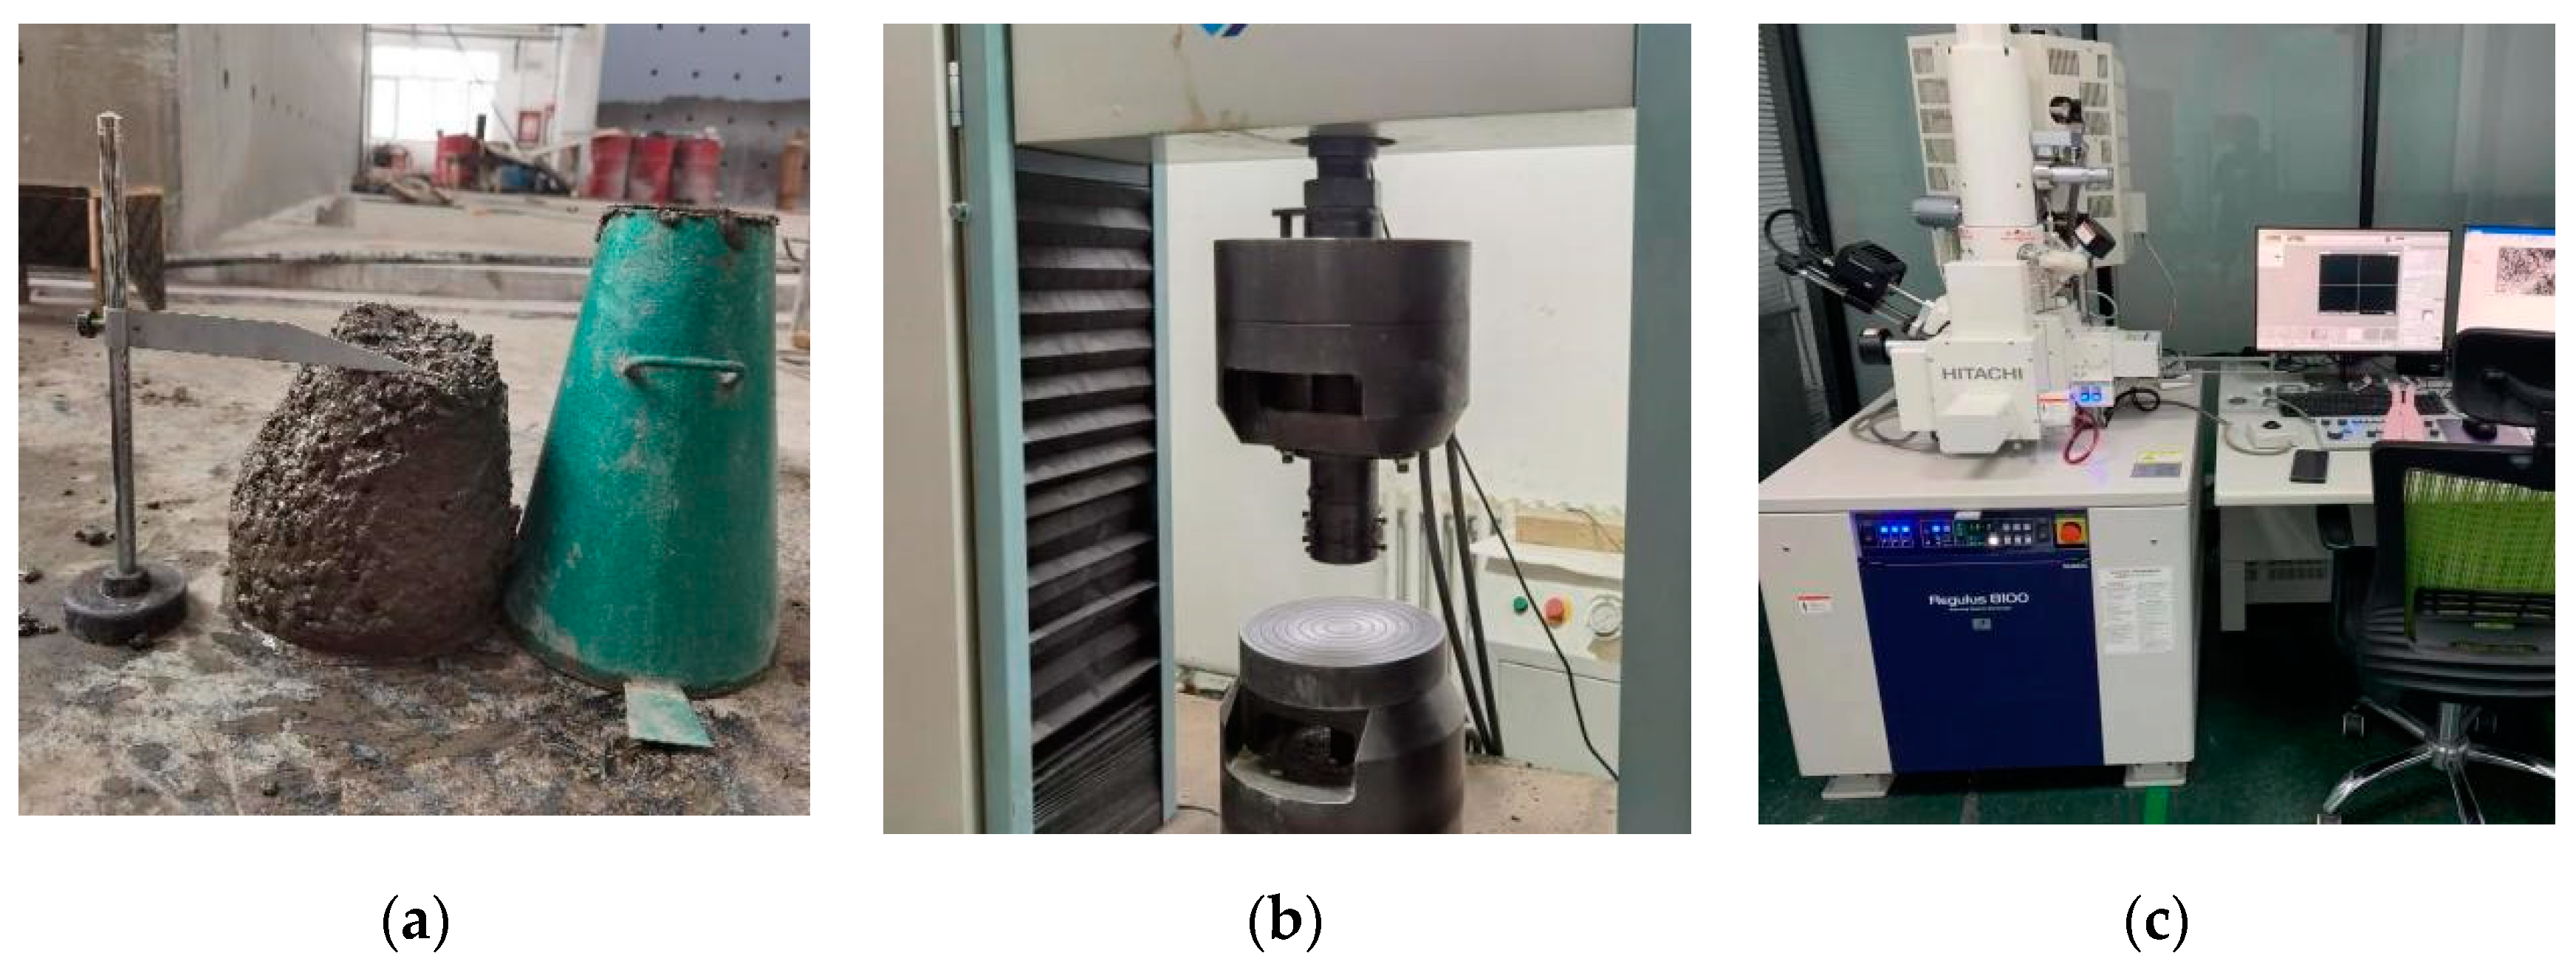
2.4.1. Slump
2.4.2. Compressive Strength and Apparent Density
2.4.3. Microstructural Analysis
3. Results and Analysis
3.1. Test Results
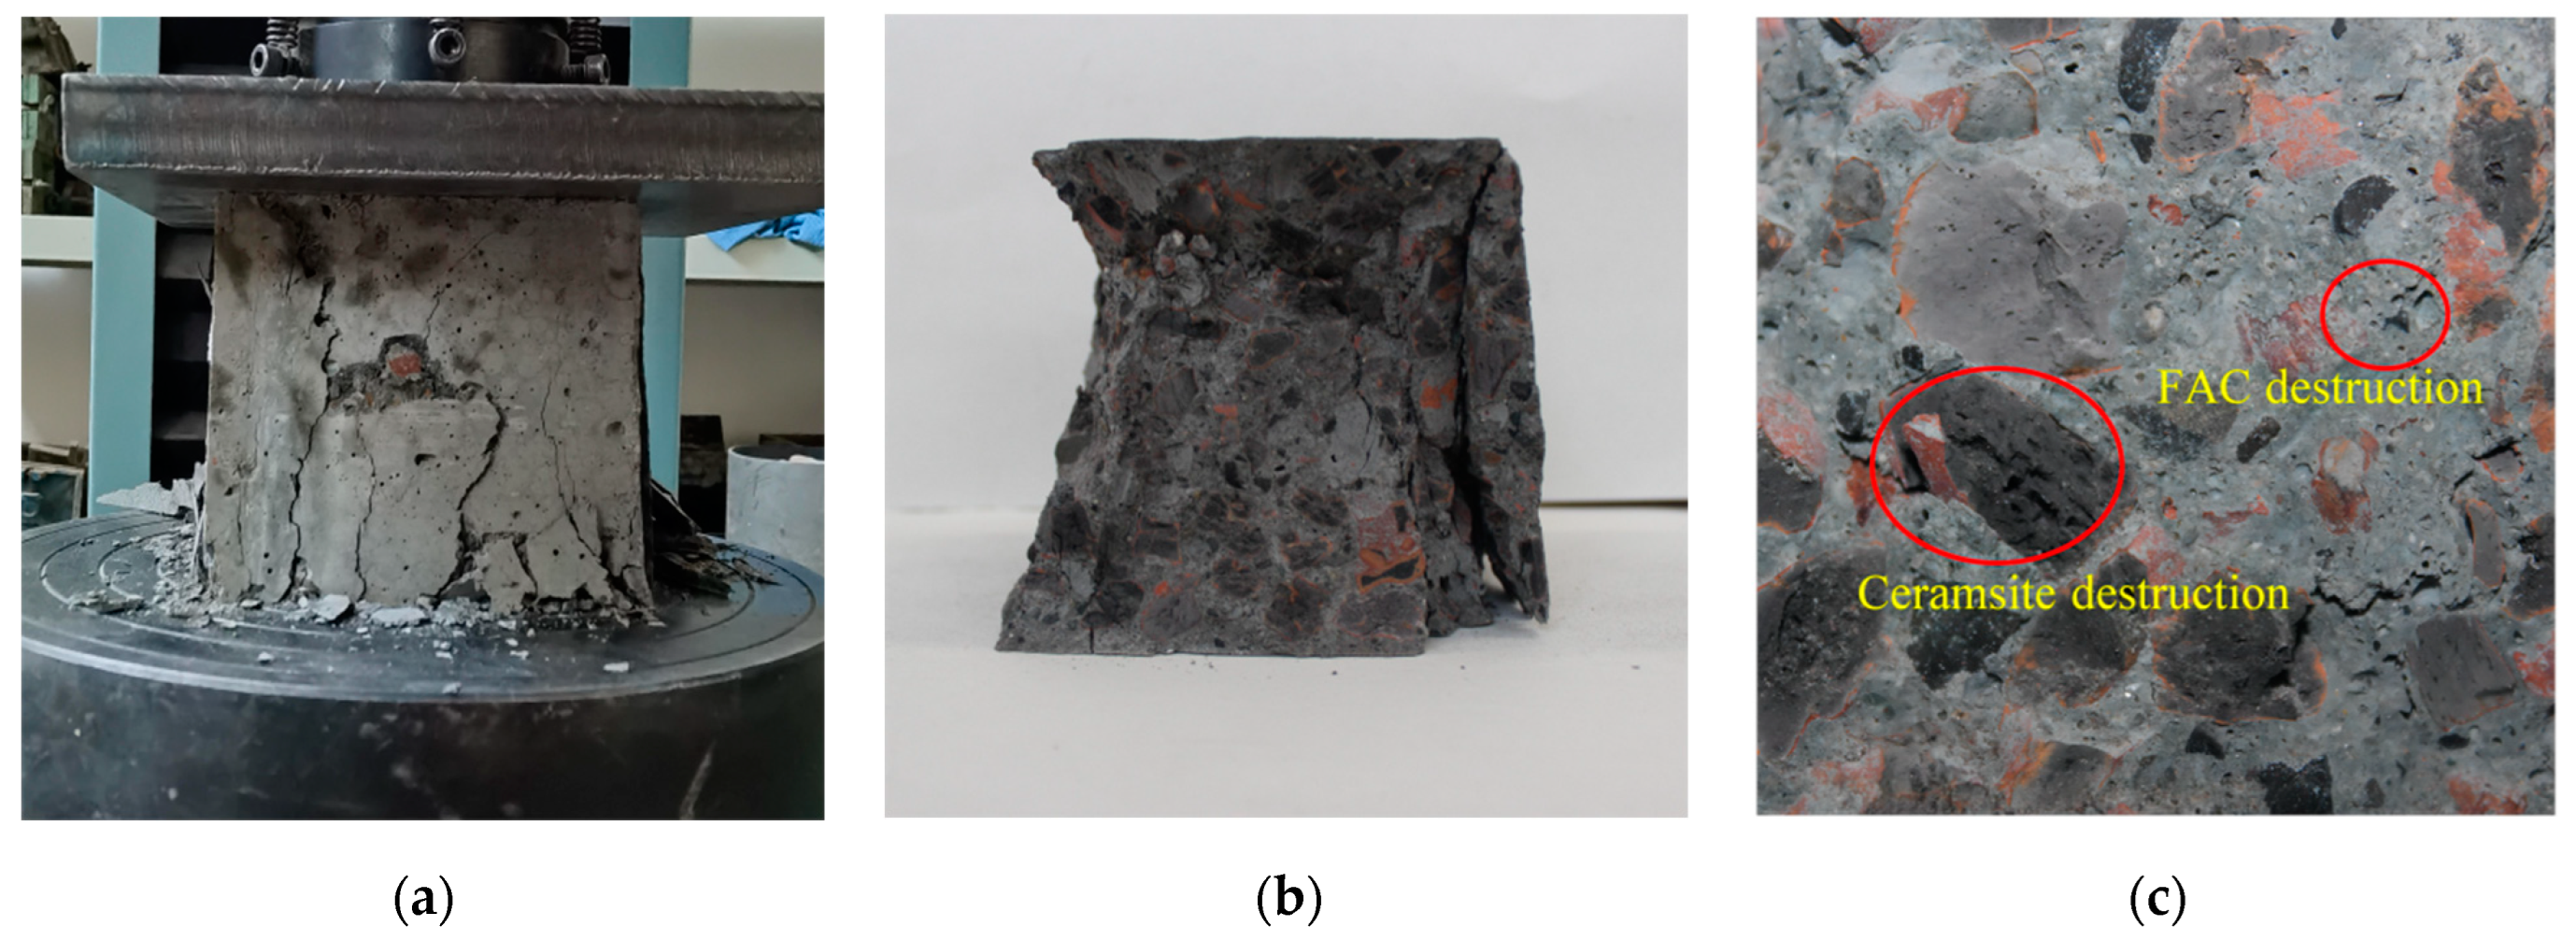
3.2. Damage Patterns
3.3. Range and Variance Analysis
3.4. Parametric Analysis
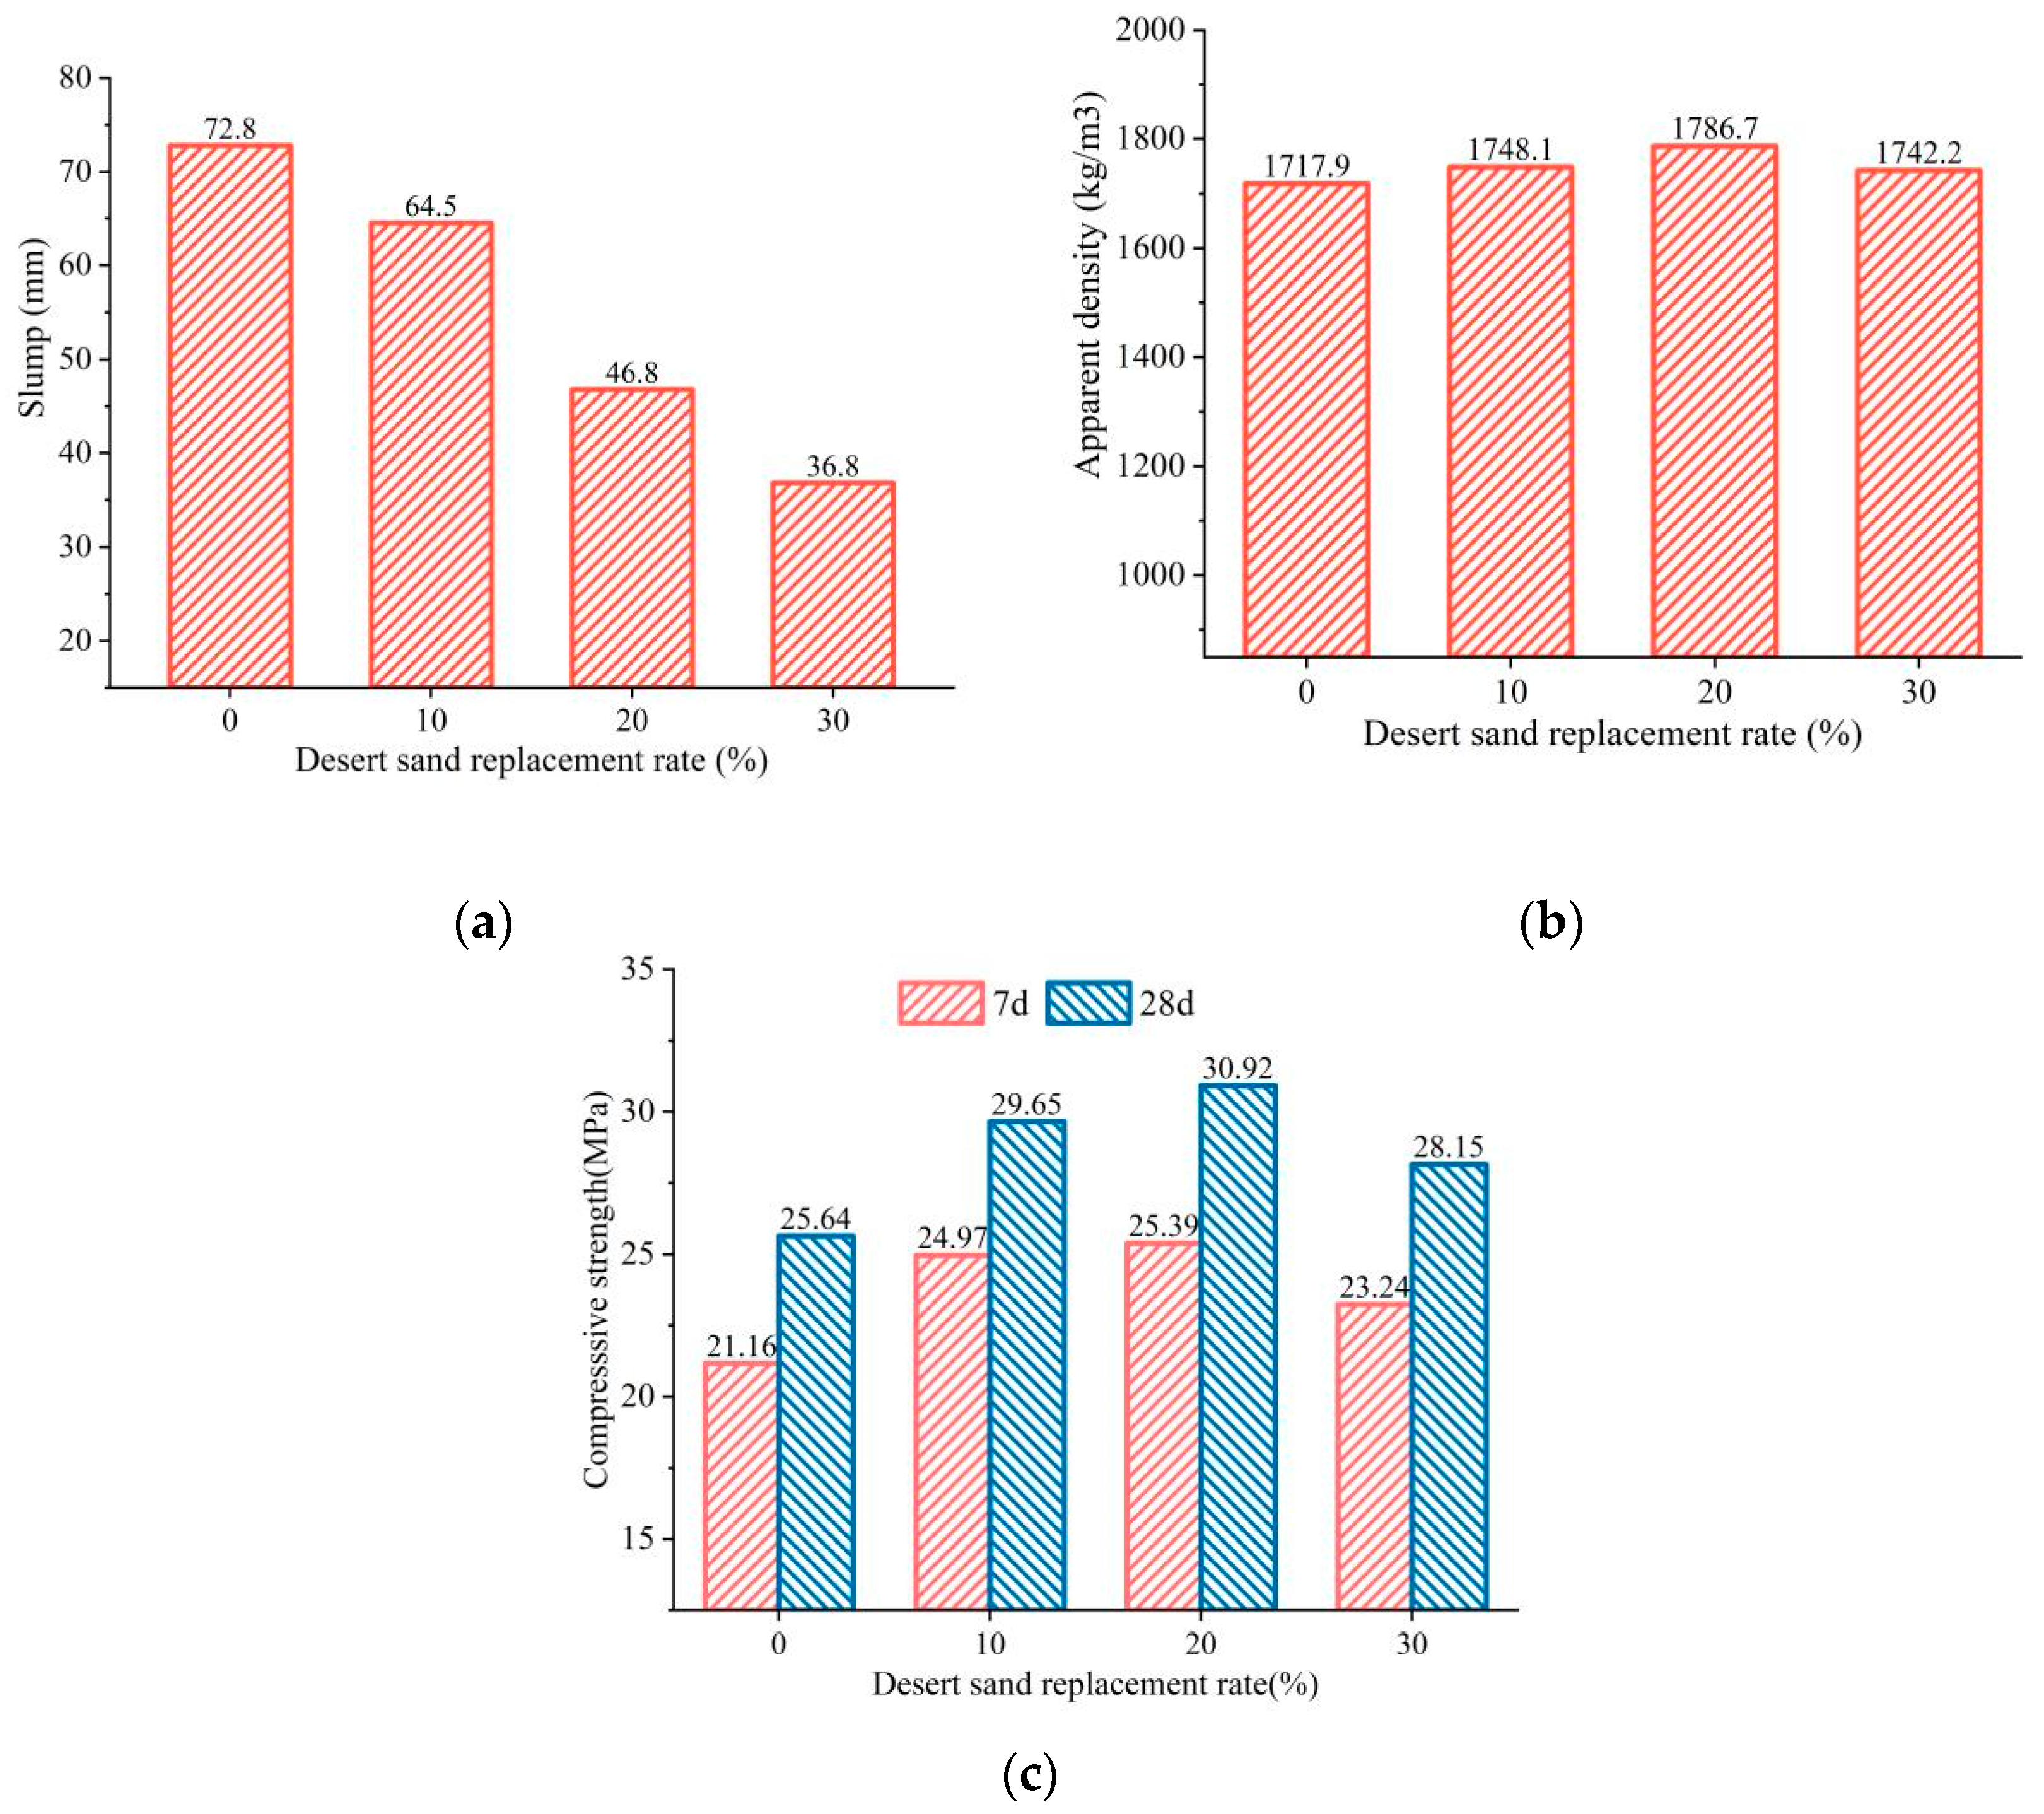
3.4.1. DS Replacing Ratio
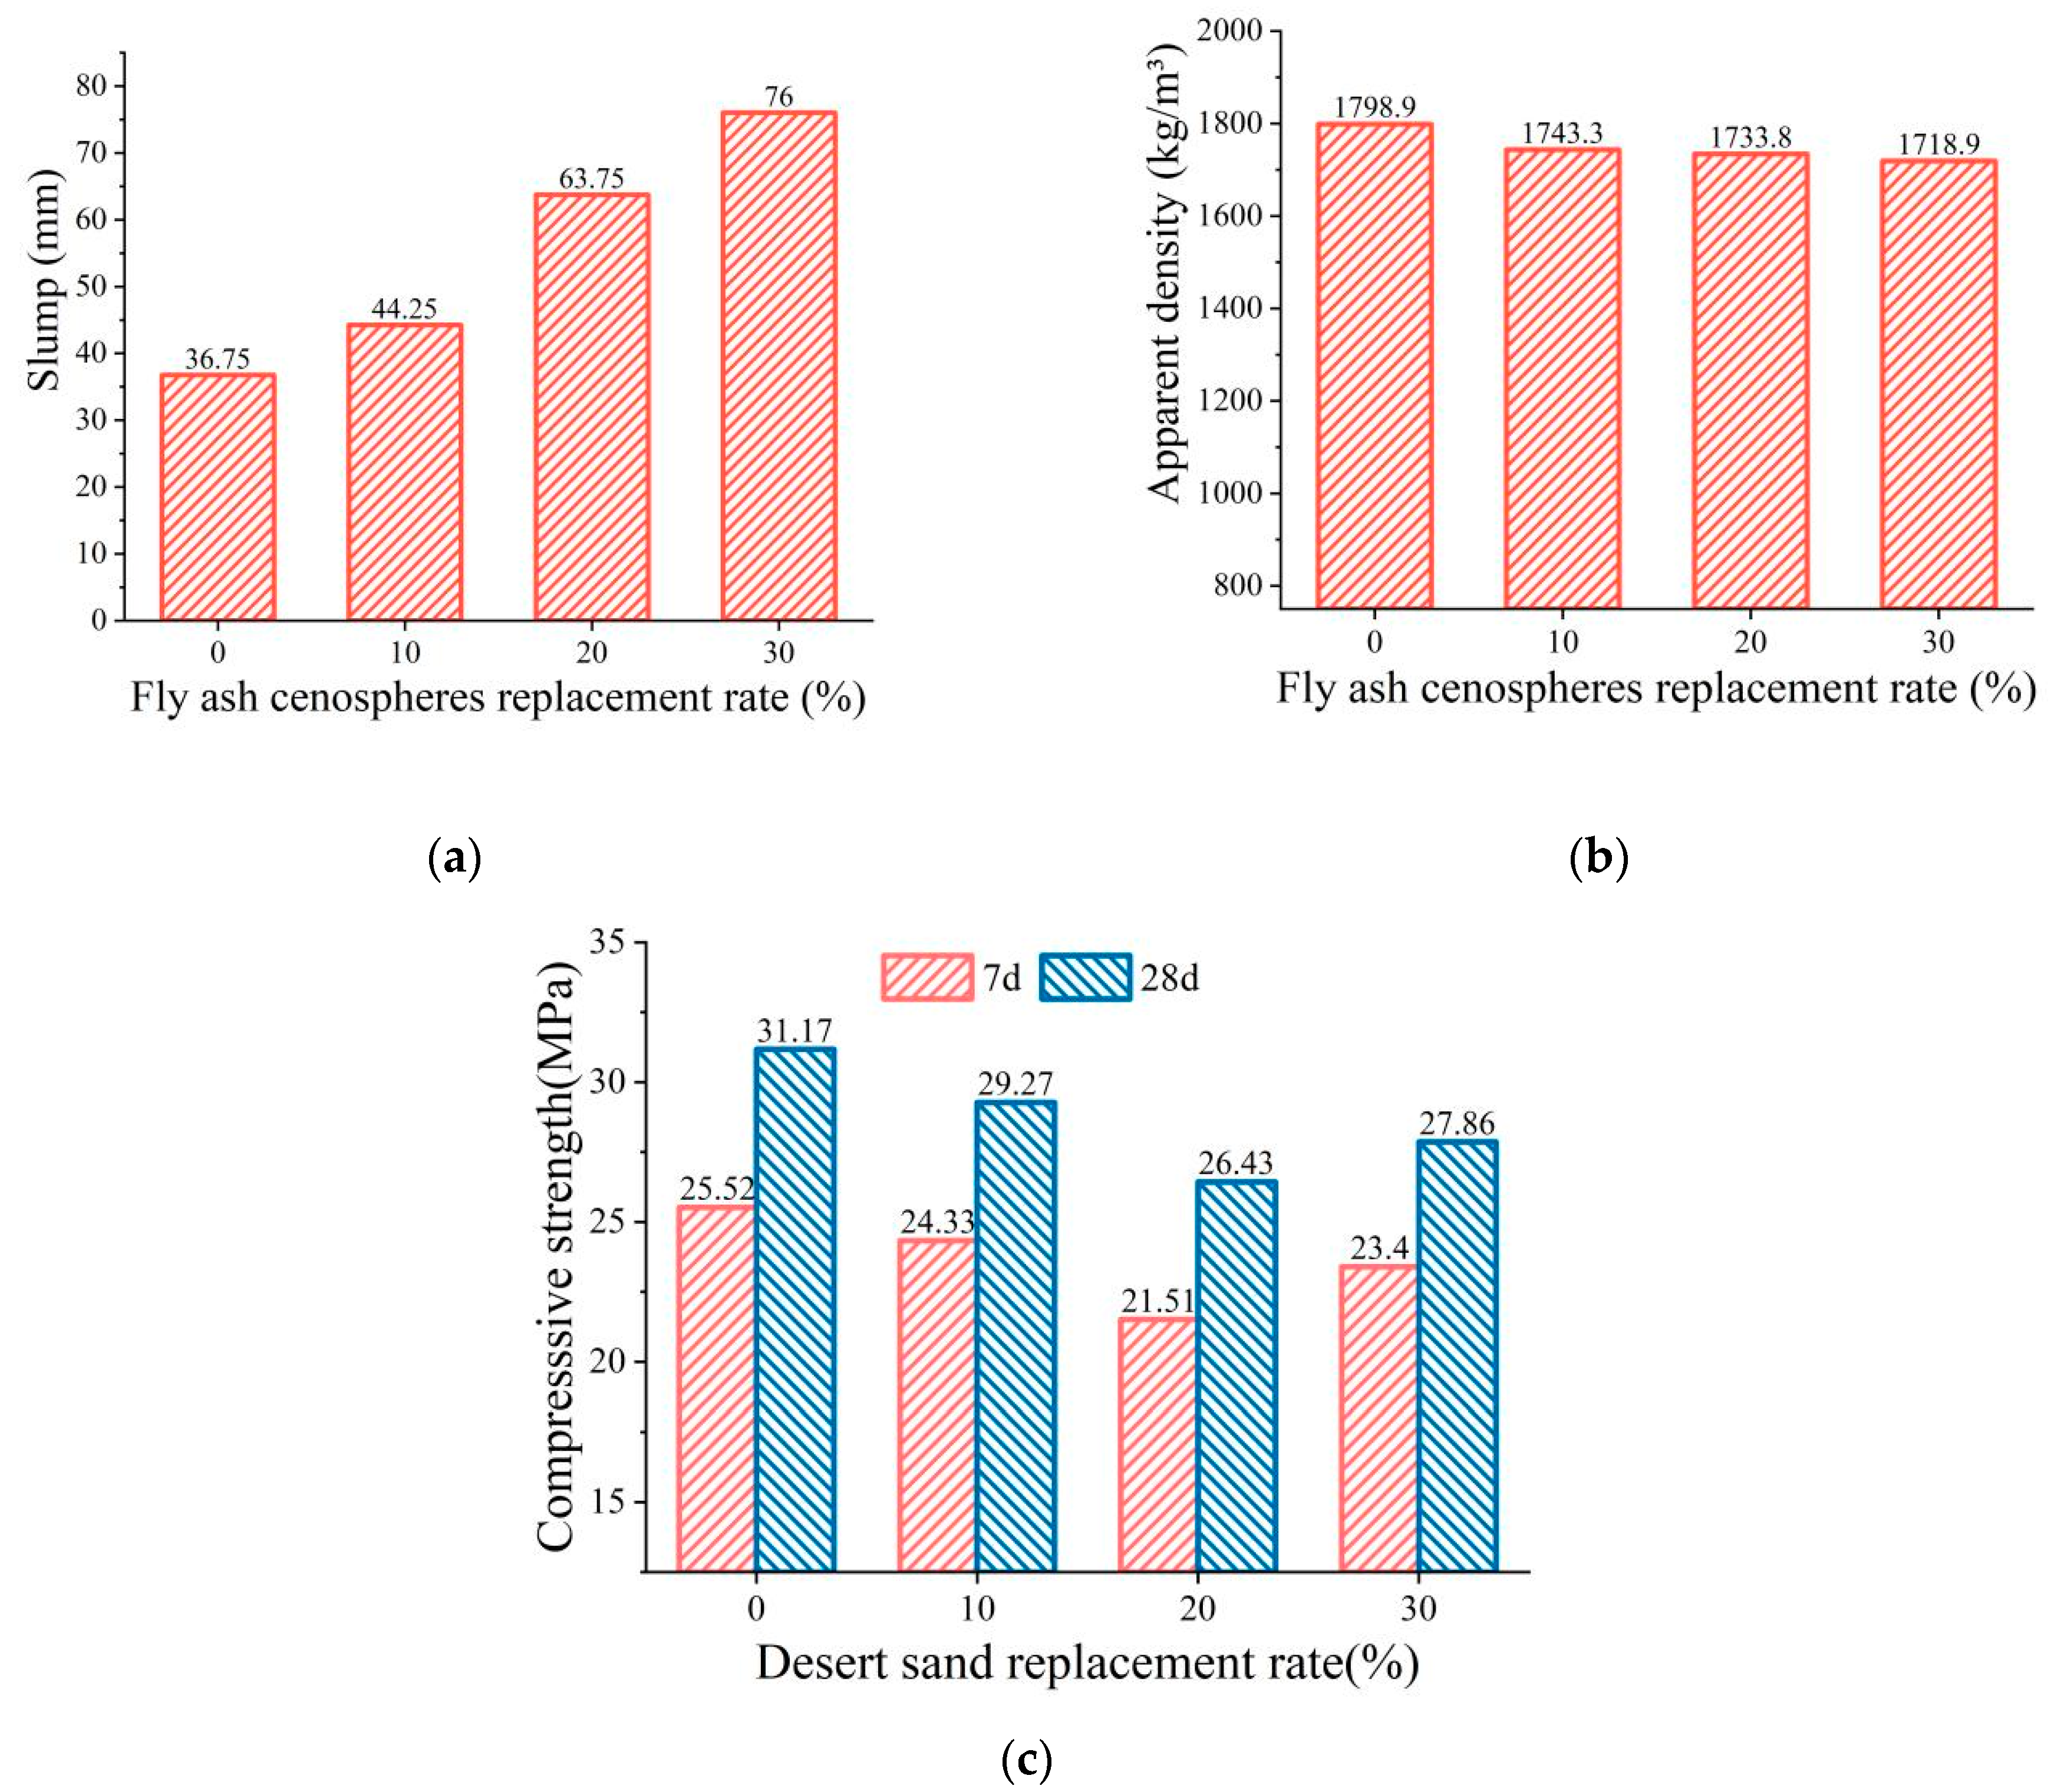
3.4.2. FAC Replacing Ratio
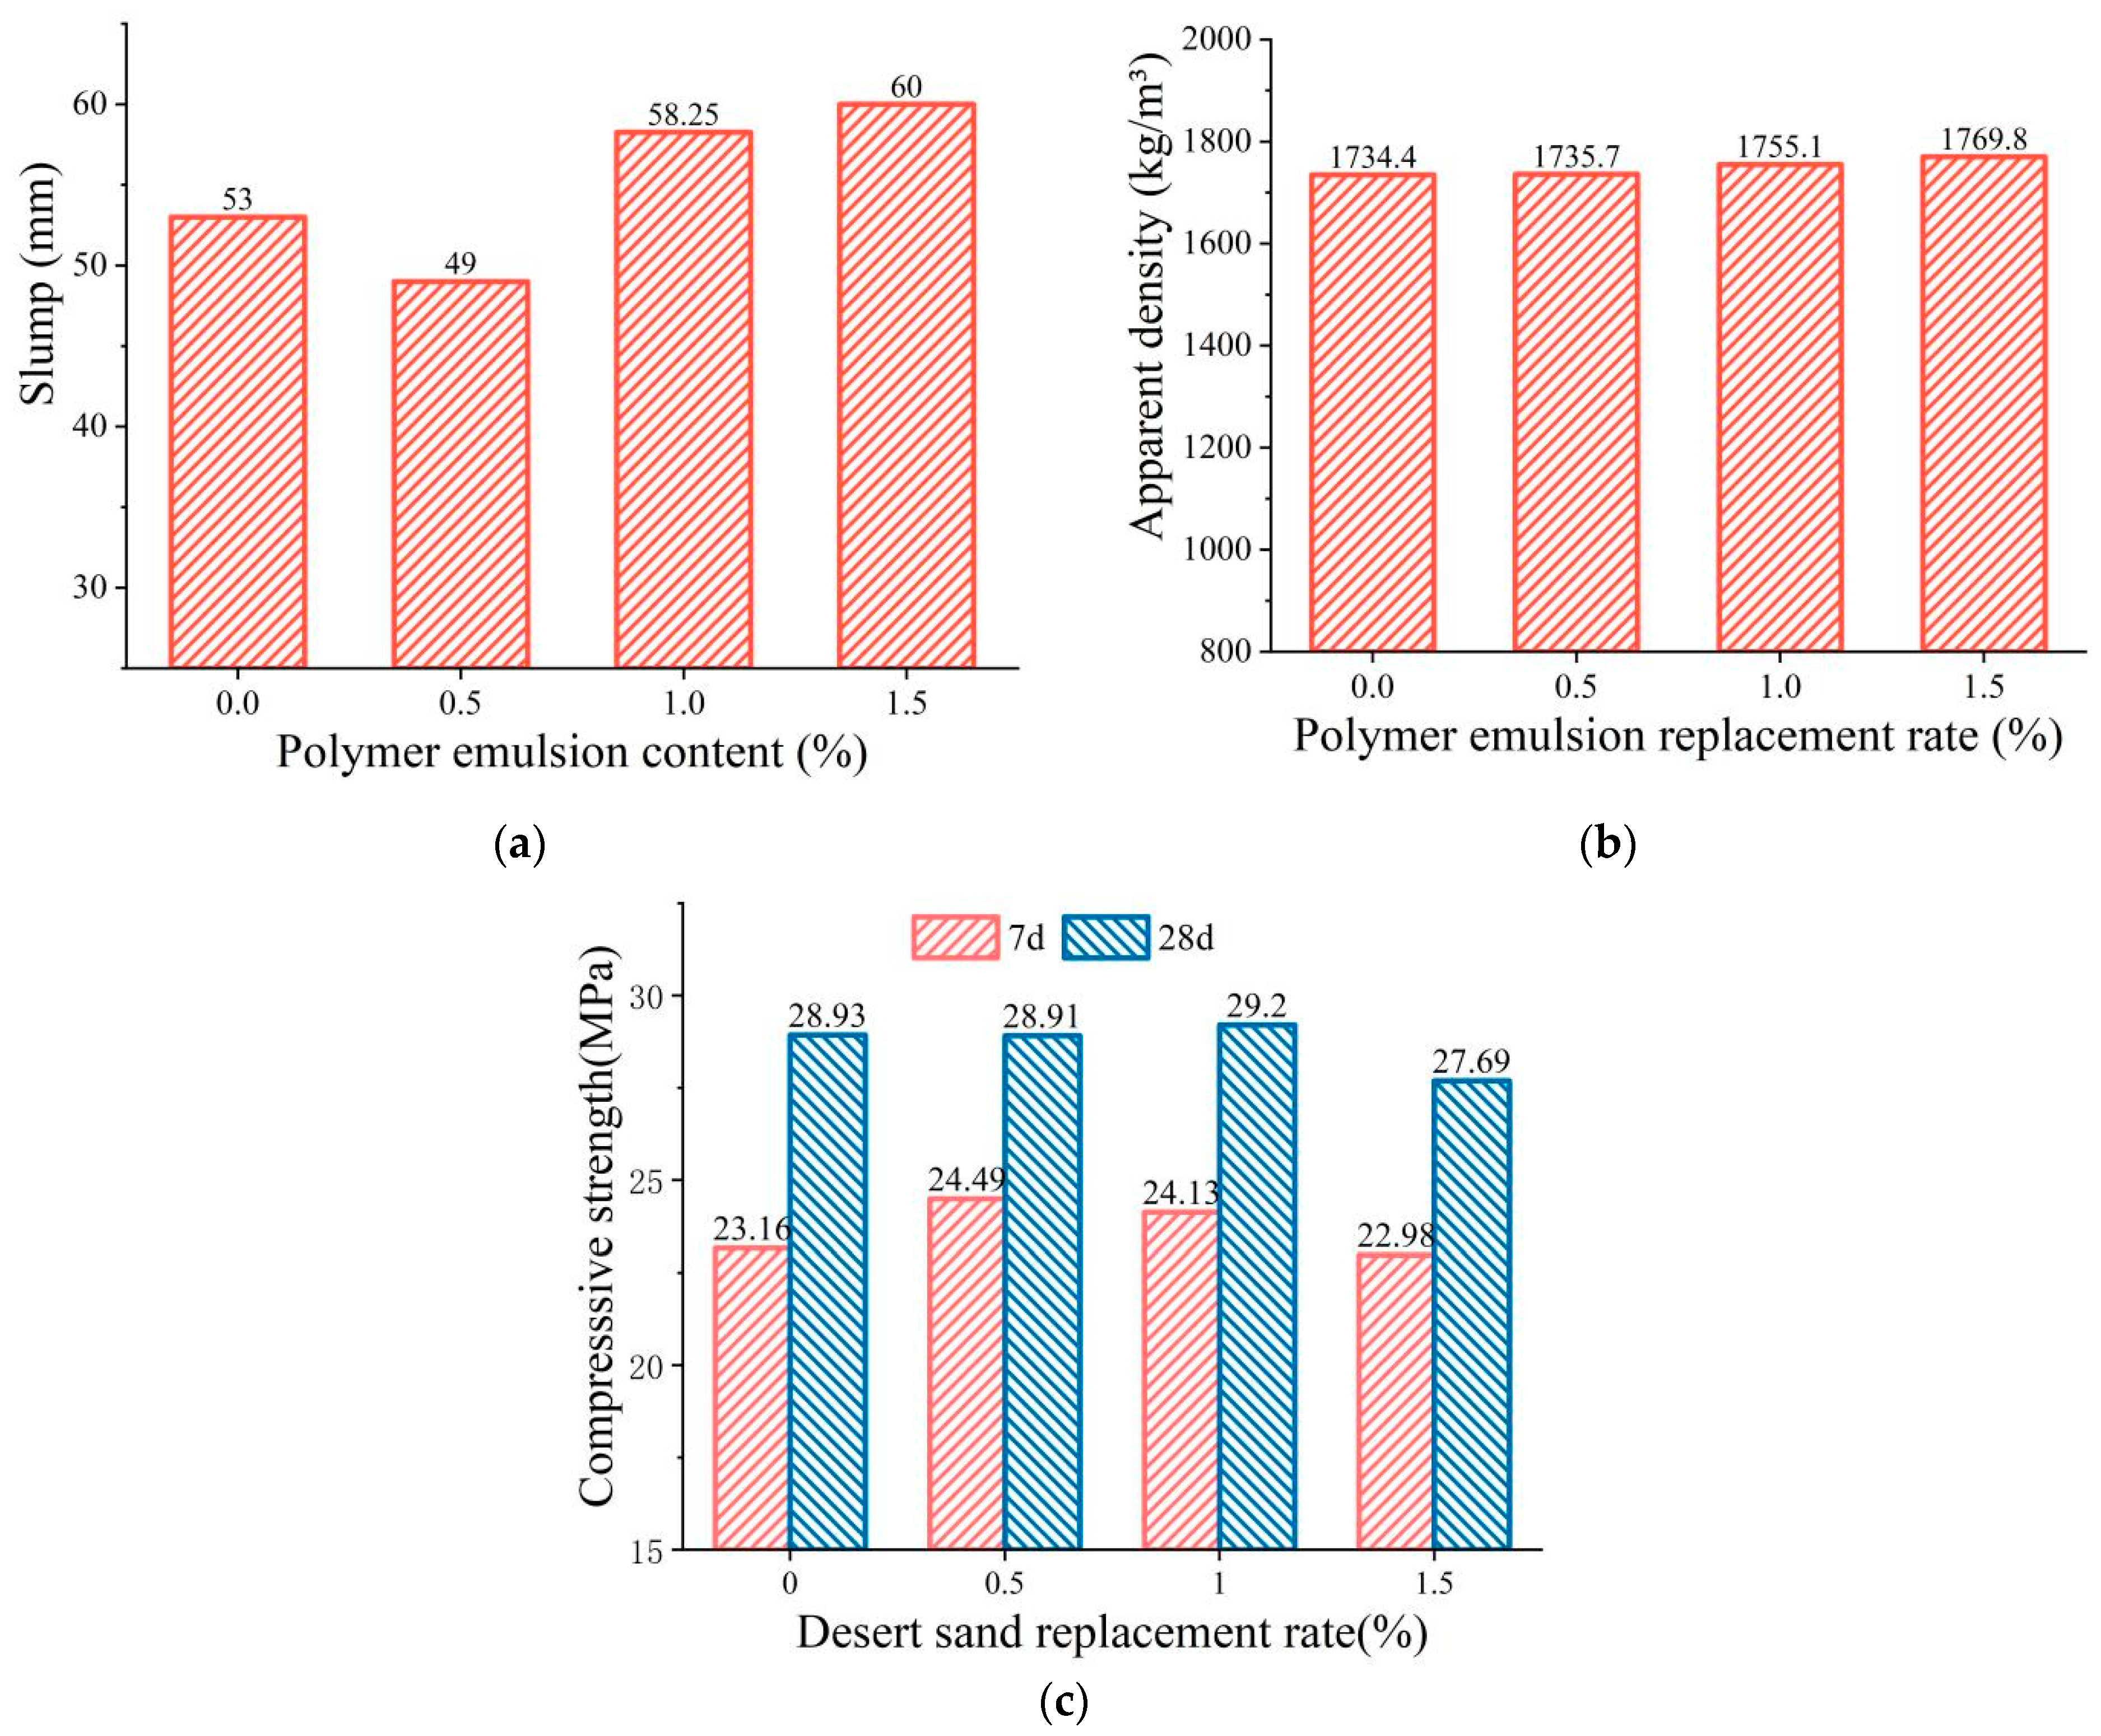
3.4.3. PLE Addition
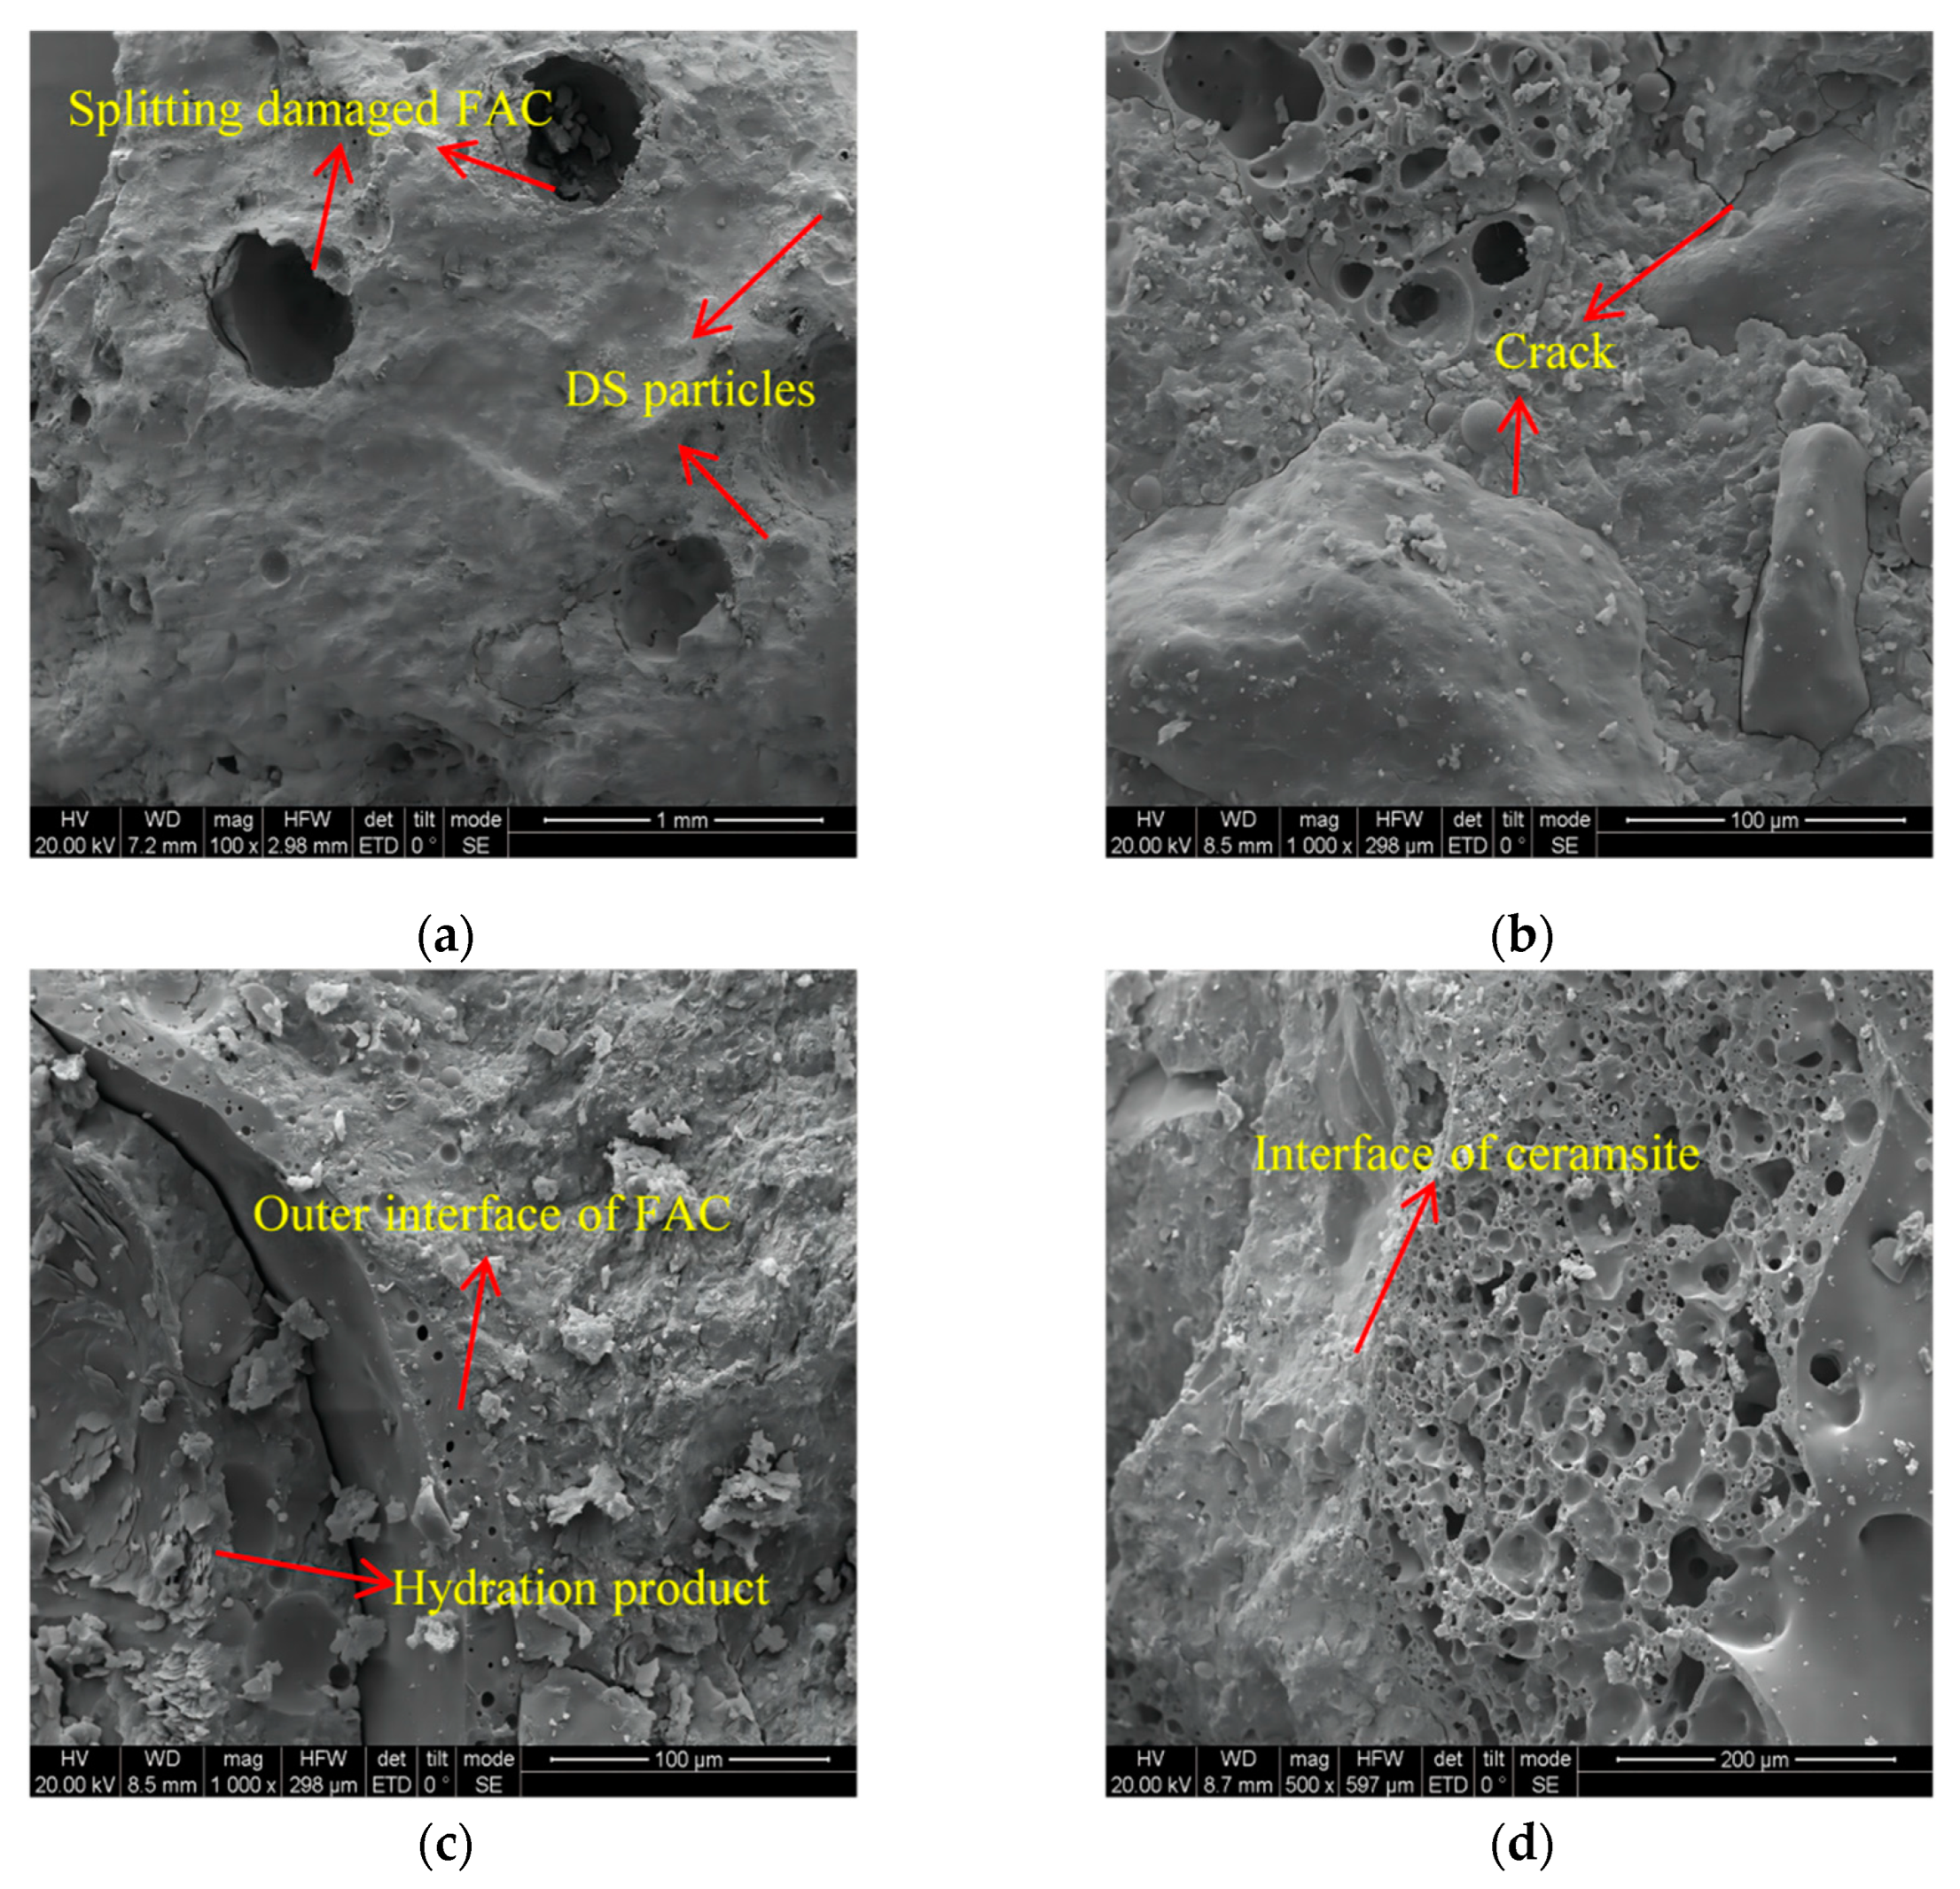
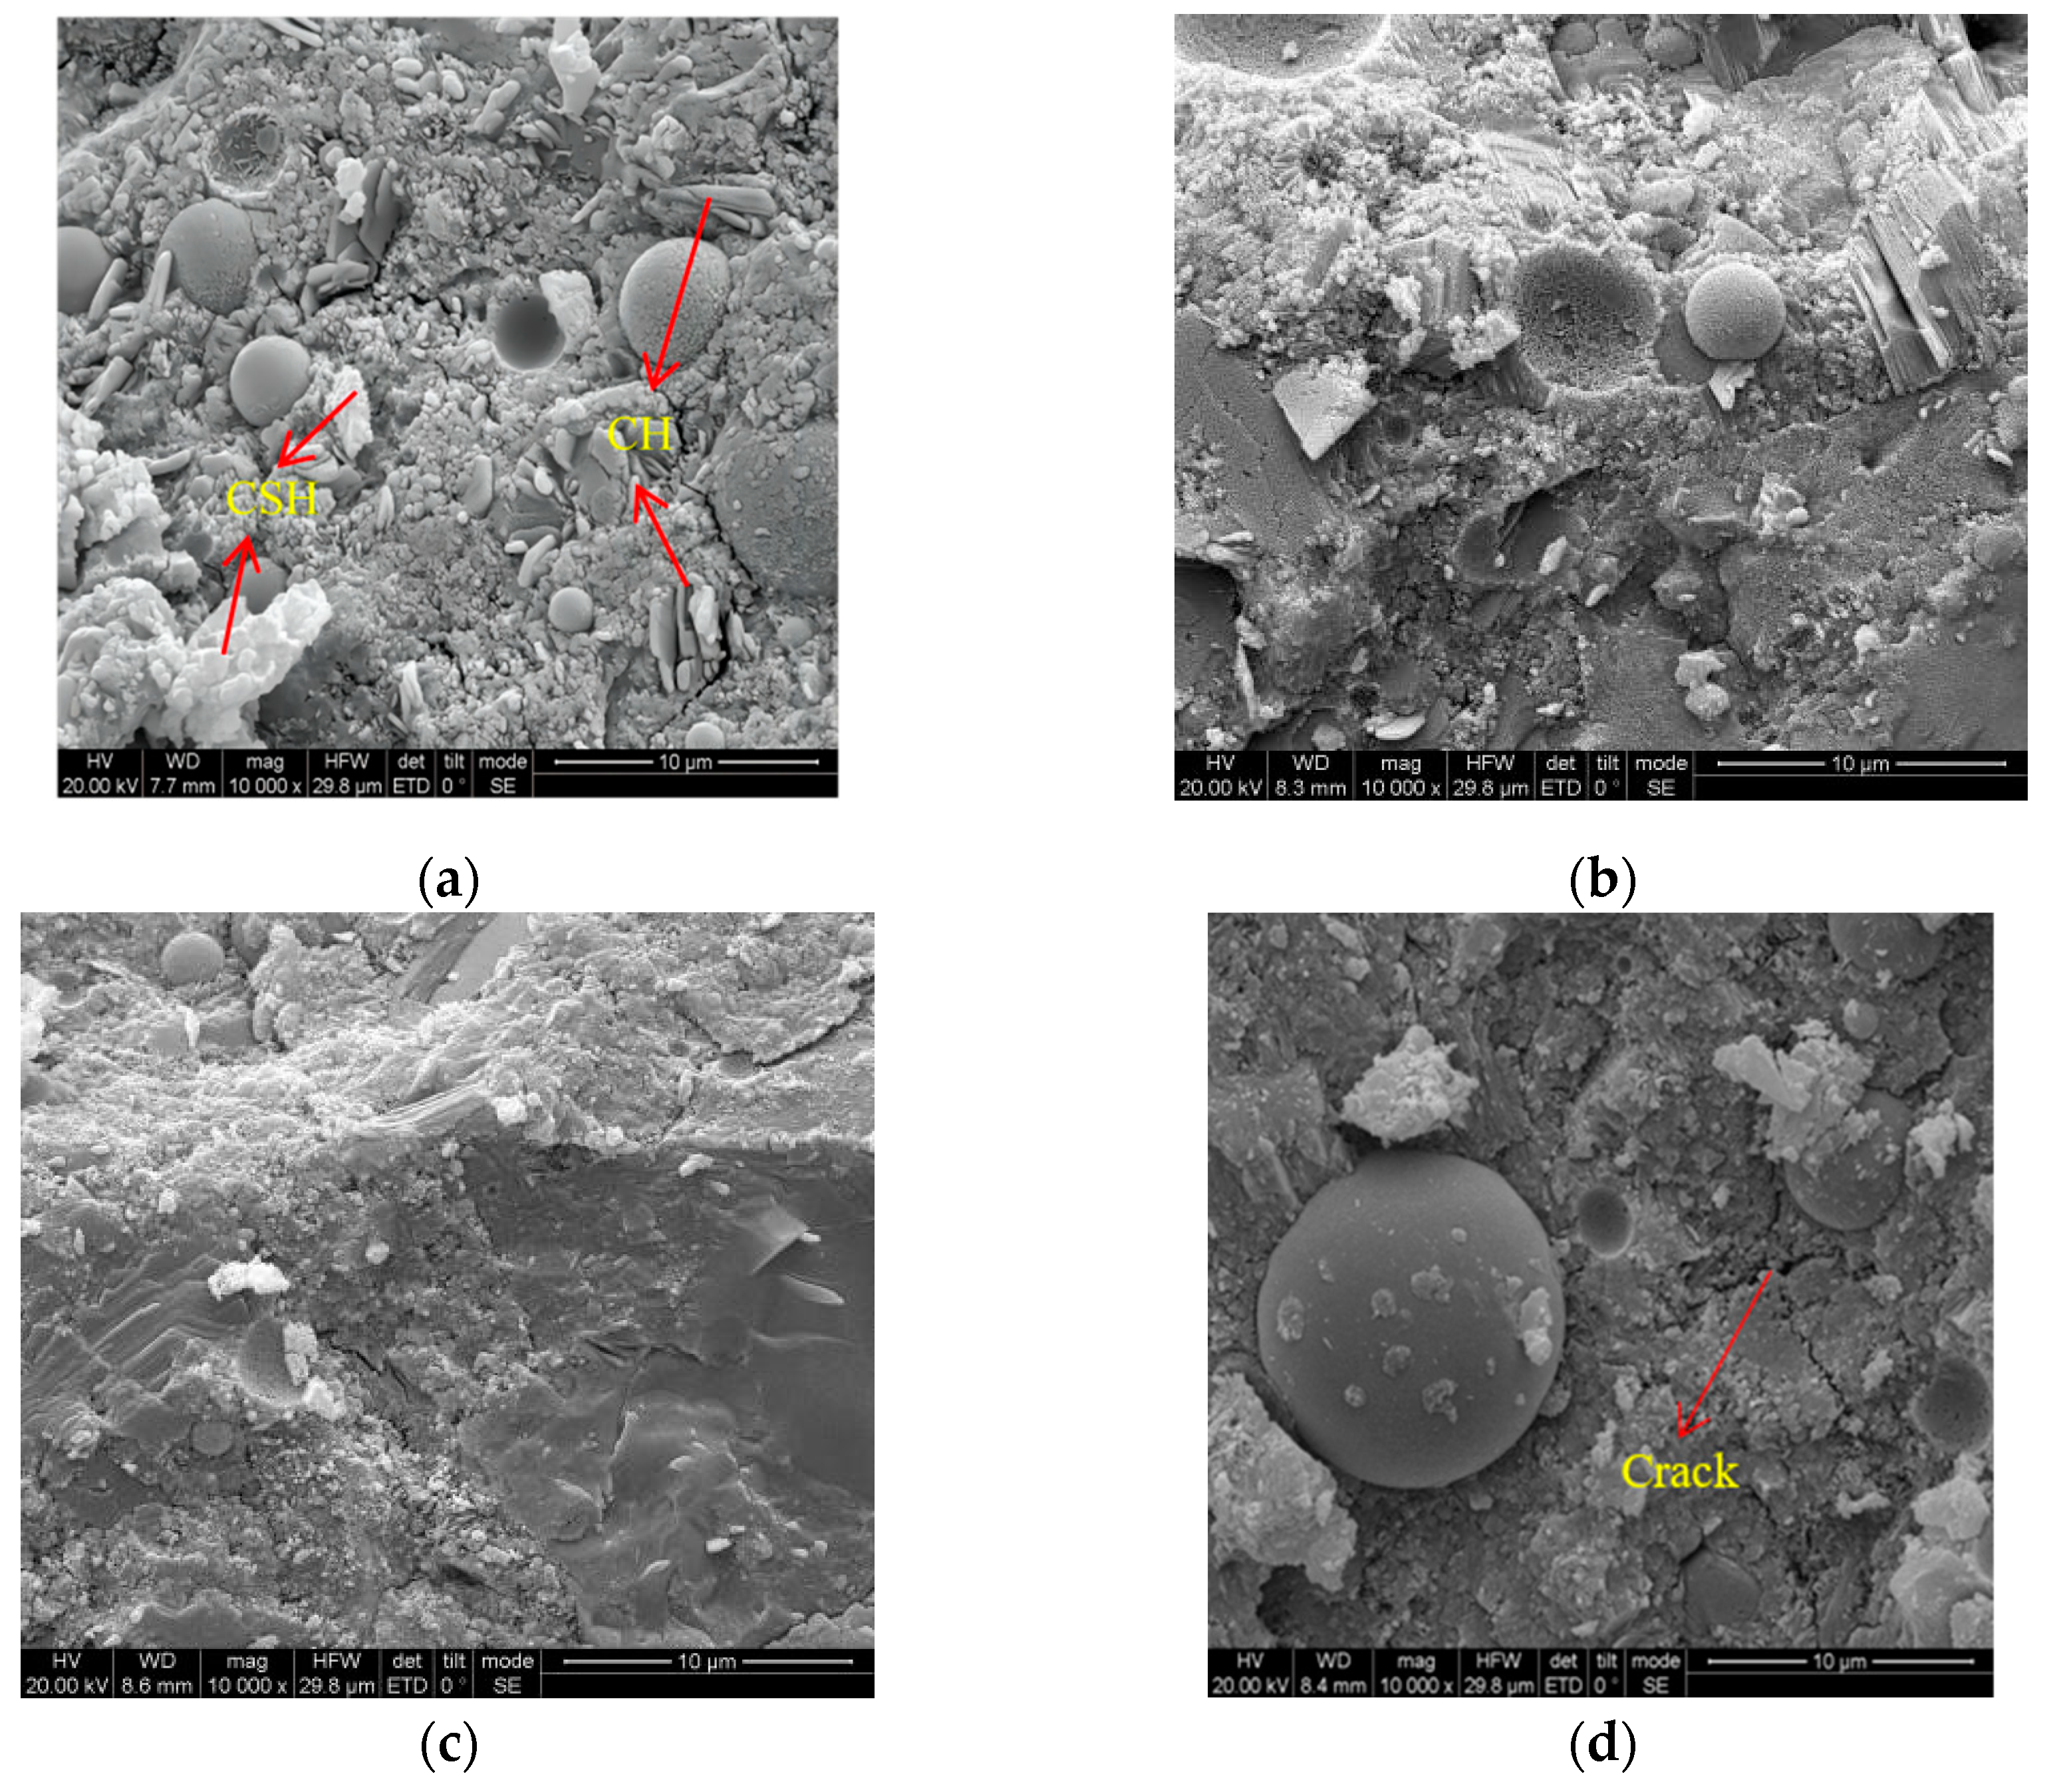
3.5. SEM Analysis
4. Conclusions
- (1)
- The three factors of the DS replacing ratio, FAC replacing ratio and PLE addition had different effects on the workability and mechanical performance of the FDCC. According to the test results, the FAC replacing ratio was the most influential factor in the slump and apparent density of the FDCC, followed by the DS replacing ratio and PLE addition. For compressive strength, the most influential factor was the DS replacing ratio, followed by the FAC replacing ratio and PLE addition. The PLE addition had little effect on the workability or mechanical performance of the FDCC.
- (2)
- With the increase in the DS replacing ratio from 0 to 30%, the slump decreased from 72.8 mm to 36.8 mm, the apparent density increased gradually and the compressive strength increased by 20.6% to reach its peak value when the DS replacing ratio was 20% and then it decreased. With the increase in the FAC replacing ratio from 0 to 30%, the slump increased by 106% from 36.65 mm to 76 mm, the apparent density decreased gradually and the compressive strength first decreased and then increased, reaching its lowest value when the FAC replacing ratio was 20%.
- (3)
- According to our synthetic evaluation analysis of the orthogonal test results, the optimum DS replacing ratio, FAC replacing ratio and PLE addition for the FDCC were 20%, 30% and 1%, respectively. DS and FACs could replace up to 50% of the river sand in the FDCC, which means that full use can be made of desert sand and industry waste, thereby reducing the demand for river sand. This would also be beneficial for the environment.
- (4)
- In this study, we found that the lower strength of desert sand and fly ash cenospheres as fine aggregates increased the brittleness of the FDCC. Therefore, some types of fibers could be used in FDCC to improve its toughness and strength. Additionally, the long-term properties of FDCC may be worth paying attention to in the future.
Author Contributions
Funding
Institutional Review Board Statement
Informed Consent Statement
Data Availability Statement
Conflicts of Interest
References
- Bogas, J.A.; Gomes, A.; Pereira, M. Self-compacting lightweight concrete produced with expanded clay aggregate. Constr. Build. Mater. 2012, 35, 1013–1022. [Google Scholar] [CrossRef]
- Thomas, M.; Bremner, T. Performance of lightweight aggregate concrete containing slag after 25 years in a harsh marine environment. Cem. Concr. Res. 2012, 42, 358–364. [Google Scholar] [CrossRef]
- Wei, H.; Wu, T.; Liu, X.; Zhang, R. Investigation of stress-strain relationship for confined lightweight aggregate concrete. Constr. Build. Mater. 2020, 256, 119432. [Google Scholar] [CrossRef]
- Zhang, C.W.; Ali, A. The advancement of seismic isolation and energy dissipation mechanisms based on friction. Soil Dyn. Earthq. Eng. 2021, 146, 106746. [Google Scholar] [CrossRef]
- Huang, H.; Li, M.; Yuan, Y.J.; Bai, H. Experimental Research on the Seismic Performance of Precast Concrete Frame with Replaceable Artificial Controllable Plastic Hinges. J. Struct. Eng. 2023, 149, 4022222. [Google Scholar] [CrossRef]
- Zhang, S.; Yuan, K.; Zhang, J.; Guo, J. Experimental Study on Performance Influencing Factors and Reasonable Mixture Ratio of Desert Sand Ceramsite Lightweight Aggregate Concrete. Adv. Civ. Eng. 2020, 2020, 8613932. [Google Scholar] [CrossRef]
- Jayawardena, U.D.S.; Indratilaka, H. Use of dune sand as an alternative for river sand for construction industry in Sri Lanka. In Proceedings of the 12th International IAEG Congress, Torino, Italy, 15–19 September 2014. [Google Scholar]
- Neville, A.M. Properties of Concrete, 5th ed.; Wiley: London, UK, 2011. [Google Scholar]
- Fu, Z.Q.; Ji, B.H.; Wu, D.Y.; Yu, Z.P. Behaviour of lightweight aggregate concrete-filled steel tube under horizontal cyclic load. Steel. Compos. Struct. 2019, 32, 717–729. [Google Scholar]
- Luo, F.J.; He, L.; Pan, Z.; Duan, W.H.; Zhao, X.L.; Collins, F. Effect of very fine particles on workability and strength of concrete made with dune sand. Constr. Build. Mater. 2013, 47, 131–137. [Google Scholar] [CrossRef]
- Yan, W.; Wu, G.; Dong, Z. Optimization of the mix proportion for desert sand concrete based on a statistical model. Constr. Build. Mater. 2019, 226, 469–482. [Google Scholar] [CrossRef]
- Bouziani, T. Assessment of fresh properties and compressive strength of self-compacting concrete made with different sand types by mixture design modelling approach. Constr. Build. Mater. 2013, 49, 308–314. [Google Scholar] [CrossRef]
- Shen, Y.J.; Hao, J.S.; Bai, Z.P.; Zhou, Z.H.; Li, Y.G.; Liao, T.C.; Zhang, K.F. Research progress of concrete prepared by desert sand. Bull. Chin. Ceram. Soc. 2021, 40, 3879–3890. [Google Scholar]
- Zhou, Z.; Shen, Y.; Hao, J.; Bai, Z.; Liu, Y.; Kou, H. Inexpensive Anti-Icing Concrete Material for Application to Tunnel and Slope Engineering Infrastructures in Cold Regions. ACS Appl. Mater. Interfaces 2021, 13, 53030–53045. [Google Scholar] [CrossRef]
- Li, Z.Q.; Yang, S.; Tang, Y.J.; Wang, W.; Li, X.H.; Jiang, H.B. Experimental study on the mechanical properties of desert sand concrete with high replacement. Concrete 2018, 12, 53–56. [Google Scholar]
- Park, S.; Lee, E.; Ko, J.; Yoo, J.; Kim, Y. Rheological properties of concrete using dune sand. Constr. Build. Mater. 2018, 172, 685–695. [Google Scholar] [CrossRef]
- Xue, H.J.; Shen, X.D.; Wang, R.Y.; Liu, Q.; Liu, Z.; Han, C.; Yuan, Q. Mechanism analysis of chloride resistance of aeolian sand concrete under wind-sand erosion and dry-wet circulation. Trans. Chin. Soc. Agric. Eng. 2017, 33, 118–126. [Google Scholar]
- Li, Z.Q.; Gan, D. Cyclic behavior and strength evaluation of RC columns with dune sand. J. Build. Eng. 2022, 47, 103801. [Google Scholar] [CrossRef]
- Yao, Z.T.; Ji, X.S.; Sarker, P.K.; Tang, J.H.; Ge, L.Q.; Xia, M.S.; Xi, Y.Q. A comprehensive review on the applications of coal fly ash. Earth-Sci. Rev. 2015, 141, 105–121. [Google Scholar] [CrossRef]
- McBride, S.P.; Shukla, A.; Bose, A. Processing and characterization of a lightweight concrete using cenospheres. J. Mater. Sci. 2002, 37, 4217–4225. [Google Scholar] [CrossRef]
- Hanif, A.; Lu, Z.; Cheng, Y.; Diao, S.; Li, Z. Effects of Different Lightweight Functional Fillers for Use in Cementitious Composites. Int. J. Concr. Struct. Mater. 2017, 11, 99–113. [Google Scholar] [CrossRef]
- Satpathy, H.; Patel, S.; Nayak, A. Development of sustainable lightweight concrete using fly ash cenosphere and sintered fly ash aggregate. Constr. Build. Mater. 2019, 202, 636–655. [Google Scholar] [CrossRef]
- Zhang, Y.; Fan, Z.; Sun, X.; Zhu, X. Utilization of surface-modified fly ash cenosphere waste as an internal curing material to intensify concrete performance. J. Clean. Prod. 2022, 358, 132042. [Google Scholar] [CrossRef]
- Qudoos, A.; Atta-ur-Rehman; Kim, H.G.; Ryou, J.-S. Influence of the surface roughness of crushed natural aggregates on the microhardness of the interfacial transition zone of concrete with mineral admixtures and polymer latex. Constr. Build. Mater. 2018, 168, 946–957. [Google Scholar] [CrossRef]
- Tian, Y.; Yan, X.; Zhang, M.; Yang, T.; Zhang, J.; Wang, Z. Effect of the characteristics of lightweight aggregates presaturated polymer emulsion on the mechanical and damping properties of concrete. Constr. Build. Mater. 2020, 253, 119154. [Google Scholar] [CrossRef]
- Zhang, W.; Huang, Y.Q. Three-dimensional numerical investigation of mixed-mode debonding of FRP concrete interface using a cohesive zone model. Constr. Build. Mater. 2022, 350, 128818. [Google Scholar] [CrossRef]
- Huang, H.; Li, M.; Yuan, Y.; Bai, H. Theoretical analysis on the lateral drift of precast concrete frame with replaceable artificial controllable plastic hinges. J. Build. Eng. 2022, 62, 105386. [Google Scholar] [CrossRef]
- Fang, B.; Hu, Z.; Shi, T.; Liu, Y.; Wang, X.; Yang, D.; Zhu, K.; Zhao, X.; Zhao, Z. Research progress on the properties and applications of magnesium phosphate cement. Ceram. Int. 2023, 49, 4001–4016. [Google Scholar] [CrossRef]
- Ministry of Housing and Urban-Rural Development of China. Technical Standard for Application of Lightweight Aggregate Concrete; China Architecture Press: Beijing, China, 2019. [Google Scholar]
- Ministry of Housing and Urban-Rural Development of China. Standard for Test Method of Performance on Ordinary Fresh Concrete; China Architecture Press: Beijing, China, 2017. [Google Scholar]
- Ministry of Housing and Urban-Rural Development of China. Standard for Test Method of Mechanical Properties on Ordinary Concrete; AQSIQ: Beijing, China, 2019. [Google Scholar]
- Chen, H.; Xie, C.; Fu, C.; Liu, J.; Wei, X.; Wu, D. Orthogonal Analysis on Mechanical Properties of Basalt–Polypropylene Fiber Mortar. Materials 2020, 13, 2937. [Google Scholar] [CrossRef]
- Liu, Y.; Li, Y.; Jiang, G. Orthogonal experiment on performance of mortar made with dune sand. Constr. Build. Mater. 2020, 264, 120254. [Google Scholar] [CrossRef]
- Jin, B.H.; Song, J.X.; Liu, H.F. Engineering Characteristics of Concrete Made of Desert Sand from Maowusu Sandy Land. Appl. Mech. Mater. 2012, 174, 604–607. [Google Scholar] [CrossRef]
- Chen, J.J.; Kwan, A.K.H. Triple Blending with Fly Ash Microsphere and Condensed Silica Fume to Improve Performance of Cement Paste. J. Mater. Civ. Eng. 2013, 25, 618–626. [Google Scholar] [CrossRef]
- Kwan, A.; Chen, J. Adding fly ash microsphere to improve packing density, flowability and strength of cement paste. Powder Technol. 2013, 234, 19–25. [Google Scholar] [CrossRef]
- Xia, D.; Chen, R.; Zhang, D.; Cheng, J. Relationship between Fractal Dimension and Properties of Engineered Cementitious Composites with Different Aggregates. Materials 2022, 15, 7666. [Google Scholar] [CrossRef] [PubMed]


| Composition (wt.%) | SiO2 | Al2O3 | Fe2O3 | K2O | CaO | SO3 | MgO | Na2O | Others |
|---|---|---|---|---|---|---|---|---|---|
| Cement | 18.69 | 3.95 | 4.32 | 0.62 | 65.26 | 3.72 | 1.52 | 0.83 | 1.09 |
| Fly ash | 45.68 | 16.72 | 10.42 | 2.10 | 13.37 | 1.73 | 4.37 | 3.81 | 1.8 |
| DS | 64.58 | 9.48 | 2.32 | 1.97 | 8.62 | 1.09 | 2.06 | 2.43 | 7.45 |
| FAC | 59.44 | 23.3 | 5.49 | 2.85 | 2.31 | 1.52 | 1.37 | 1.49 | 2.23 |
| RS | 90.98 | 3.42 | 0.56 | 1.96 | 1.01 | 0.63 | 0.20 | 0.26 | 0.98 |
| Technical Index | Bulk Density (kg/m3) | Numerical Tube Pressure (MPa) | Water Absorption (%) | Softening Coefficient | Silt Content (%) | Mass Loss After Boiling (%) |
|---|---|---|---|---|---|---|
| Standard | - | ≥1.0 | ≤10 | ≥0.8 | ≤3.0 | ≤5.0 |
| Actual value | 559 | 3.6 | 4.3 | 1 | 0.2 | 1 |
| Main Component (%) | Salt | Isopropanol | Acetone | Sodium Citrate | Sodium Hydroxide | Pigment |
|---|---|---|---|---|---|---|
| Water reducing agent | 28.71 | 0.69 | 2.14 | 4.51 | 2.89 | 0.06 |
| Level | Factor | |||
|---|---|---|---|---|
| A(%) | B (%) | C (%) | D | |
| 1 | 0 | 0 | 0 | 1 |
| 2 | 10 | 10 | 0.5 | 2 |
| 3 | 20 | 20 | 1 | 3 |
| 4 | 30 | 30 | 1.5 | 4 |
| Test Number | Factor | |||
|---|---|---|---|---|
| A | B | C | D | |
| FDCC1 | 0 | 0 | 0 | 1 |
| FDCC2 | 0 | 10 | 0.5 | 2 |
| FDCC3 | 0 | 20 | 1 | 3 |
| FDCC4 | 0 | 30 | 1.5 | 4 |
| FDCC5 | 10 | 0 | 0.5 | 3 |
| FDCC6 | 10 | 10 | 0 | 4 |
| FDCC7 | 10 | 20 | 1.5 | 1 |
| FDCC8 | 10 | 30 | 1 | 2 |
| FDCC9 | 20 | 0 | 1 | 4 |
| FDCC10 | 20 | 10 | 1.5 | 3 |
| FDCC11 | 20 | 20 | 0 | 2 |
| FDCC12 | 20 | 30 | 0.5 | 1 |
| FDCC13 | 30 | 0 | 1.5 | 2 |
| FDCC14 | 30 | 10 | 1 | 1 |
| FDCC15 | 30 | 20 | 0.5 | 4 |
| FDCC16 | 30 | 30 | 0 | 3 |
| Test Number | Amount of Raw Material (kg/m3) | ||||||||
|---|---|---|---|---|---|---|---|---|---|
| Water | Cement | Fly Ash | Ceramsite | RS | DS | FAC | PLE | Water Reducing Agent | |
| FDCC1 | 154.0 | 352.0 | 88 | 559 | 646.1 | 0 | 0 | 0 | 4.6 |
| FDCC2 | 151.6 | 349.8 | 581.4 | 0 | 15.9 | 4.5 | |||
| FDCC3 | 149.2 | 347.6 | 516.8 | 0 | 31.8 | 9.1 | |||
| FDCC4 | 146.8 | 345.4 | 452.2 | 0 | 47.7 | 13.7 | |||
| FDCC5 | 151.6 | 349.8 | 581.4 | 73.4 | 0 | 4.5 | |||
| FDCC6 | 154.0 | 352.0 | 516.8 | 73.4 | 15.9 | 0 | |||
| FDCC7 | 146.8 | 345.4 | 452.2 | 73.4 | 31.8 | 13.7 | |||
| FDCC8 | 149.2 | 347.6 | 387.6 | 73.4 | 47.7 | 9.1 | |||
| FDCC9 | 149.2 | 347.6 | 516.8 | 146.9 | 0 | 9.1 | |||
| FDCC10 | 146.8 | 345.4 | 452.2 | 146.9 | 15.9 | 13.7 | |||
| FDCC11 | 154.0 | 352.0 | 387.6 | 146.9 | 31.8 | 0 | |||
| FDCC12 | 151.6 | 349.8 | 323.1 | 146.9 | 47.7 | 4.6 | |||
| FDCC13 | 146.8 | 345.4 | 452.2 | 220.4 | 0 | 13.8 | |||
| FDCC14 | 149.2 | 347.6 | 387.6 | 220.4 | 15.9 | 9.2 | |||
| FDCC15 | 151.6 | 349.8 | 323.1 | 220.4 | 31.8 | 4.5 | |||
| FDCC16 | 154.0 | 352.0 | 258.4 | 220.4 | 47.7 | 0 | |||
| Test Number | Slump (mm) | Apparent Density (kg/m3) | Compressive Strength (MPa) | |
|---|---|---|---|---|
| 7 d | 28 d | |||
| FDCC1 | 49 | 1730.8 | 24.18 | 30.75 |
| FDCC2 | 56 | 1726.3 | 22.84 | 26.40 |
| FDCC3 | 87 | 1716.2 | 19.59 | 23.77 |
| FDCC4 | 99 | 1698.3 | 18.03 | 21.66 |
| FDCC5 | 44 | 1765.6 | 24.47 | 29.60 |
| FDCC6 | 51 | 1744.0 | 26.24 | 30.93 |
| FDCC7 | 79 | 1747.3 | 23.61 | 26.58 |
| FDCC8 | 84 | 1735.7 | 25.55 | 31.49 |
| FDCC9 | 33 | 1849.5 | 28.03 | 32.72 |
| FDCC10 | 41 | 1784.0 | 24.89 | 30.92 |
| FDCC11 | 52 | 1767.3 | 20.42 | 27.89 |
| FDCC12 | 61 | 1746.3 | 28.23 | 32.14 |
| FDCC13 | 21 | 1849.6 | 25.39 | 31.59 |
| FDCC14 | 29 | 1719.1 | 23.35 | 28.84 |
| FDCC15 | 37 | 1704.4 | 22.41 | 27.49 |
| FDCC16 | 60 | 1695.7 | 21.81 | 26.13 |
| Performance Index | Range | Factor | |||
|---|---|---|---|---|---|
| A | B | C | D | ||
| Slump (mm) | Kj1 | 72.75 | 36.75 | 53.00 | 54.50 |
| Kj2 | 64.50 | 44.25 | 49.50 | 53.25 | |
| Kj3 | 46.75 | 63.75 | 58.25 | 58.00 | |
| Kj4 | 36.75 | 76.00 | 60.00 | 55.00 | |
| R1 | 36.00 | 39.25 | 10.50 | 4.75 | |
| Apparent density (kg/m3) | Kj1 | 1717.90 | 1798.88 | 1734.45 | 1735.88 |
| Kj2 | 1748.15 | 1743.35 | 1735.65 | 1769.73 | |
| Kj3 | 1786.78 | 1733.80 | 1755.13 | 1740.38 | |
| Kj4 | 1742.20 | 1719.00 | 1769.80 | 1749.05 | |
| R2 | 68.88 | 79.88 | 35.35 | 33.85 | |
| 7-d compressive strength (MPa) | Kj1 | 21.16 | 25.52 | 23.16 | 24.84 |
| Kj2 | 24.97 | 24.33 | 24.49 | 23.55 | |
| Kj3 | 25.39 | 21.51 | 24.13 | 22.69 | |
| Kj4 | 23.24 | 23.41 | 22.98 | 23.68 | |
| R3 | 4.23 | 4.01 | 1.51 | 2.15 | |
| Kj1 | 25.65 | 31.17 | 28.93 | 29.58 | |
| Kj2 | 29.65 | 29.27 | 28.91 | 29.34 | |
| Kj3 | 30.92 | 26.43 | 29.21 | 27.61 | |
| Kj4 | 28.51 | 27.86 | 27.69 | 28.20 | |
| R4 | 5.27 | 4.73 | 1.52 | 1.97 | |
| Performance Index | Range | Factor | |||
|---|---|---|---|---|---|
| A | B | C | D | ||
| Slump (mm) | 66.243 *** | 79.367 *** | 5.724 * | (3,3) = 29.46 (3,3) = 9.28 (3,3) = 5.39 | |
| Apparent Density (kg/m3) | 3.611 | 5.400 * | 1.272 | ||
| 7-d Compressive Strength | 4.742 | 3.660 | 0.687 | ||
| 28-d Compressive Strength | 5.773 * | 4.660 | 0.522 | ||
Disclaimer/Publisher’s Note: The statements, opinions and data contained in all publications are solely those of the individual author(s) and contributor(s) and not of MDPI and/or the editor(s). MDPI and/or the editor(s) disclaim responsibility for any injury to people or property resulting from any ideas, methods, instructions or products referred to in the content. |
© 2023 by the authors. Licensee MDPI, Basel, Switzerland. This article is an open access article distributed under the terms and conditions of the Creative Commons Attribution (CC BY) license (https://creativecommons.org/licenses/by/4.0/).
Share and Cite
Guo, J.; Yuan, K.; Xu, J.; Wang, Y.; Gan, D.; He, M. The Workability and Mechanical Performance of Fly Ash Cenosphere–Desert Sand Ceramsite Concrete: An Experimental Study and Analysis. Materials 2023, 16, 1298. https://doi.org/10.3390/ma16031298
Guo J, Yuan K, Xu J, Wang Y, Gan D, He M. The Workability and Mechanical Performance of Fly Ash Cenosphere–Desert Sand Ceramsite Concrete: An Experimental Study and Analysis. Materials. 2023; 16(3):1298. https://doi.org/10.3390/ma16031298
Chicago/Turabian StyleGuo, Junlin, Kang Yuan, Jianjiang Xu, Ying Wang, Dan Gan, and Mingsheng He. 2023. "The Workability and Mechanical Performance of Fly Ash Cenosphere–Desert Sand Ceramsite Concrete: An Experimental Study and Analysis" Materials 16, no. 3: 1298. https://doi.org/10.3390/ma16031298