
Ensemble Machine-Learning-Based Prediction Models for the Compressive Strength of Recycled Powder Mortar


Abstract
:1. Introduction
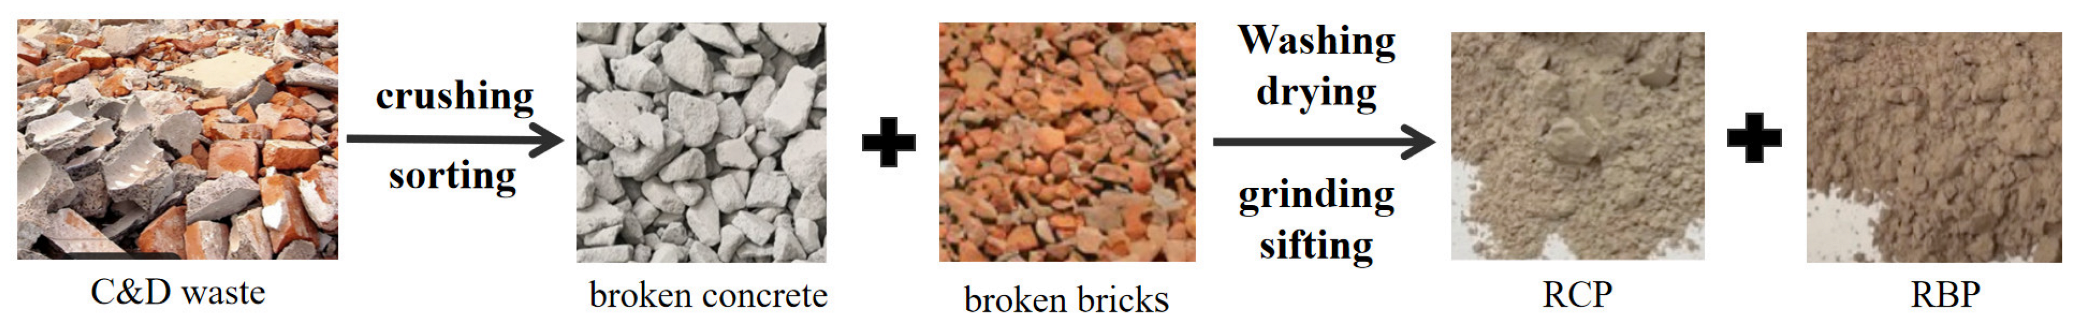
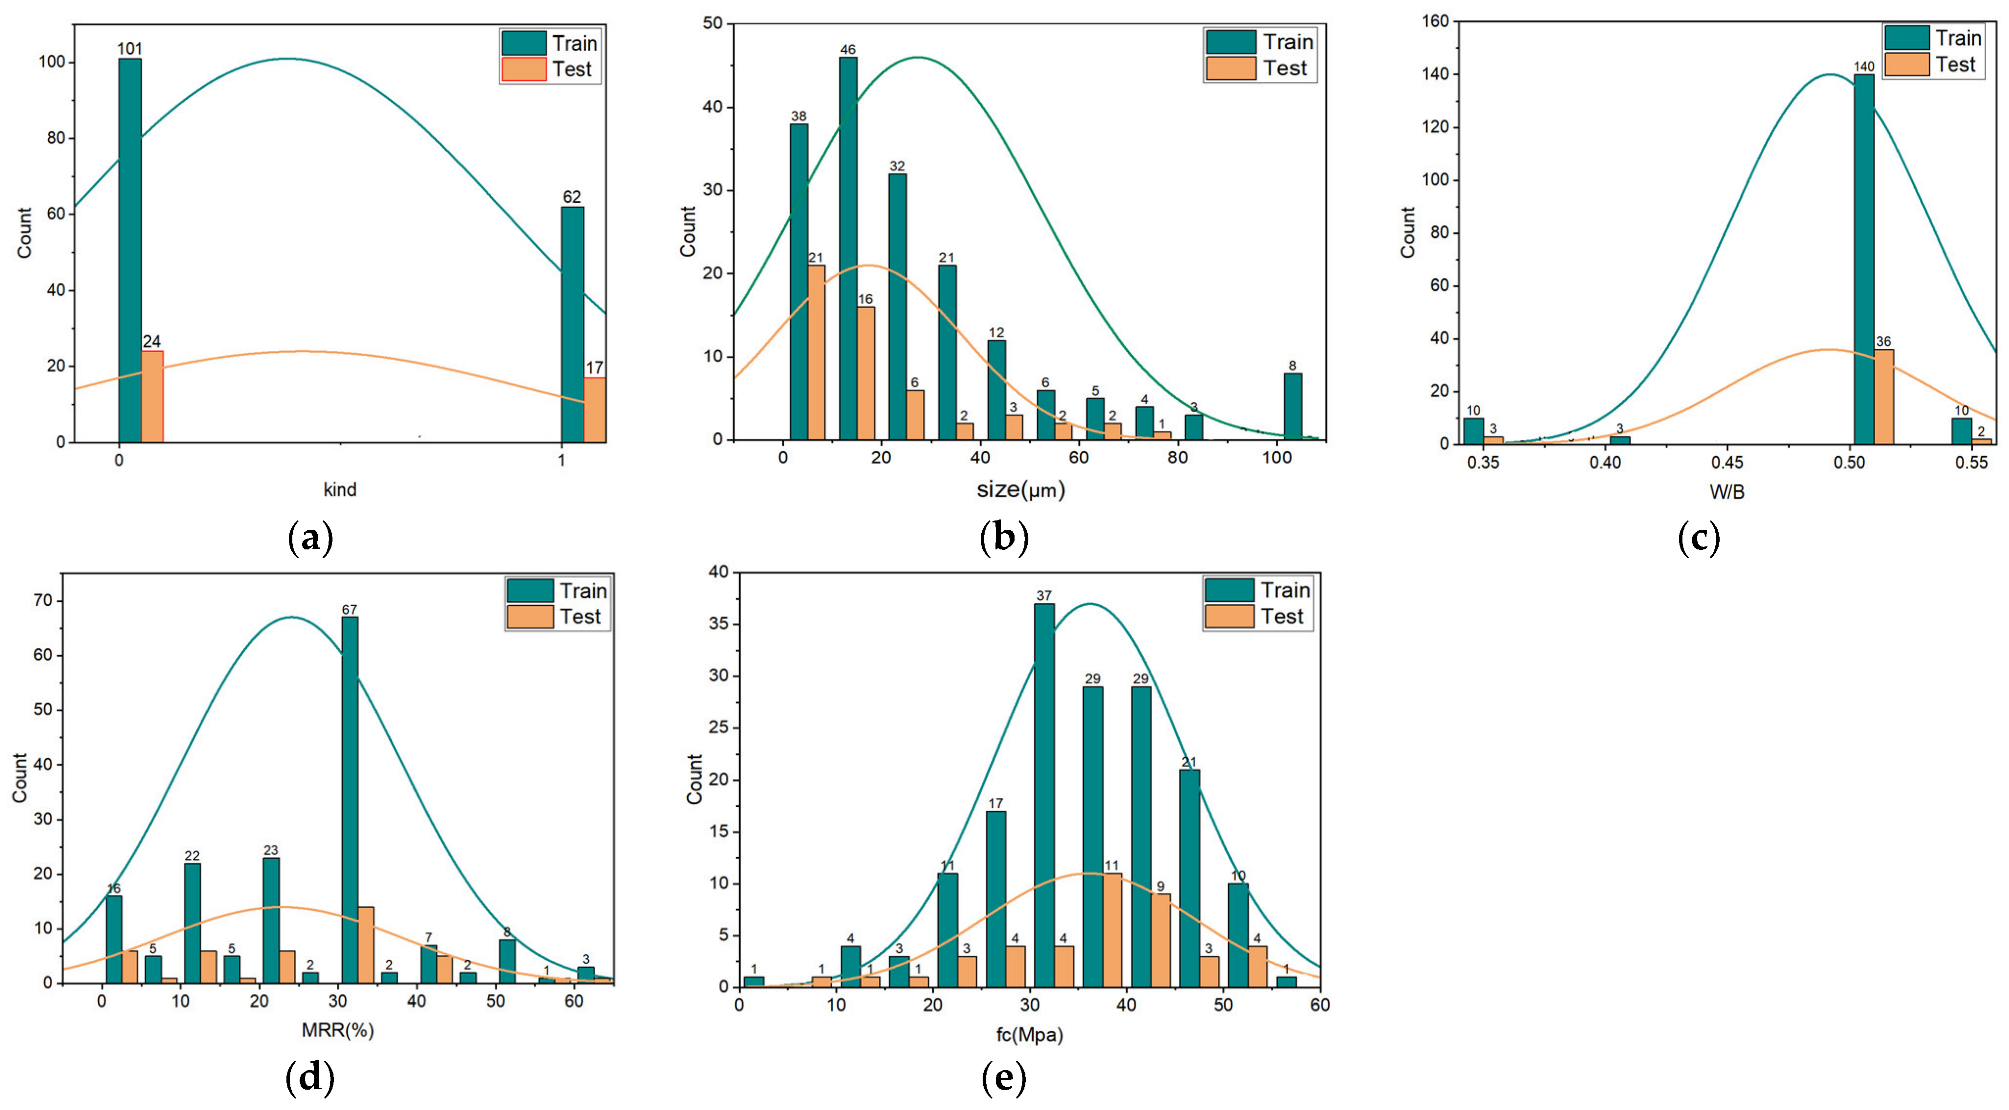
2. Data Collection and Analysis
3. Machine-Learning-Based Models for Compressive Strength
3.1. Data Preprocessing
3.2. ML Model Algorithm
3.2.1. eXtreme Gradient-Boosting (XGBoost)
3.2.2. Random Forest (RF)
3.2.3. Light Gradient-Boosting Machine (LightGBM)
3.2.4. Adaptive Boosting (AdaBoost)
3.3. Model Tuning and Evaluation
3.3.1. Model Tuning: K-Fold Cross-Validation
3.3.2. Model Evaluation
4. Model Results and Discussion
4.1. Hyperparameter Settings and Optimization
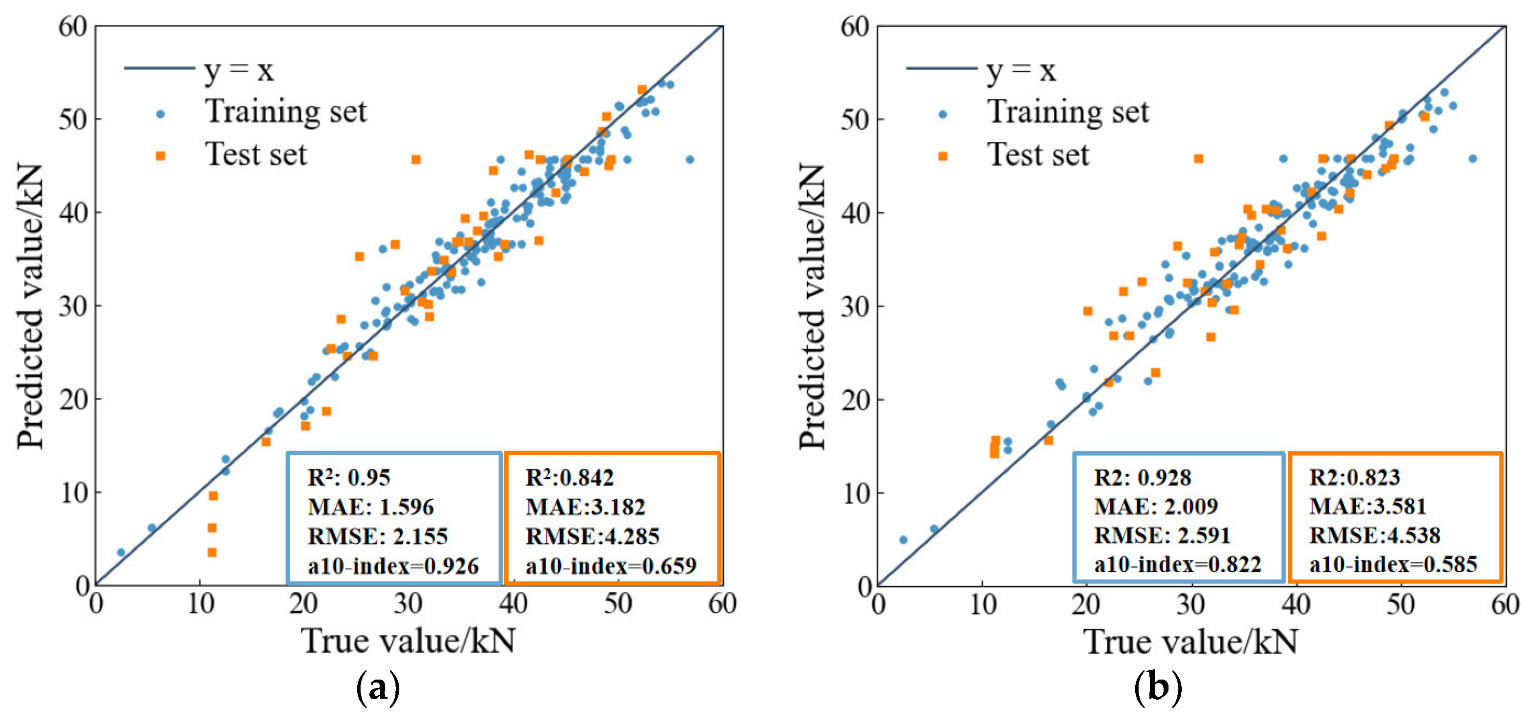
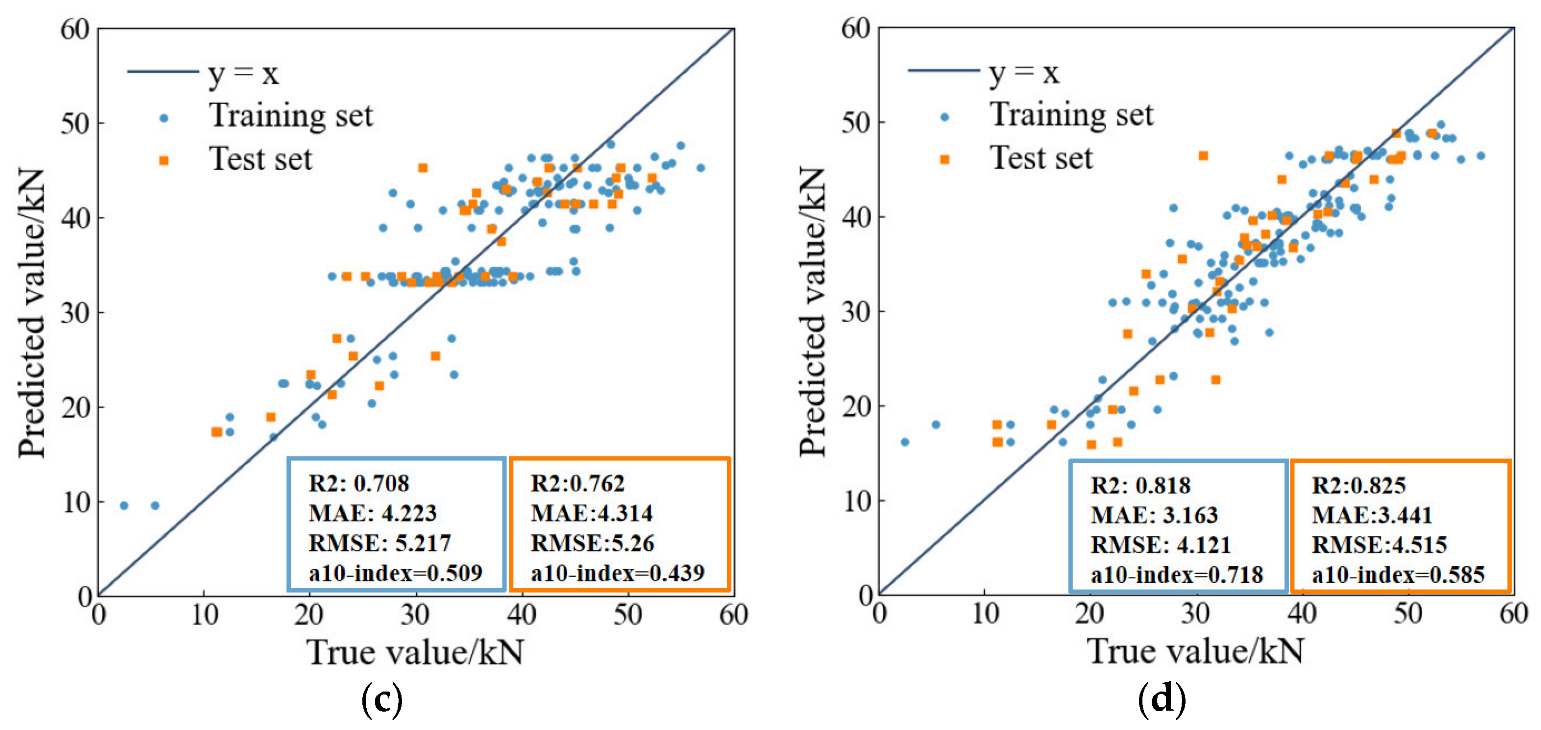
4.2. Model Prediction Results
5. Interpretability of the Model
5.1. Features Explained: Shapley Additive exPlanations (SHAP)
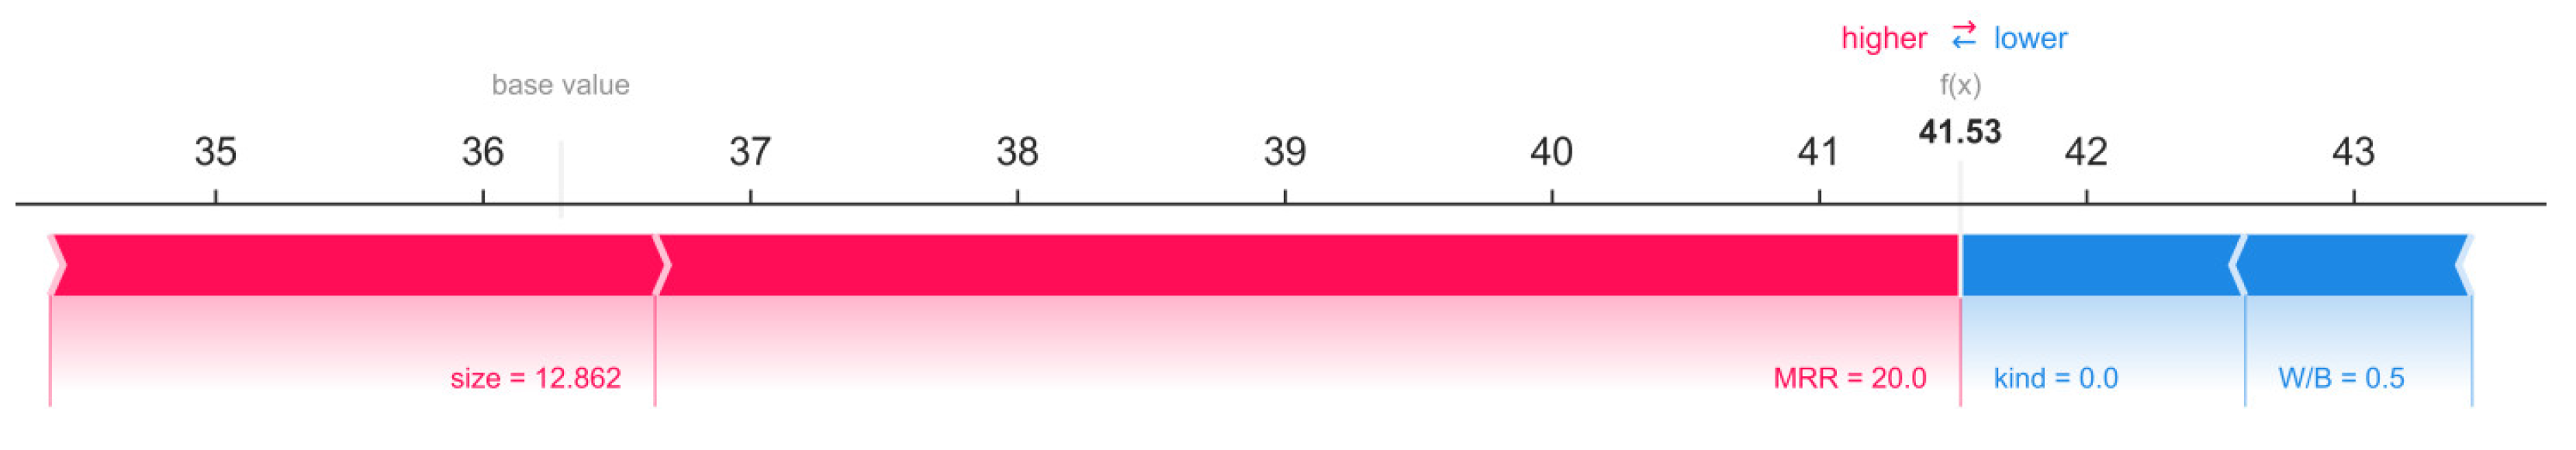
5.2. Individual Interpretation
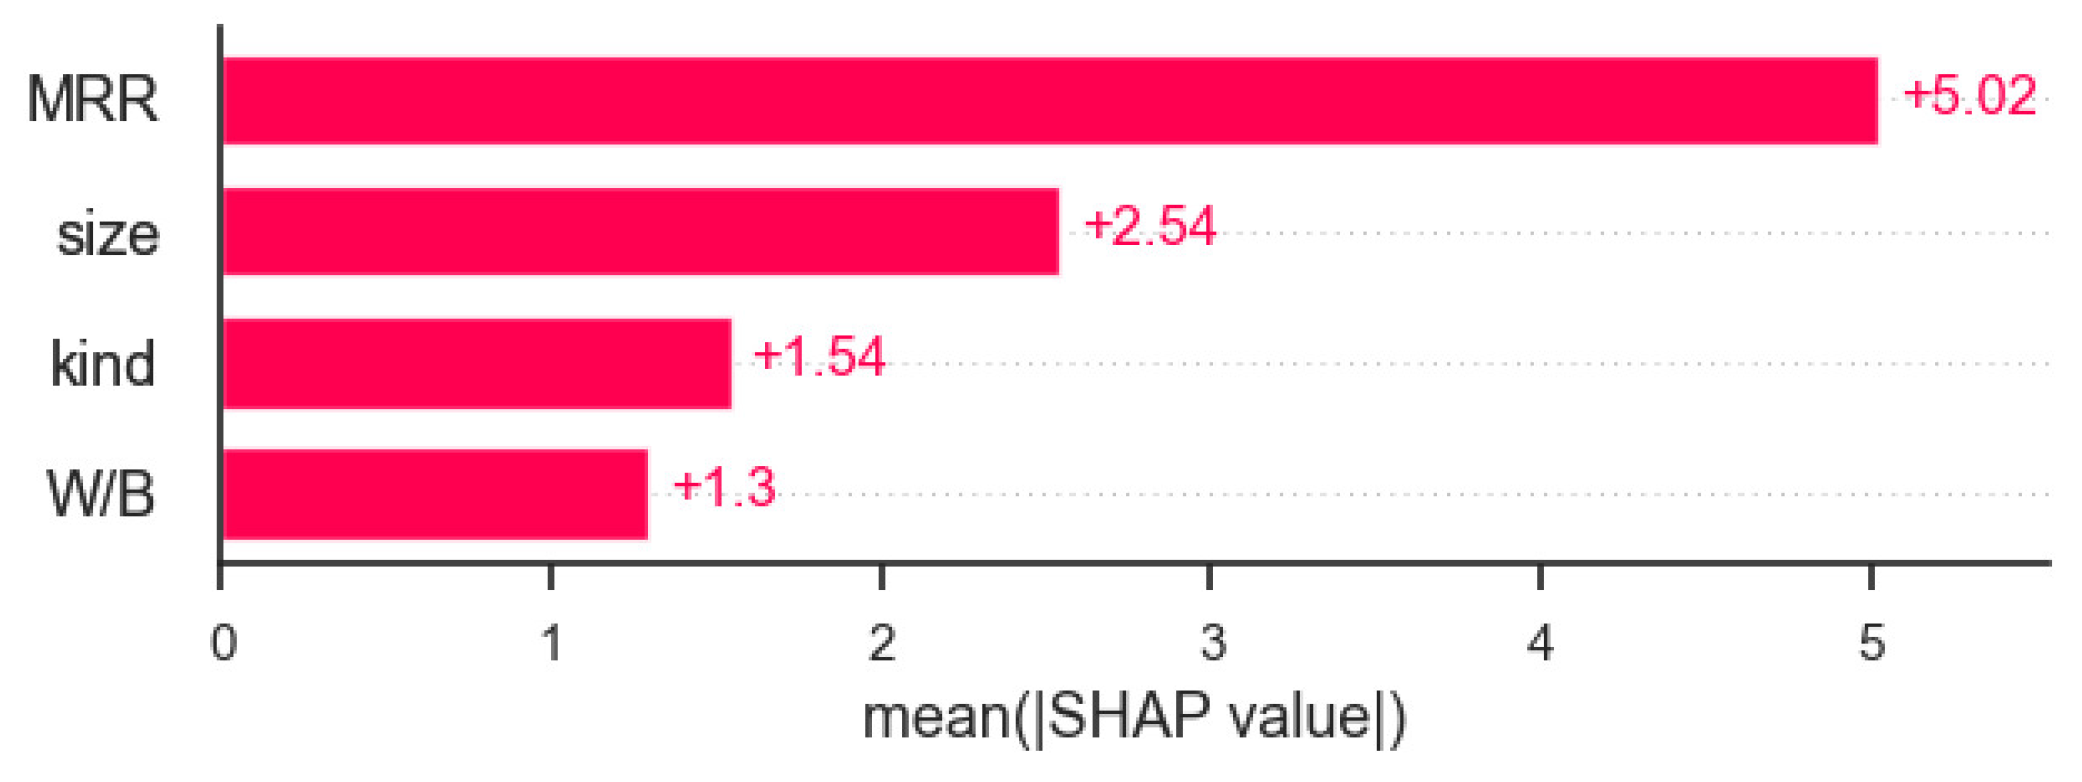
5.3. Global Interpretation
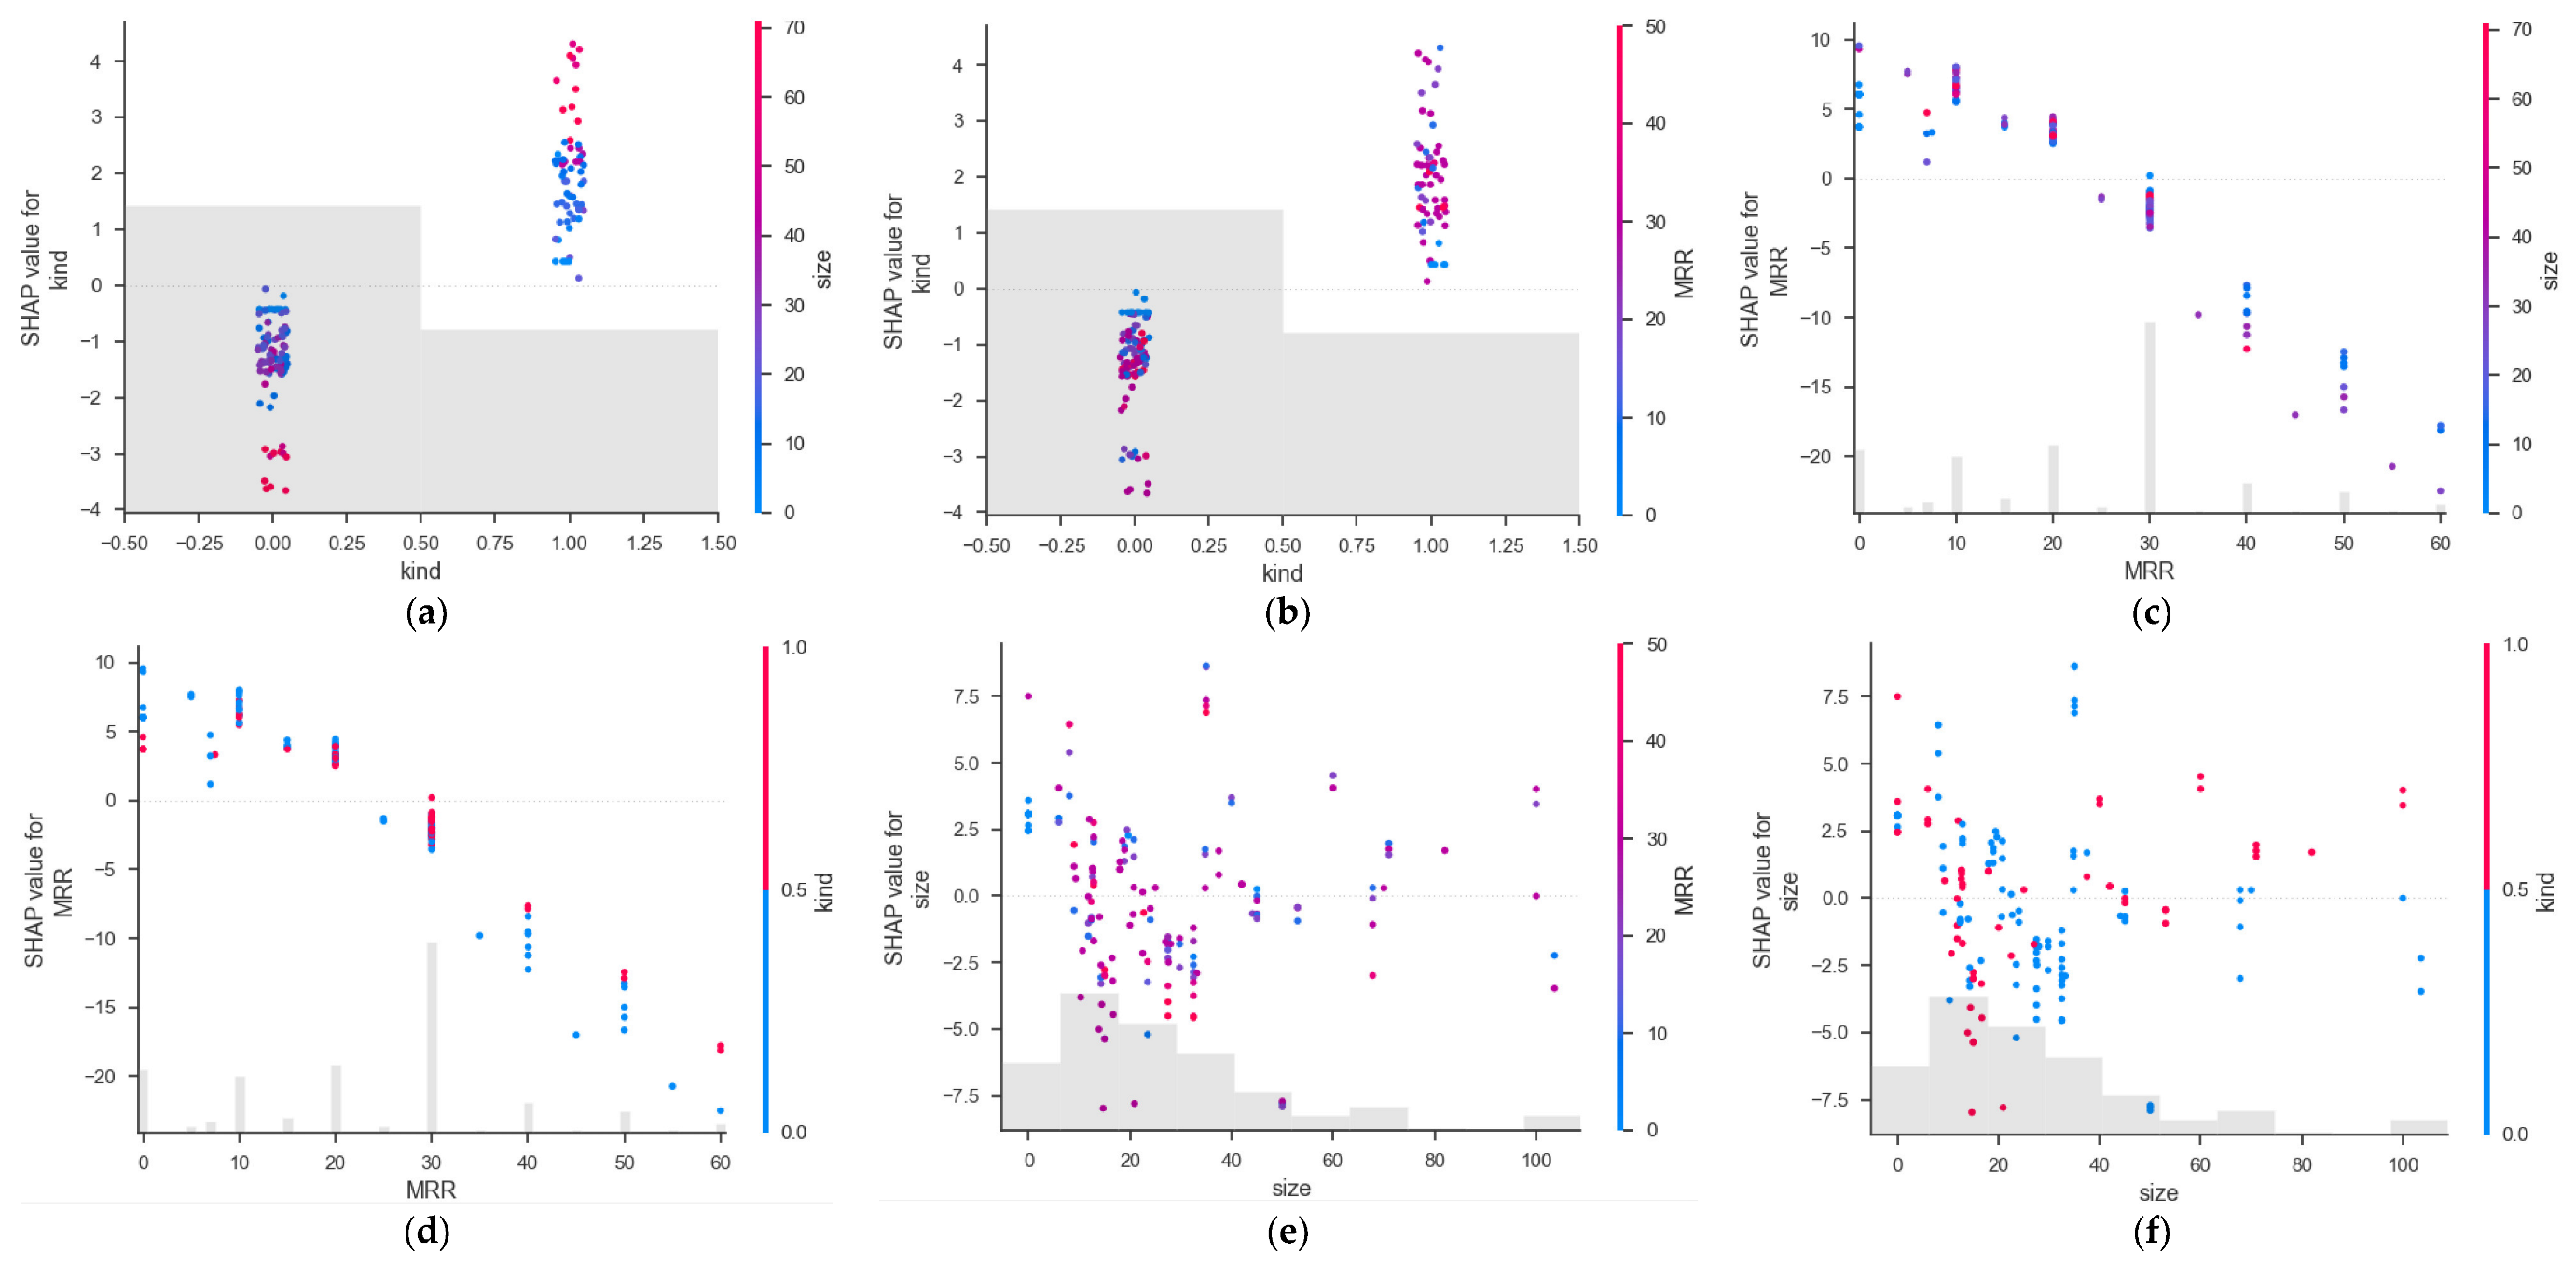
5.4. Feature Interactions
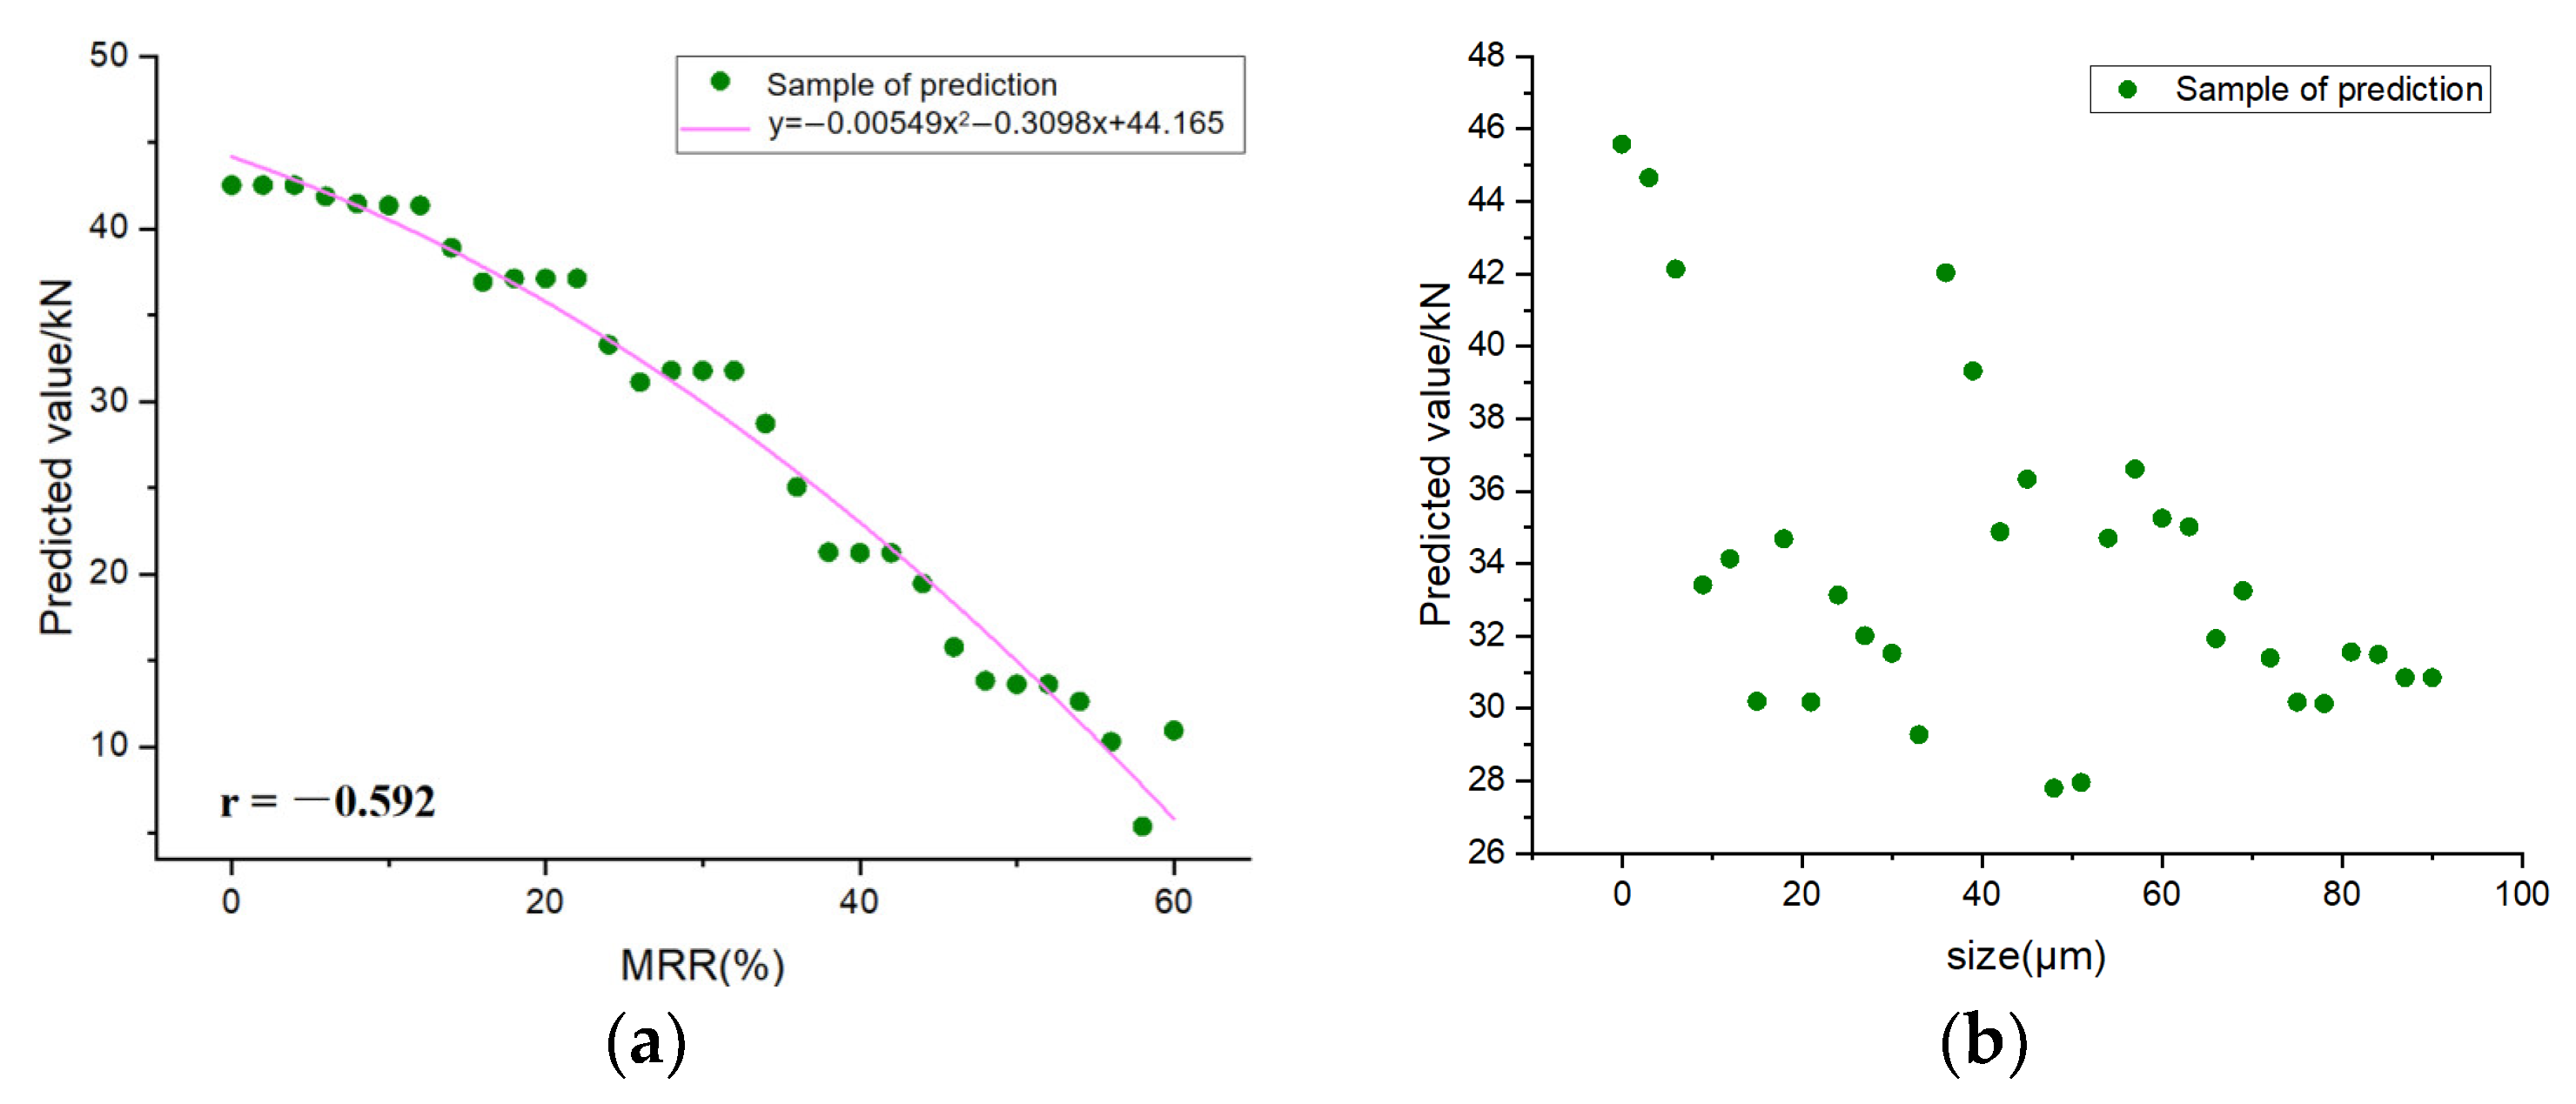
5.5. Sensitivity of Feature
6. Conclusions
- After the comparison of four performance indicators, it is found that XGBoost achieves the best results in four ML models. The a10-index, RMSE, MAE and R2 are 0.926, 2.155, 1.596 and 0.95 in the training set and 0.659, 4.285, 3.182 and 0.842 in the test set, respectively, indicating that the XGBoost model is the best model for predicting the compressive strength of the RP mortar.
- Among the four ML models used in this paper, AdaBoost has the worst performance, with the R2 value in the training set only 0.708. This is because AdaBoost is sensitive to abnormal samples, which may gain higher weights in iterations, affecting the prediction accuracy of the final strong learner.
- SHAP is an additive interpreter that adds up the contribution values of each influencing factor to obtain the final predicted value. In the first place, SHAP provides a global interpretation of the strength prediction and sorts the feature importance of the four input variables to conclude that the mass replacement rate of RP has the greatest influence on the prediction process, which is consistent with the results found in previous experiments [73]. On the contrary, W/B has the least effect on the predicted results, because the W/B used in the experiment is more concentrated.
- In the feature dependence analysis, the SHAP value decreases with the increase in the mass replacement rate, and the SHAP value of RBP is slightly higher than that of RCP. These findings provide reference value for future research into recycled powder.
Author Contributions
Funding
Institutional Review Board Statement
Informed Consent Statement
Data Availability Statement
Acknowledgments
Conflicts of Interest
Appendix A. All test data
| Author | Literature | ID | Kind | Size(μm) | W/B | MRR(%) | fc(Mpa) |
| Zhang Xiu qin | EXPERI MENTAL STUDY ON THE UTILIZATION OF RENEWA BLE MICRON (Chinese) [74] | 1 | RCP | 0.00 | 0.50 | 0.00 | 42.70 |
| 2 | RCP | 29.78 | 0.50 | 10.00 | 39.10 | ||
| 3 | RCP | 29.78 | 0.50 | 20.00 | 35.80 | ||
| 4 | RCP | 29.78 | 0.50 | 30.00 | 31.20 | ||
| Shujun Li et al. | Experimental Study on the Preparation of Recycled Admixtures by Using Construction and Demolition Waste [39] | 5 | RCP | 0.00 | 0.50 | 0.00 | 46.60 |
| 6 | RCP | 22.50 | 0.50 | 30.00 | 33.55 | ||
| 7 | RCP | 37.50 | 0.50 | 30.00 | 32.62 | ||
| 8 | RBP | 22.50 | 0.50 | 30.00 | 36.35 | ||
| 9 | RBP | 37.50 | 0.50 | 30.00 | 34.48 | ||
| Lan Cong et al. | Study on the Application of Recycled Fine Powder in Ready-Mixed Concrete [40] | 10 | RBP | 16.61 | 0.50 | 30.00 | 33.05 |
| 11 | RBP | 14.44 | 0.50 | 30.00 | 34.99 | ||
| 12 | RBP | 12.67 | 0.50 | 30.00 | 37.42 | ||
| 13 | RBP | 10.66 | 0.50 | 30.00 | 37.91 | ||
| Wang Hua | INFLUENCE OF RECYCLED FINE POWDER ON SHRINKAGE CRACKING OF CONCRETE (Chinese) [75] | 14 | RCP | 100.00 | 0.50 | 30.00 | 29.90 |
| 15 | RCP | 70.00 | 0.50 | 30.00 | 32.30 | ||
| 16 | RCP | 50.00 | 0.50 | 30.00 | 30.20 | ||
| Liu Rongtao | Experimental Study on the Construction Waste Clay Brick Powder as Active Admixture (Chinese) [76] | 17 | RBP | 25.00 | 0.50 | 30.00 | 28.70 |
| 18 | RBP | 15.00 | 0.50 | 30.00 | 31.90 | ||
| 19 | RBP | 10.00 | 0.50 | 30.00 | 32.70 | ||
| 20 | RBP | 0.00 | 0.50 | 0.00 | 42.50 | ||
| 21 | RBP | 15.00 | 0.50 | 10.00 | 38.30 | ||
| 22 | RBP | 15.00 | 0.50 | 20.00 | 35.70 | ||
| 23 | RBP | 15.00 | 0.50 | 30.00 | 31.90 | ||
| 24 | RBP | 15.00 | 0.50 | 40.00 | 26.30 | ||
| 25 | RBP | 15.00 | 0.50 | 50.00 | 22.10 | ||
| 26 | RBP | 15.00 | 0.50 | 60.00 | 16.60 | ||
| Kang Xiaoming | Study on the Influence of the Particle Size Distribution of Recycled Concrete Powder on the Mechanical Properties and Microstructure of Rcycled Mortar (Chinese) [77] | 27 | RCP | 34.82 | 0.50 | 10.00 | 42.00 |
| 28 | RCP | 34.82 | 0.50 | 20.00 | 40.30 | ||
| 29 | RCP | 34.82 | 0.50 | 30.00 | 31.00 | ||
| 30 | RCP | 19.40 | 0.50 | 10.00 | 43.50 | ||
| 31 | RCP | 19.40 | 0.50 | 20.00 | 41.00 | ||
| 32 | RCP | 19.40 | 0.50 | 30.00 | 31.50 | ||
| 33 | RCP | 18.53 | 0.50 | 10.00 | 50.60 | ||
| 34 | RCP | 18.53 | 0.50 | 20.00 | 44.00 | ||
| 35 | RCP | 18.53 | 0.50 | 30.00 | 36.10 | ||
| 36 | RCP | 0.00 | 0.50 | 0.00 | 50.80 | ||
| 37 | RCP | 67.79 | 0.50 | 10.00 | 45.50 | ||
| 38 | RCP | 67.79 | 0.50 | 20.00 | 37.20 | ||
| 39 | RCP | 67.79 | 0.50 | 30.00 | 26.80 | ||
| 40 | RCP | 67.79 | 0.50 | 40.00 | 17.60 | ||
| Xu Changwei et al. | Study on activation of waste clay brick powder [41] | 41 | RBP | 14.71 | 0.50 | 30.00 | 23.42 |
| 42 | RBP | 13.89 | 0.50 | 30.00 | 25.30 | ||
| 43 | RBP | 12.85 | 0.50 | 30.00 | 27.42 | ||
| 44 | RBP | 0.00 | 0.50 | 0.00 | 40.90 | ||
| 45 | RBP | 12.85 | 0.50 | 20.00 | 48.10 | ||
| 46 | RBP | 12.85 | 0.50 | 30.00 | 39.20 | ||
| 47 | RBP | 12.85 | 0.50 | 40.00 | 31.80 | ||
| 48 | RBP | 12.85 | 0.50 | 50.00 | 26.50 | ||
| 49 | RBP | 12.85 | 0.50 | 60.00 | 21.10 | ||
| XU Changwei et al. | Application of waste clay brick powder in grouting material (Chinese) [78] | 50 | RBP | 20.90 | 0.50 | 30.00 | 22.10 |
| 51 | RBP | 16.70 | 0.50 | 30.00 | 27.70 | ||
| 52 | RBP | 14.37 | 0.50 | 30.00 | 32.90 | ||
| 53 | RBP | 12.71 | 0.50 | 30.00 | 35.60 | ||
| Zheng Li | Properties of Concrete with Recycled Clay- Brick-Powder (Chinese) [79] | 54 | RBP | 100.00 | 0.50 | 30.00 | 44.90 |
| 55 | RBP | 60.00 | 0.50 | 30.00 | 45.10 | ||
| 56 | RBP | 40.00 | 0.50 | 30.00 | 45.10 | ||
| 57 | RBP | 100.00 | 0.50 | 20.00 | 45.04 | ||
| 58 | RBP | 60.00 | 0.50 | 20.00 | 48.45 | ||
| 59 | RBP | 40.00 | 0.50 | 20.00 | 49.10 | ||
| 60 | RBP | 100.00 | 0.50 | 10.00 | 48.90 | ||
| 61 | RBP | 60.00 | 0.50 | 10.00 | 52.00 | ||
| 62 | RBP | 40.00 | 0.50 | 10.00 | 50.10 | ||
| WANG Yuan-yuan et al. | STUDY ON MECHANICAL PROPERTIES OF WASTE CLAY-BRICK-POWDER MORTAR (Chinese) [80] | 63 | RBP | 0.00 | 0.35 | 0.00 | 54.90 |
| 64 | RBP | 53.00 | 0.35 | 10.00 | 50.00 | ||
| 65 | RBP | 53.00 | 0.35 | 20.00 | 48.30 | ||
| 66 | RBP | 53.00 | 0.35 | 30.00 | 45.10 | ||
| 67 | RBP | 71.00 | 0.35 | 10.00 | 52.30 | ||
| 68 | RBP | 71.00 | 0.35 | 20.00 | 48.20 | ||
| 69 | RBP | 71.00 | 0.35 | 30.00 | 45.10 | ||
| 70 | RBP | 82.00 | 0.35 | 10.00 | 48.80 | ||
| 71 | RBP | 82.00 | 0.35 | 20.00 | 44.90 | ||
| 72 | RBP | 82.00 | 0.35 | 30.00 | 44.80 | ||
| 73 | RBP | 45.00 | 0.35 | 10.00 | 53.60 | ||
| 74 | RBP | 45.00 | 0.35 | 20.00 | 40.00 | ||
| 75 | RBP | 45.00 | 0.35 | 30.00 | 37.10 | ||
| Zhang Ping et al. | Study on the method of stimulating the activity of regenerated micro powder (Chinese) [81] | 76 | RCP | 0.00 | 0.50 | 0.00 | 49.20 |
| 77 | RCP | 8.06 | 0.50 | 10.00 | 46.10 | ||
| 78 | RCP | 8.06 | 0.50 | 20.00 | 44.80 | ||
| 79 | RCP | 8.06 | 0.50 | 30.00 | 43.10 | ||
| 80 | RCP | 8.06 | 0.50 | 40.00 | 33.40 | ||
| 81 | RCP | 8.06 | 0.50 | 50.00 | 28.00 | ||
| Liu Yin et al. | Experimental Research on Cementitious Property of Renewable Powders of Construction Waste (Chinese) [82] | 82 | RCP | 0.00 | 0.50 | 0.00 | 30.60 |
| 83 | RCP | 50.00 | 0.50 | 10.00 | 29.50 | ||
| 84 | RCP | 50.00 | 0.50 | 20.00 | 26.90 | ||
| 85 | RCP | 50.00 | 0.50 | 30.00 | 23.50 | ||
| 86 | RCP | 50.00 | 0.50 | 40.00 | 20.10 | ||
| Ma Yu | Experimental study on properties of recycled micro powder concrete mixed with construction waste (Chinese) [83] | 87 | RCP | 0.00 | 0.50 | 0.00 | 56.80 |
| 88 | RCP | 35.00 | 0.50 | 10.00 | 53.10 | ||
| 89 | RCP | 35.00 | 0.50 | 20.00 | 50.80 | ||
| 90 | RCP | 35.00 | 0.50 | 30.00 | 39.20 | ||
| 91 | RCP | 35.00 | 0.50 | 40.00 | 33.60 | ||
| 92 | RCP | 35.00 | 0.50 | 50.00 | 25.80 | ||
| Fan Yao-hu et al. | Effect of Regenerated Powder and Fly Ash on Mechanical Properties and Microstructure of Mortar (Chinese) [84] | 93 | RCP | 0.00 | 0.50 | 0.00 | 49.30 |
| 94 | RCP | 12.86 | 0.50 | 10.00 | 43.60 | ||
| 95 | RCP | 12.86 | 0.50 | 20.00 | 42.50 | ||
| 96 | RCP | 12.86 | 0.50 | 30.00 | 33.60 | ||
| 97 | RCP | 12.86 | 0.50 | 40.00 | 27.80 | ||
| Gao shaobin | Full-component of Waste Cement and Utilization of Recycled Concrete (Chinese) [85] | 98 | RCP | 0.00 | 0.55 | 0.00 | 52.50 |
| 99 | RCP | 24.01 | 0.55 | 10.00 | 47.50 | ||
| 100 | RCP | 24.01 | 0.55 | 20.00 | 44.90 | ||
| 101 | RCP | 24.01 | 0.55 | 30.00 | 38.20 | ||
| Zhenhua Duan et al. | Combined use of recycled powder and recycled coarse aggregate derived from construction and demolition waste in self-compacting concrete [37] | 102 | RCP | 0.00 | 0.50 | 0.00 | 42.53 |
| 103 | RCP | 45.00 | 0.50 | 30.00 | 34.02 | ||
| 104 | RCP | 45.00 | 0.40 | 0.00 | 48.41 | ||
| 105 | RCP | 45.00 | 0.40 | 10.00 | 42.41 | ||
| 106 | RCP | 45.00 | 0.40 | 20.00 | 41.25 | ||
| Dae-Joong Moon et al. | Fundamental properties of mortar containing waste concrete powder [38] | 107 | RCP | 19.67 | 0.55 | 0.00 | 54.10 |
| 108 | RCP | 44.12 | 0.55 | 20.00 | 41.90 | ||
| 109 | RCP | 20.76 | 0.55 | 10.00 | 52.60 | ||
| 110 | RCP | 20.76 | 0.55 | 20.00 | 46.70 | ||
| 111 | RCP | 20.76 | 0.55 | 30.00 | 36.40 | ||
| 112 | RCP | 18.93 | 0.55 | 10.00 | 50.10 | ||
| 113 | RCP | 18.93 | 0.55 | 20.00 | 43.40 | ||
| 114 | RCP | 18.93 | 0.55 | 30.00 | 37.30 | ||
| Shujun Li et al. | Particle-size effect of recycled clay brick powder on the pore structure of blended cement paste [86] | 115 | RBP | 0.00 | 0.50 | 30.00 | 48.30 |
| 116 | RBP | 25.00 | 0.50 | 30.00 | 39.80 | ||
| 117 | RBP | 45.00 | 0.50 | 30.00 | 36.20 | ||
| 118 | RBP | 75.00 | 0.50 | 30.00 | 33.70 | ||
| Zhiming Ma et al. | Mechanical properties and water absorption of cement composites with various fineness and contents of waste brick powder from C&D waste [87] | 119 | RBP | 0.00 | 0.50 | 0.00 | 42.10 |
| 120 | RBP | 6.00 | 0.50 | 7.50 | 43.30 | ||
| 121 | RBP | 6.00 | 0.50 | 15.00 | 44.50 | ||
| 122 | RBP | 6.00 | 0.50 | 30.00 | 38.00 | ||
| 123 | RBP | 12.00 | 0.50 | 30.00 | 42.60 | ||
| 124 | RBP | 12.00 | 0.50 | 30.00 | 43.40 | ||
| 125 | RBP | 12.00 | 0.50 | 30.00 | 37.80 | ||
| 126 | RBP | 18.00 | 0.50 | 30.00 | 40.70 | ||
| 127 | RBP | 18.00 | 0.50 | 30.00 | 39.10 | ||
| 128 | RBP | 18.00 | 0.50 | 30.00 | 36.30 | ||
| 129 | RBP | 42.00 | 0.50 | 30.00 | 38.50 | ||
| 130 | RBP | 42.00 | 0.50 | 30.00 | 37.40 | ||
| 131 | RBP | 42.00 | 0.50 | 30.00 | 32.90 | ||
| Huixia Wu et al. | Water transport and resistance improvement for the cementitious composites with eco-friendly powder from various concrete wastes [88] | 132 | RCP | 0.00 | 0.50 | 0.00 | 42.50 |
| 133 | RCP | 9.00 | 0.50 | 10.00 | 37.90 | ||
| 134 | RCP | 9.00 | 0.50 | 20.00 | 35.40 | ||
| 135 | RCP | 9.00 | 0.50 | 30.00 | 32.13 | ||
| 136 | RCP | 9.00 | 0.50 | 50.00 | 20.70 | ||
| Huixia Wu et al. | Properties of green mortar blended with waste concrete-brick powder at various components, replacement ratios and particle sizes [89] | 137 | RCP | 0.00 | 0.50 | 0.00 | 42.50 |
| 138 | RCP | 14.30 | 0.50 | 10.00 | 37.60 | ||
| 139 | RCP | 14.30 | 0.50 | 20.00 | 34.30 | ||
| 140 | RCP | 14.30 | 0.50 | 30.00 | 30.50 | ||
| 141 | RBP | 11.80 | 0.50 | 10.00 | 41.30 | ||
| 142 | RBP | 11.80 | 0.50 | 20.00 | 38.70 | ||
| 143 | RBP | 11.80 | 0.50 | 30.00 | 34.90 | ||
| Zhenhua Duan et al. | Study on the essential properties of recycled powders from construction and demolition waste [90] | 144 | RBP | 0.00 | 0.50 | 0.00 | 45.00 |
| 145 | RBP | 12.64 | 0.50 | 10.00 | 41.40 | ||
| 146 | RBP | 12.64 | 0.50 | 20.00 | 40.70 | ||
| 147 | RBP | 12.64 | 0.50 | 30.00 | 37.80 | ||
| Shujun Li et al. | Investigation of using recycled powder from the preparation of recycled aggregate as a supplementary cementitious material [91] | 148 | RCP | 0.00 | 0.50 | 0.00 | 47.10 |
| 149 | RCP | 9.00 | 0.50 | 30.00 | 35.32 | ||
| 150 | RCP | 14.00 | 0.50 | 30.00 | 34.40 | ||
| 151 | RCP | 18.00 | 0.50 | 30.00 | 32.10 | ||
| 152 | RCP | 28.00 | 0.50 | 30.00 | 31.60 | ||
| 153 | RBP | 9.30 | 0.50 | 30.00 | 37.20 | ||
| 154 | RBP | 13.00 | 0.50 | 30.00 | 36.50 | ||
| 155 | RBP | 20.00 | 0.50 | 30.00 | 34.10 | ||
| 156 | RBP | 27.00 | 0.50 | 30.00 | 33.90 | ||
| Xiao-xiao Yu | Effect of Mechanical Force Grinding on the Properties of Recycled Powder (Chinese) [92] | 157 | RCP | 27.50 | 0.50 | 5.00 | 42.40 |
| 158 | RCP | 27.50 | 0.50 | 10.00 | 41.50 | ||
| 159 | RCP | 27.50 | 0.50 | 15.00 | 37.80 | ||
| 160 | RCP | 27.50 | 0.50 | 20.00 | 34.80 | ||
| 161 | RCP | 27.50 | 0.50 | 25.00 | 32.40 | ||
| 162 | RCP | 27.50 | 0.50 | 30.00 | 30.30 | ||
| 163 | RCP | 27.50 | 0.50 | 35.00 | 23.80 | ||
| 164 | RCP | 27.50 | 0.50 | 40.00 | 20.00 | ||
| 165 | RCP | 27.50 | 0.50 | 45.00 | 16.30 | ||
| 166 | RCP | 27.50 | 0.50 | 50.00 | 12.50 | ||
| 167 | RCP | 27.50 | 0.50 | 55.00 | 11.20 | ||
| 168 | RCP | 27.50 | 0.50 | 60.00 | 5.40 | ||
| 169 | RCP | 32.50 | 0.50 | 5.00 | 41.60 | ||
| 170 | RCP | 32.50 | 0.50 | 10.00 | 38.20 | ||
| 171 | RCP | 32.50 | 0.50 | 15.00 | 36.10 | ||
| 172 | RCP | 32.50 | 0.50 | 20.00 | 32.50 | ||
| 173 | RCP | 32.50 | 0.50 | 25.00 | 30.10 | ||
| 174 | RCP | 32.50 | 0.50 | 30.00 | 36.90 | ||
| 175 | RCP | 32.50 | 0.50 | 35.00 | 22.50 | ||
| 176 | RCP | 32.50 | 0.50 | 40.00 | 17.40 | ||
| 177 | RCP | 32.50 | 0.50 | 45.00 | 12.40 | ||
| 178 | RCP | 32.50 | 0.50 | 50.00 | 11.30 | ||
| 179 | RCP | 32.50 | 0.50 | 55.00 | 11.10 | ||
| 180 | RCP | 32.50 | 0.50 | 60.00 | 2.50 | ||
| Li Zhong | Effect of recycled fine powder/aggregate modification on cement-basedmaterials and its application (Chinese) [93] | 181 | RCP | 0.00 | 0.50 | 0.00 | 43.90 |
| 182 | RCP | 22.70 | 0.50 | 10.00 | 43.50 | ||
| 183 | RCP | 22.70 | 0.50 | 30.00 | 33.30 | ||
| 184 | RCP | 22.70 | 0.50 | 50.00 | 20.50 | ||
| Yang Lin | INVESTIGATION ON R ECYCLED CEMENTITIOUS MATERIALS PR EPAR ING WITH RECYCLED CONCR ETE POWDER (Chinese) [94] | 185 | RCP | 0.00 | 0.50 | 0.00 | 45.20 |
| 186 | RCP | 33.20 | 0.50 | 30.00 | 27.80 | ||
| 187 | RCP | 27.60 | 0.50 | 30.00 | 28.90 | ||
| 188 | RCP | 20.60 | 0.50 | 30.00 | 31.30 | ||
| 189 | RCP | 16.50 | 0.50 | 30.00 | 29.60 | ||
| 190 | RCP | 14.30 | 0.50 | 30.00 | 28.00 | ||
| 191 | RCP | 10.30 | 0.50 | 30.00 | 25.70 | ||
| Huixia Wu et al. | Early-age behavior and mechanical properties of cement-based materials with various types and fineness of recycled powder [95] | 192 | RCP | 0.00 | 0.50 | 0.00 | 38.80 |
| 193 | RCP | 12.40 | 0.50 | 7.00 | 38.50 | ||
| 194 | RCP | 12.40 | 0.50 | 15.00 | 36.40 | ||
| 195 | RCP | 12.40 | 0.50 | 30.00 | 30.20 | ||
| 196 | RCP | 12.40 | 0.50 | 40.00 | 24.10 | ||
| 197 | RCP | 23.50 | 0.50 | 7.00 | 27.80 | ||
| 198 | RCP | 23.50 | 0.50 | 15.00 | 34.50 | ||
| 199 | RCP | 23.50 | 0.50 | 30.00 | 29.60 | ||
| 200 | RCP | 23.50 | 0.50 | 40.00 | 22.90 | ||
| 201 | RCP | 103.60 | 0.50 | 7.00 | 35.20 | ||
| 202 | RCP | 103.60 | 0.50 | 15.00 | 30.20 | ||
| 203 | RCP | 103.60 | 0.50 | 30.00 | 25.20 | ||
| 204 | RCP | 103.60 | 0.50 | 40.00 | 20.00 |
Appendix B. ML training set data
| ID | Kind | Size (μm) | W/B | MRR (%) | fc (Mpa) |
| 1 | 0 | 32.5 | 0.5 | 40 | 17.4 |
| 2 | 0 | 34.823 | 0.5 | 10 | 42 |
| 3 | 1 | 45 | 0.35 | 10 | 53.6 |
| 4 | 0 | 27.5 | 0.5 | 55 | 11.2 |
| 5 | 1 | 27 | 0.5 | 30 | 33.9 |
| 6 | 0 | 0 | 0.5 | 0 | 46.6 |
| 7 | 0 | 37.5 | 0.5 | 30 | 32.62 |
| 8 | 1 | 71 | 0.35 | 10 | 52.3 |
| 9 | 1 | 100 | 0.5 | 30 | 44.9 |
| 10 | 0 | 24.01 | 0.55 | 10 | 47.5 |
| 11 | 1 | 12.85 | 0.5 | 40 | 31.8 |
| 12 | 0 | 24.01 | 0.55 | 30 | 38.2 |
| 13 | 0 | 103.6 | 0.5 | 15 | 30.2 |
| 14 | 1 | 12 | 0.5 | 30 | 43.4 |
| 15 | 0 | 45 | 0.4 | 20 | 41.25 |
| 16 | 1 | 15 | 0.5 | 30 | 31.9 |
| 17 | 1 | 40 | 0.5 | 20 | 49.1 |
| 18 | 1 | 15 | 0.5 | 10 | 38.3 |
| 19 | 0 | 10.3 | 0.5 | 30 | 25.7 |
| 20 | 0 | 22.5 | 0.5 | 30 | 33.55 |
| 21 | 0 | 35 | 0.5 | 20 | 50.8 |
| 22 | 1 | 11.8 | 0.5 | 30 | 34.9 |
| 23 | 1 | 12.85 | 0.5 | 60 | 21.1 |
| 24 | 0 | 45 | 0.4 | 10 | 42.41 |
| 25 | 0 | 22.7 | 0.5 | 10 | 43.5 |
| 26 | 1 | 75 | 0.5 | 30 | 33.7 |
| 27 | 0 | 29.78 | 0.5 | 20 | 35.8 |
| 28 | 0 | 9 | 0.5 | 30 | 35.32 |
| 29 | 0 | 0 | 0.5 | 0 | 50.8 |
| 30 | 1 | 12.85 | 0.5 | 20 | 48.1 |
| 31 | 1 | 18 | 0.5 | 30 | 39.1 |
| 32 | 1 | 14.44 | 0.5 | 30 | 34.99 |
| 33 | 1 | 45 | 0.35 | 30 | 37.1 |
| 34 | 1 | 15 | 0.5 | 50 | 22.1 |
| 35 | 1 | 0 | 0.5 | 0 | 42.5 |
| 36 | 0 | 12.4 | 0.5 | 30 | 30.2 |
| 37 | 0 | 33.2 | 0.5 | 30 | 27.8 |
| 38 | 1 | 100 | 0.5 | 10 | 48.9 |
| 39 | 0 | 8.06 | 0.5 | 40 | 33.4 |
| 40 | 0 | 103.6 | 0.5 | 40 | 20 |
| 41 | 0 | 22.7 | 0.5 | 30 | 33.3 |
| 42 | 0 | 0 | 0.5 | 0 | 38.8 |
| 43 | 1 | 0 | 0.5 | 0 | 45 |
| 44 | 0 | 50 | 0.5 | 20 | 26.9 |
| 45 | 0 | 20.76 | 0.55 | 10 | 52.6 |
| 46 | 1 | 16.7 | 0.5 | 30 | 27.7 |
| 47 | 1 | 12 | 0.5 | 30 | 42.6 |
| 48 | 0 | 0 | 0.5 | 0 | 30.6 |
| 49 | 0 | 35 | 0.5 | 40 | 33.6 |
| 50 | 1 | 6 | 0.5 | 15 | 44.5 |
| 51 | 0 | 18.93 | 0.55 | 20 | 43.4 |
| 52 | 1 | 0 | 0.5 | 0 | 42.1 |
| 53 | 0 | 32.5 | 0.5 | 30 | 36.9 |
| 54 | 0 | 14 | 0.5 | 30 | 34.4 |
| 55 | 0 | 19.403 | 0.5 | 30 | 31.5 |
| 56 | 1 | 9.3 | 0.5 | 30 | 37.2 |
| 57 | 1 | 13 | 0.5 | 30 | 36.5 |
| 58 | 1 | 6 | 0.5 | 7.5 | 43.3 |
| 59 | 1 | 12 | 0.5 | 30 | 37.8 |
| 60 | 0 | 0 | 0.5 | 0 | 56.8 |
| 61 | 1 | 12.85 | 0.5 | 30 | 39.2 |
| 62 | 1 | 11.8 | 0.5 | 10 | 41.3 |
| 63 | 1 | 82 | 0.35 | 20 | 44.9 |
| 64 | 0 | 18.93 | 0.55 | 10 | 50.1 |
| 65 | 1 | 53 | 0.35 | 30 | 45.1 |
| 66 | 1 | 25 | 0.5 | 30 | 39.8 |
| 67 | 0 | 100 | 0.5 | 30 | 29.9 |
| 68 | 0 | 27.5 | 0.5 | 45 | 16.3 |
| 69 | 0 | 27.5 | 0.5 | 35 | 23.8 |
| 70 | 1 | 18 | 0.5 | 30 | 40.7 |
| 71 | 1 | 42 | 0.5 | 30 | 38.5 |
| 72 | 0 | 27.6 | 0.5 | 30 | 28.9 |
| 73 | 0 | 44.12 | 0.55 | 20 | 41.9 |
| 74 | 0 | 18 | 0.5 | 30 | 32.1 |
| 75 | 0 | 50 | 0.5 | 30 | 30.2 |
| 76 | 0 | 35 | 0.5 | 10 | 53.1 |
| 77 | 0 | 27.5 | 0.5 | 50 | 12.5 |
| 78 | 1 | 12.64 | 0.5 | 20 | 40.7 |
| 79 | 1 | 14.71 | 0.5 | 30 | 23.42 |
| 80 | 1 | 10.66 | 0.5 | 30 | 37.91 |
| 81 | 0 | 50 | 0.5 | 10 | 29.5 |
| 82 | 0 | 12.862 | 0.5 | 10 | 43.6 |
| 83 | 1 | 53 | 0.35 | 20 | 48.3 |
| 84 | 1 | 6 | 0.5 | 30 | 38 |
| 85 | 0 | 67.785 | 0.5 | 30 | 26.8 |
| 86 | 0 | 32.5 | 0.5 | 15 | 36.1 |
| 87 | 0 | 103.6 | 0.5 | 7 | 35.2 |
| 88 | 0 | 20.76 | 0.55 | 20 | 46.7 |
| 89 | 1 | 40 | 0.5 | 30 | 45.1 |
| 90 | 0 | 67.785 | 0.5 | 20 | 37.2 |
| 91 | 0 | 32.5 | 0.5 | 25 | 30.1 |
| 92 | 0 | 20.6 | 0.5 | 30 | 31.3 |
| 93 | 1 | 45 | 0.35 | 20 | 40 |
| 94 | 0 | 29.78 | 0.5 | 30 | 31.2 |
| 95 | 0 | 32.5 | 0.5 | 60 | 2.5 |
| 96 | 0 | 67.785 | 0.5 | 10 | 45.5 |
| 97 | 0 | 8.06 | 0.5 | 50 | 28 |
| 98 | 0 | 32.5 | 0.5 | 20 | 32.5 |
| 99 | 0 | 12.4 | 0.5 | 15 | 36.4 |
| 100 | 0 | 9 | 0.5 | 50 | 20.7 |
| 101 | 1 | 60 | 0.5 | 20 | 48.45 |
| 102 | 1 | 15 | 0.5 | 30 | 31.9 |
| 103 | 1 | 12.85 | 0.5 | 50 | 26.5 |
| 104 | 0 | 32.5 | 0.5 | 10 | 38.2 |
| 105 | 0 | 12.862 | 0.5 | 40 | 27.8 |
| 106 | 0 | 35 | 0.5 | 50 | 25.8 |
| 107 | 1 | 14.37 | 0.5 | 30 | 32.9 |
| 108 | 1 | 20.9 | 0.5 | 30 | 22.1 |
| 109 | 0 | 0 | 0.5 | 0 | 45.2 |
| 110 | 0 | 14.3 | 0.5 | 20 | 34.3 |
| 111 | 0 | 32.5 | 0.5 | 45 | 12.4 |
| 112 | 1 | 40 | 0.5 | 10 | 50.1 |
| 113 | 1 | 82 | 0.35 | 10 | 48.8 |
| 114 | 0 | 32.5 | 0.5 | 35 | 22.5 |
| 115 | 1 | 82 | 0.35 | 30 | 44.8 |
| 116 | 0 | 28 | 0.5 | 30 | 31.6 |
| 117 | 0 | 0 | 0.5 | 0 | 49.3 |
| 118 | 0 | 34.823 | 0.5 | 30 | 31 |
| 119 | 0 | 32.5 | 0.5 | 50 | 11.3 |
| 120 | 0 | 27.5 | 0.5 | 25 | 32.4 |
| 121 | 1 | 15 | 0.5 | 60 | 16.6 |
| 122 | 0 | 18.529 | 0.5 | 10 | 50.6 |
| 123 | 0 | 27.5 | 0.5 | 30 | 30.3 |
| 124 | 0 | 8.06 | 0.5 | 20 | 44.8 |
| 125 | 0 | 0 | 0.5 | 0 | 42.53 |
| 126 | 0 | 9 | 0.5 | 30 | 32.13 |
| 127 | 0 | 18.529 | 0.5 | 30 | 36.1 |
| 128 | 0 | 27.5 | 0.5 | 10 | 41.5 |
| 129 | 0 | 34.823 | 0.5 | 20 | 40.3 |
| 130 | 0 | 103.6 | 0.5 | 30 | 25.2 |
| 131 | 0 | 18.93 | 0.55 | 30 | 37.3 |
| 132 | 0 | 23.5 | 0.5 | 30 | 29.6 |
| 133 | 0 | 19.67 | 0.55 | 0 | 54.1 |
| 134 | 0 | 14.3 | 0.5 | 30 | 30.5 |
| 135 | 0 | 23.5 | 0.5 | 15 | 34.5 |
| 136 | 0 | 50 | 0.5 | 30 | 23.5 |
| 137 | 0 | 45 | 0.4 | 0 | 48.41 |
| 138 | 1 | 25 | 0.5 | 30 | 28.7 |
| 139 | 0 | 35 | 0.5 | 30 | 39.2 |
| 140 | 0 | 0 | 0.5 | 0 | 42.5 |
| 141 | 1 | 13.89 | 0.5 | 30 | 25.3 |
| 142 | 0 | 19.403 | 0.5 | 10 | 43.5 |
| 143 | 0 | 27.5 | 0.5 | 20 | 34.8 |
| 144 | 0 | 27.5 | 0.5 | 5 | 42.4 |
| 145 | 0 | 22.7 | 0.5 | 50 | 20.5 |
| 146 | 1 | 42 | 0.5 | 30 | 37.4 |
| 147 | 1 | 71 | 0.35 | 30 | 45.1 |
| 148 | 0 | 23.5 | 0.5 | 7 | 27.8 |
| 149 | 1 | 11.8 | 0.5 | 20 | 38.7 |
| 150 | 0 | 23.5 | 0.5 | 40 | 22.9 |
| 151 | 1 | 37.5 | 0.5 | 30 | 34.48 |
| 152 | 1 | 60 | 0.5 | 30 | 45.1 |
| 153 | 1 | 18 | 0.5 | 30 | 36.3 |
| 154 | 0 | 24.01 | 0.55 | 20 | 44.9 |
| 155 | 1 | 20 | 0.5 | 30 | 34.1 |
| 156 | 0 | 9 | 0.5 | 10 | 37.9 |
| 157 | 0 | 0 | 0.5 | 0 | 42.7 |
| 158 | 1 | 100 | 0.5 | 20 | 45.04 |
| 159 | 0 | 12.4 | 0.5 | 7 | 38.5 |
| 160 | 0 | 12.862 | 0.5 | 30 | 33.6 |
| 161 | 1 | 0 | 0.5 | 30 | 48.3 |
| 162 | 0 | 70 | 0.5 | 30 | 32.3 |
| 163 | 0 | 0 | 0.5 | 0 | 49.2 |
Appendix C. ML test set data
| ID | Kind | Size (μm) | W/B | MRR (%) | fc (Mpa) |
| 1 | 0 | 18.529 | 0.5 | 20 | 44 |
| 2 | 0 | 19.403 | 0.5 | 20 | 41 |
| 3 | 0 | 0 | 0.5 | 0 | 47.1 |
| 4 | 0 | 0 | 0.5 | 0 | 43.9 |
| 5 | 0 | 27.5 | 0.5 | 60 | 5.4 |
| 6 | 0 | 0 | 0.55 | 0 | 52.5 |
| 7 | 1 | 45 | 0.5 | 30 | 36.2 |
| 8 | 1 | 12.67 | 0.5 | 30 | 37.422 |
| 9 | 1 | 15 | 0.5 | 40 | 26.3 |
| 10 | 1 | 12.64 | 0.5 | 30 | 37.8 |
| 11 | 1 | 12.71 | 0.5 | 30 | 35.6 |
| 12 | 0 | 8.06 | 0.5 | 10 | 46.1 |
| 13 | 1 | 12.85 | 0.5 | 30 | 27.4176 |
| 14 | 0 | 67.785 | 0.5 | 40 | 17.6 |
| 15 | 1 | 12.64 | 0.5 | 10 | 41.4 |
| 16 | 0 | 27.5 | 0.5 | 40 | 20 |
| 17 | 1 | 0 | 0.5 | 0 | 40.9 |
| 18 | 0 | 29.78 | 0.5 | 10 | 39.1 |
| 19 | 1 | 16.61 | 0.5 | 30 | 33.048 |
| 20 | 0 | 45 | 0.5 | 30 | 34.02 |
| 21 | 1 | 0 | 0.35 | 0 | 54.9 |
| 22 | 0 | 0 | 0.5 | 0 | 42.5 |
| 23 | 1 | 10 | 0.5 | 30 | 32.7 |
| 24 | 1 | 42 | 0.5 | 30 | 32.9 |
| 25 | 0 | 12.4 | 0.5 | 40 | 24.1 |
| 26 | 0 | 32.5 | 0.5 | 5 | 41.6 |
| 27 | 0 | 32.5 | 0.5 | 55 | 11.1 |
| 28 | 0 | 9 | 0.5 | 20 | 35.4 |
| 29 | 0 | 14.3 | 0.5 | 10 | 37.6 |
| 30 | 0 | 14.3 | 0.5 | 30 | 28 |
| 31 | 1 | 71 | 0.35 | 20 | 48.2 |
| 32 | 1 | 53 | 0.35 | 10 | 50 |
| 33 | 0 | 8.06 | 0.5 | 30 | 43.1 |
| 34 | 1 | 15 | 0.5 | 20 | 35.7 |
| 35 | 0 | 50 | 0.5 | 40 | 20.1 |
| 36 | 0 | 27.5 | 0.5 | 15 | 37.8 |
| 37 | 1 | 22.5 | 0.5 | 30 | 36.348 |
| 38 | 1 | 60 | 0.5 | 10 | 52 |
| 39 | 0 | 12.862 | 0.5 | 20 | 42.5 |
| 40 | 0 | 20.76 | 0.55 | 30 | 36.4 |
| 41 | 0 | 16.5 | 0.5 | 30 | 29.6 |
References
- Wu, R.; Zhao, T.; Zhang, P.; Yang, D.; Liu, M.; Ma, Z. Tensile Behavior of Strain Hardening Cementitious Composites (SHCC) Containing Reactive Recycled Powder from Various C & D Waste. J. Renew. Mater. 2021, 9, 743–765. [Google Scholar] [CrossRef]
- Bovea, M.D.; Powell, J.C. Developments in life cycle assessment applied to evaluate the environmental performance of construction and demolition wastes. Waste Manag. 2016, 50, 151–172. [Google Scholar] [CrossRef] [PubMed]
- Cheng, Z.; Yang, Y.; Zhang, H. Interpretable ensemble machine-learning models for strength activity index prediction of iron ore tailings. Case Stud. Constr. Mater. 2022, 17, e01239. [Google Scholar] [CrossRef]
- Ge, P.; Huang, W.; Zhang, J.; Quan, W.; Guo, Y. Mix proportion design method of recycled brick aggregate concrete based on aggregate skeleton theory. Constr. Build. Mater. 2021, 304, 124584. [Google Scholar] [CrossRef]
- Liu, J.; Ren, F.; Quan, H. Prediction Model for Compressive Strength of Porous Concrete with Low-Grade Recycled Aggregate. Materials 2021, 14, 3871. [Google Scholar] [CrossRef]
- He, A.; Cai, J.; Chen, Q.; Liu, X.; Xue, H.; Yu, C. Axial compressive behaviour of steel-jacket retrofitted RC columns with recycled aggregate concrete. Constr. Build. Mater. 2017, 141, 501–516. [Google Scholar] [CrossRef]
- Xie, T.; Yang, G.; Zhao, X.; Xu, J.; Fang, C. A unified model for predicting the compressive strength of recycled aggregate concrete containing supplementary cementitious materials. J. Clean. Prod. 2020, 251, 119752. [Google Scholar] [CrossRef]
- Tang, Q.; Ma, Z.; Wu, H.; Wang, W. The utilization of eco-friendly recycled powder from concrete and brick waste in new concrete: A critical review. Cem. Concr. Compos. 2020, 114, 103807. [Google Scholar] [CrossRef]
- Zhou, L.; Liu, Y.; Lu, J.; Zhou, W.; Wang, H. Influence of Recycled Concrete Powder (RCP) and Recycled Brick Powder (RBP) on the Physical/Mechanical Properties and Durability of Raw Soil. Coatings 2021, 11, 1475. [Google Scholar] [CrossRef]
- Likes, L.; Markandeya, A.; Haider, M.M.; Bollinger, D.; McCloy, J.S.; Nassiri, S. Recycled concrete and brick powders as supplements to Portland cement for more sustainable concrete. J. Clean. Prod. 2022, 364, 132651. [Google Scholar] [CrossRef]
- Gao, Y.; Cui, X.; Lu, N.; Hou, S.; He, A.; Liang, C. Effect of recycled powders on the mechanical properties and durability of fully recycled fiber-reinforced mortar. J. Build. Eng. 2022, 45, 103574. [Google Scholar] [CrossRef]
- Xiao, J.; Ma, Z.; Sui, T.; Xiao, J.; Ma, Z.; Sui, T.; Akbarnezhad, A.; Duan, Z. Mechanical properties of concrete mixed with recycled powder produced from construction and demolition waste. J. Clean. Prod. 2018, 188, 720–731. [Google Scholar] [CrossRef]
- Chen, X.; Li, Y.; Zhu, Z.; Ma, L. Evaluation of waste concrete recycled powder (WCRP) on the preparation of low-exothermic cement. J. Build. Eng. 2022, 53, 104511. [Google Scholar] [CrossRef]
- Xie, H.; Dong, J.; Deng, Y.; Dai, Y. Research and Model Prediction on the Performance of Recycled Brick Powder Foam Concrete. Adv. Civ. Eng. 2022, 2022, 2908616. [Google Scholar] [CrossRef]
- Huang, X.; Sresakoolchai, J.; Qin, X.; Ho, Y.F.; Kaewunruen, S. Self-Healing Performance Assessment of Bacterial-Based Concrete Using Machine Learning Approaches. Materials 2022, 15, 4436. [Google Scholar] [CrossRef]
- Yuan, X.; Tian, Y.; Ahmad, W.; Ahmad, A.; Usanova, K.; Mohamed, A.; Khallaf, R. Machine Learning Prediction Models to Evaluate the Strength of Recycled Aggregate Concrete. Materials 2022, 15, 2823. [Google Scholar] [CrossRef]
- Kang, M.; Yoo, D.; Gupta, R. Machine learning-based prediction for compressive and flexural strengths of steel fiber-reinforced concrete. Constr. Build. Mater. 2021, 266, 121117. [Google Scholar] [CrossRef]
- Chou, J.; Ngo, N.; Pham, A. Shear Strength Prediction in Reinforced Concrete Deep Beams Using Nature-Inspired Metaheuristic Support Vector Regression. J. Comput. Civ. Eng. 2016, 30, 4015002. [Google Scholar] [CrossRef]
- Feng, D.; Wang, W.; Mangalathu, S.; Taciroglu, E. Interpretable XGBoost-SHAP Machine-Learning Model for Shear Strength Prediction of Squat RC Walls. J. Struct. Eng. 2021, 147, 4021173. [Google Scholar] [CrossRef]
- Shen, Y.; Wu, L.; Liang, S. Explainable machine learning-based model for failure mode identification of RC flat slabs without transverse reinforcement. Eng. Fail. Anal. 2022, 141, 106647. [Google Scholar] [CrossRef]
- Liang, S.; Shen, Y.; Ren, X. Comparative study of influential factors for punching shear resistance/failure of RC slab-column joints using machine-learning models. Structures 2022, 45, 1333–1349. [Google Scholar] [CrossRef]
- Wakjira, T.; Ibrahim, M.; Ebead, U.; Alam, M. Explainable machine learning model and reliability analysis for flexural capacity prediction of RC beams strengthened in flexure with FRCM. Eng. Struct. 2022, 255, 113003. [Google Scholar] [CrossRef]
- Shen, Y.; Sun, J.; Liang, S. Interpretable Machine Learning Models for Punching Shear Strength Estimation of FRP Reinforced Concrete Slabs. Crystals 2022, 12, 259. [Google Scholar] [CrossRef]
- Mangalathu, S.; Hwang, S.; Jeon, J. Failure mode and effects analysis of RC members based on machine-learning-based SHapley Additive exPlanations (SHAP) approach. Eng. Struct. 2020, 219, 110927. [Google Scholar] [CrossRef]
- Li, Q.; Song, Z. High-performance concrete strength prediction based on ensemble learning. Constr. Build. Mater. 2022, 324, 126694. [Google Scholar] [CrossRef]
- Liang, M.; Chang, Z.; Wan, Z.; Gan, Y.; Schlangen, E.; Šavija, B. Interpretable Ensemble-Machine-Learning models for predicting creep behavior of concrete. Cem. Concr. Compos. 2021, 125, 104295. [Google Scholar] [CrossRef]
- Sarkhani, B.; Reza, S.; Mahzad, E.; Akbar, A. Predicting Resilient Modulus of Flexible Pavement Foundation Using Extreme Gradient Boosting Based Optimized Models. SSRN Electron. J. 2022, 1–20. [Google Scholar] [CrossRef]
- Nguyen-Sy, T.; Wakim, J.; To, Q.; Vu, M.; Nguyen, T.; Nguyen, T. Predicting the compressive strength of concrete from its compositions and age using the extreme gradient boosting method. Constr. Build. Mater. 2022, 260, 119757. [Google Scholar] [CrossRef]
- Wan, Z.; Xu, Y.; Šavija, B. On the Use of Machine Learning Models for Prediction of Compressive Strength of Concrete: Influence of Dimensionality Reduction on the Model Performance. Materials 2021, 14, 713. [Google Scholar] [CrossRef]
- Bulbul, A.M.R.; Khan, K.; Nafees, A.; Amin, M.N.; Ahmad, W.; Usman, M.; Nazar, S.; Arab, A.M.A. In-Depth Analysis of Cement-Based Material Incorporating Metakaolin Using Individual and Ensemble Machine Learning Approaches. Materials 2022, 15, 7764. [Google Scholar] [CrossRef]
- Zhu, Y.; Ahmad, A.; Ahmad, W.; Vatin, N.I.; Mohamed, A.M.; Fathi, D. Predicting the Splitting Tensile Strength of Recycled Aggregate Concrete Using Individual and Ensemble Machine Learning Approaches. Crystals 2022, 12, 569. [Google Scholar] [CrossRef]
- Barkhordari, M.S.; Armaghani, D.J.; Mohammed, A.S.; Ulrikh, D.V. Data-Driven Compressive Strength Prediction of Fly Ash Concrete Using Ensemble Learner Algorithms. Buildings 2022, 12, 132. [Google Scholar] [CrossRef]
- Rathakrishnan, V.; Beddu, S.; Ahmed, A. Predicting compressive strength of high-performance concrete with high volume ground granulated blast-furnace slag replacement using boosting machine learning algorithms. Sci. Rep. 2022, 12, 9539. [Google Scholar] [CrossRef]
- Ahmad, W.; Ahmad, A.; Ostrowski, K.A.; Aslam, F.; Joyklad, P.; Zajdel, P. Application of Advanced Machine Learning Approaches to Predict the Compressive Strength of Concrete Containing Supplementary Cementitious Materials. Materials 2021, 14, 5762. [Google Scholar] [CrossRef] [PubMed]
- Gupta, P.; Gupta, N.; Saxena, K.; Goyal, S. A novel hybrid soft computing model using stacking with ensemble method for estimation of compressive strength of geopolymer composite. Adv. Mater. Process. Technol. 2021, 8, 1494–1509. [Google Scholar] [CrossRef]
- Wang, H.; Yi, W.; Liu, Y. An innovative approach of determining the sample data size for machine learning models: A case study on health and safety management for infrastructure workers. Electron. Res. Arch. 2022, 9, 3452–3462. [Google Scholar] [CrossRef]
- Duan, Z.; Multani, A.; Xiao, J.; Hou, S. Combined use of recycled powder and recycled coarse aggregate derived from construction and demolition waste in self-compacting concrete. Constr. Build. Mater. 2020, 254, 119323. [Google Scholar] [CrossRef]
- Moon, D.; Moon, H.; Kim, Y. Fundamental Properties of Mortar Containing Waste Concrete Powder. Geosyst. Eng. 2005, 8, 95–100. [Google Scholar] [CrossRef]
- Li, S.; Li, Q.; Zhao, X.; Luo, J.; Gao, S.; Yue, G.; Su, D. Experimental Study on the Preparation of Recycled Admixtures by Using Construction and Demolition Waste. Materials 2019, 12, 1678. [Google Scholar] [CrossRef] [Green Version]
- Lan, C.; Lu, J.; Chen, J.; Wu, H. Study on the Application of Recycled Fine Powder in Ready-Mixed Concrete. MATEC Web Conf. 2019, 278, 01010. [Google Scholar] [CrossRef]
- Xu, C.; Yang, X. Study on Activation of Waste Clay Brick Powder. IOP Conf. Ser. Mater. Sci. Eng. 2020, 744, 12028. [Google Scholar] [CrossRef]
- Emmanuel, T.; Maupong, T.; Mpoeleng, D.; Semong, T.; Mphago, B.; Tabona, O. A survey on missing data in machine learning. J. Big Data 2021, 8, 140. [Google Scholar] [CrossRef]
- Williams, W.T.; Lambert, J.M. Multivariate Methods in Plant Ecology: V. Similarity Analyses and Information-Analysis. J. Ecol. 1966, 54, 427. [Google Scholar] [CrossRef]
- Ganaie, M.A.; Hu, M.; Malik, A.K.; Tanveer, M.; Suganthan, P.N. Ensemble deep learning: A review. Eng. Appl. Artif. Intell. 2022, 115, 105151. [Google Scholar] [CrossRef]
- Ngo, G.; Beard, R.; Chandra, R. Evolutionary bagging for ensemble learning. Neurocomputing 2022, 510, 1–14. [Google Scholar] [CrossRef]
- Friedman, J.H.; Hall, P. On bagging and nonlinear estimation. J. Stat. Plan. Inference 2007, 137, 669–683. [Google Scholar] [CrossRef]
- Duffy, N.; Helmbold, D. Boosting Methods for Regression. Mach. Learn. 2002, 47, 153–200. [Google Scholar] [CrossRef] [Green Version]
- Wakjira, T.; Alam, M.; Ebead, U.A. Plastic hinge length of rectangular RC columns using ensemble machine learning model. Eng. Struct. 2021, 244, 112808. [Google Scholar] [CrossRef]
- Chen, T.; Guestrin, C. XGBoost: A Scalable Tree Boosting System. In Proceedings of the 22nd ACM SIGKDD International Conference on Knowledge Discovery and Data Mining (KDD ’16), San Francisco, CA, USA, 13–17 August 2016; pp. 785–794. [Google Scholar] [CrossRef] [Green Version]
- Sagi, O.; Rokach, L. Approximating XGBoost with an interpretable decision tree. Inf. Sci. 2021, 572, 522–542. [Google Scholar] [CrossRef]
- Breiman, L. Random Forests. Mach. Learn. 2004, 45, 5–32. [Google Scholar] [CrossRef] [Green Version]
- Sun, J.; Yu, H.; Zhong, G.; Dong, J.; Zhang, S.; Yu, H. Random Shapley Forests: Cooperative Game-Based Random Forests with Consistency. IEEE Trans. Cybern. 2022, 52, 205–214. [Google Scholar] [CrossRef] [PubMed]
- Genuer, R.; Poggi, J.; Tuleau-Malot, C.; Villa-Vialaneix, N. Random Forests for Big Data. Big Data Res. 2017, 9, 28–46. [Google Scholar] [CrossRef] [Green Version]
- Biau, G. Analysis of a Random Forests Model. J. Mach. Learn. Res. 2012, 13, 1063–1095. [Google Scholar] [CrossRef]
- Ke, G.; Meng, Q.; Finley, T.; Wang, T.; Chen, W.; Ma, W.; Ye, Q.; Liu, T. LightGBM: A Highly Efficient Gradient Boosting Decision Tree. In Proceedings of the 31st International Conference on Neural Information Processing Systems (NIPS ’17), Long Beach, CA, USA, 4–9 December 2017; pp. 3149–3157. [Google Scholar] [CrossRef]
- Bentéjac, C.; Csörgo, A.; Martínez-Muñoz, G. A comparative analysis of gradient boosting algorithms. Artif. Intell. Rev. 2020, 54, 1937–1967. [Google Scholar] [CrossRef]
- Wen, Z.; Shi, J.; He, B.; Chen, J. Exploiting GPUs for Efficient Gradient Boosting Decision Tree Training. IEEE Trans. Parallel Distrib. Syst. 2019, 30, 2706–2717. [Google Scholar] [CrossRef]
- Freund, Y.; Schapire, R.E. A Decision-Theoretic Generalization of On-Line Learning and an Application to Boosting. J. Comput. Syst. Sci. 1997, 55, 119–139. [Google Scholar] [CrossRef] [Green Version]
- Naderpour, H.; Mirrashid, M. Estimating the compressive strength of eco-friendly concrete incorporating recycled coarse aggregate using neuro-fuzzy approach. J. Clean. Prod. 2020, 265, 121886. [Google Scholar] [CrossRef]
- Guo, R.; Fu, D.; Sollazzo, G. An ensemble learning model for asphalt pavement performance prediction based on gradient boosting decision tree. Int. J. Pavement Eng. 2021, 23, 3633–3646. [Google Scholar] [CrossRef]
- Chai, T.; Draxler, R.R. Root mean square error (RMSE) or mean absolute error (MAE)? Geosci. Model Dev. Discuss. 2014, 7, 1247–1250. [Google Scholar] [CrossRef] [Green Version]
- Nguyen, N.; Tong, K.; Lee, S.; Karamanli, A.; Vo, T. Prediction compressive strength of cement-based mortar containing metakaolin using explainable Categorical Gradient Boosting model. Eng. Struct. 2022, 269, 114768. [Google Scholar] [CrossRef]
- Kumar, M.; Namrata, K.; Kumari, N. Hyper-parametric improved machine learning models for solar radiation forecasting. Concurr. Comput. Pract. Exp. 2022, 34, e7190. [Google Scholar] [CrossRef]
- Peng, Y.; Gong, D.; Deng, C.; Li, H.; Cai, H.; Zhang, H. An automatic hyperparameter optimization DNN model for precipitation prediction. Appl. Intell. 2022, 52, 2703–2719. [Google Scholar] [CrossRef]
- Dissanayake, M.; Nguyen, H.; Poologanathan, K.; Perampalam, G.; Upasiri, I.; Rajanayagam, H.; Suntharalingam, T. Prediction of shear capacity of steel channel sections using machine learning algorithms. Thin-Walled Struct. 2022, 175, 109152. [Google Scholar] [CrossRef]
- Mi, J.; Li, A.; Zhou, L. Review Study of Interpretation Methods for Future Interpretable Machine Learning. IEEE Access 2020, 8, 191969–191985. [Google Scholar] [CrossRef]
- Sun, X.; Liu, Y.; Li, J.; Zhu, J.; Liu, X.; Chen, H. Using cooperative game theory to optimize the feature selection problem. Neurocomputing 2012, 97, 86–93. [Google Scholar] [CrossRef]
- Ribeiro, M.T.; Singh, S.; Guestrin, C. “Why Should I Trust You?”: Explaining the Predictions of Any Classifier. ACM 2016, 1135–1144. [Google Scholar] [CrossRef]
- Shen, L.; Shen, Y.; Liang, S. Reliability Analysis of RC Slab-Column Joints under Punching Shear Load Using a Machine Learning-Based Surrogate Model. Buildings 2022, 12, 1750. [Google Scholar] [CrossRef]
- Sun, C.; Chen, L.; Xiao, J.; Multani, A.; Zeng, J. Compound utilization of construction and industrial waste as cementitious recycled powder in mortar. Resour. Conserv. Recycl. 2021, 170, 105561. [Google Scholar] [CrossRef]
- Kim, Y.J.; Choi, Y.W. Utilization of waste concrete powder as a substitution material for cement. Constr. Build. Mater. 2012, 30, 500–504. [Google Scholar] [CrossRef]
- Tenza-Abril, A.; Villacampa, Y.; Solak, A.; Baeza-Brotons, F. Prediction and sensitivity analysis of compressive strength in segregated lightweight concrete based on artificial neural network using ultrasonic pulse velocity. Constr. Build. Mater. 2018, 189, 1173–1183. [Google Scholar] [CrossRef]
- Xue, C.; Qiao, H.; Cao, H.; Feng, Q.; Li, Q. Analysis on the Strength of Cement Mortar Mixed with Construction Waste Brick Powder. Adv. Civ. Eng. 2021, 2021, 8871280. [Google Scholar] [CrossRef]
- Zhang, X. Experimental Study on the Utilization of Renewable Micron. Master’s Thesis, Qingdao Technological University, Qingdao, China, 2015. [Google Scholar] [CrossRef]
- Wang, H.; Xia, Y. Influence of Recycled Fine Powder on Shrink-Age Cracking of Concrete. Ind. Constr. 2016, 46, 122–125. [Google Scholar] [CrossRef]
- Liu, R. Experimental Study on the Construction Waste Clay Brick Powder as Active Admixture. Master’s Thesis, Xi’an University of Architecture and Technology, Xi’an, China, 2017. [Google Scholar] [CrossRef]
- Kang, X. Study on the Influence of the Particle Size Distribution of Recycled Concrete Powder on the Mechanical Properties and Microstructure of Recycled Mortar. Master’s Thesis, Qinghai University, Qinghai, China, 2019. [Google Scholar] [CrossRef]
- Xu, C.; Zhao, T.; Yu, F. Application of waste clay brick powder in grouting material. Concrete 2019, 71–75. [Google Scholar] [CrossRef]
- Zheng, L. Properties of Concrete with Recycled Clay-Brick-Powder. Master’s Thesis, Shandong University, Jinan, China, 2012. [Google Scholar] [CrossRef]
- Wang, Y.; Hao, W.; Wu, X.; Sun, R. Study on Mechanical Properties of Waste Clay-Brick-Powder Mortar. Low Temp. Archit. Technol. 2015, 37, 17–20. [Google Scholar] [CrossRef]
- Zhang, P.; Gu, L.; Wang, Q.; Chen, X. Study on the method of stimulating the activity of regenerated micro powder. China Concr. Cem. Prod. 2019, 2, 90–93. [Google Scholar] [CrossRef]
- Liu, Y.; Lu, C.; Zhang, H.; Li, J. Experimental Research on Cementitious Property of Renewable Powders of Construction Waste. China Powder Sci. Technol. 2015, 21, 33–36. [Google Scholar] [CrossRef]
- Ma, Y. Experimental study on proper-ties of recycled micro powder concrete mixed with construction waste. China Concr. Cem. Prod. 2016, 3, 88–90. [Google Scholar] [CrossRef]
- Fan, Y.; Li, Y.; Kang, X. Effect of Regenerated Powder and Fly Ash on Mechanical Properties and Microstructure of Mortar. Bull. Chin. Ceram. Soc. 2019, 38, 537–542. [Google Scholar] [CrossRef]
- Gao, S. Full-component of Waste Cement and Utilization of Recycled Concrete. Master’s Thesis, China University of Mining and Technology, Xuzhou, China, 2019. [Google Scholar] [CrossRef]
- Li, S.; Chen, G.; Xu, Z.; Luo, X.; Gao, J. Particle-size effect of recycled clay brick powder on the pore structure of blended cement paste. Constr. Build. Mater. 2022, 344, 128288. [Google Scholar] [CrossRef]
- Ma, Z.; Tang, Q.; Wu, H.; Xu, J.; Liang, C. Mechanical properties and water absorption of cement composites with various fineness and contents of waste brick powder from C & D waste. Cem. Concr. Compos. 2022, 114, 103758. [Google Scholar] [CrossRef]
- Wu, H.; Yang, D.; Xu, J.; Liang, C.; Ma, Z. Water transport and resistance improvement for the cementitious composites with eco-friendly powder from various concrete wastes. Constr. Build. Mater. 2021, 290, 123247. [Google Scholar] [CrossRef]
- Wu, H.; Liang, C.; Wang, C.; Ma, Z. Properties of green mortar blended with waste concrete-brick powder at various components, replacement ratios and particle sizes. Constr. Build. Mater. 2022, 342, 128050. [Google Scholar] [CrossRef]
- Duan, Z.; Hou, S.; Xiao, J.; Li, B. Study on the essential properties of recycled powders from construction and demolition waste. J. Clean. Prod. 2022, 253, 119865. [Google Scholar] [CrossRef]
- Li, S.; Gao, J.; Li, Q.; Zhao, X. Investigation of using recycled powder from the preparation of recycled aggregate as a supplementary cementitious material. Constr. Build. Mater. 2022, 267, 120976. [Google Scholar] [CrossRef]
- Yu, X.; Li, R.; Dong, X.; Li, G.; Zhang, S. Effect of Mechanical Force Grinding on the Properties of Recycled Powder. J. Synth. Cryst. 2017, 46, 688–692. [Google Scholar] [CrossRef]
- Li, Z. Effect of Recycled Fine Powder/Aggregate Modification on Cement-Based Materials and Its Application. Master’s Thesis, Zhongyuan University of Technology, Zhengzhou, China, 2022. [Google Scholar] [CrossRef]
- Yang, L. Investigation on Recycled Cementitious Materials Preparing with Recycled Concrete Powder. Master’s Thesis, Southeast University, Nanjing, China, 2016. Available online: https://kns.cnki.net/KCMS/detail/detail.aspx?dbname=CMFD201701&filename=1016328459.nh (accessed on 3 June 2016).
- Wu, H.; Liang, C.; Xiao, J.; Xu, J.; Ma, Z. Early-age behavior and mechanical properties of cement-based materials with various types and fineness of recycled powder. Struct. Concr. 2021, 23, 1253–1272. [Google Scholar] [CrossRef]


| Hyperparameters | Potential Values | ||
|---|---|---|---|
| ML Models | Number of Weak Learners | Learning Rate | Maximum Depth |
| XGBoost | 50, 60, 70, …, 200 | 0.1, 0.2, 0.3, …, 1 | 1, 2, 3, …, 10 |
| RF | 50, 60, 70, …, 200 | - | 1, 2, 3, …, 20 |
| LightGBM | 50, 60, 70, …, 200 | 0.1, 0.2, 0.3, …, 1 | 1, 2, 3, …, 20 |
| AdaBoost | 50, 60, 70, …, 200 | 0.1, 0.2, 0.3, …, 1 | - |
| Hyperparameters | Values | |||
|---|---|---|---|---|
| ML Models | Number of Weak Learners | Learning Rate | Maximum Depth | Average Validation Outcome |
| XGBoost | 100 | 0.1 | 6 | 0.75 |
| RF | 100 | - | 10 | 0.646 |
| LightGBM | 100 | 0.4 | 15 | 0.701 |
| AdaBoost | 100 | 0.3 | - | 0.628 |
| Data Set | Training Set | Test Set | ||||||
|---|---|---|---|---|---|---|---|---|
| ML Models | XGBoost | RF | AdaBoost | LightGBM | XGBoost | RF | AdaBoost | LightGBM |
| R2 | 0.950 | 0.928 | 0.708 | 0.818 | 0.842 | 0.823 | 0.762 | 0.825 |
| RMSE | 2.155 | 2.591 | 5.217 | 4.121 | 4.285 | 4.538 | 5.26 | 4.515 |
| MAE | 1.569 | 2.009 | 4.223 | 3.163 | 3.182 | 3.581 | 4.314 | 3.441 |
| a10-index | 0.926 | 0.822 | 0.509 | 0.718 | 0.659 | 0.585 | 0.439 | 0.585 |
Disclaimer/Publisher’s Note: The statements, opinions and data contained in all publications are solely those of the individual author(s) and contributor(s) and not of MDPI and/or the editor(s). MDPI and/or the editor(s) disclaim responsibility for any injury to people or property resulting from any ideas, methods, instructions or products referred to in the content. |
© 2023 by the authors. Licensee MDPI, Basel, Switzerland. This article is an open access article distributed under the terms and conditions of the Creative Commons Attribution (CC BY) license (https://creativecommons.org/licenses/by/4.0/).
Share and Cite
Fei, Z.; Liang, S.; Cai, Y.; Shen, Y. Ensemble Machine-Learning-Based Prediction Models for the Compressive Strength of Recycled Powder Mortar. Materials 2023, 16, 583. https://doi.org/10.3390/ma16020583
Fei Z, Liang S, Cai Y, Shen Y. Ensemble Machine-Learning-Based Prediction Models for the Compressive Strength of Recycled Powder Mortar. Materials. 2023; 16(2):583. https://doi.org/10.3390/ma16020583
Chicago/Turabian StyleFei, Zhengyu, Shixue Liang, Yiqing Cai, and Yuanxie Shen. 2023. "Ensemble Machine-Learning-Based Prediction Models for the Compressive Strength of Recycled Powder Mortar" Materials 16, no. 2: 583. https://doi.org/10.3390/ma16020583