
Kinetics and Modeling of Counter-Current Leaching of Waste Random-Access Memory Chips in a Cu-NH3-SO4 System Utilizing Cu(II) as an Oxidizer


Abstract
:1. Introduction
- Evaluation of Cu ammoniacal leaching using end-of-life PCBs under anaerobic conditions;
- Design of experiments to determine leaching kinetics and kinetic model selection according to goodness of fit, considering the initial Cu(II) concentrations, particle sizes, stirring rates, and temperatures as the primary experimental factors.
- Extending the determined experimental model into one that can be utilized in a counter-current leaching model.
- Development of a counter-current leaching model utilizing the kinetic leaching expression.
2. Materials and Methods
2.1. Theoretical Framework
2.1.1. Part 1—Development of Cu Leaching Kinetics via Experimentation
2.1.2. Part 2—Adaptation of Kinetics to Counter-Current Flow and Stirred Reactors
2.1.3. Part 3—Application of Developed Model of a CCL Model
2.2. Waste RAM Chips
2.3. Leaching Experiments Pertaining to Part 1
2.4. Chemical Assay and Analytical Methods
3. Results and Discussions
3.1. Element Composition in Waste Chips
3.2. Effect of Leaching Parameters (Stirring Rate, Particle Size, Cu(II) Concentration, and Temperature)
3.3. Kinetic Modeling Fitting Corresponding to Part 1
3.4. Modeling Leaching in a Counter-Current Circuit as It Relates to Part 3
4. Conclusions
Author Contributions
Funding
Institutional Review Board Statement
Informed Consent Statement
Data Availability Statement
Acknowledgments
Conflicts of Interest
References
- Ning, C.; Lin, C.S.K.; Hui, D.C.W.; McKay, G. Waste Printed Circuit Board (PCB) Recycling Techniques. Top. Curr. Chem. 2017, 375, 43. [Google Scholar] [CrossRef]
- Lin, P.; Werner, J.; Groppo, J.; Yang, X. Material Characterization and Physical Processing of a General Type of Waste Printed Circuit Boards. Sustainability 2022, 14, 13479. [Google Scholar] [CrossRef]
- Oishi, T.; Koyama, K.; Alam, S.; Tanaka, M.; Lee, J.C. Recovery of High Purity Copper Cathode from Printed Circuit Boards Using Ammoniacal Sulfate or Chloride Solutions. Hydrometallurgy 2007, 89, 82–88. [Google Scholar] [CrossRef]
- Golev, A.; Corder, G.D. Quantifying Metal Values in E-Waste in Australia: The Value Chain Perspective. Miner. Eng. 2017, 107, 81–87. [Google Scholar] [CrossRef]
- Li, Z.; Diaz, L.A.; Yang, Z.; Jin, H.; Lister, T.E.; Vahidi, E.; Zhao, F. Comparative Life Cycle Analysis for Value Recovery of Precious Metals and Rare Earth Elements from Electronic Waste. Resour. Conserv. Recycl. 2019, 149, 20–30. [Google Scholar] [CrossRef]
- Mitovski, A.; Štrbac, N.; Živković, D.; Balanović, L.; Manasijević, D.; Sokić, M.; Grekulović, V.; Nikolić, R. A Comparative Review of Pyrometallurgical and Hydrometallurgical Processes of Copper Production from E-Waste Based on Environmental and Economic Parameters. In Proceedings of the 4th International Symposium on Environmental and Material Flow Management, Bor’s Lake, Serbia, 31 October–2 November 2014. [Google Scholar]
- Sun, Z.; Xiao, Y.; Sietsma, J.; Agterhuis, H.; Visser, G.; Yang, Y. Selective Copper Recovery from Complex Mixtures of End-of-Life Electronic Products with Ammonia-Based Solution. Hydrometallurgy 2015, 152, 91–99. [Google Scholar] [CrossRef]
- Radmehr, V.; Koleini, S.M.J.; Khalesi, M.R.; Tavakoli Mohammadi, M.R. Ammonia Leaching: A New Approach of Copper Industry in Hydrometallurgical Processes. J. Inst. Eng. (India) Ser. D 2013, 94, 95–104. [Google Scholar] [CrossRef]
- Radmehr, V.; Koleini, S.M.J.; Khalesi, M.R.; Mohammadi, M.R.T. Ammonia Leaching in the Copper Industry: A Review. In Proceedings of the 26th International Mineral Processing Congress, IMPC 2012: Innovative Processing for Sustainable Growth—Conference Proceedings, New Delhi, India, 24–28 September 2012; pp. 2512–2523. [Google Scholar]
- Rudnik, E.; Pierzynka, M.; Handzlik, P. Ammoniacal Leaching and Recovery of Copper from Alloyed Low-Grade e-Waste. J. Mater. Cycles Waste Manag. 2016, 18, 318–328. [Google Scholar] [CrossRef]
- Konishi, H. Selective separation and recovery of copper from iron and copper mixed waste by ammonia solution. ISIJ Int. 2007, 36, 73–79. [Google Scholar]
- Li, H.; Eksteen, J.; Oraby, E. Hydrometallurgical Recovery of Metals from Waste Printed Circuit Boards (WPCBs): Current Status and Perspectives—A Review. Resour. Conserv. Recycl. 2018, 139, 122–139. [Google Scholar] [CrossRef]
- Bari, F.; Begum, M.N.; Jamaludin, B.; Hussin, K. Selective Leaching for the Recovery of Copper From PCB; School of Materials Engineering, University Malaysia Perlis: Perlis, Malaysia, 2009; Volume 1. [Google Scholar]
- Koyama, K.; Tanaka, M.; Lee, J.C. Copper Leaching Behavior from Waste Printed Circuit Board in Ammoniacal Alkaline Solution. Mater. Trans. 2006, 47, 1788–1792. [Google Scholar] [CrossRef]
- Xiao, Y.; Yang, Y.; Van Den Berg, J.; Sietsma, J.; Agterhuis, H.; Visser, G.; Bol, D. Hydrometallurgical Recovery of Copper from Complex Mixtures of End-of-Life Shredded ICT Products. Hydrometallurgy 2013, 140, 128–134. [Google Scholar] [CrossRef]
- Oishi, T.; Koyama, K.; Konishi, H.; Tanaka, M.; Lee, J.C. Influence of Ammonium Salt on Electrowinning of Copper from Ammoniacal Alkaline Solutions. Electrochim. Acta 2007, 53, 127–132. [Google Scholar] [CrossRef]
- Alam, M.S.; Tanaka, M.; Koyama, K.; Oishi, T.; Lee, J.C. Electrolyte Purification in Energy-Saving Monovalent Copper Electrowinning Processes. Hydrometallurgy 2007, 87, 36–44. [Google Scholar] [CrossRef]
- Oishi, T.; Yaguchi, M.; Koyama, K.; Tanaka, M.; Lee, J.C. Effect of Phosphate on Lead Removal during a Copper Recycling Process from Wastes Using Ammoniacal Chloride Solution. Hydrometallurgy 2008, 90, 161–167. [Google Scholar] [CrossRef]
- Oishi, T.; Yaguchi, M.; Koyama, K.; Tanaka, M.; Lee, J.C. Hydrometallurgical Process for the Recycling of Copper Using Anodic Oxidation of Cuprous Ammine Complexes and Flow-through Electrolysis. Electrochim. Acta 2008, 53, 2585–2592. [Google Scholar] [CrossRef]
- Koyama, K.; Tanaka, M.; Miyasaka, Y.; Lee, J.C. Electrolytic Copper Deposition from Ammoniacal Alkaline Solution Containing Cu(I). Mater. Trans. 2006, 47, 2076–2080. [Google Scholar] [CrossRef]
- Werner, J.M. Electrowinning Cells for the Segregation of the Cathodic and Anodic Compartments. WO2021159086 A1, 12 August 2021. [Google Scholar]
- Sun, Z.; Cao, H.; Venkatesan, P.; Jin, W.; Xiao, Y.; Sietsma, J.; Yang, Y. Electrochemistry during Efficient Copper Recovery from Complex Electronic Waste Using Ammonia Based Solutions. Front. Chem. Sci. Eng. 2017, 11, 308–316. [Google Scholar] [CrossRef]
- Werner, J.M. Single Stage Clarifier and Mixing Assembly. U.S. Patent US11207614B2, 28 December 2021. [Google Scholar]
- Werner, J.M. Single Stage Clarifier and Mixing Assembly. U.S. Patent US11596912B2, 7 March 2023. [Google Scholar]
- Klumpar, I.V. Computer Modeling of Multistage, Countercurrent Leaching. TMS Pap. 1973. [Google Scholar]
- Liu, J.; Horio, M.; Muchi, I. The Mathematical Model of Multistage Countercurrent Leaching. J. Cent. South Inst. Min. Metall. 1983, 1, 1–7. [Google Scholar]
- Wadnerkar, D.; Tade, M.O.; Pareek, V.K.; Utikar, R.P. Modeling and Optimization of Carbon in Leach (CIL) Circuit for Gold Recovery. Miner. Eng. 2015, 83, 136–148. [Google Scholar] [CrossRef]
- Levenspiel, O. Chemical Reaction Engineering; John Wiley & Sons: Hoboken, NJ, USA, 1998; ISBN 047125424X. [Google Scholar]
- Free, M. Hydrometallurgy: Fundamentals and Applications; John Wiley & Sons, Inc.: Hoboken, NJ, USA, 2013; ISBN 9781118230770. [Google Scholar]
- Bingöl, D.; Canbazoǧlu, M.; Aydoǧan, S. Dissolution Kinetics of Malachite in Ammonia/Ammonium Carbonate Leaching. Hydrometallurgy 2005, 76, 55–62. [Google Scholar] [CrossRef]
- Baba, A.A.; Ghosh, M.K.; Pradhan, S.R.; Rao, D.S.; Baral, A.; Adekola, F.A. Characterization and Kinetic Study on Ammonia Leaching of Complex Copper Ore. Trans. Nonferrous Met. Soc. China (Engl. Ed.) 2014, 24, 1587–1595. [Google Scholar] [CrossRef]
- Liu, Z.X.; Yin, Z.L.; Xiong, S.F.; Chen, Y.G.; Chen, Q.Y. Leaching and Kinetic Modeling of Calcareous Bornite in Ammonia Ammonium Sulfate Solution with Sodium Persulfate. Hydrometallurgy 2014, 144–145, 86–90. [Google Scholar] [CrossRef]
- Liu, W.; Tang, M.; Tang, C.; He, J.; Yang, S.; Yang, J. Dissolution Kinetics of Low Grade Complex Copper Ore in Ammonia-Ammonium Chloride Solution. Trans. Nonferrous Met. Soc. China (Engl. Ed.) 2010, 20, 910–917. [Google Scholar] [CrossRef]
- Ghosh, M.K.; Das, R.P.; Biswas, A.K. Oxidative Ammonia Leaching of Sphalerite Part I: Noncatalytic Kinetics. Int. J. Miner. Process. 2002, 66, 241–254. [Google Scholar] [CrossRef]
- Ghosh, M.K.; Das, R.P.; Biswas, A.K. Oxidative Ammonia Leaching of Sphalerite Part II: Cu(II)-Catalyzed Kinetics. Int. J. Miner. Process. 2003, 70, 221–234. [Google Scholar] [CrossRef]
- Oluokun, O.O.; Otunniyi, I.O. Kinetic Analysis of Cu and Zn Dissolution from Printed Circuit Board Physical Processing Dust under Oxidative Ammonia Leaching. Hydrometallurgy 2020, 193, 105320. [Google Scholar] [CrossRef]
- Dickinson, C.F.; Heal, G.R. Solid-Liquid Diffusion Controlled Rate Equations. Thermochim. Acta 1999, 340–341, 89–103. [Google Scholar] [CrossRef]
- Zhuravlev, V.F.; Lesokhin, I.G.; Tempelman, R.G. Kinetics of Reactions in the Formation of Aluminates and the Contribution of Mineralizers to the Process. J. Appl. Chem. USSR 1948, 21, 887–890. [Google Scholar]
- Jander, W. Reactions in the Solid State at High Temperatures. Z. Anorg. Allg. Chem. 1927, 163, 1–30. [Google Scholar] [CrossRef]
- Sun, Z.; Xiao, Y.; Sietsma, J.; Agterhuis, H.; Yang, Y. A Cleaner Process for Selective Recovery of Valuable Metals from Electronic Waste of Complex Mixtures of End-of-Life Electronic Products. Environ. Sci. Technol. 2015, 49, 7981–7988. [Google Scholar] [CrossRef] [PubMed]
- Laidler, K.J. The Development of the Arrhenius Equation. J. Chem. Educ. 1984, 61, 494. [Google Scholar] [CrossRef]
- Gok, O.; Anderson, C.G.; Cicekli, G.; Ilknur Cocen, E. Leaching Kinetics of Copper from Chalcopyrite Concentrate in Nitrous-Sulfuric Acid. Physicochem. Probl. Miner. Process. 2014, 50, 399–413. [Google Scholar] [CrossRef]
- Rogozhnikov, D.; Karimov, K.; Shoppert, A.; Dizer, O.; Naboichenko, S. Kinetics and Mechanism of Arsenopyrite Leaching in Nitric Acid Solutions in the Presence of Pyrite and Fe(III) Ions. Hydrometallurgy 2021, 199, 105525. [Google Scholar] [CrossRef]
- Hidalgo, T.; Kuhar, L.; Beinlich, A.; Putnis, A. Kinetics and Mineralogical Analysis of Copper Dissolution from a Bornite/Chalcopyrite Composite Sample in Ferric-Chloride and Methanesulfonic-Acid Solutions. Hydrometallurgy 2019, 188, 140–156. [Google Scholar] [CrossRef]
- Lin, P. Recovery of Valuable Metals from Electronic Waste Using a Novel Ammonia-Based Hydrometallurgical Process. Ph.D. Thesis, University of Kentucky, Lexington, KY, USA, 2023. [Google Scholar]


| Leaching Agent | Sampling Time | Particle Size | Cu(II) Conc. | S/L Ratio | Temp. | Agitation | Ar Flow Rate |
|---|---|---|---|---|---|---|---|
| mol/L | min | mm | g/L | g/L | °C | rpm | L/min |
| 1 M (NH4)2SO4 and 4 M NH4OH | 15, 30, 60, 120, 240 and 480 | 1.2, 2.0, 3.4 | 10, 20, 30, 40 | 50 | 18, 25, 35, 45, 55, 65 | 450, 600, 750 | 0.1 |
| Al | Au | Bi | Co | Cr | Cu | Fe | Ga | Ge | Mg | Mn | Ni | Pb | Sb | Sn | Ta | Zn |
|---|---|---|---|---|---|---|---|---|---|---|---|---|---|---|---|---|
| ppm | ppm | ppm | ppm | ppm | %wt. | %wt. | ppm | ppm | ppm | ppm | %wt. | ppm | ppm | ppm | ppm | ppm |
| 8629 | 693 | 308 | 1224 | 447 | 30.97 | 1.81 | 102 | 116 | 472 | 775 | 1.53 | 2584 | 695 | 6448 | 39 | 338 |
| Dp | Zhuravlev Model |
|---|---|
| mm | |
| 1.2 | 0.9675 |
| 2.0 | 0.9924 |
| 3.4 | 0.9961 |
| Avg | 0.9853 |
| c(Cu2+) | Zhuravlev Model |
|---|---|
| g/L | |
| 10 | 0.8585 |
| 20 | 0.9908 |
| 30 | 0.9905 |
| 40 | 0.9924 |
| Avg | 0.9581 |
| Input | Symbol | Value | Unit |
|---|---|---|---|
| Rate coefficient (variable) | b | 0.001363 | Unitless |
| Feed particle size | R | 1 | mm |
| Leaching temperature | T | 293 | K |
| Initial Cu(II) concentration in solution | Cu(II) | 35 | g/L |
| Initial Cu(I) concentration in solution | Cu(I) | 5 | g/L |
| Initial Cu(0) concentration in feed | Cu(0) | 30 | %wt. |
| Lixiviant flow rate | Qlix | 500 | L/min |
| Mass flow of feed | Qfeed | 3.33 | t/h |
| Mass flow of Cu(0) | QCu(0) | 1 | t/h |
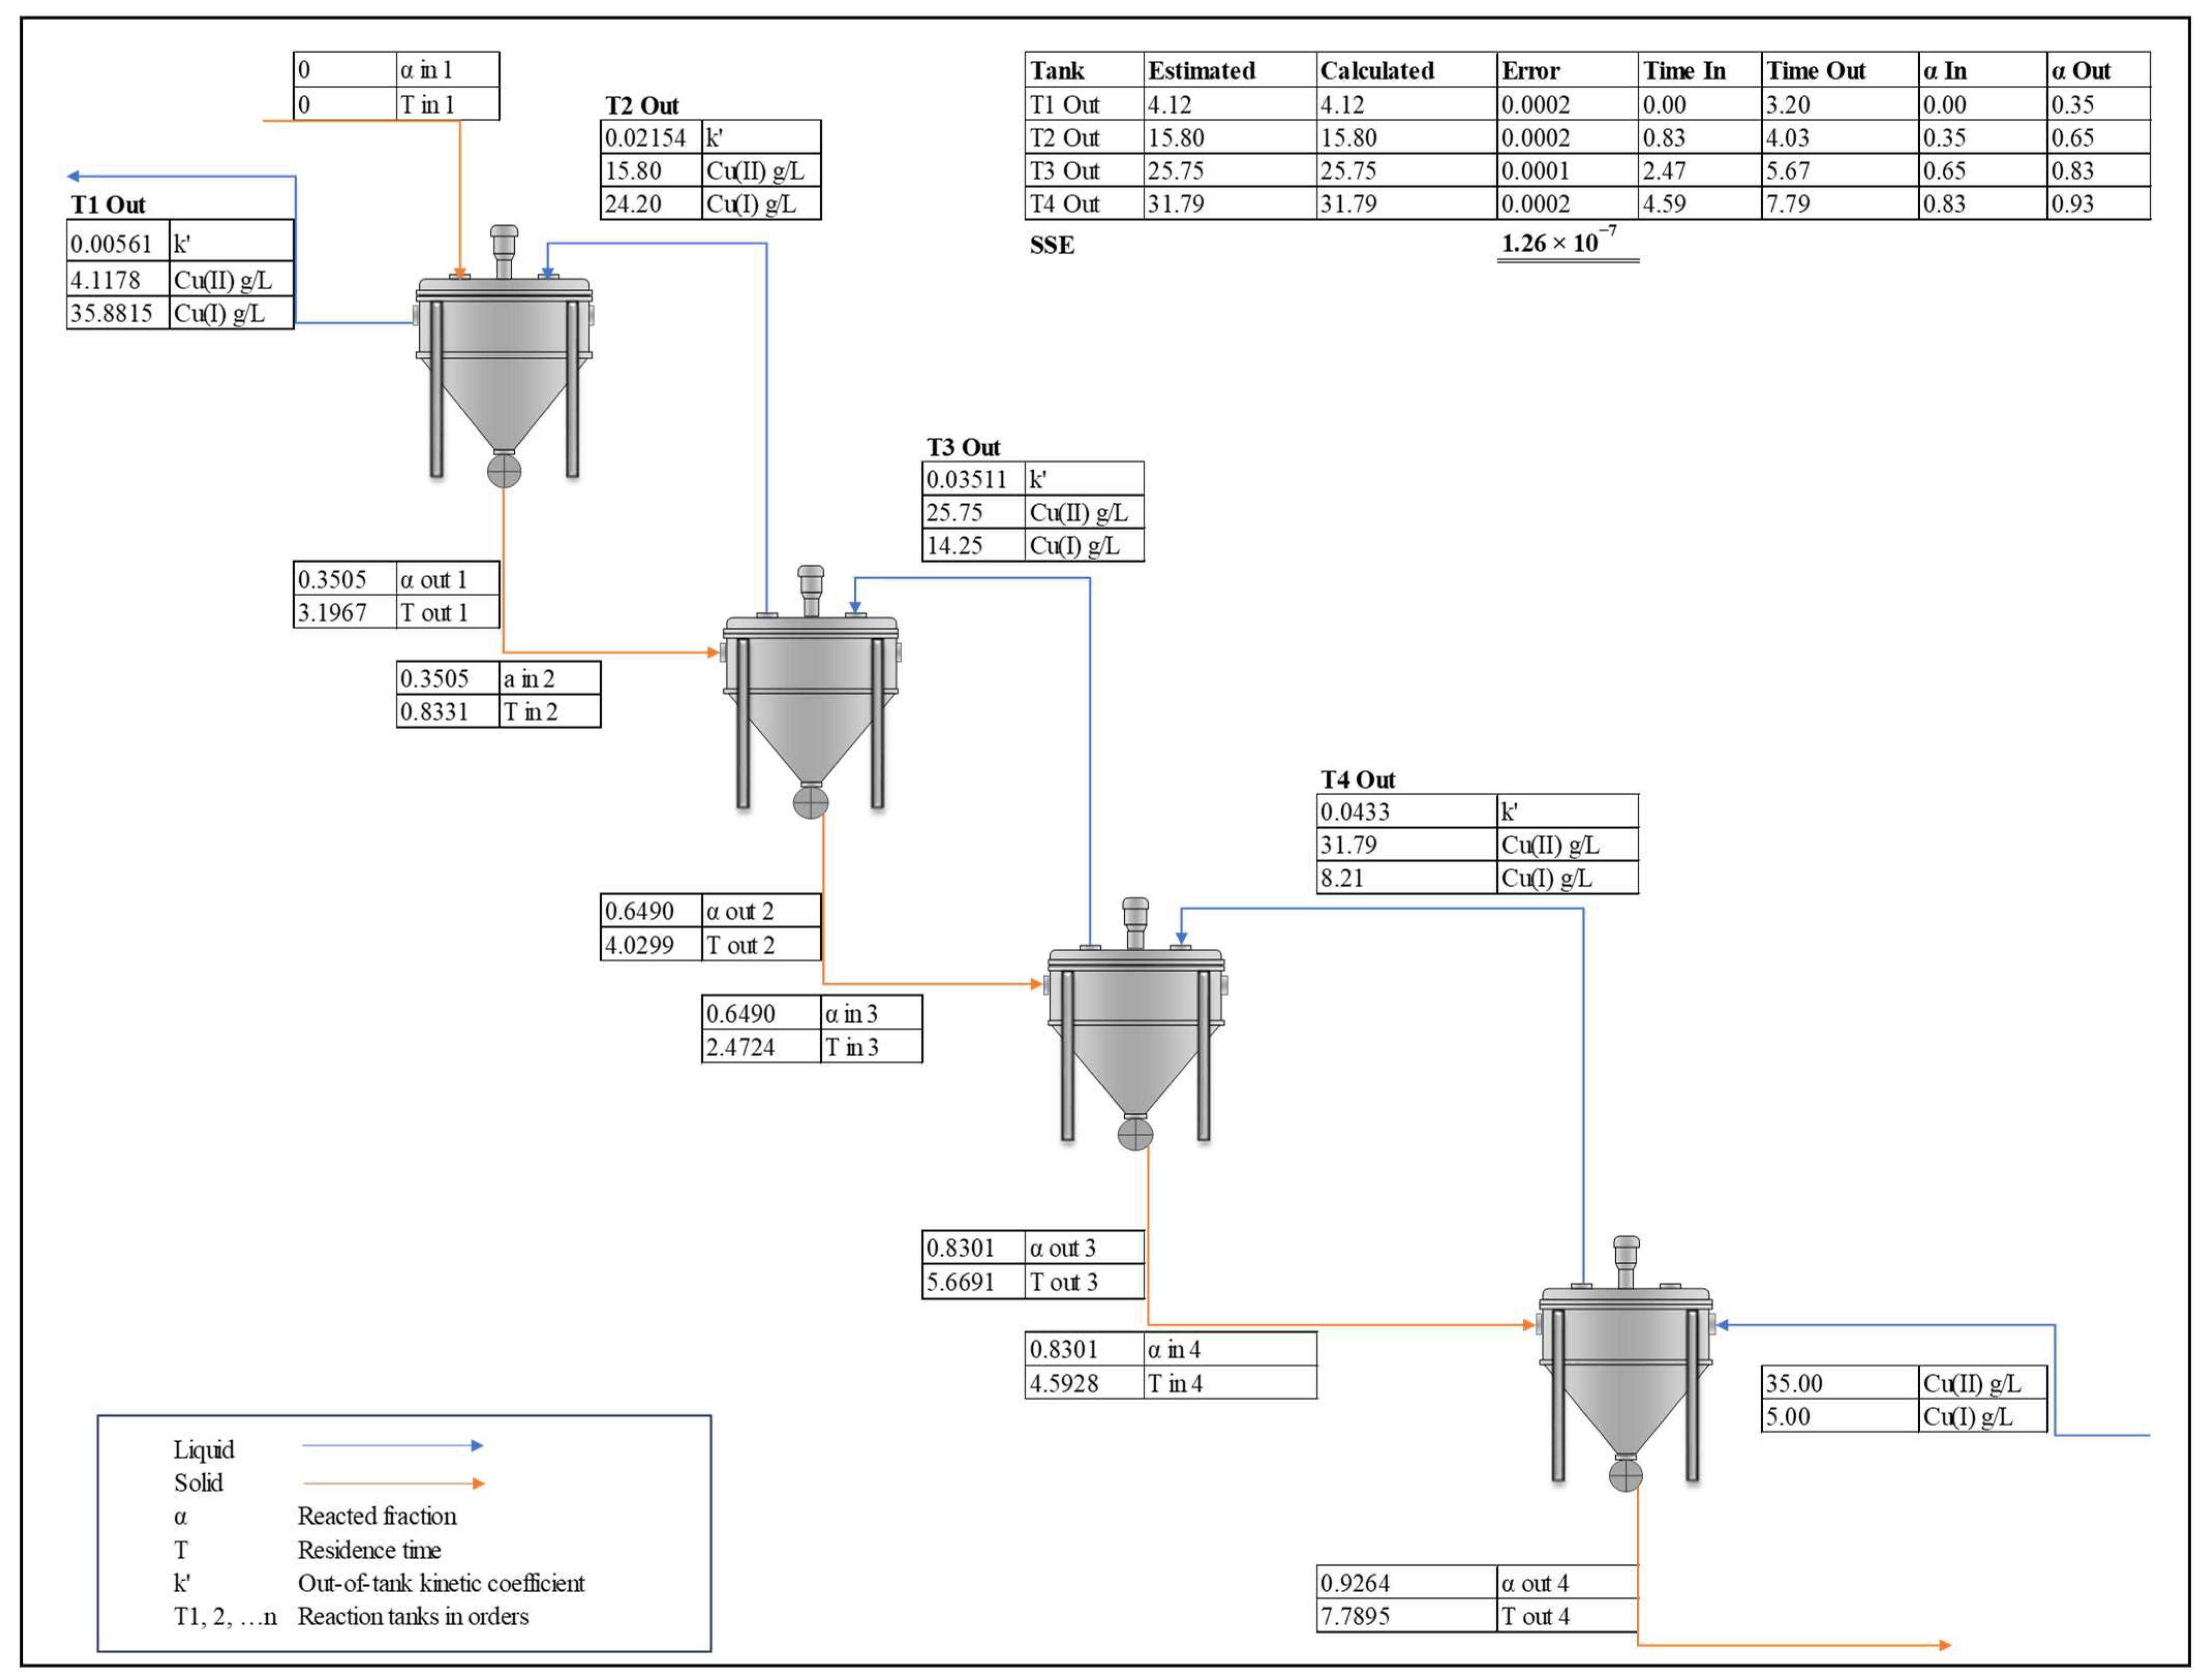
| Tank # | Effective Leaching Time (h) | [Cu2+]out (g/L) | Cumulative α |
|---|---|---|---|
| Tank 1 | 3.20 | 4.12 | 0.35 |
| Tank 2 | 4.03 | 15.80 | 0.65 |
| Tank 3 | 5.67 | 25.75 | 0.83 |
| Tank 4 | 7.79 | 31.79 | 0.93 |
Disclaimer/Publisher’s Note: The statements, opinions and data contained in all publications are solely those of the individual author(s) and contributor(s) and not of MDPI and/or the editor(s). MDPI and/or the editor(s) disclaim responsibility for any injury to people or property resulting from any ideas, methods, instructions or products referred to in the content. |
© 2023 by the authors. Licensee MDPI, Basel, Switzerland. This article is an open access article distributed under the terms and conditions of the Creative Commons Attribution (CC BY) license (https://creativecommons.org/licenses/by/4.0/).
Share and Cite
Lin, P.; Werner, J.; Ali, Z.A.; Bertucci, L.; Groppo, J. Kinetics and Modeling of Counter-Current Leaching of Waste Random-Access Memory Chips in a Cu-NH3-SO4 System Utilizing Cu(II) as an Oxidizer. Materials 2023, 16, 6274. https://doi.org/10.3390/ma16186274
Lin P, Werner J, Ali ZA, Bertucci L, Groppo J. Kinetics and Modeling of Counter-Current Leaching of Waste Random-Access Memory Chips in a Cu-NH3-SO4 System Utilizing Cu(II) as an Oxidizer. Materials. 2023; 16(18):6274. https://doi.org/10.3390/ma16186274
Chicago/Turabian StyleLin, Peijia, Joshua Werner, Zulqarnain Ahmad Ali, Lucas Bertucci, and Jack Groppo. 2023. "Kinetics and Modeling of Counter-Current Leaching of Waste Random-Access Memory Chips in a Cu-NH3-SO4 System Utilizing Cu(II) as an Oxidizer" Materials 16, no. 18: 6274. https://doi.org/10.3390/ma16186274