
Numerical Simulation of PFRC Fracture Subjected to High Temperature by Means of a Trilinear Softening Diagram


Abstract
:1. Introduction
2. PFRC Performance at High Temperature
3. Numerical Simulation of Fracture
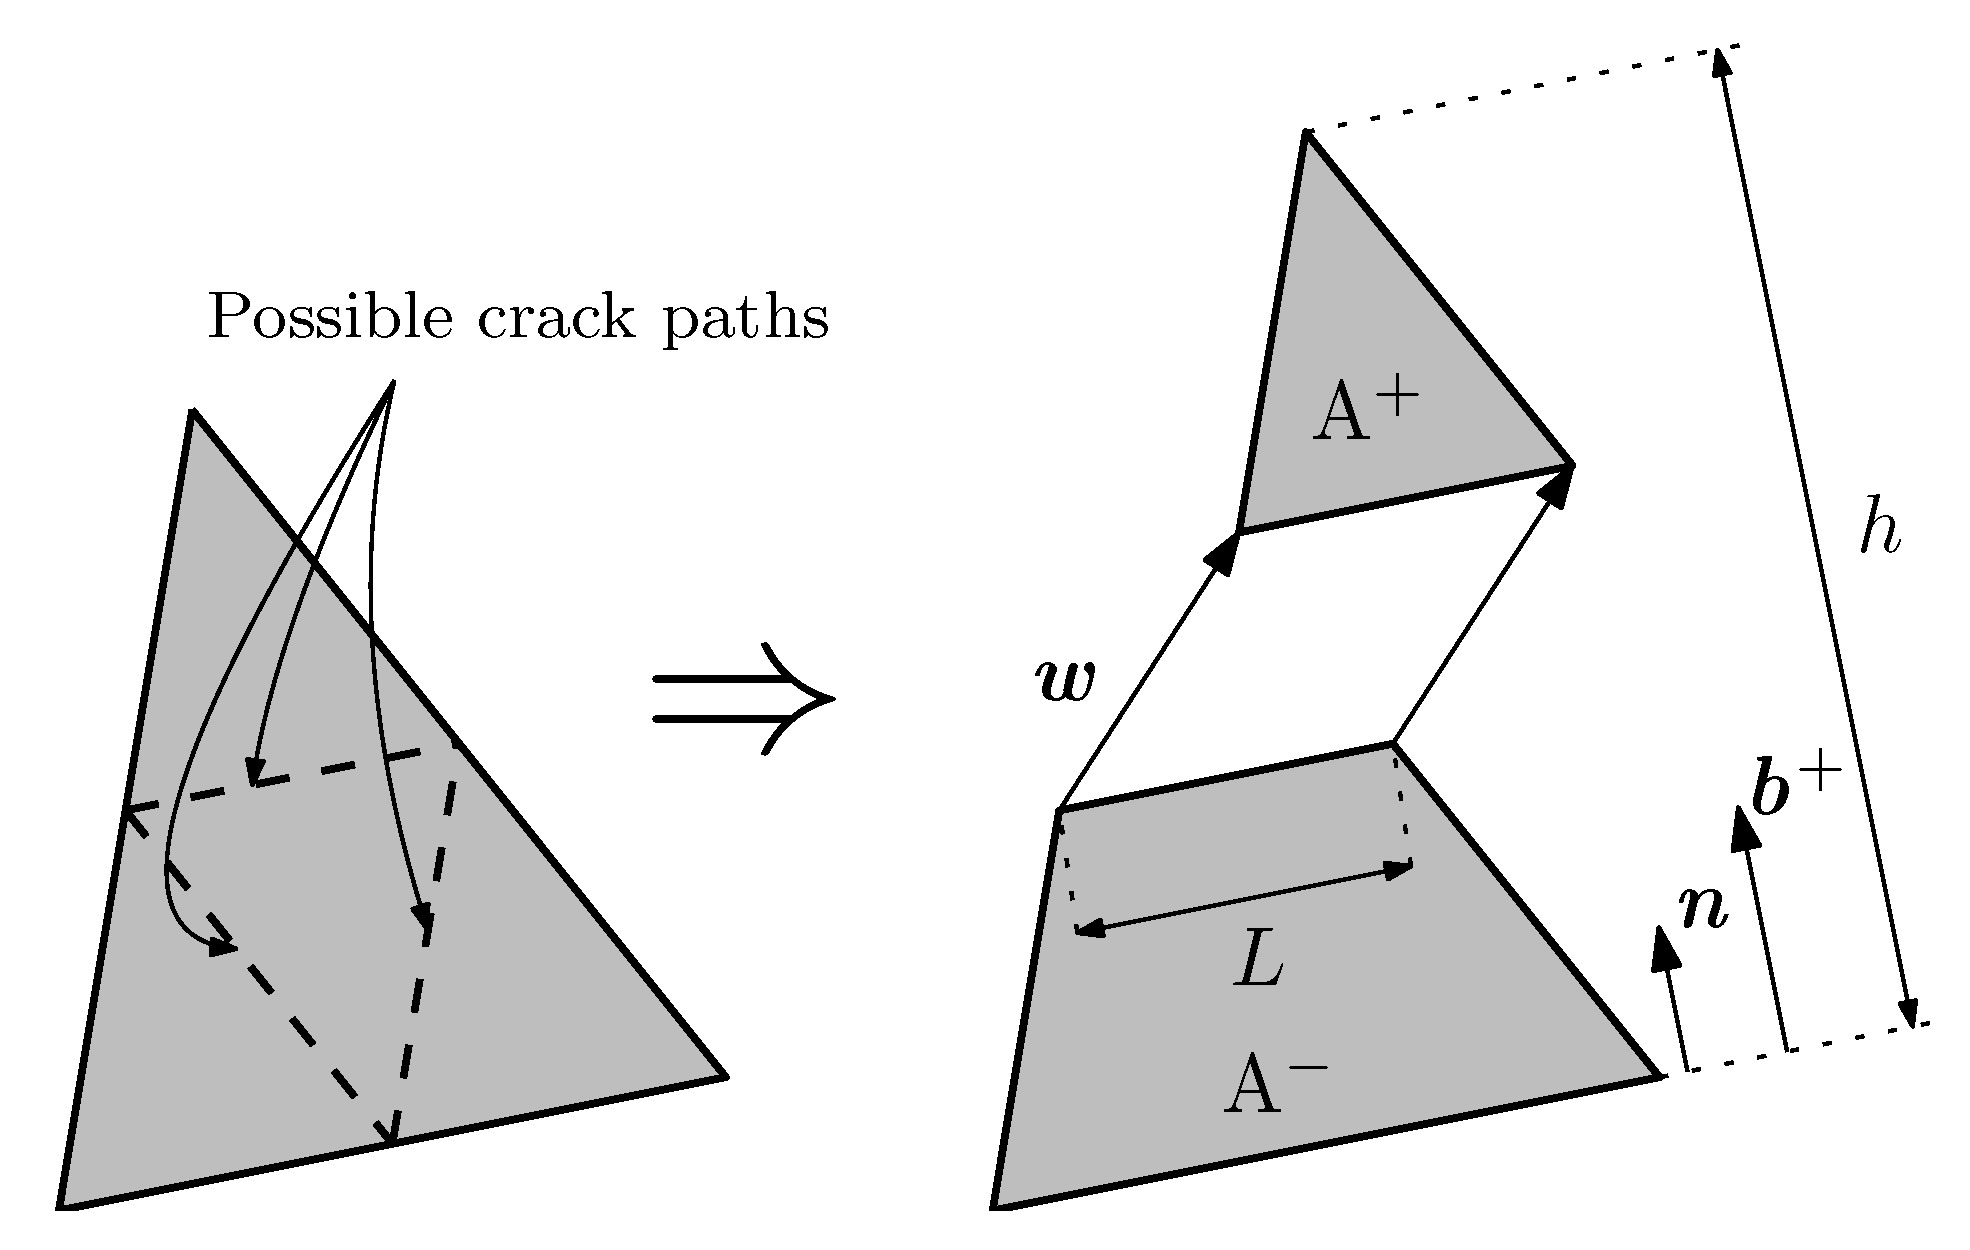
3.1. Embedded Crack Model
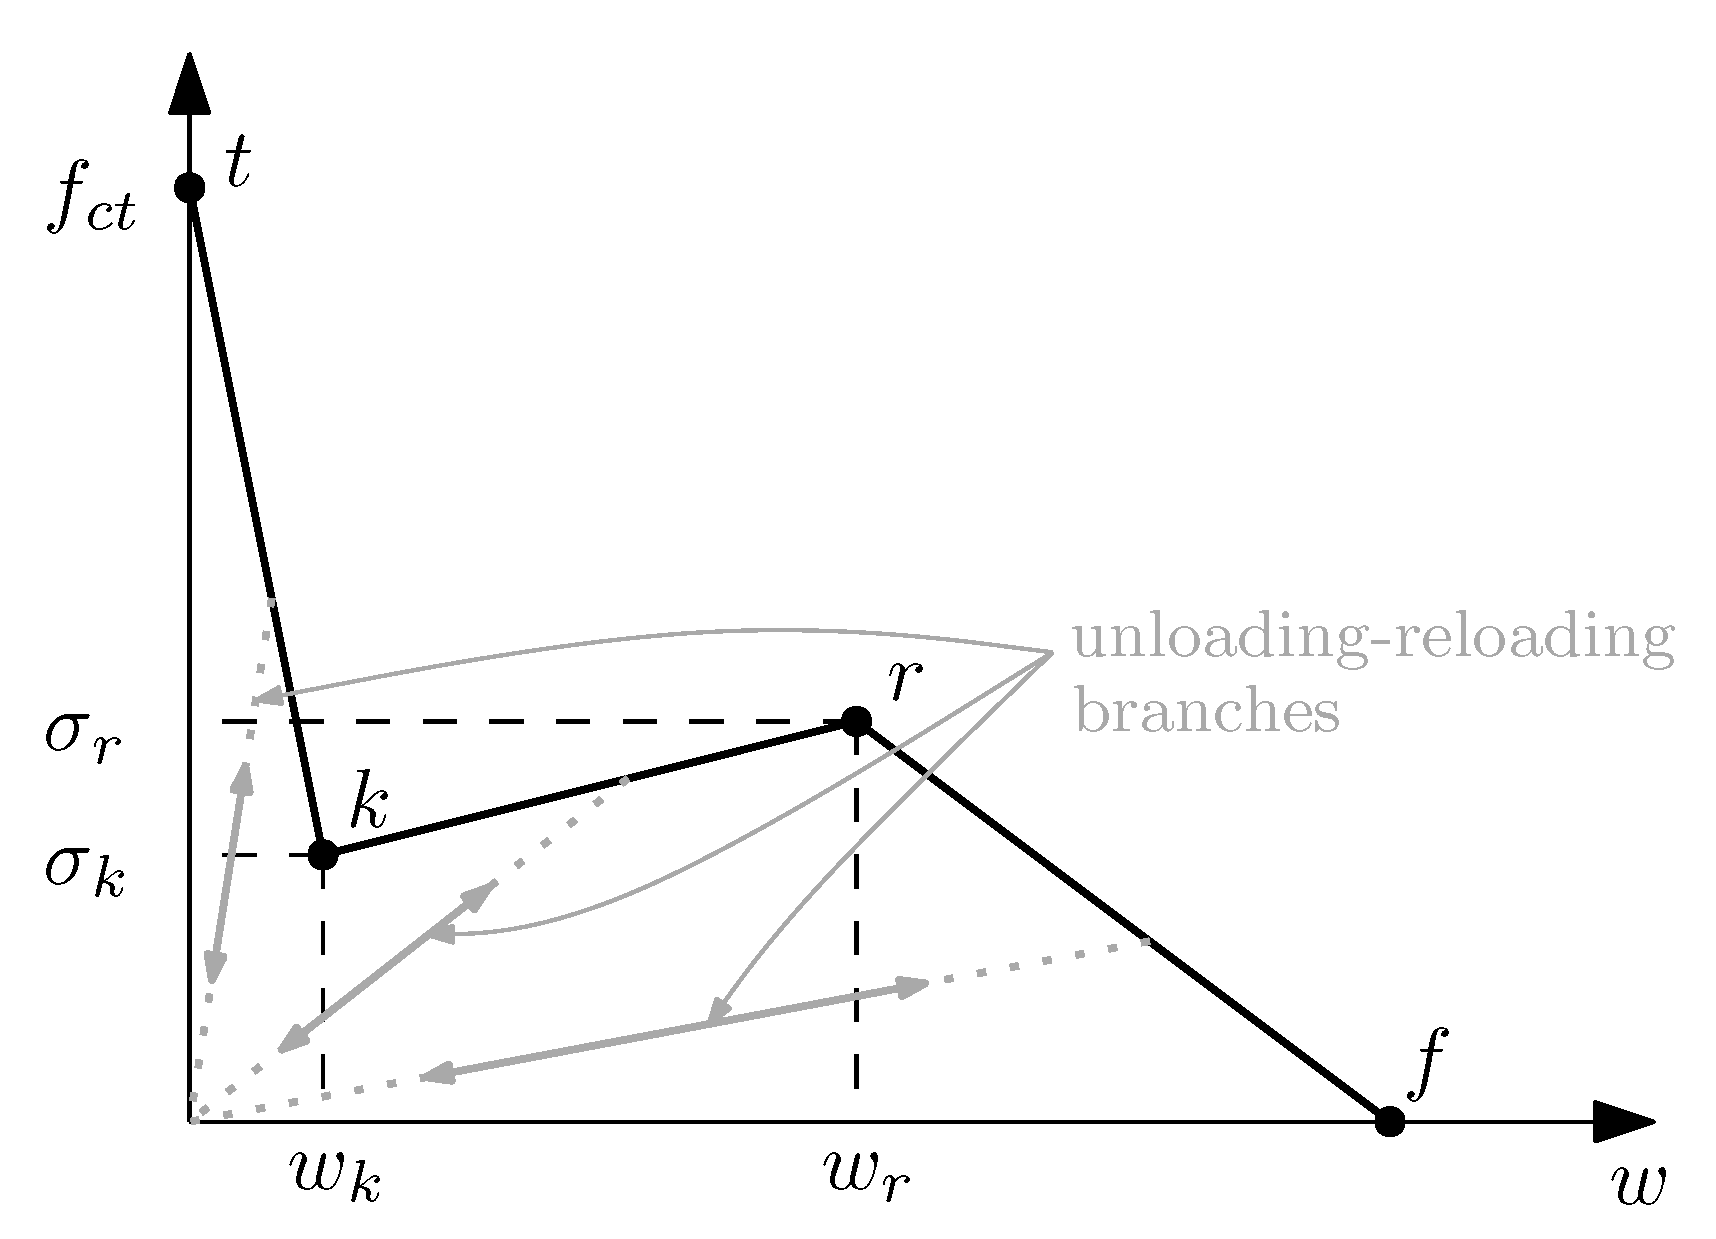
3.2. Trilinear Softening Diagram
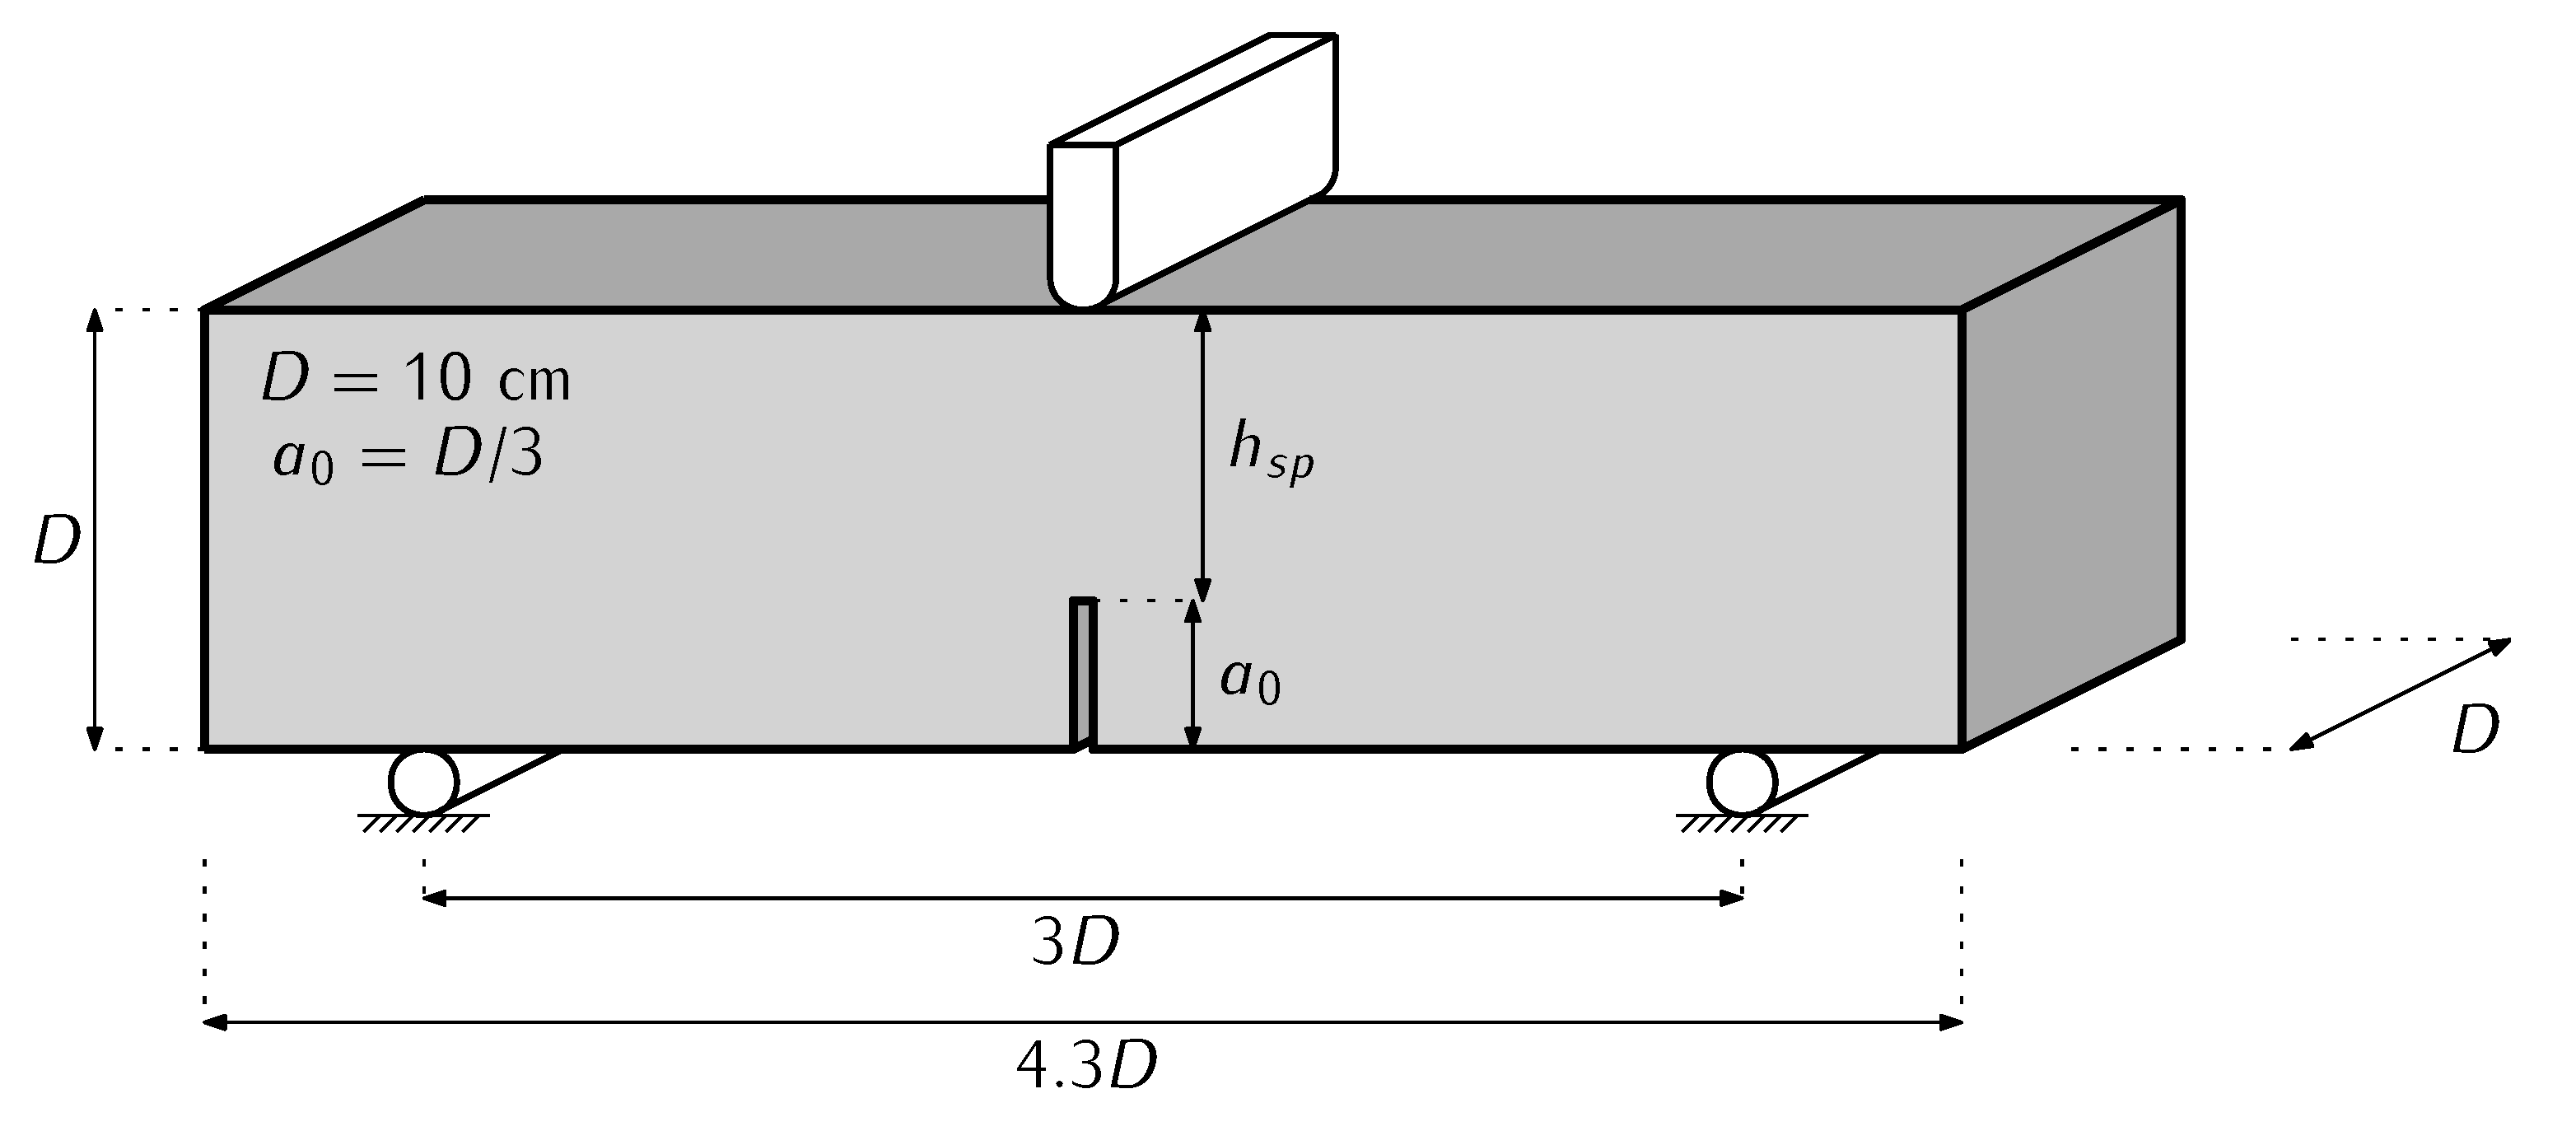
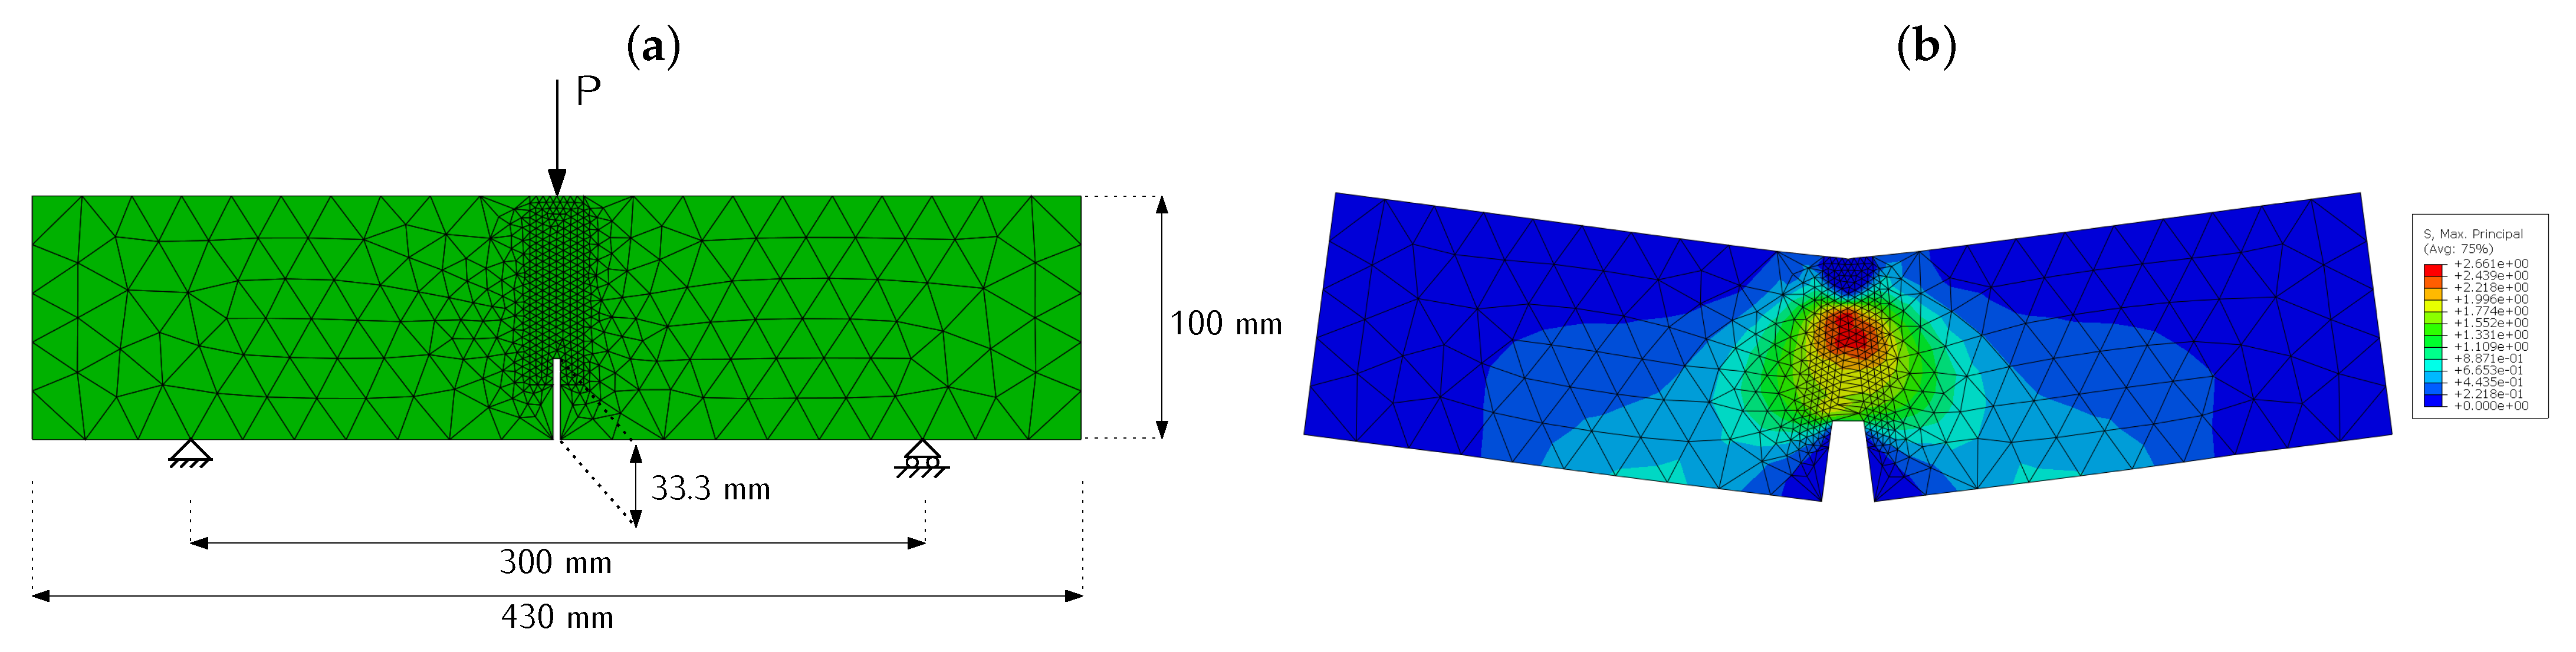
3.3. FEM Models
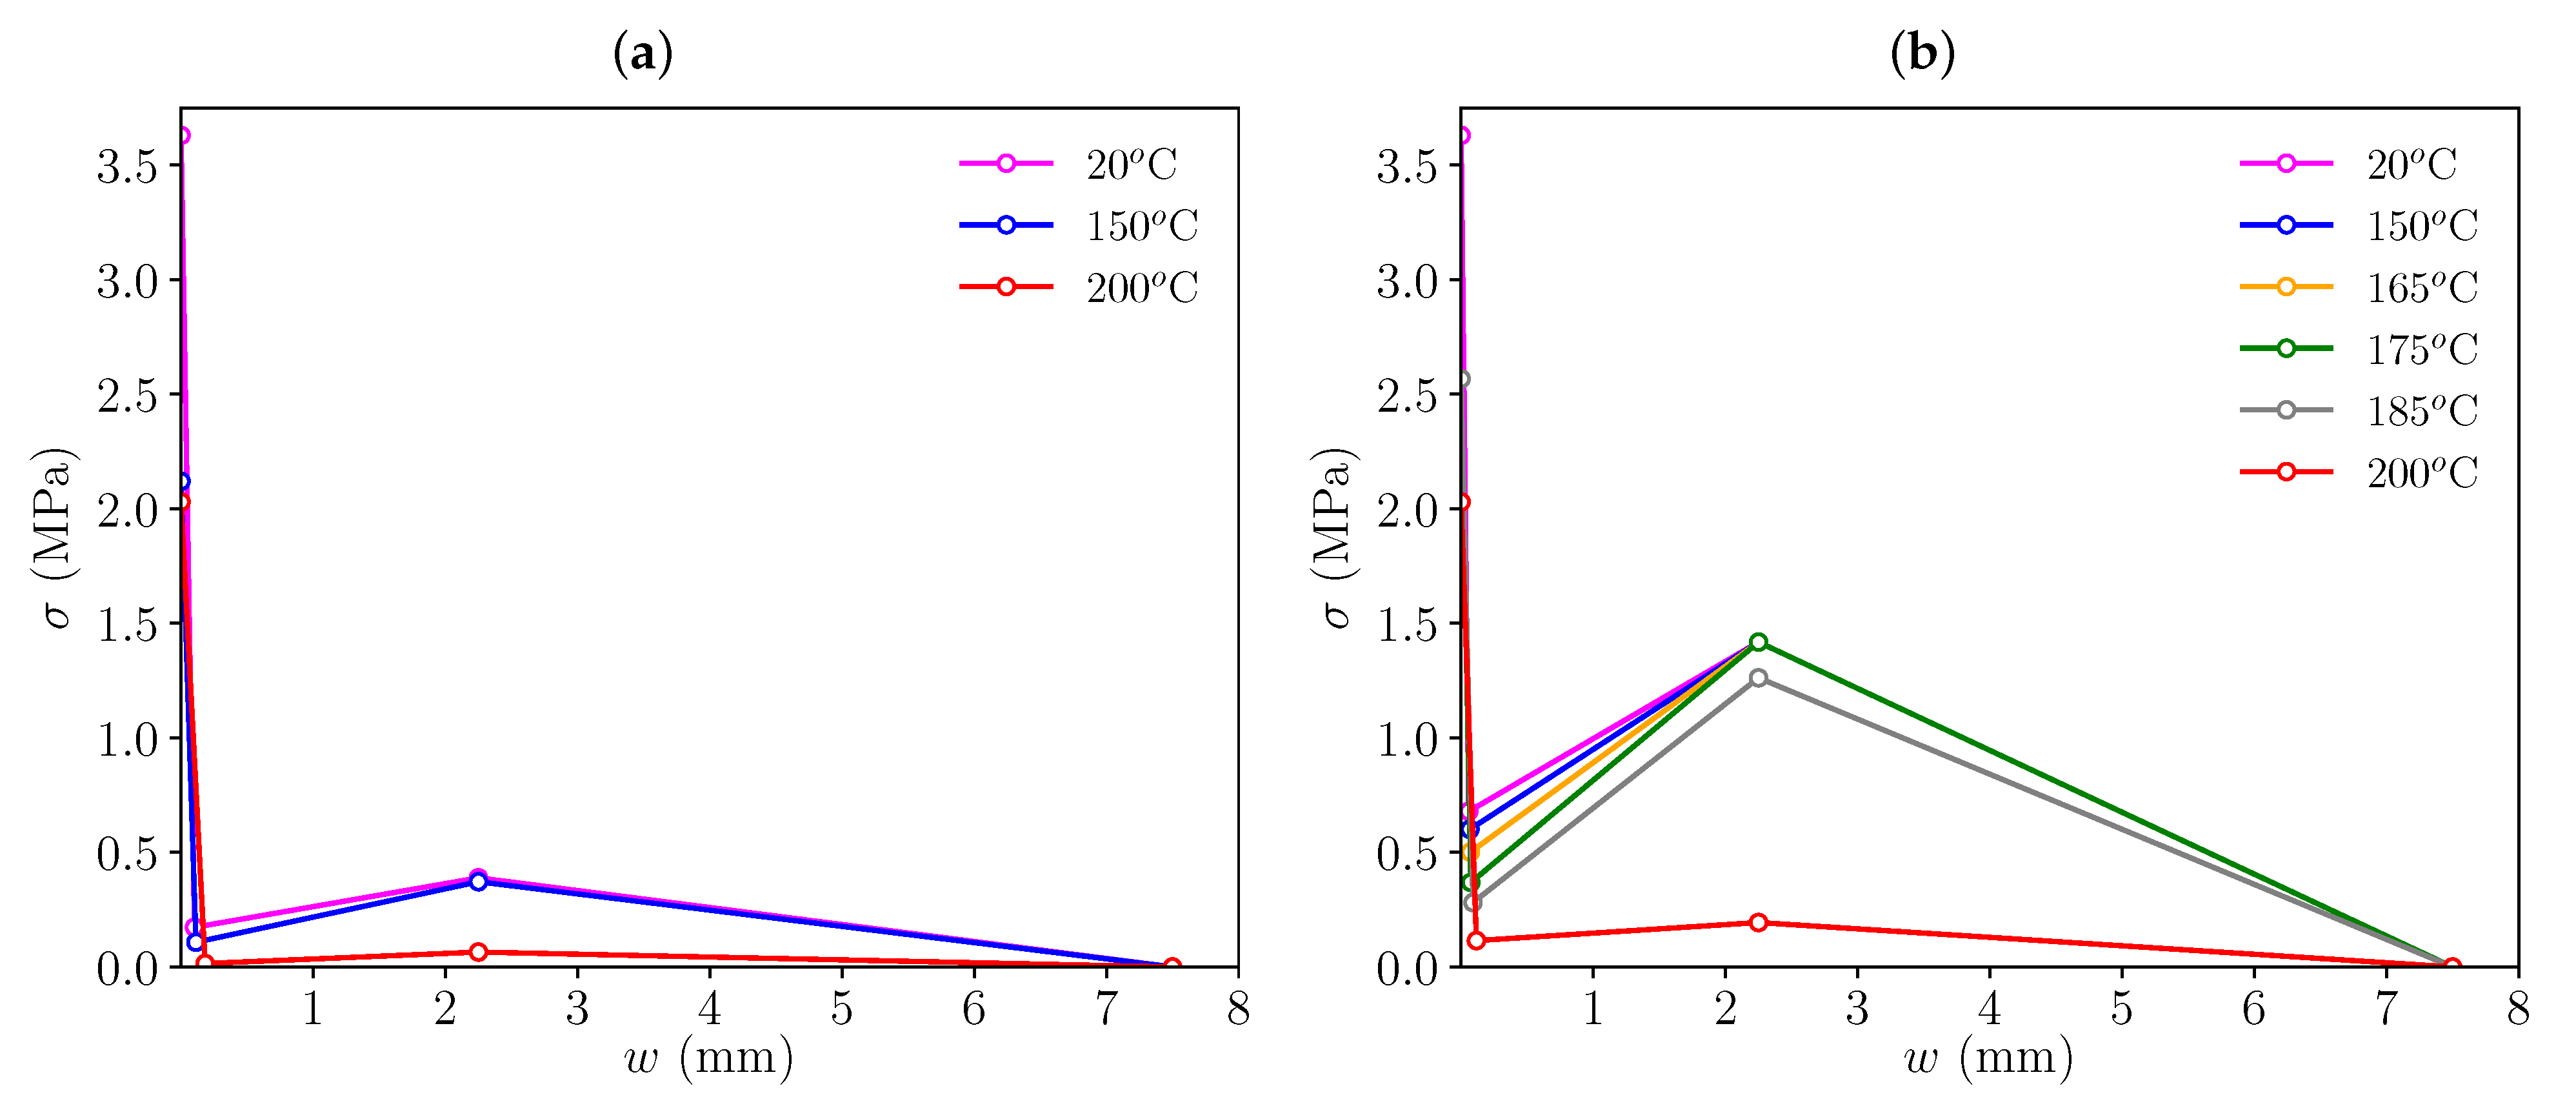
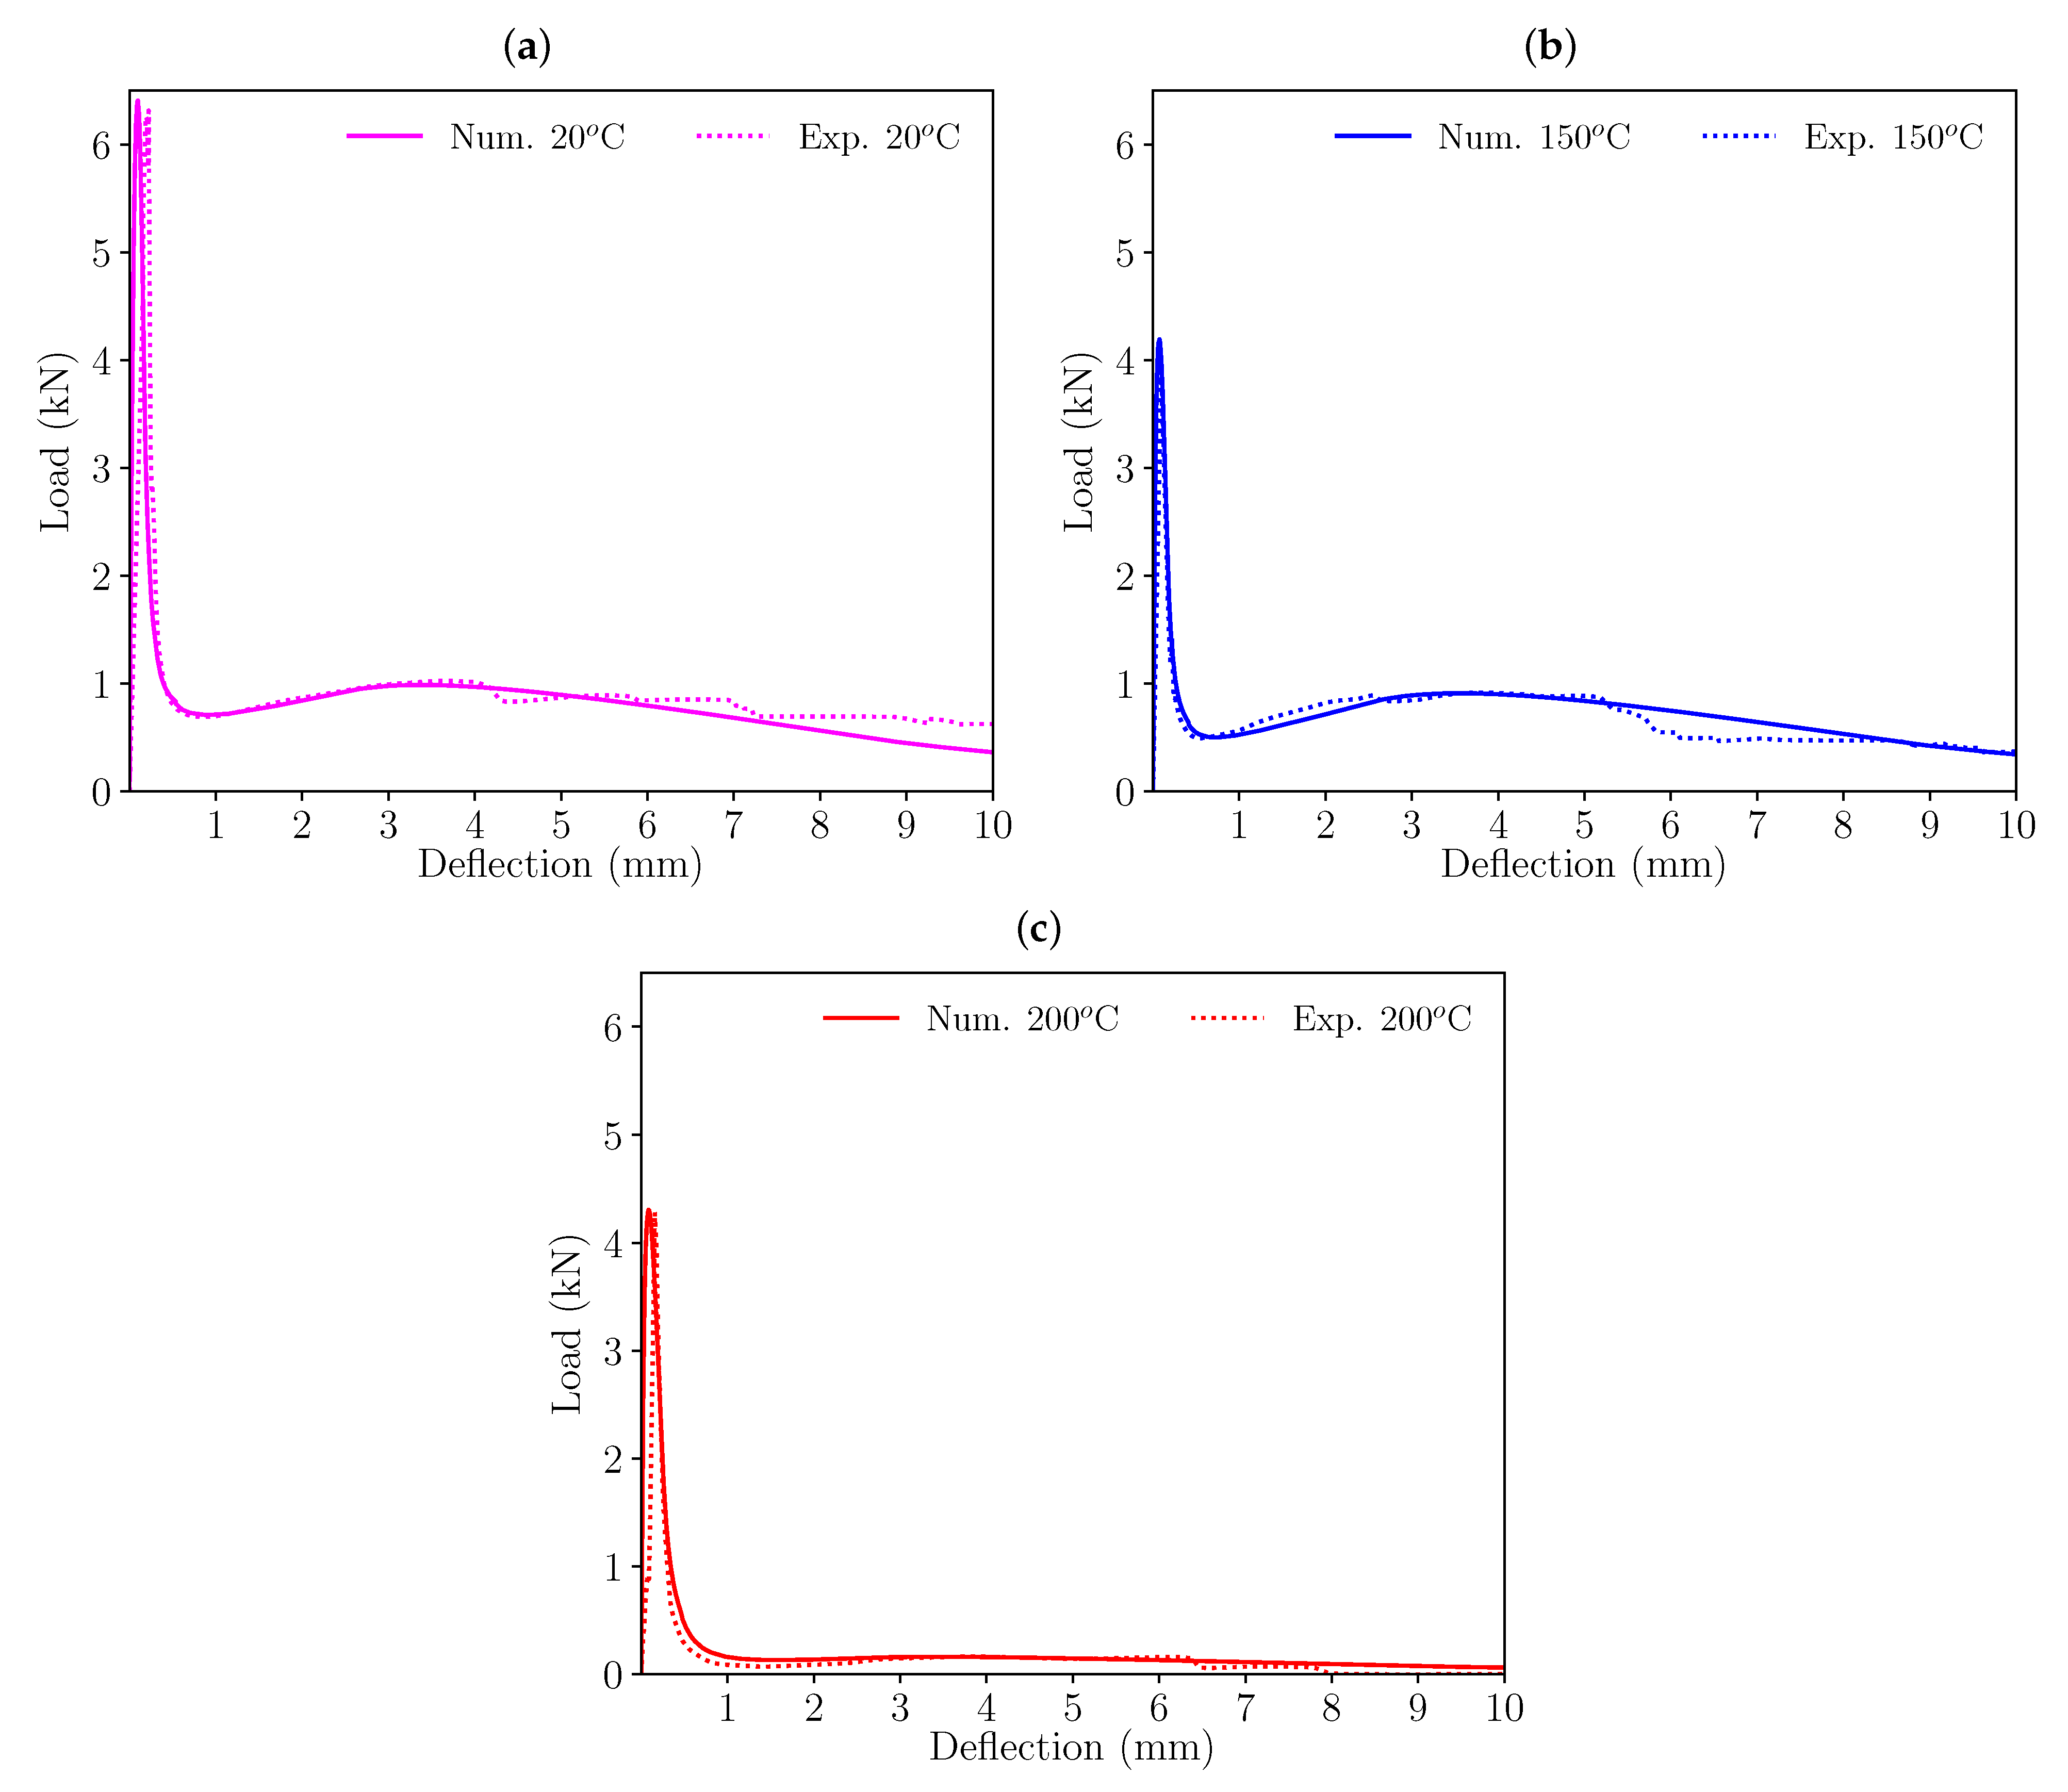
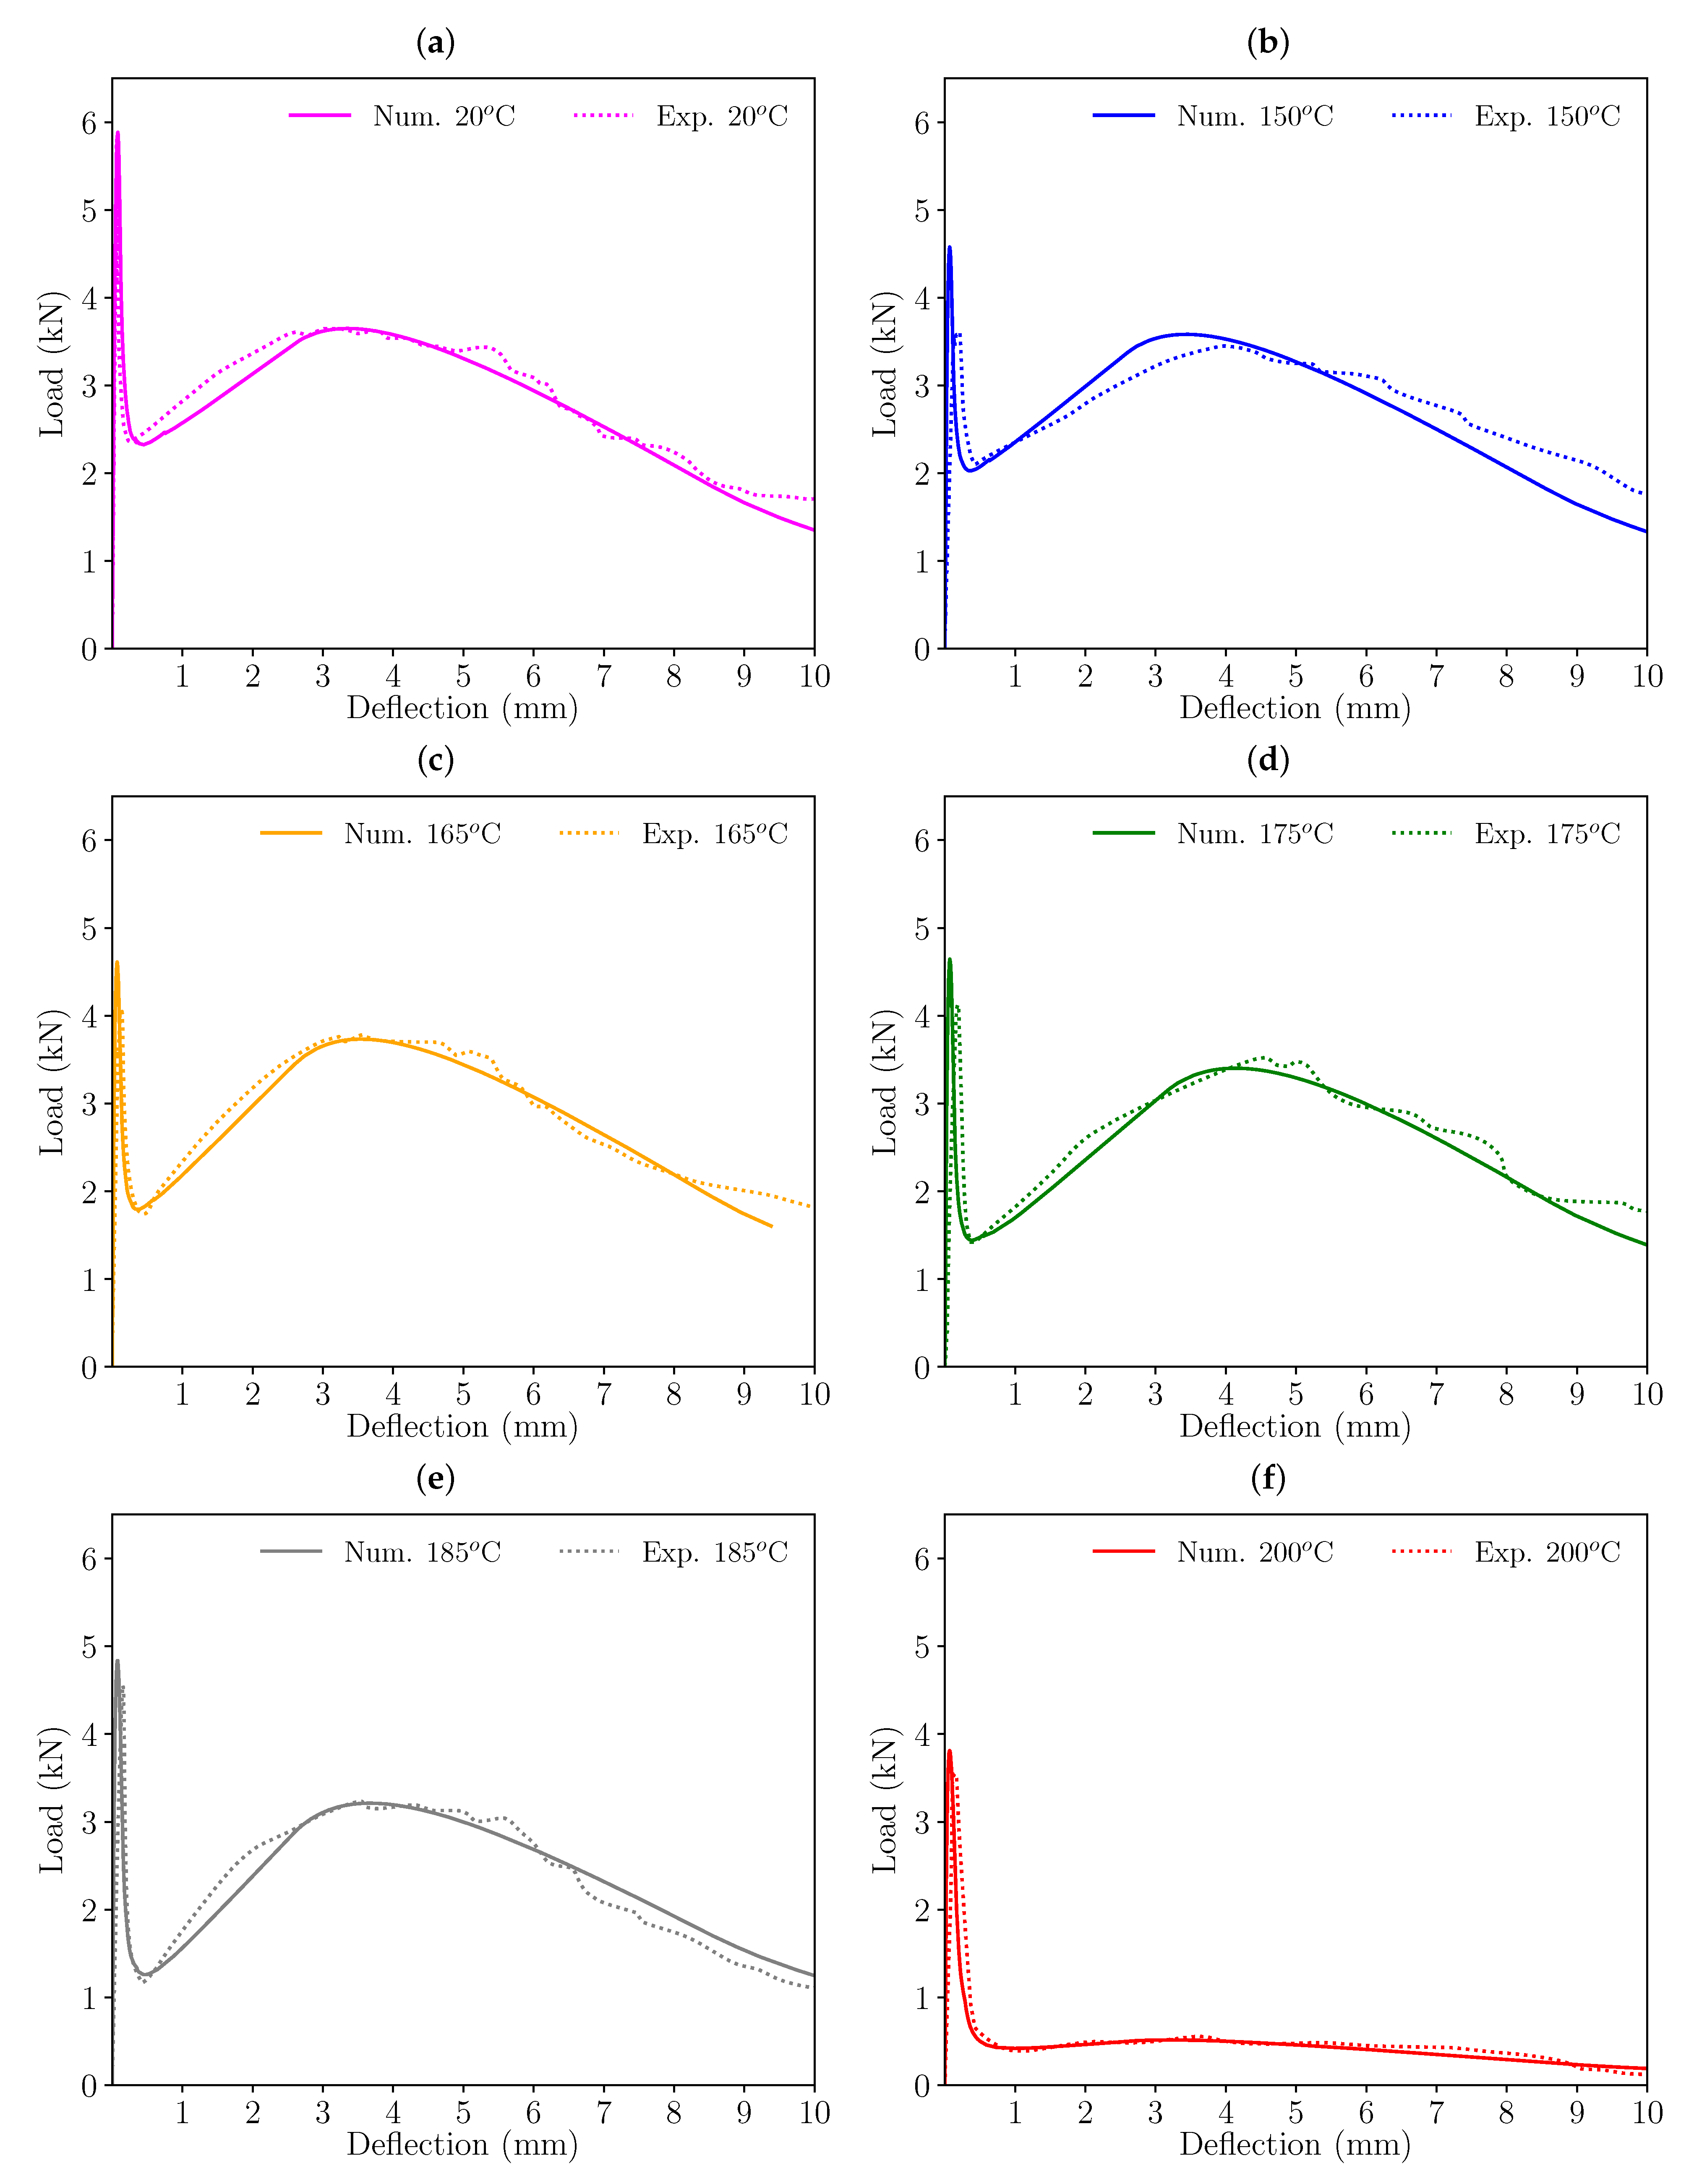
4. Definition of the Trilinear Softening Diagrams and Results
Proposed Modification of the Trilinear Diagram to Include the Effect of High Temperature Exposure
5. Conclusions
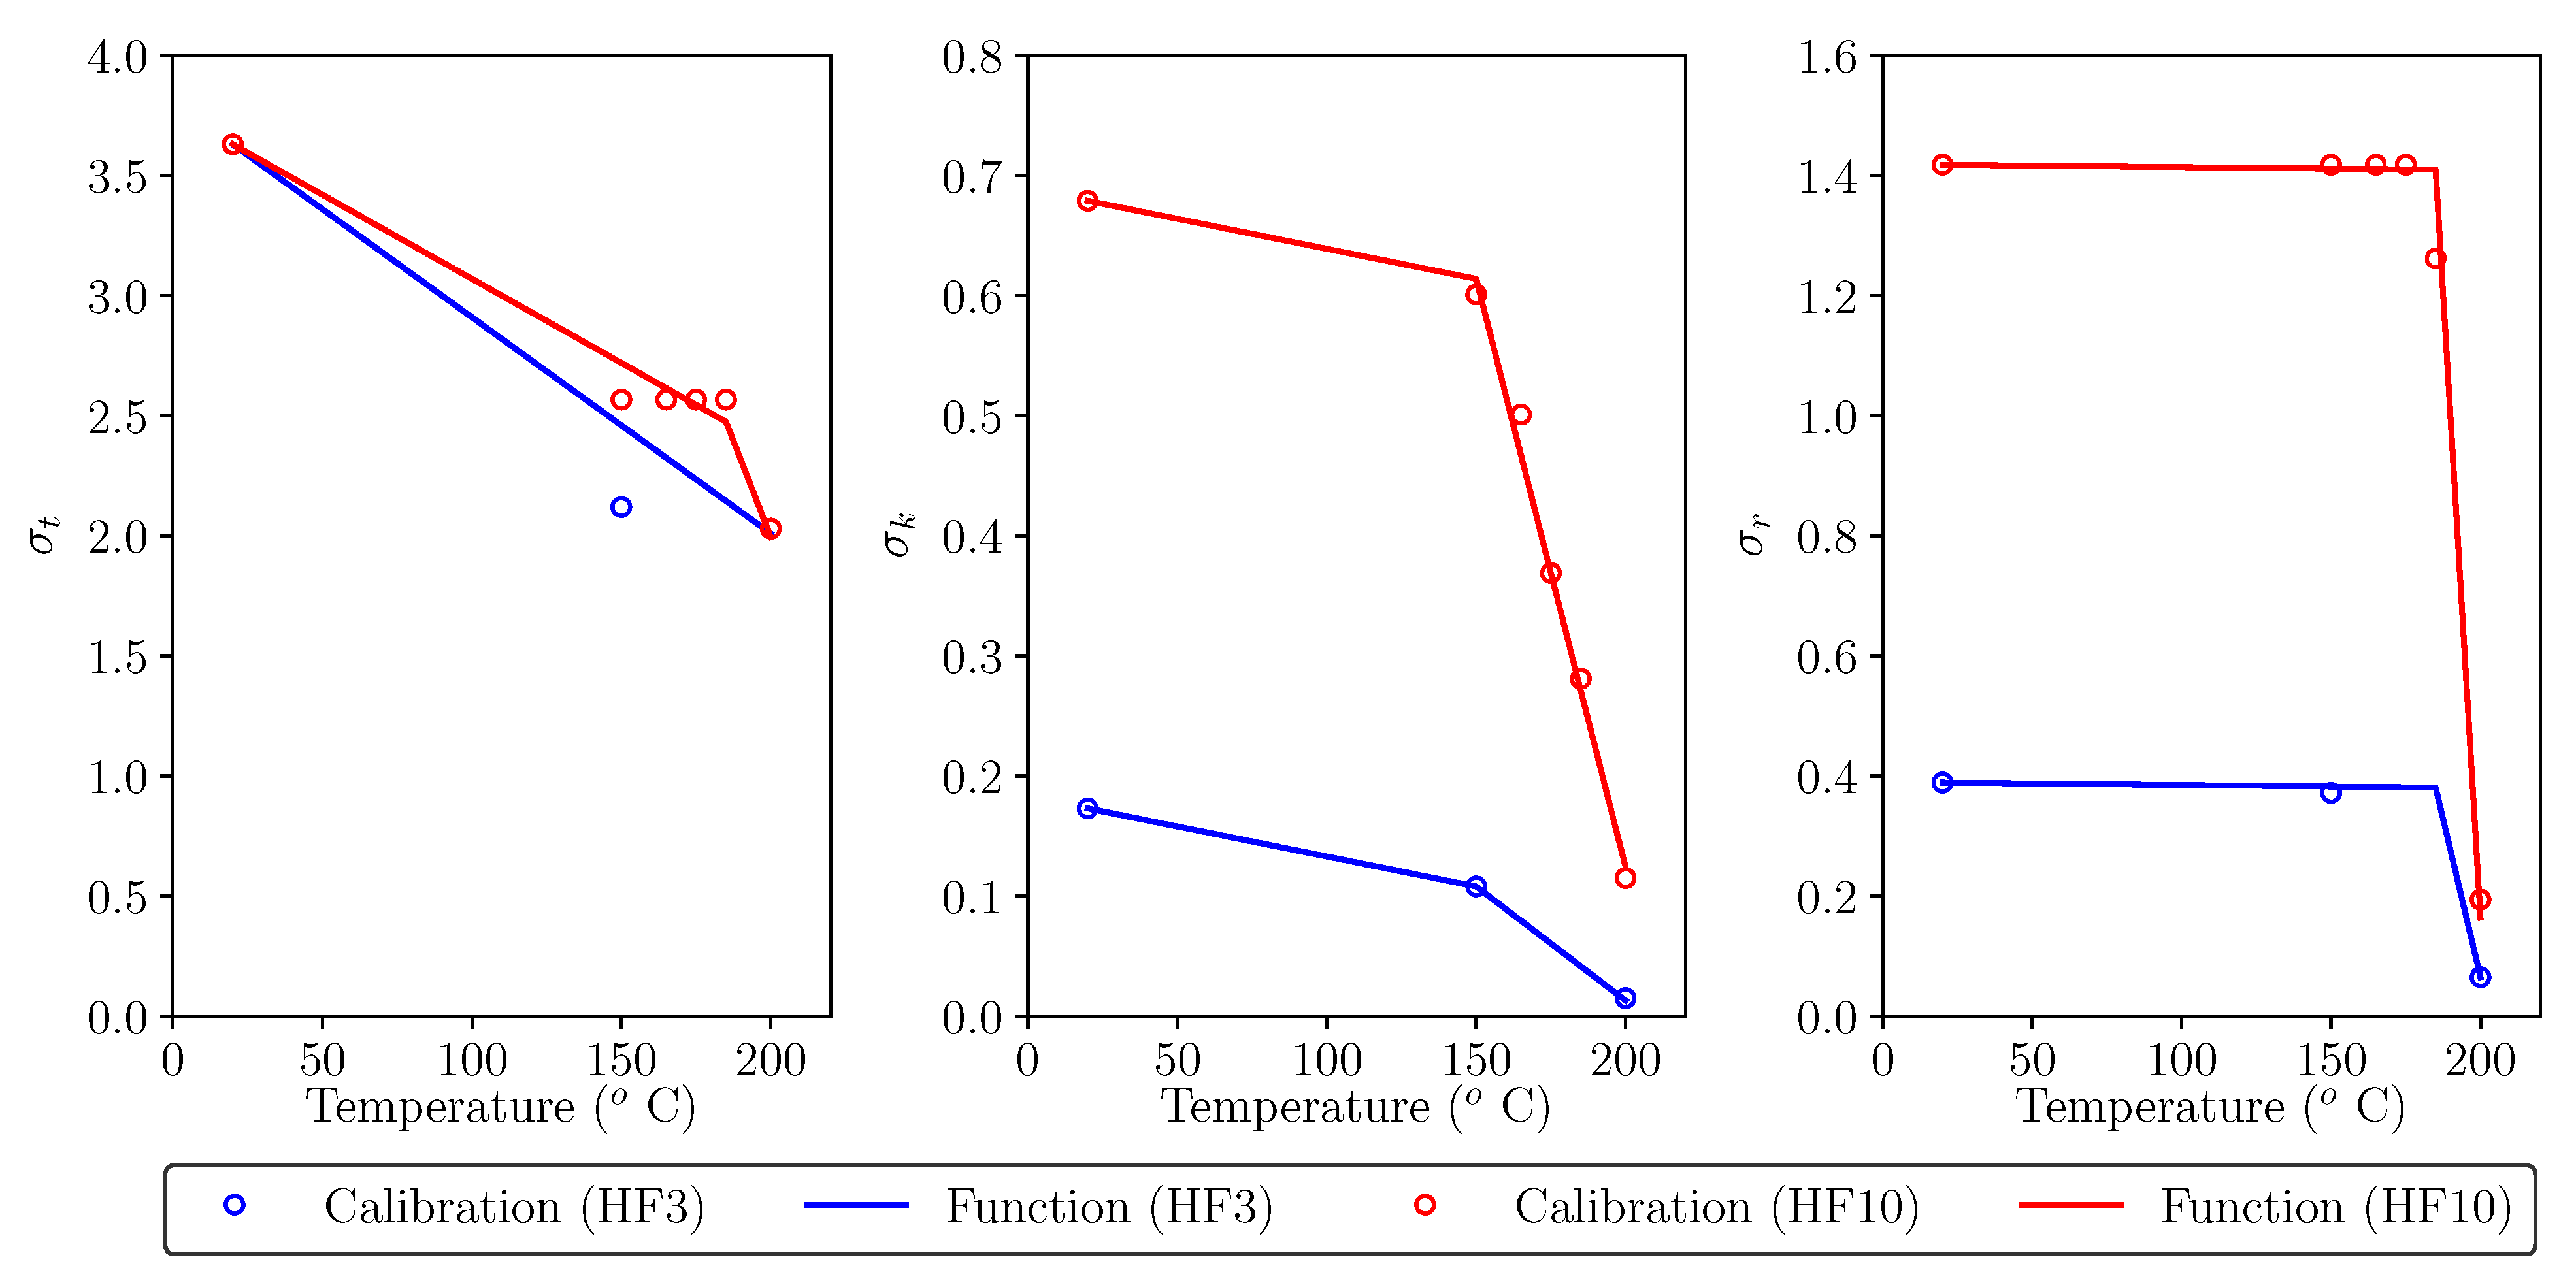
- A trilinear diagram calibrated with specimens not exposed to high temperature can be adapted for high temperature exposure by modifying the ordinates of points t, k and r of the trilinear diagram (, and values), which decrease as temperature exposure increases.
- The load drop after the initial peak becomes higher as temperature increases. This drop is relevant beginning from a temperature exposure of 150 °C. A function for defining , which is the most relevant parameter to correctly model this load drop, is proposed. This function is bilinear and the decrease of is higher for temperature values over 150 °C, as observed in the calibrated results of this parameter.
- The load drop of the remnant peak load that takes place after the initial peak load can be only observed for temperatures over 175 °C. A function for , the most relevant parameter for correctly capturing this remnant peak load, is proposed. This function is also bilinear and the decrease of becomes higher at temperature values over 175 °C, in agreement with the calibrated results.
Author Contributions
Funding
Institutional Review Board Statement
Informed Consent Statement
Data Availability Statement
Conflicts of Interest
References
- Achilleos, C.; Hadjimitsis, D.; Neocleous, K.; Pilakoutas, K.; Neophytou, P.O.; Kallis, S. Proportioning of steel fibre reinforced concrete mixes for pavement construction and their impact on environment and cost. Sustainability 2011, 3, 965–983. [Google Scholar] [CrossRef]
- Shah, A.A.; Ribakov, Y. Recent trends in steel fibered high-strength concrete. Mater. Des. 2011, 32, 4122–4151. [Google Scholar] [CrossRef]
- Buratti, N.; Ferracuti, B.; Savoia, M. Concrete crack reduction in tunnel linings by steel fibre-reinforced concretes. Constr. Build. Mater. 2013, 44, 249–259. [Google Scholar] [CrossRef]
- Germano, F.; Tiberti, G.; Plizzari, G. Post-peak fatigue performance of steel fiber reinforced concrete under flexure. Mater. Struct. 2016, 49, 4229–4245. [Google Scholar] [CrossRef]
- Yoo, D.Y.; Banthia, N. Mechanical and structural behaviors of ultra-high-performance fiber-reinforced concrete subjected to impact and blast. Constr. Build. Mater. 2017, 149, 416–431. [Google Scholar] [CrossRef]
- Marcos-Meson, V.; Fischer, G.; Edvardsen, C.; Skovhus, T.L.; Michel, A. Durability of Steel Fibre Reinforced Concrete (SFRC) exposed to acid attack–A literature review. Constr. Build. Mater. 2019, 200, 490–501. [Google Scholar] [CrossRef]
- China CECS38:2004; Technical Specification for Fiber Reinforced Concrete Structures provides Guidelines for Various Applications. Dalian University of Technology: Dalian, China, 2004.
- Fib Model Code 2010; Fédération Internationale du Béton fib/International Federation for Structural Concrete: Paris, France, 2013.
- Sweden Standard Fibre Concrete—Design of Fibre Concrete Structures SS812310; Svenska Institutet för Standarder (SIS)—Bygg Och Anläggning: Stockholm, Sweden, 2014.
- Structural Code: Annexes 1–18; Ministerio de Transportes, Movilidad y Agenda Urbana: Madrid, Spain, 2021.
- Bažant, Z.P.; Kaplan, M.F. Concrete at High Temperatures: Material Properties and Mathematical Models; Longman Group Limited: London, UK, 1996. [Google Scholar]
- Varona, F.; Baeza, F.J.; Bru, D.; Ivorra, S. Evolution of the bond strength between reinforcing steel and fibre reinforced concrete after high temperature exposure. Constr. Build. Mater. 2018, 176, 359–370. [Google Scholar] [CrossRef]
- Liu, X.; Ye, G.; De Schutter, G.; Yuan, Y.; Taerwe, L. On the mechanism of polypropylene fibres in preventing fire spalling in self-compacting and high-performance cement paste. Cem. Concr. Res. 2008, 38, 487–499. [Google Scholar] [CrossRef]
- Chen, M.; Sun, Z.; Tu, W.; Yan, X.; Zhang, M. Behaviour of recycled tyre polymer fibre reinforced concrete at elevated temperatures. Cem. Concr. Compos. 2021, 124, 104257. [Google Scholar] [CrossRef]
- Tabatabaie Shourijeh, P.; Masoudi Rad, A.; Heydari Bahman Bigloo, F.; Binesh, S.M. Application of recycled concrete aggregates for stabilization of clay reinforced with recycled tire polymer fibers and glass fibers. Constr. Build. Mater. 2022, 355, 129172. [Google Scholar] [CrossRef]
- Lopez, J.A.; Serna, P.; Camacho, E.; Coll, H.; Navarro-Gregori, J. First ultra-high-performance fibre-reinforced concrete footbridge in Spain: Design and construction. Struct. Eng. Int. 2014, 24, 101–104. [Google Scholar] [CrossRef]
- Xiang, D.; Liu, S.; Li, Y.; Liu, Y. Improvement of flexural and cyclic performance of bridge deck slabs by utilizing steel fiber reinforced concrete (SFRC). Constr. Build. Mater. 2022, 329, 127184. [Google Scholar] [CrossRef]
- Varona, F.B.; Baeza, F.J.; Bru, D.; Ivorra, S. Influence of high temperature on the mechanical properties of hybrid fibre reinforced normal and high strength concrete. Constr. Build. Mater. 2018, 159, 73–82. [Google Scholar] [CrossRef]
- Yermak, N.; Pliya, P.; Beaucour, A.L.; Simon, A.; Noumowé, A. Influence of steel and/or polypropylene fibres on the behaviour of concrete at high temperature: Spalling, transfer and mechanical properties. Constr. Build. Mater. 2017, 132, 240–250. [Google Scholar] [CrossRef]
- Cuenca, E.; Echegaray-Oviedo, J.; Serna, P. Influence of concrete matrix and type of fiber on the shear behavior of self-compacting fiber reinforced concrete beams. Compos. Part B Eng. 2015, 75, 135–147. [Google Scholar] [CrossRef]
- Alberti, M.; Enfedaque, A.; Gálvez, J. Fracture mechanics of polyolefin fibre reinforced concrete: Study of the influence of the concrete properties, casting procedures, the fibre length and specimen size. Eng. Fract. Mech. 2016, 154, 225–244. [Google Scholar] [CrossRef]
- Picazo, A.; Gálvez, J.; Alberti, M.; Enfedaque, A. Assessment of the shear behaviour of polyolefin fibre reinforced concrete and verification by means of digital image correlation. Constr. Build. Mater. 2018, 181, 565–578. [Google Scholar] [CrossRef]
- Barros, J.A.; Foster, S.J. An integrated approach for predicting the shear capacity of fibre reinforced concrete beams. Eng. Struct. 2018, 174, 346–357. [Google Scholar] [CrossRef]
- Karamloo, M.; Afzali-Naniz, O.; Doostmohamadi, A. Impact of using different amounts of polyolefin macro fibers on fracture behavior, size effect, and mechanical properties of self-compacting lightweight concrete. Constr. Build. Mater. 2020, 250, 118856. [Google Scholar] [CrossRef]
- Alberti, M.G.; Gálvez, J.C.; Enfedaque, A.; Castellanos, R. Influence of high temperature on the fracture properties of polyolefin fibre reinforced concrete. Materials 2021, 14, 601. [Google Scholar] [CrossRef]
- Gálvez, J.; Planas, J.; Sancho, J.; Reyes, E.; Cendón, D.; Casati, M. An embedded cohesive crack model for finite element analysis of quasi-brittle materials. Eng. Fract. Mech. 2013, 109, 369–386. [Google Scholar] [CrossRef]
- Jirásek, M. Damage and Smeared Crack Models. In Numerical Modeling of Concrete Cracking; Hofstetter, G., Meschke, G., Eds.; Springer: Vienna, Austria, 2011; pp. 1–49. [Google Scholar] [CrossRef]
- Alberti, M.; Enfedaque, A.; Gálvez, J.; Reyes, E. Numerical modelling of the fracture of polyolefin fibre reinforced concrete by using a cohesive fracture approach. Compos. Part B Eng. 2017, 111, 200–210. [Google Scholar] [CrossRef]
- Planas, J.; Guinea, G.; Gálvez, J.; Sanz, B.; Fathy, A. Indirect Test for Stress-Crack Opening Curve, from Experimental Determination of the Stress-Crack Opening Curve for Concrete in Tension—Final Report of RILEM Technical Committee TC 187-SOC. 2007. Available online: https://www.rilem.net/publication/publication/103?id_papier=4148 (accessed on 26 July 2023).
- Sancho, J.; Planas, J.; Cendón, D.; Reyes, E.; Gálvez, J. An embedded crack model for finite element analysis of concrete fracture. Eng. Fract. Mech. 2007, 74, 75–86. [Google Scholar] [CrossRef]
- Hillerborg, A.; Modéer, M.; Petersson, P.E. Analysis of crack formation and crack growth in concrete by means of fracture mechanics and finite elements. Cem. Concr. Res. 1976, 6, 773–781. [Google Scholar] [CrossRef]
- Suárez, F.; Gálvez, J.; Enfedaque, A.; Alberti, M. Modelling fracture on polyolefin fibre reinforced concrete specimens subjected to mixed-mode loading. Eng. Fract. Mech. 2019, 211, 244–253. [Google Scholar] [CrossRef]


| Cement (kg/m) | Limestone (kg/m) | Water (kg/m) | Sand (kg/m) | Gravel (kg/m) | Grit (kg/m) | Superplasticiser (% Cement Weight) | Polyolefin Fibres (kg/m) | |
|---|---|---|---|---|---|---|---|---|
| HF3 | 375 | 100 | 187.5 | 916 | 300 | 450 | 0.75 | 3 |
| HF10 | 375 | 100 | 187.5 | 916 | 300 | 450 | 0.75 | 10 |
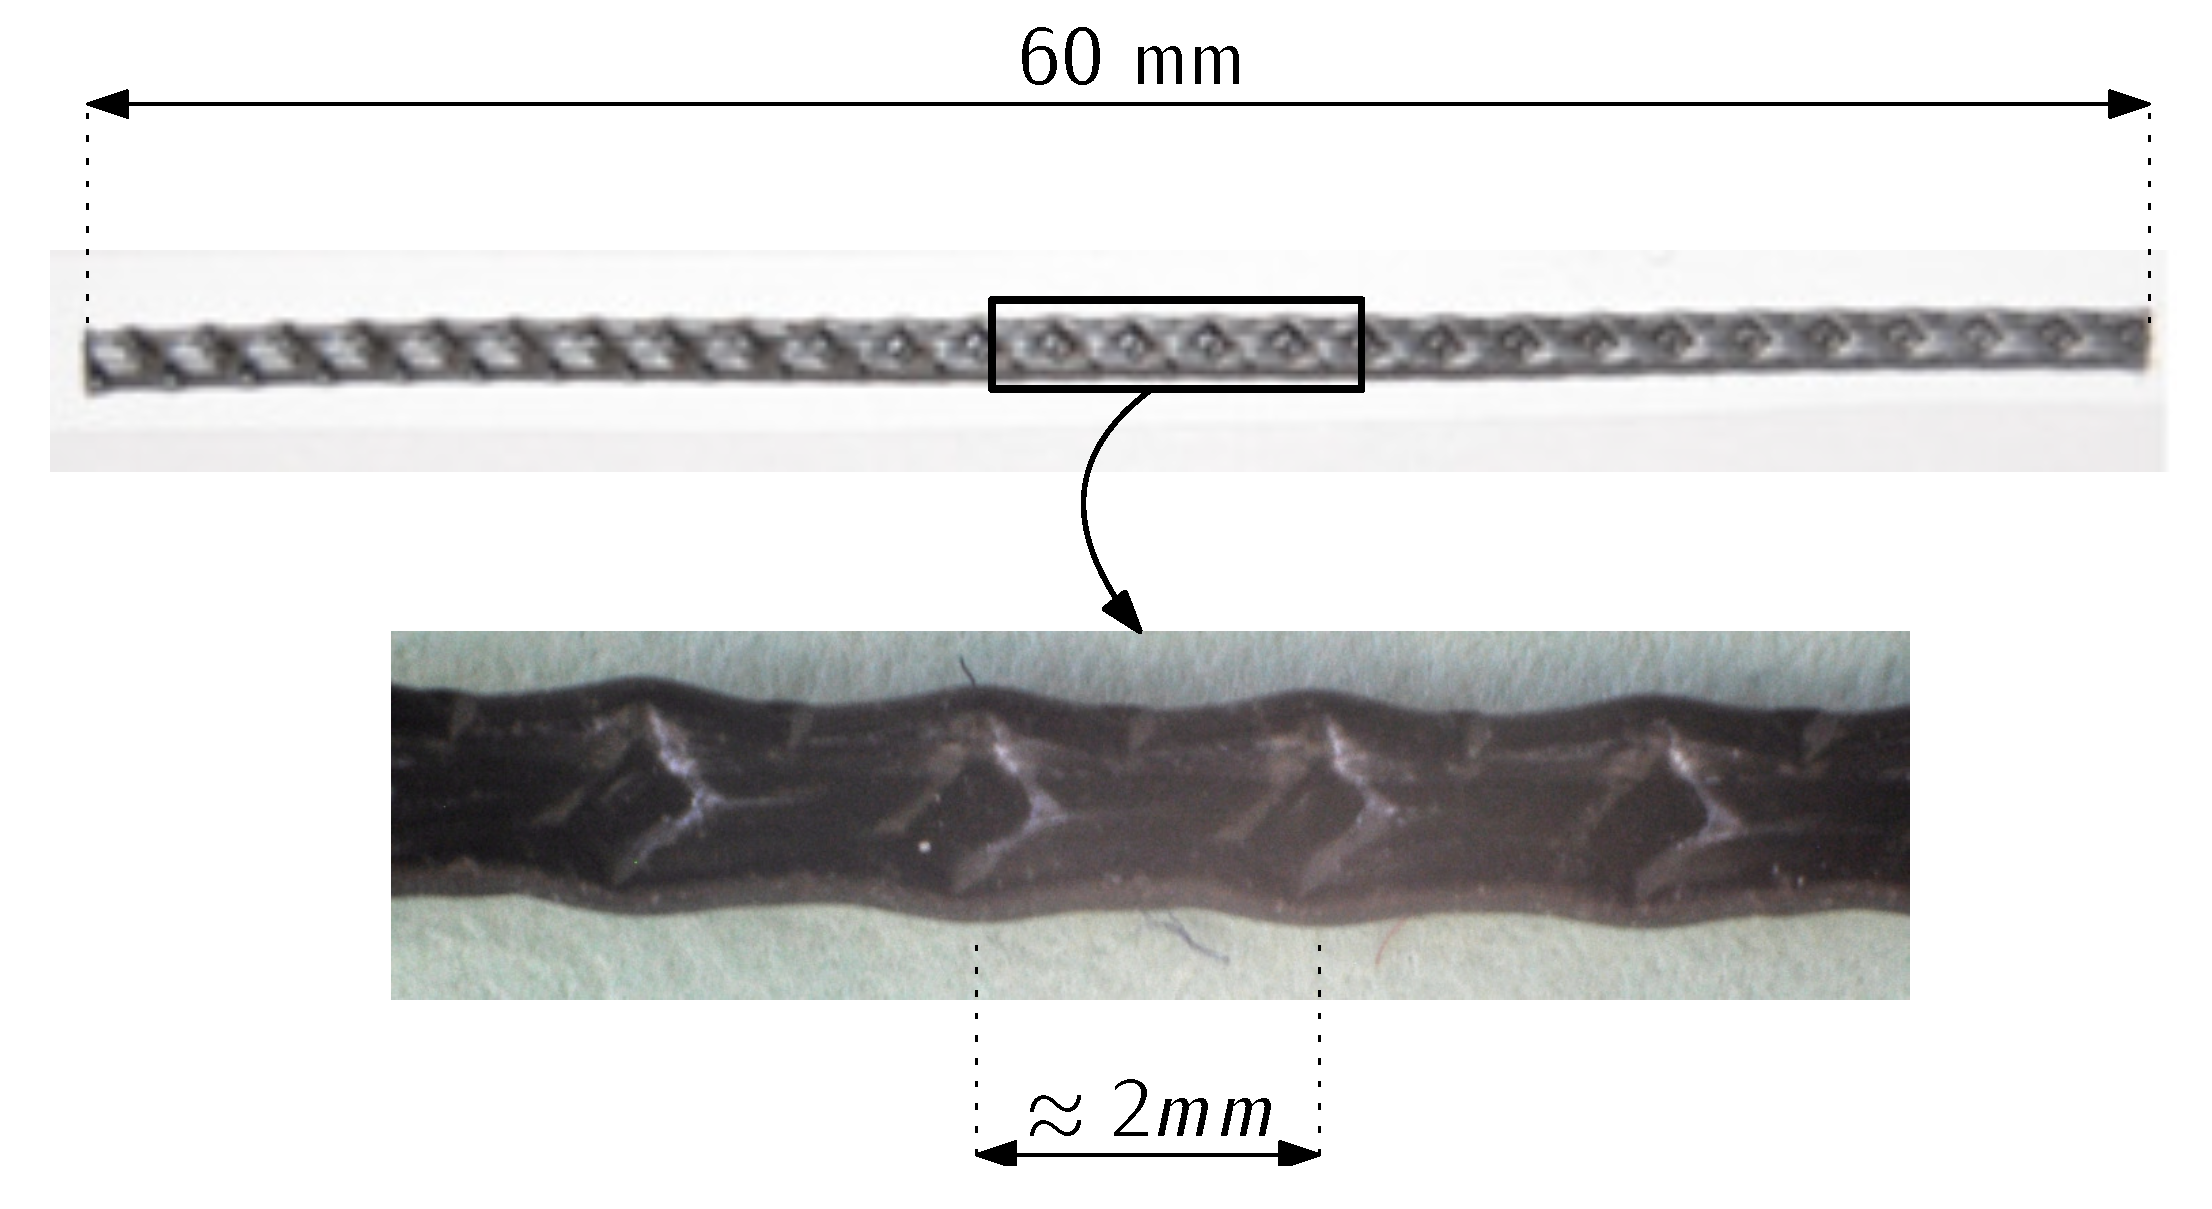
| Density (g/cm) | Length (mm) | Eq. Diameter (mm) | Tensile Strength (MPa) | Elastic Modulus (GPa) |
|---|---|---|---|---|
| 0.91 | 60 | 0.92 | >500 | >9 |
| HF3 | HF10 | |||||||||
|---|---|---|---|---|---|---|---|---|---|---|
| 20 °C | 150 °C | 200 °C | 20 °C | 150 °C | 165 °C | 175 °C | 185 °C | 200 °C | ||
| 0.000 | 0.000 | 0.000 | 0.000 | 0.000 | 0.000 | 0.000 | 0.000 | 0.000 | ||
| 3.630 | 2.120 | 2.030 | 3.630 | 2.567 | 2.567 | 2.567 | 2.567 | 2.030 | ||
| 0.102 | 0.113 | 0.182 | 0.058 | 0.067 | 0.070 | 0.074 | 0.090 | 0.116 | ||
| 0.173 | 0.108 | 0.015 | 0.679 | 0.601 | 0.501 | 0.369 | 0.281 | 0.115 | ||
| 2.250 | 2.250 | 2.250 | 2.250 | 2.250 | 2.250 | 2.250 | 2.250 | 2.250 | ||
| 0.389 | 0.372 | 0.065 | 1.418 | 1.418 | 1.418 | 1.418 | 1.262 | 0.194 | ||
| 7.500 | 7.500 | 7.500 | 7.500 | 7.500 | 7.500 | 7.500 | 7.500 | 7.500 | ||
| 0.000 | 0.000 | 0.000 | 0.000 | 0.000 | 0.000 | 0.000 | 0.000 | 0.000 | ||
Disclaimer/Publisher’s Note: The statements, opinions and data contained in all publications are solely those of the individual author(s) and contributor(s) and not of MDPI and/or the editor(s). MDPI and/or the editor(s) disclaim responsibility for any injury to people or property resulting from any ideas, methods, instructions or products referred to in the content. |
© 2023 by the authors. Licensee MDPI, Basel, Switzerland. This article is an open access article distributed under the terms and conditions of the Creative Commons Attribution (CC BY) license (https://creativecommons.org/licenses/by/4.0/).
Share and Cite
Suárez, F.; Enfedaque, A.; Alberti, M.G.; Gálvez, J.C. Numerical Simulation of PFRC Fracture Subjected to High Temperature by Means of a Trilinear Softening Diagram. Materials 2023, 16, 6048. https://doi.org/10.3390/ma16176048
Suárez F, Enfedaque A, Alberti MG, Gálvez JC. Numerical Simulation of PFRC Fracture Subjected to High Temperature by Means of a Trilinear Softening Diagram. Materials. 2023; 16(17):6048. https://doi.org/10.3390/ma16176048
Chicago/Turabian StyleSuárez, Fernando, Alejandro Enfedaque, Marcos G. Alberti, and Jaime C. Gálvez. 2023. "Numerical Simulation of PFRC Fracture Subjected to High Temperature by Means of a Trilinear Softening Diagram" Materials 16, no. 17: 6048. https://doi.org/10.3390/ma16176048