
Novel Bio-Based Materials: From Castor Oil to Epoxy Resins for Engineering Applications

Abstract
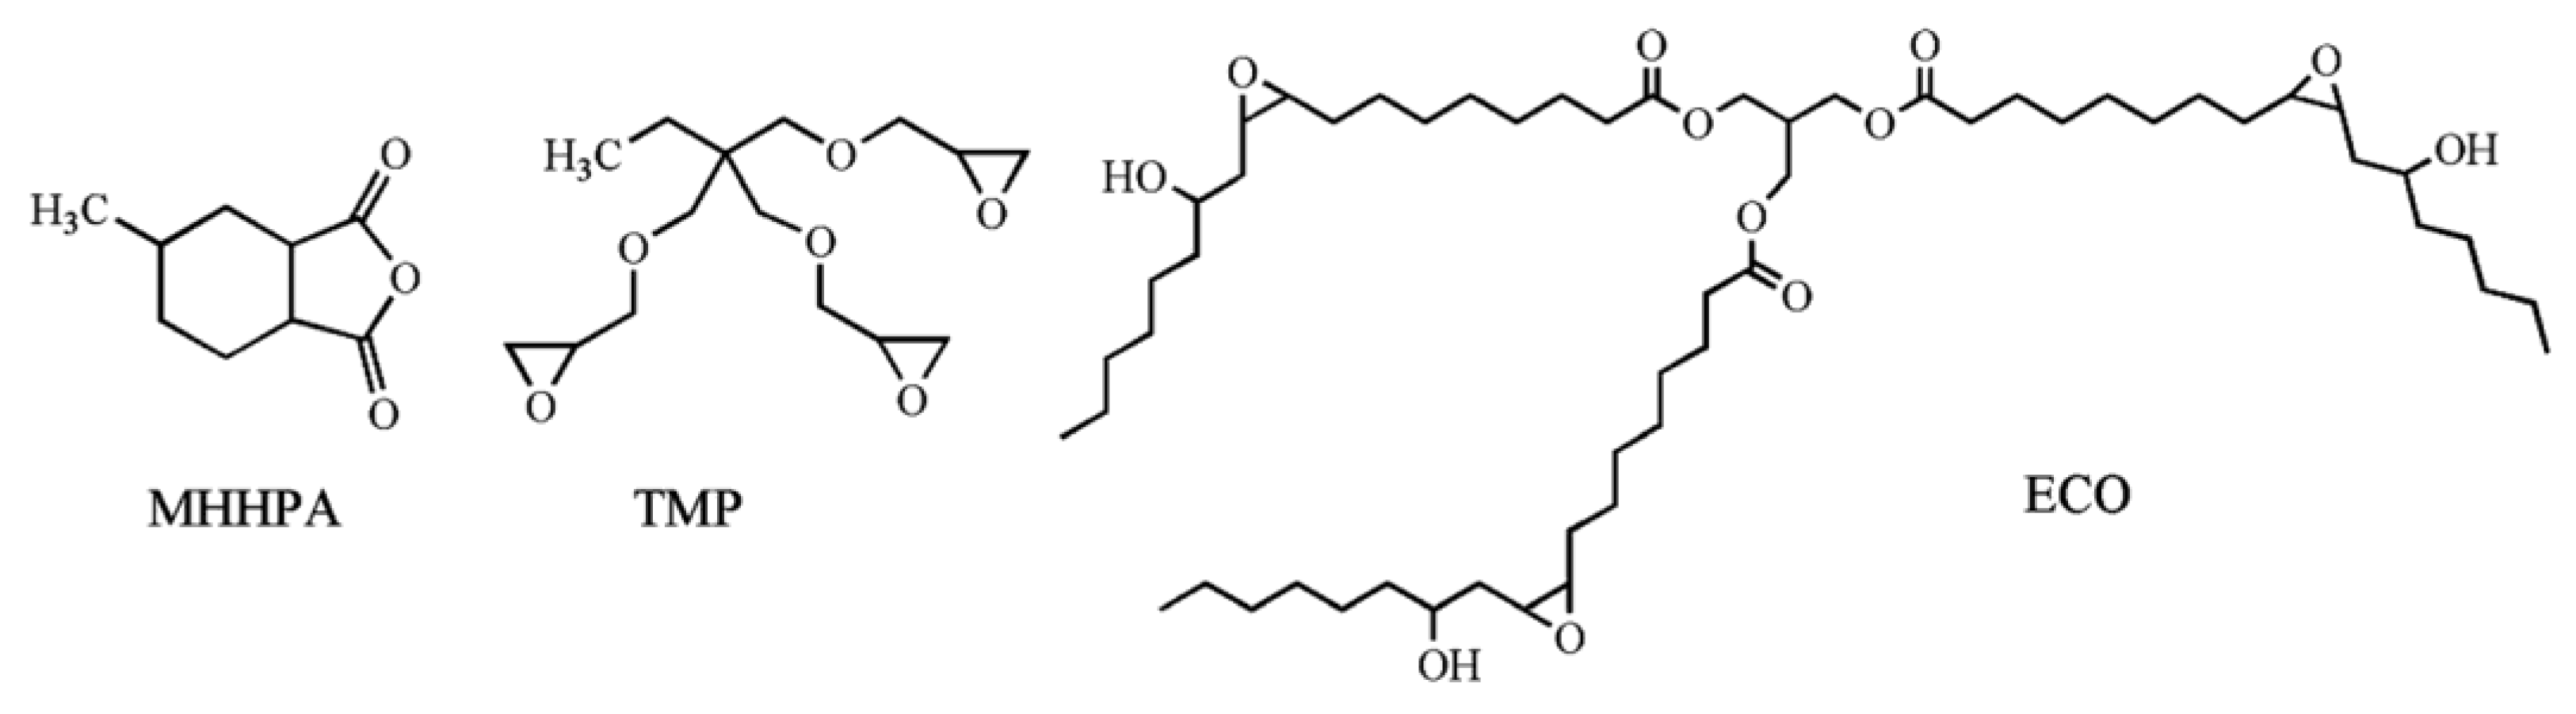
:1. Introduction
2. Materials and Methods
2.1. Reagents and Materials
2.2. Films Preparation
3. Measurements
4. Results
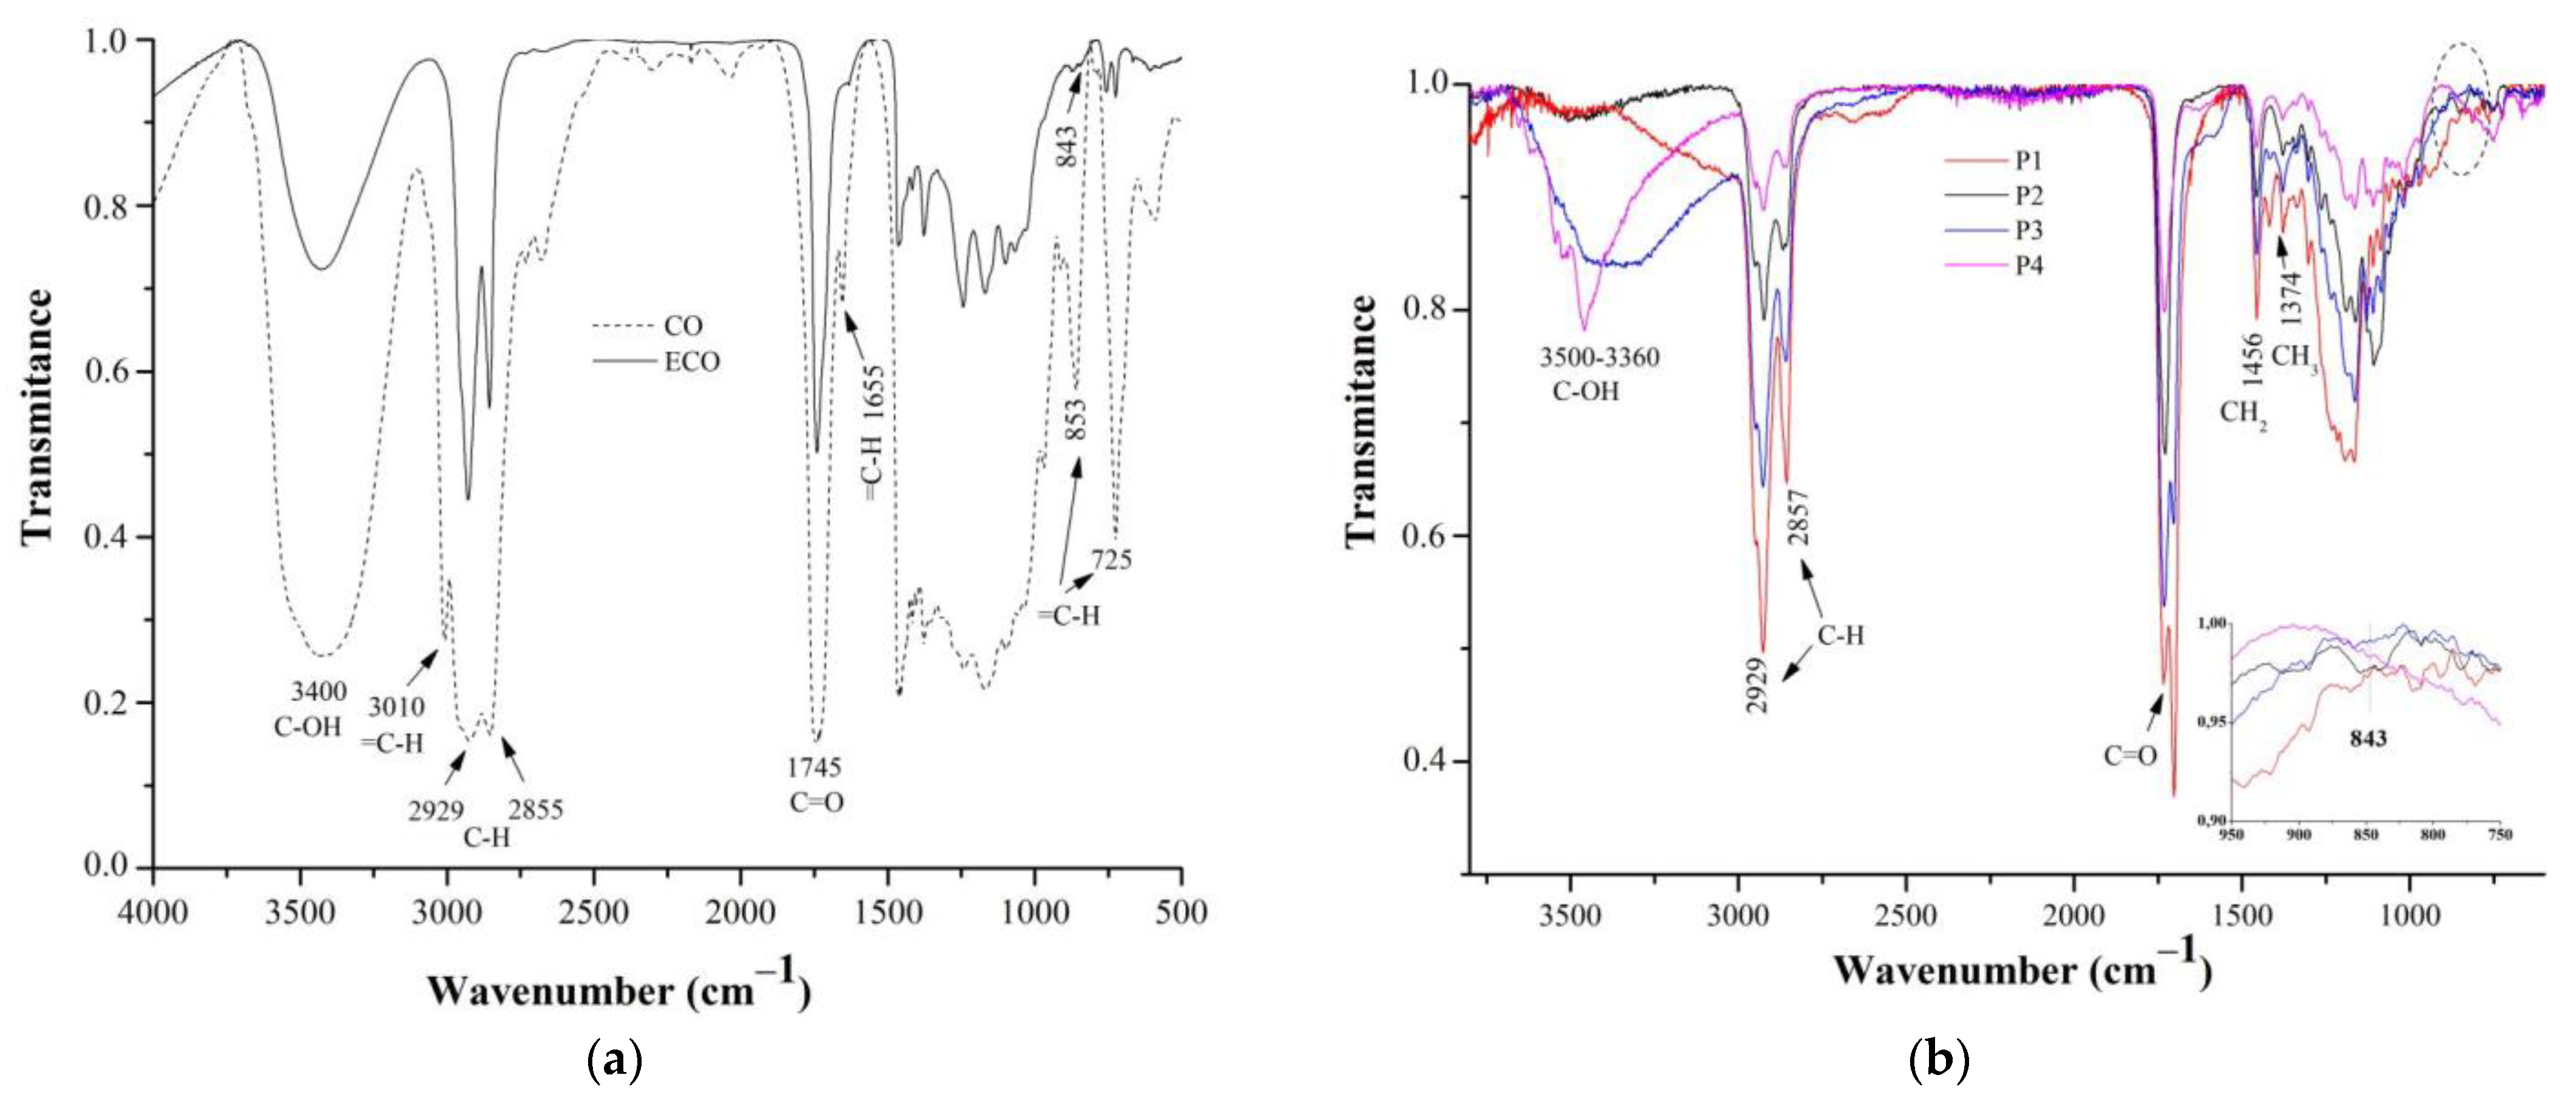
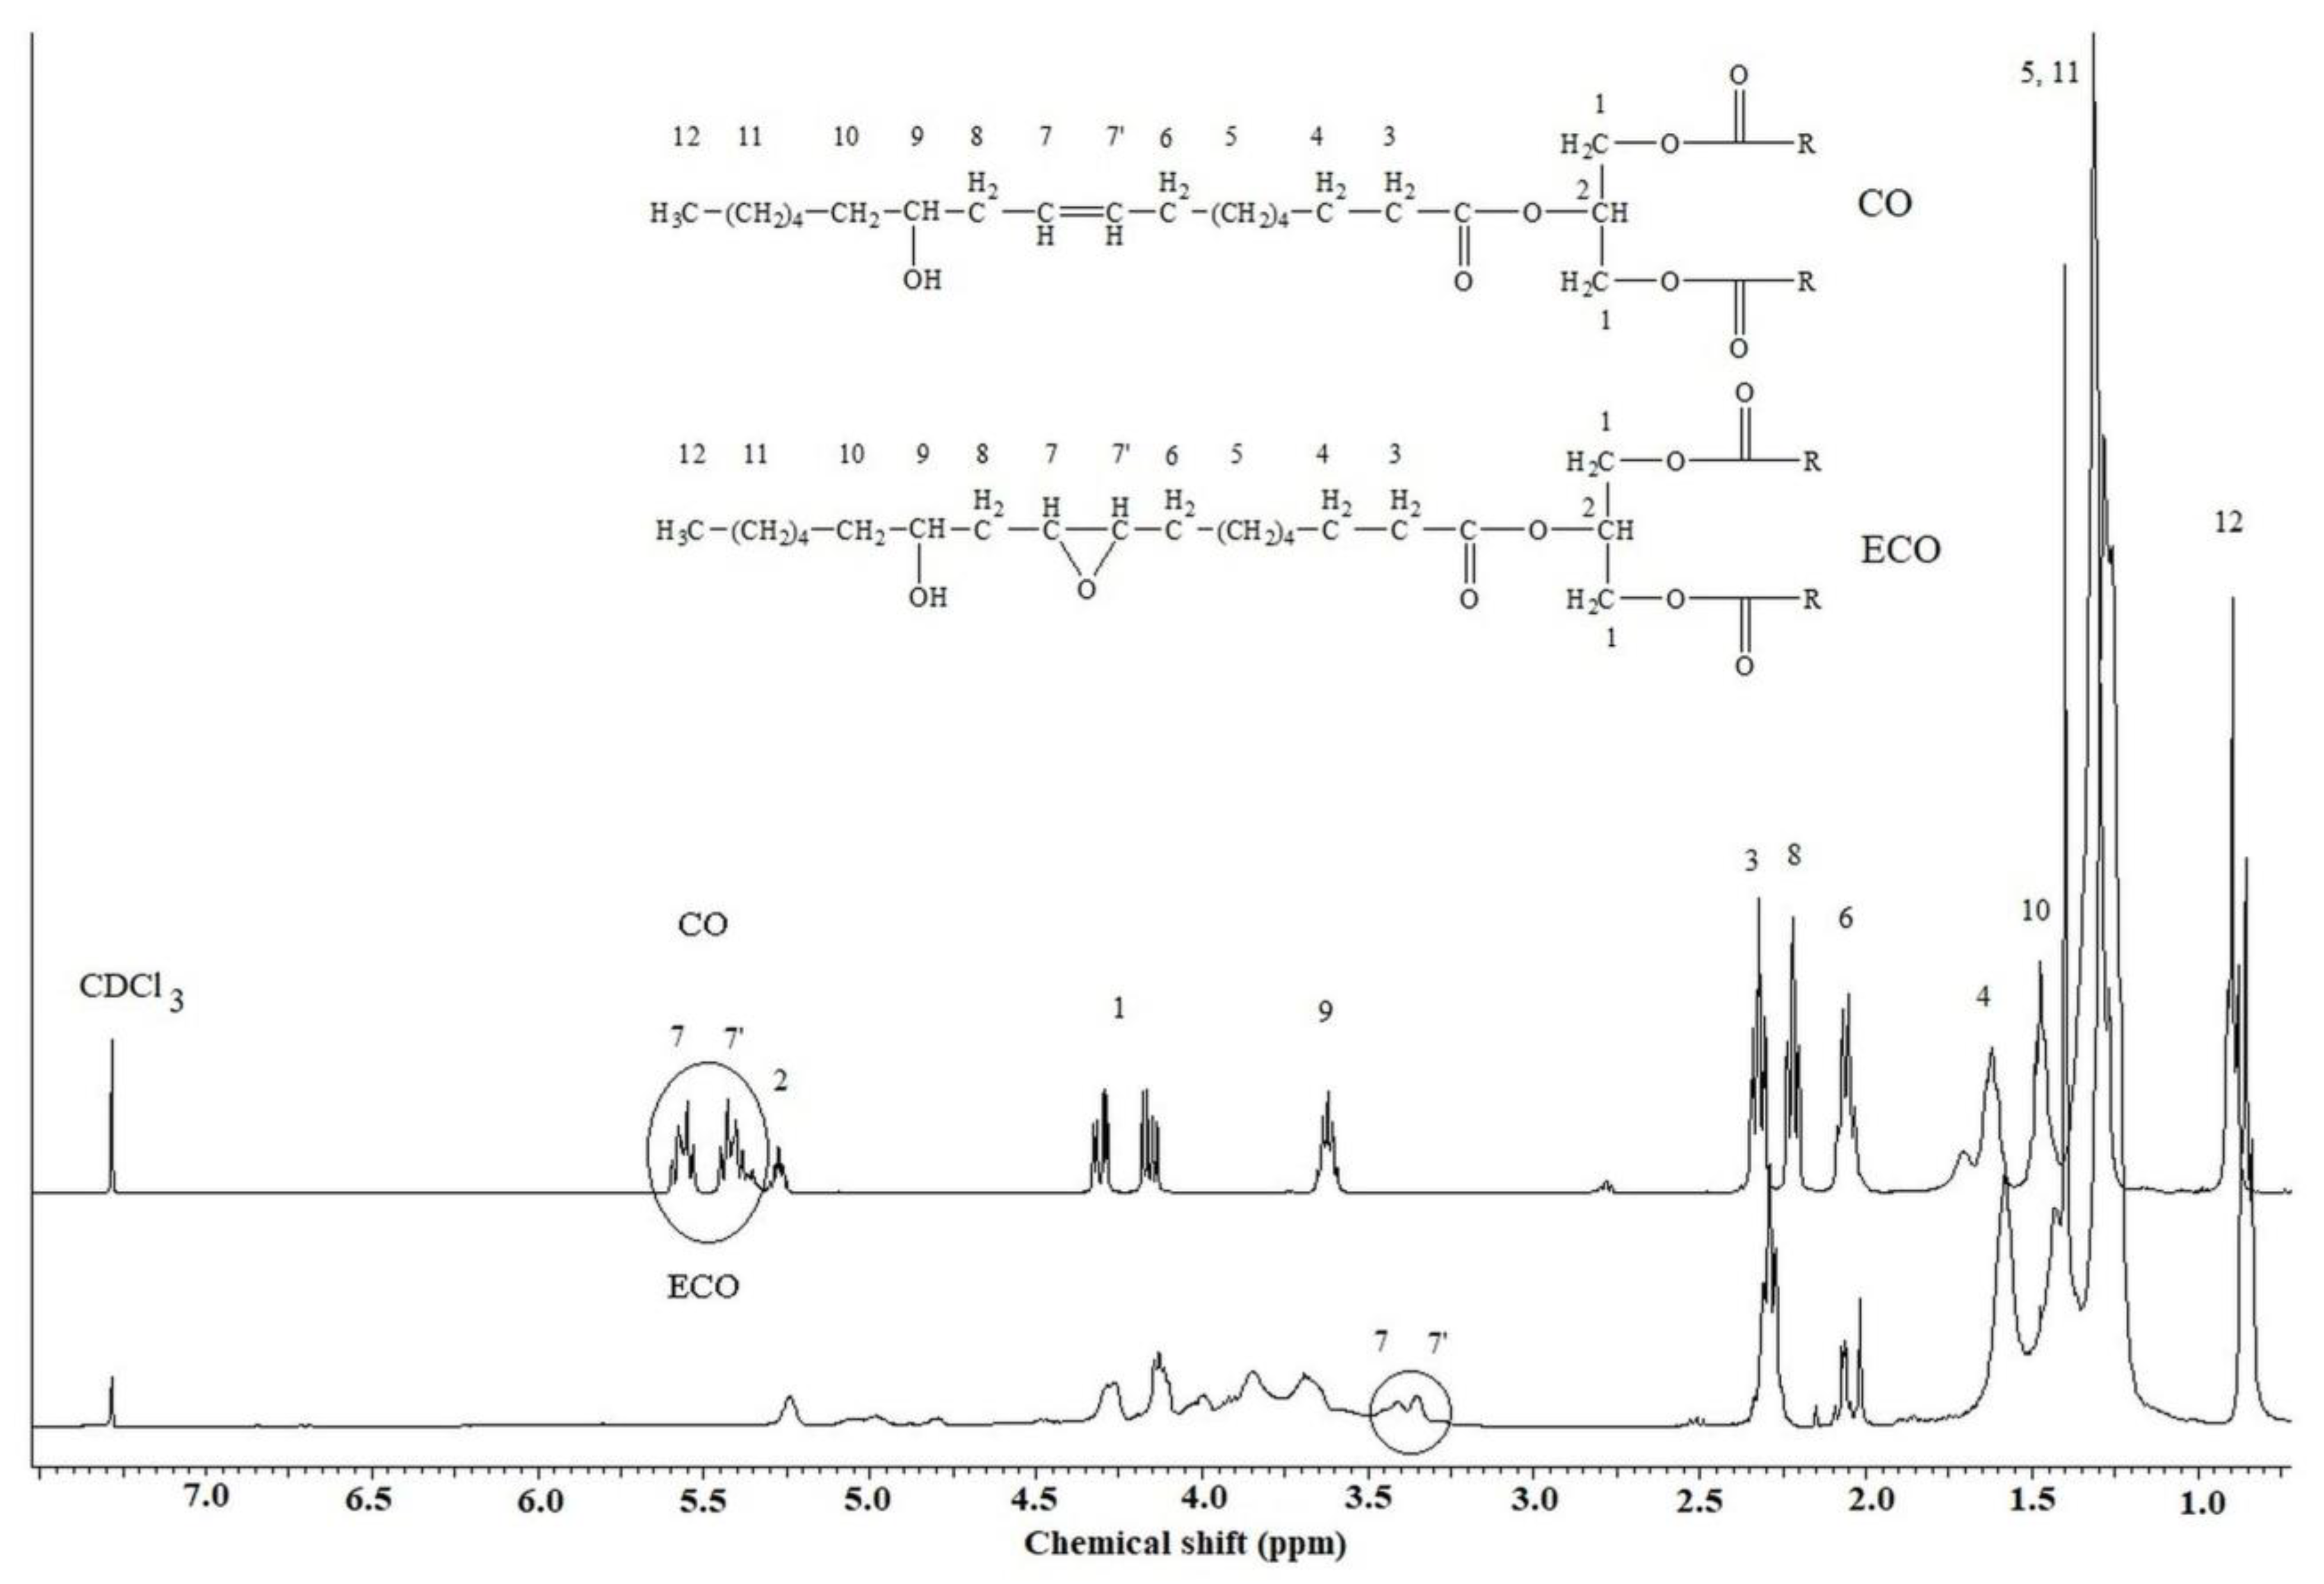
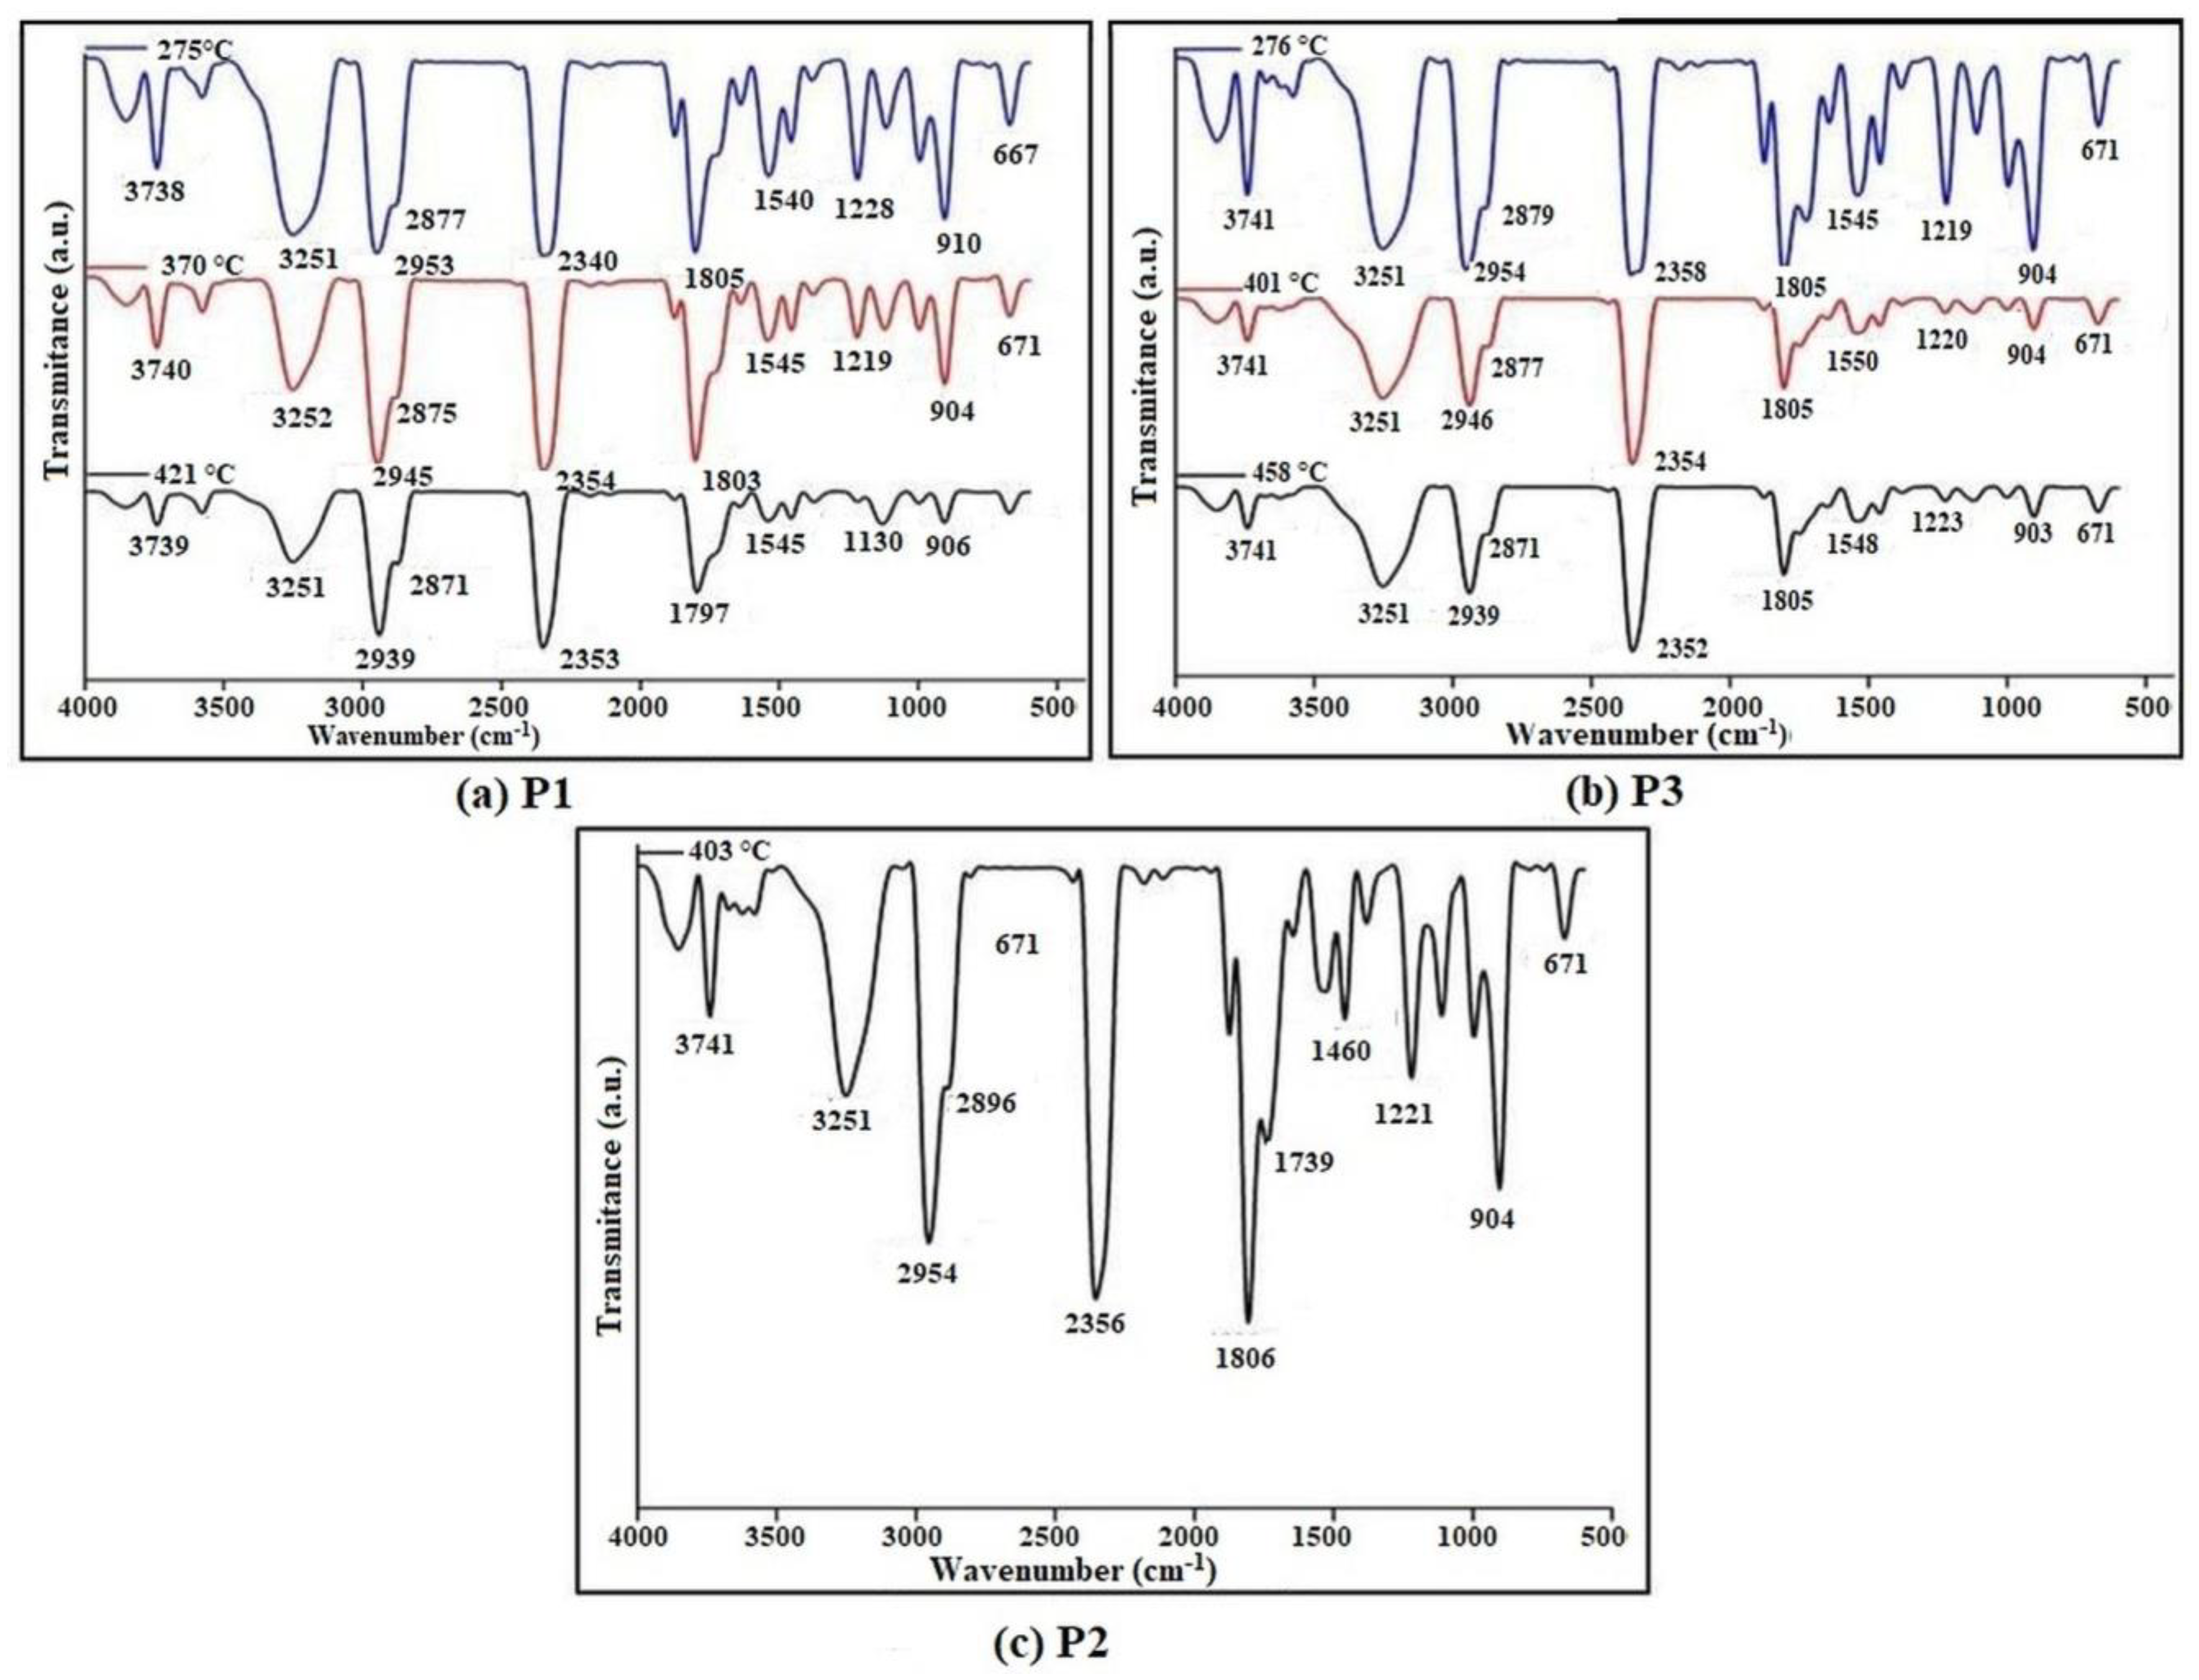
4.1. FT-IR and 1H-NMR Characterization
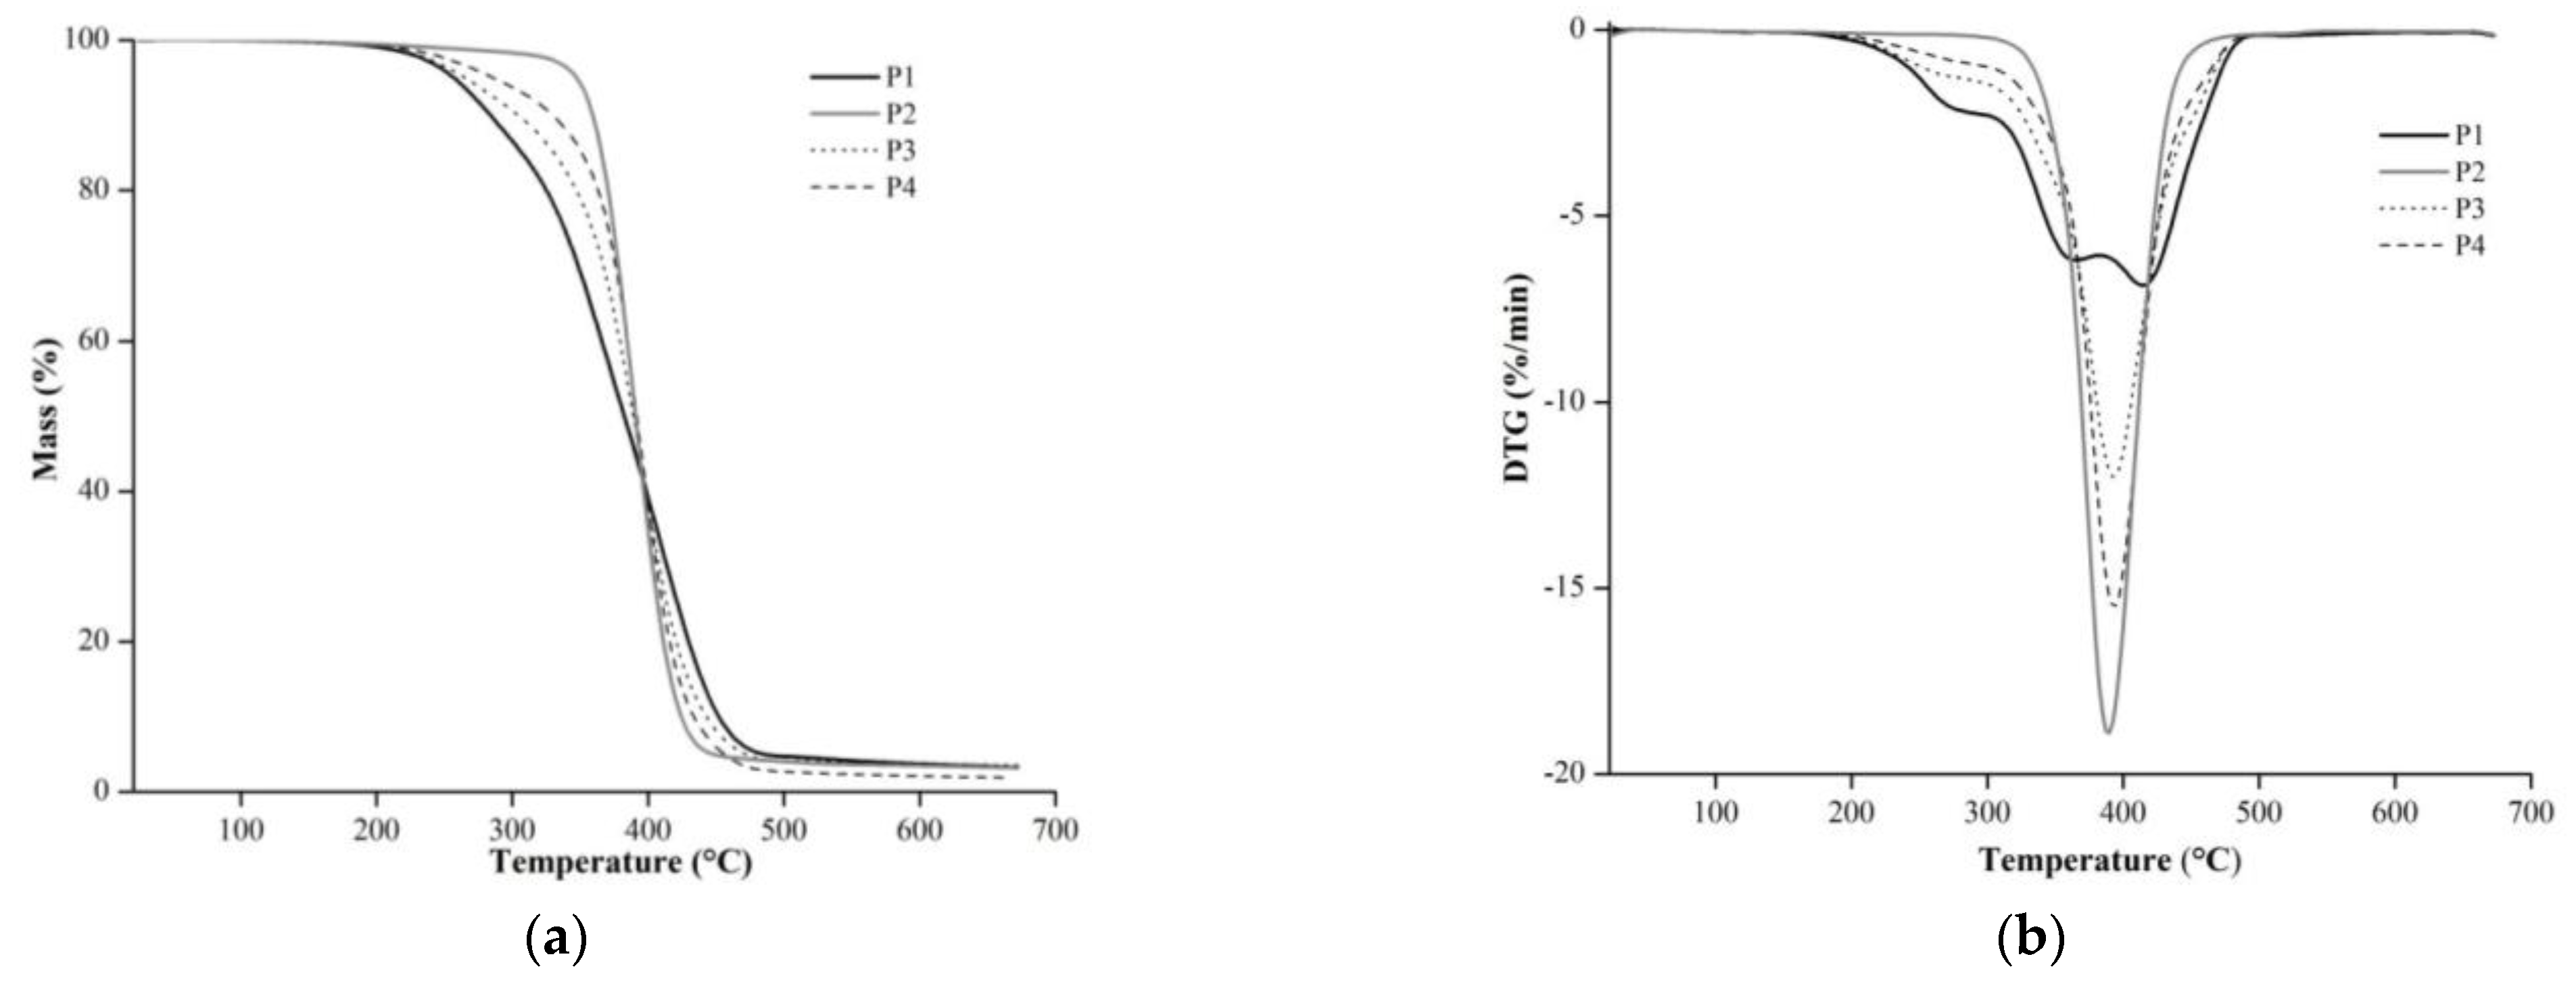
4.2. Thermal Analyses
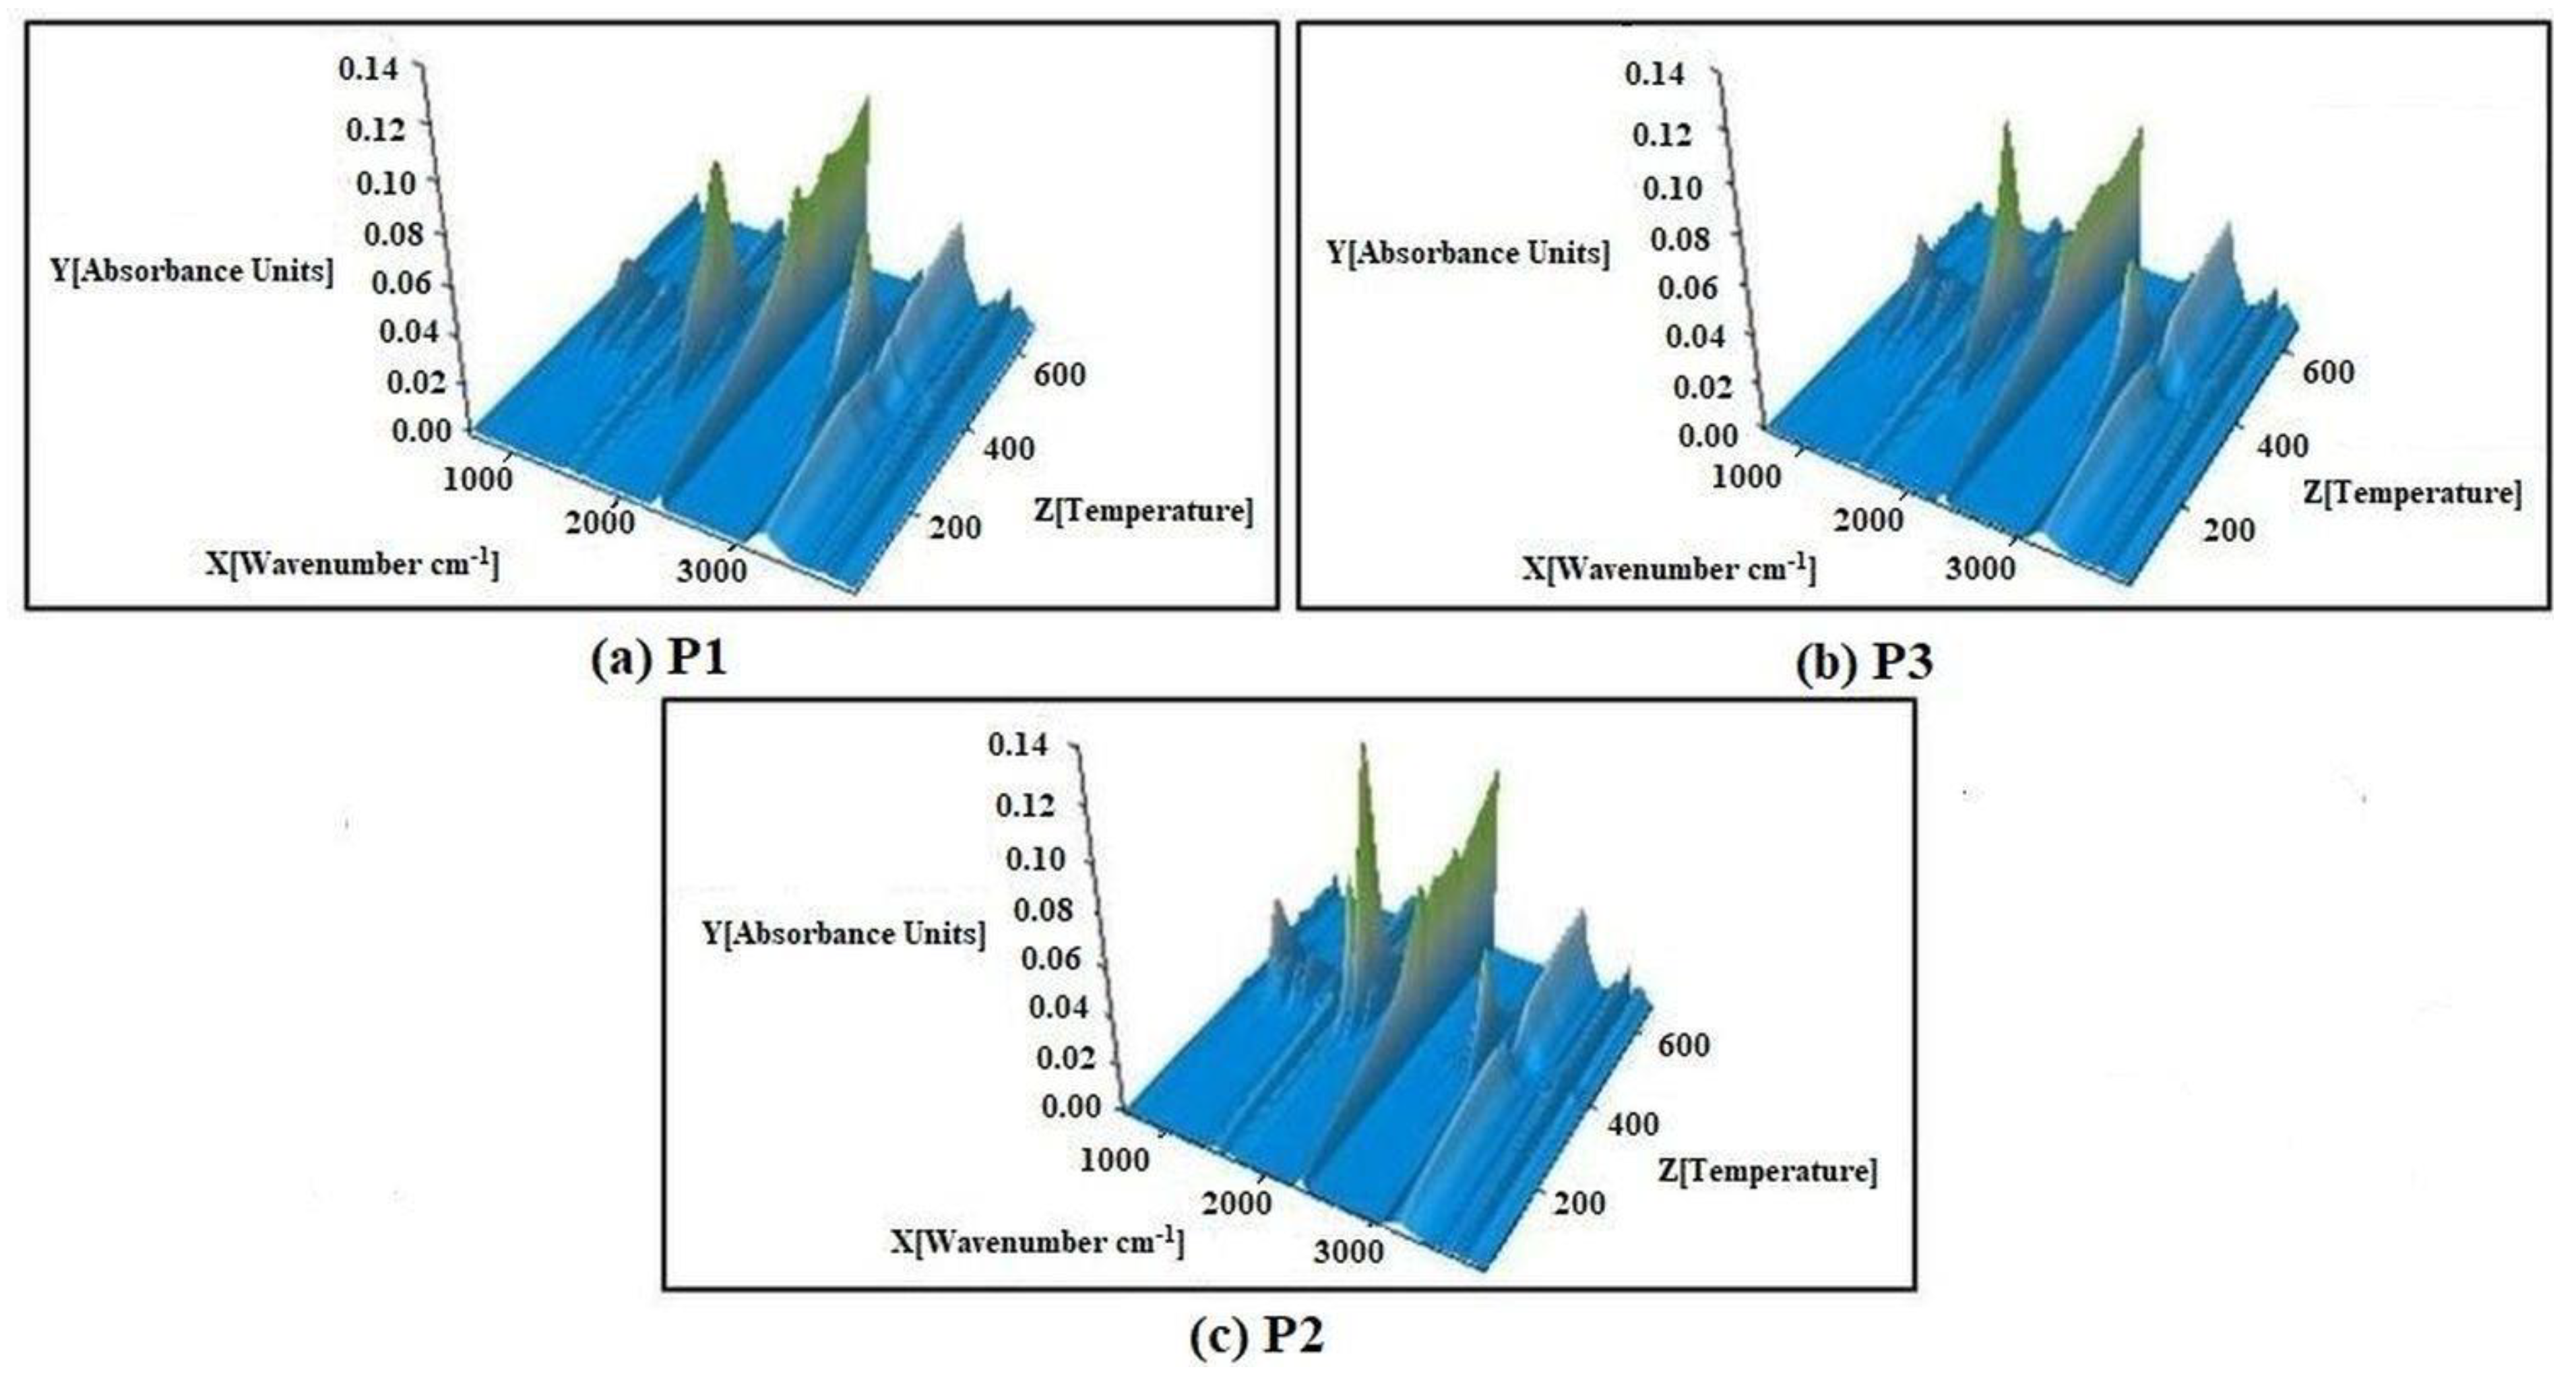
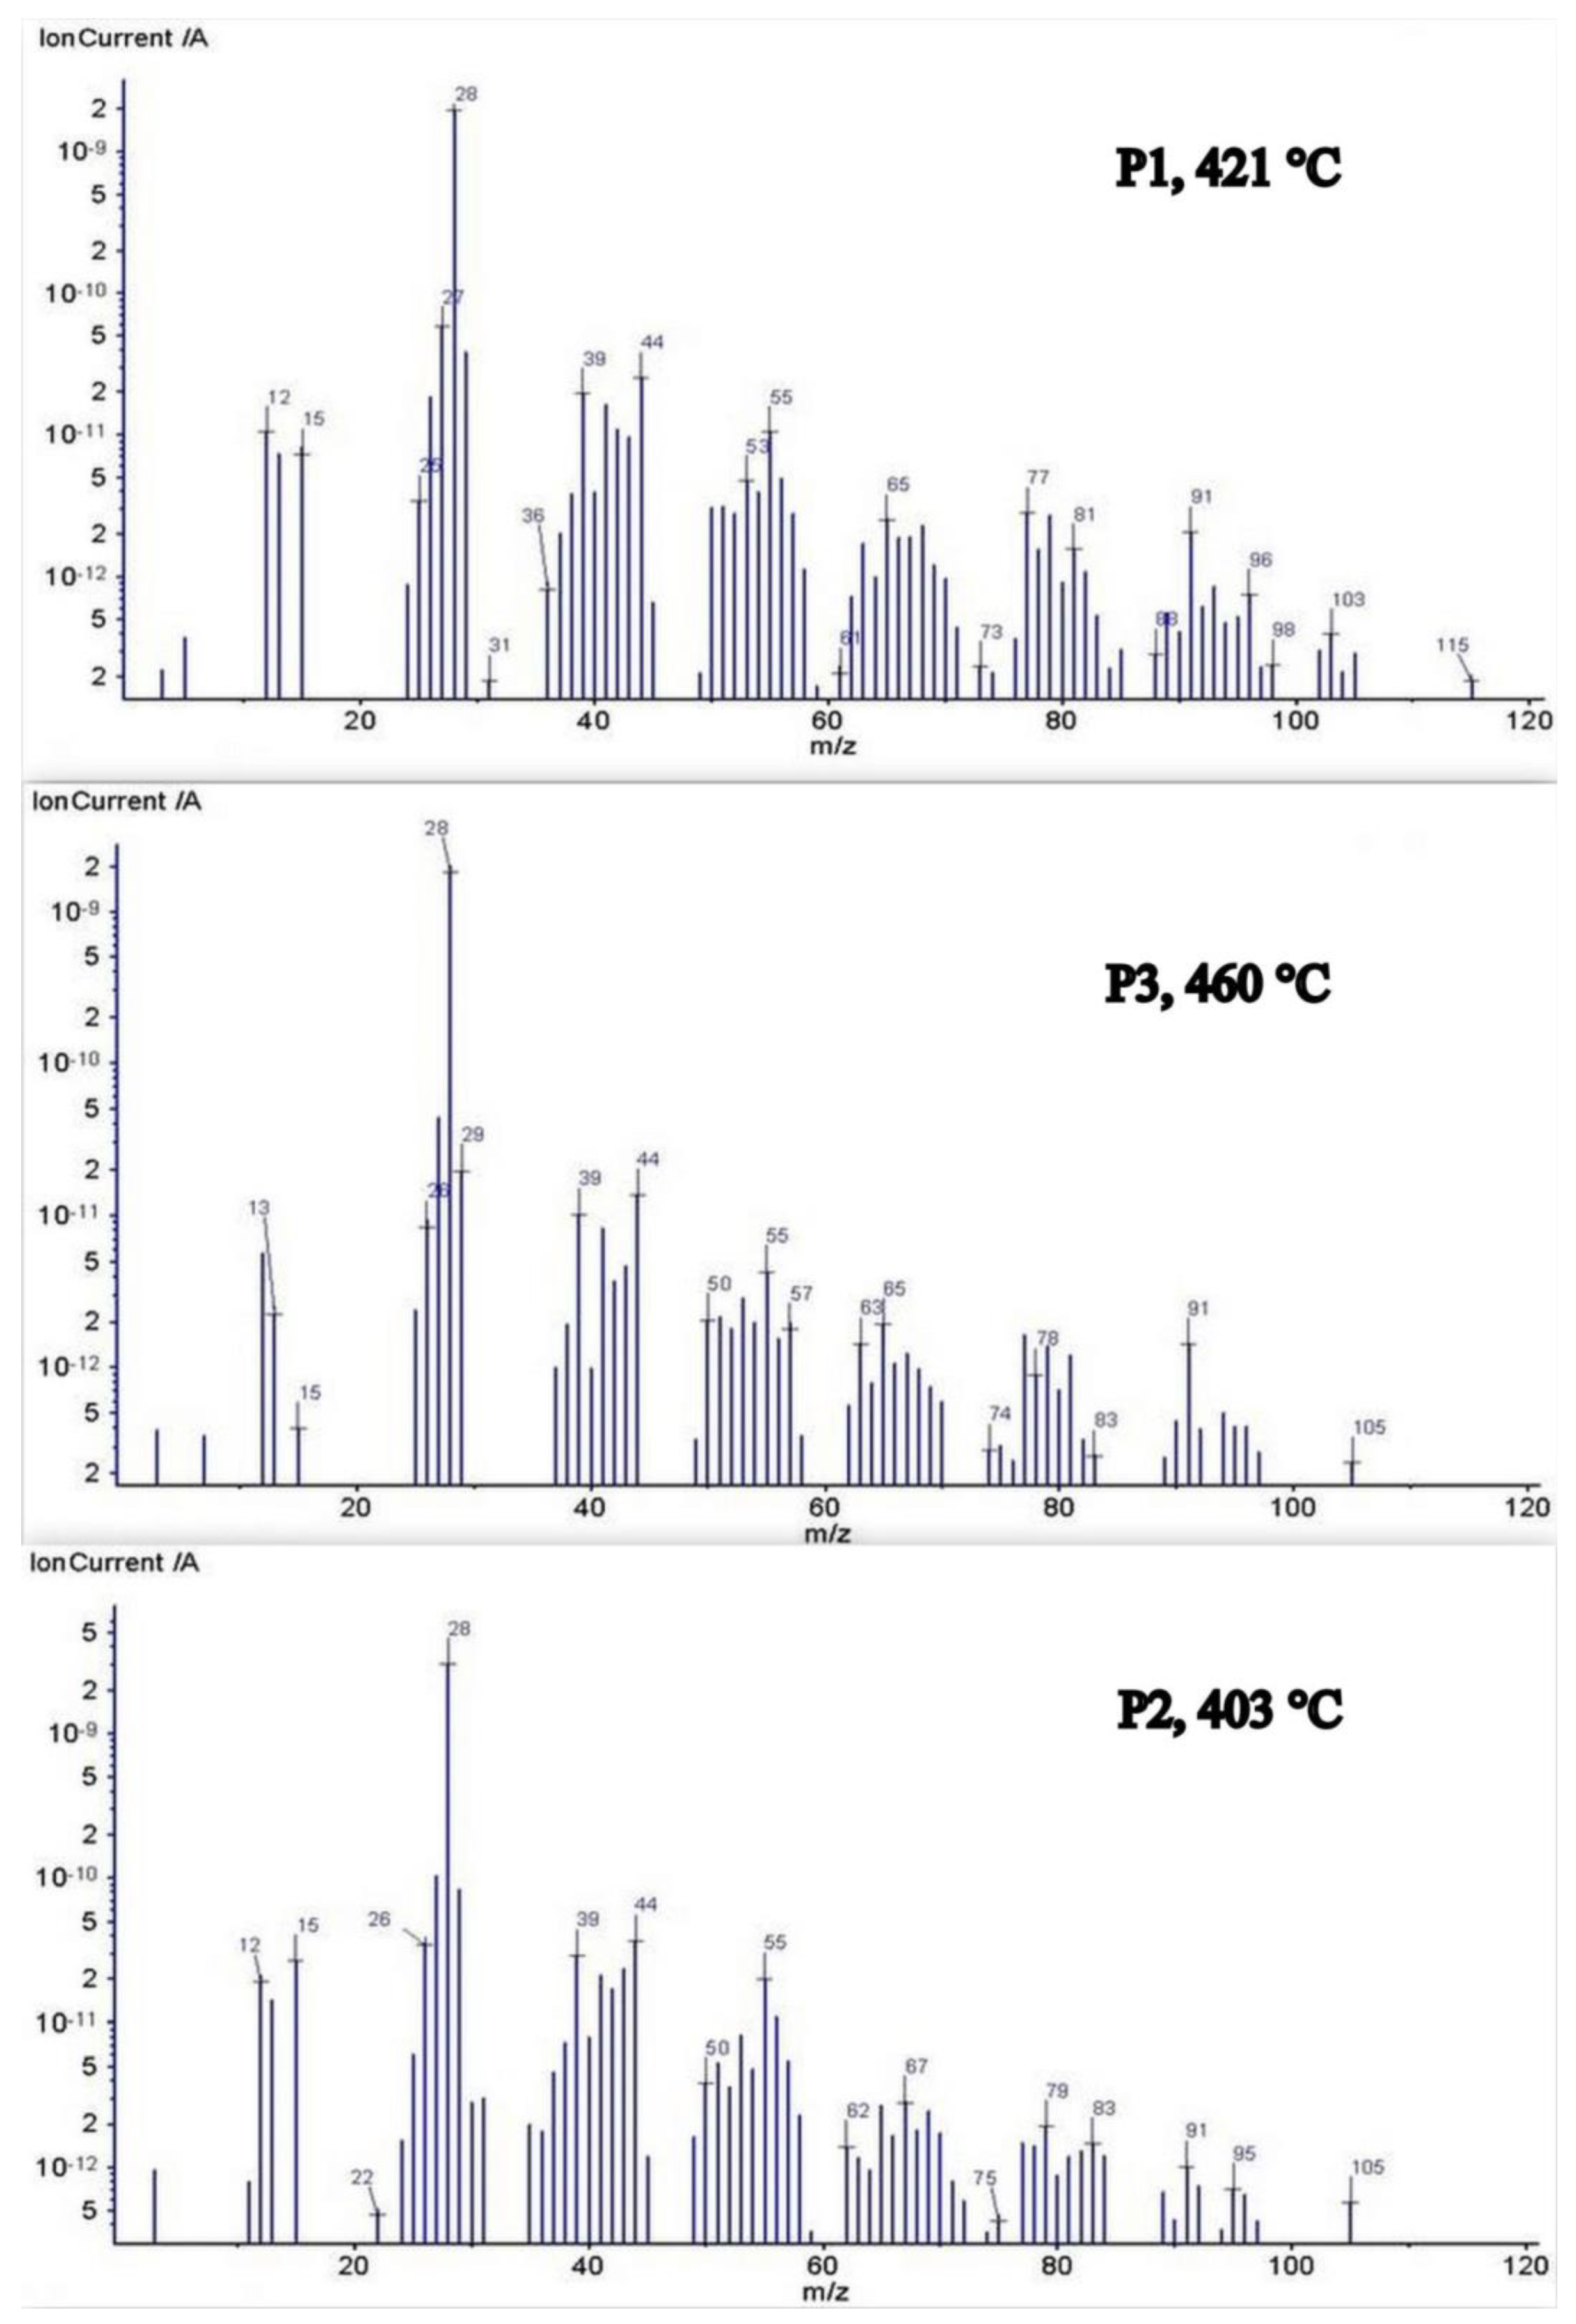
4.2.1. Evolved Gas Analysis
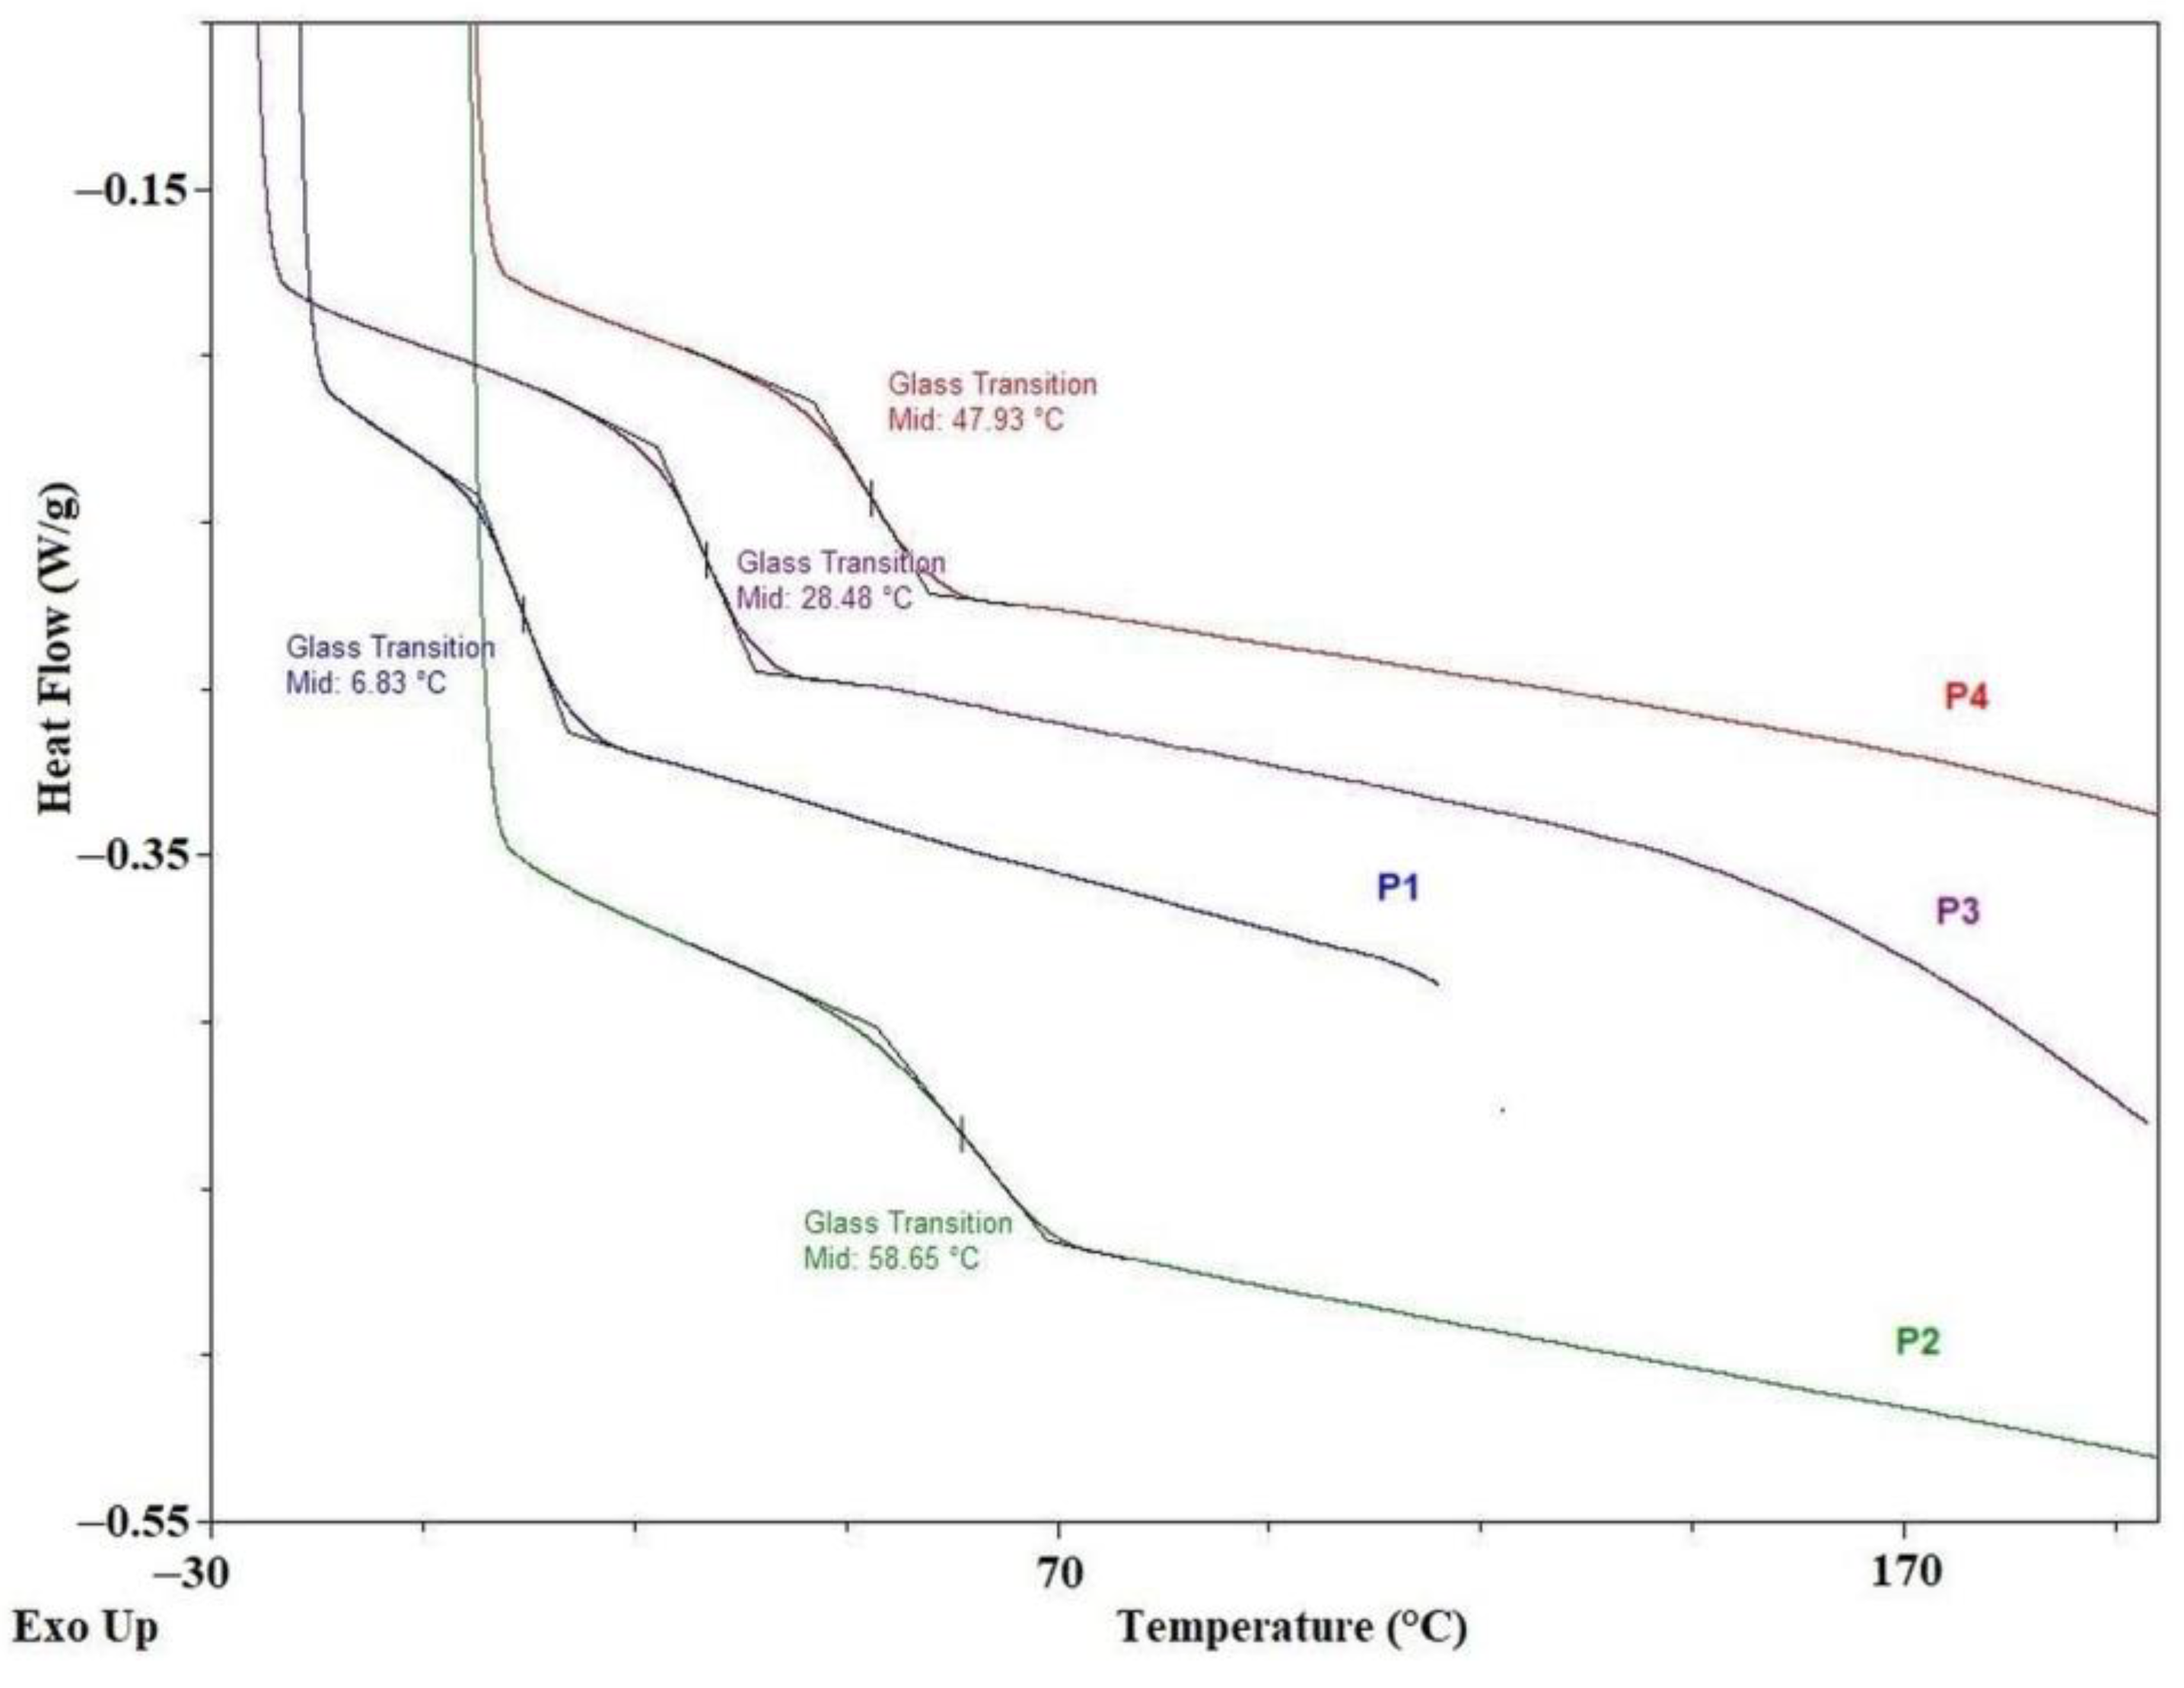
4.2.2. DSC Measurements
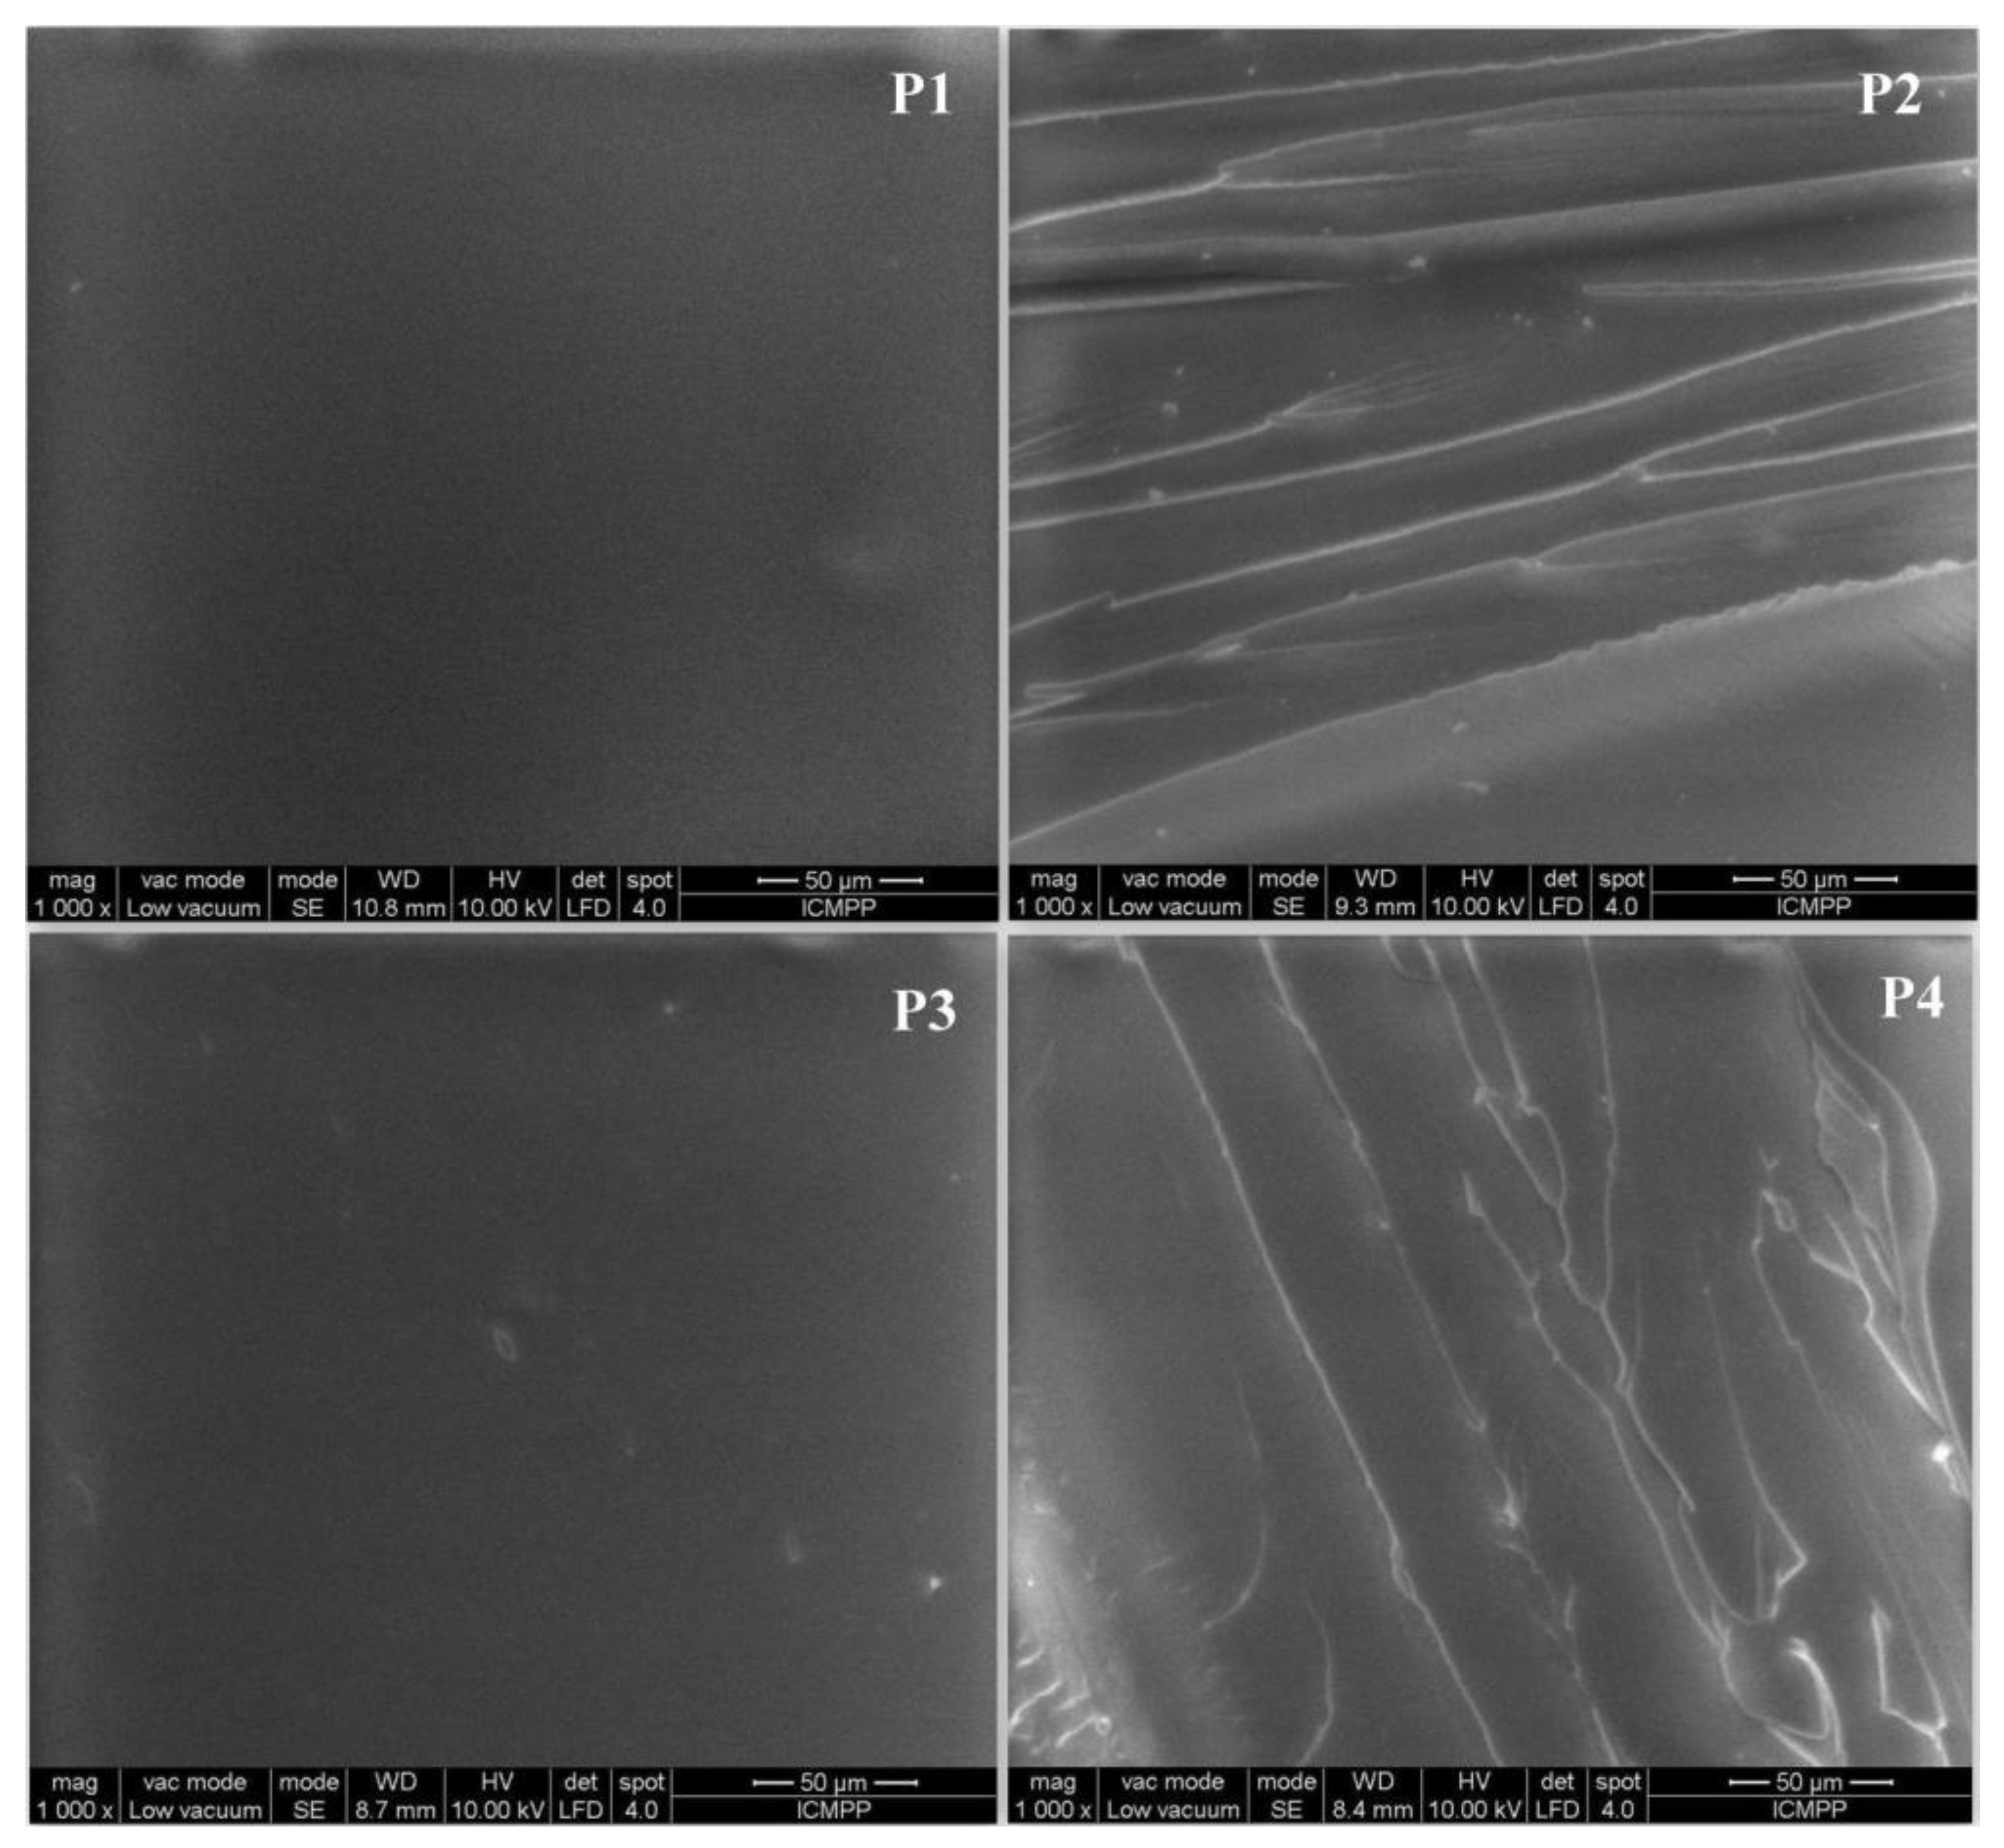
4.3. SEM
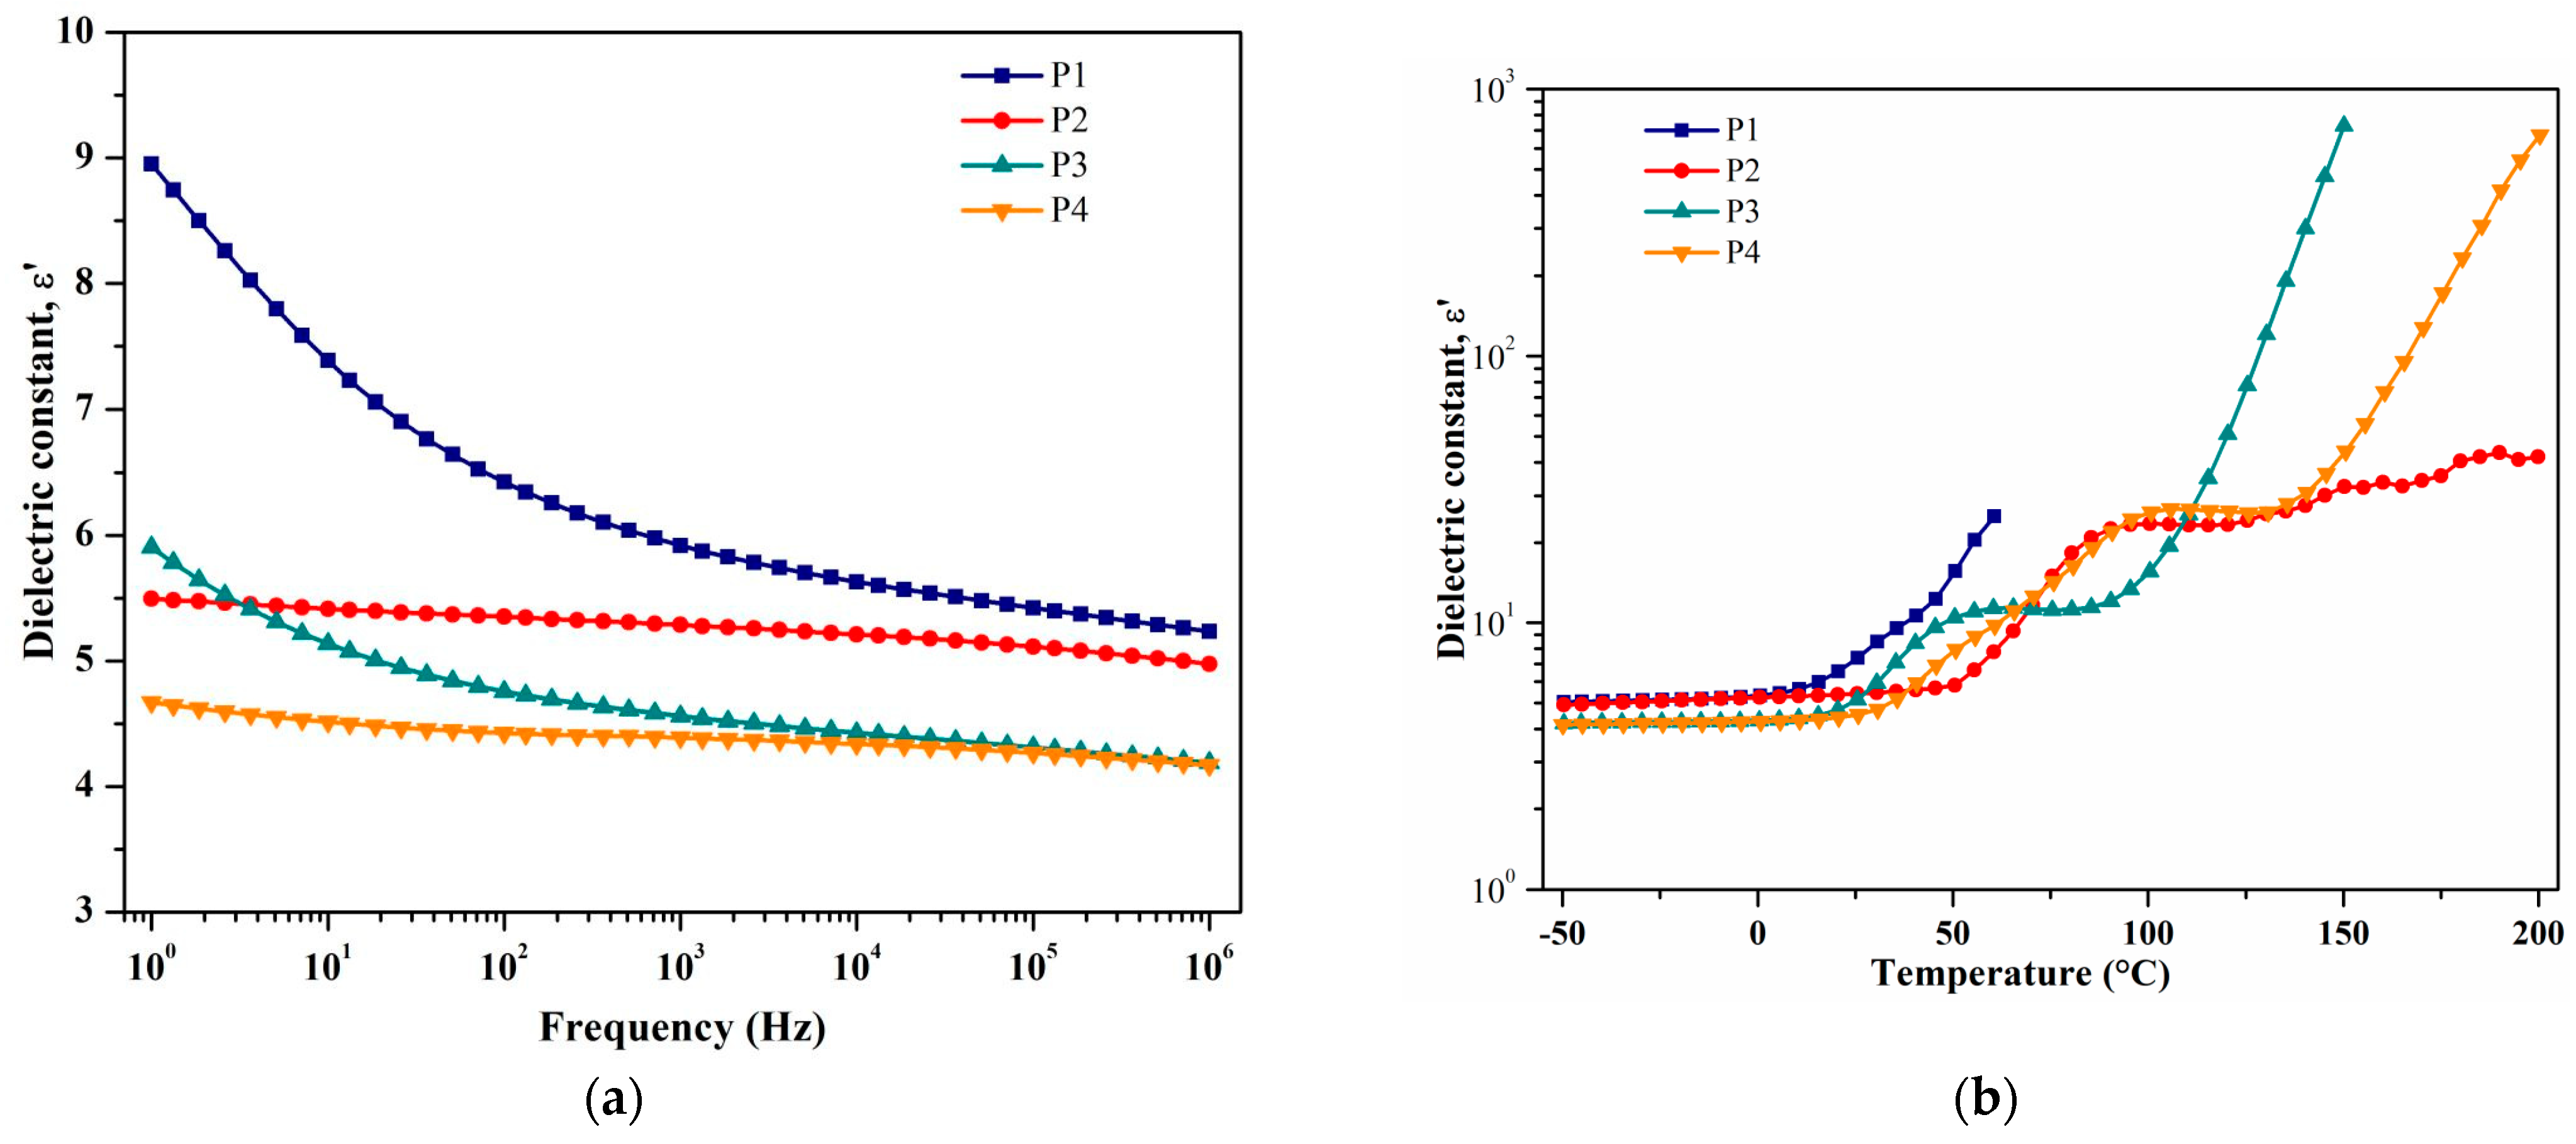
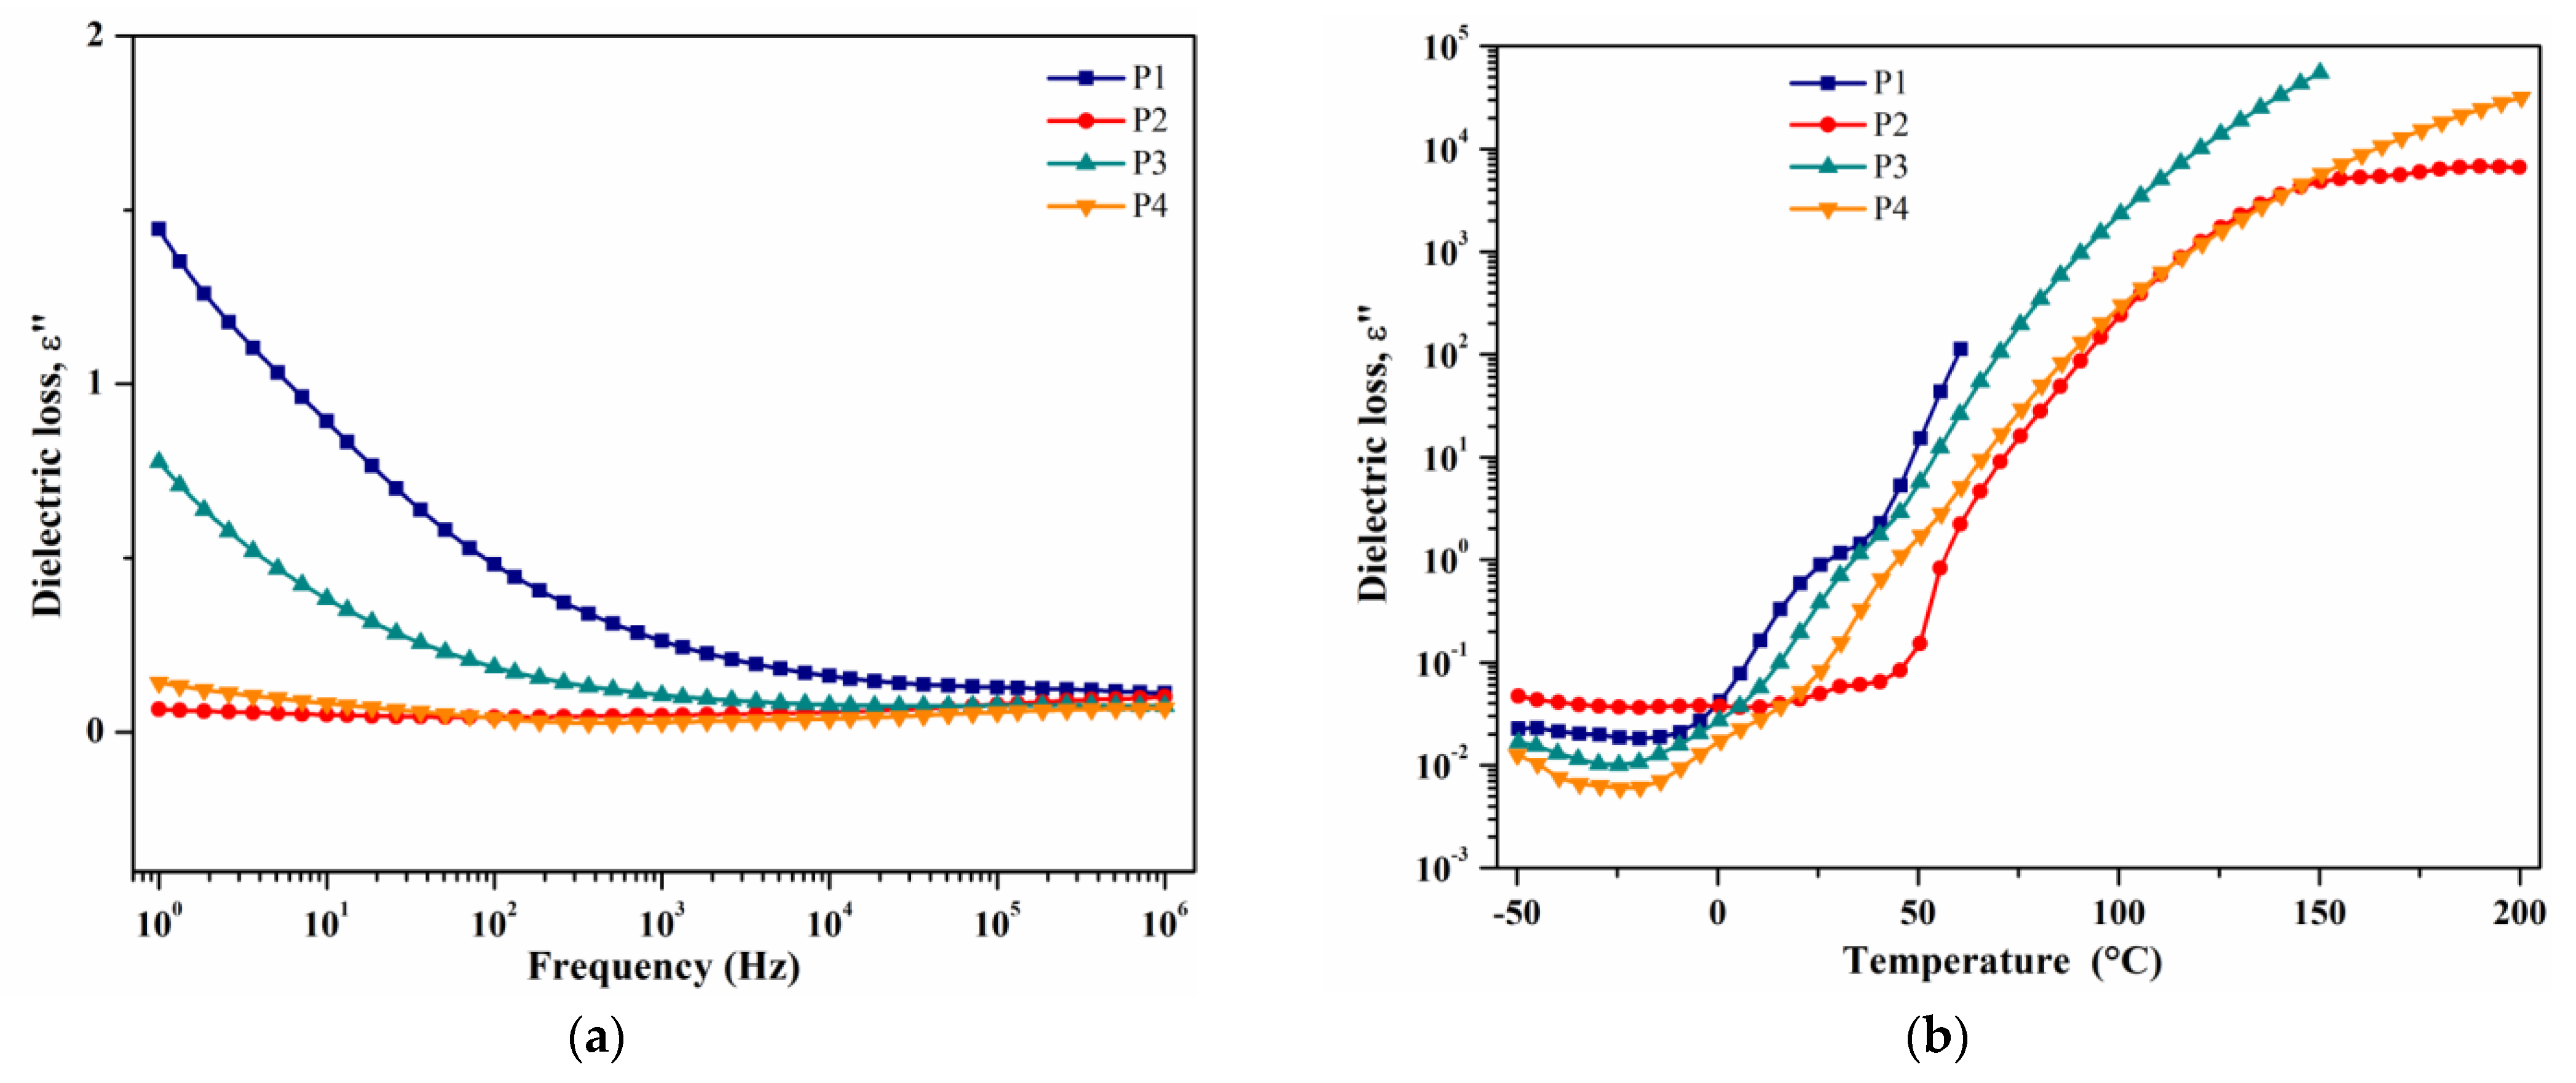
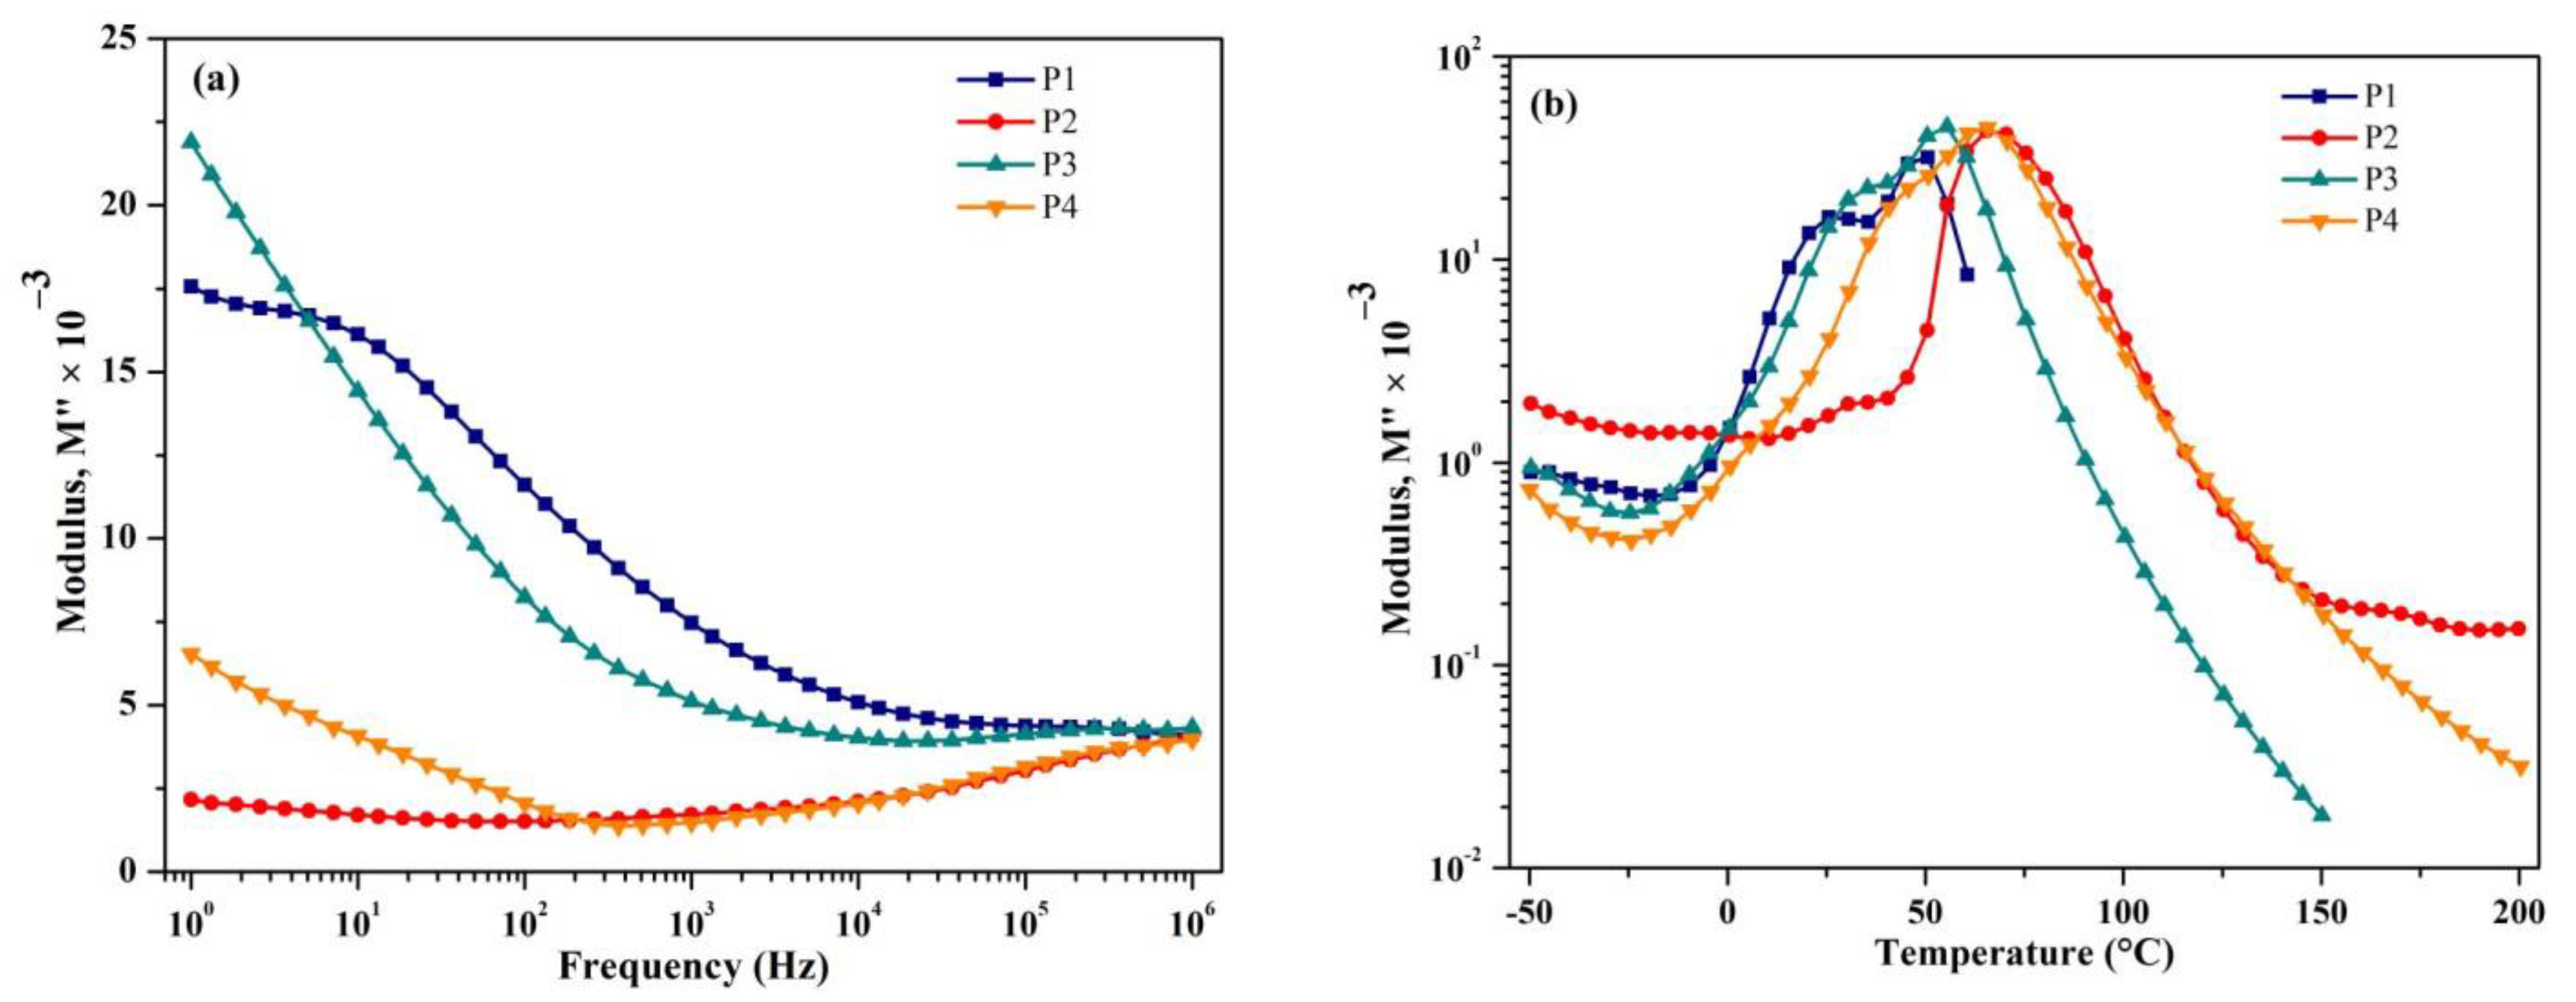
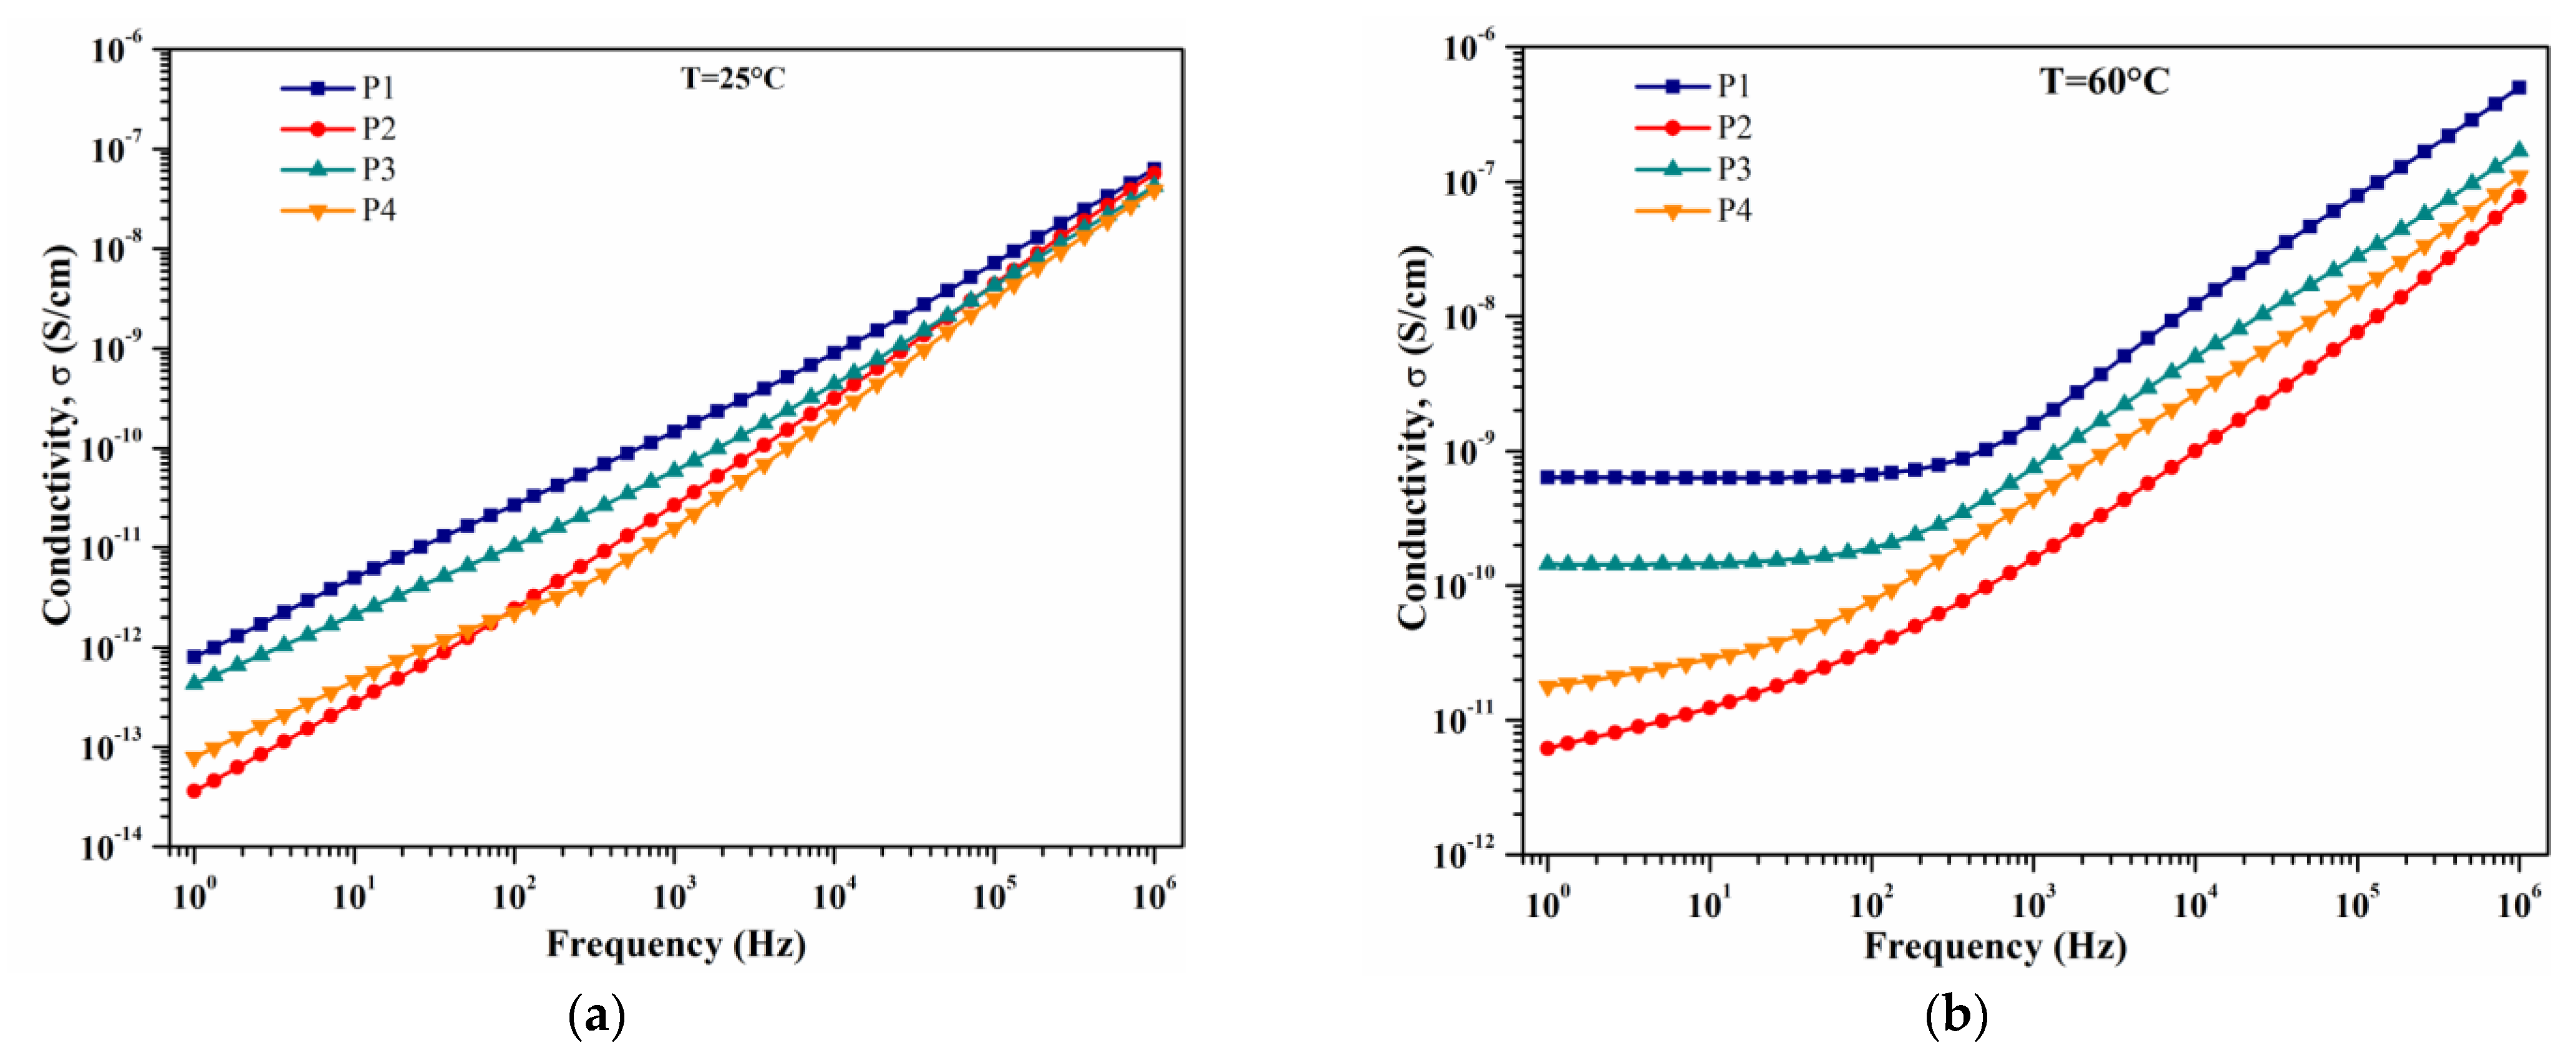
4.4. Dielectric Measurements
4.5. Water Absorption
5. Conclusions
Author Contributions
Funding
Institutional Review Board Statement
Informed Consent Statement
Data Availability Statement
Conflicts of Interest
References
- Maiuolo, L.; Olivito, F.; Algieri, V.; Costanzo, P.; Jiritano, A.; Tallarida, M.A.; Tursi, A.; Sposato, C.; Feo, A.; De Nino, A. Synthesis, Characterization and Mechanical Properties of Novel Bio-Based Polyurethane Foams Using Cellulose-Derived Polyol for Chain Extension and Cellulose Citrate as a Thickener Additive. Polymers 2021, 13, 2802. [Google Scholar] [CrossRef] [PubMed]
- Chakraborty, I.; Chatterjee, K. Polymers and composites derived from castor oil as sustainable materials and degradable biomaterials: Current status and emerging trends. Biomacromolecules 2020, 21, 4639–4662. [Google Scholar] [CrossRef] [PubMed]
- Barrett, L.W.; Sperling, L.H.; Murphy, C.J. Naturally functionalized triglyceride oils in interpenetrating polymer networks. J. Am. Oil Chem. Soc. 1993, 70, 523–534. [Google Scholar] [CrossRef]
- Güner, F.S.; Yagci, Y.A.; Erciyes, T. Polymers from triglyceride oils. Progr. Polym. Sci. 2006, 31, 633–670. [Google Scholar] [CrossRef]
- Samarth, N.; Mahanwar, P. Modified vegetable oil based additives as a future polymeric material—Review. Open J. Org. Polym. Mat. 2015, 5, 1–22. [Google Scholar] [CrossRef]
- Bussell, G.W. Maleinized Fatty Acid Esters of 9-Oxatetracyclo-4.4. 1 OO Undecan-4-ol. U.S. Patent 3,855,163, 17 December 1974. [Google Scholar]
- Hodakowski, L.E.; Osborn, C.L.; Harris, E.B. Polymerizable Epoxide-Modified Compositions. U.S. Patent 4,119,640, 10 July 1975. [Google Scholar]
- Trecker, D.J.; Borden, G.W.; Smith, O.W. Method for Curing Acrylated Epoxidized Soybean Oil Amine Compositions. U.S. Patent 3,979,270, 7 September 1976. [Google Scholar]
- Syahrullaila, S.; Kamitanib, S.; Shakirina, A. Performance of vegetable oil as lubricant in extreme pressure condition. Procedia Eng. 2013, 68, 172–177. [Google Scholar] [CrossRef]
- Lligadas, G.; Ronda, J.C.; Galià, M.; Cádiz, V. Renewable polymeric materials from vegetable oils: A perspective. Mater. Today 2013, 16, 337–343. [Google Scholar] [CrossRef]
- Miao, S.; Wang, P.; Su, Z.; Zhang, S. Vegetable-oil-based polymers as future polymeric biomaterials. Acta Biomater. 2014, 10, 1692–1704. [Google Scholar] [CrossRef]
- Nurchi, C.; Buonvino, S.; Arciero, I.; Melino, S. Sustainable vegetable oil-based biomaterials: Synthesis and biomedical applications. Int. J. Mol. Sci. 2023, 24, 2153. [Google Scholar] [CrossRef]
- Thomas, J.; Soucek, M.D. Cationic copolymers of norbornylized seed oils for fiber-reinforced composite applications. ACS Omega 2022, 7, 33949–33962. [Google Scholar] [CrossRef]
- Wang, Q.; Thomas, J.; Soucek, M.D. Investigation of UV-curable alkyd coating properties. J. Coat. Technol. Res. 2023, 20, 545–557. [Google Scholar] [CrossRef]
- Thomas, J.; Bouscher, R.F.; Nwosu, J.; Soucek, M.D. Sustainable thermosets and composites based on the epoxides of norbornylized seed oils and biomass fillers. ACS Sustain. Chem. Eng. 2022, 10, 12342–12354. [Google Scholar] [CrossRef]
- Thomas, J.; Nwosu, J.; Soucek, M.D. Acid-cured norbornylized seed oil epoxides for sustainable, recyclable, and reprocessable thermosets and composite application. ACS Appl. Polym. Mater. 2023, 5, 2230–2242. [Google Scholar] [CrossRef]
- Jin, F.L.; Park, S.J. Thermomechanical behavior of epoxy resins modified with epoxidized vegetable oils. Polym. Int. 2008, 57, 577–583. [Google Scholar] [CrossRef]
- Stemmelen, M.; Lapinte, V.; Habas, J.P.; Robin, J.J. Plant oil-based epoxy resins from fatty diamines and epoxidized vegetable oil. Eur. Polym. J. 2015, 68, 536–545. [Google Scholar] [CrossRef]
- Thulasiraman, V.; Rakesh, S.; Sarojadevi, M. Synthesis and characterization of chlorinated soy oil based epoxy resin/glass fiber composites. Polym Compos. 2009, 30, 49–58. [Google Scholar] [CrossRef]
- Mashouf Roudsari, G.M.; Mohanty, A.K.; Misra, M. Study of the curing kinetics of epoxy resins with biobased hardener and epoxidized soybean oil. ACS Sustain. Chem. Eng. 2014, 2, 2111–2116. [Google Scholar] [CrossRef]
- Di Mauro, C.; Genua, A.; Mija, A. Building thermally and chemically reversible covalent bonds in vegetable oil based epoxy thermosets. Influence of epoxy–hardener ratio in promoting recyclability. Mat. Adv. 2020, 1, 1788–1798. [Google Scholar] [CrossRef]
- Jadhav, P.D.; Patwardhan, A.V.; Kulkarn, R.D. Kinetic study of in situ epoxidation of mustard oil. Mol. Catal. 2021, 511, 111748. [Google Scholar] [CrossRef]
- Di Mauro, C.; Malburet, S.; Genua, A.; Graillot, A.; Mija, A. Sustainable series of new epoxidized vegetable oil-based thermosets with chemical recycling properties. Biomacromolecules 2020, 21, 3923–3935. [Google Scholar] [CrossRef]
- Grauzeliene, S.; Navaruckiene, A.; Skliutas, E.; Malinauskas, M.; Serra, A.; Ostrauskaite, J. Vegetable oil-based thiol-ene/thiol-epoxy resins for laser direct writing 3D micro-/nano-lithography. Polymers 2021, 13, 82. [Google Scholar] [CrossRef] [PubMed]
- Dinu, R.; Briand, N.; Mija, A. Influence of keratin on epoxidized linseed oil curing and thermoset performances. ACS Sustainable Chem. Eng. 2021, 9, 15641–15652. [Google Scholar] [CrossRef]
- Dinu, R.; Bejenari, I.; Volf, I.; Mija, A. Vegetable oil-based resins reinforced with spruce bark powder and with Its hydrochar lignocellulosic biomass. Appl. Sci. 2021, 11, 10649. [Google Scholar] [CrossRef]
- Dinu, R.; Mija, A. Bio-based epoxy resins and composites from epoxidized linseed oil crosslinked with different cyclic anhydrides and their combination with lignin. Cellul. Chem. Technol. 2020, 54, 925–938. [Google Scholar] [CrossRef]
- Di Mauro, C.; Tran, T.-N.; Mija, A. One-Pot terpolymerization synthesis of high carbon biocontent recyclable epoxy thermosets and their composites with flax woven fibers. ACS Sustain. Chem. Eng. 2021, 9, 8526–8538. [Google Scholar] [CrossRef]
- Di Mauro, C.; Genua, A.; Mija, A. Fully bio-based reprocessable thermosetting resins based on epoxidized vegetable oils cured with itaconic acid. Ind. Crops Prod. 2022, 185, 115116. [Google Scholar] [CrossRef]
- Di Mauro, C.; Mija, A. Influence of the presence of disulphide bonds in aromatic or aliphatic dicarboxylic acid hardeners used to produce reprocessable epoxidized thermosets. Polymers 2021, 13, 534. [Google Scholar] [CrossRef]
- Di Mauro, C.; Genua, A.; Rymarczyk, M.; Dobbels, C.; Malburet, S.; Graillot, A.; Mija, A. Chemical and mechanical reprocessed resins and bio-composites based on five epoxidized vegetable oils thermosets reinforced with flax fibers or PLA woven. Compos. Sci. Technol. 2021, 205, 108678. [Google Scholar] [CrossRef]
- Di Mauro, C.; Genua, A.; Mija, A. Kinetical study, thermo-mechanical characteristics and recyclability of epoxidized camelina oil cured with antagonist structure (Aliphatic/Aromatic) or functionality (acid/amine) hardeners. Polymers 2021, 13, 2503. [Google Scholar] [CrossRef]
- Nepomuceno, N.C.; Fook, M.V.L.; Ries, A.; Mija, A.; Wellen, R.M.R. Bio-based epoxy resins of epoxidized soybean oil cured with salicylic acid loaded with chitosan: Evaluation of physical–chemical properties. J. Polym. Environ. 2023, 31, 2566–2575. [Google Scholar] [CrossRef]
- Chong, K.L.; Lai, J.C.; Rahman, R.A.; Adrus, N.; Al-Saffar, Z.H.; Hassan, A.; Lim, T.H.; Wahit, M.U. A review on recent approaches to sustainable bio-based epoxy vitrimer from epoxidized vegetable oils. Ind. Crops Prod. 2022, 189, 115857. [Google Scholar] [CrossRef]
- Akindoyo, J.O.; Beg, M.D.H.; Ghazali, S.; Islam, M.R.; Jeyaratnam, N.; Yuvaraj, A.R. Polyurethane types, synthesis and applications-a review. RSC Adv. 2016, 6, 114453–114482. [Google Scholar] [CrossRef]
- Maisonneuve, L.; Chollet, G.; Grau, E.; Cramail, H. Vegetable oils: A source of polyols for polyurethane materials. OCL 2016, 23, D508. [Google Scholar] [CrossRef]
- Reddy Paluvai, N.; Mohanty, S.; Nayak, S.K. Synthesis and characterization of acrylated epoxidized castor oil nanocomposites. Int. J. Polym. Anal. Charact. 2015, 20, 298–306. [Google Scholar] [CrossRef]
- ASTM-D570; Standard Test Method for Water Absorption of Plastics. ASTM International: West Conshohocken, PA, USA, 1998; Reapproved 2018.
- Saeedi, I.A.; Andritsch, T.; Vaughan, A.S. On the dielectric behavior of amine and anhydride cured epoxy resins modified using multi-terminal epoxy functional network modifier. Polymer 2019, 11, 1271–1289. [Google Scholar] [CrossRef] [PubMed]
- Song, F.; Xia, H.; Jia, P.; Zhang, M.; Hu, L.; Zhou, Y. The effects of epoxidized acrylated castor oil (EACO) on soft poly (vinyl chloride) films as a main plasticizer. Polish J. Chem. Technol. 2018, 20, 13–19. [Google Scholar] [CrossRef]
- Sahoo, S.K.; Khandelwal, V.; Manik, G. Development of completely bio-based epoxy networks derived from epoxidized linseed and castor oil cured with citric acid. Polym. Adv. Technol. 2018, 29, 2080–2090. [Google Scholar] [CrossRef]
- Sharma, B.K.; Adhvaryu, A.; Liu, Z.; Erhan, S.Z. Chemical Modification of Vegetable Oils for Lubricant Applications. J. Am. Oil Chem. Soc. 2006, 83, 129–136. [Google Scholar] [CrossRef]
- Sankaranarayanan, S.; Srinivasan, K. Preparation of functionalized castor oil derivatives with tunable physical properties using heterogeneous acid and base catalysts. RSC Adv. 2015, 5, 50289–50297. [Google Scholar] [CrossRef]
- Fu, Q.; Long, Y.; Gao, Y.; Ling, Y.; Qian, H.; Wang, F.; Zhu, X. Synthesis and properties of castor oil based plasticizers. RSC Adv. 2019, 9, 10049. [Google Scholar] [CrossRef]
- Hafiezal, M.R.M.; Abdan, K.; Abidin, Z.Z.; Azaman, M.D.; Hanafee, Z.M. Thermal and flammability characteristics of blended Jatropha bio-epoxy as matrix in carbon fiber–reinforced polymer. J. Compos. Sci. 2019, 3, 6. [Google Scholar] [CrossRef]
- Mustata, F.; Rosu, D.; Varganici, C.D.; Rosu, L.; Rosca, I.; Tudorachi, N. Assessing the thermal and fungal behavior of eco-friendly epoxy thermosets derived from vegetable oils for wood protective coatings. Progr. Org. Coat. 2022, 163, 106612. [Google Scholar] [CrossRef]
- Darie-Nita, R.N.; Irimia, A.; Grigoras, V.C.; Mustata, F.; Tudorachi, N.; Râpa, M.; Ludwiczak, J.; Iwanczuk, A. Evaluation of natural and modified castor oil incorporation on the melt rocessing and physico-chemical properties of polylactic acid. Polymers 2022, 14, 3608. [Google Scholar] [CrossRef]
- Mustata, F.; Tudorachi, N. Synthesis and thermal characterization of some hardeners for epoxy resins based on castor oil and cyclic anhydrides. Ind. Crop. Prod. 2021, 159, 113087. [Google Scholar] [CrossRef]
- Li, H.; Niu, S.; Lu, C. Pyrolysis Characteristics of castor oil through thermogravimetric coupled with fourier transform infrared spectroscopy. Procedia Eng. 2017, 205, 3705–3710. [Google Scholar] [CrossRef]
- Tudorachi, N.; Mustata, F. Thermal degradation and evolved gas analysis of some vegetable oils using TG/FT-IR/MS technique. J. Therm. Anal. Calorim. 2015, 119, 1703–1711. [Google Scholar] [CrossRef]
- Available online: https://webbook.nist.gov/chemistry/name-ser/ (accessed on 27 January 2023).
- Butnaru, I.; Constantin, C.P.; Asandulesa, M.; Wolińska-Grabczyk, A.; Jankowski, A.; Szeluga, U.; Damaceanu, M.D. Insights into molecular engineering of membranes based on fluorinated polyimide-polyamide miscible blends which do not obey the trade-off rule. Sep. Purif. Technol. 2020, 233, 116031. [Google Scholar] [CrossRef]
- Zheng, Y.; Chonung, K.; Jin, X.; Wei, P.; Jiang, P. Study on the curing reaction, dielectric and thermal performances of epoxy impregnating resin with reactive silicon compounds as new diluents. J. Appl. Polym. Sci. 2008, 107, 3127–3313. [Google Scholar] [CrossRef]
- Asandulesa, M.; Chibac-Scutaru, A.L.; Culica, M.E.; Melinte, V.; Coseri, S. Cellulose-based films with enhanced load of nitrogen containing heterocycles: The impact on the surface morphology and proton conductivity. Appl. Surf. Sci. 2023, 607, 1550776. [Google Scholar] [CrossRef]


| Sample | Oil (g) | MHHPA (g) | TMP (g) |
|---|---|---|---|
| P1 | 3 | 1.7 | - |
| P2 | - | 2.5 | 1.5 |
| P3 | 1.09 | 0.9 | 0.27 |
| P4 | 0.68 | 0.95 | 0.68 |
| Sample | Degradation Stage | Tonset a (°C) | Tpeak b (°C) | W c (%) | Residual Mass (%) | T5% d (°C) | T10% d (°C) | T30% d (°C) | Ts e (°C) | Tg f (°C) | TGS g (°C) |
|---|---|---|---|---|---|---|---|---|---|---|---|
| P1 | I | 228 | 277 | 13.53 | 3.16 | 258 | 283 | 348 | 153 | 6.83 | 275 |
| II | 320 | 366 | 32.16 | 370 | |||||||
| III | 395 | 414 | 51.15 | 421 | |||||||
| P2 | I | 355 | 387 | 96.88 | 3.12 | 344 | 357 | 378 | 172 | 58.65 | 403 |
| I | 210 | 263 | 10.32 | 28.48 | 276 | ||||||
| P3 | II | 361 | 392 | 77.05 | 3.45 | 265 | 303 | 368 | 160 | 401 | |
| III | 440 | 456 | 9.18 | 458 | |||||||
| P4 | I | 214 | 270 | 7.28 | 1.78 | 285 | 330 | 375 | 166 | 47.93 | - |
| II | 365 | 393 | 80.05 | ||||||||
| III | 437 | 457 | 10.89 |
| Compound | Molecular Formula | MS Signals (m/z) | Sample |
|---|---|---|---|
| Carbon Monoxide | CO | 28, 29 | P1; P2; P3 |
| Carbon Dioxide | CO2 | 44, 28, 12, 22 | P1; P2; P3 |
| Methane | CH4 | 15, 13 | P1; P2; P3 |
| Propane | C3H8 | 29, 28, 27, 44, 26 | P1; P2; P3 |
| Butane | C4H10 | 43, 29, 27, 28 | P1; P2; P3 |
| Cyclohexane | C6H12 | 56, 84, 55, 54 | P1; P2; P3 |
| Methylcyclohexane | C7H14 | 83, 55, 41, 98 | P1; P2; P3 |
| Propene | C3H6 | 41, 42, 39, 40 | P1; P2; P3 |
| Hexadiene | C6H10 | 82, 67, 81, 68, 67, 65 | P1; P2; P3 |
| 3-Methylcyclohexene | C7H12 | 96, 81, 67, 95, 97 | P1; P2; P3 |
| 1,4-Cyclohexadiene | C6H8 | 80, 79, 77, 78 | P1; P2; P3 |
| Methanol | CH4O | 31, 32, 29, 15 | P1; P2 |
| Ethanol | C2H6O | 45, 46, 31, 29, 25 | P1; P2 |
| Propanol | C3H8O | 29, 42, 31, 41, 39 | P1; P2; P3 |
| Formaldehyde | CH2O | 29, 30, 28 | P1; P2; P3 |
| Acetone | C3H6O | 43, 58, 15, 42, 38 | P1; P2; P3 |
| Octan 2-one | C8H16O | 43, 58, 41, 71, 85, 53 | P1; P2; P3 |
| Heptanal | C7H14O | 70, 71, 55, 54, 45 | P1; P2; P3 |
| Butanoic acid, 1-methylbutyl ester | C9H12O2 | 71, 115, 89, 43, 55 | P1 |
| Diethoxymethane | C5H12O2 | 103, 104, 59, 58, 31, 29, 105 | P1; P2; P3 |
| Sample | Frequency (Hz) | Solubility in Water (%) | |||
|---|---|---|---|---|---|
| 100 Hz | 103 Hz | 106 Hz | RT | 100 °C | |
| P1 | 9.0 | 5.9 | 5.2 | 9.41 | 3.21 |
| P2 | 5.5 | 5.3 | 5.0 | 1.33 | 3.12 |
| P3 | 5.9 | 4.6 | 4.1 | 1.74 | 3.68 |
| P4 | 4.7 | 4.4 | 4.1 | 2.60 | 3.06 |
Disclaimer/Publisher’s Note: The statements, opinions and data contained in all publications are solely those of the individual author(s) and contributor(s) and not of MDPI and/or the editor(s). MDPI and/or the editor(s) disclaim responsibility for any injury to people or property resulting from any ideas, methods, instructions or products referred to in the content. |
© 2023 by the authors. Licensee MDPI, Basel, Switzerland. This article is an open access article distributed under the terms and conditions of the Creative Commons Attribution (CC BY) license (https://creativecommons.org/licenses/by/4.0/).
Share and Cite
Gaina, C.; Ursache, O.; Gaina, V.; Serban, A.-M.; Asandulesa, M. Novel Bio-Based Materials: From Castor Oil to Epoxy Resins for Engineering Applications. Materials 2023, 16, 5649. https://doi.org/10.3390/ma16165649
Gaina C, Ursache O, Gaina V, Serban A-M, Asandulesa M. Novel Bio-Based Materials: From Castor Oil to Epoxy Resins for Engineering Applications. Materials. 2023; 16(16):5649. https://doi.org/10.3390/ma16165649
Chicago/Turabian StyleGaina, Constantin, Oana Ursache, Viorica Gaina, Alexandru-Mihail Serban, and Mihai Asandulesa. 2023. "Novel Bio-Based Materials: From Castor Oil to Epoxy Resins for Engineering Applications" Materials 16, no. 16: 5649. https://doi.org/10.3390/ma16165649