
Facile and Simple Post Treatment Ball Milling Strategy for the Production of Low-Cost TiO2 Composites with Enhanced Photocatalytic Performance and Applicability to Construction Materials


Abstract
:1. Introduction
2. Materials and Methods
2.1. Materials
2.2. Preparation of BM Treated Samples
2.3. Photocatalytic Experiment Program
2.3.1. Photodegradation of MB (Aqueous)
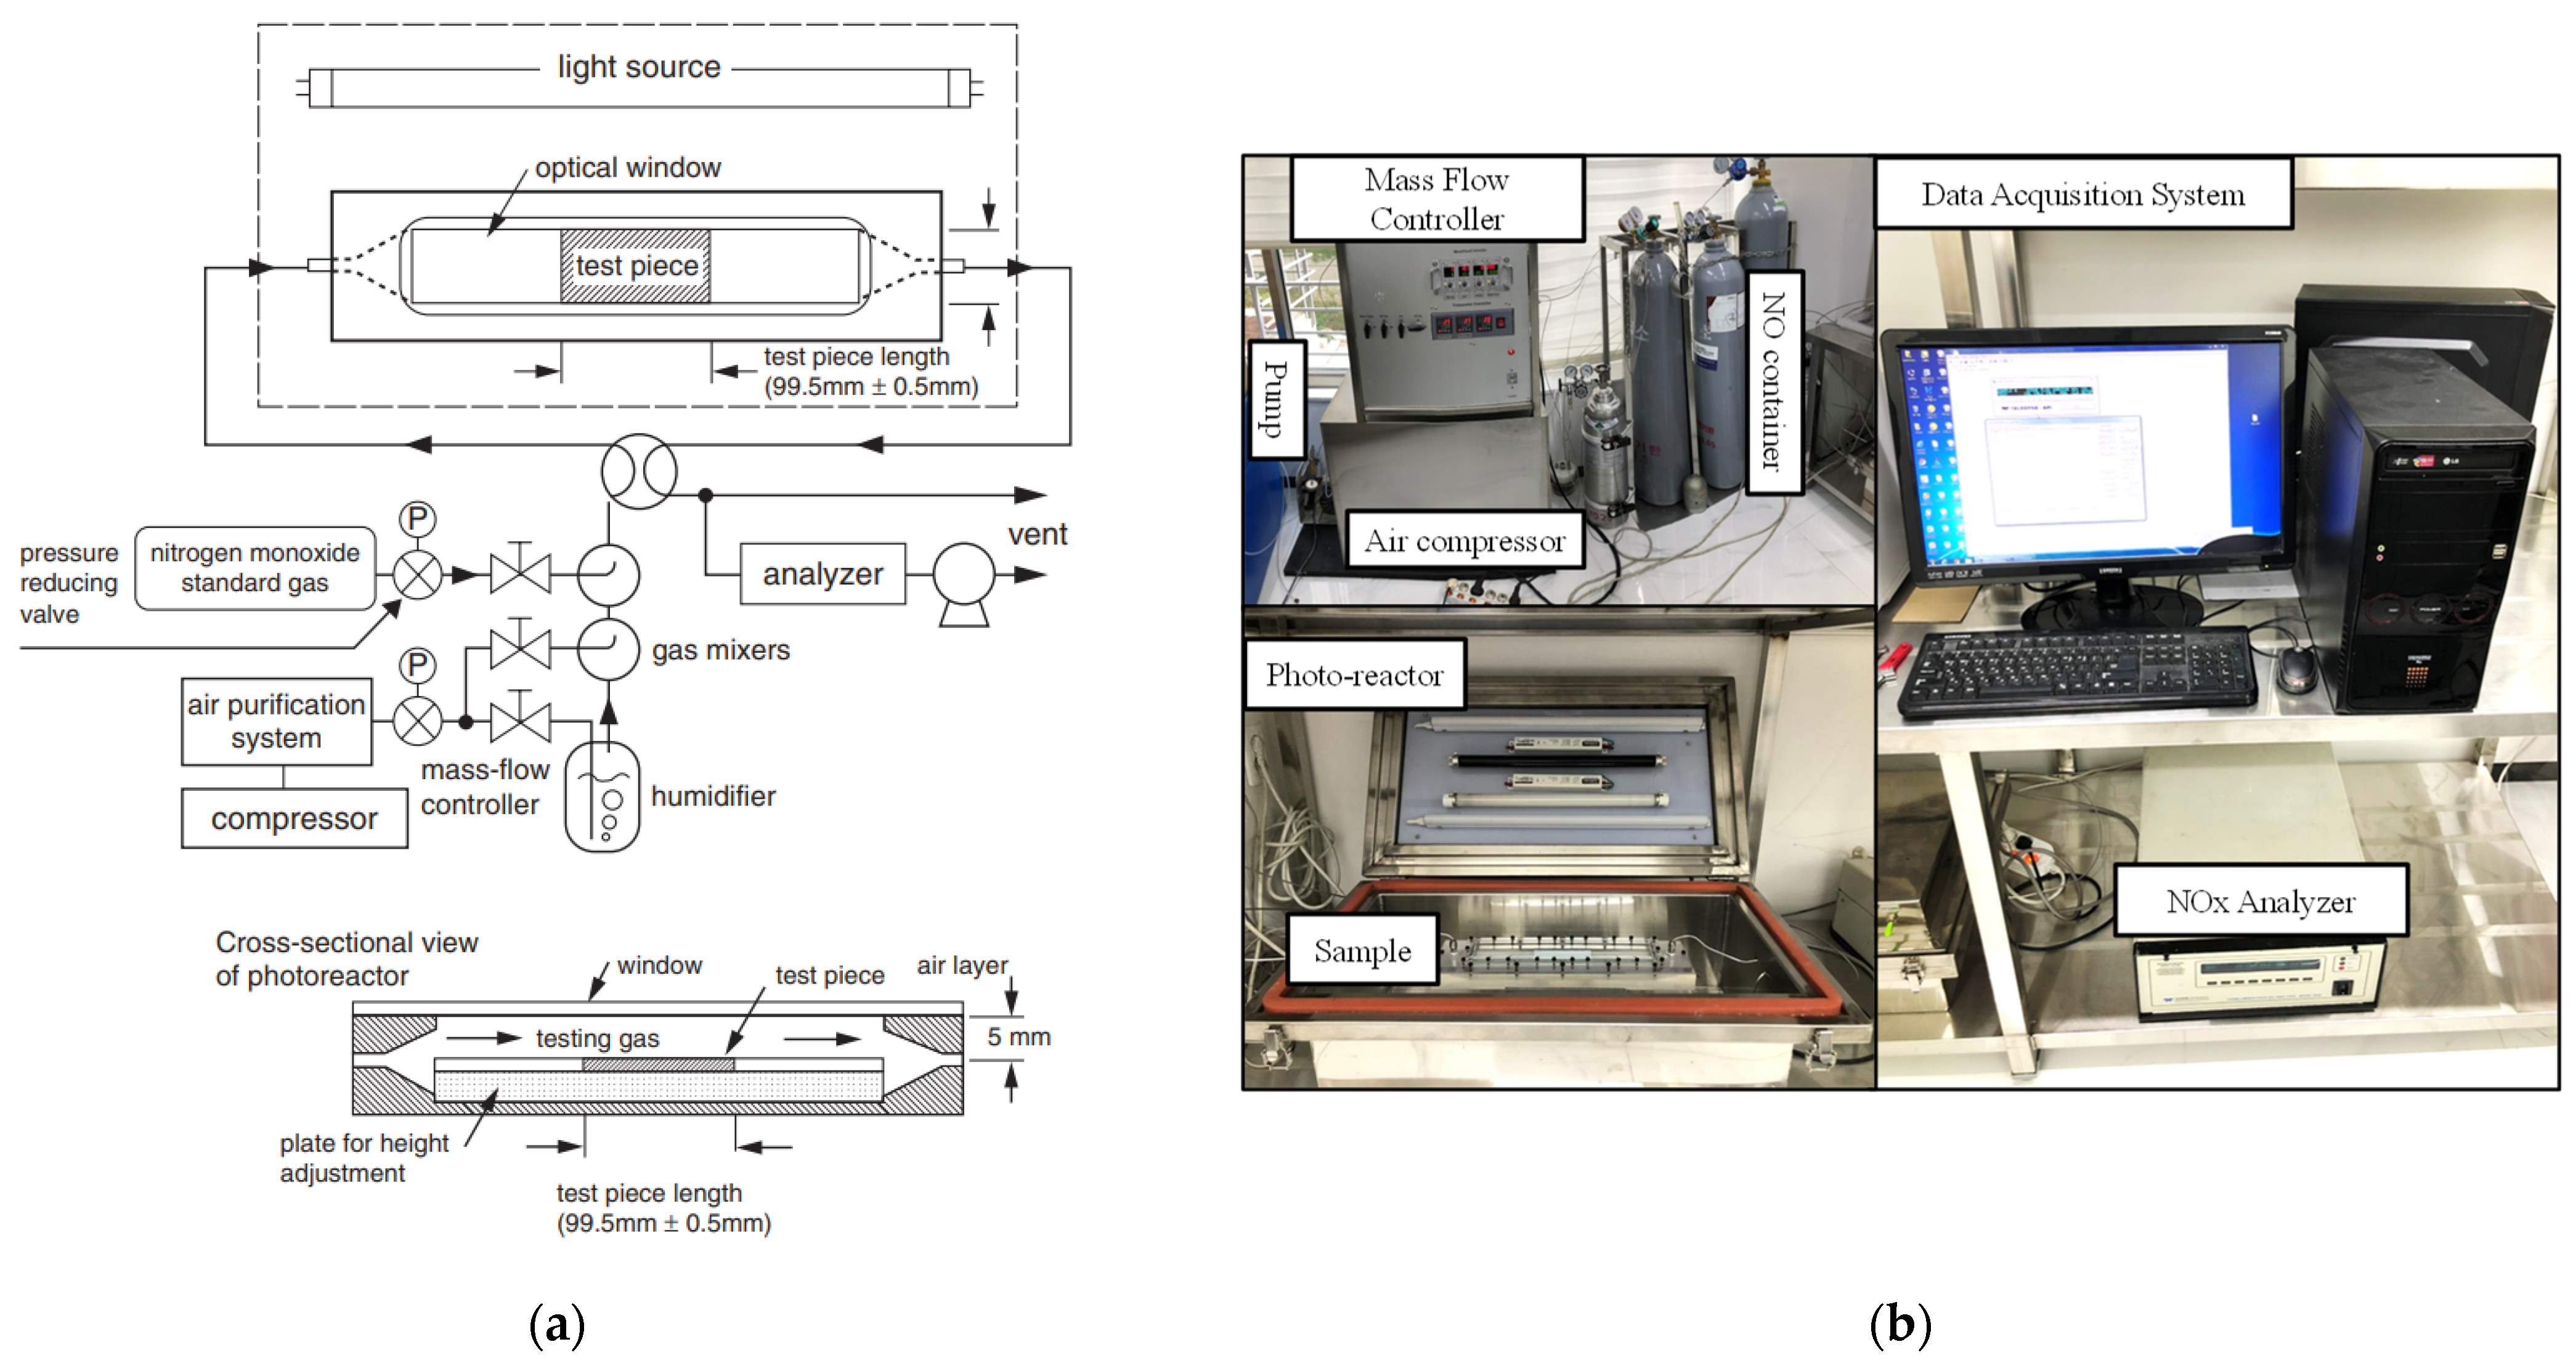
2.3.2. Photodegradation of NOx
3. Results and Discussion
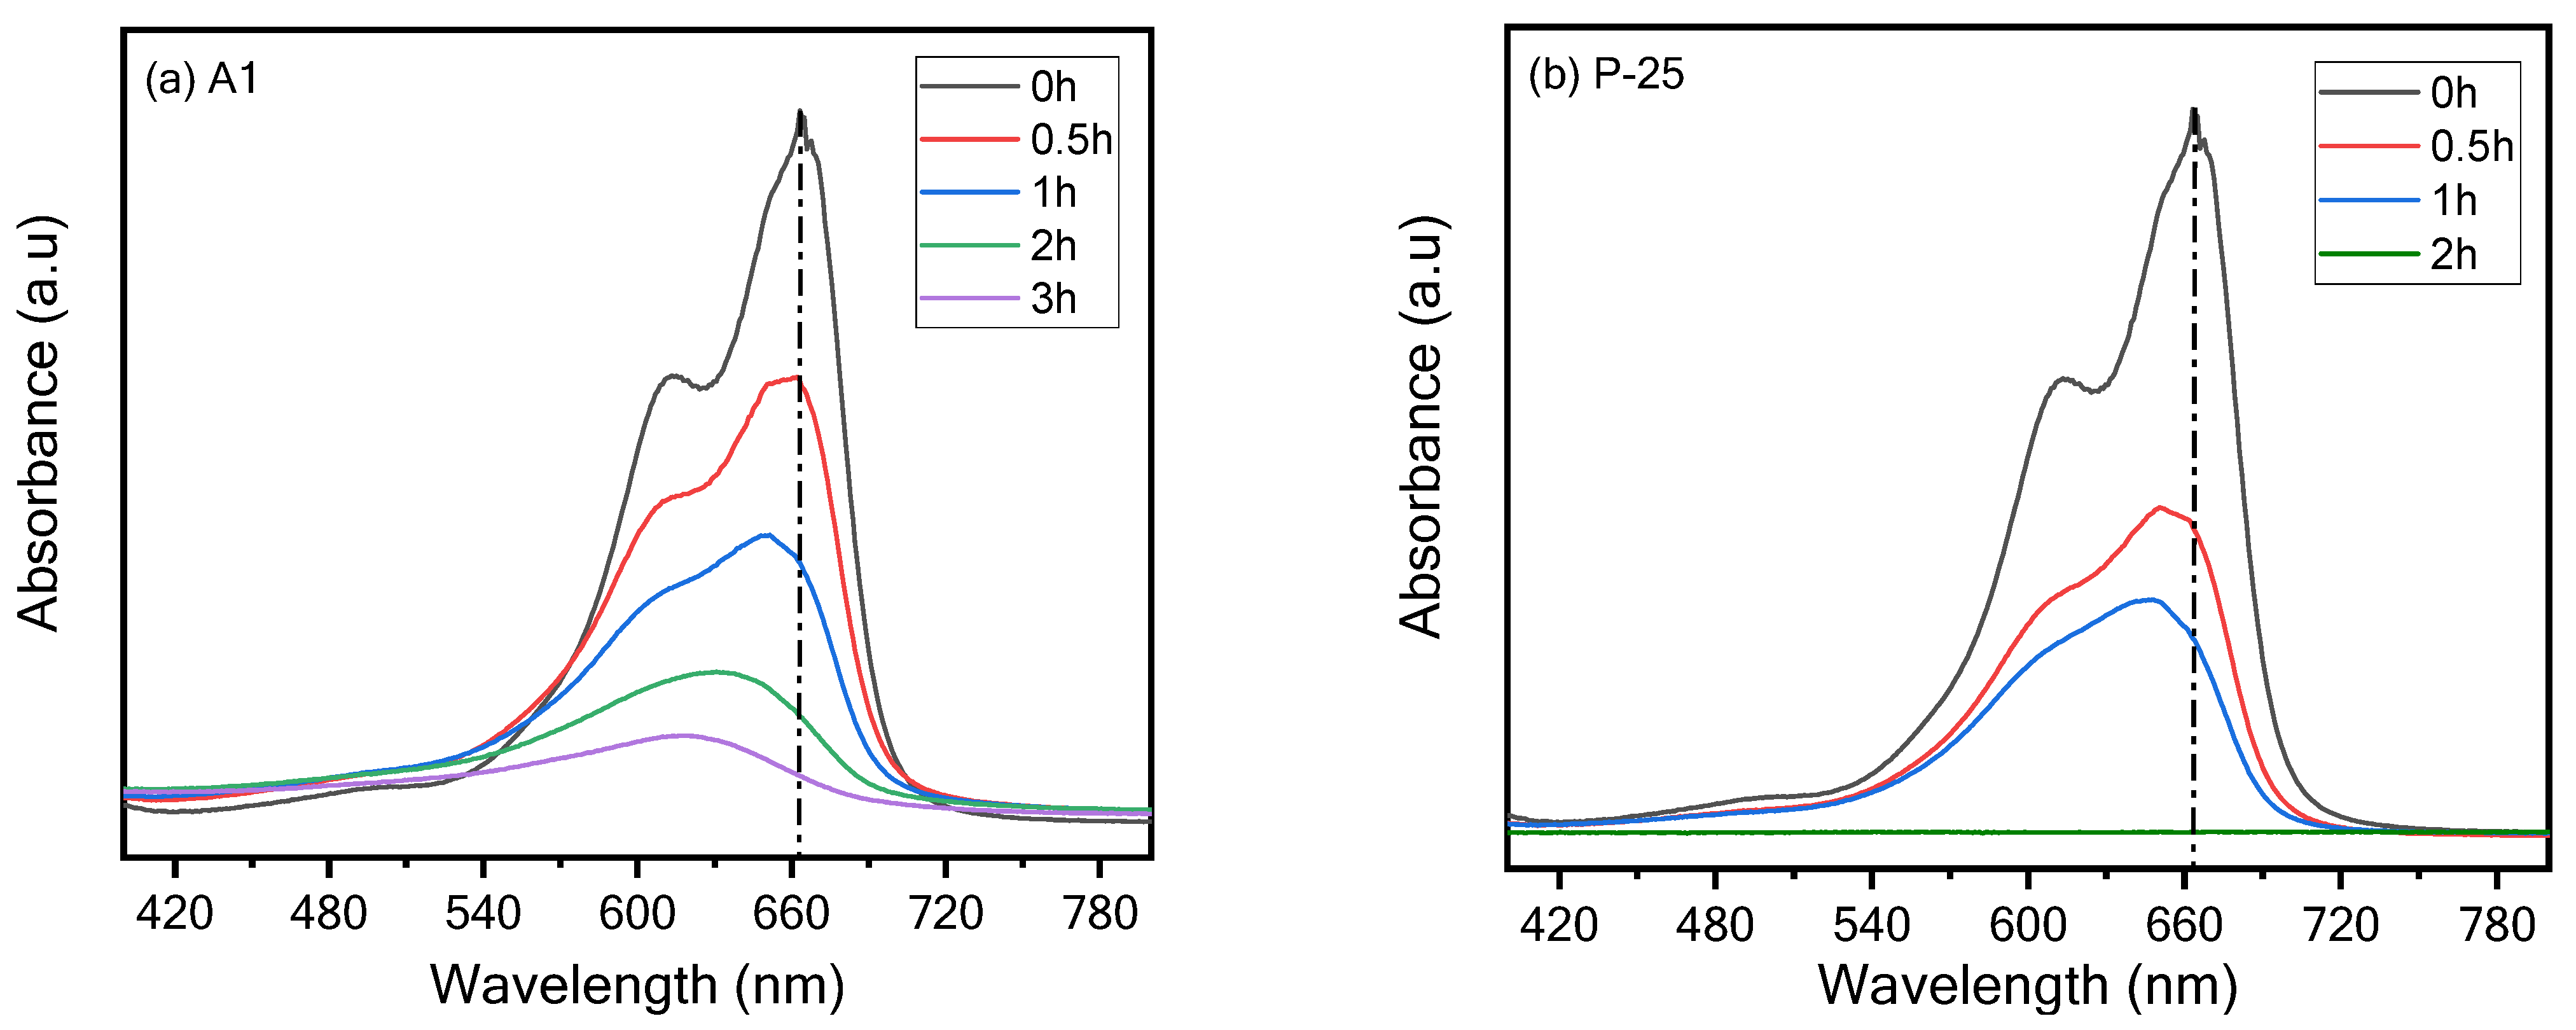
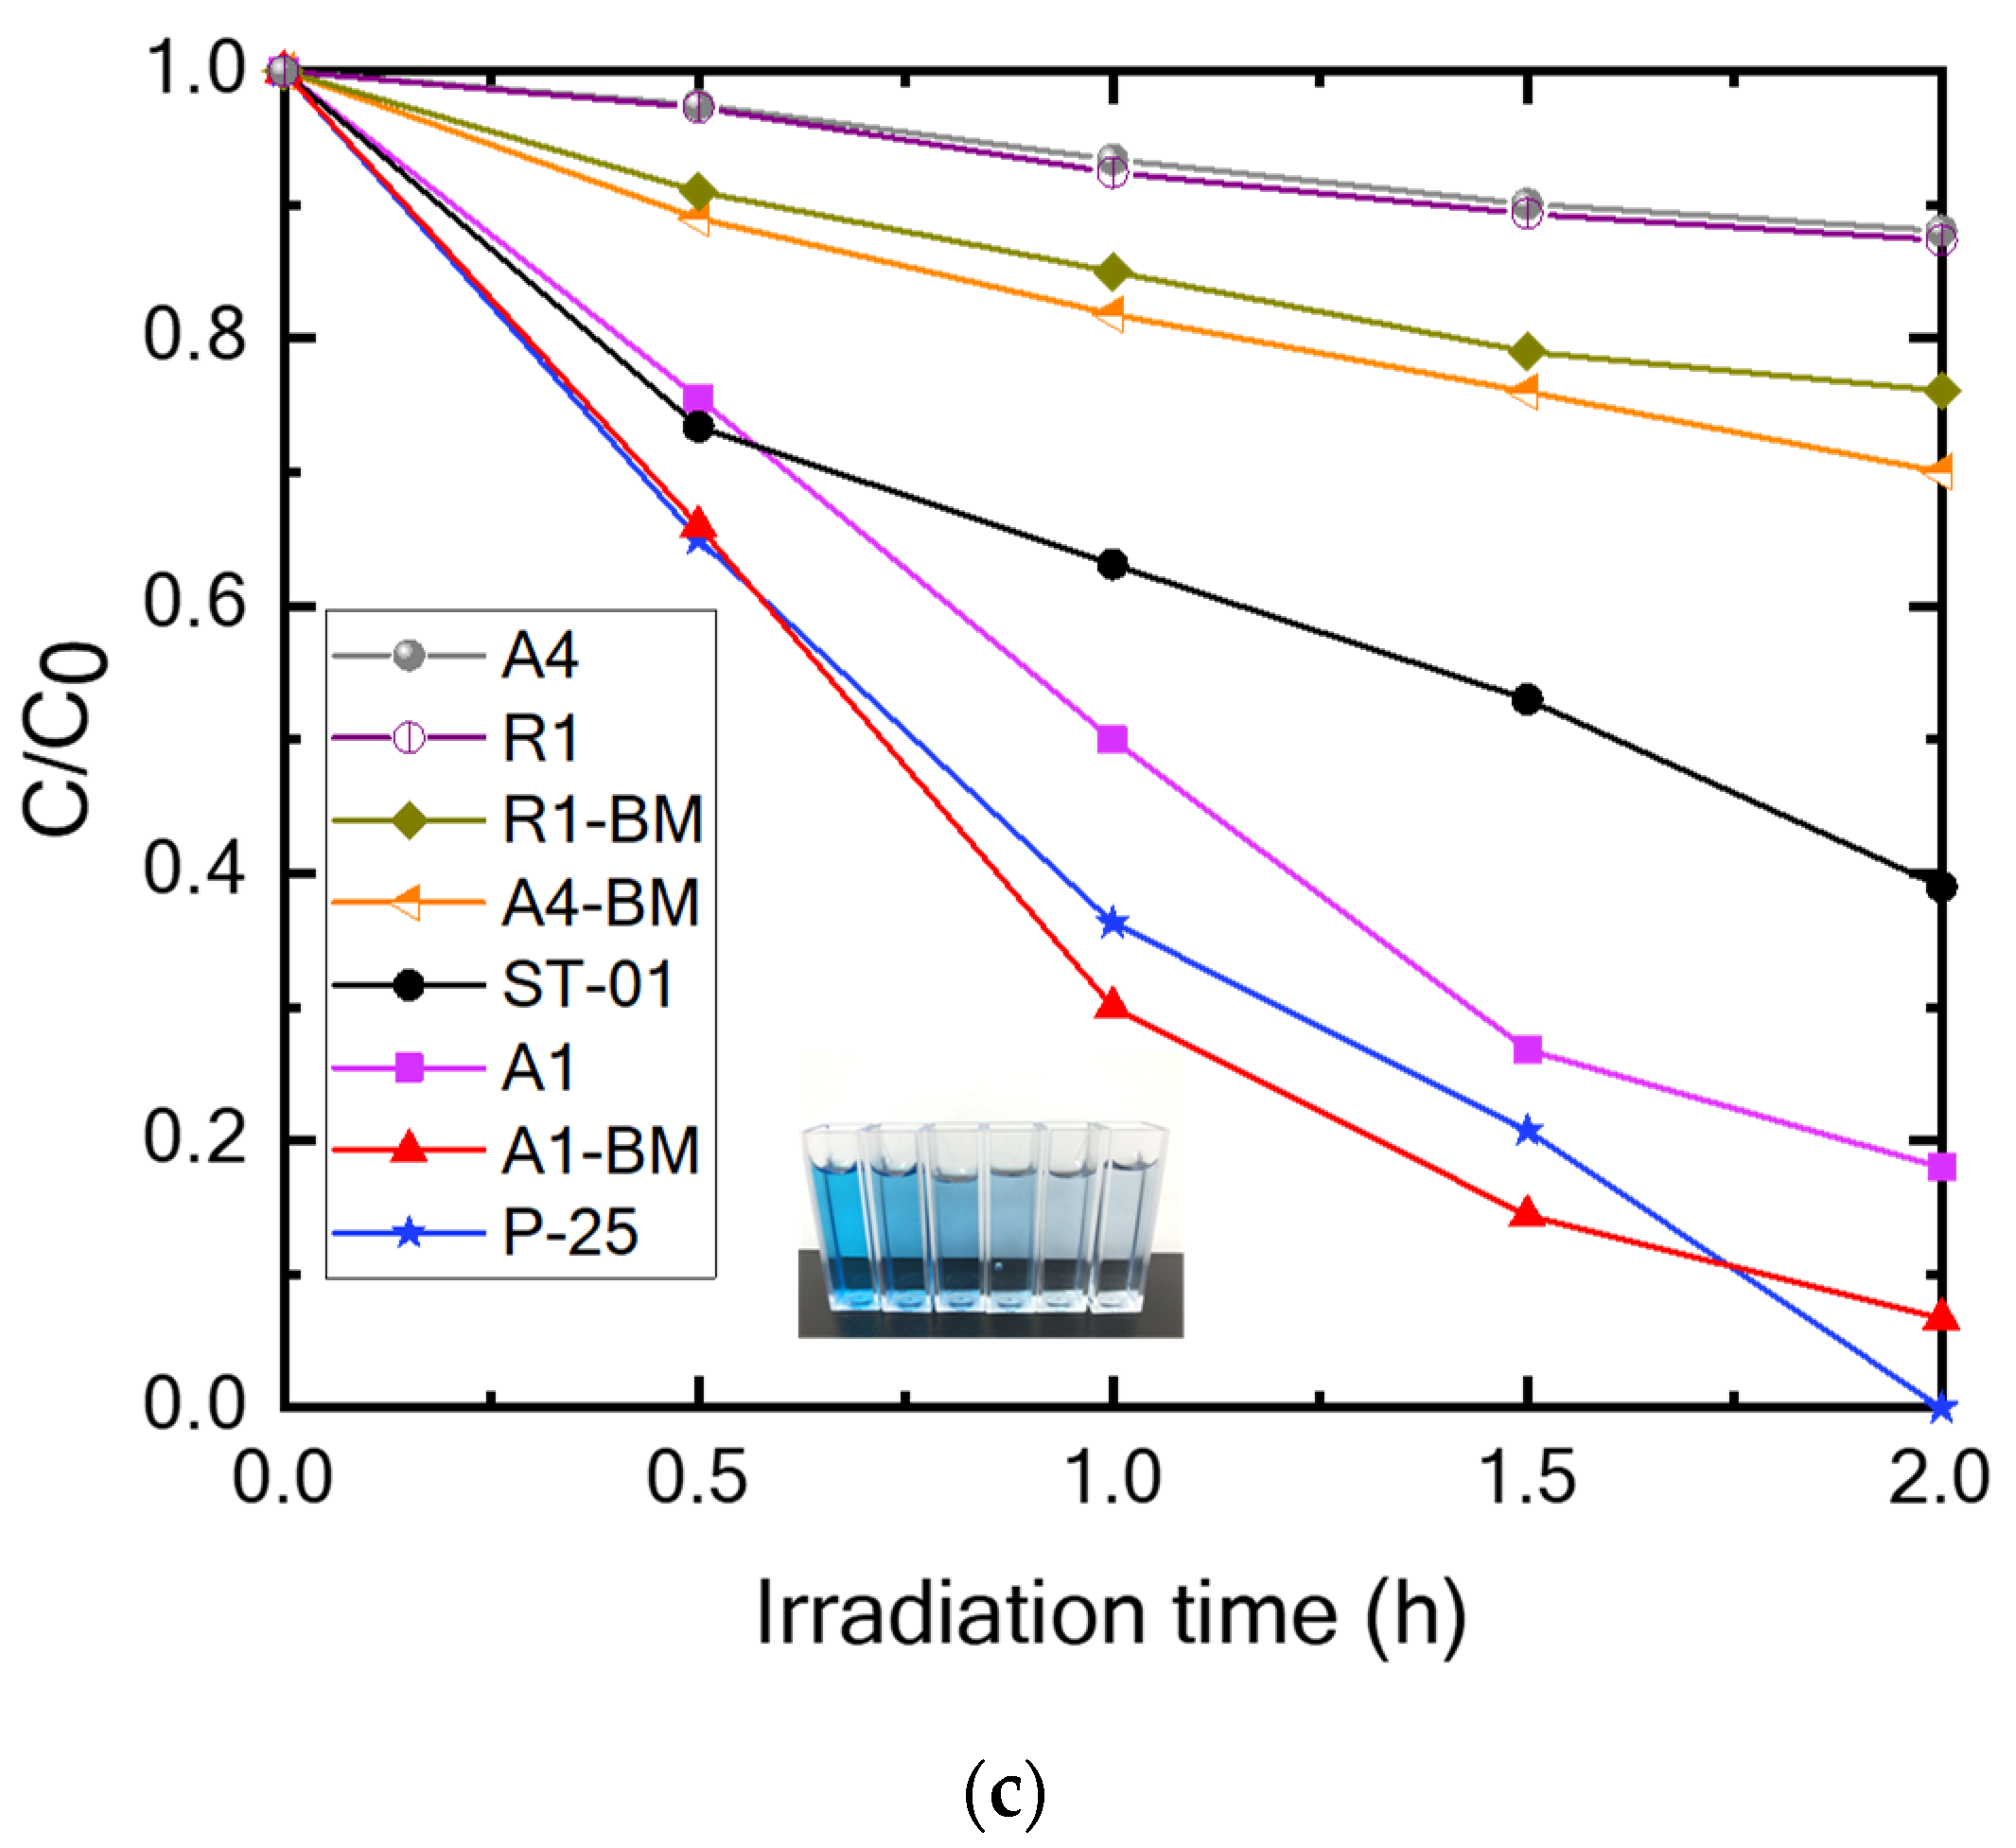
3.1. MB Photocatalytic Degradation
3.2. Photodegradation of NOx
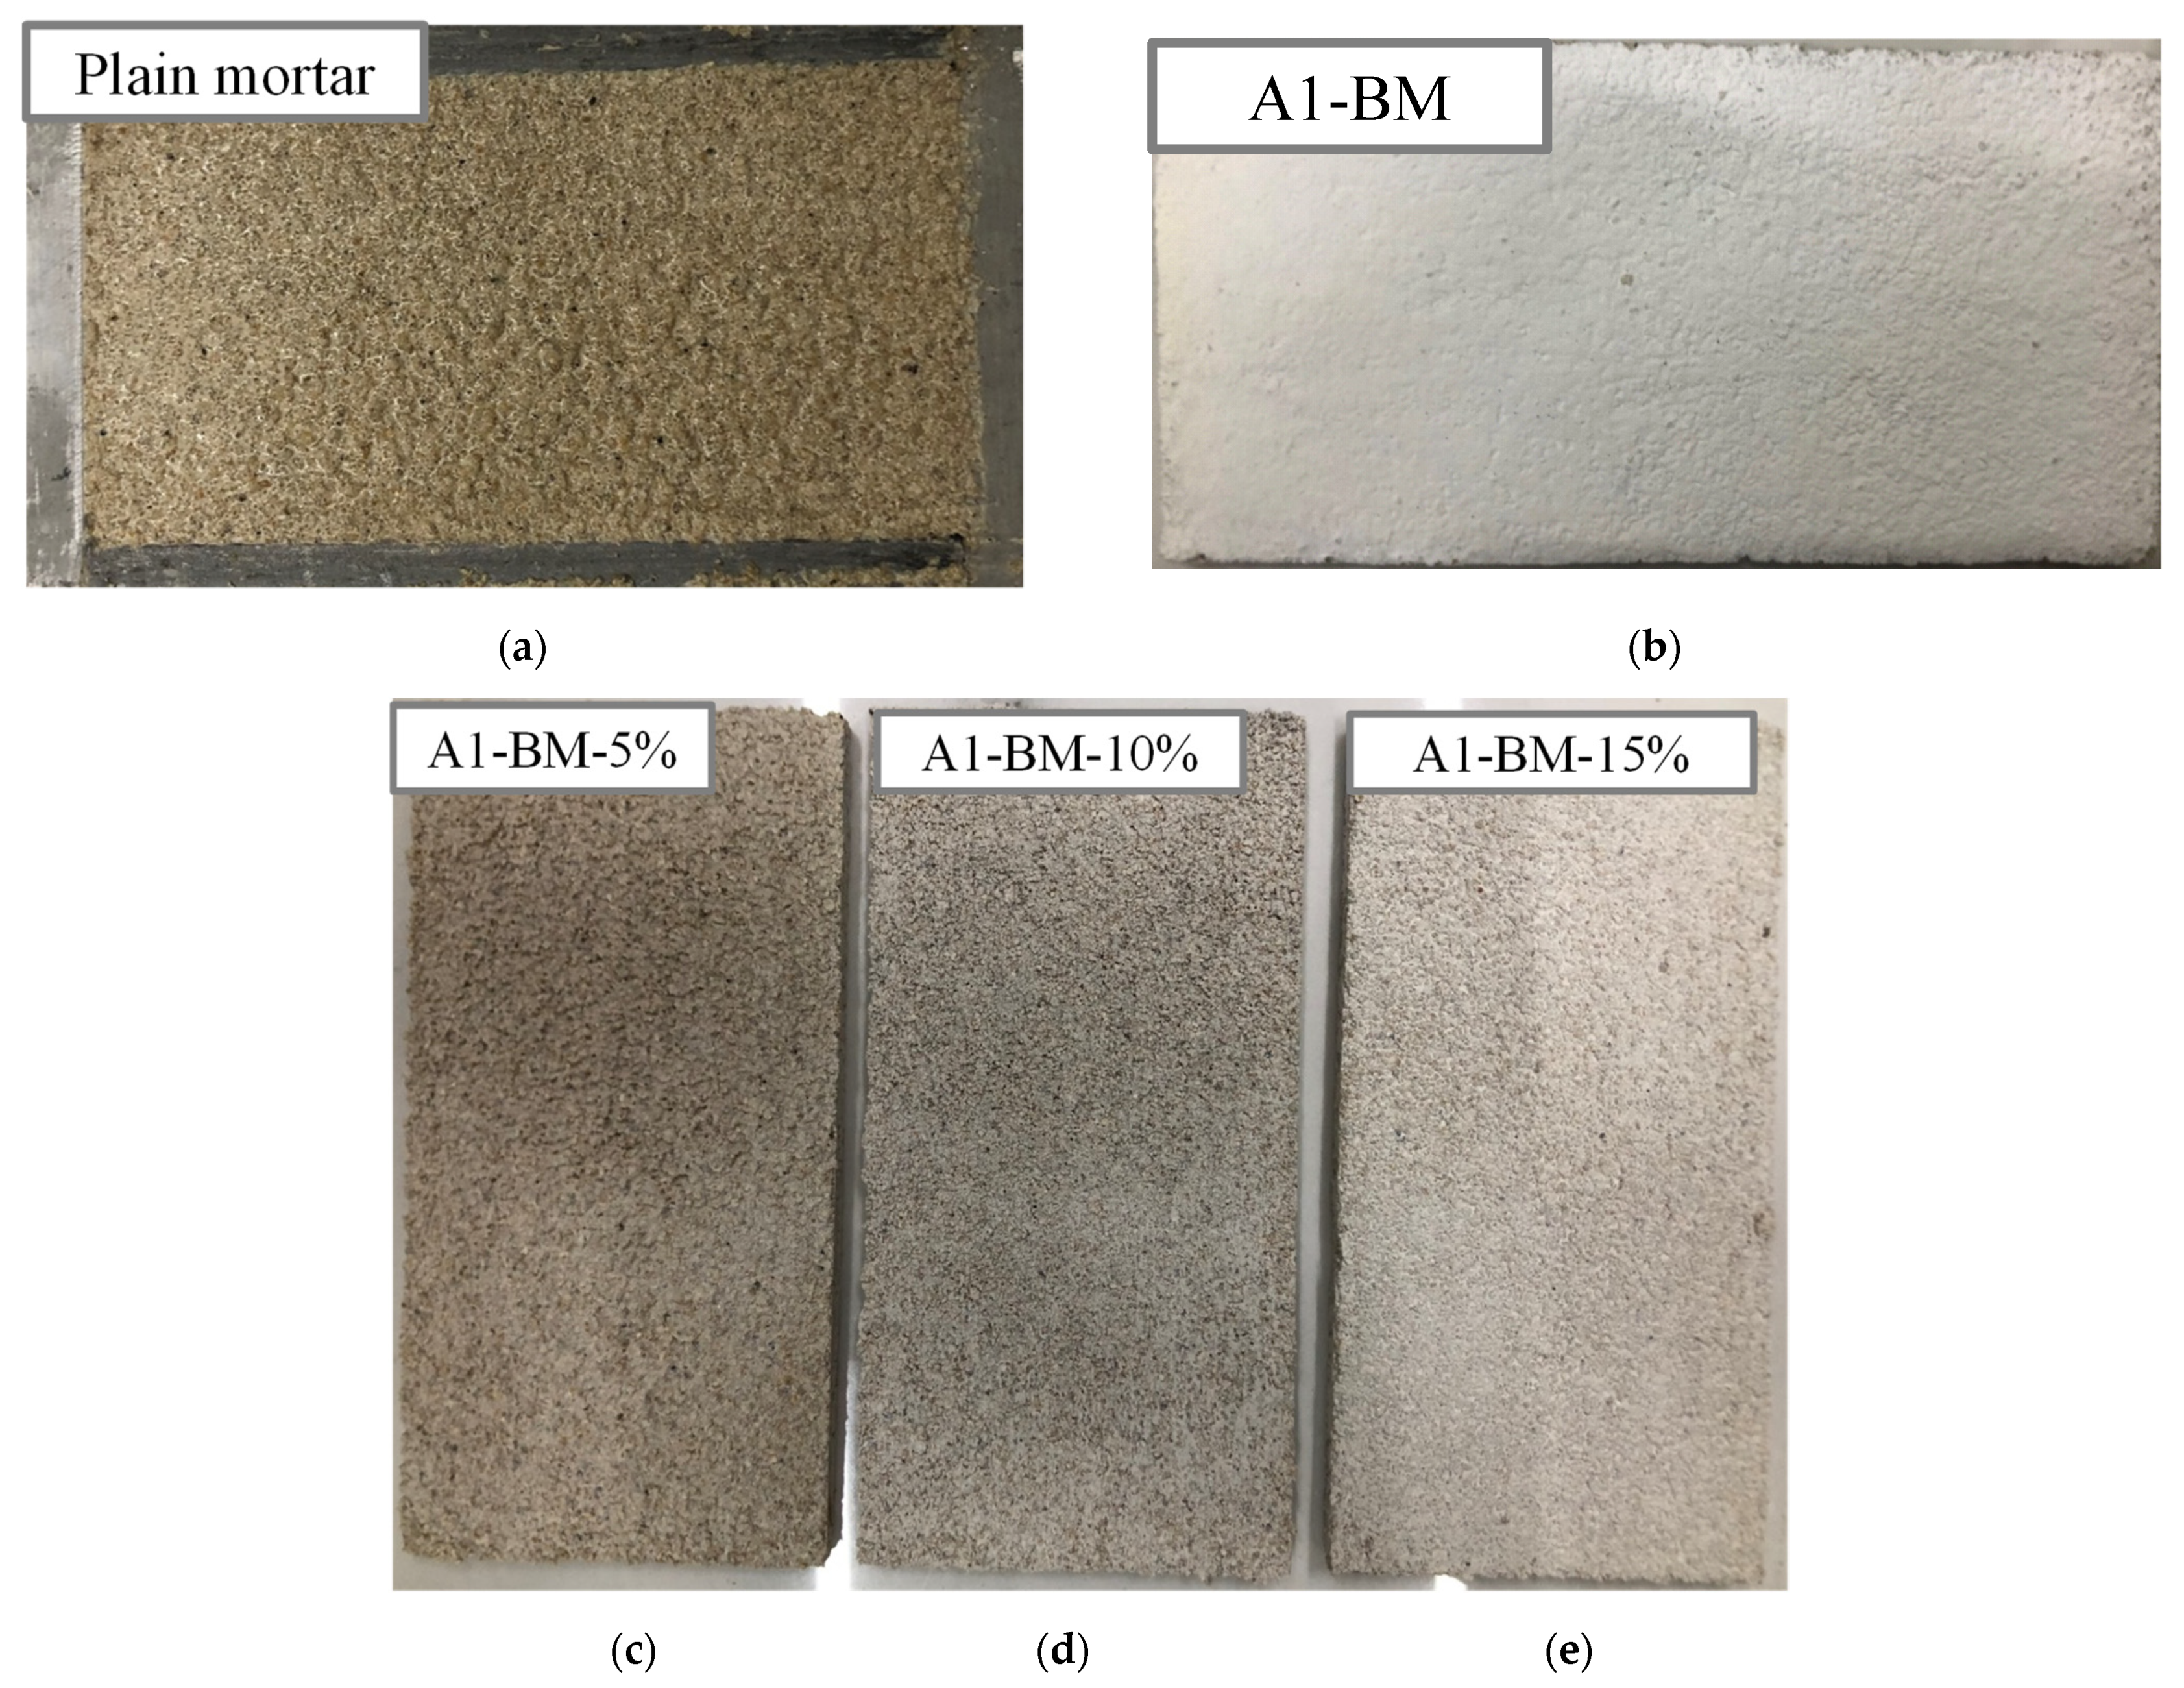
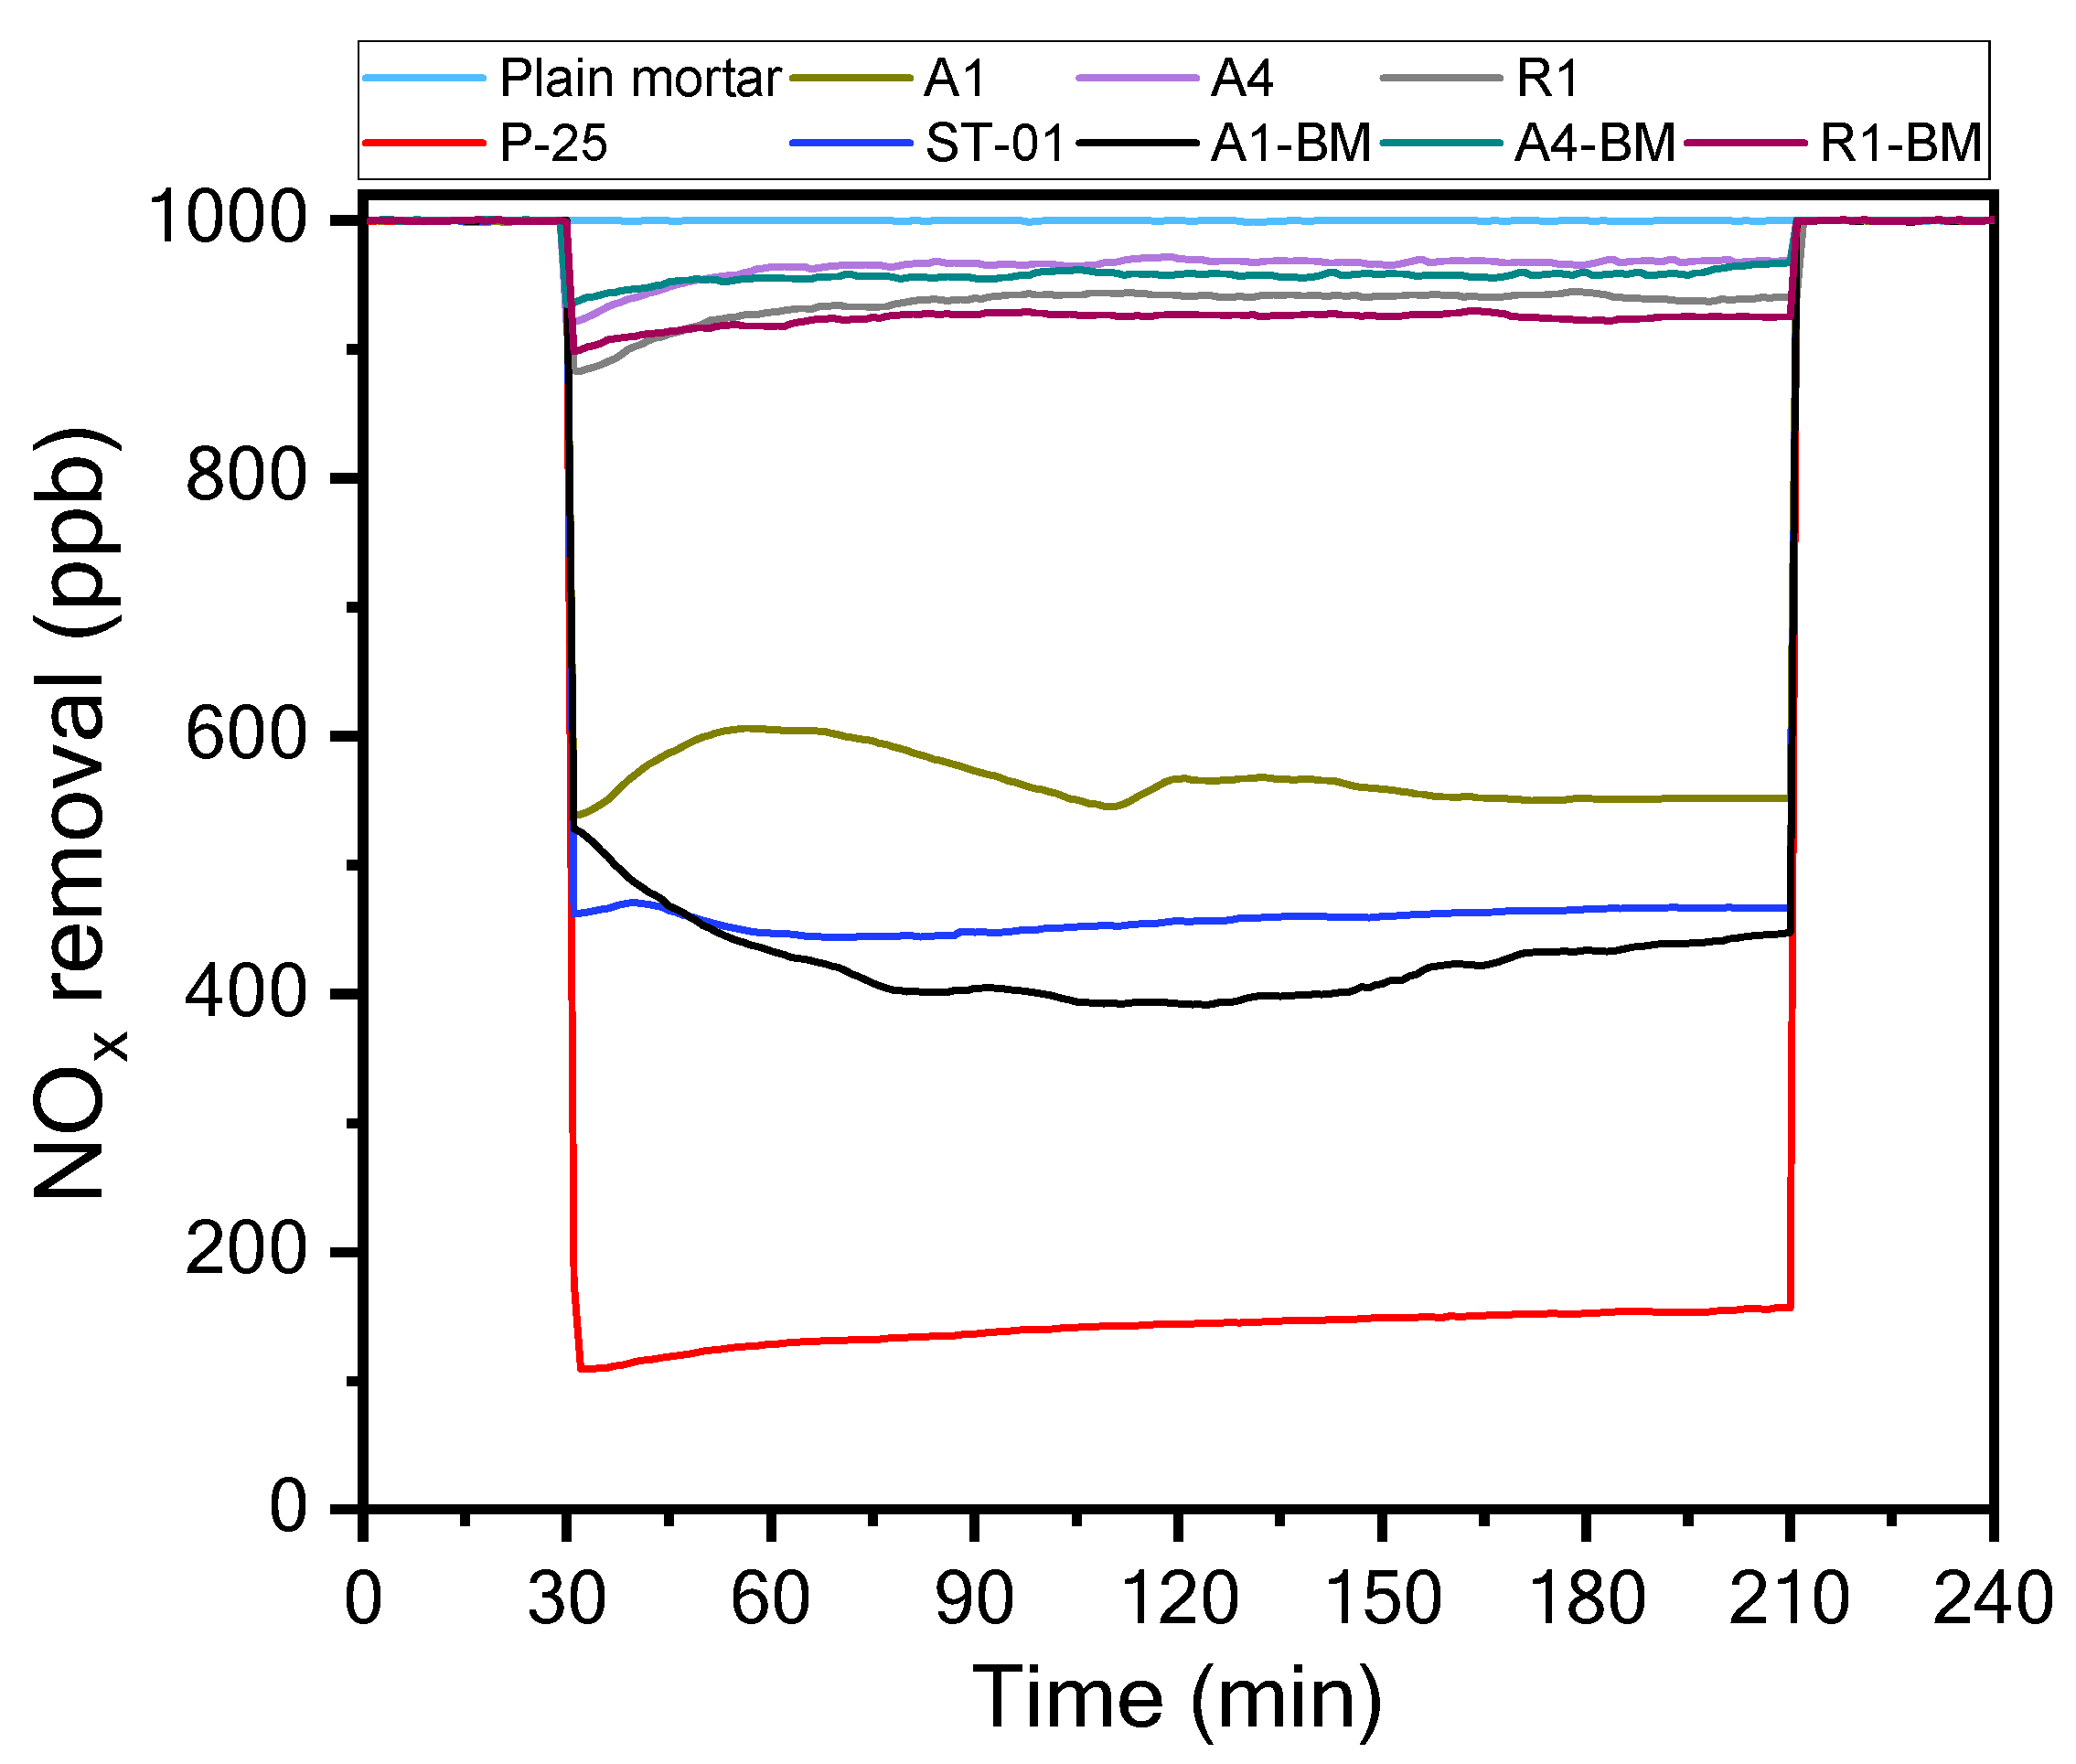
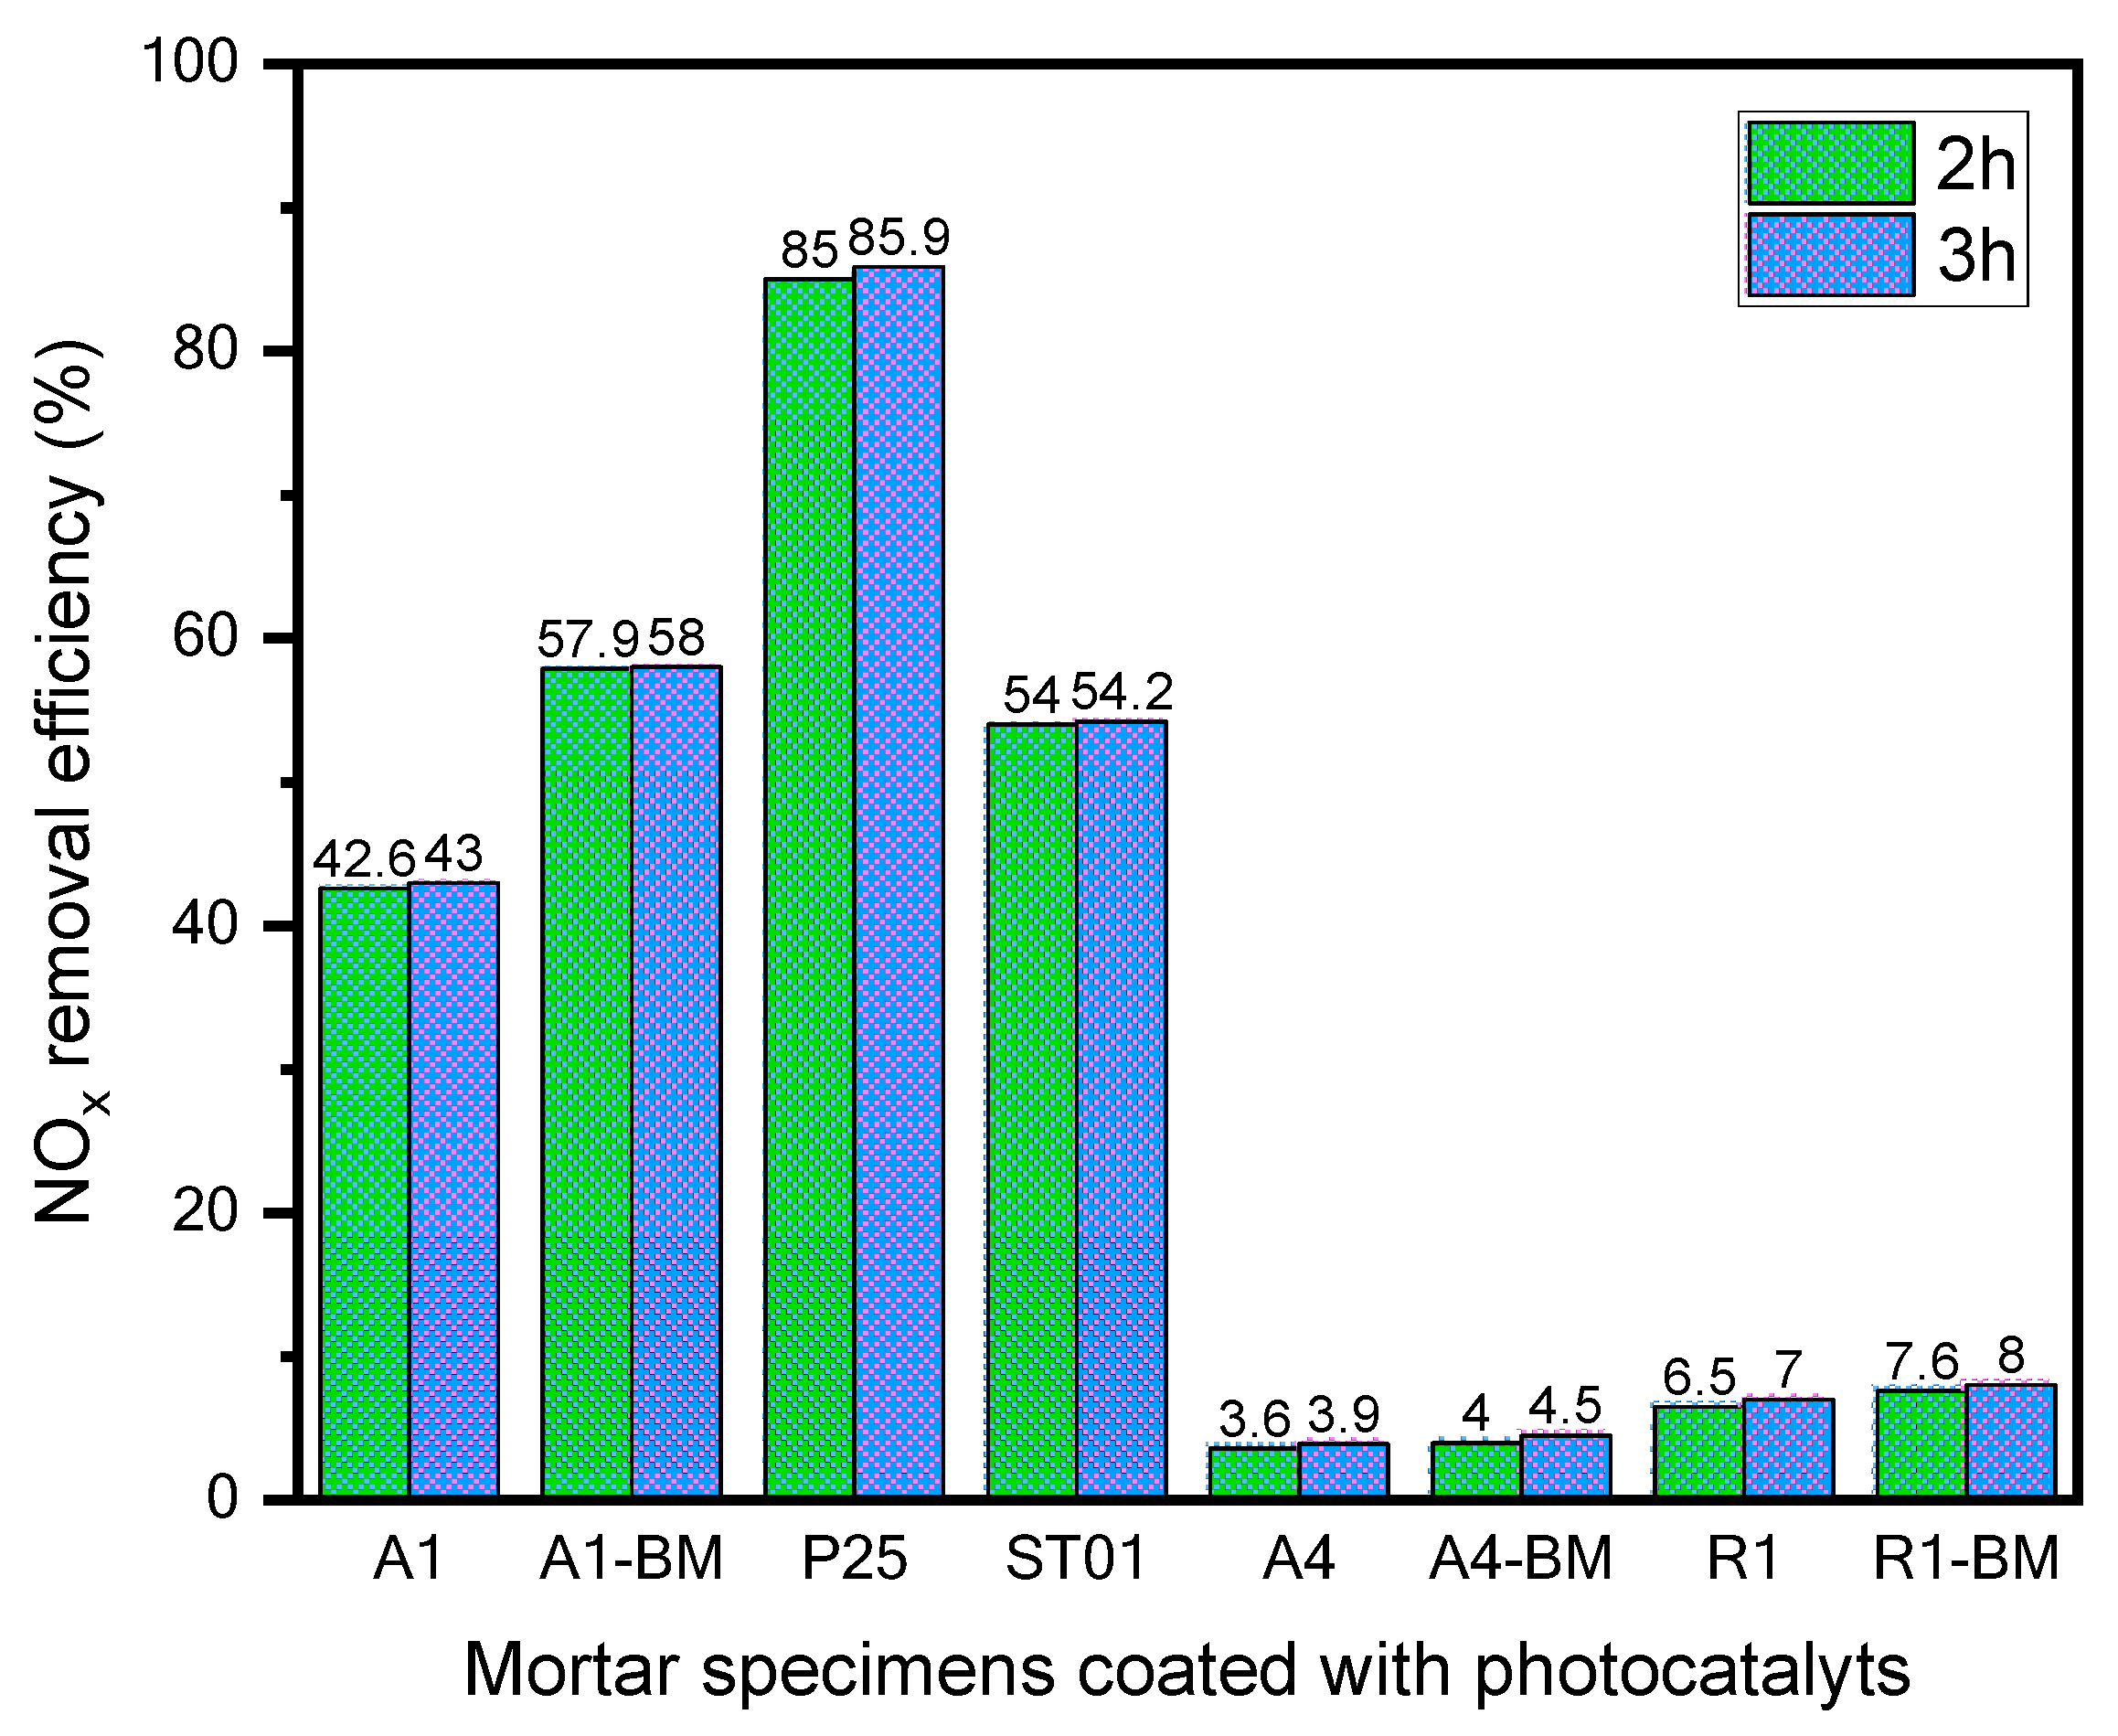
3.2.1. Mortar Specimens Coated with Photocatalysts
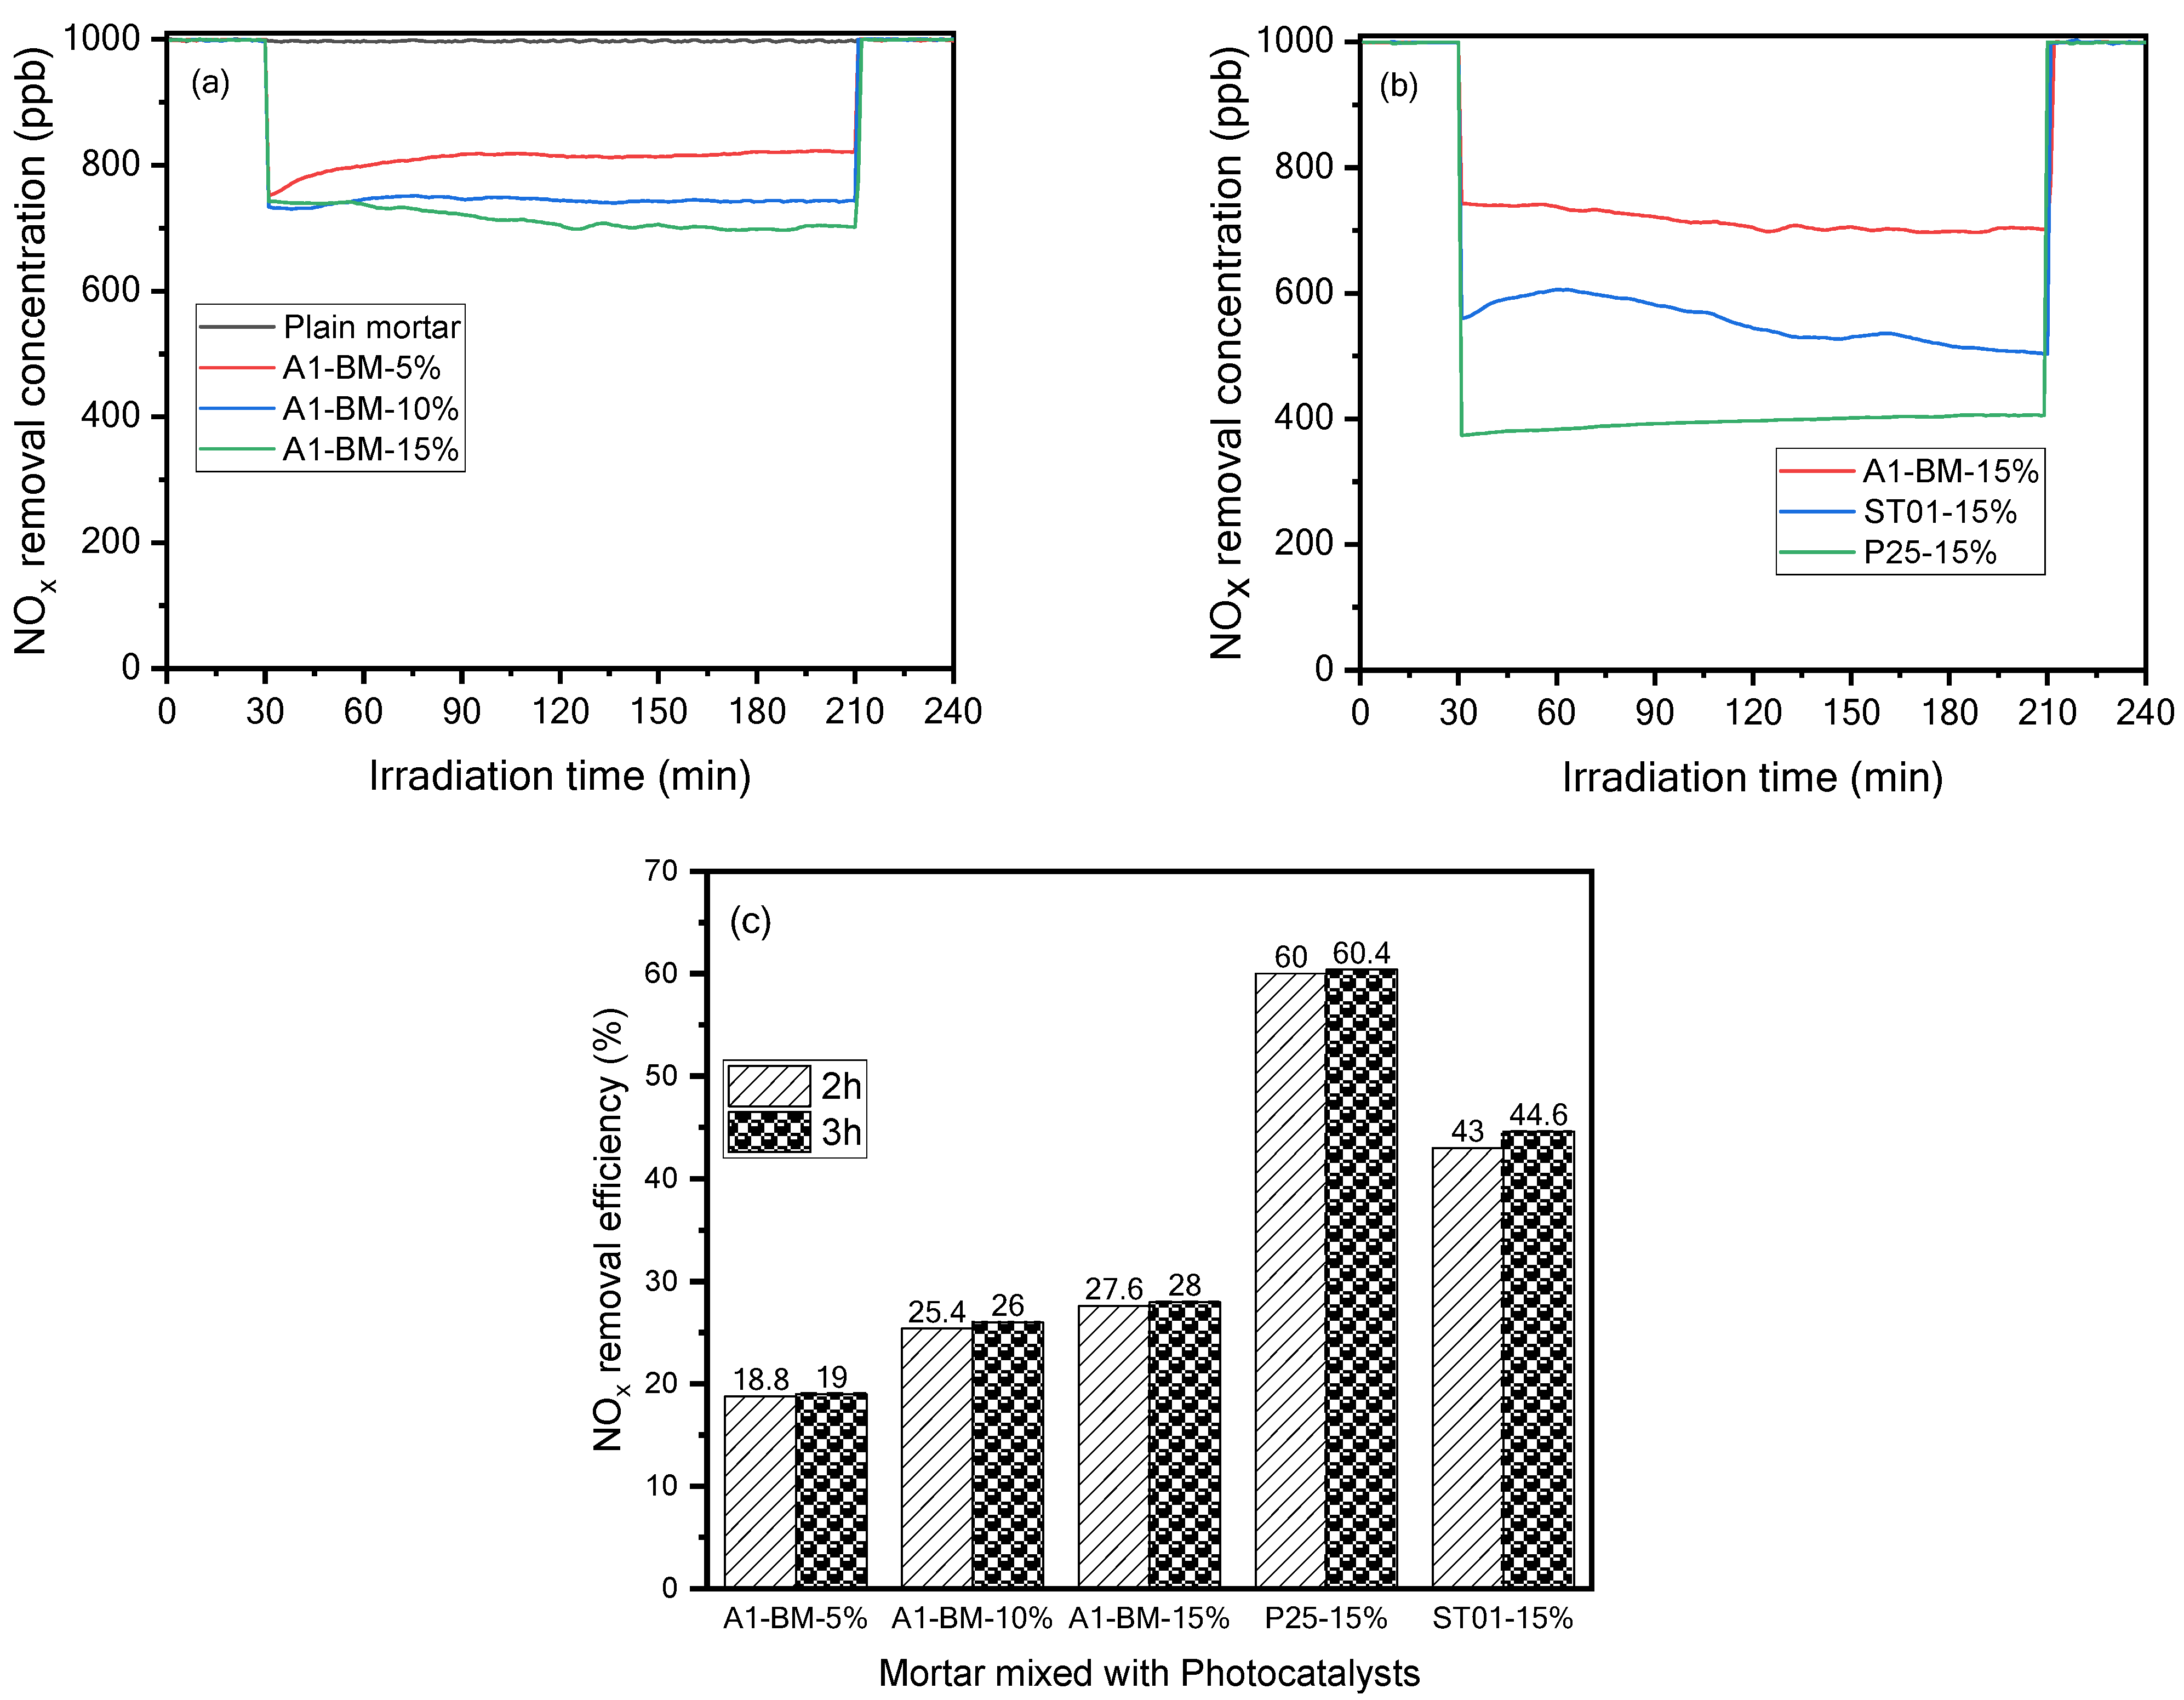
3.2.2. Mortar Mixed with the Photocatalysts
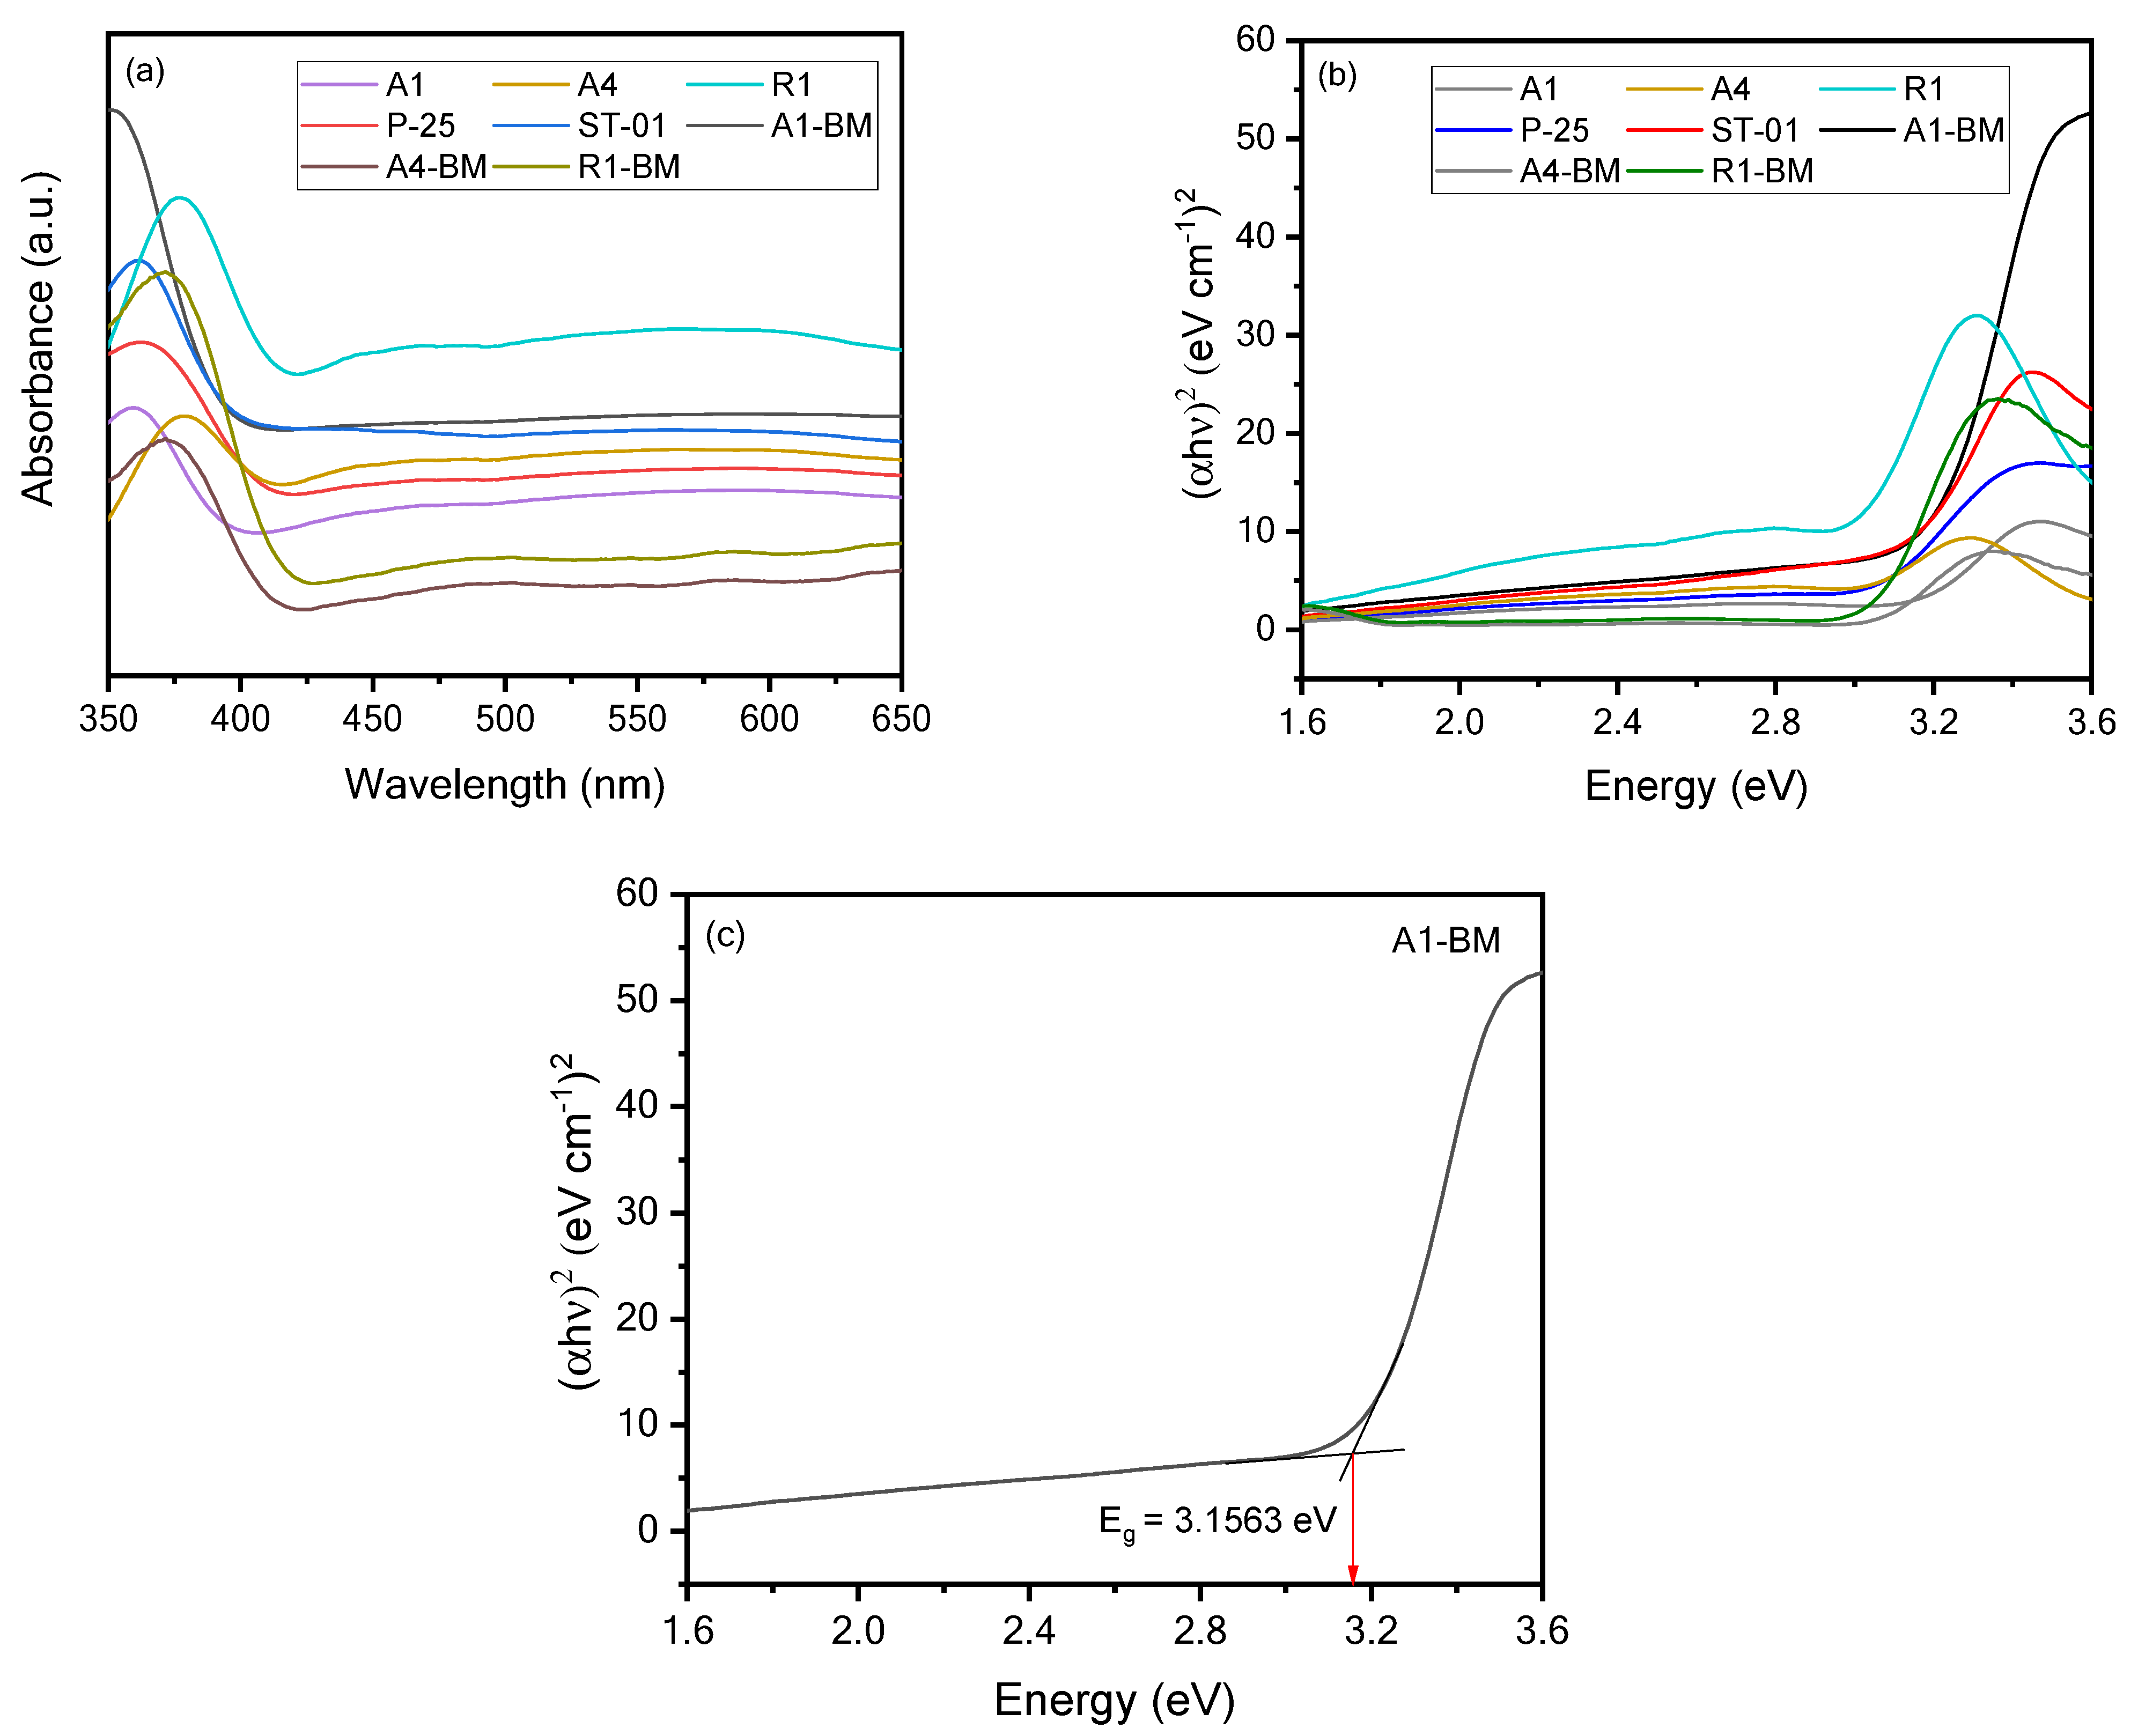
3.3. Optical Property Analysis
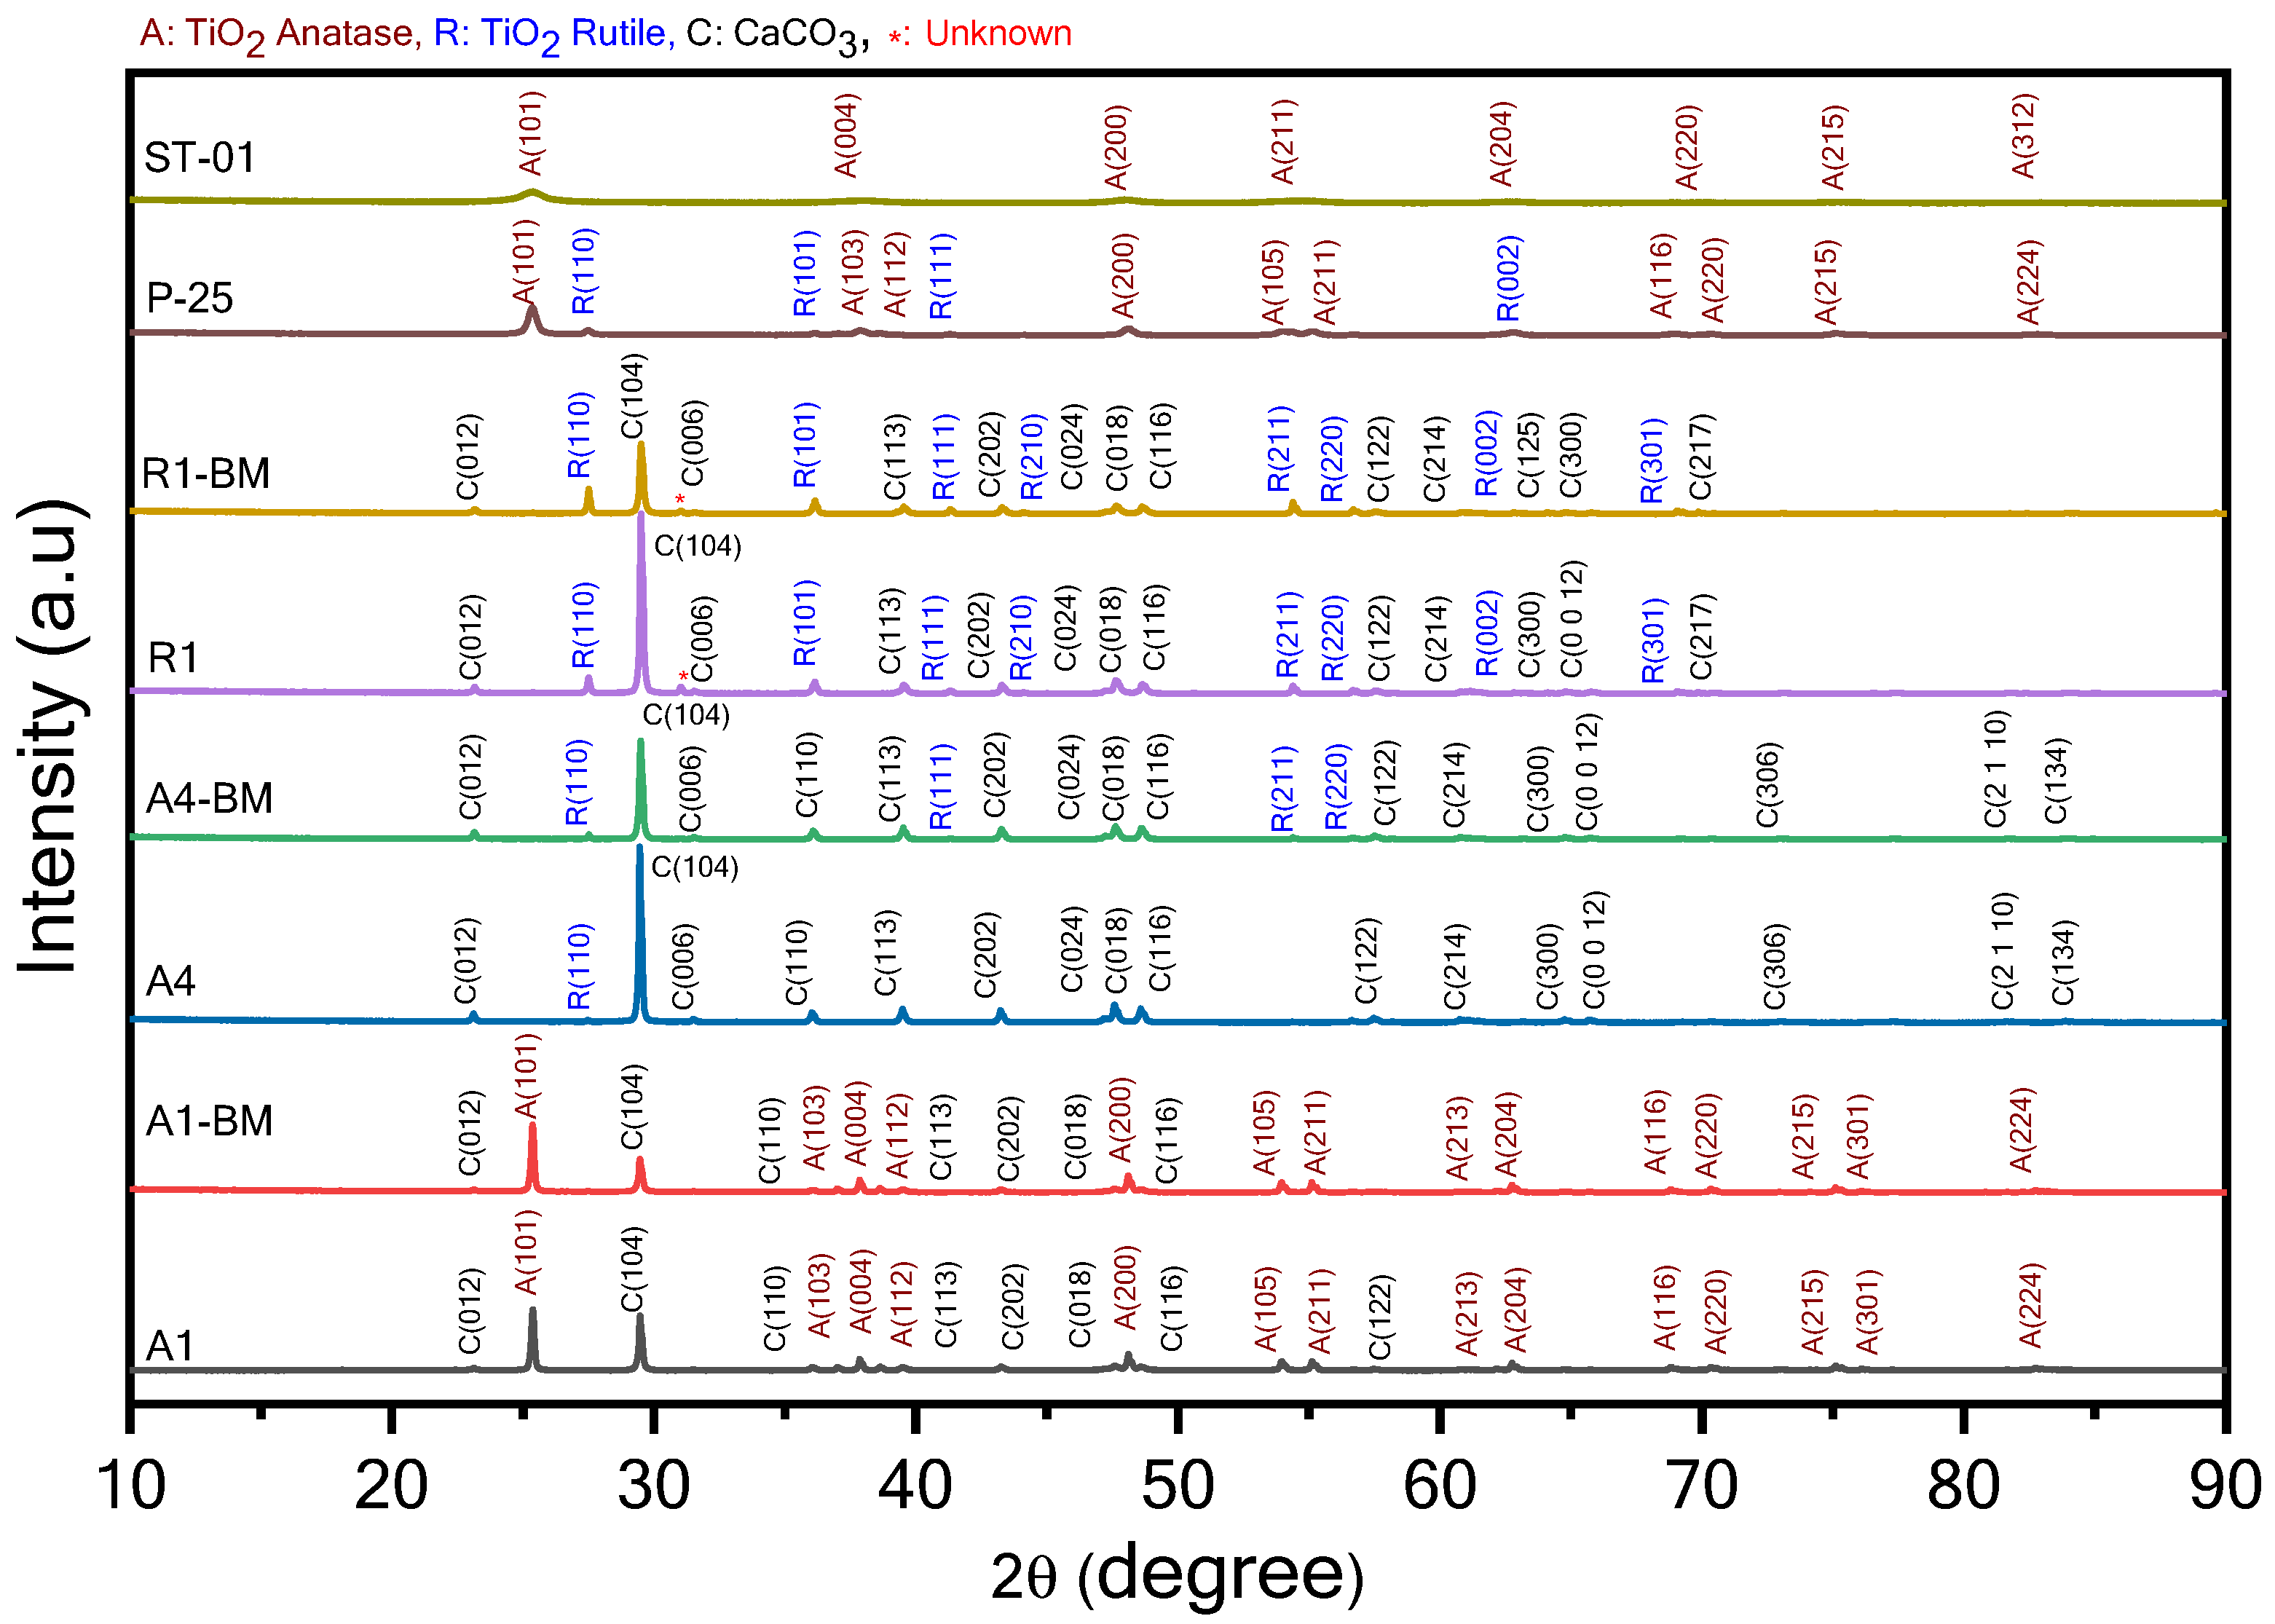
3.4. XRD Analysis
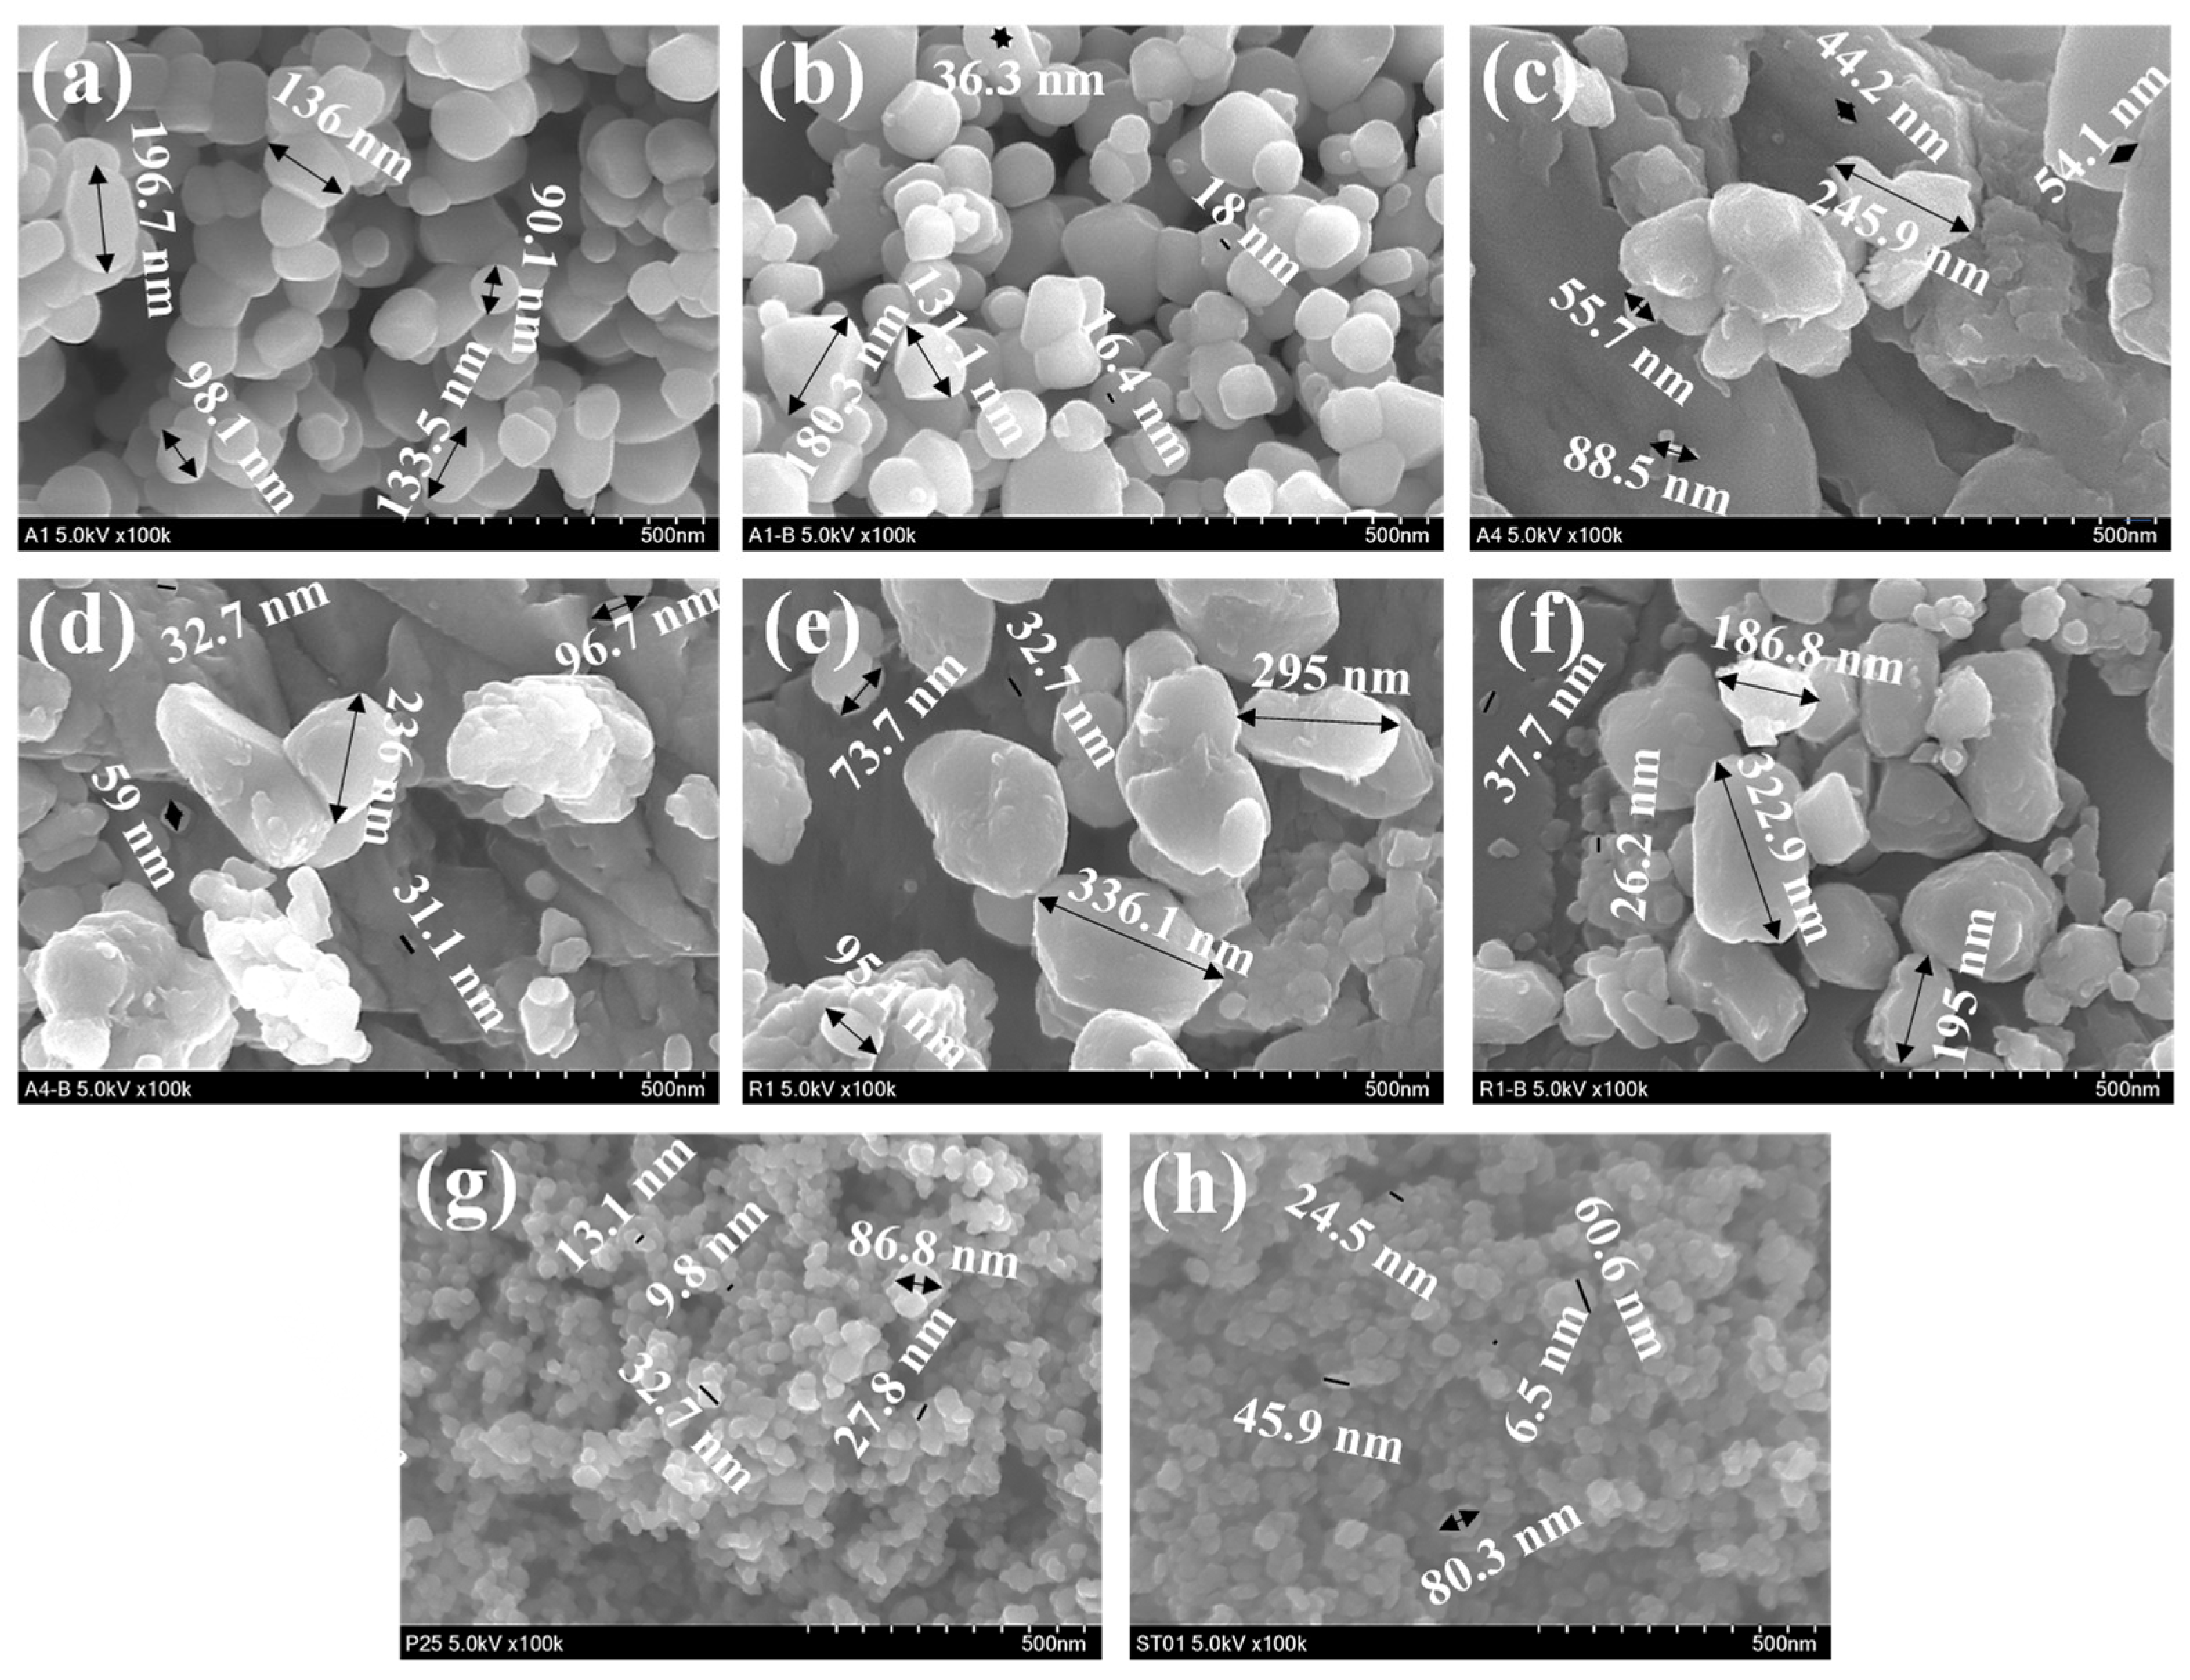
3.5. SEM Analysis
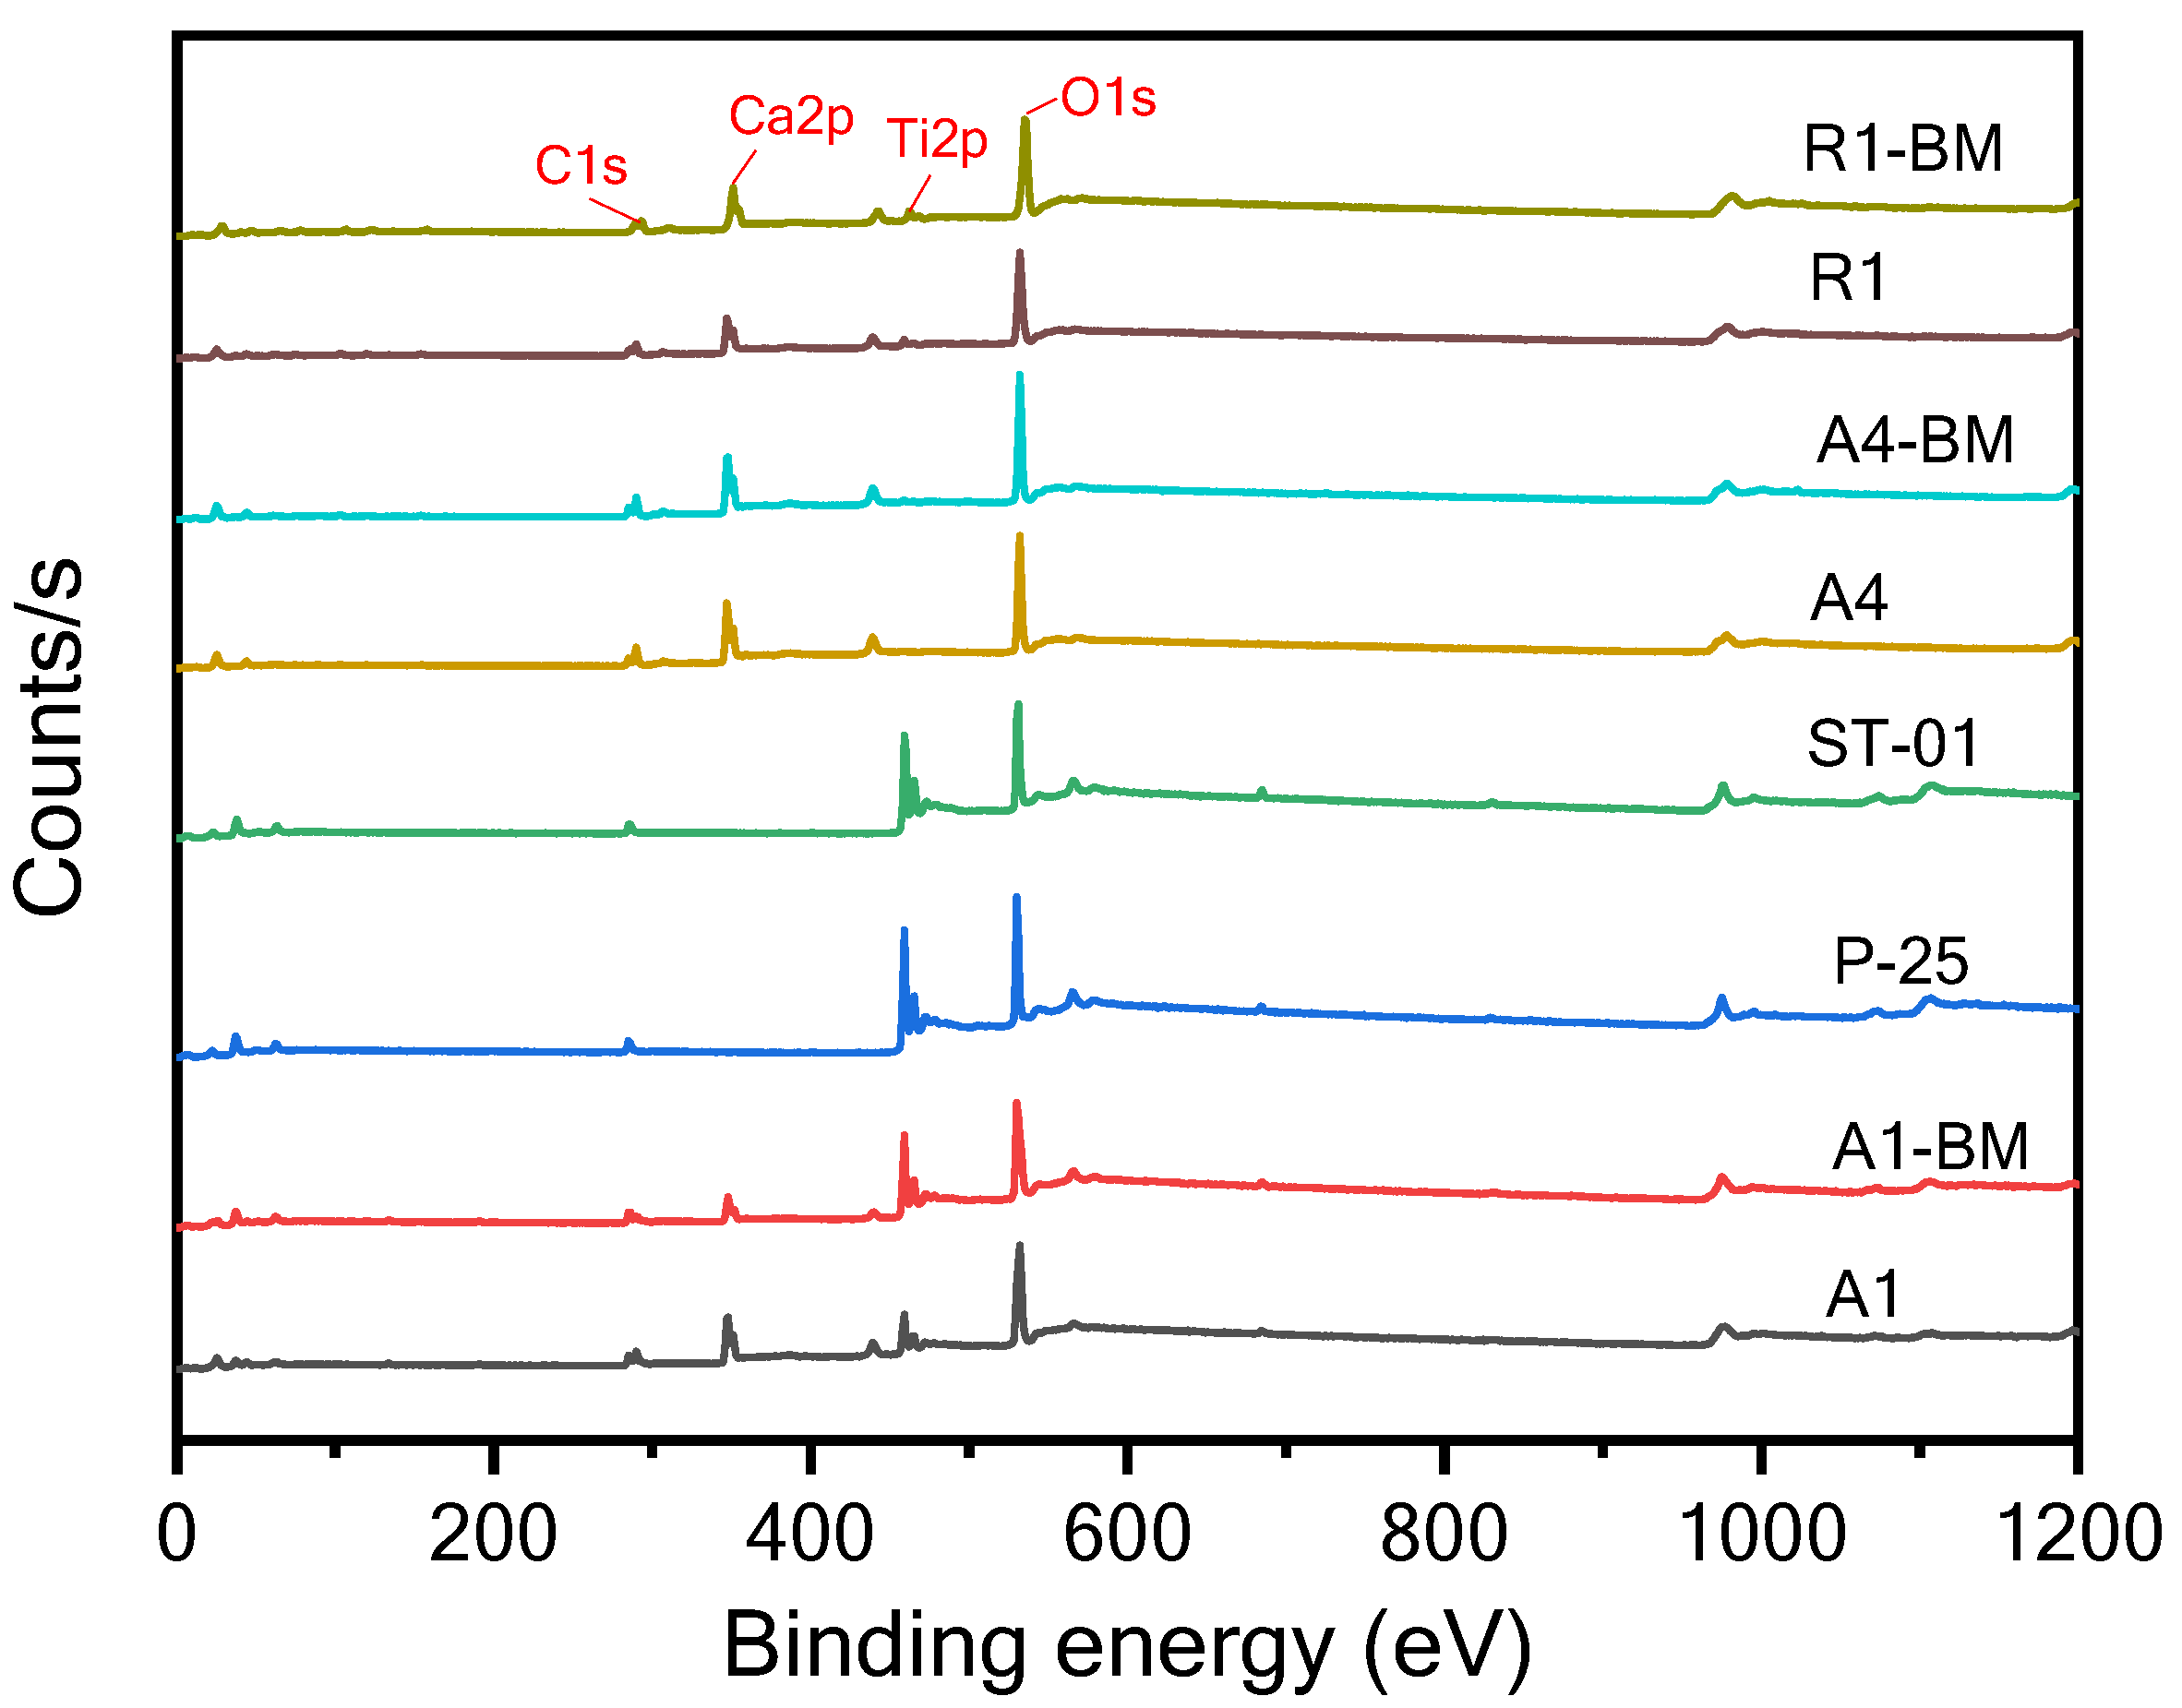
3.6. XPS Analysis
3.6.1. XPS Survey Analysis
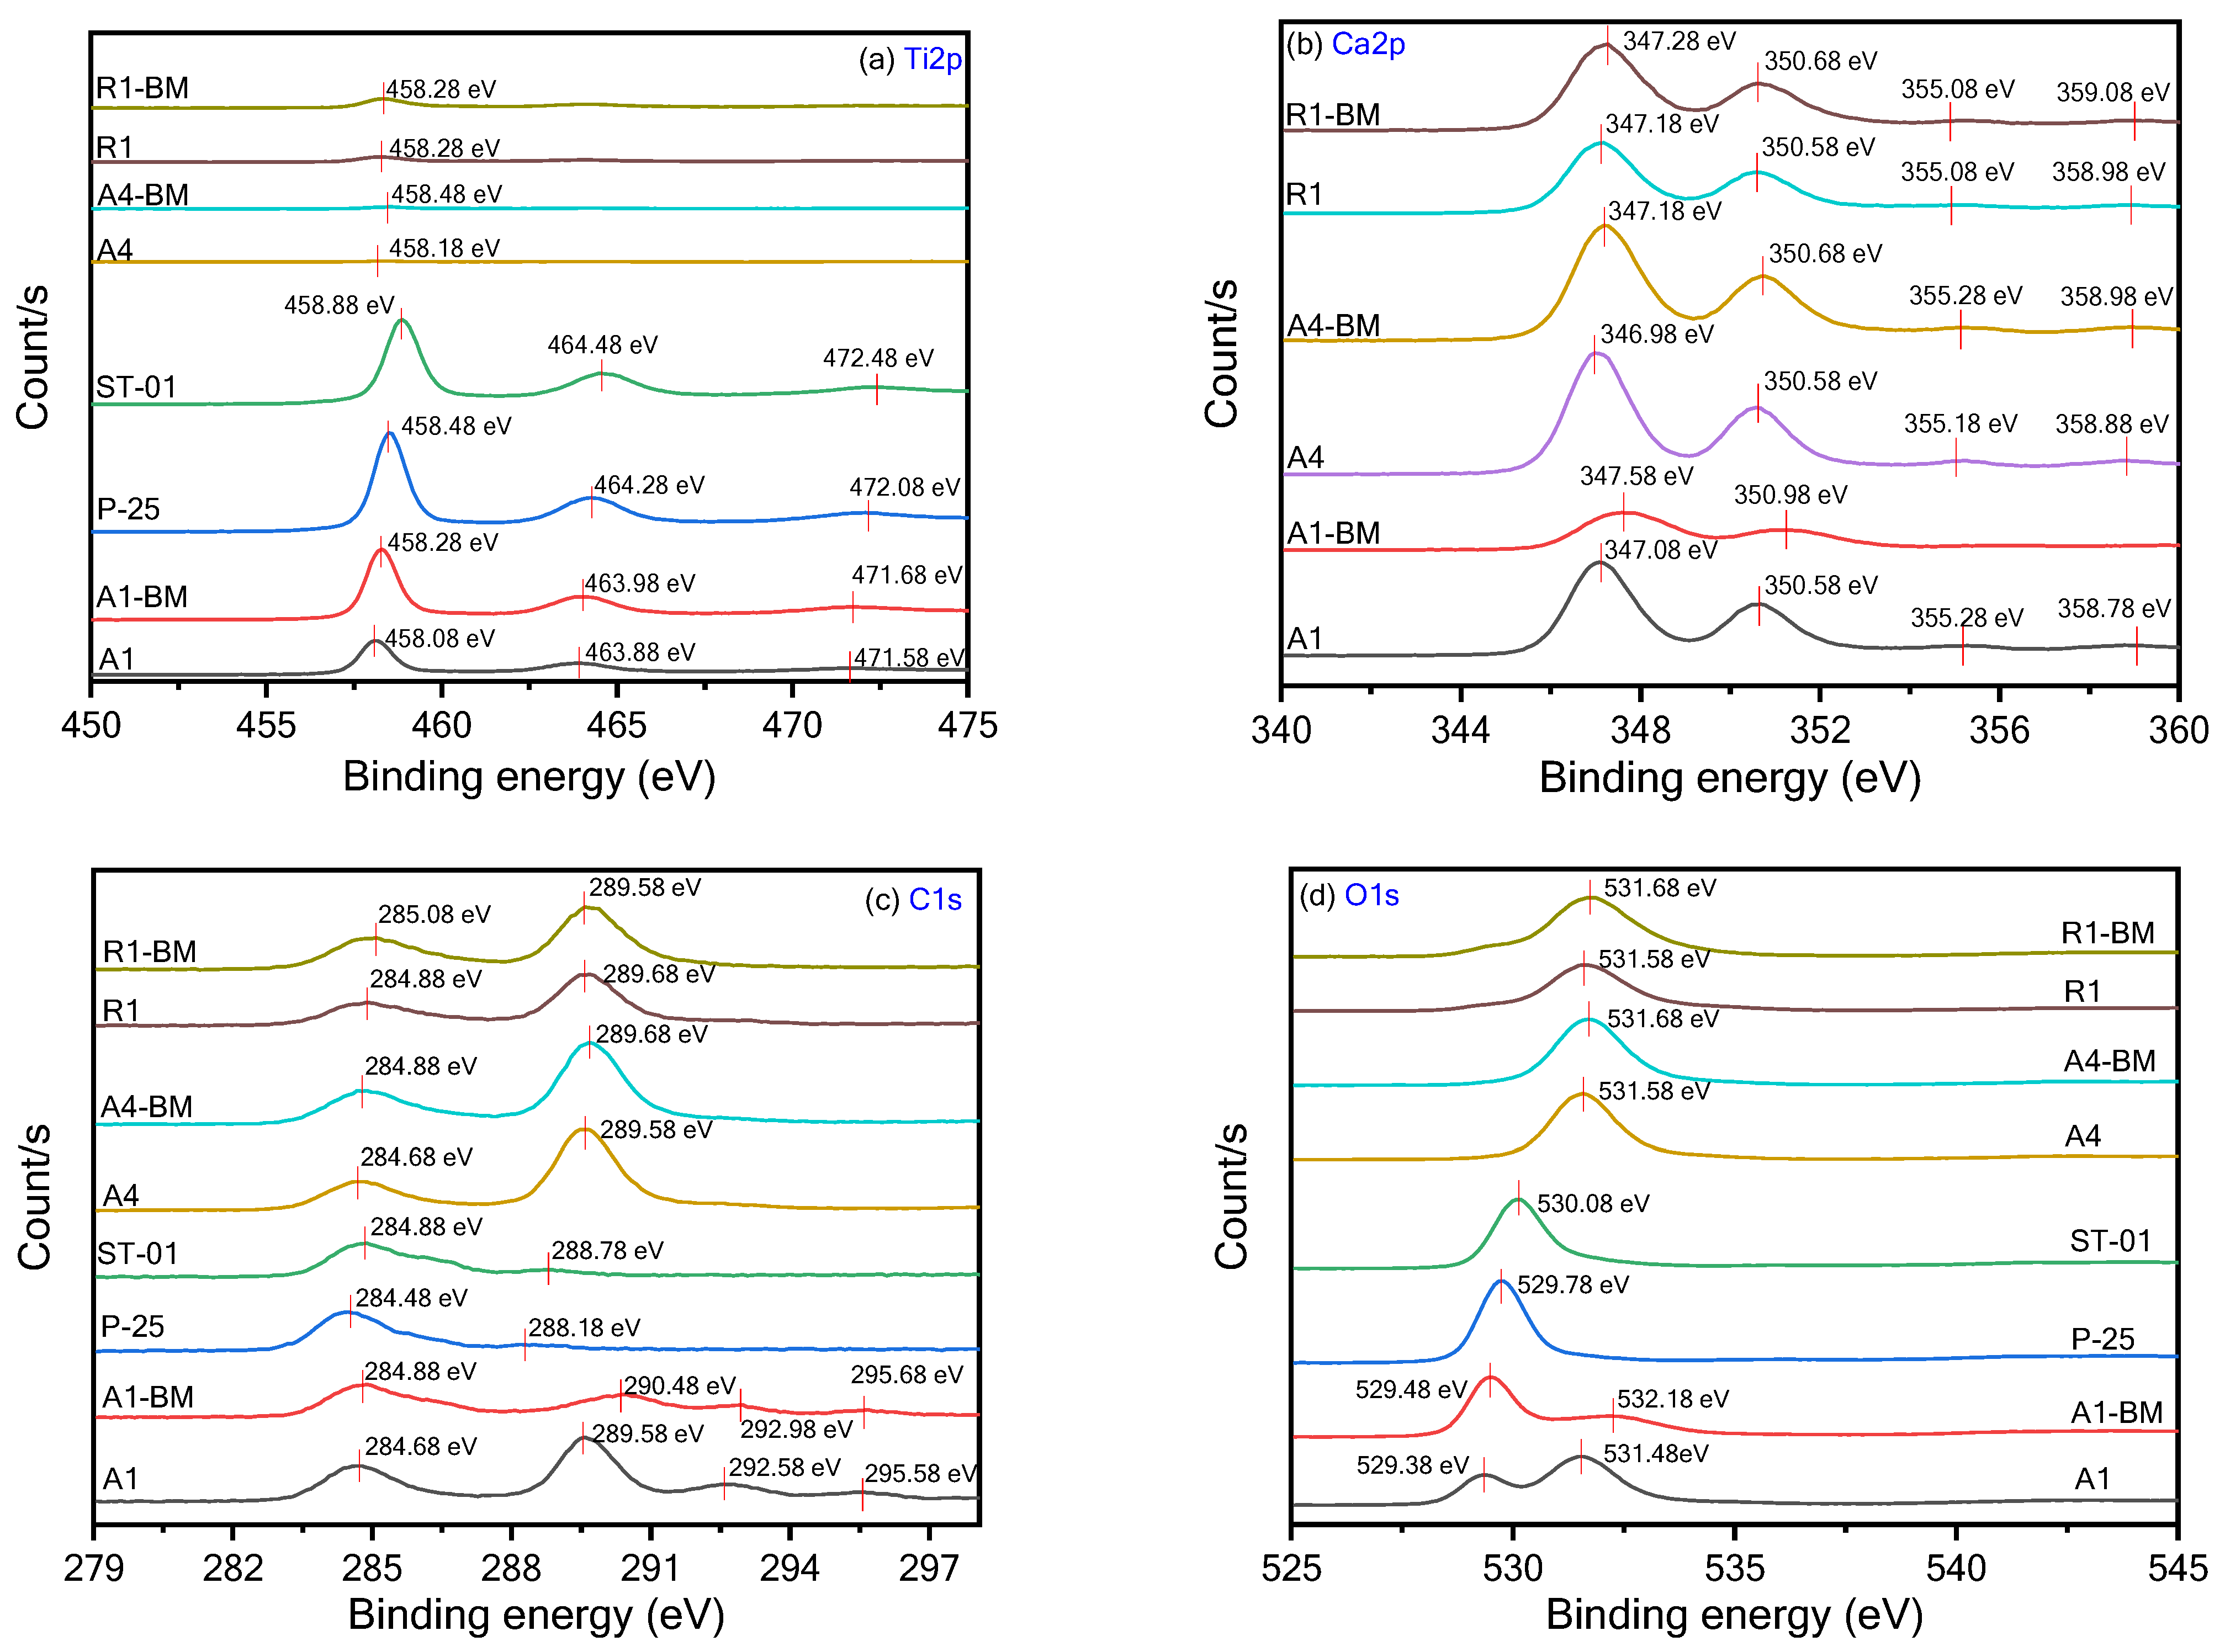
3.6.2. Core Level Analysis
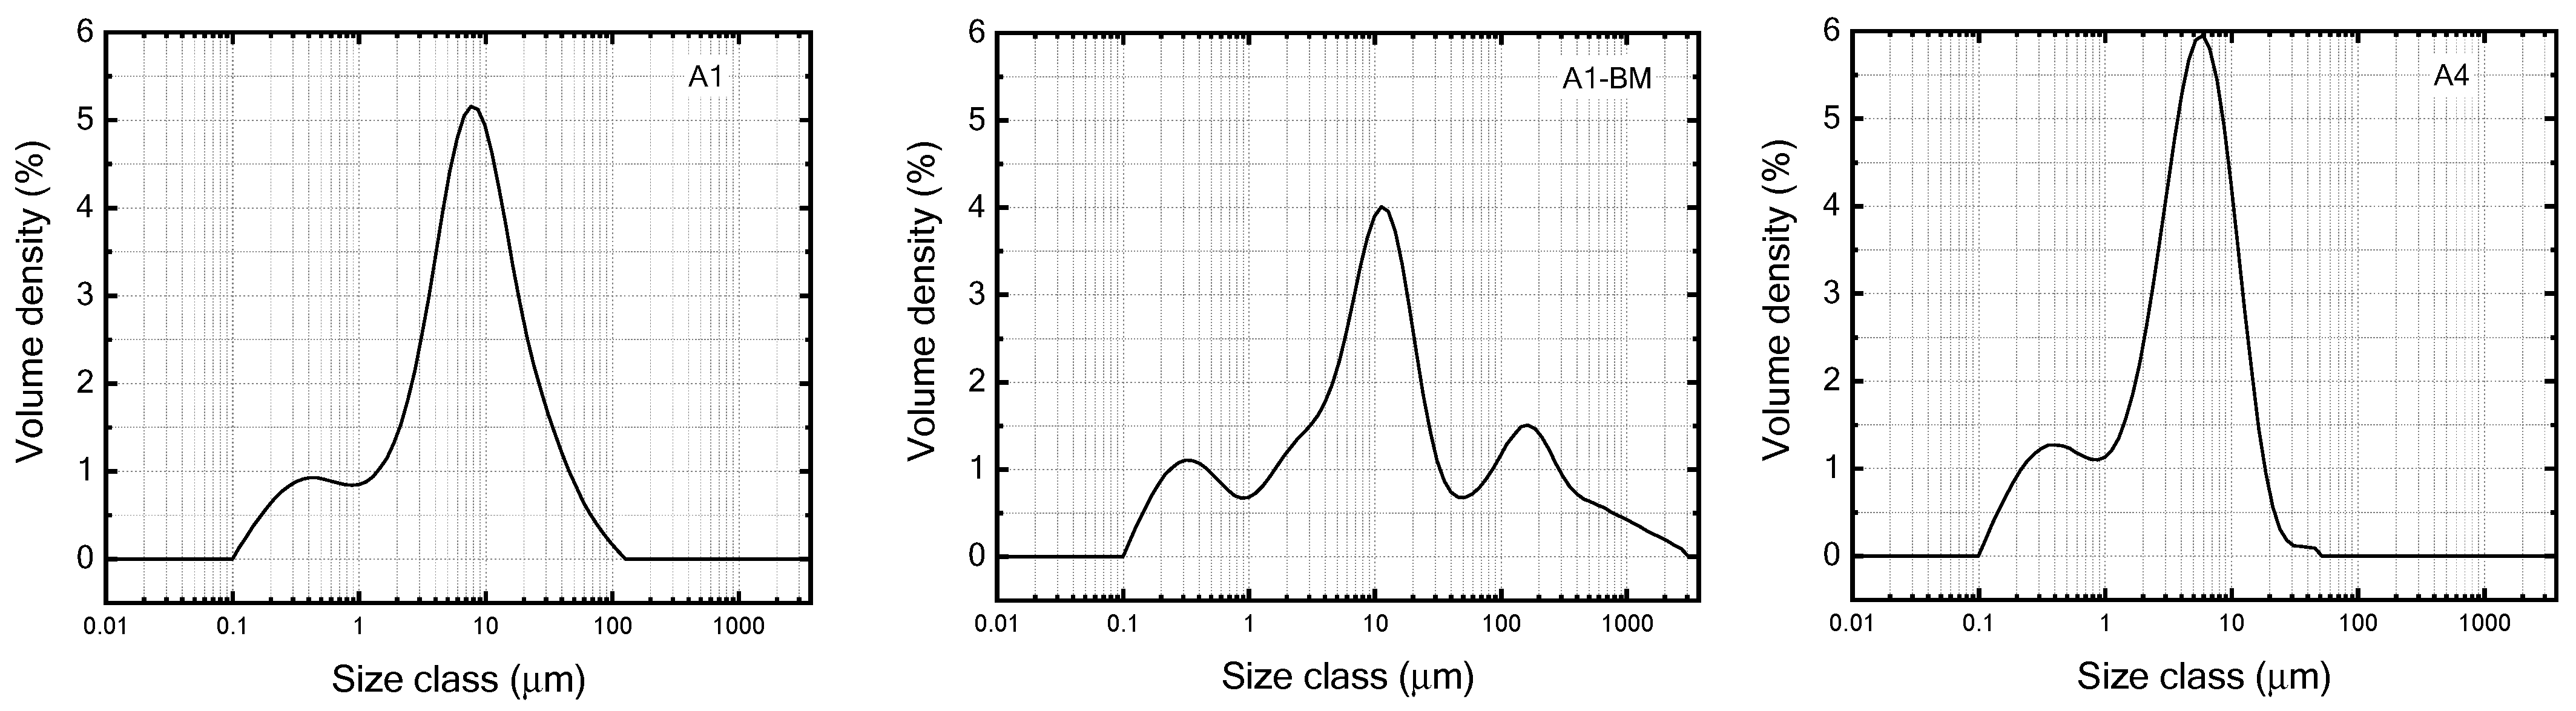
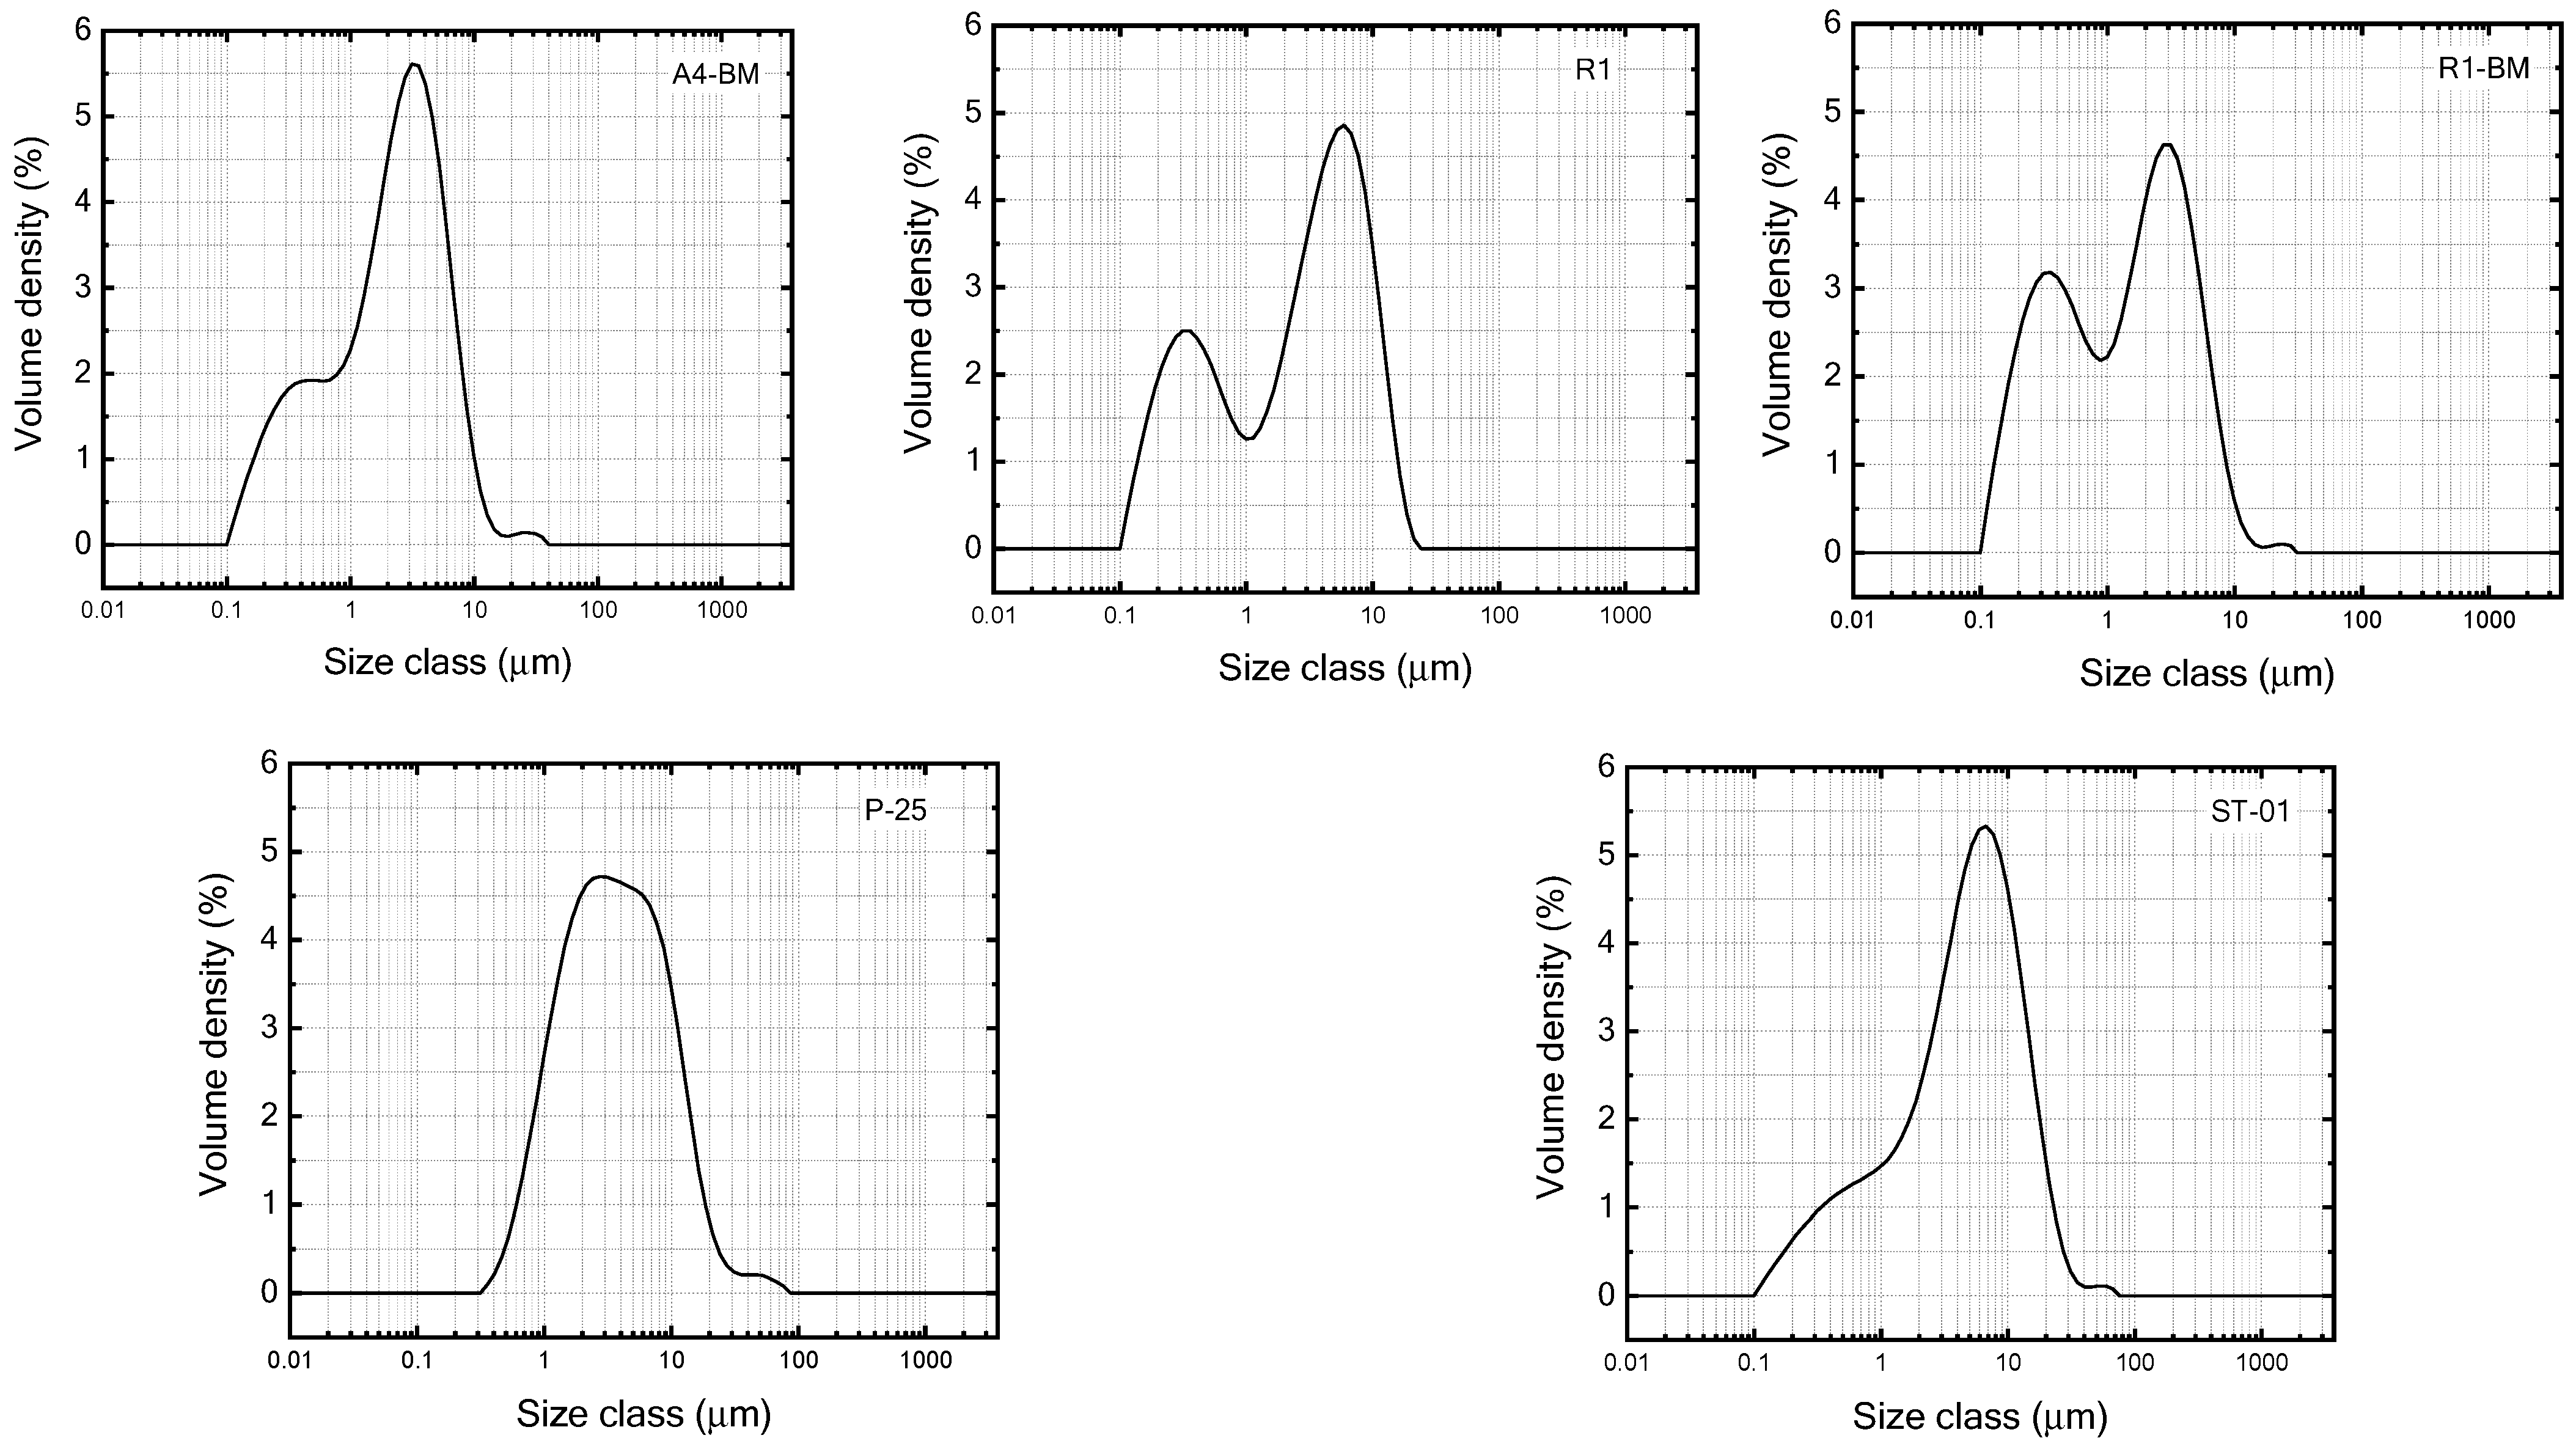
3.7. Particle Size Analysis
4. Conclusions
- This work proved that besides the use of pristine pure commercial TiO2, cheaper TiO2 composite can be suitably modified and incorporated into cementitious materials to develop newer and advanced construction materials.
- Our ball milling post-treatment strategy of composite TiO2 demonstrated a significant enhancement in functional performance such as photodegradation capability. The developed construction materials in this work exhibited superior performance over pristine titania due to the augmented interactions between the titania and the component in the composite, modification of crystal structure, surface characteristics and physicochemical properties resulting in influences on the photocatalytic performance of a cementitious system.
- The findings of the present work are expected to contribute to new directions for developing cheaper commercial construction materials with enhanced performance and provides scope for extending the possible utilization of such developed materials in the wider use of photocatalytic building materials.
Supplementary Materials
Author Contributions
Funding
Institutional Review Board Statement
Informed Consent Statement
Data Availability Statement
Conflicts of Interest
References
- Marin, M.L.; Santos-Juanes, L.; Arques, A.; Amat, A.M.; Miranda, M.A. Organic Photocatalysts for the Oxidation of Pollutants and Model Compounds. Chem. Rev. 2012, 112, 1710–1750. [Google Scholar] [CrossRef] [PubMed]
- Rao, Z.; Shi, G.; Wang, Z.; Mahmood, A.; Xie, X.; Sun, J. Photocatalytic Degradation of Gaseous VOCs over Tm3+-TiO2: Revealing the Activity Enhancement Mechanism and Different Reaction Paths. Chem. Eng. J. 2020, 395, 125078. [Google Scholar] [CrossRef]
- Dudziak, S.; Bielan, Z.; Kubica, P.; Zielinska-Jurek, A. Optimization of Carbamazepine Photodegradation on Defective TiO2-Based Magnetic Photocatalyst. J. Environ. Chem. Eng. 2021, 9, 105782. [Google Scholar] [CrossRef]
- Alonso-Tellez, A.; Masson, R.; Robert, D.; Keller, N.; Keller, V. Comparison of Hombikat UV100 and P25 TiO2 Performance in Gas-Phase Photocatalytic Oxidation Reactions. J. Photochem. Photobiol. A Chem. 2012, 250, 58–65. [Google Scholar] [CrossRef]
- Espíndola, J.C.; Cristóvão, R.O.; Mendes, A.; Boaventura, R.A.R.; Vilar, V.J.P. Photocatalytic Membrane Reactor Performance towards Oxytetracycline Removal from Synthetic and Real Matrices: Suspended vs Immobilized TiO2-P25. Chem. Eng. J. 2019, 378, 122114. [Google Scholar] [CrossRef]
- Pelaez, M.; Nolan, N.T.; Pillai, S.C.; Seery, M.K.; Falaras, P.; Kontos, A.G.; Dunlop, P.S.M.; Hamilton, J.W.J.; Byrne, J.A.; O’Shea, K.; et al. A Review on the Visible Light Active Titanium Dioxide Photocatalysts for Environmental Applications. Appl. Catal. B 2012, 125, 331–349. [Google Scholar] [CrossRef] [Green Version]
- Zhu, X.; Qin, F.; Xia, Y.; Zhong, Y.; Zhang, X.; Feng, W.; Jiao, Y. Synthesis of Ag@AgCl Modified Anatase/Rutile/Brookite Mixed Phase TiO2 and Their Photocatalytic Property. Nanotechnol. Rev. 2022, 11, 2916–2927. [Google Scholar] [CrossRef]
- Sirisuk, A.; Klansorn, E.; Praserthdam, P. Effects of Reaction Medium and Crystallite Size on Ti3+ Surface Defects in Titanium Dioxide Nanoparticles Prepared by Solvothermal Method. Catal. Commun. 2008, 9, 1810–1814. [Google Scholar] [CrossRef]
- Naldoni, A.; Altomare, M.; Zoppellaro, G.; Liu, N.; Kment, Š.; Zbořil, R.; Schmuki, P. Photocatalysis with Reduced TiO2: From Black TiO2 to Cocatalyst-Free Hydrogen Production. ACS Catal. 2019, 9, 345–364. [Google Scholar] [CrossRef] [Green Version]
- Kočí, K.; Obalová, L.; Matějová, L.; Plachá, D.; Lacný, Z.; Jirkovský, J.; Šolcová, O. Effect of TiO2 Particle Size on the Photocatalytic Reduction of CO2. Appl. Catal. B 2009, 89, 494–502. [Google Scholar] [CrossRef]
- Bianchi, C.L.; Gatto, S.; Pirola, C.; Naldoni, A.; di Michele, A.; Cerrato, G.; Crocellà, V.; Capucci, V. Photocatalytic Degradation of Acetone, Acetaldehyde and Toluene in Gas-Phase: Comparison between Nano and Micro-Sized TiO2. Appl. Catal. B 2014, 146, 123–130. [Google Scholar] [CrossRef]
- Bakardjieva, S.; Šubrt, J.; Štengl, V.; Dianez, M.J.; Sayagues, M.J. Photoactivity of Anatase-Rutile TiO2 Nanocrystalline Mixtures Obtained by Heat Treatment of Homogeneously Precipitated Anatase. Appl. Catal. B 2005, 58, 193–202. [Google Scholar] [CrossRef]
- Reyes-Coronado, D.; Rodríguez-Gattorno, G.; Espinosa-Pesqueira, M.E.; Cab, C.; de Coss, R.; Oskam, G. Phase-Pure TiO2 Nanoparticles: Anatase, Brookite and Rutile. Nanotechnology 2008, 19, 145605. [Google Scholar] [CrossRef] [PubMed]
- Ohtani, B.; Prieto-Mahaney, O.O.; Li, D.; Abe, R. What Is Degussa (Evonic) P25? Crystalline Composition Analysis, Reconstruction from Isolated Pure Particles and Photocatalytic Activity Test. J. Photochem. Photobiol. A Chem. 2010, 216, 179–182. [Google Scholar] [CrossRef] [Green Version]
- Allen, N.S.; Vishnyakov, V.; Kelly, P.J.; Kriek, R.J.; Mahdjoub, N.; Hill, C. Characterisation and Photocatalytic Assessment of TiO2 Nano-Polymorphs: Influence of Crystallite Size and Influence of Thermal Treatment on Paint Coatings and Dye Fading Kinetics. J. Phys. Chem. Solids 2019, 126, 131–142. [Google Scholar] [CrossRef] [Green Version]
- Reza, K.M.; Kurny, A.; Gulshan, F. Parameters Affecting the Photocatalytic Degradation of Dyes Using TiO2: A Review. Appl. Water Sci. 2017, 7, 1569–1578. [Google Scholar] [CrossRef] [Green Version]
- Devi, L.G.; Kavitha, R. A Review on Non Metal Ion Doped Titania for the Photocatalytic Degradation of Organic Pollutants under UV/Solar Light: Role of Photogenerated Charge Carrier Dynamics in Enhancing the Activity. Appl. Catal. B 2013, 140–141, 559–587. [Google Scholar] [CrossRef]
- Li, R.; Li, T.; Zhou, Q. Impact of Titanium Dioxide (TiO2) Modification on Its Application to Pollution Treatment—A Review. Catalysts 2020, 10, 804. [Google Scholar] [CrossRef]
- Taghipour, S.; Yeung, K.L.; Ataie-Ashtiani, B. Efficiency of Mechanochemical Ball Milling Technique in the Preparation of Fe/TiO2 Photocatalysts. ChemEngineering 2022, 6, 77. [Google Scholar] [CrossRef]
- Saitow, K.I.; Wakamiya, T. 130-Fold Enhancement of TiO2 Photocatalytic Activities by Ball Milling. Appl. Phys. Lett. 2013, 103, 4816058. [Google Scholar] [CrossRef]
- Dulian, P.; Buras, M.; Żukowski, W. Modyfication of Photocatalytic Properties of Titanium Dioxide by Mechanochemical Method. Pol. J. Chem. Technol. 2016, 18, 68–71. [Google Scholar] [CrossRef] [Green Version]
- Gopalan, A.I.; Lee, J.C.; Saianand, G.; Lee, K.P.; Chun, W.Y.; Hou, Y.L.; Kannan, V.; Park, S.S.; Kim, W.J. Cost-Effective Production of TiO2 with 90-Fold Enhanced Photocatalytic Activity via Facile Sequential Calcination and Ball Milling Post-Treatment Strategy. Materials 2020, 13, 5072. [Google Scholar] [CrossRef] [PubMed]
- ISO 679:2009; Cement—Test Methods—Determination of Strength. ISO: Geneva, Switzerland, 2009.
- ASTM C1329-05; Standard Specification for Mortar Cement. ASTM International: Conshohocken, PA, USA, 2005.
- JIS R 1701-1:2004; Fine Ceramics (Advanced Ceramics, Advanced Technical Ceramics)—Test Method for Air Purification Performance of Photocatalytic Materials—Part 1: Removal of Nitric Oxide (FOREIGN STANDARD). Japanese Industrial Standards: Tokyo, Japan, 2004.
- Zou, X.; Zhu, G. Microporous Organic Materials for Membrane-Based Gas Separation. Adv. Mater. 2018, 30, 750. [Google Scholar] [CrossRef] [PubMed]
- Kusumawardani, L.J.; Syahputri, Y. Study of Structural and Optical Properties of Fe(III)-Doped TiO2 Prepared by Sol-Gel Method. In Proceedings of the IOP Conference Series: Earth and Environmental Science, Bogor, Indonesia, 25 October 2018; Institute of Physics Publishing: Bristol, UK, 2019; Volume 299. [Google Scholar]
- Sembiring, E.; Bonardo, D.; Sembiring, K.; Sitorus, Z. Analyze the Strength of Ceramics Made from Clay, Sinabung Volcanic Ash and Sea Water in the Term of the Structure. J. Phys. Conf. Ser. 2021, 2019, 012066. [Google Scholar] [CrossRef]
- Chu, D.H.; Vinoba, M.; Bhagiyalakshmi, M.; Hyun Baek, I.; Nam, S.C.; Yoon, Y.; Kim, S.H.; Jeong, S.K. CO2 Mineralization into Different Polymorphs of CaCO3 Using an Aqueous-CO2 System. RSC Adv. 2013, 3, 21722–21729. [Google Scholar] [CrossRef]
- Chen, Y.-F.; Lee, C.-Y.; Yeng, M.-Y.; Chiu, H.-T. The Effect of Calcination Temperature on the Crystallinity of TiO2 Nanopowders. J. Cryst. Growth 2003, 247, 363–370. [Google Scholar] [CrossRef]
- Guo, Z.; Wu, H.; Li, M.; Tang, T.; Wen, J.; Li, X. Phosphorus-Doped Graphene Quantum Dots Loaded on TiO2 for Enhanced Photodegradation. Appl. Surf. Sci. 2020, 526, 146724. [Google Scholar] [CrossRef]
- Inceesungvorn, B.; Teeranunpong, T.; Nunkaew, J.; Suntalelat, S.; Tantraviwat, D. Novel NiTiO3/Ag3VO4 Composite with Enhanced Photocatalytic Performance under Visible Light. Catal. Commun. 2014, 54, 35–38. [Google Scholar] [CrossRef]
- Iatsunskyi, I.; Kempiński, M.; Nowaczyk, G.; Jancelewicz, M.; Pavlenko, M.; Załeski, K.; Jurga, S. Structural and XPS Studies of PSi/TiO2 Nanocomposites Prepared by ALD and Ag-Assisted Chemical Etching. Appl. Surf. Sci. 2015, 347, 777–783. [Google Scholar] [CrossRef]
- Oku, M.; Matsuta, H.; Wagatsuma, K.; Waseda, Y.; Kohiki, S. Removal of Inelastic Scattering Part from Ti2p XPS Spectrum of TiO2 by Deconvolution Method Using O1s as Response Function. J. Electron Spectrosc. Relat. Phenom. 1999, 105, 211–218. [Google Scholar] [CrossRef]
- Moulder, J.F.; Stickle, W.F.; Sobol, P.E.; Bomben, K.D.; Chastain, J. Handbook of X-ray Photoelectron Spectroscopy: A Reference Book of Standard Spectra for Identification and Interpretation of XPS Data; Physical Electronics Division, Perkin-Elmer Corporation: Eden Prairie, MI, USA, 1992. [Google Scholar]
- Voigts, F.; Bebensee, F.; Dahle, S.; Volgmann, K.; Maus-Friedrichs, W. The Adsorption of CO2 and CO on Ca and CaO Films Studied with MIES, UPS and XPS. Surf. Sci. 2009, 603, 40–49. [Google Scholar] [CrossRef]
- Stipp, S.L.; Hochella, M.F., Jr. Structure and Bonding Environments at the Calcite Surface as Observed with X-ray Photoelectron Spectroscopy (XPS) and Low Energy Electron Diffraction (LEED). Geochim. Cosmochim. Acta 1991, 55, 1723–1736. [Google Scholar] [CrossRef]
- Park, Y.; Kim, W.; Park, H.; Tachikawa, T.; Majima, T.; Choi, W. Carbon-Doped TiO2 Photocatalyst Synthesized without Using an External Carbon Precursor and the Visible Light Activity. Appl. Catal. B 2009, 91, 355–361. [Google Scholar] [CrossRef]
- Dimitrijevic, N.M.; Vijayan, B.K.; Poluektov, O.G.; Rajh, T.; Gray, K.A.; He, H.; Zapol, P. Role of Water and Carbonates in Photocatalytic Transformation of CO2 to CH4 on Titania. J. Am. Chem. Soc. 2011, 133, 3964–3971. [Google Scholar] [CrossRef] [PubMed]
- Yu, L.; Li, D. Photocatalytic Methane Conversion Coupled with Hydrogen Evolution from Water over Pd/TiO2. Catal. Sci. Technol. 2017, 7, 635–640. [Google Scholar] [CrossRef]
- Comer, B.M.; Liu, Y.H.; Dixit, M.B.; Hatzell, K.B.; Ye, Y.; Crumlin, E.J.; Hatzell, M.C.; Medford, A.J. The Role of Adventitious Carbon in Photo-Catalytic Nitrogen Fixation by Titania. J. Am. Chem. Soc. 2018, 140, 15157–15160. [Google Scholar] [CrossRef]
- Rusina, O.; Eremenko, A.; Frank, G.; Strunk, H.P.; Kisch, H. Photofixierung von Stickstoff an Nanostrukturierten Eisentitanatfilmen. Angew. Chem. 2001, 113, 4115–4117. [Google Scholar] [CrossRef]


| Sample ID. | Company Names | Composition | Price (won/kg) | ||
|---|---|---|---|---|---|
| A (%) | R (%) | C (%) | |||
| A1(BA01-01) | Hengyang Yutu Chemical (Hengyang, China) | 42.6 | - | 57.4 | 1000 |
| A4(BA01-01+) | Hengyang Yutu Chemical (Hengyang, China) | - | 0.1 | 99.9 | 1200 |
| R1(R996) | Sichuan Lomon Group (Sichuan, China) | - | minor | main | 2800 |
| P-25 | Degussa Ag (Marl, Germany) | 87.5 | 12.5 | - | 130,000 |
| ST-01 | Ishihara Sangyo (Osaka, Japan) | 100 | - | - | 140,000 |
| Mixture Types | Water (g) | Cement (g) | Sand (g) | Photocatalysts (%) |
|---|---|---|---|---|
| Plain mortar | 60 | 100 | 300 | 0 |
| Mortar mixed with photocatalysts | 60 | 100 | 300 | 5 |
| 60 | 100 | 300 | 10 | |
| 60 | 100 | 300 | 15 |
| Irradiation Time (h) | Photocatalysts | |||||||
|---|---|---|---|---|---|---|---|---|
| A1 | A1-BM | A4 | A4-BM | R1 | R1-BM | P25 | ST01 | |
| Concentration of the Photodegraded Methylene Blue (mg/L) | ||||||||
| 1 h | 5 | 3 | 9.3 | 8.1 | 9.3 | 8.5 | 3.74 | 6.31 |
| 2 h | 1.8 | 0.67 | 8.7 | 7 | 8.8 | 7.6 | 0 | 3.9 |
| Sample ID. | Pseudo-First Order Rate Constant (Y) | Slope of Y | Regression Coefficient (R2) |
|---|---|---|---|
| A1 | −0.893x + 0.092 | −0.893 | 0.985 |
| A1-BM | −1.385x + 0.133 | −1.385 | 0.991 |
| A4 | −0.066x + 0.001 | −0.066 | 0.990 |
| A4-BM | −0.174x − 0.015 | −0.174 | 0.992 |
| R1 | −0.071x − 0.0002 | −0.071 | 0.984 |
| R1-BM | −0.137x − 0.015 | −0.137 | 0.981 |
| P-25 | −1.059x + 0.040 | −1.059 | 0.996 |
| ST-01 | −0.441x − 0.027 | −0.441 | 0.982 |
| Samples | Composition | 2θ | Crystallite Size (nm) | D-Spacing (Å) | Lattice Constants (a, b, c) | |||||||||||||
|---|---|---|---|---|---|---|---|---|---|---|---|---|---|---|---|---|---|---|
| A (%) | R (%) | C (%) | A | R | C | A | R | C | A | R | C | A | R | C | ||||
| (101) | (110) | (104) | a = b | c | a = b | c | a= b | c | ||||||||||
| A1-BM | 33.3 | - | 66.7 | 25.34 | - | 29.46 | 48.46 | - | 42.12 | 3.51 | 3.02 | 3.77 | 9.50 | - | - | 4.97 | 17.02 | |
| A1 | 42.6 | - | 57.4 | 25.38 | - | 29.50 | 51.21 | - | 43.01 | 3.50 | 3.02 | 3.77 | 9.45 | - | - | 4.97 | 16.98 | |
| A4 | - | 0.1 | 99.9 | - | - | 29.45 | - | - | 54.39 | - | - | 3.03 | - | - | - | - | 4.98 | 17.02 |
| A4-BM | 1.9 | 98.1 | - | 27.42 | 29.38 | - | 68.9 | 39.36 | - | 3.24 | 3.03 | - | - | 5.59 | 2.96 | 4.99 | 17.05 | |
| R1 | - | minor | main | - | 27.86 | 29.46 | - | 38.6 | 42.34 | - | 3.19 | 3.02 | - | - | 4.52 | 2.98 | 4.98 | 17.01 |
| R1-BM | 0.2 | 13.2 | 86.7 | 25.40 | 27.46 | 29.47 | 67.00 | 57.35 | 44.70 | 3.50 | 3.24 | 3.02 | 3.78 | 9.51 | 4.58 | 2.95 | 4.97 | 17.01 |
| P-25 | 87.5 | 12.5 | - | 25.32 | 27.44 | - | 18.89 | 28.79 | - | 3.51 | 3.24 | - | 3.78 | 9.50 | 4.59 | 2.95 | - | - |
| ST01 | 100 | - | - | 25.29 | - | - | 6.28 | - | - | 3.51 | - | - | 3.78 | 9.50 | - | - | - | - |
Disclaimer/Publisher’s Note: The statements, opinions and data contained in all publications are solely those of the individual author(s) and contributor(s) and not of MDPI and/or the editor(s). MDPI and/or the editor(s) disclaim responsibility for any injury to people or property resulting from any ideas, methods, instructions or products referred to in the content. |
© 2023 by the authors. Licensee MDPI, Basel, Switzerland. This article is an open access article distributed under the terms and conditions of the Creative Commons Attribution (CC BY) license (https://creativecommons.org/licenses/by/4.0/).
Share and Cite
Kighuta, K.; Kim, S.-W.; Hou, Y.-L.; Lee, K.-P.; Kim, W.-J. Facile and Simple Post Treatment Ball Milling Strategy for the Production of Low-Cost TiO2 Composites with Enhanced Photocatalytic Performance and Applicability to Construction Materials. Materials 2023, 16, 4931. https://doi.org/10.3390/ma16144931
Kighuta K, Kim S-W, Hou Y-L, Lee K-P, Kim W-J. Facile and Simple Post Treatment Ball Milling Strategy for the Production of Low-Cost TiO2 Composites with Enhanced Photocatalytic Performance and Applicability to Construction Materials. Materials. 2023; 16(14):4931. https://doi.org/10.3390/ma16144931
Chicago/Turabian StyleKighuta, Kabuyaya, Sun-Woo Kim, Yao-Long Hou, Kwang-Pill Lee, and Wha-Jung Kim. 2023. "Facile and Simple Post Treatment Ball Milling Strategy for the Production of Low-Cost TiO2 Composites with Enhanced Photocatalytic Performance and Applicability to Construction Materials" Materials 16, no. 14: 4931. https://doi.org/10.3390/ma16144931