
A New Method of Predicting the Parameters of the Rotational Friction Welding Process Based on the Determination of the Frictional Heat Transfer in Ti Grade 2/AA 5005 Joints

Abstract
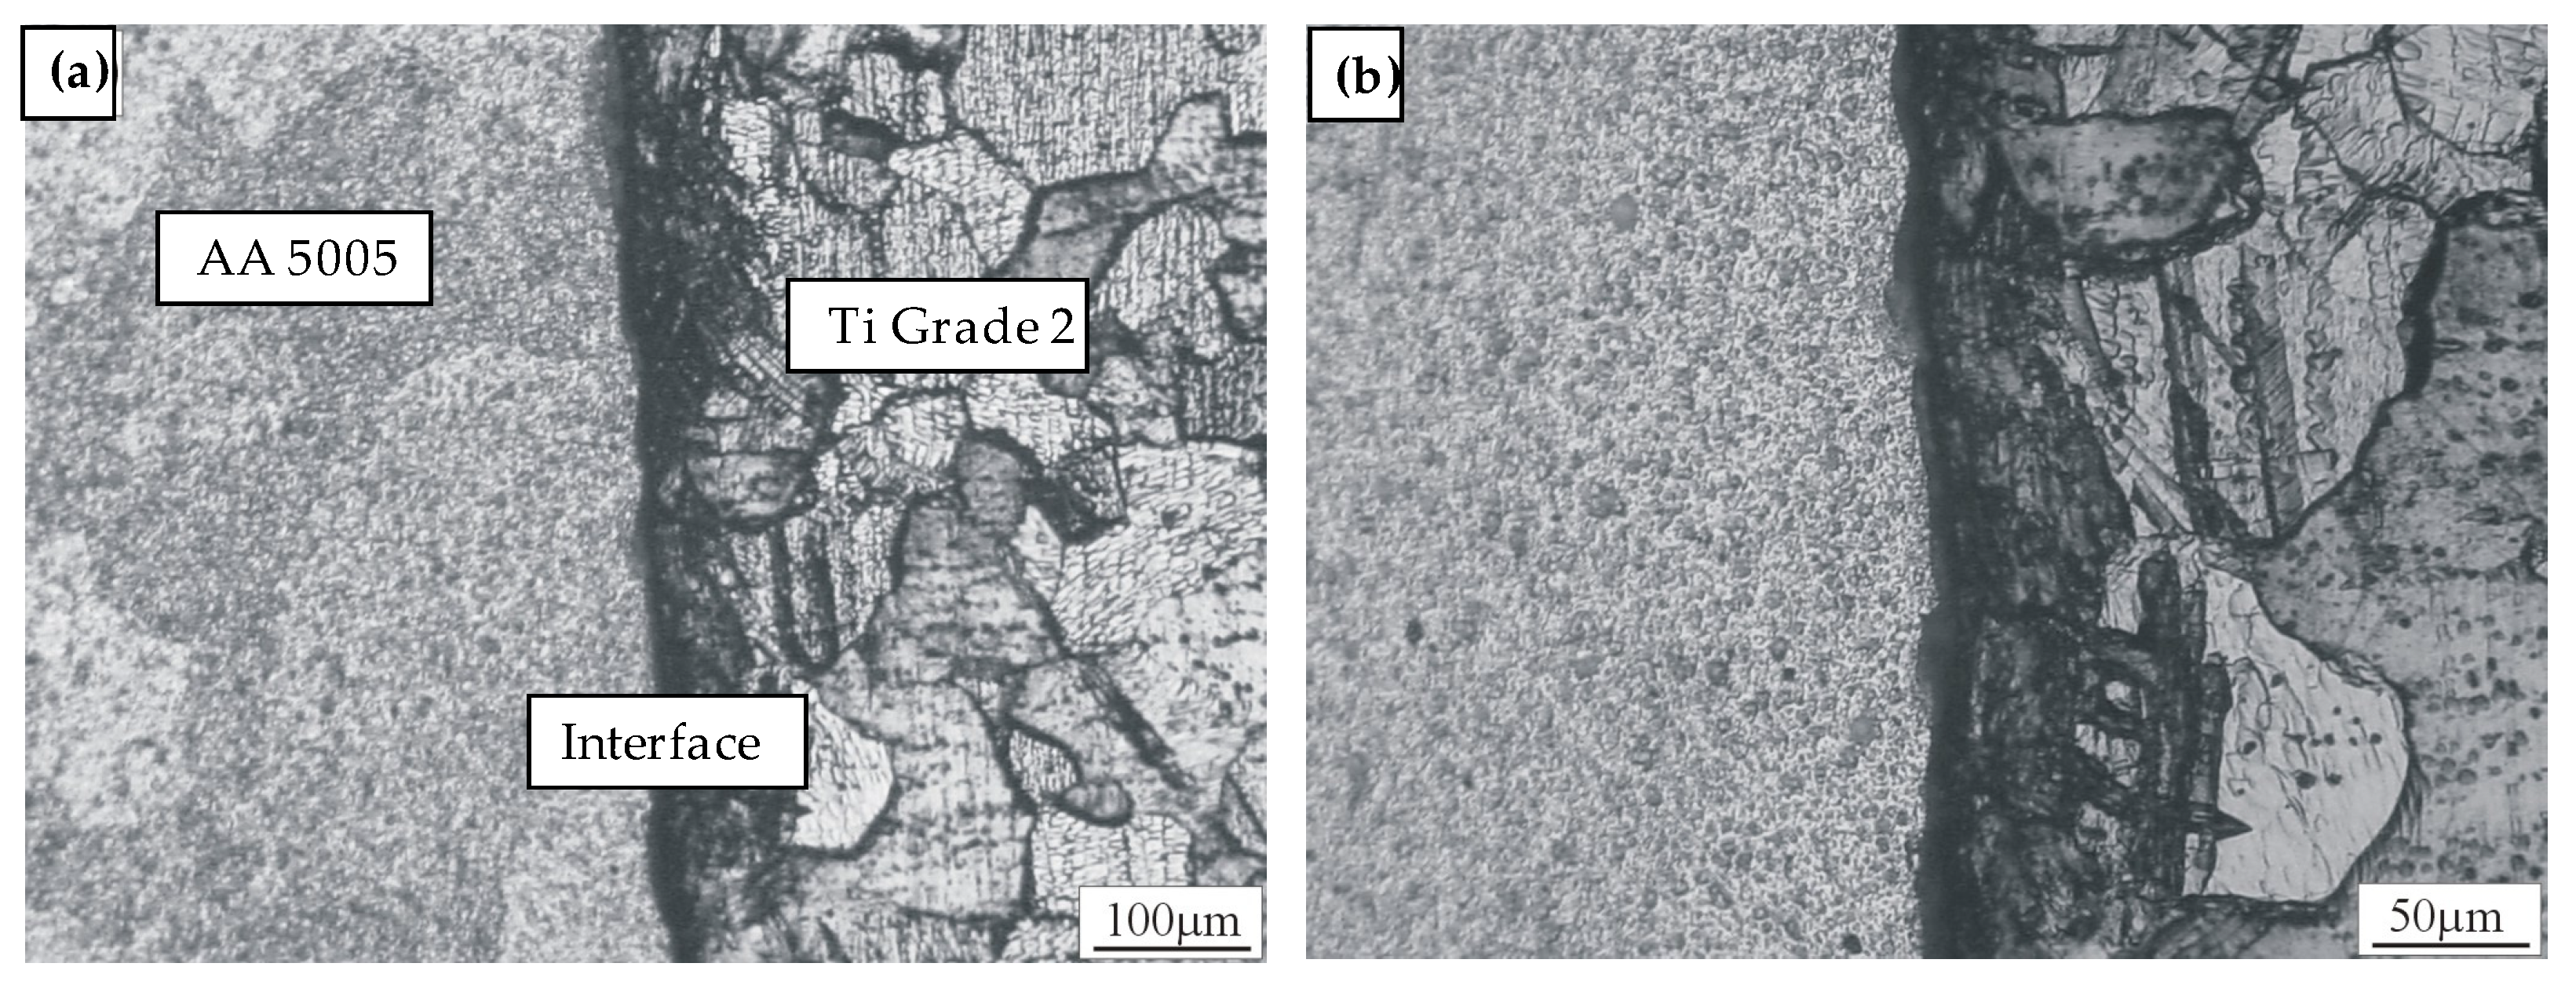
:1. Introduction
Types of Welded Materials
2. Welded Materials
2.1. Characteristics of Aluminum Alloy AA 5005
2.2. Characteristics of Ti Grade 2
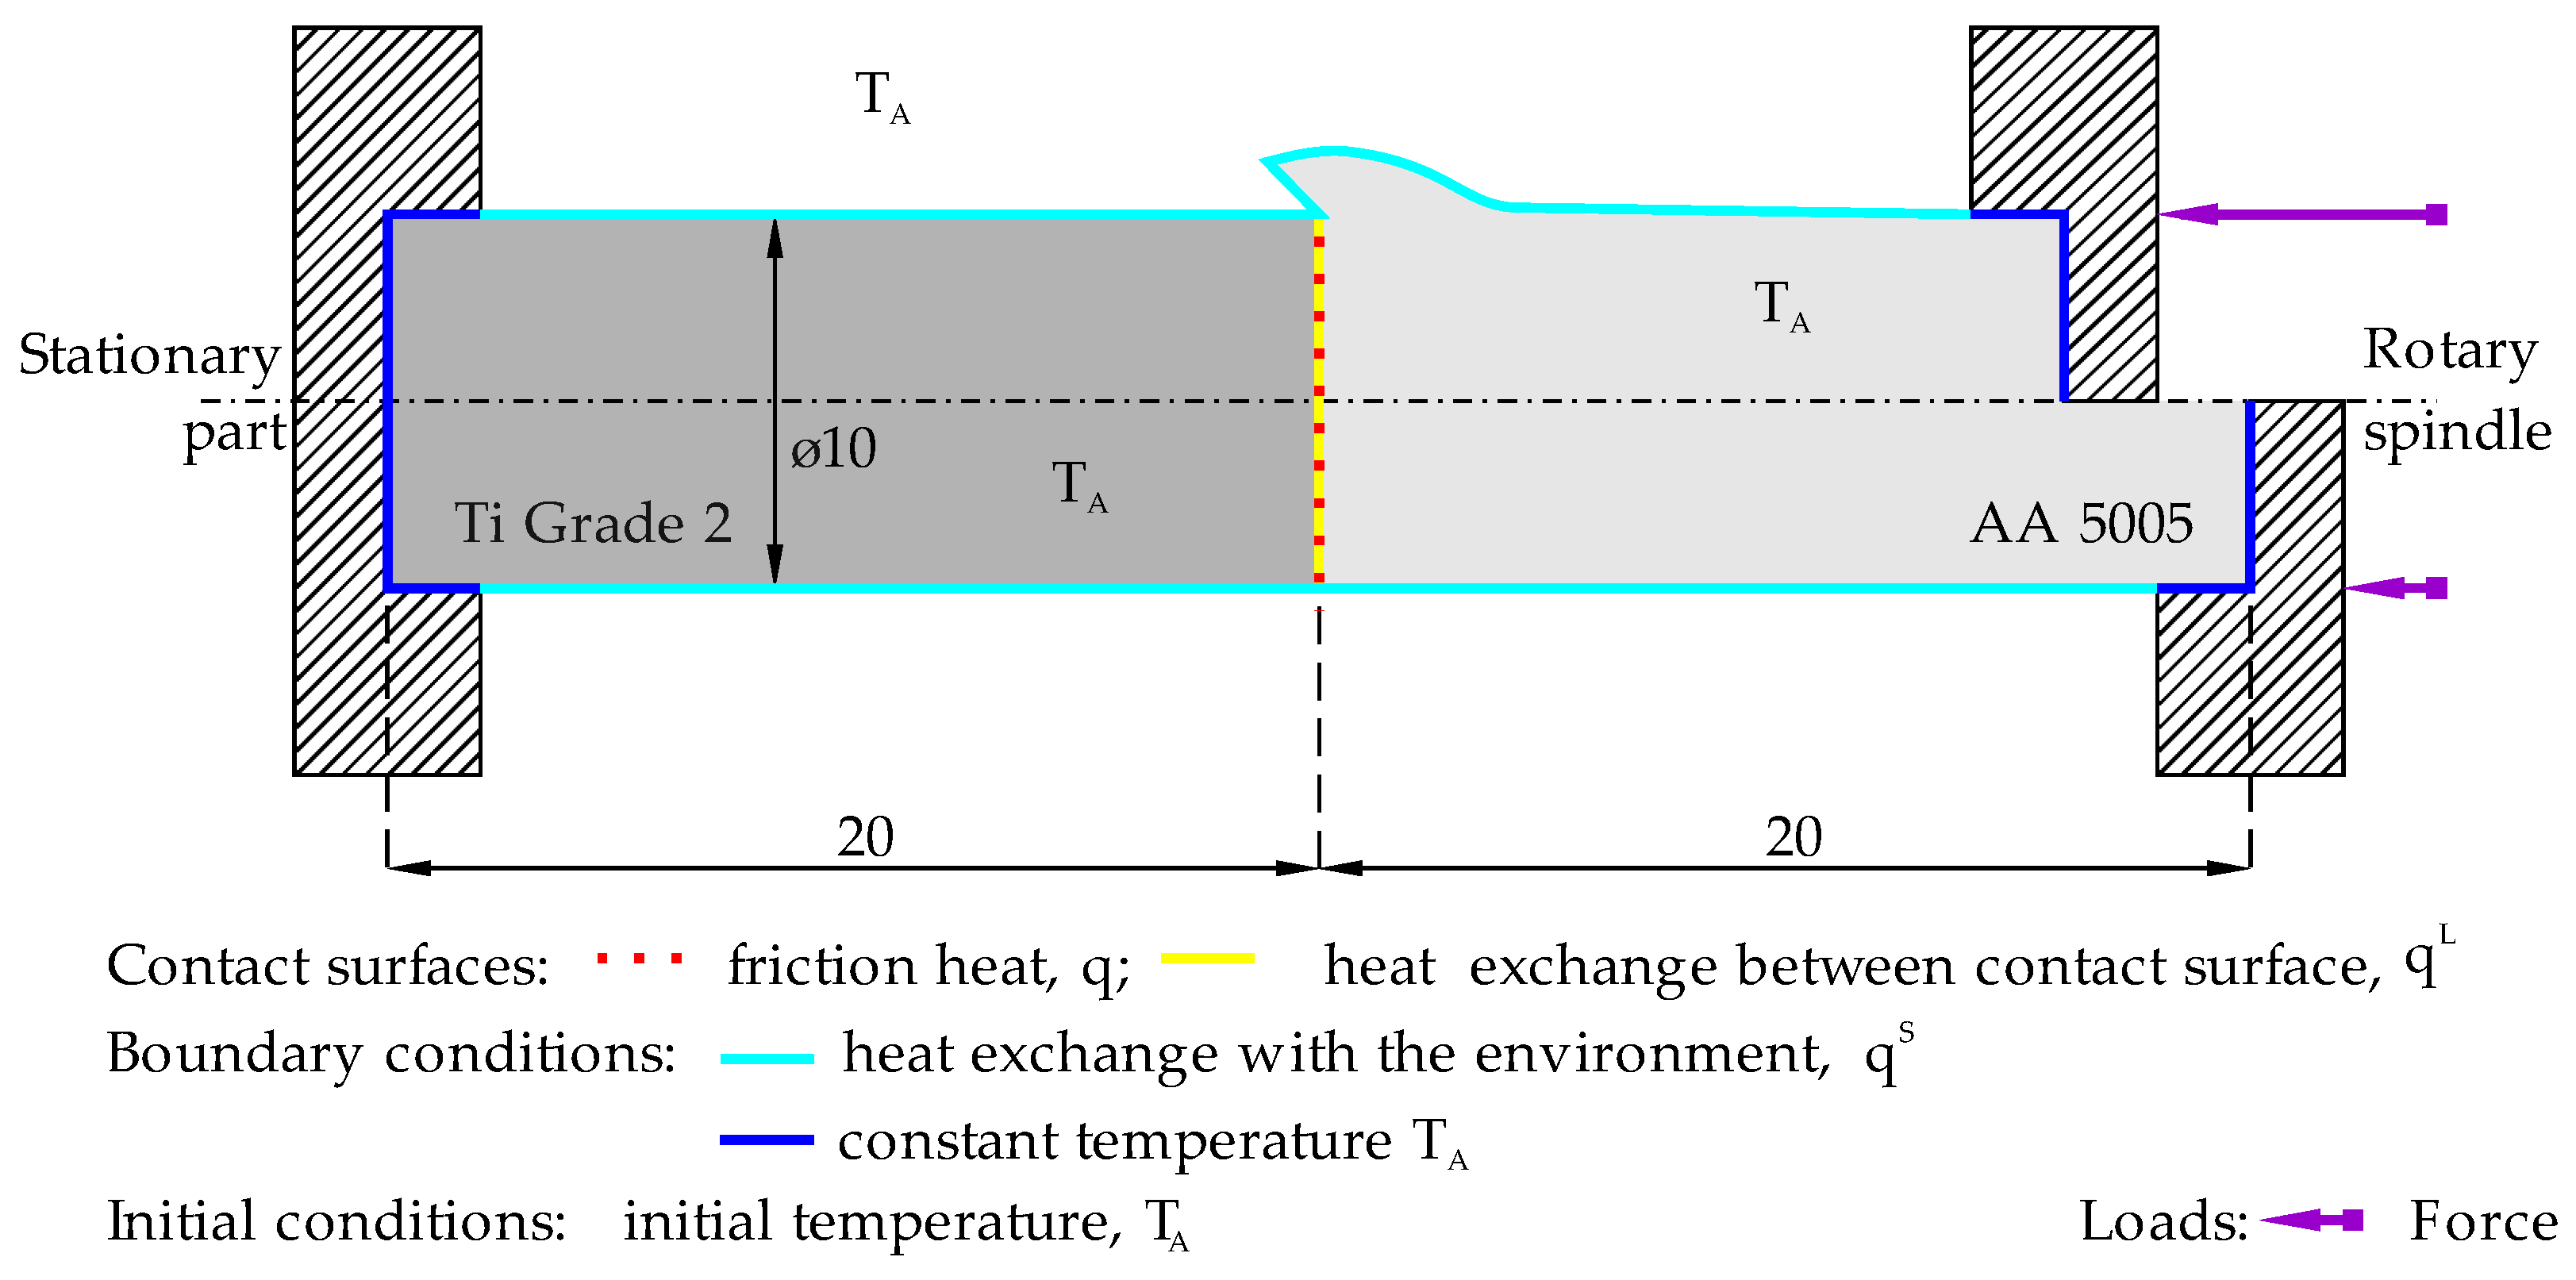
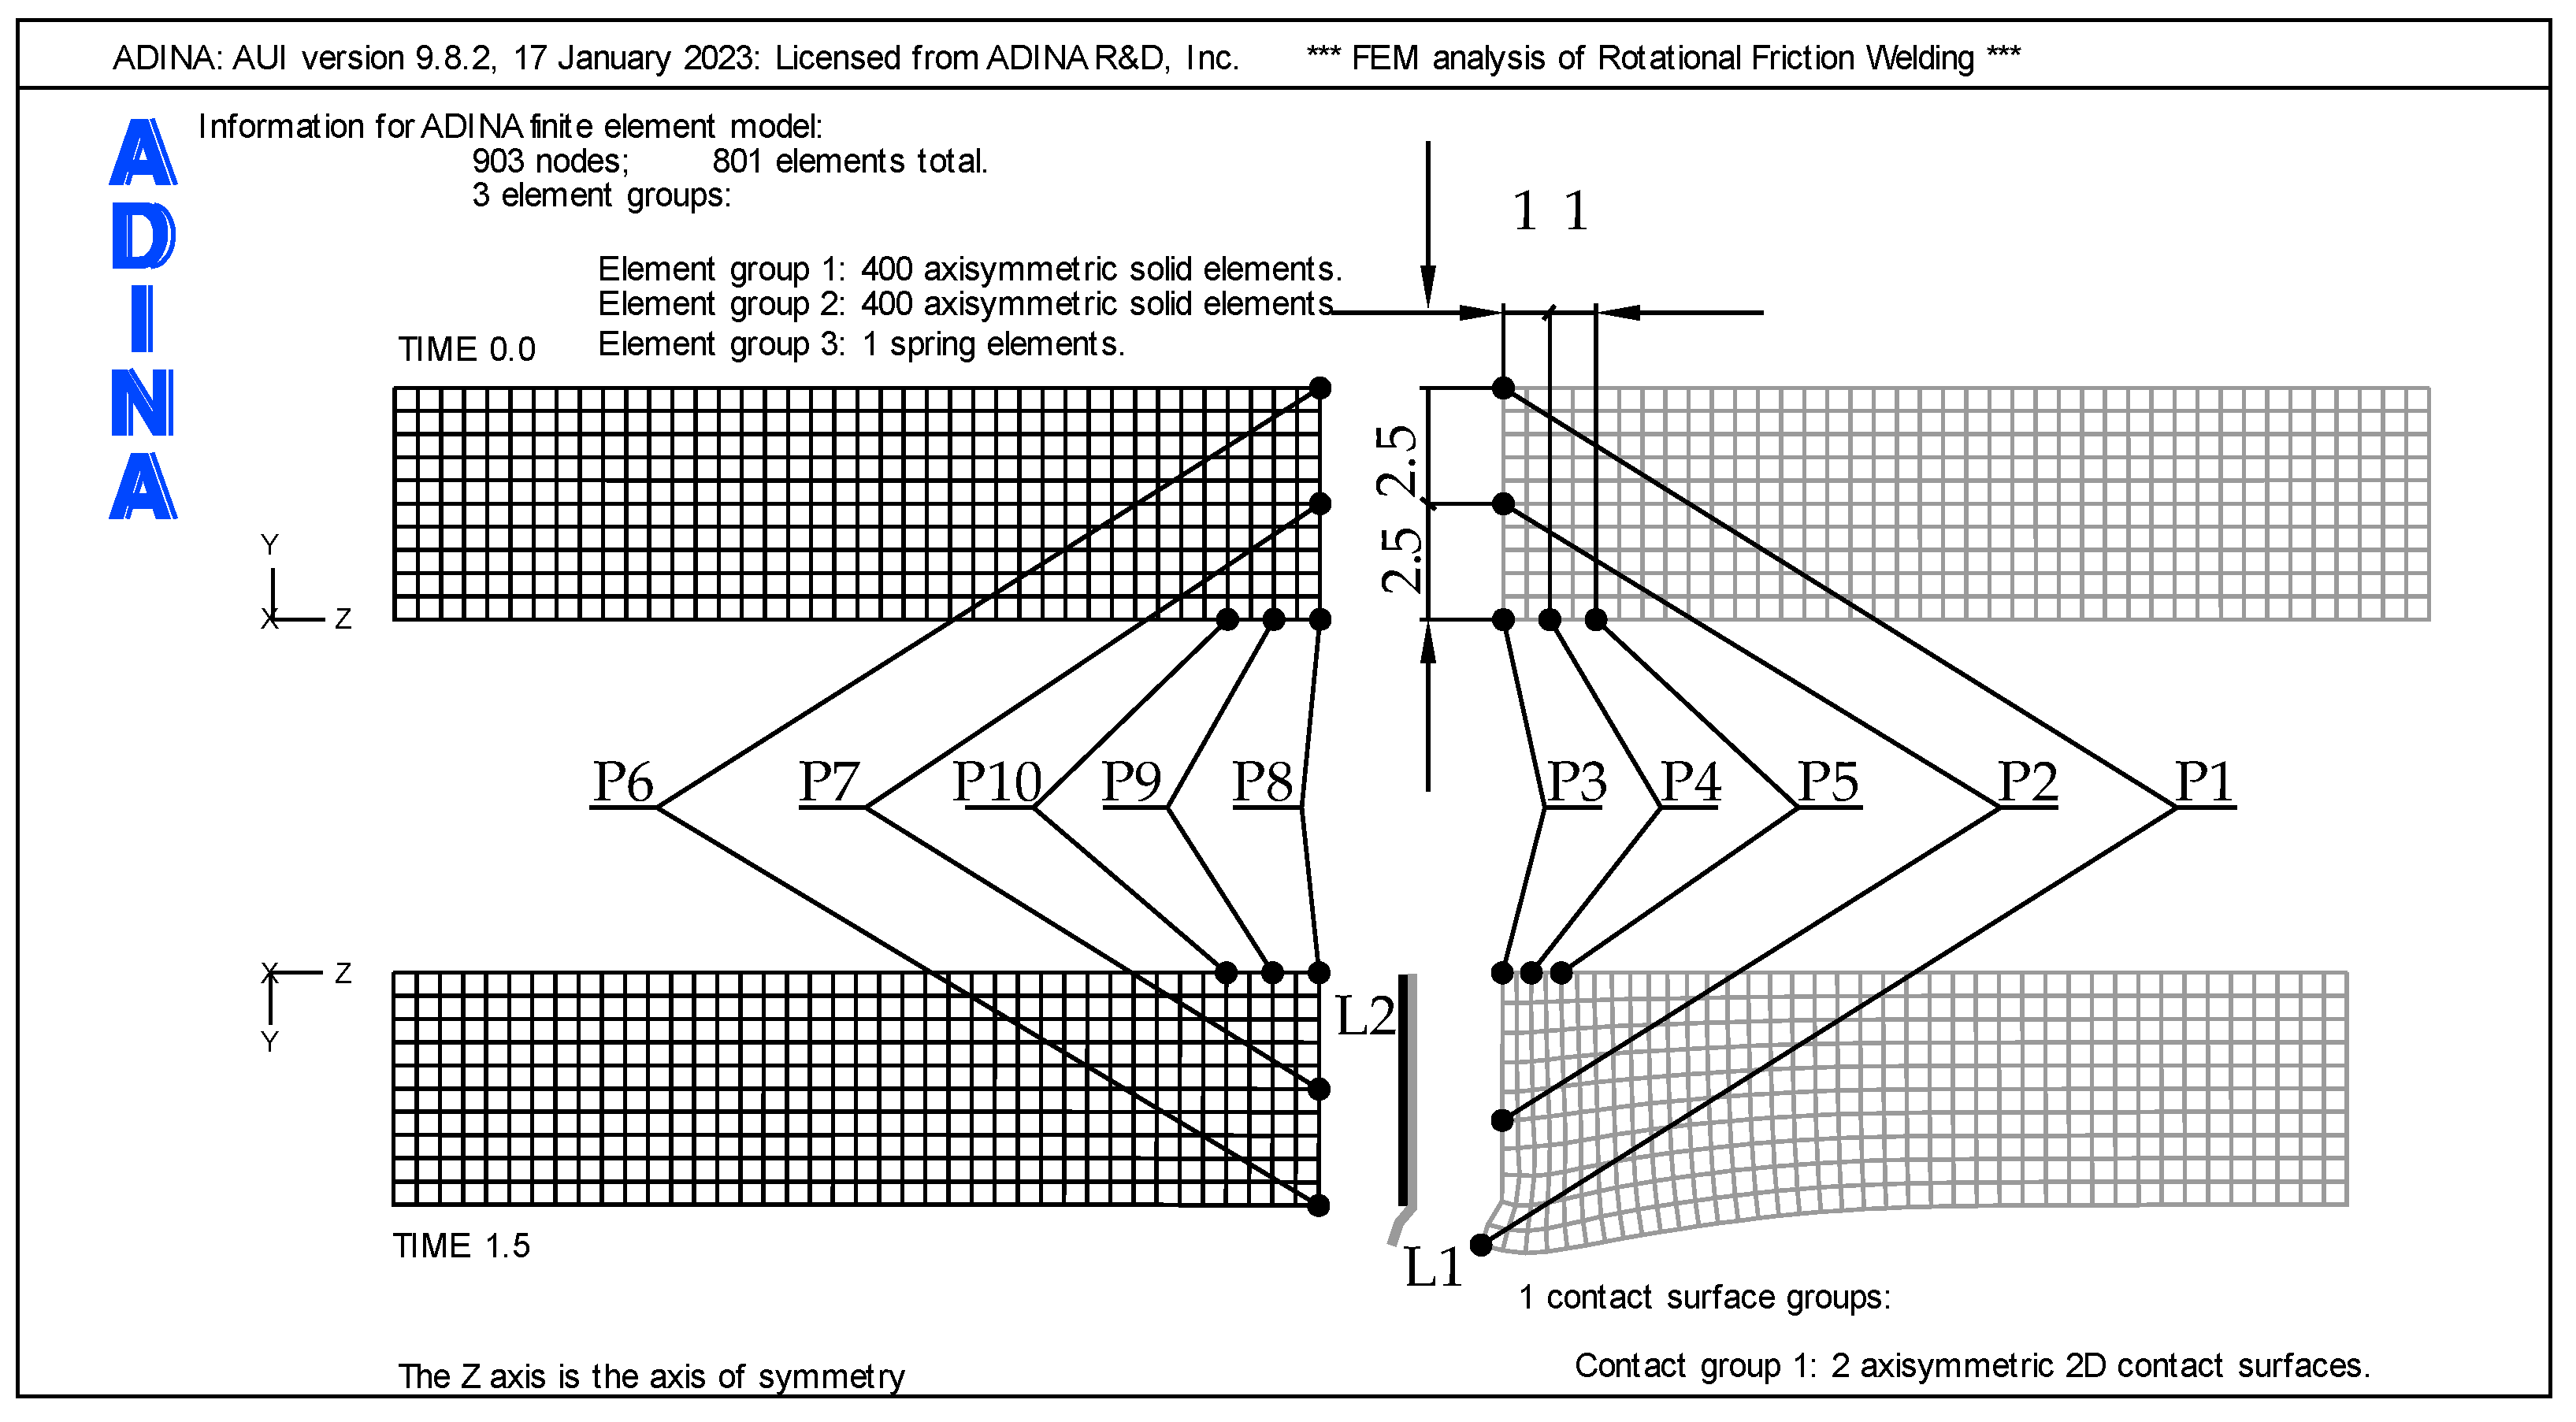
3. FEM Assumptions
- The von Mises yield condition;
- An associated flow rule using the von Mises yield function;
- An isotropic, bilinear hardening rule,
- was assumed in numerical modelling of the friction welding in the mechanical range.
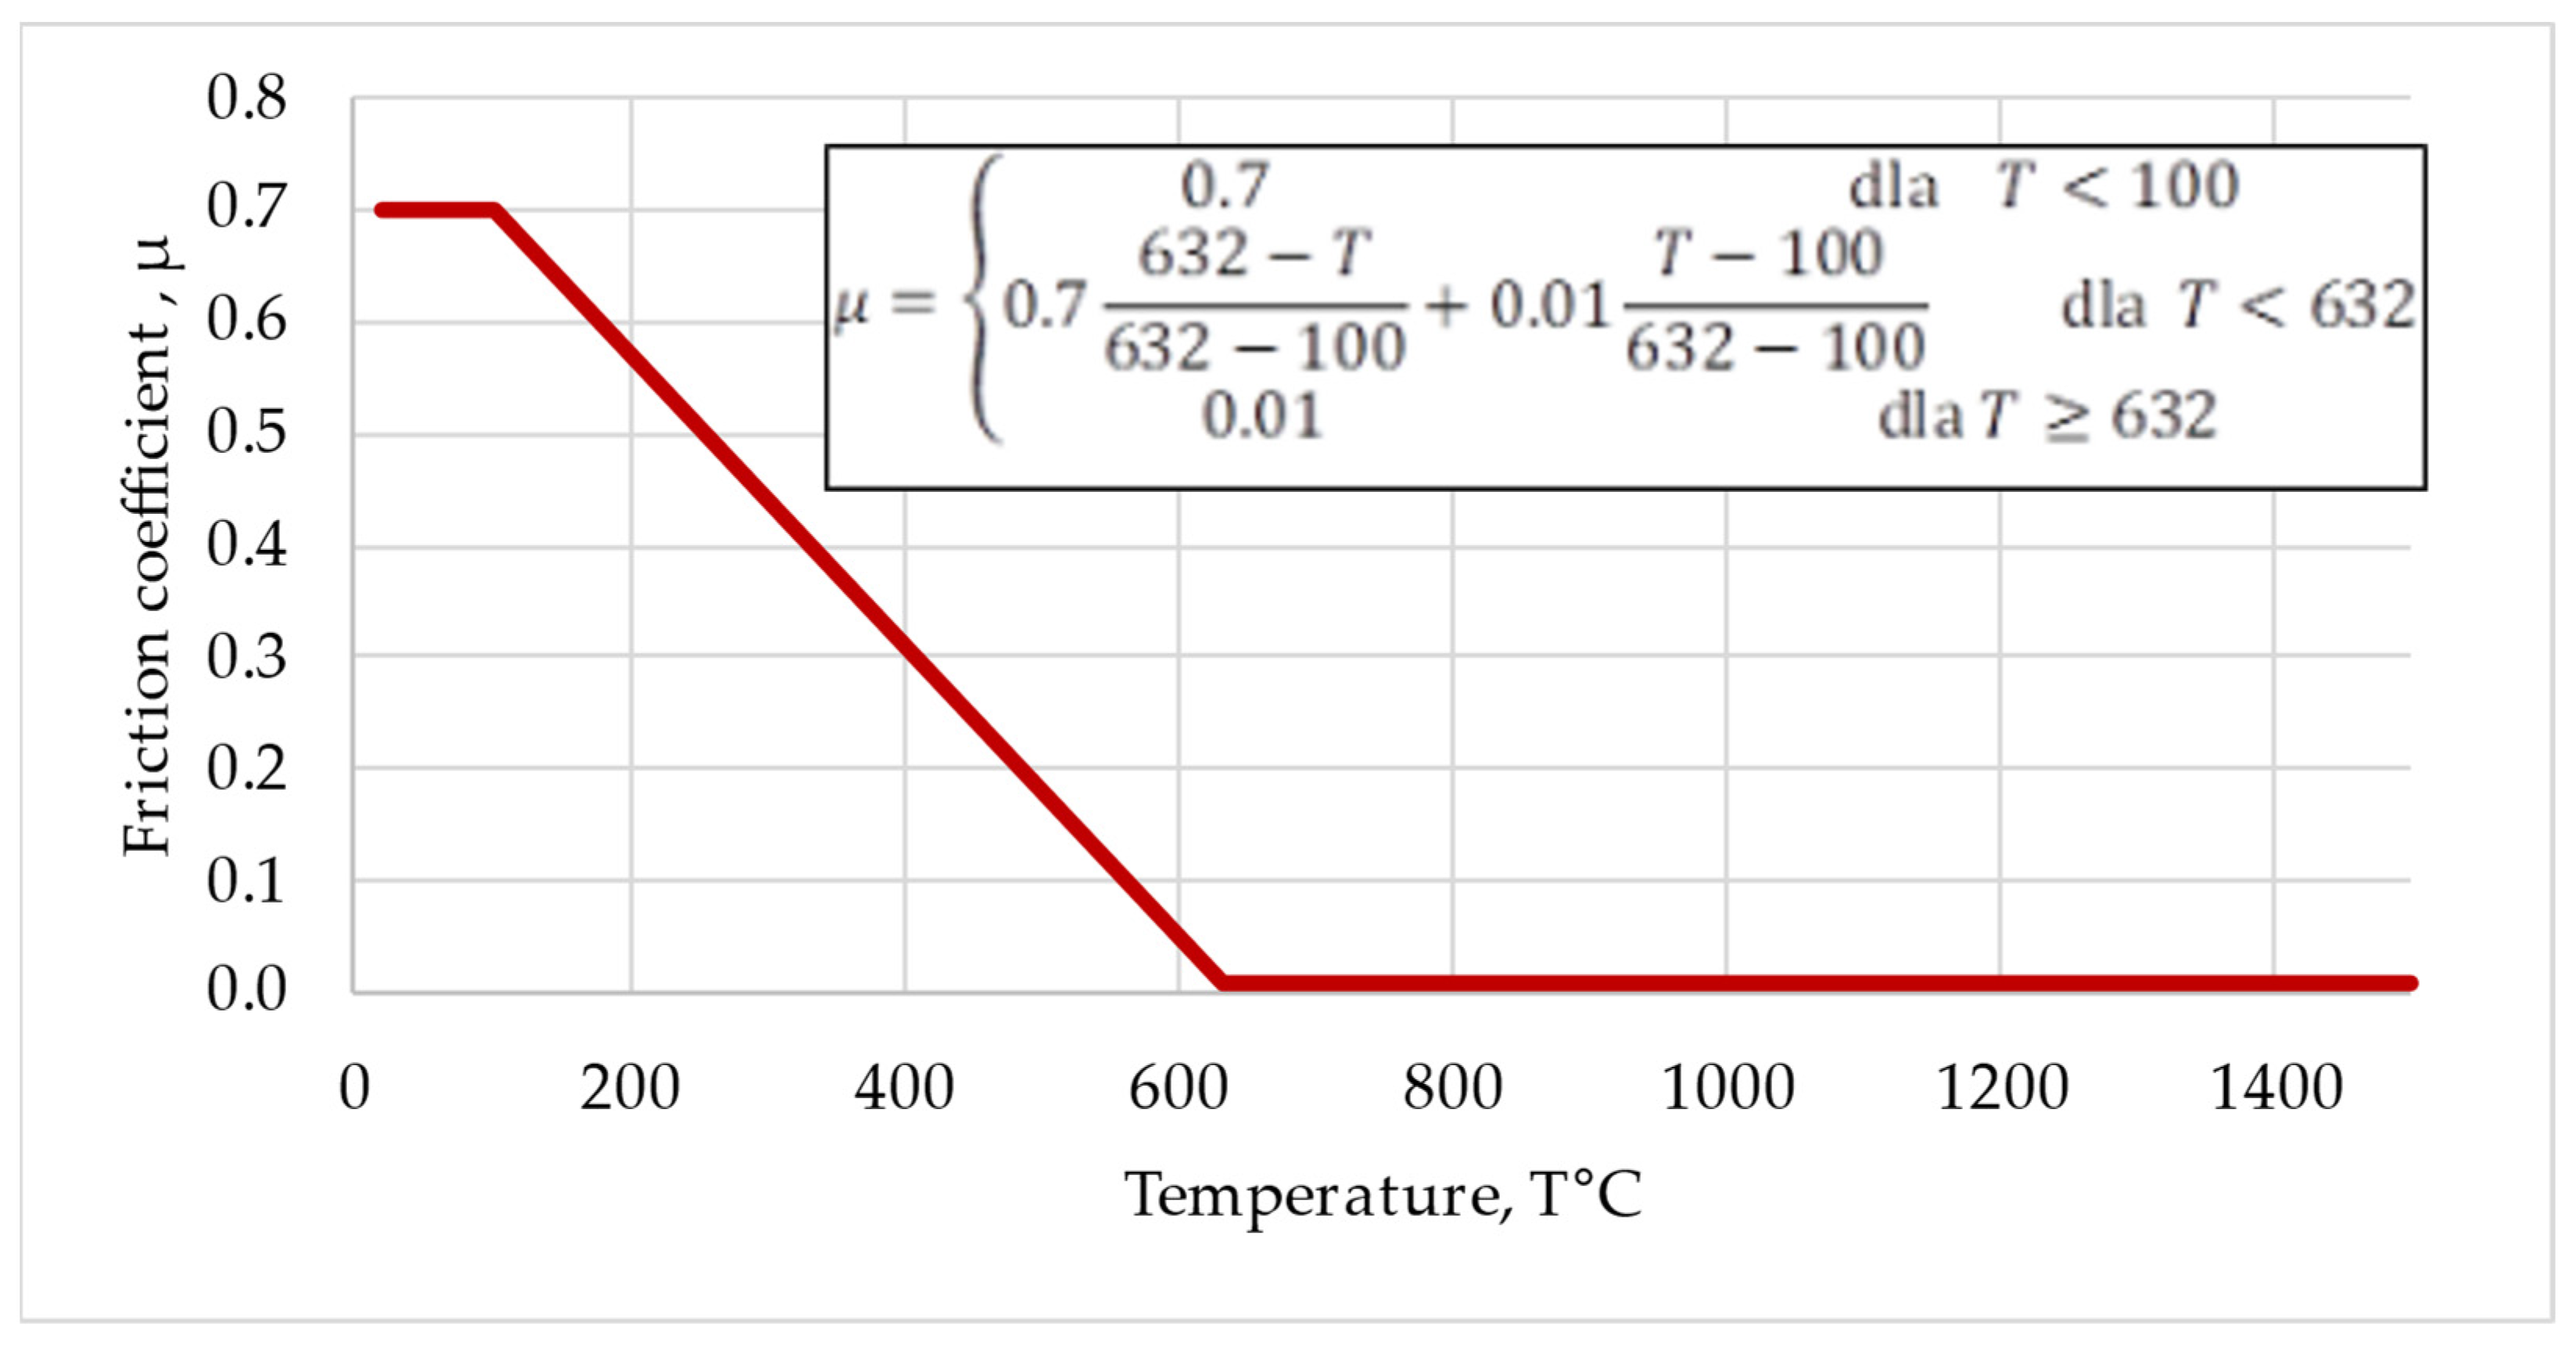
3.1. Friction Conditions
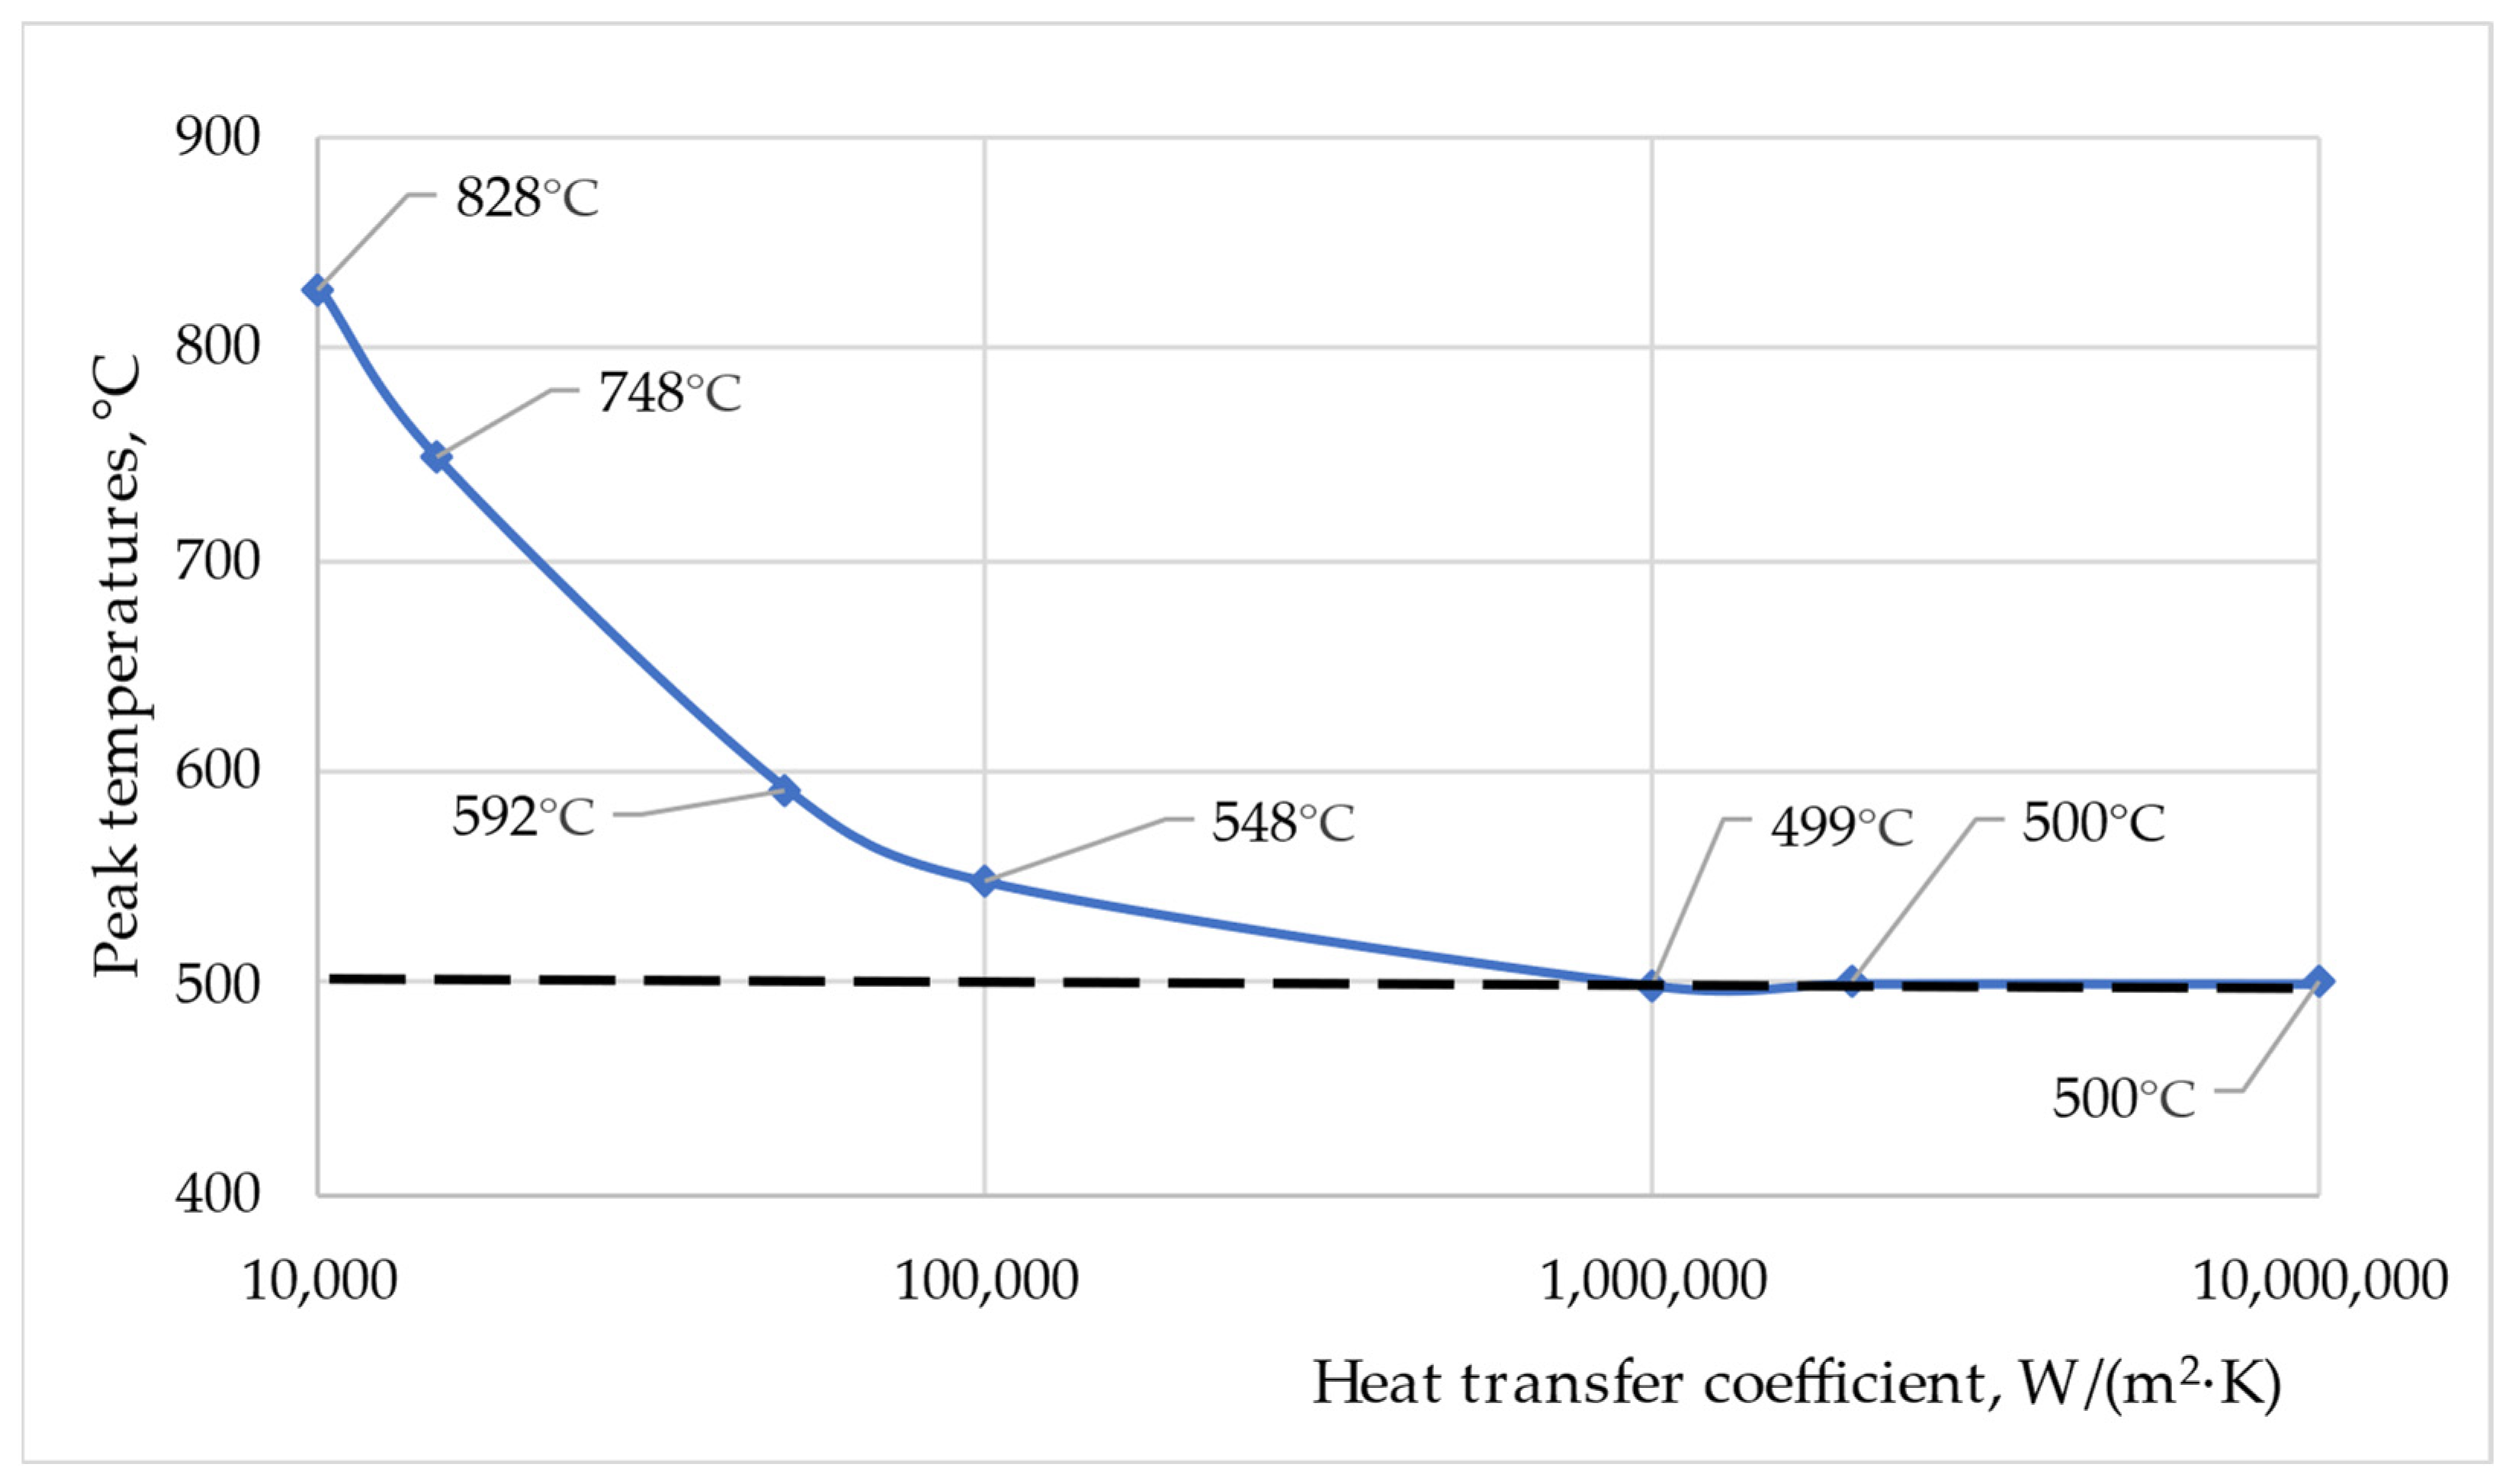
3.2. Thermal Conditions
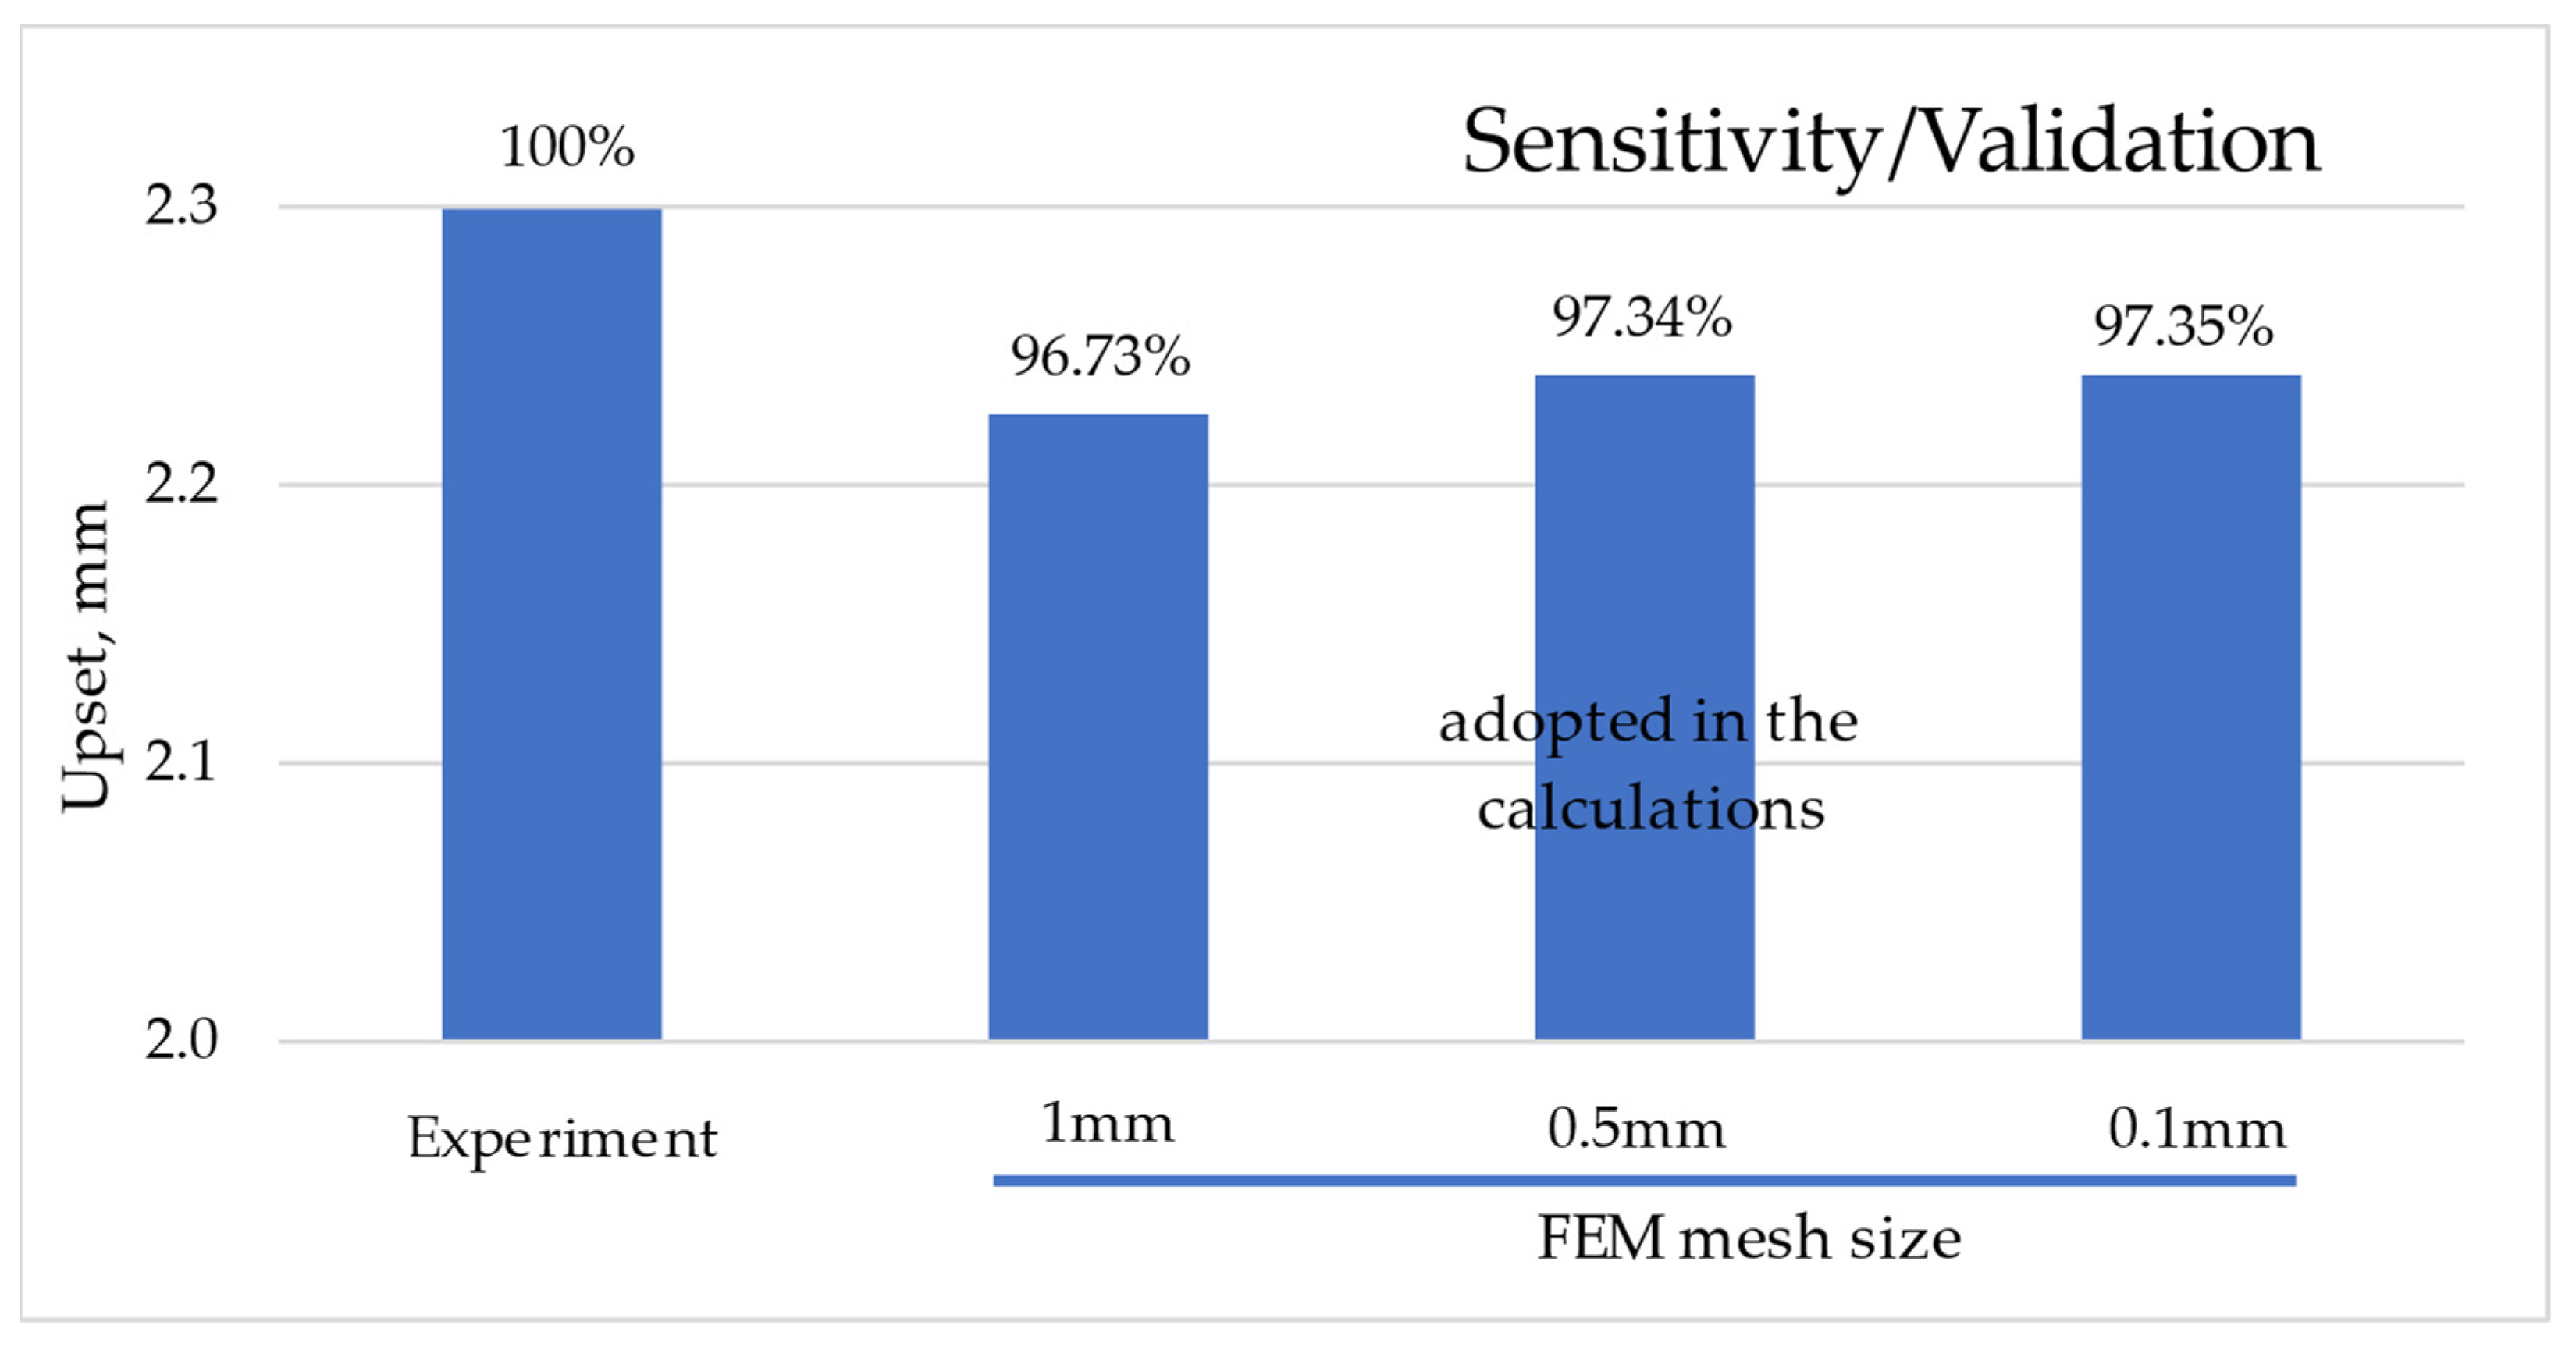
3.3. Validation Issue
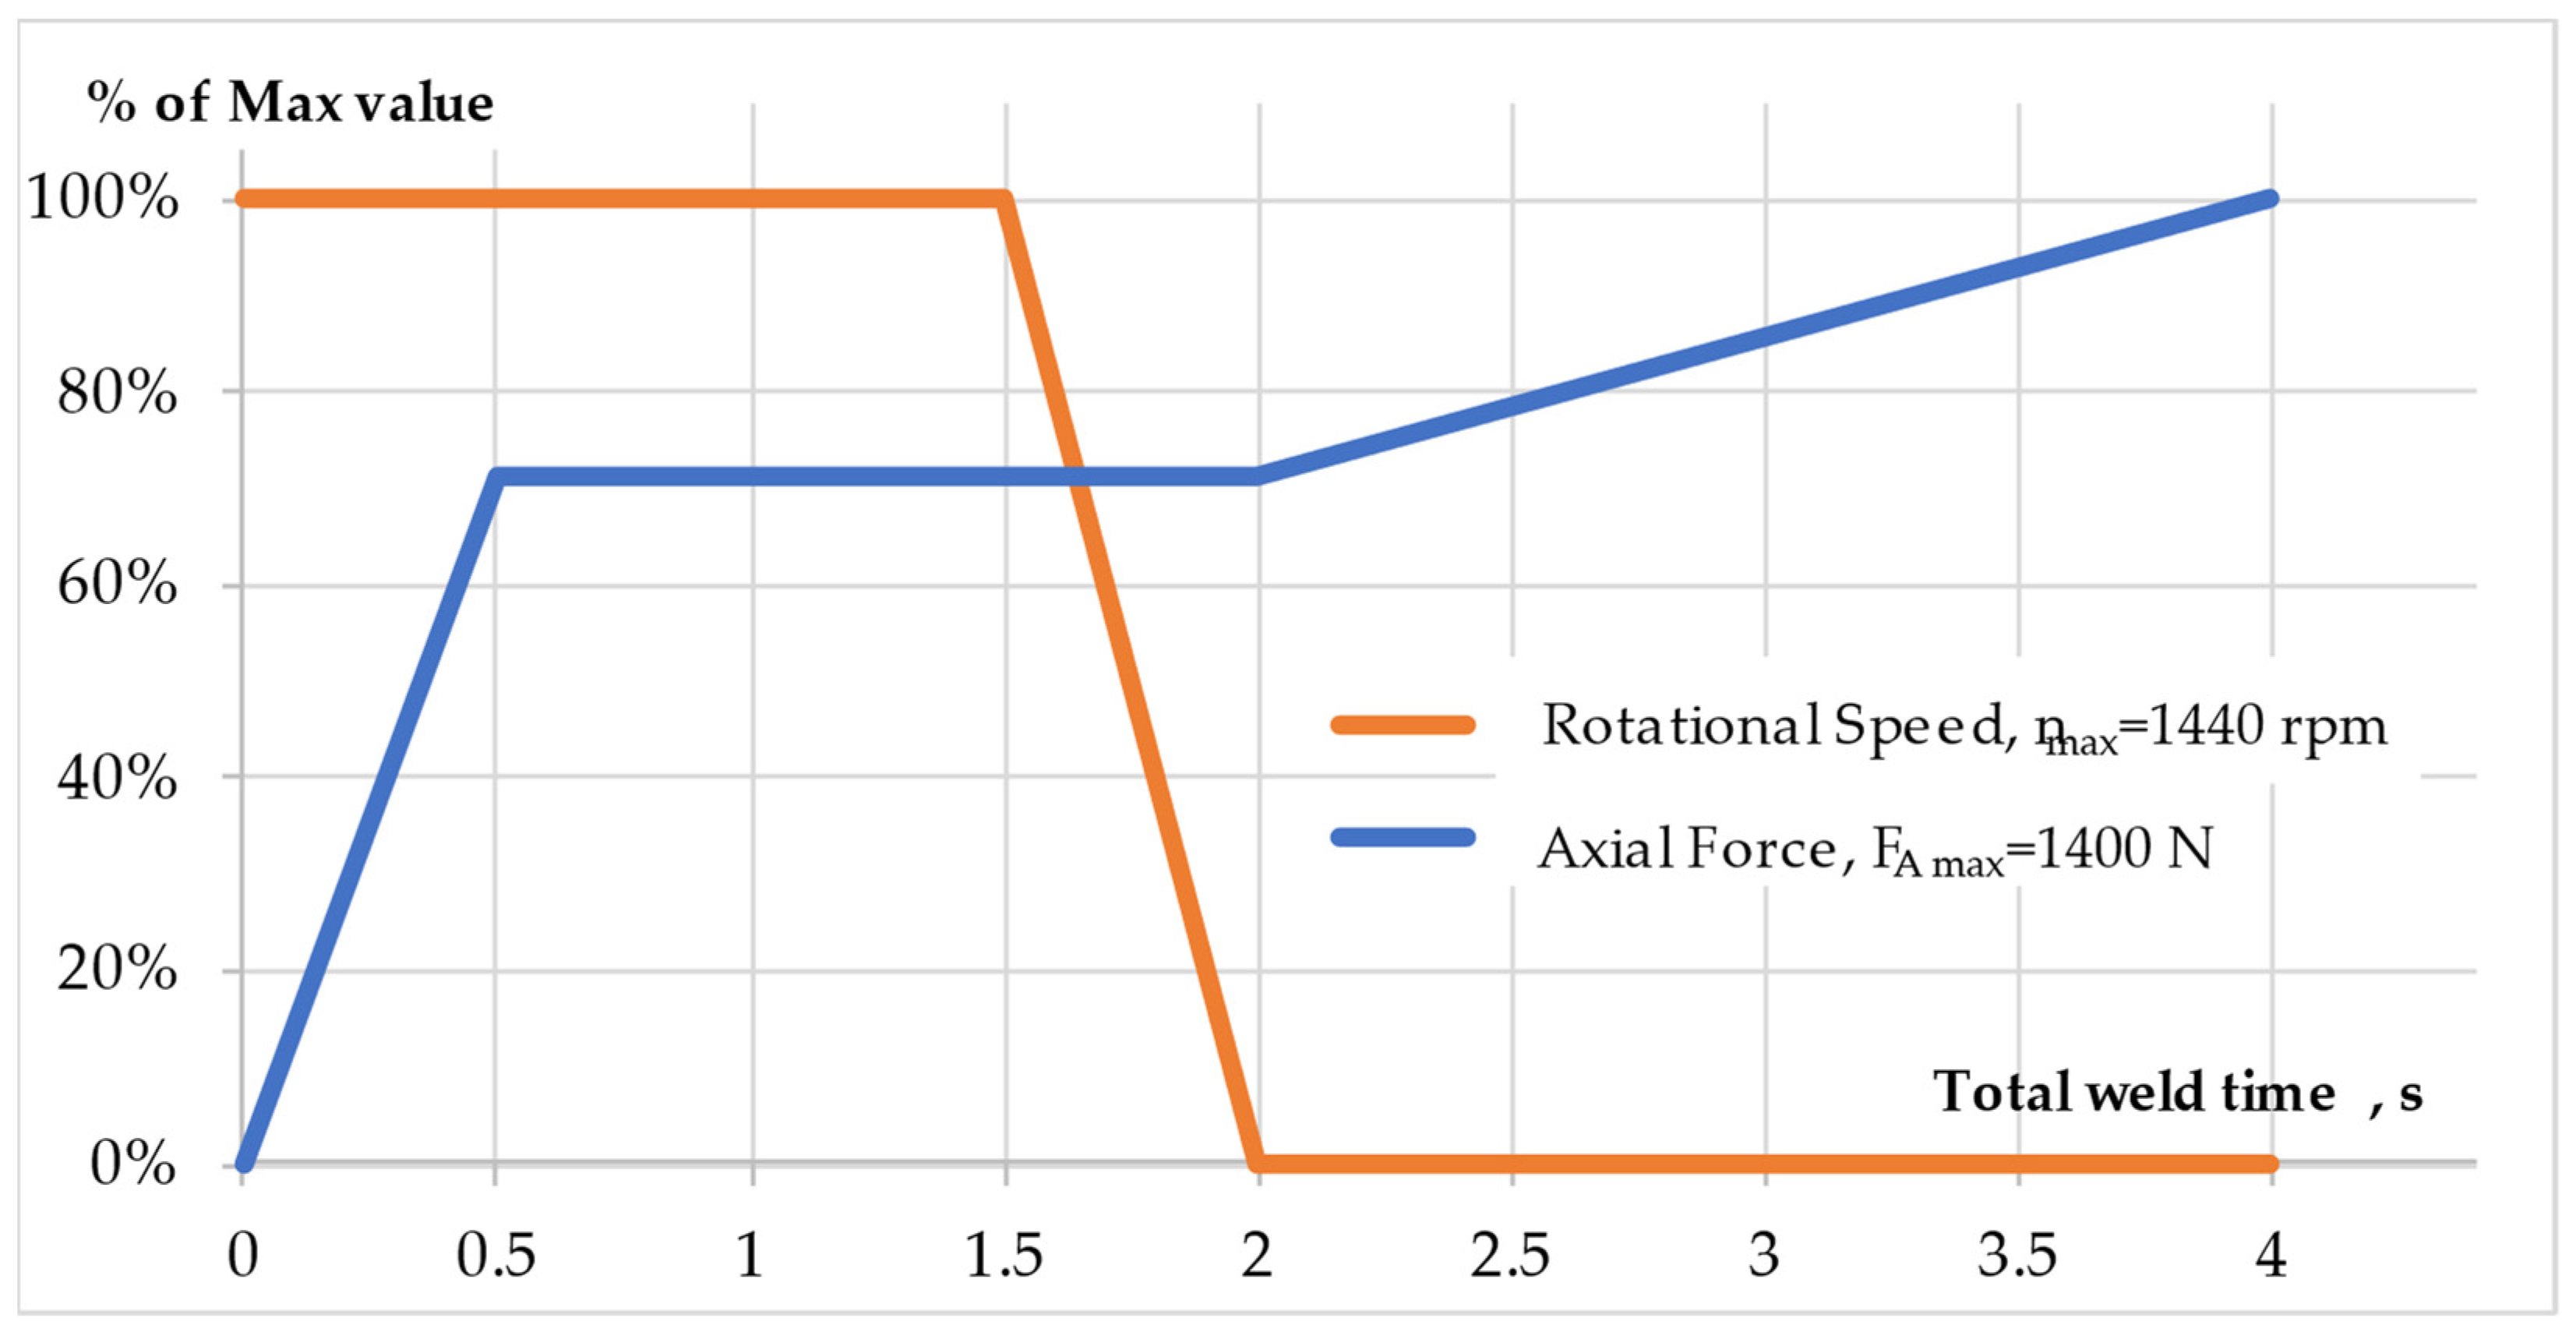
3.4. Welding Parameters
3.4.1. Friction Phase
3.4.2. Forge Phase
4. Results
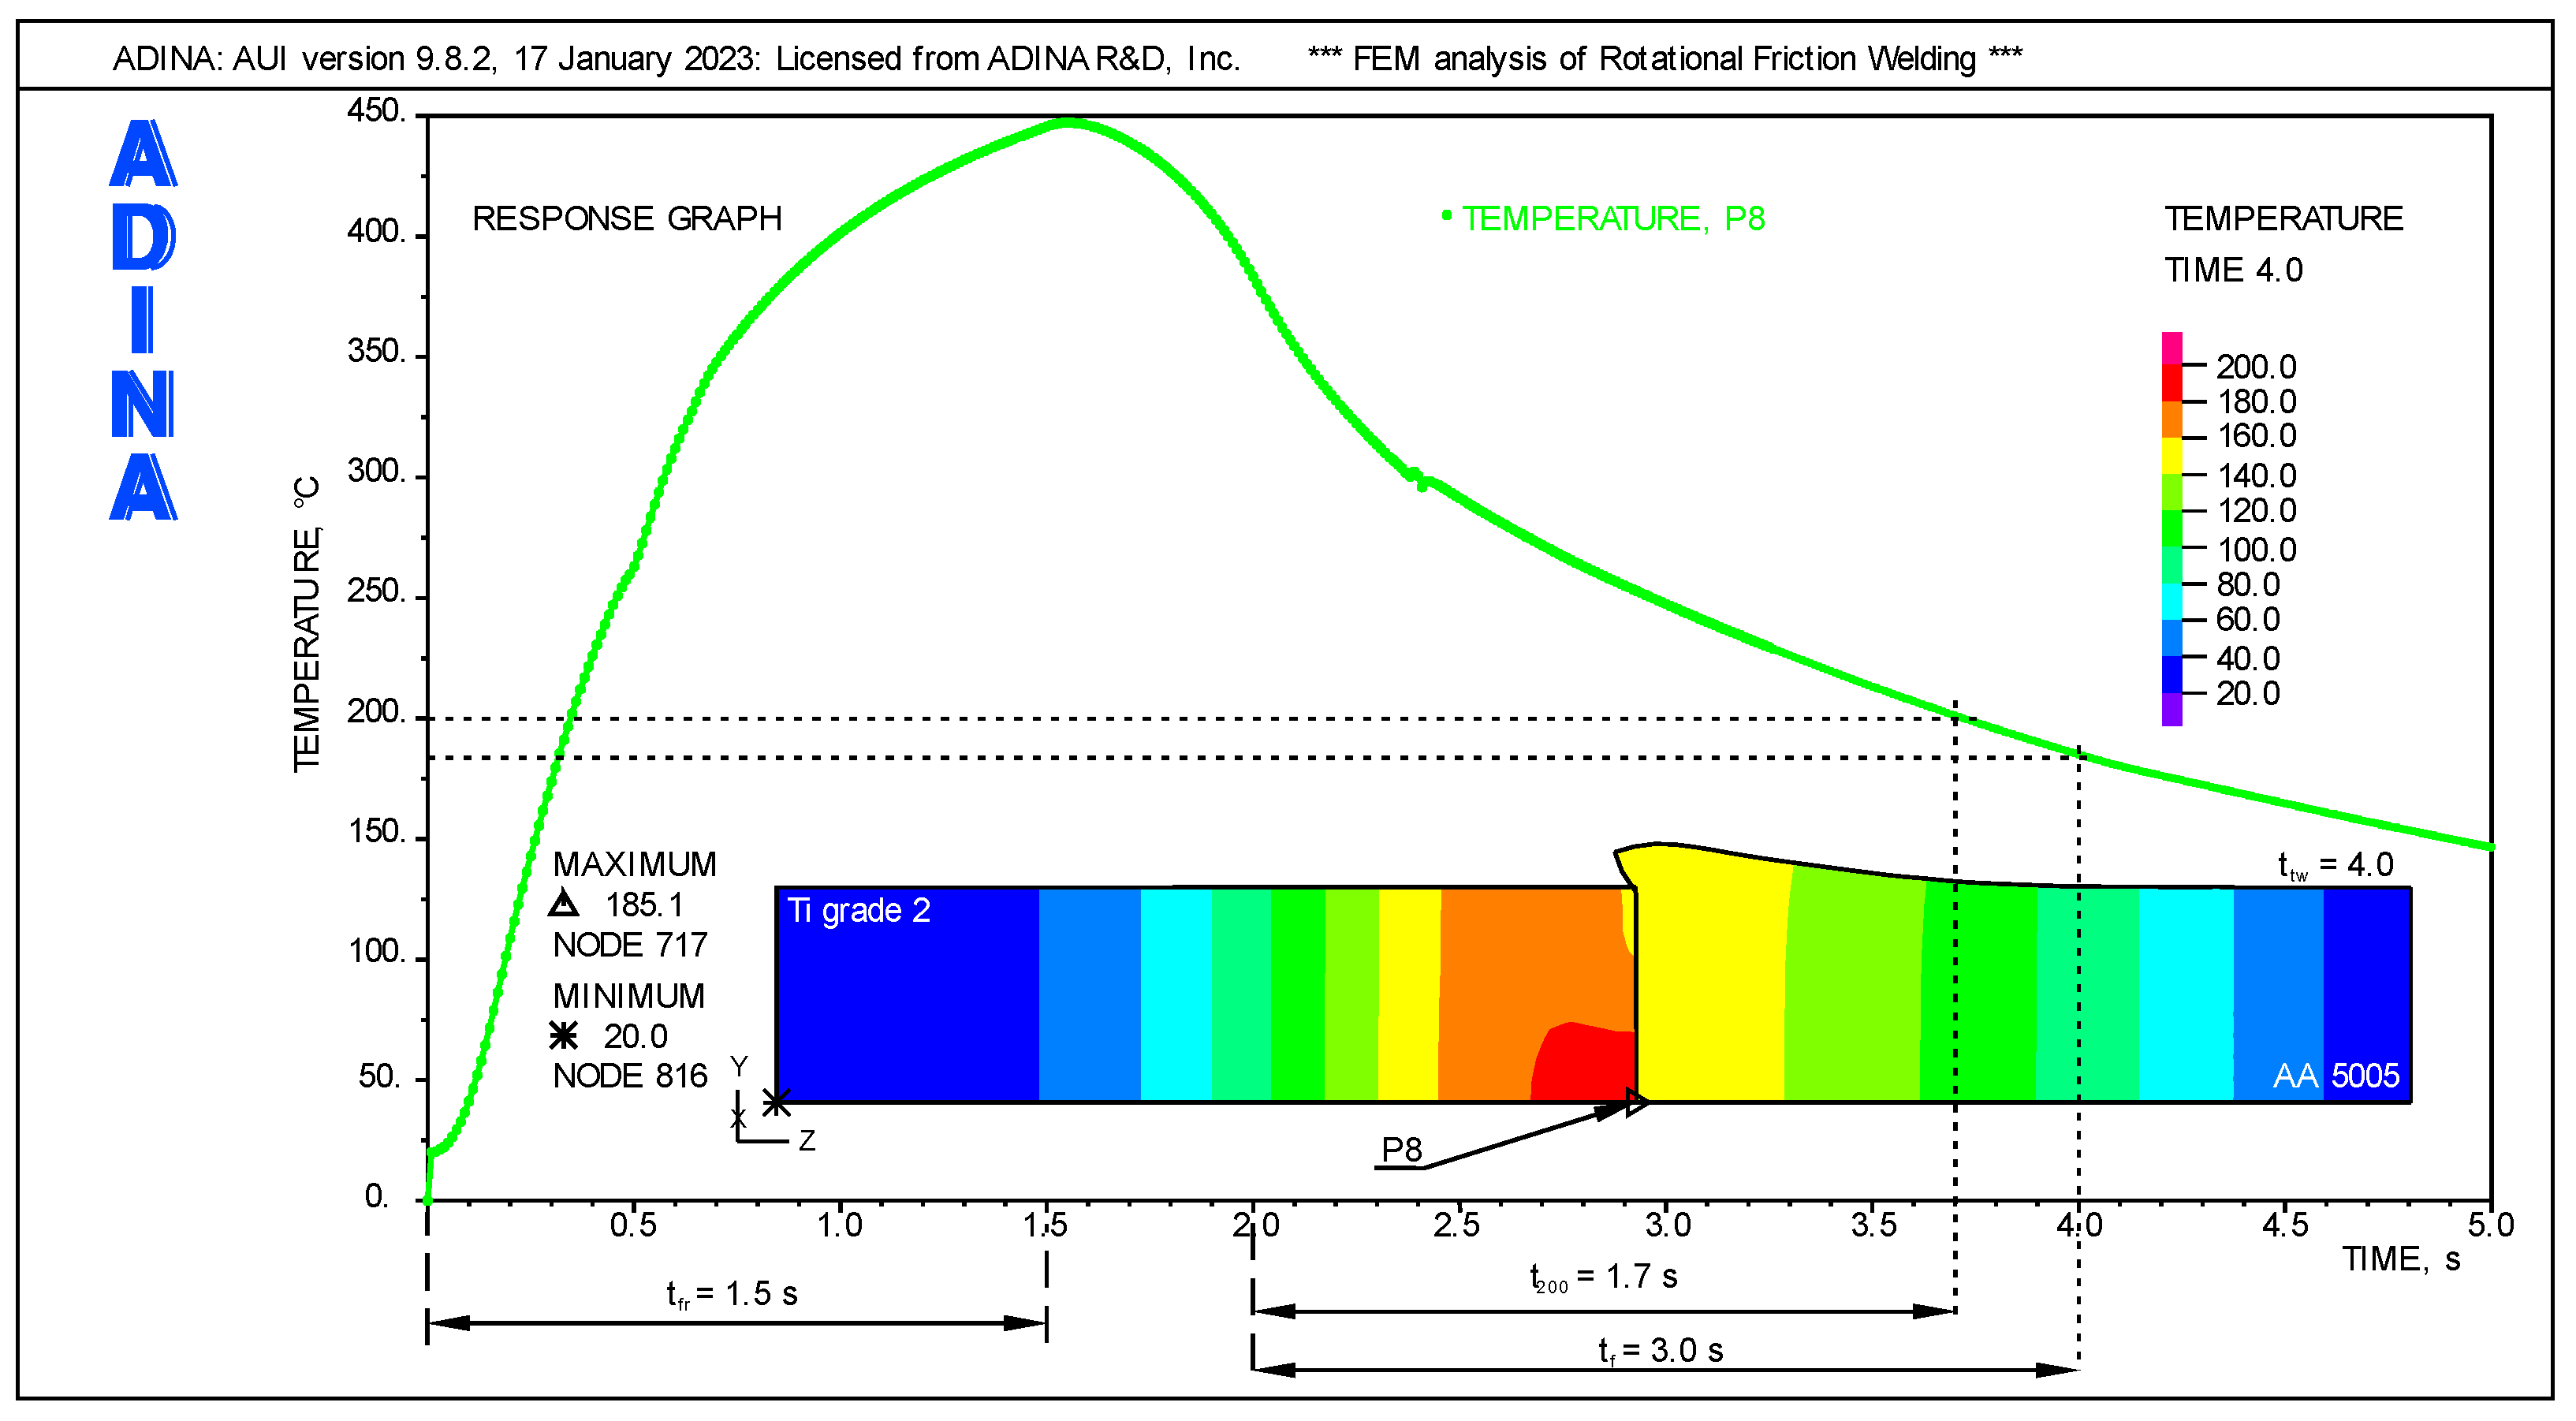
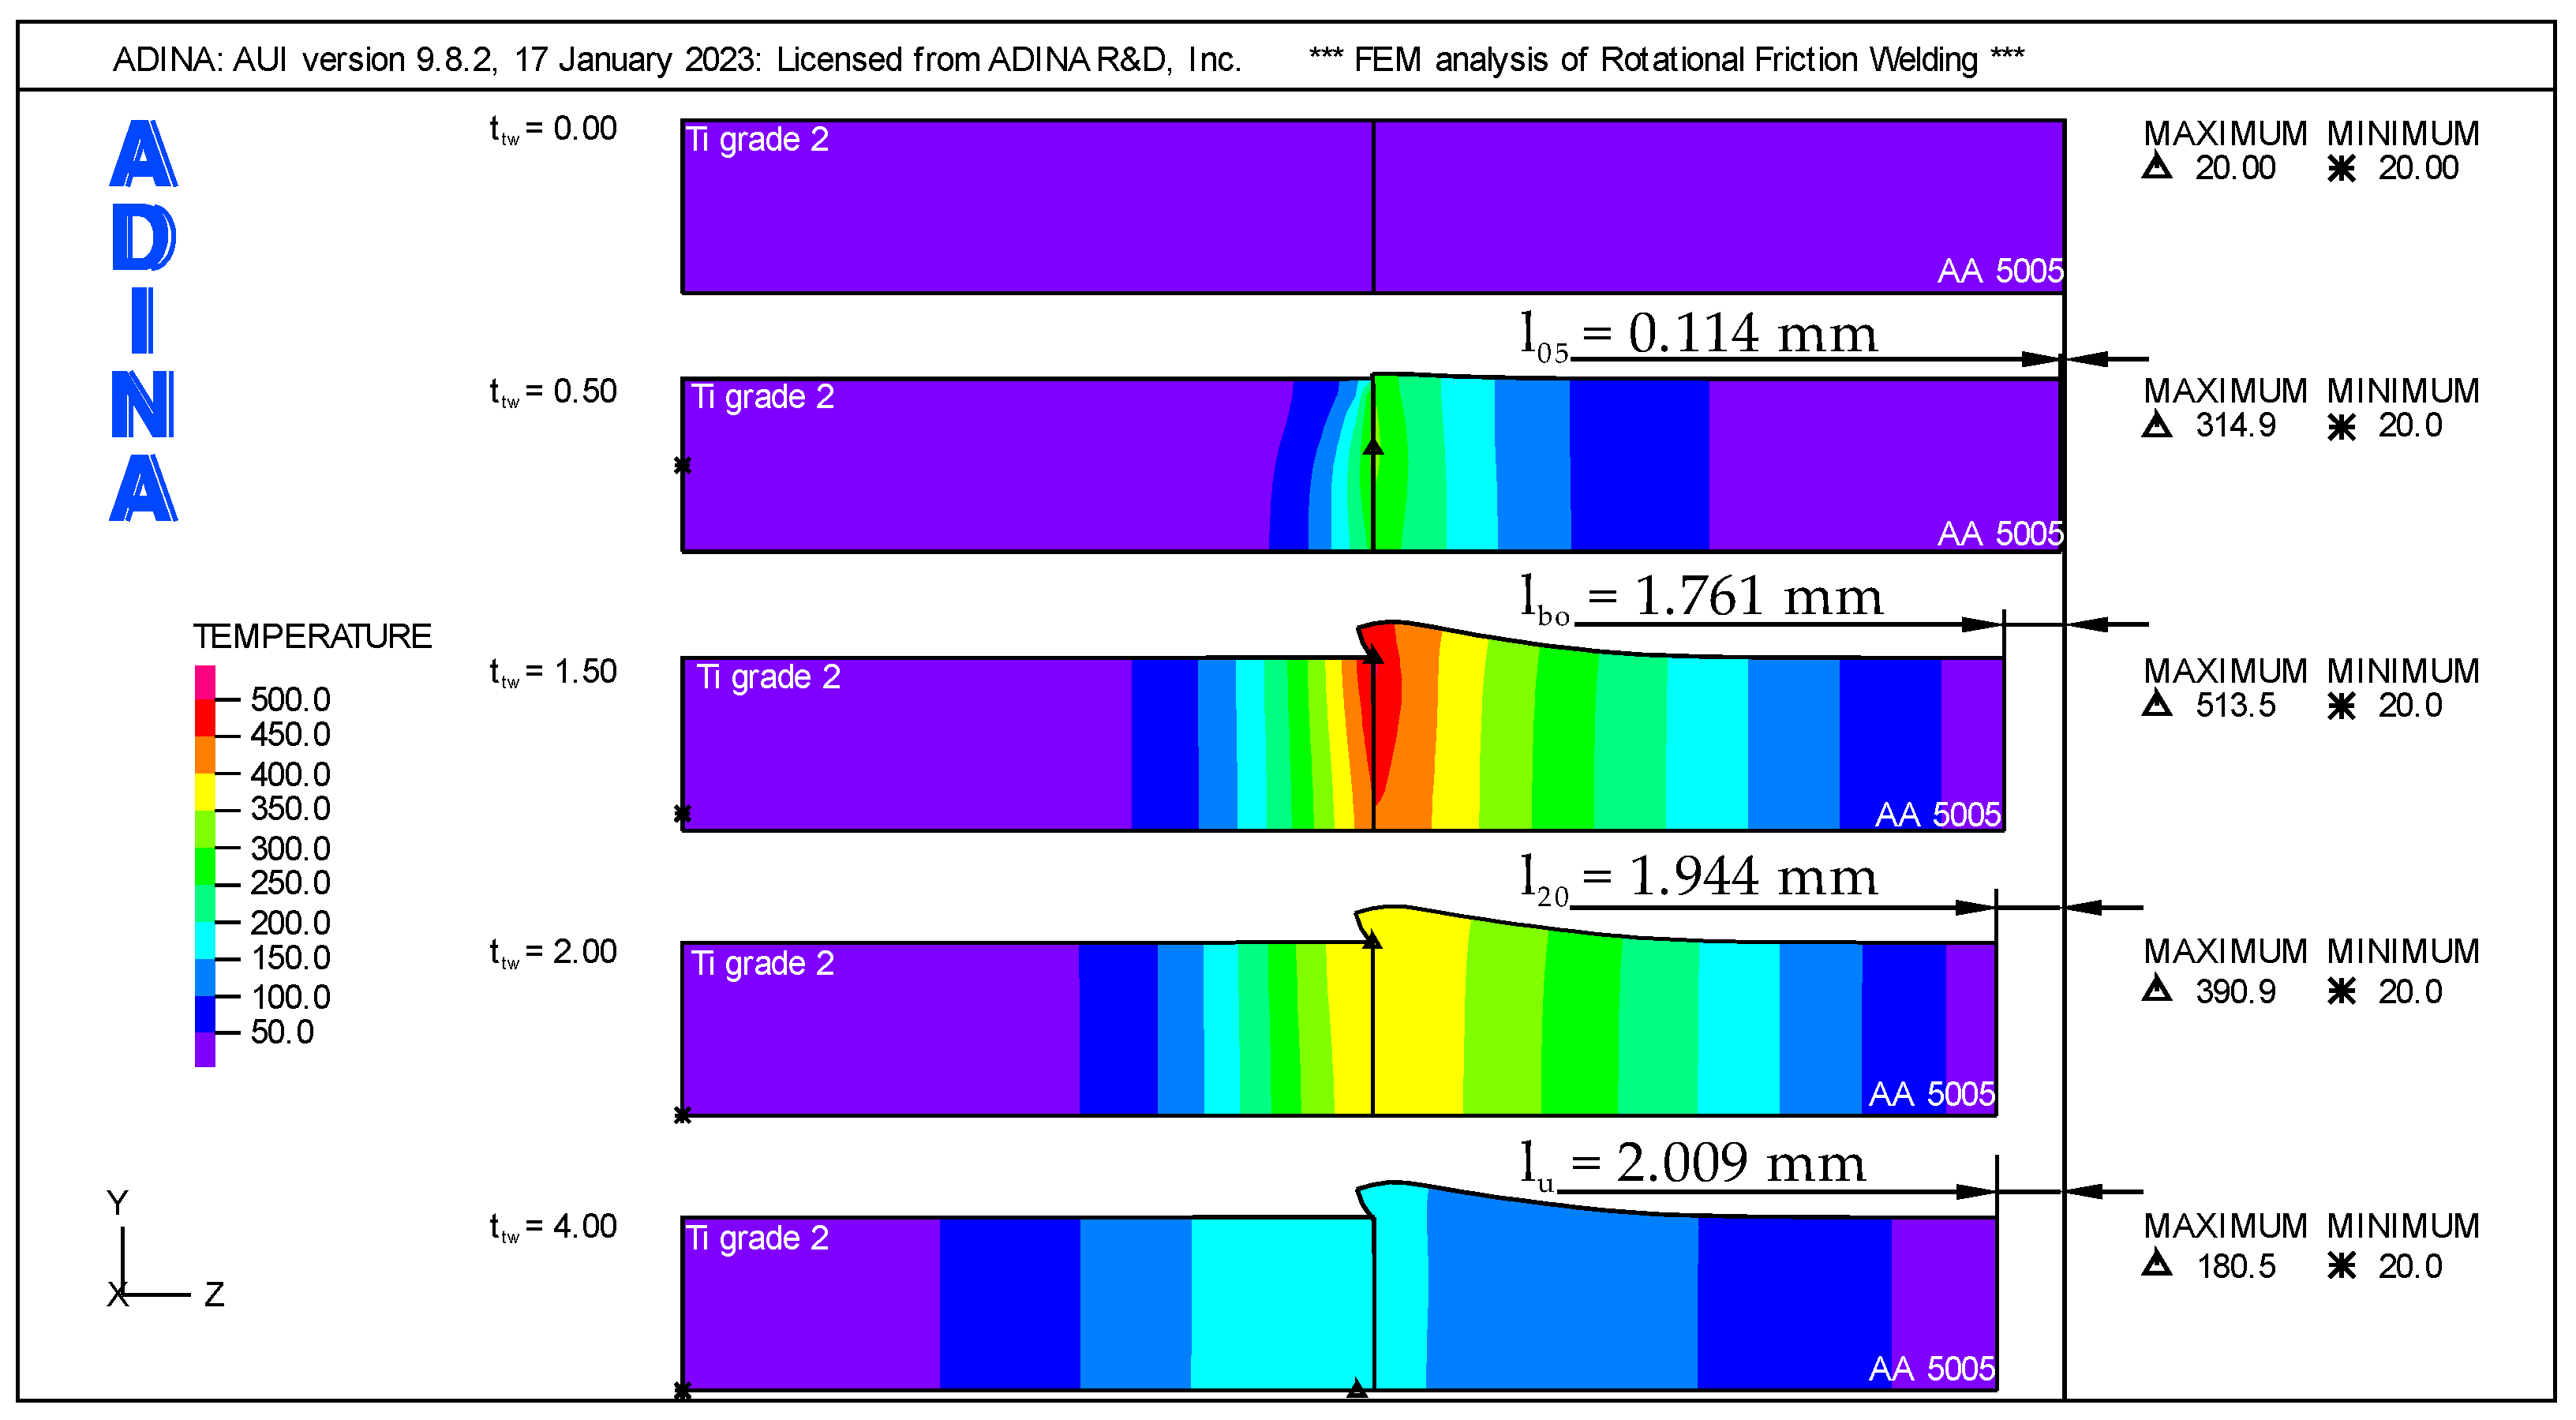
4.1. Temperature Changes in the Weldment
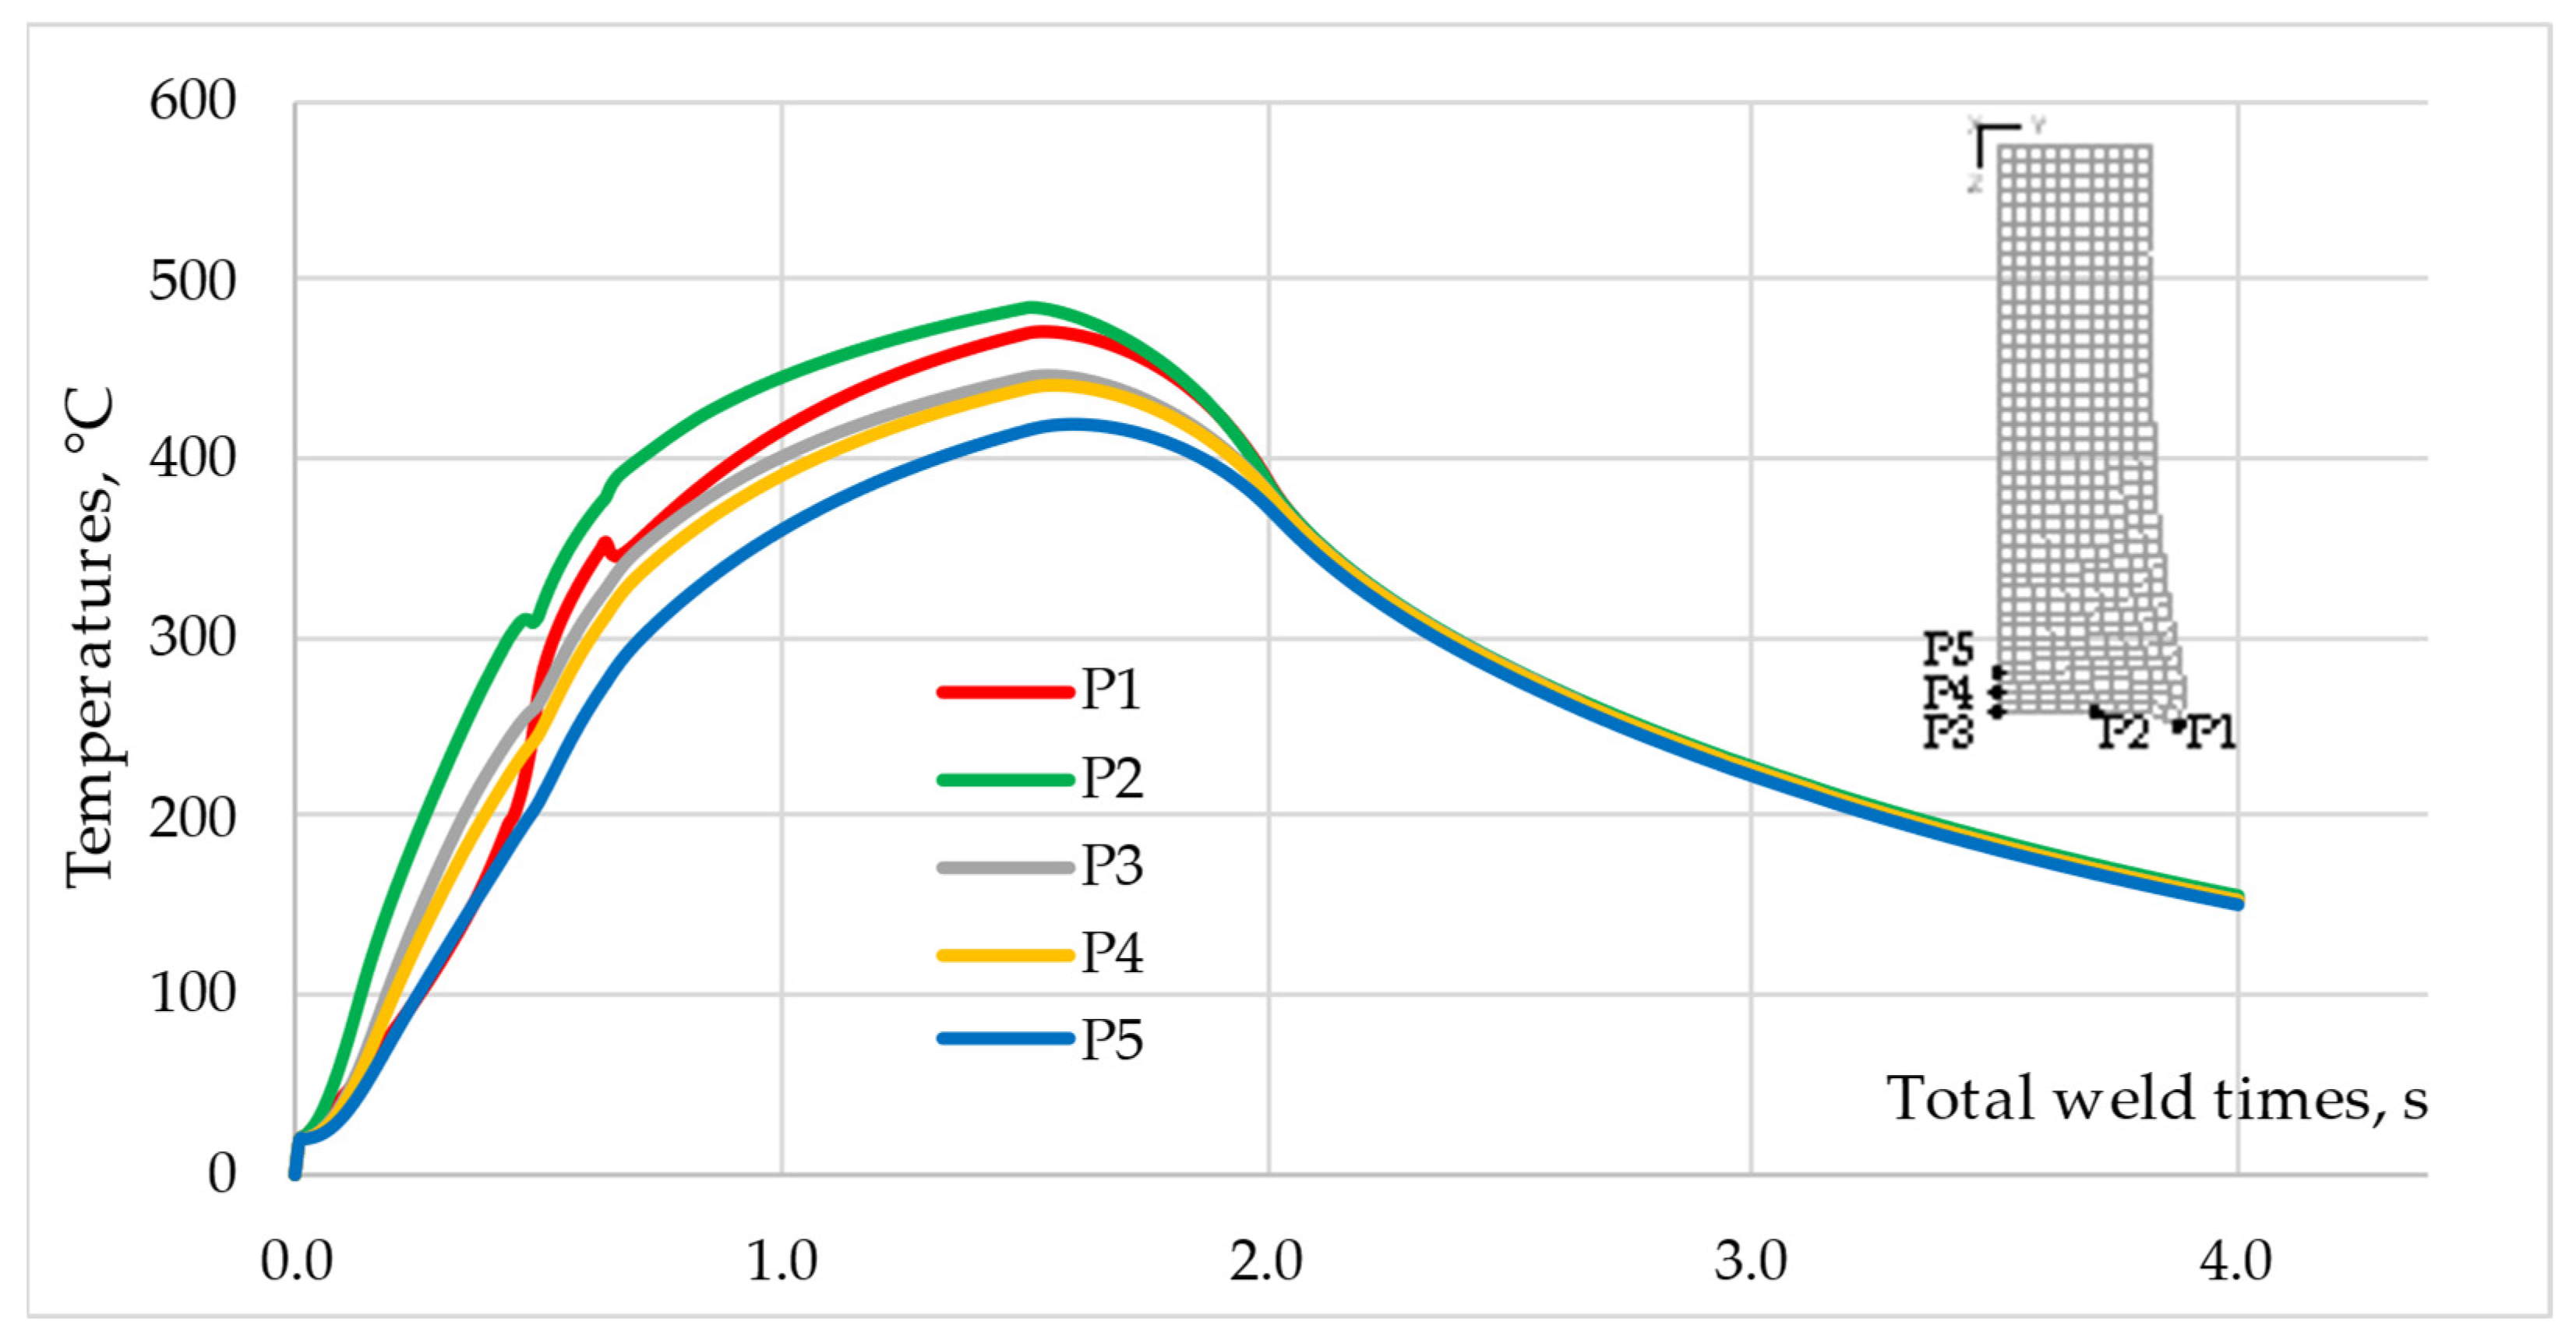
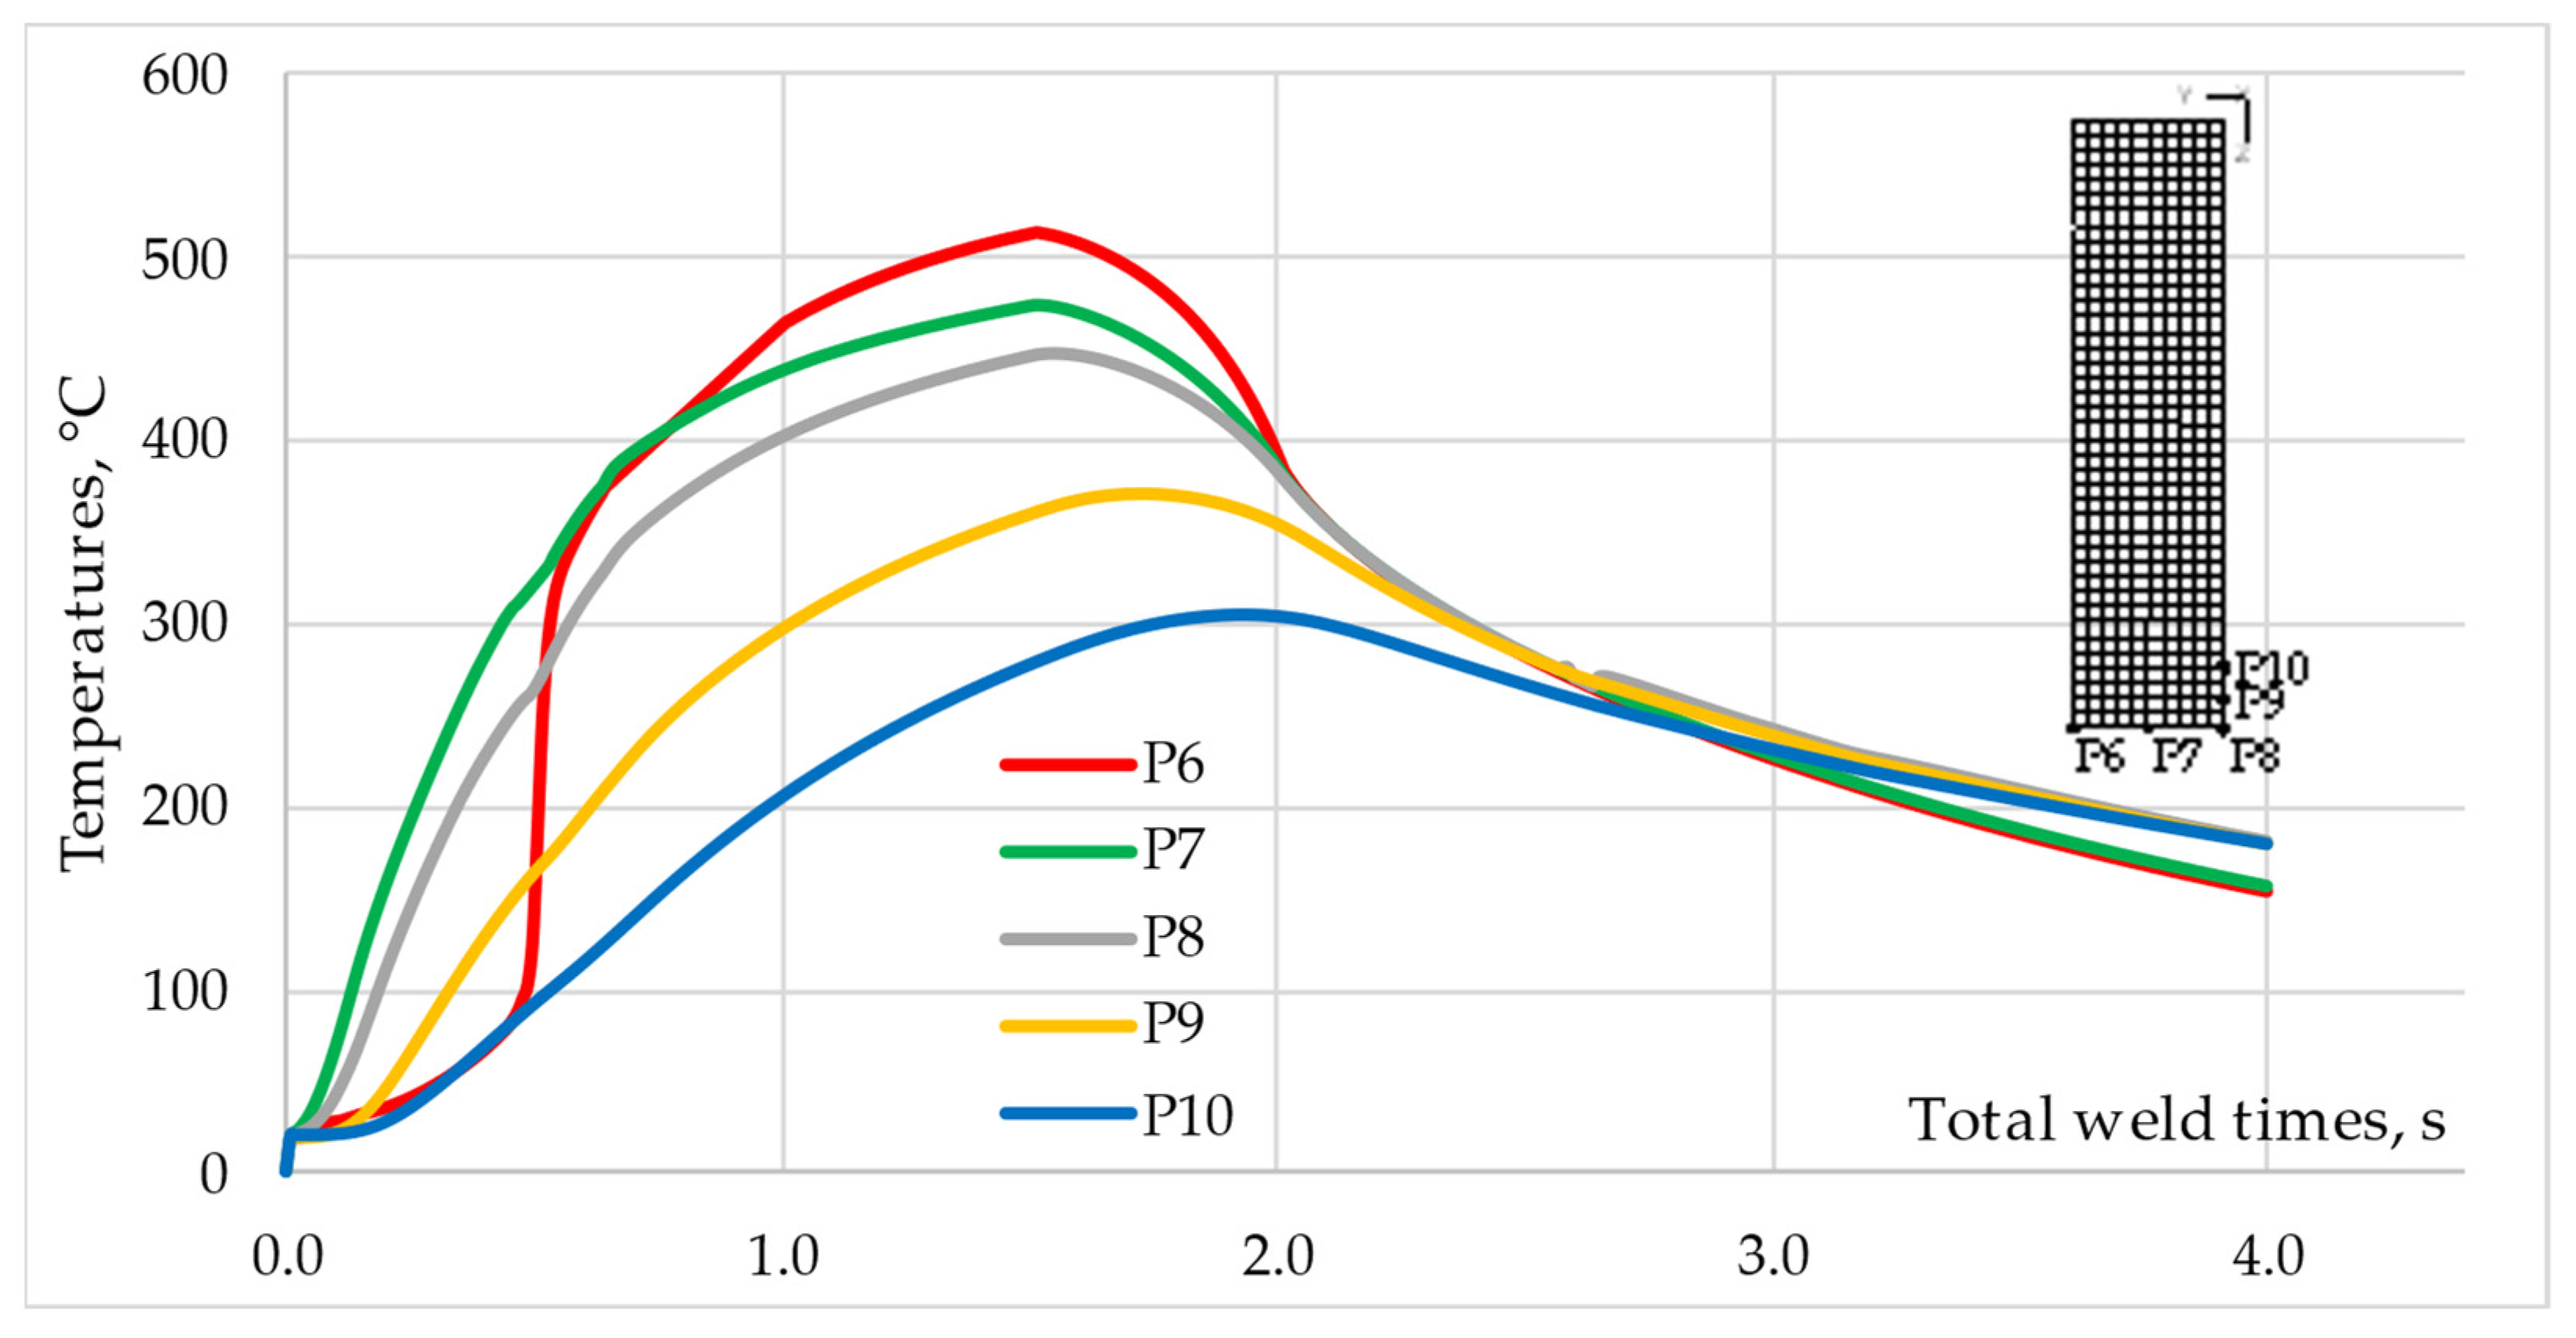
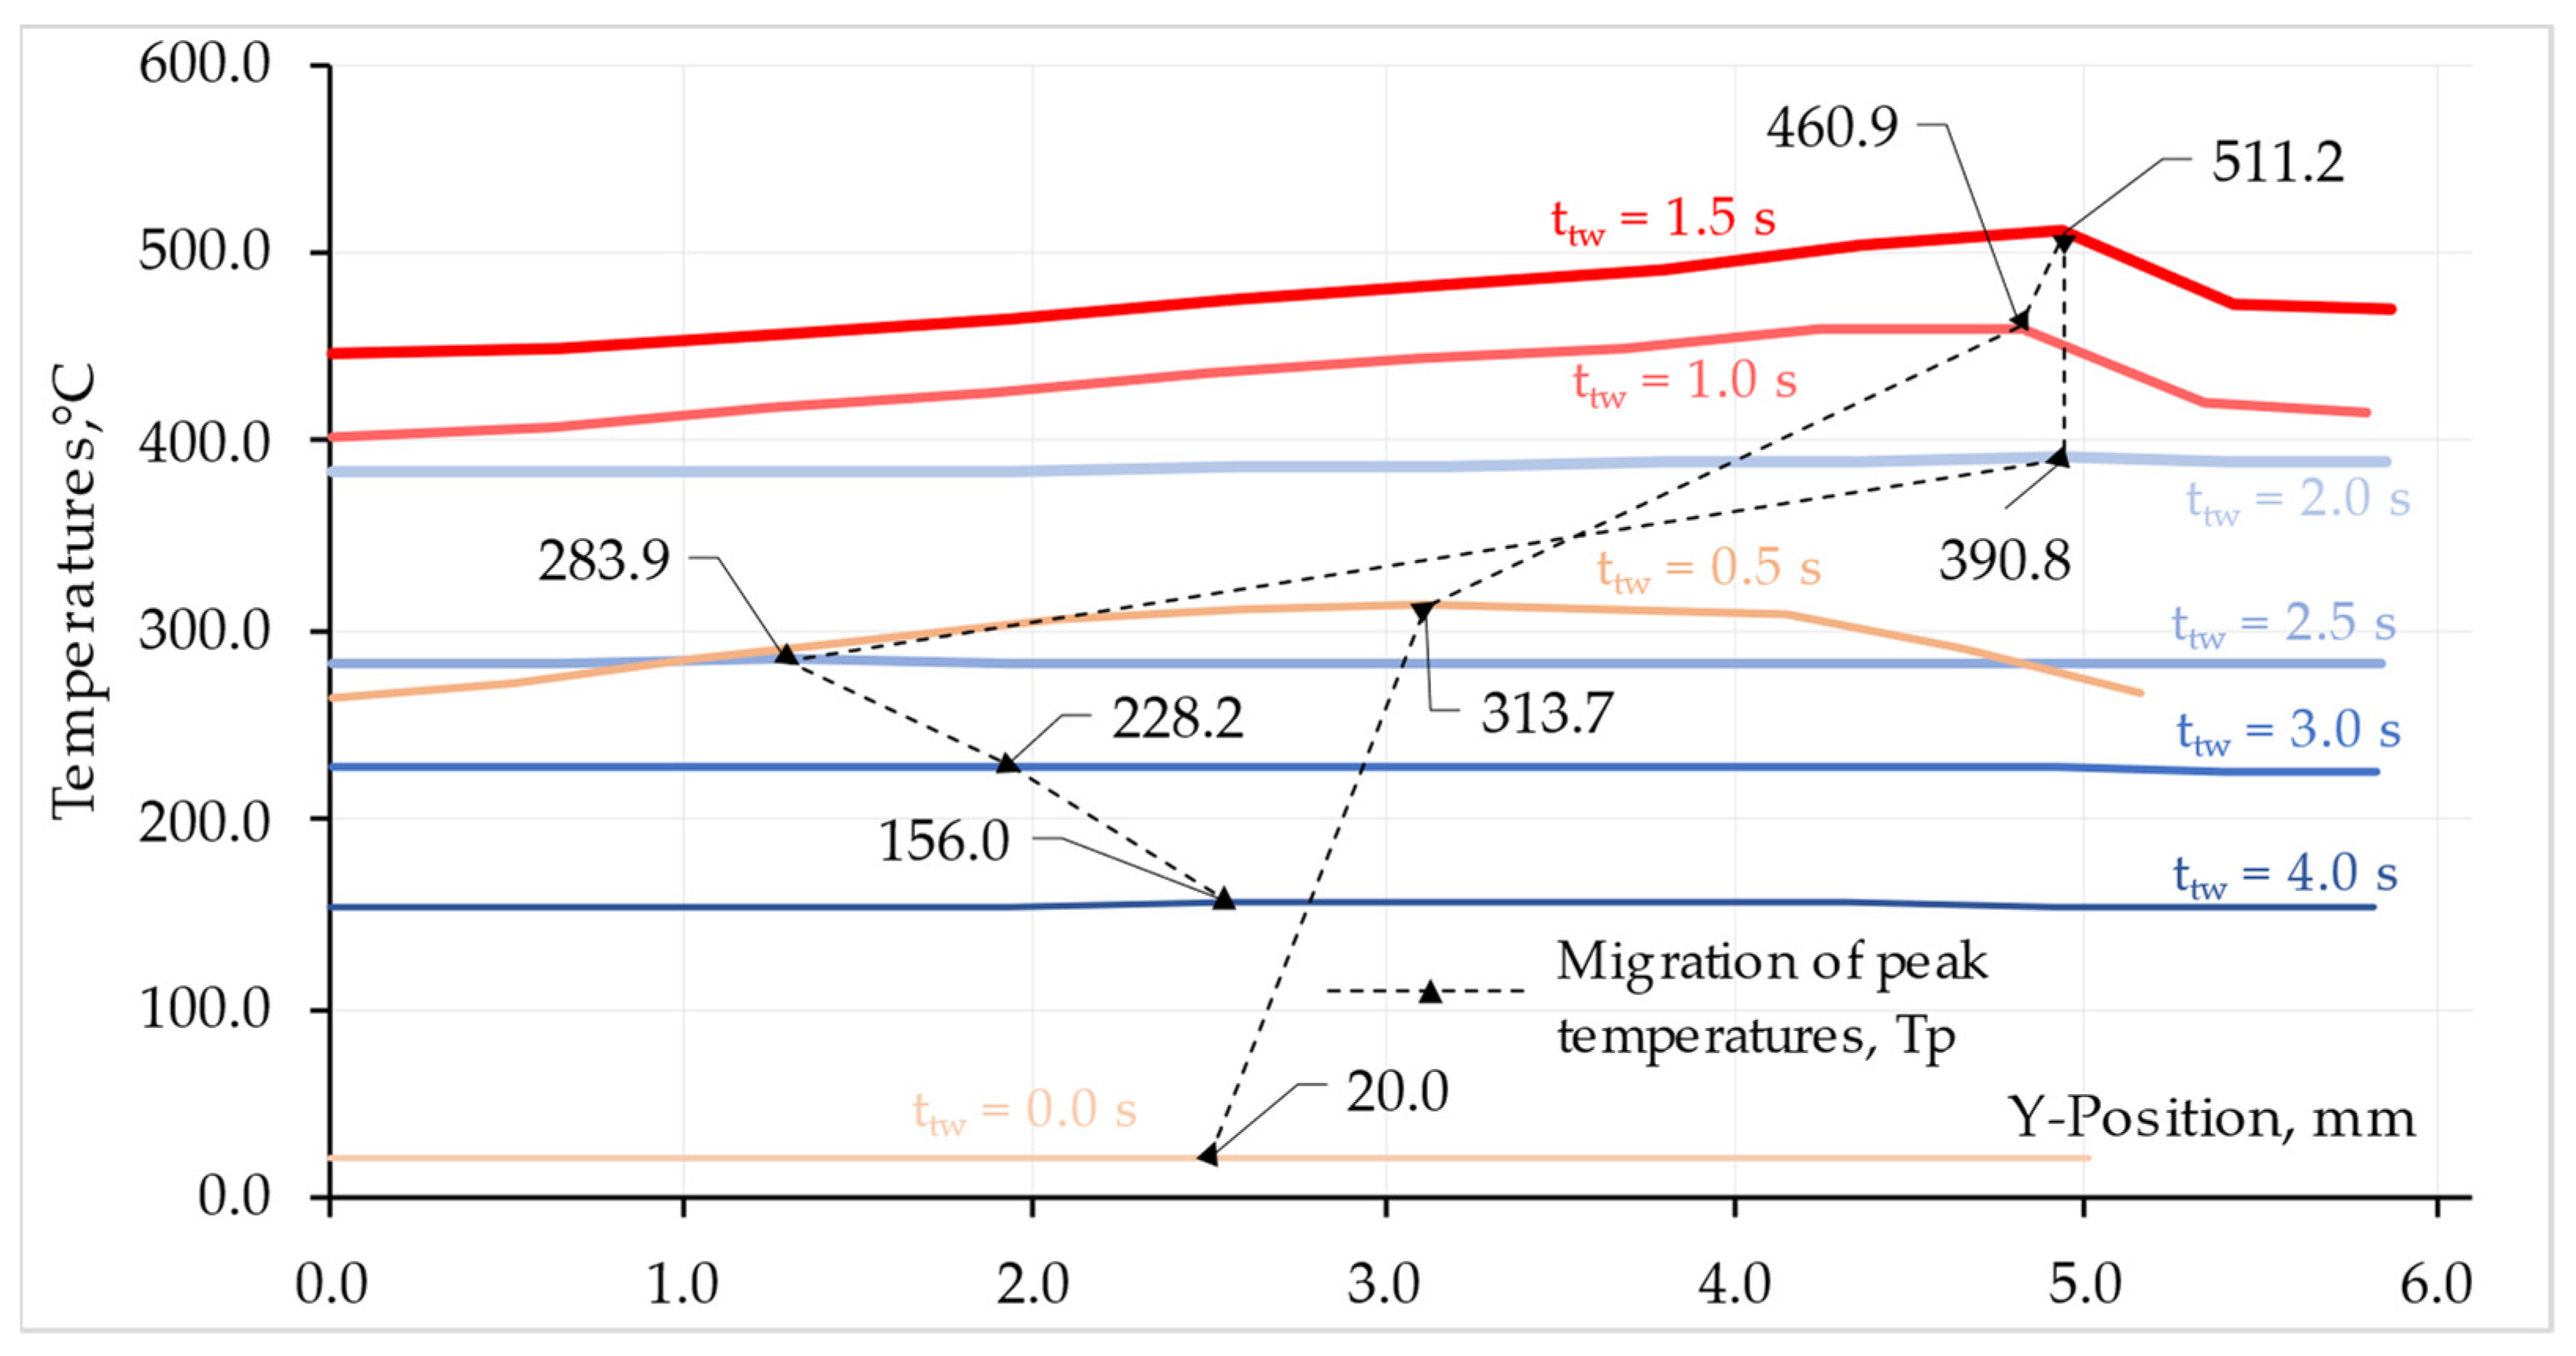
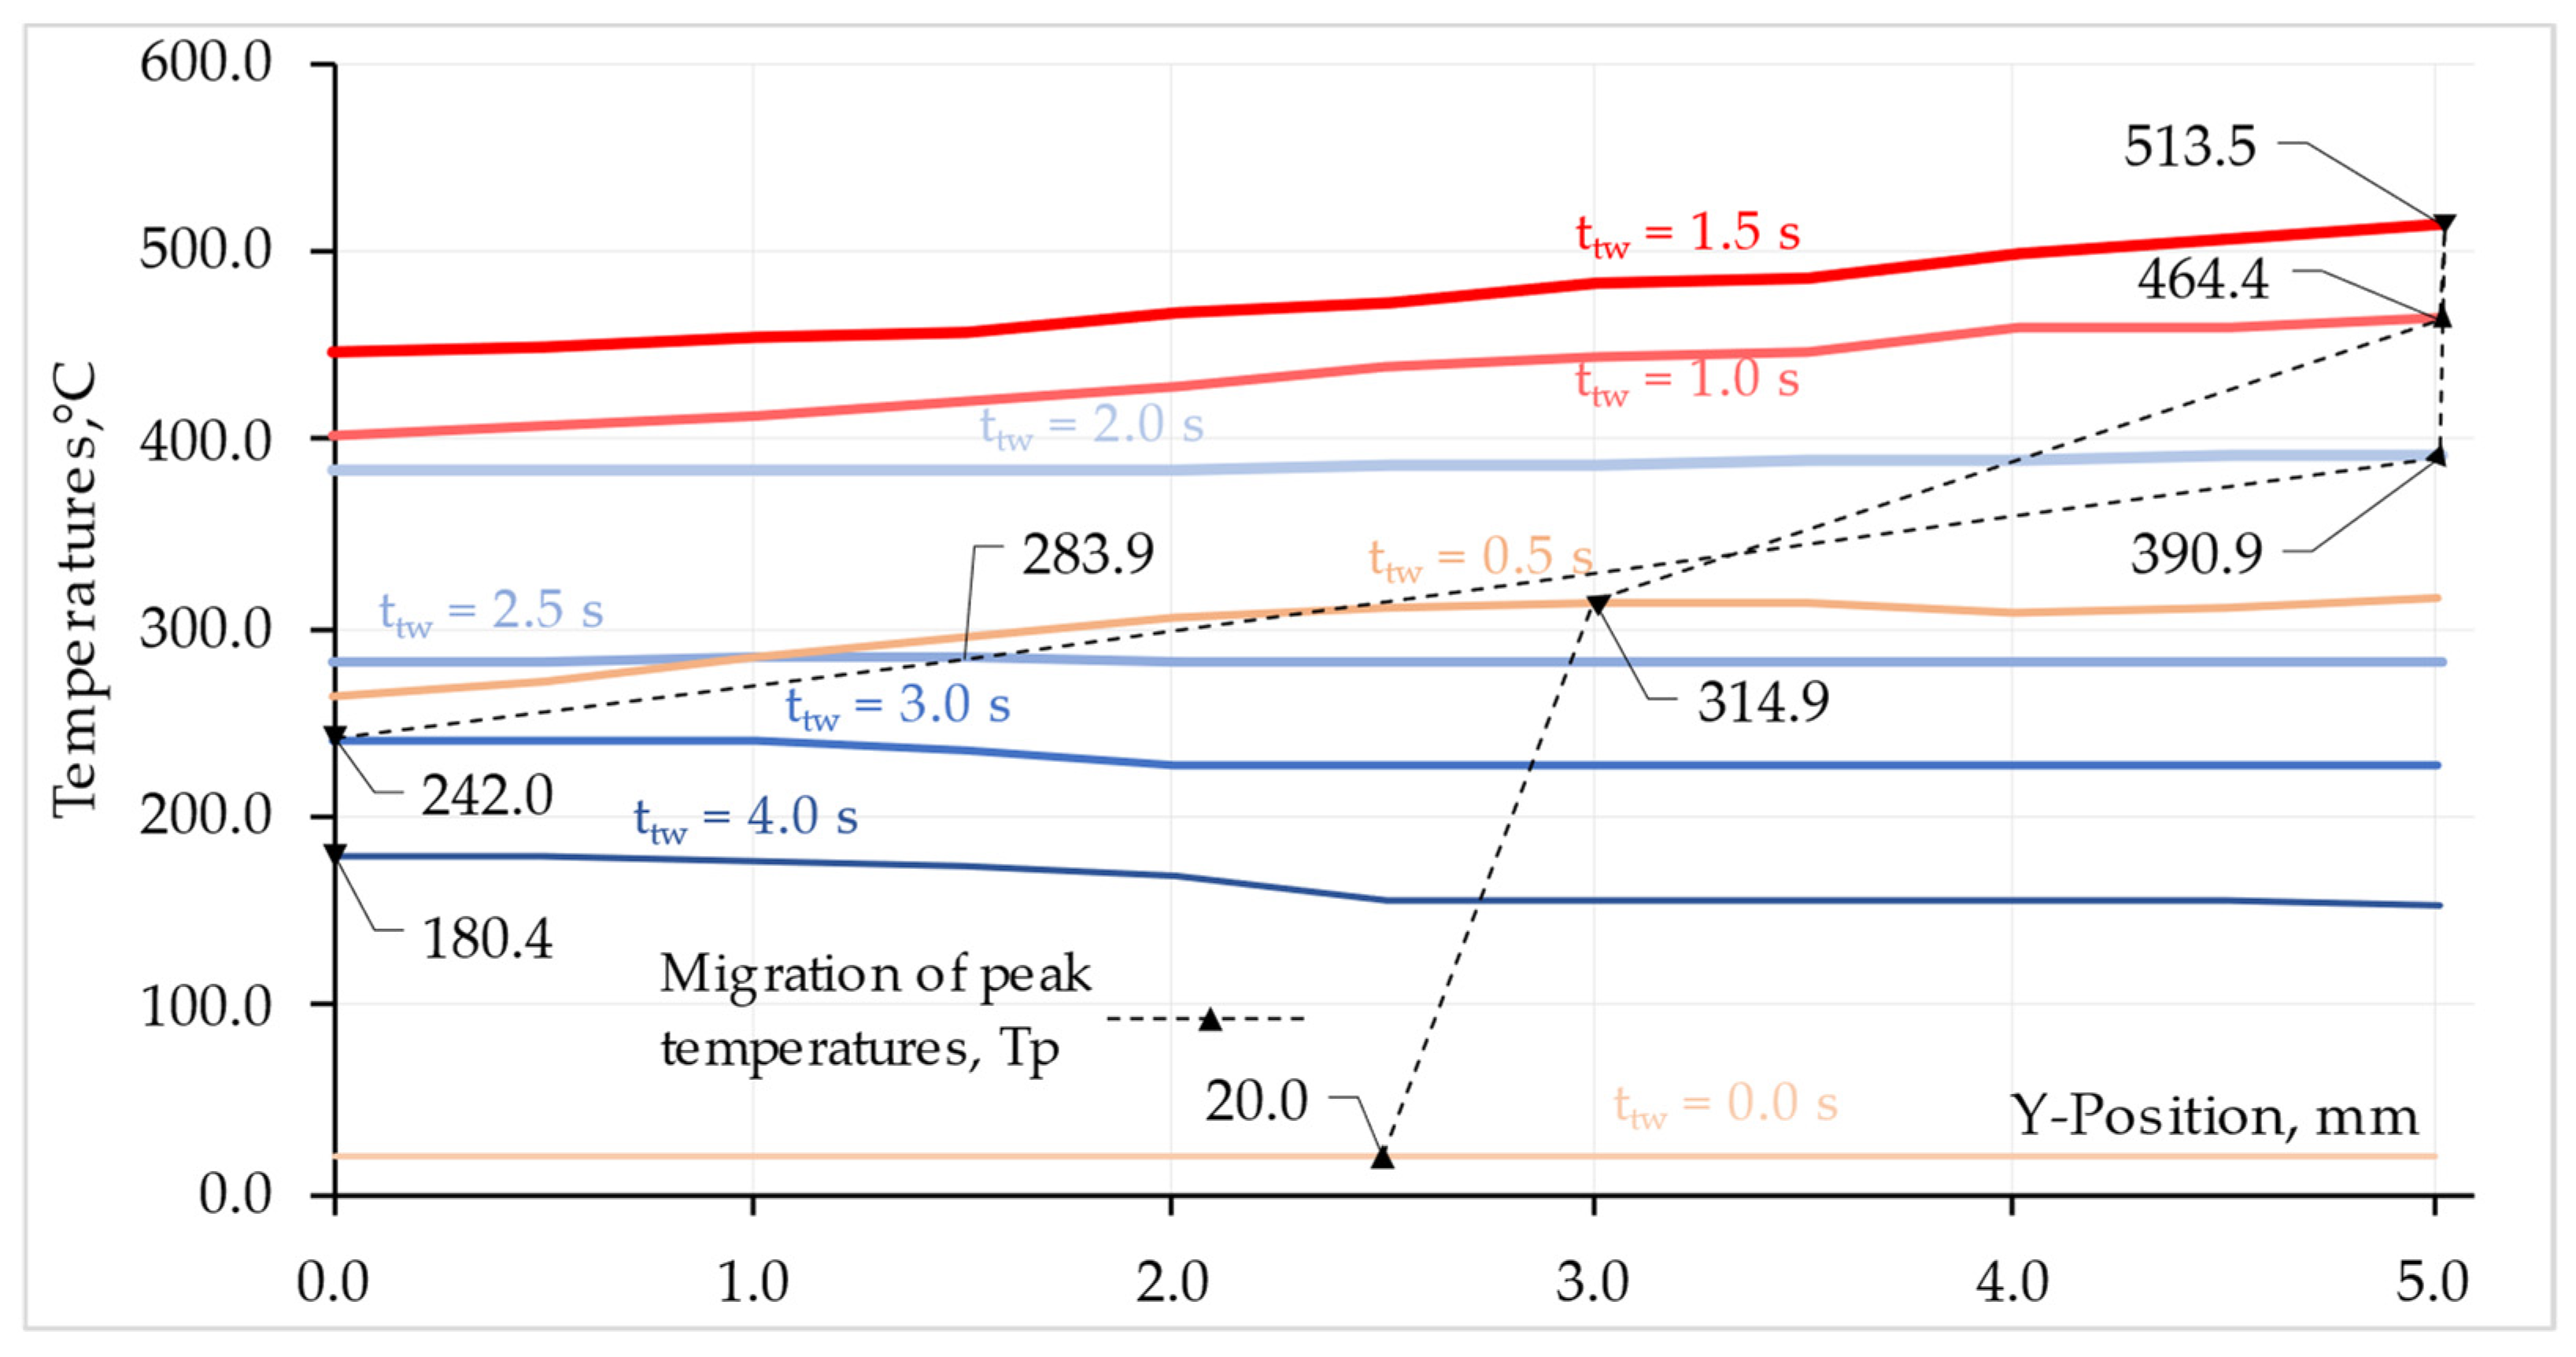
4.1.1. Temperature Changes at the Points
4.1.2. Temperature Changes at the Faying Surface
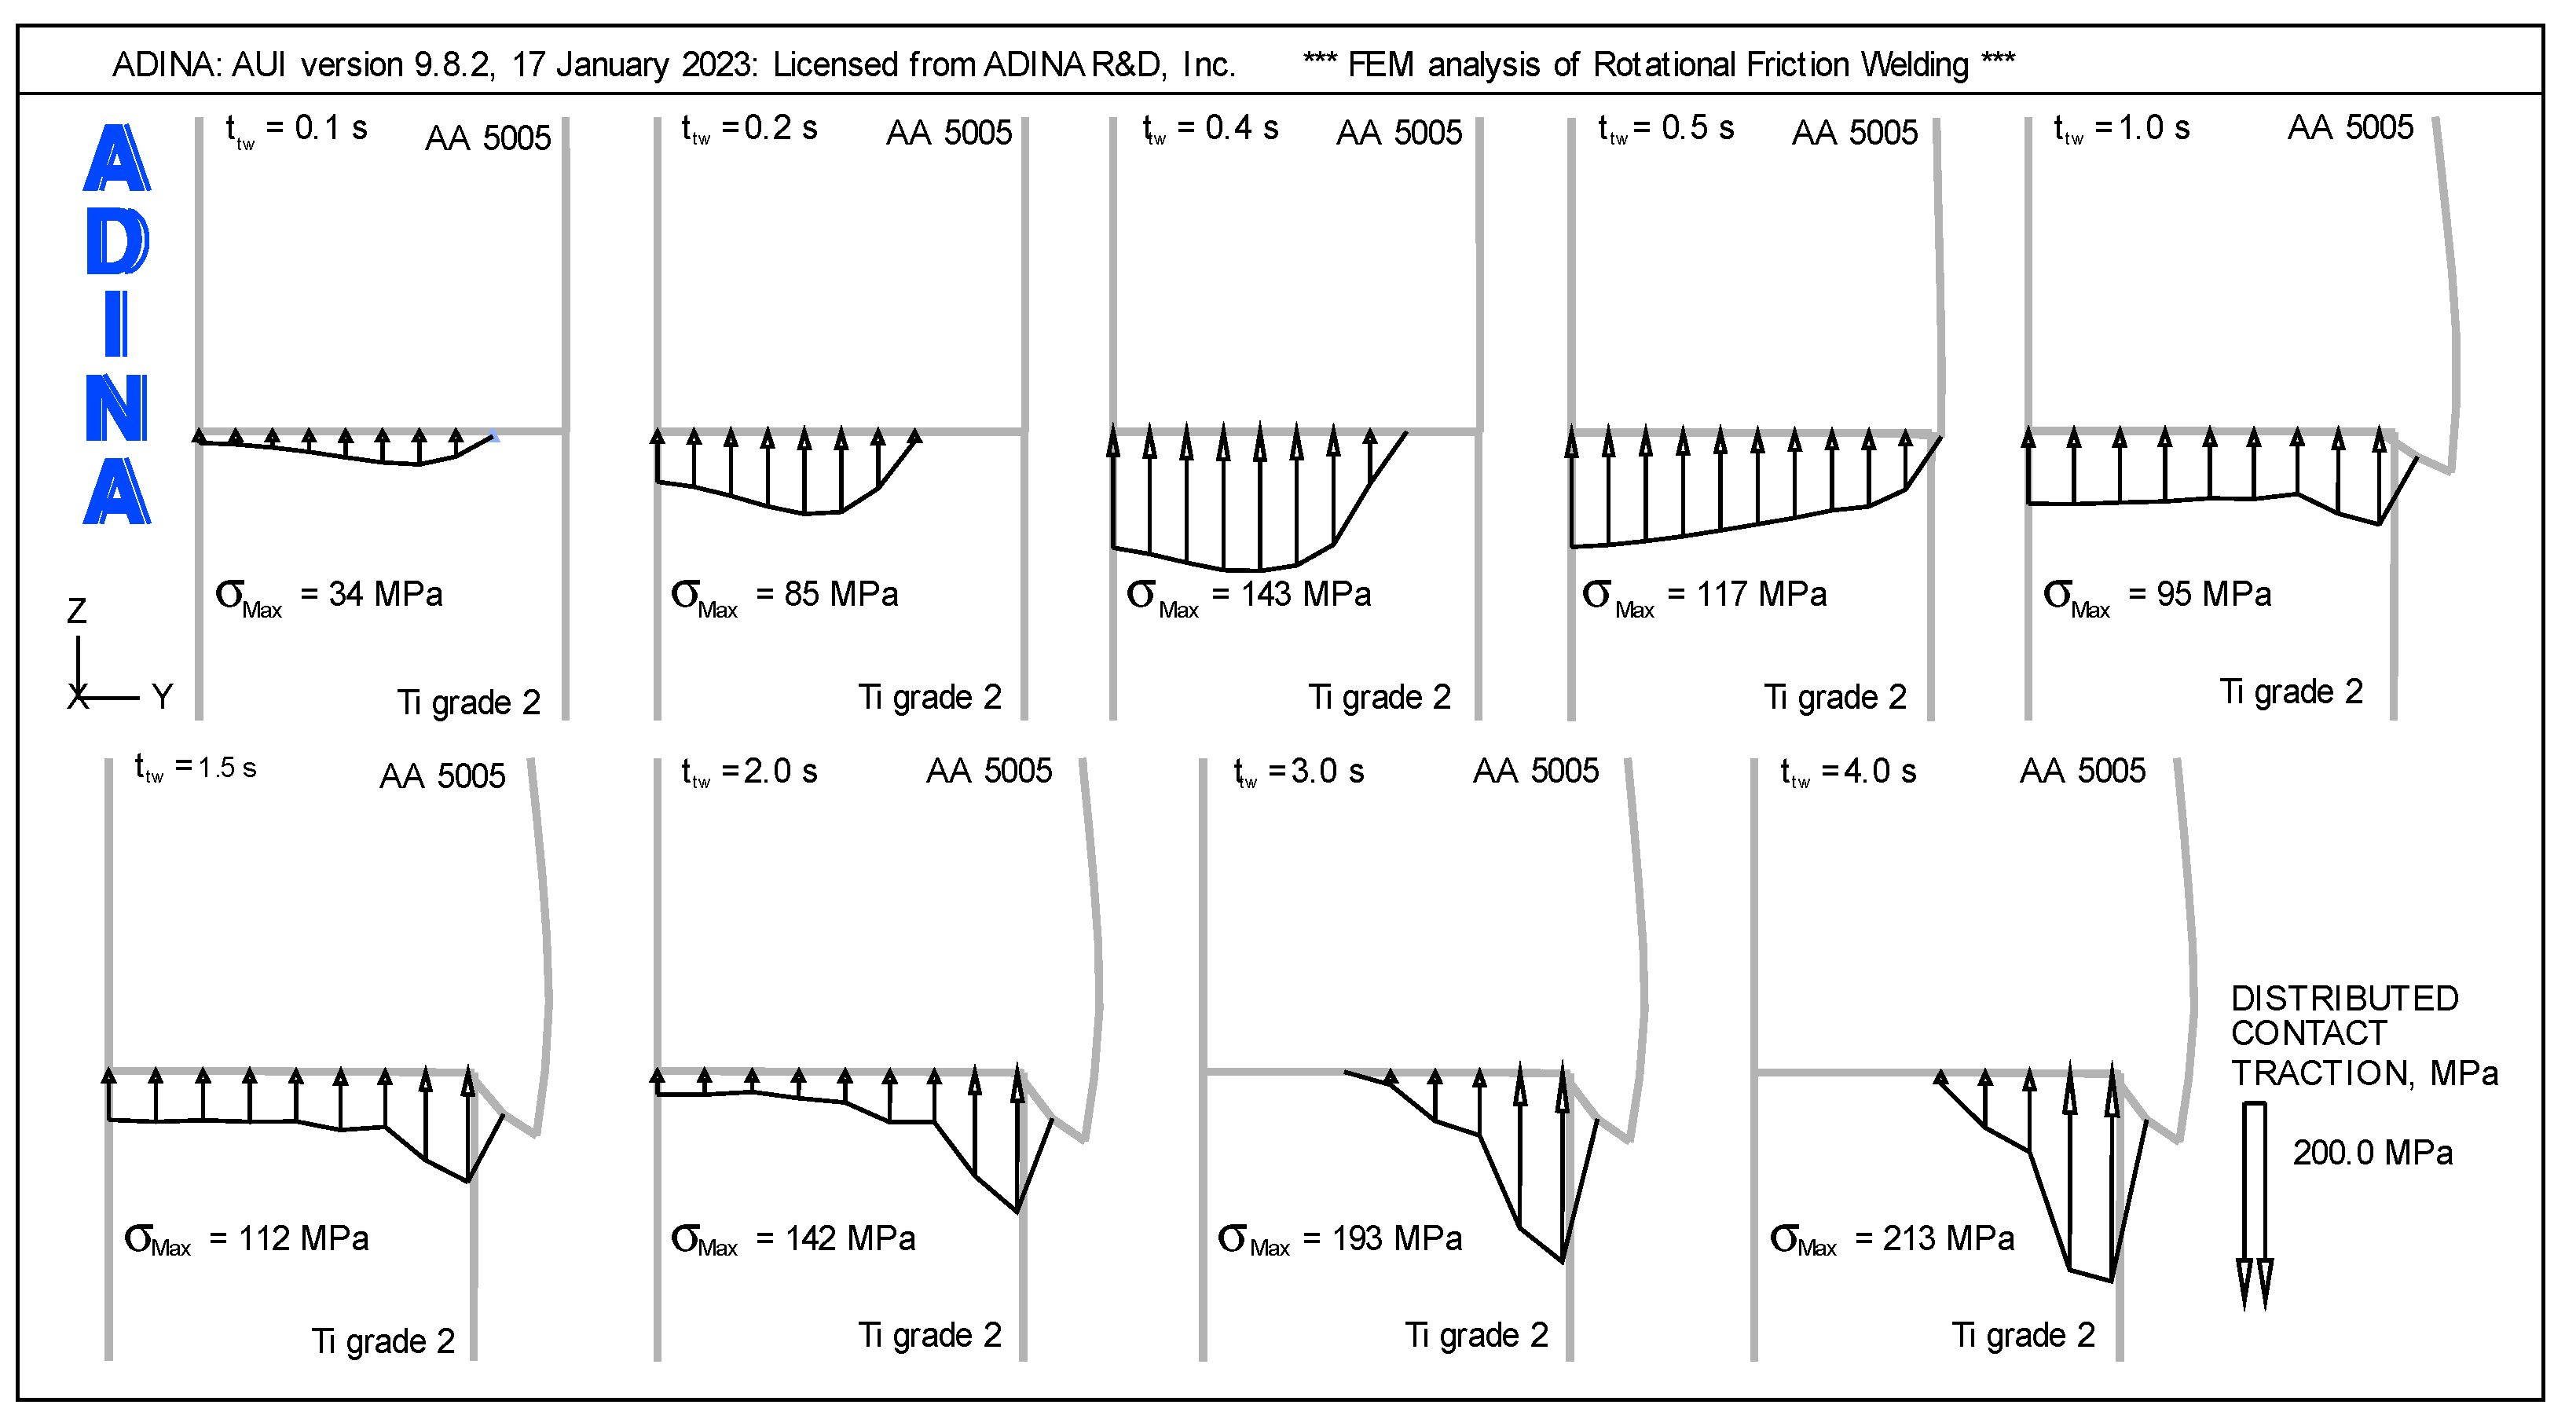
4.2. Contact Traction Changes on the Faying Surfaces
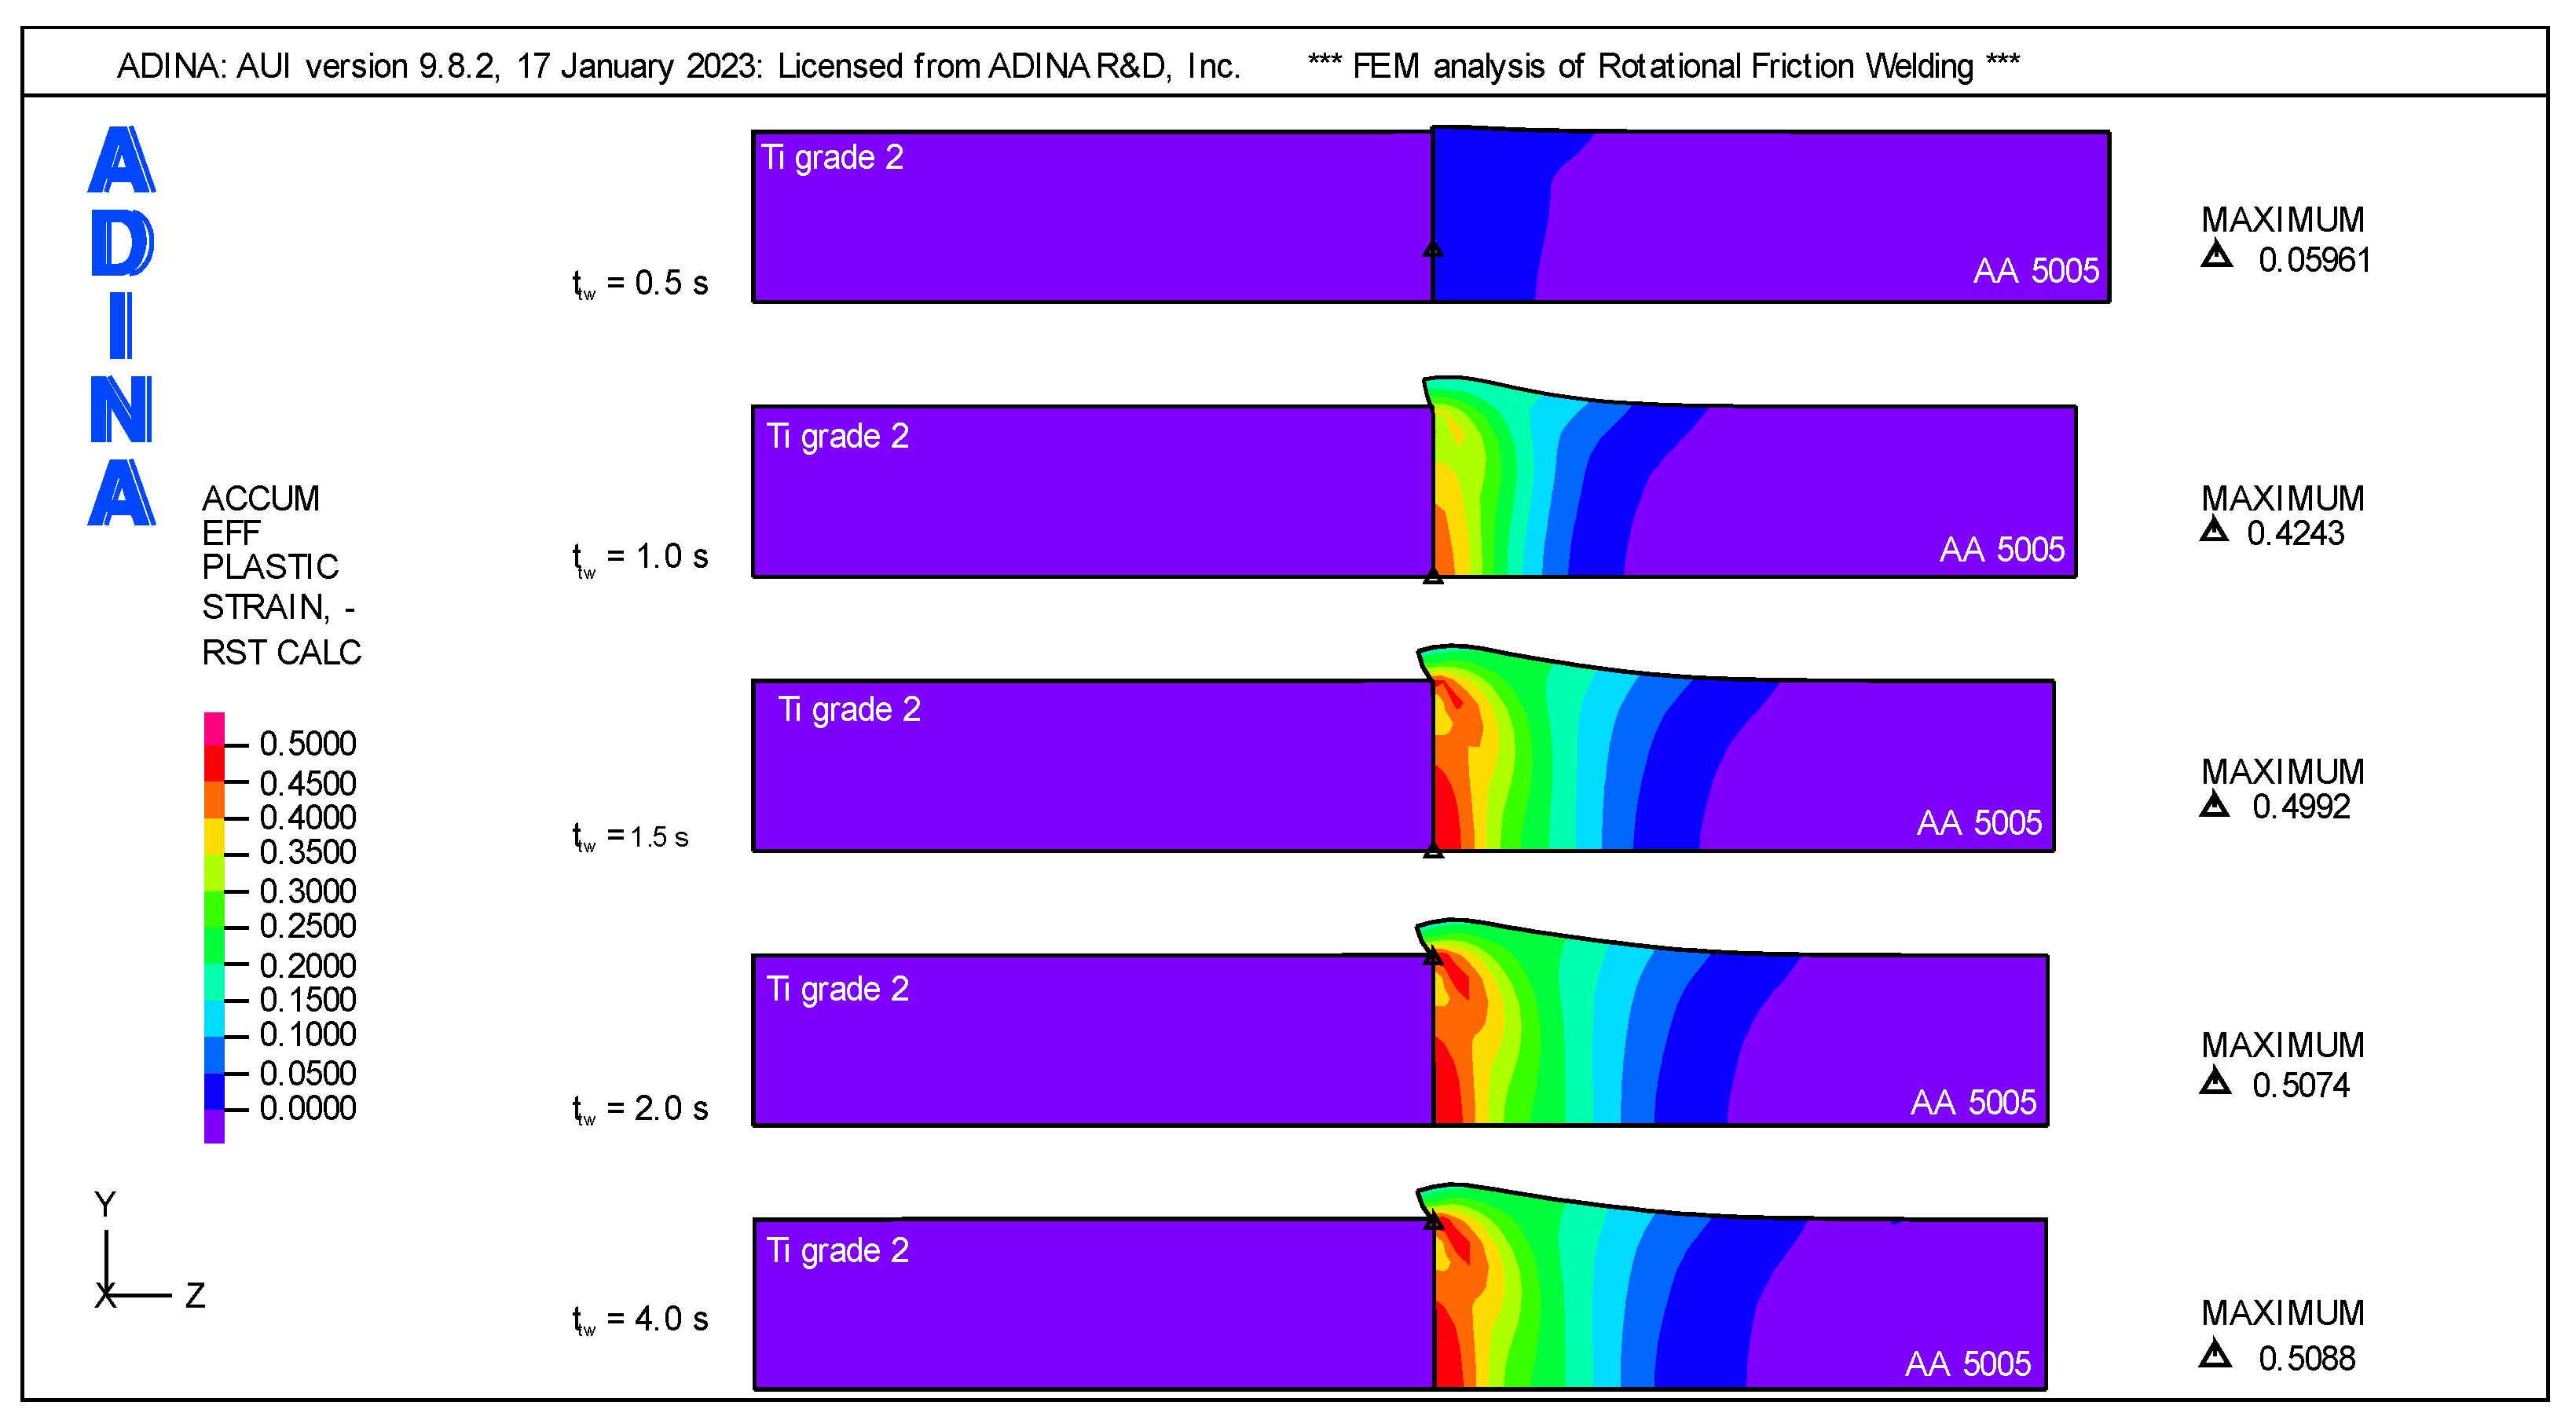
4.3. Weldment Deformation
5. Discussion
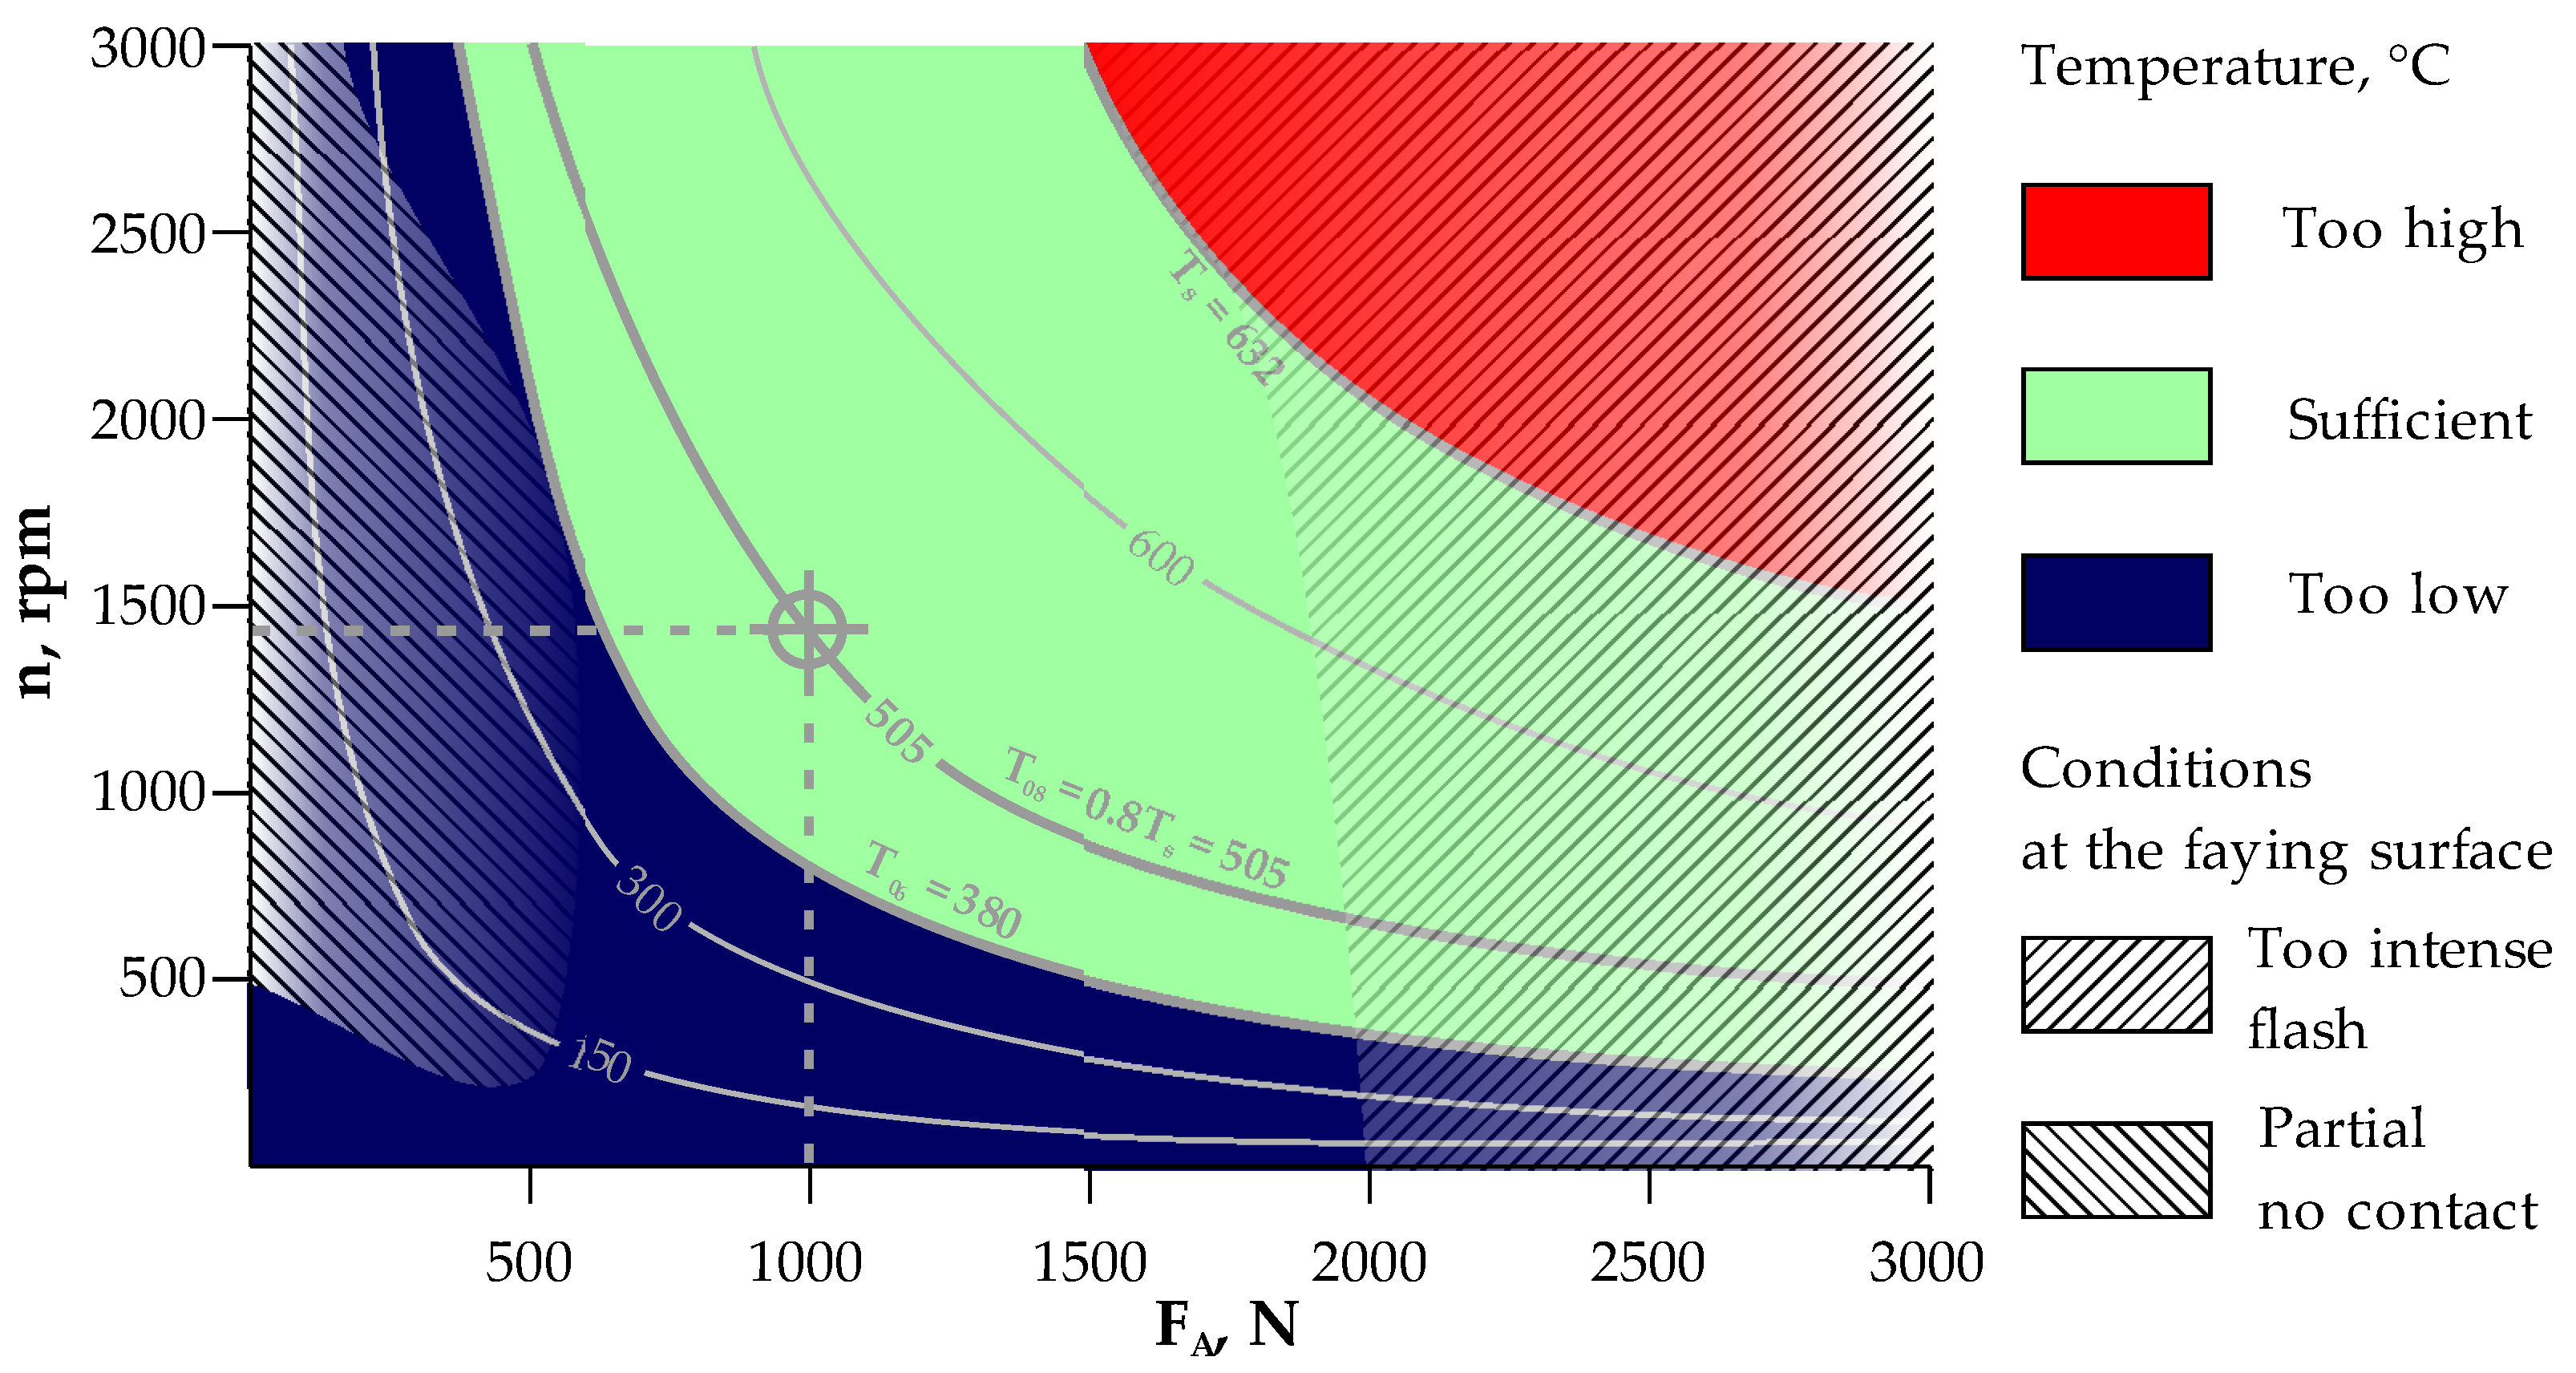
Effect of Dissimilarity in Material Properties on RFW Process Parameters
Temperature Peak Migration
6. Conclusions
- Numerical calculations strongly depend on the assumed frictional conditions and the heat transfer coefficient hC. Good results were obtained assuming a low coefficient of friction at the solidus temperature of the material with a lower melting point. The optimal value of the heat transfer coefficient was hC = 106 W/m2·K.
- On the faying surfaces, there is an uneven temperature distribution during the RFW process predicted by numerical simulations.
- The peak temperature on the faying surfaces migrates during the RFW process. In the friction phase on the faying surfaces, it moves from the half of the rod radius to the outside, and in the forging phase, in the absence of a source of frictional heat, the temperature peak returns to the inside of the rod.
- Good-quality Ti Grade 2/AA 5005 joints, without IMCs, were obtained with the assumption that the temperature peak at the end of the friction phase will be around 80% of the solidus temperature of the AA 5005 material.
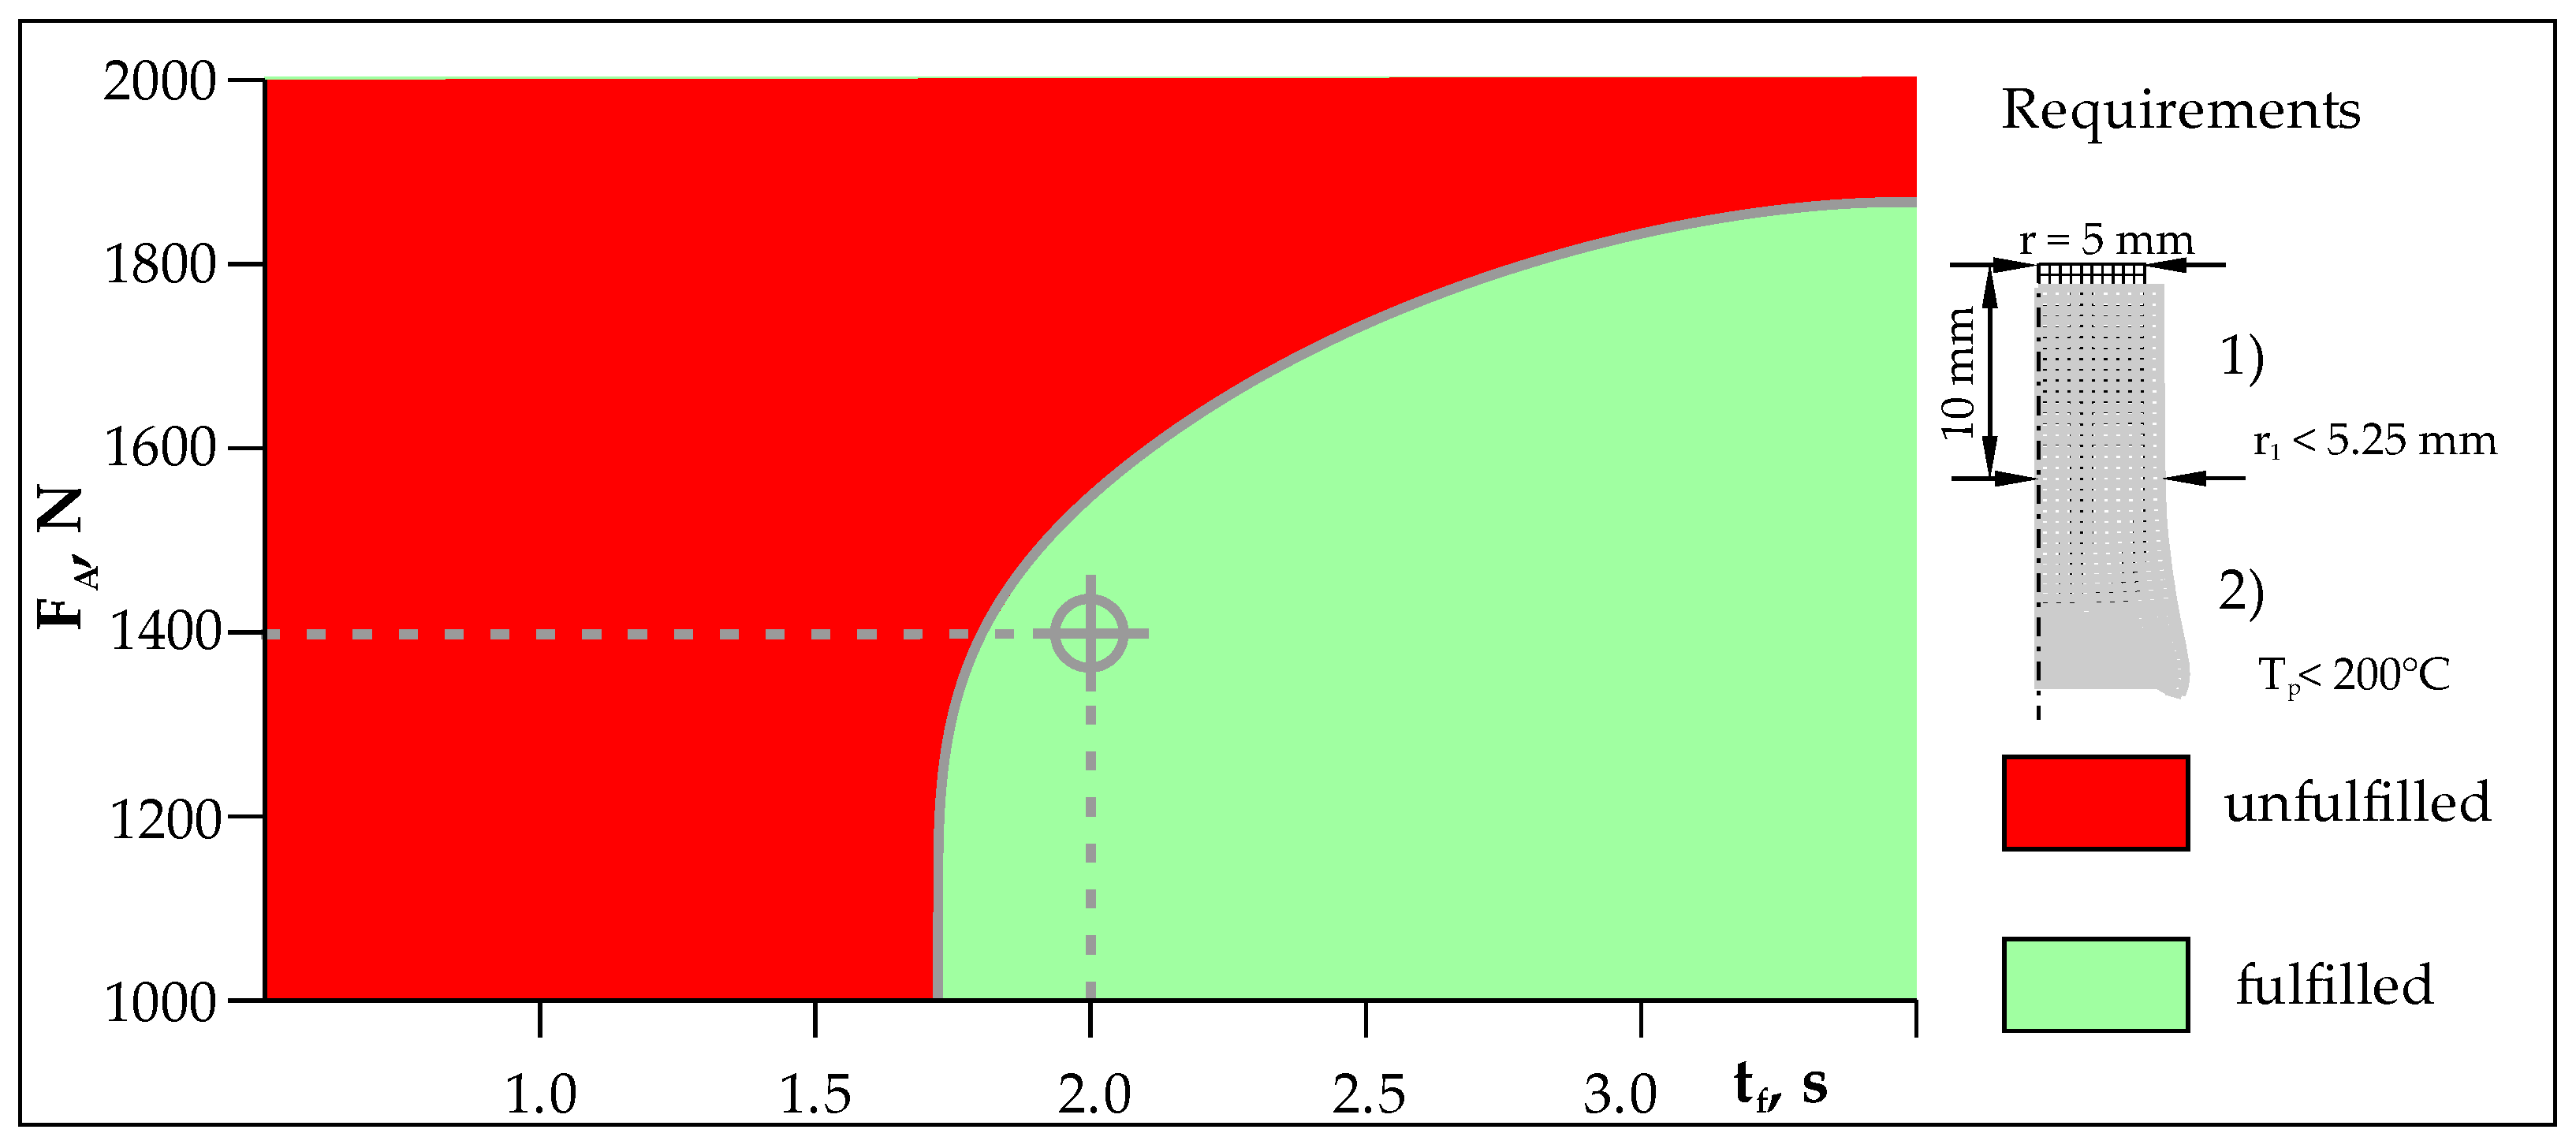
- The maximum axial force FAMax in the forging phase should be the product of the yield strength at temperature T0.8 and the face area of the rod.
- The axial force FA in the friction phase should be about 70% of the FAmax.
Author Contributions
Funding
Institutional Review Board Statement
Informed Consent Statement
Data Availability Statement
Conflicts of Interest
References
- Meisnar, M.; Baker, S.; Bennett, J.M.; Bernad, A.; Mostafa, A.; Resch, S.; Fernandes, N.; Norman, A. Microstructural characterisation of rotary friction welded AA6082 and Ti-6Al-4V dissimilar joints. Mater. Des. 2017, 132, 188–197. [Google Scholar] [CrossRef]
- Lacki, P.; Wojsyk, K.; Kudła, K.; Nitkiewicz, Z.; Śliwa, R.E. Friction welding of the alloys having significantly different thermal and mechanical properties. In IWCMM 2009 XIX International Workshop on Computational Mechanics of Materials, Proceedings of the 19th International Workshop on Computational Mechanics of Materials IWCMM19, Constanta, Romania, 1–4 September 2009; Peride, N., Ed.; Ovidius University Press: Constanta, Romania, 2009; pp. 98–99. [Google Scholar]
- Kudła, K.; Wojsyk, K.; Lacki, P.; Śliwa, R.E. Zgrzewanie tarciowe stopów tytanu z aluminium: Ang. Friction welding of titanium alloys with aluminum. Inżynieria Mater. 2009, 30, 306–309. [Google Scholar]
- Vill, V.I. Friction Welding of Metals; American Welding Society, Inc.: New York, NY, USA, 1962; ISBN 0278920098. [Google Scholar]
- Zimmerman, J.; Włosinski, W.; Lindemann, Z.R. Thermo-mechanical and diffusion modelling in the process of ceramic–metal friction welding. J. Mater. Process. Technol. 2009, 209, 1644–1653. [Google Scholar] [CrossRef]
- Lindemann, Z.R.; Skalski, K.; Włosinski, W.; Zimmerman, J. Thermo-mechanical phenomena in the process of friction welding. Bull. Pol. Acad. Sci. Tech. Sci. 2006, 54, 1–8. [Google Scholar]
- Taban, E.; Gould, J.E.; Lippold, J.C. Dissimilar friction welding of 6061-T6 aluminum and AISI 1018 steel: Properties and microstructural characterization. Mater. Des. 2010, 31, 2305–2311. [Google Scholar] [CrossRef]
- Geng, P.; Qin, G.; Zhou, J.; LI, C. Parametric optimization and microstructural characterization of friction welded aeronautic aluminum alloy 2024. Trans. Nonferrous Met. Soc. China 2019, 29, 2483–2495. [Google Scholar] [CrossRef]
- Palanivel, R.; Dinaharan, I.; Laubscher, R.F. Assessment of microstructure and tensile behavior of continuous drive friction welded titanium tubes. Mater. Sci. Eng. A 2017, 687, 249–258. [Google Scholar] [CrossRef]
- Tsikayi, D.; Hattingh, D.G.; Bernard, D.; Steuwer, A.; Westraadt, J.; Goosen, W.; Buslaps, T. Effect of Direct energy surface modification on fatigue life of rotary friction welded Ti6Al4V ELI fatigue coupons. Int. J. Fatigue 2022, 163, 107096. [Google Scholar] [CrossRef]
- van der Merwe, H.B.; James, M.N.; Hattingh, D.G.; Rall, W. Fatigue life prediction for rotary friction welded Ti-6Al-4V under variable amplitude fatigue loading. Theor. Appl. Fract. Mech. 2019, 104, 102321. [Google Scholar] [CrossRef]
- Więckowski, W.; Adamus, J. Blachy aluminiowe w aspekcie zastosowań w przemyśle lotniczym: Aluminum sheets in terms of applications in the aviation industry. Rudy i Metale Nieżelazne 2009, 54, 769–772. [Google Scholar]
- ADINA R & D, Inc. ADINA Theory and Modeling Guide: Volume I: ADINA Solids & Structures; ADINA R & D, Inc.: Watertown, MA, USA, 2022. [Google Scholar]
- ADINA R & D, Inc. ADINA Theory and Modeling Guide: Volume II: ADINA Thermal; ADINA R & D, Inc.: Watertown, MA, USA, 2022. [Google Scholar]
- Bathe, K.J. Finite Element Procedures; Prentice-Hall, Inc.: Upper Saddle River, NJ, USA, 1996. [Google Scholar]
- Wang, Q.J.; Chung, Y.-W. Encyclopedia of Tribology; Springer: Boston, MA, USA, 2013. [Google Scholar]
- Maalekian, M.; Kozeschnik, E.; Brantner, H.P.; Cerjak, H. Comparative analysis of heat generation in friction welding of steel bars. Acta Mater. 2008, 56, 2843–2855. [Google Scholar] [CrossRef]
- Geng, P.; Qin, G.; Zhou, J. A computational modeling of fully friction contact-interaction in linear friction welding of Ni-based superalloys. Mater. Des. 2020, 185, 108244. [Google Scholar] [CrossRef]


| Ref | Rotating Component 1 | Stationary Component 1 | Speed | Load 2 | Time or the Burn-Off Length 3 | ||
|---|---|---|---|---|---|---|---|
| Friction Phase | Forging Phase | Friction Phase | Forging Phase | ||||
| [5] | Al2O3; rod; ϕ10 mm | AA 6061; rod ϕ10 mm | 14,500 rpm | 18 MPa | 46 MPa | 0.85 s | 3.5 s |
| [6] | Al2O3; rod; ϕ10 mm | Aluminum; rod; ϕ10 mm | 14,000 rpm | 18 MPa | 46 MPa | 1.4 s | 1.6 s |
| [7] | AA 6061; rod; ϕ12.5 mm | AISI 1018; rod; ϕ12.5 mm | 4200 rpm | 23 MPa | 50–60 MPa | 1 s | 5 s |
| [8] | AA 2024; rod; ϕ12 mm | AA 2024; rod; ϕ12 mm | 2200 rpm | 40 MPa | 90–110 MPa | 4–8 s | - |
| [9] | Ti Grade 2; tube; ϕ60 mm; 3.9 mm | Ti Grade 2; tube; ϕ60 mm; 3.9 mm | 2200 rpm | 20 kN | 30 kN | 32 s | 22 s |
| [10,11] | Ti Grade 23; rod; ϕ6 mm | Ti Grade 23; rod; ϕ6 mm | 2500 rpm | 4 kN | 6 kN | 1.5 mm | 9 s |
| [1] | Ti Grade 5; rod; ϕ8 mm | AA 6082; rod; ϕ8 mm | 6000 rpm–14,000 rpm | 9 kN–18 kN | 13 kN–30 kN | Max 3 s | 0.25 s–2.5 s |
| [2,3] | Ti- α; rod; ϕ10 mm | AA 5005; rod; ϕ10 mm | 1440 rpm | 1 kN–10 kN | 25 kN–35 kN | 2 s–5 s | 0.5 s–2.5 s |
| Material | Element Content, wt.% | |||||||
|---|---|---|---|---|---|---|---|---|
| Al | Cr | Cu | Fe | Mg | Mn | Si | Zn | |
| AA 5005-H32 | Bal. | 0.09 | 0.19 | 0.67 | 1.07 | 0.18 | 0.27 | 0.23 |
| Material | Density, kg/m3 | YTS, MPa | UTS, MPa | EL, % | Young’s Modulus, GPa | Poisson’s Ratio, - | Shear Modulus, GPa | Shear Strength, MPa | Hardness, Brinell |
|---|---|---|---|---|---|---|---|---|---|
| AA 5005-H32 | 2700 | 117 | 138 | 11 | 68.9 | 0.33 | 25.9 | 96.5 | 36 |
| Material | Thermal Conductivity, W/mK | Specific Heat Capacity, J/KgK | Melting Point, °C | CTE Linear, 10−6/°C | |
|---|---|---|---|---|---|
| Solidus | Liquidus | ||||
| AA 5005-H32 | 200 * | 900 | 632 | 654 | 21.9 |
| Material | Element Content, wt.% | |||||
|---|---|---|---|---|---|---|
| Ti | C | H | Fe | N | O | |
| Ti Grade 2 | Bal. | 0.06 | 0.01 | 0.20 | 0.03 | 0.12 |
| Material | Density, kg/m3 | YTS, MPa | UTS, MPa | EaB, % | Young’s Modulus, GPa | Poisson’s Ratio, - | Shear Modulus, GPa | Shear Strength, MPa | Hardness, Brinell |
|---|---|---|---|---|---|---|---|---|---|
| Ti Grade 2 | 4510 | 340 | 430 | 28 | 102 | 0.34 | 38.0 | 380 | 200 |
| Material | Thermal Conductivity, W/mK | Specific Heat Capacity, J/KgK | Transformation Temperature, °C | CTE Linear, 10−6/°C | |
|---|---|---|---|---|---|
| Beta Transus | Liquidus | ||||
| Ti Grade 2 | 16.4 * | 523 | 913 | 1665 | 8.6 |
Disclaimer/Publisher’s Note: The statements, opinions and data contained in all publications are solely those of the individual author(s) and contributor(s) and not of MDPI and/or the editor(s). MDPI and/or the editor(s) disclaim responsibility for any injury to people or property resulting from any ideas, methods, instructions or products referred to in the content. |
© 2023 by the authors. Licensee MDPI, Basel, Switzerland. This article is an open access article distributed under the terms and conditions of the Creative Commons Attribution (CC BY) license (https://creativecommons.org/licenses/by/4.0/).
Share and Cite
Lacki, P.; Adamus, J.; Więckowski, W.; Motyka, M. A New Method of Predicting the Parameters of the Rotational Friction Welding Process Based on the Determination of the Frictional Heat Transfer in Ti Grade 2/AA 5005 Joints. Materials 2023, 16, 4787. https://doi.org/10.3390/ma16134787
Lacki P, Adamus J, Więckowski W, Motyka M. A New Method of Predicting the Parameters of the Rotational Friction Welding Process Based on the Determination of the Frictional Heat Transfer in Ti Grade 2/AA 5005 Joints. Materials. 2023; 16(13):4787. https://doi.org/10.3390/ma16134787
Chicago/Turabian StyleLacki, Piotr, Janina Adamus, Wojciech Więckowski, and Maciej Motyka. 2023. "A New Method of Predicting the Parameters of the Rotational Friction Welding Process Based on the Determination of the Frictional Heat Transfer in Ti Grade 2/AA 5005 Joints" Materials 16, no. 13: 4787. https://doi.org/10.3390/ma16134787