
Solidification Behavior of Dy-Tb-Fe Alloys through Experimental Study and Thermodynamic Calculation

Abstract
:1. Introduction
2. Literature Information
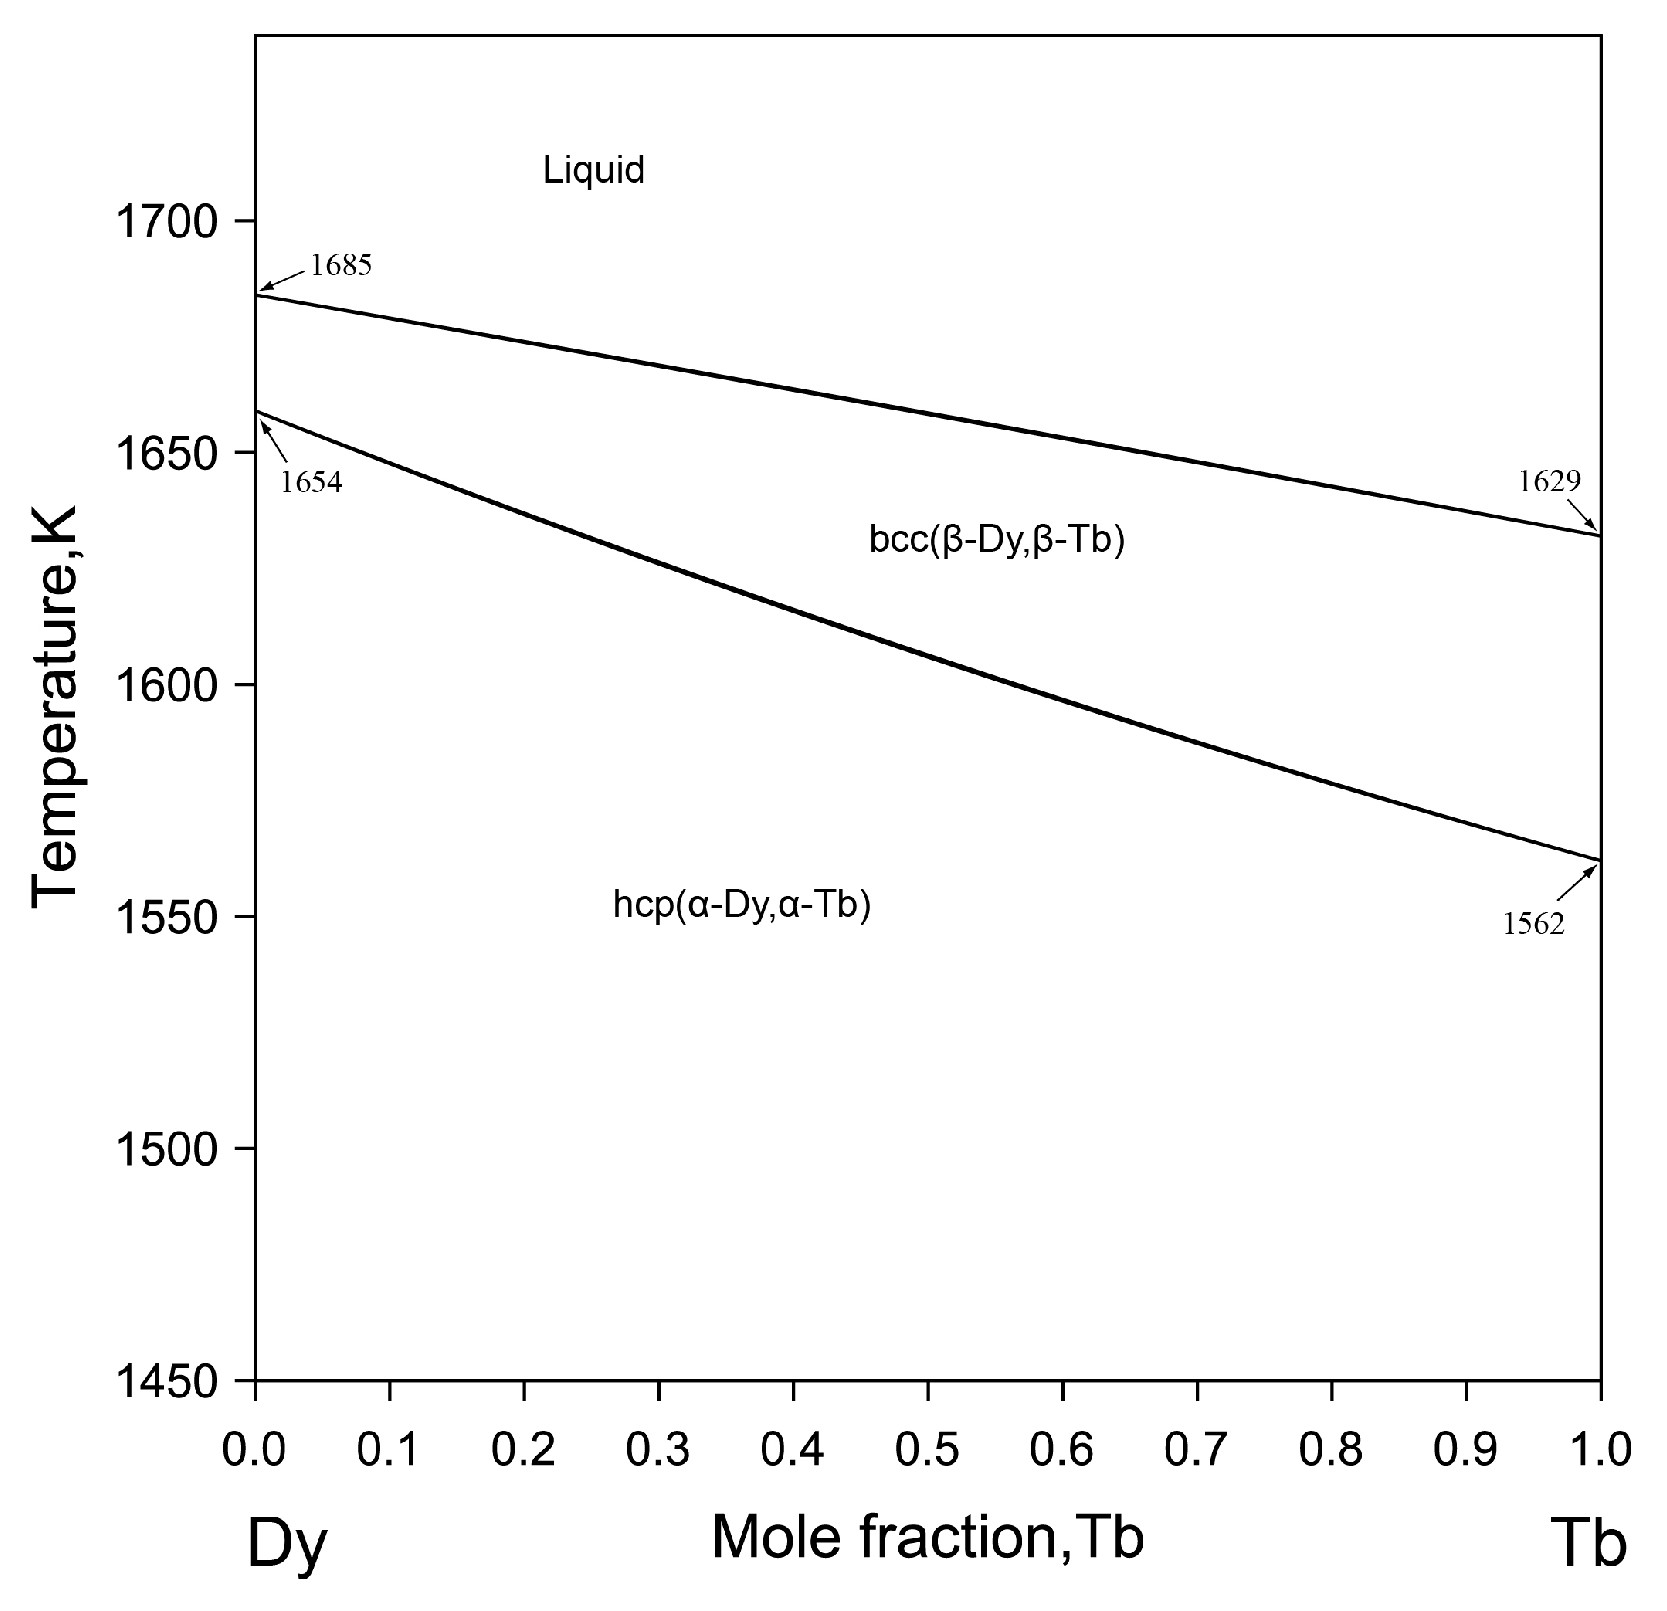
2.1. Binary Systems
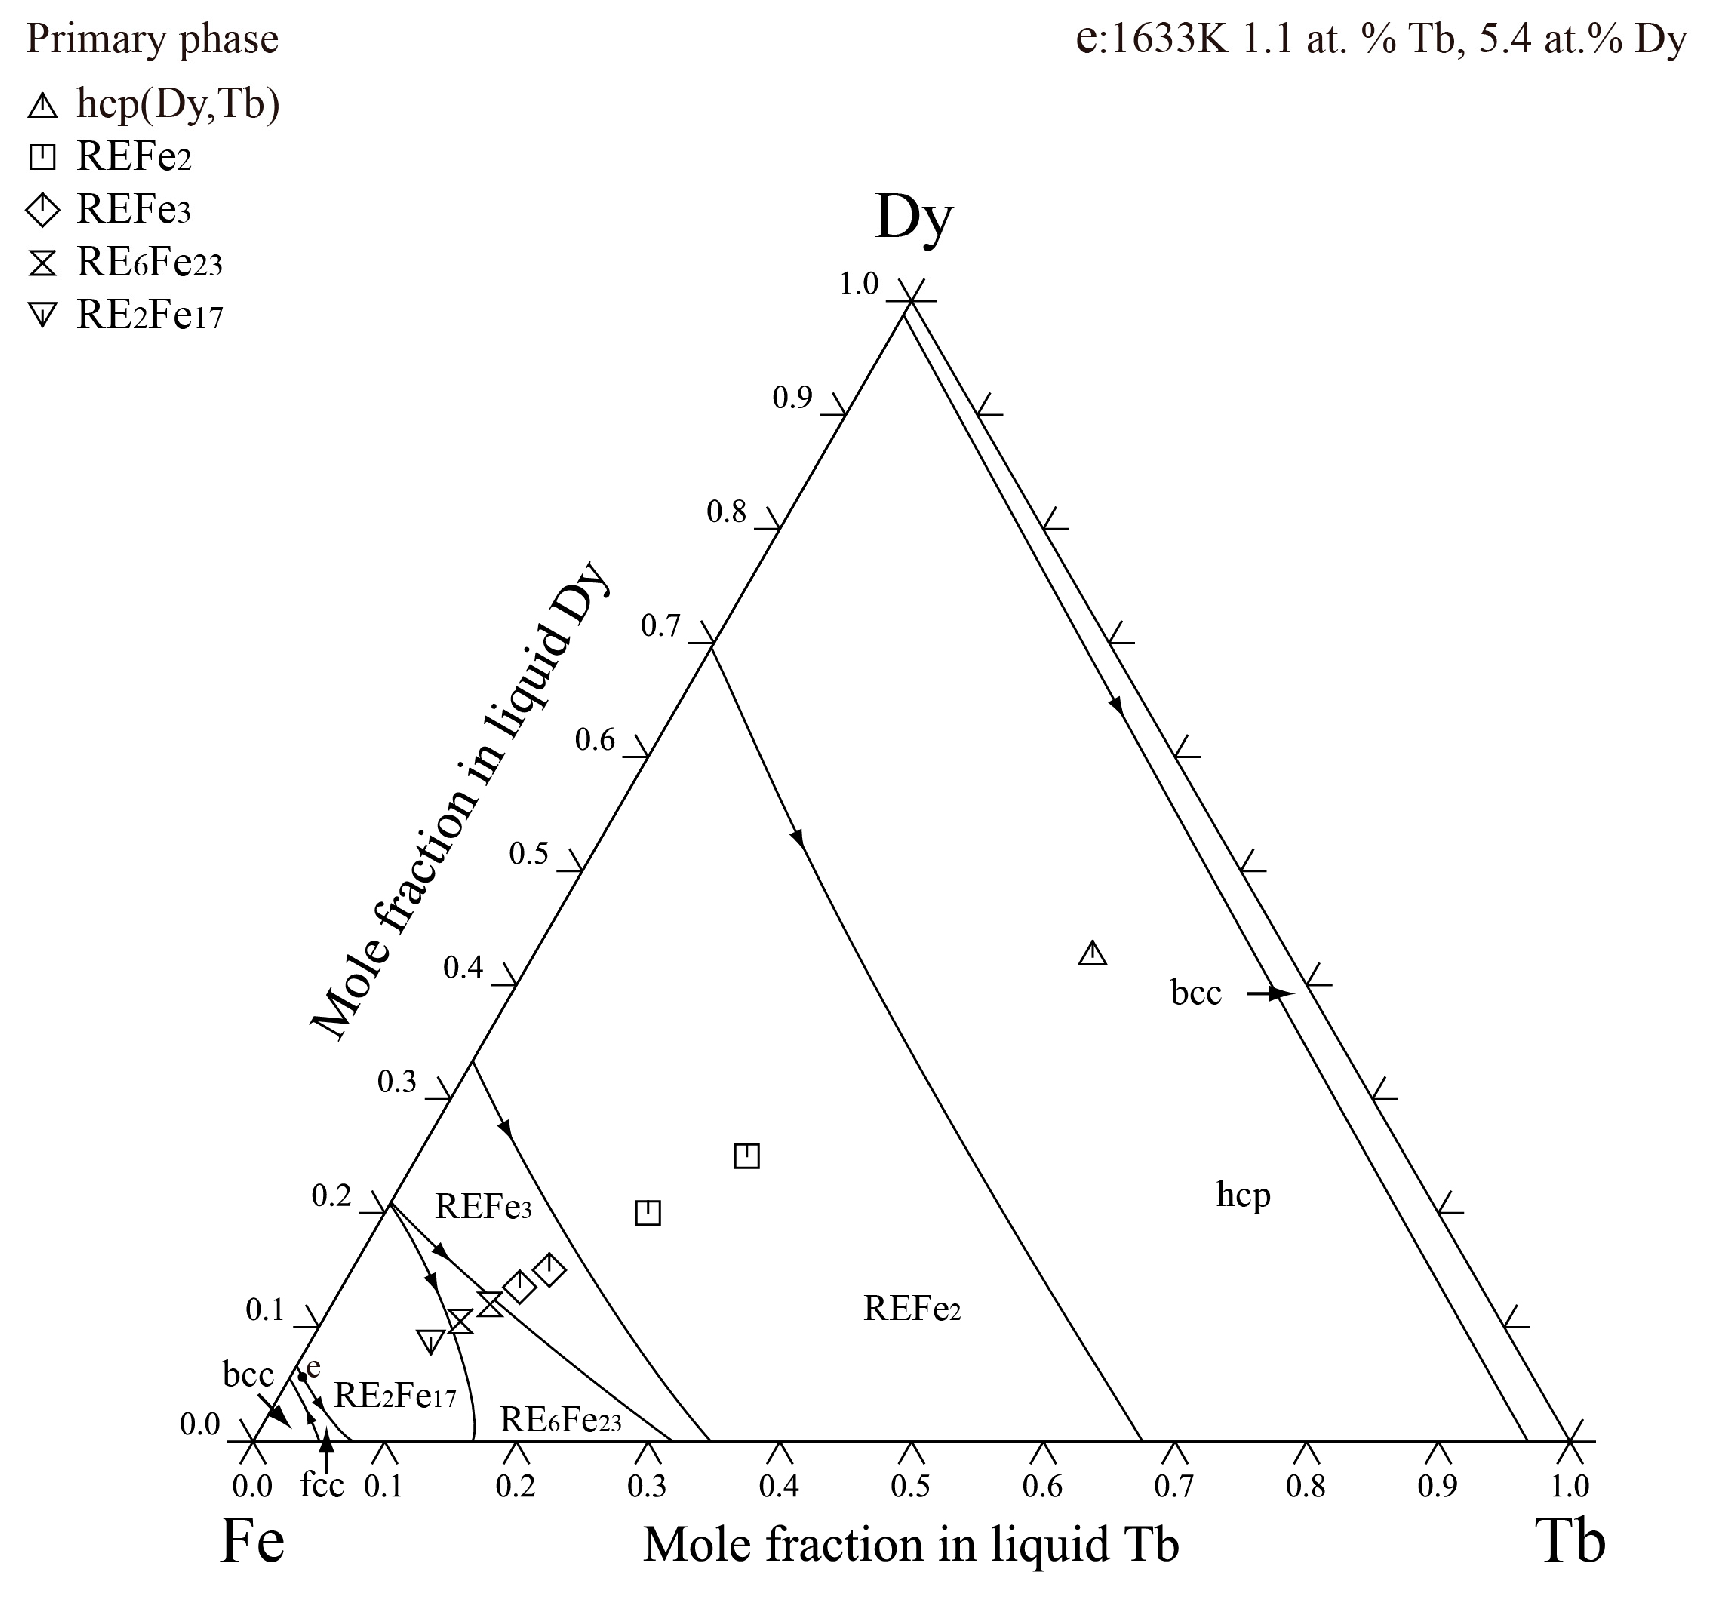
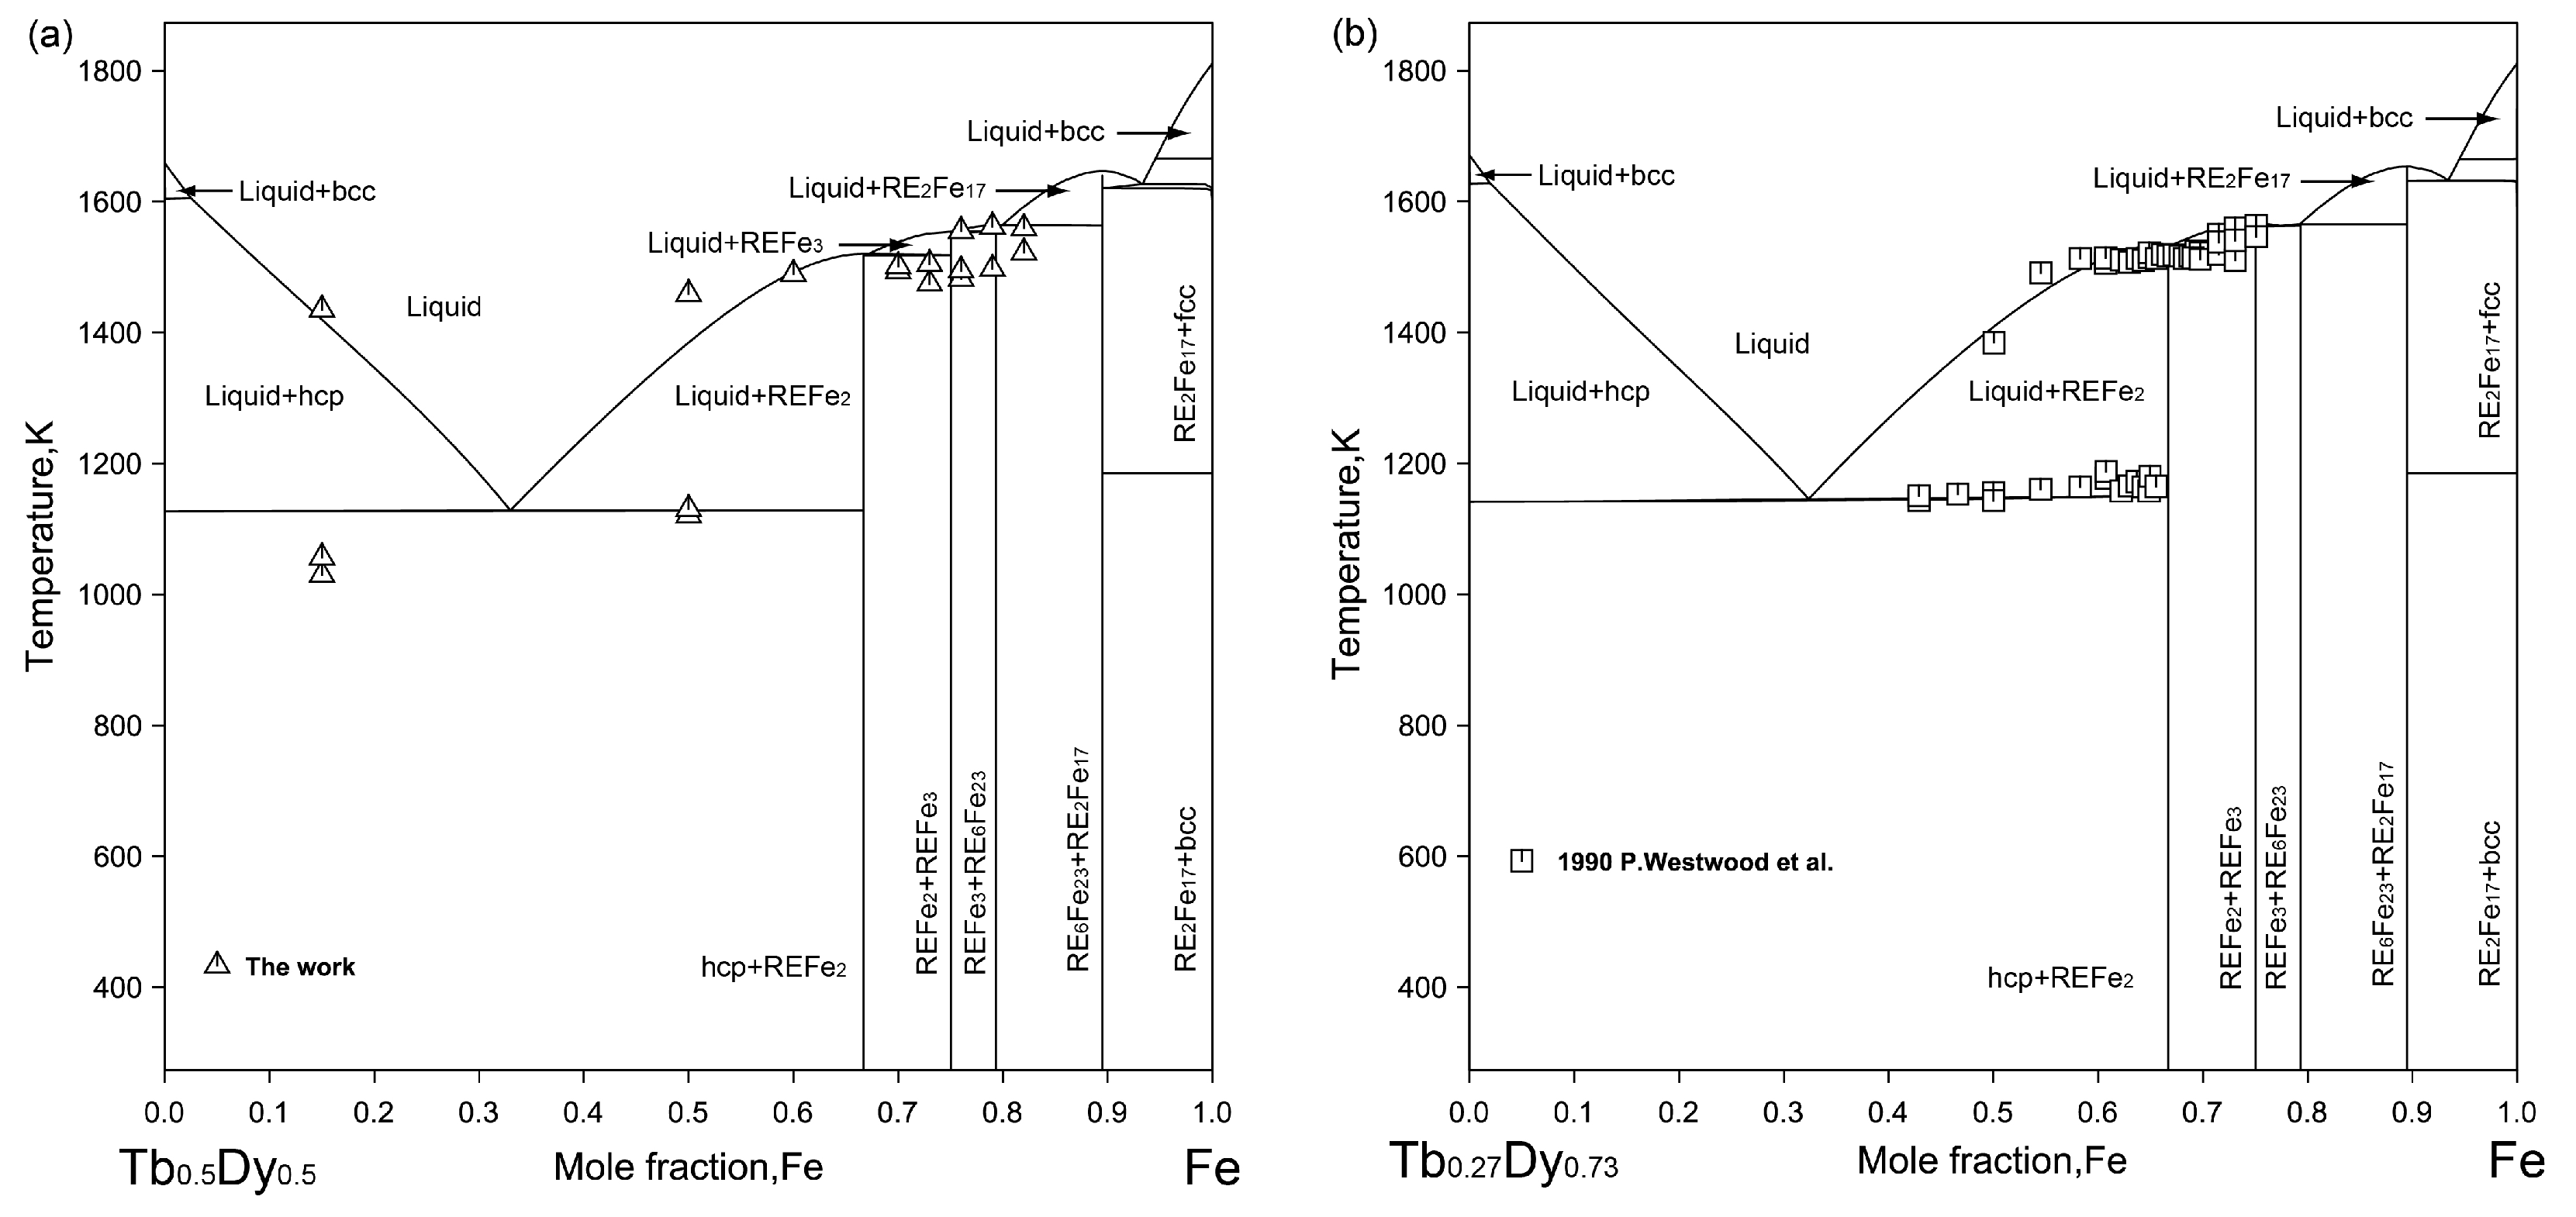
2.2. Ternary System
3. Experimental Procedure
4. Thermodynamic Calculation
4.1. Solution Phases
4.2. Intermetallic Compounds
5. Results and Discussion
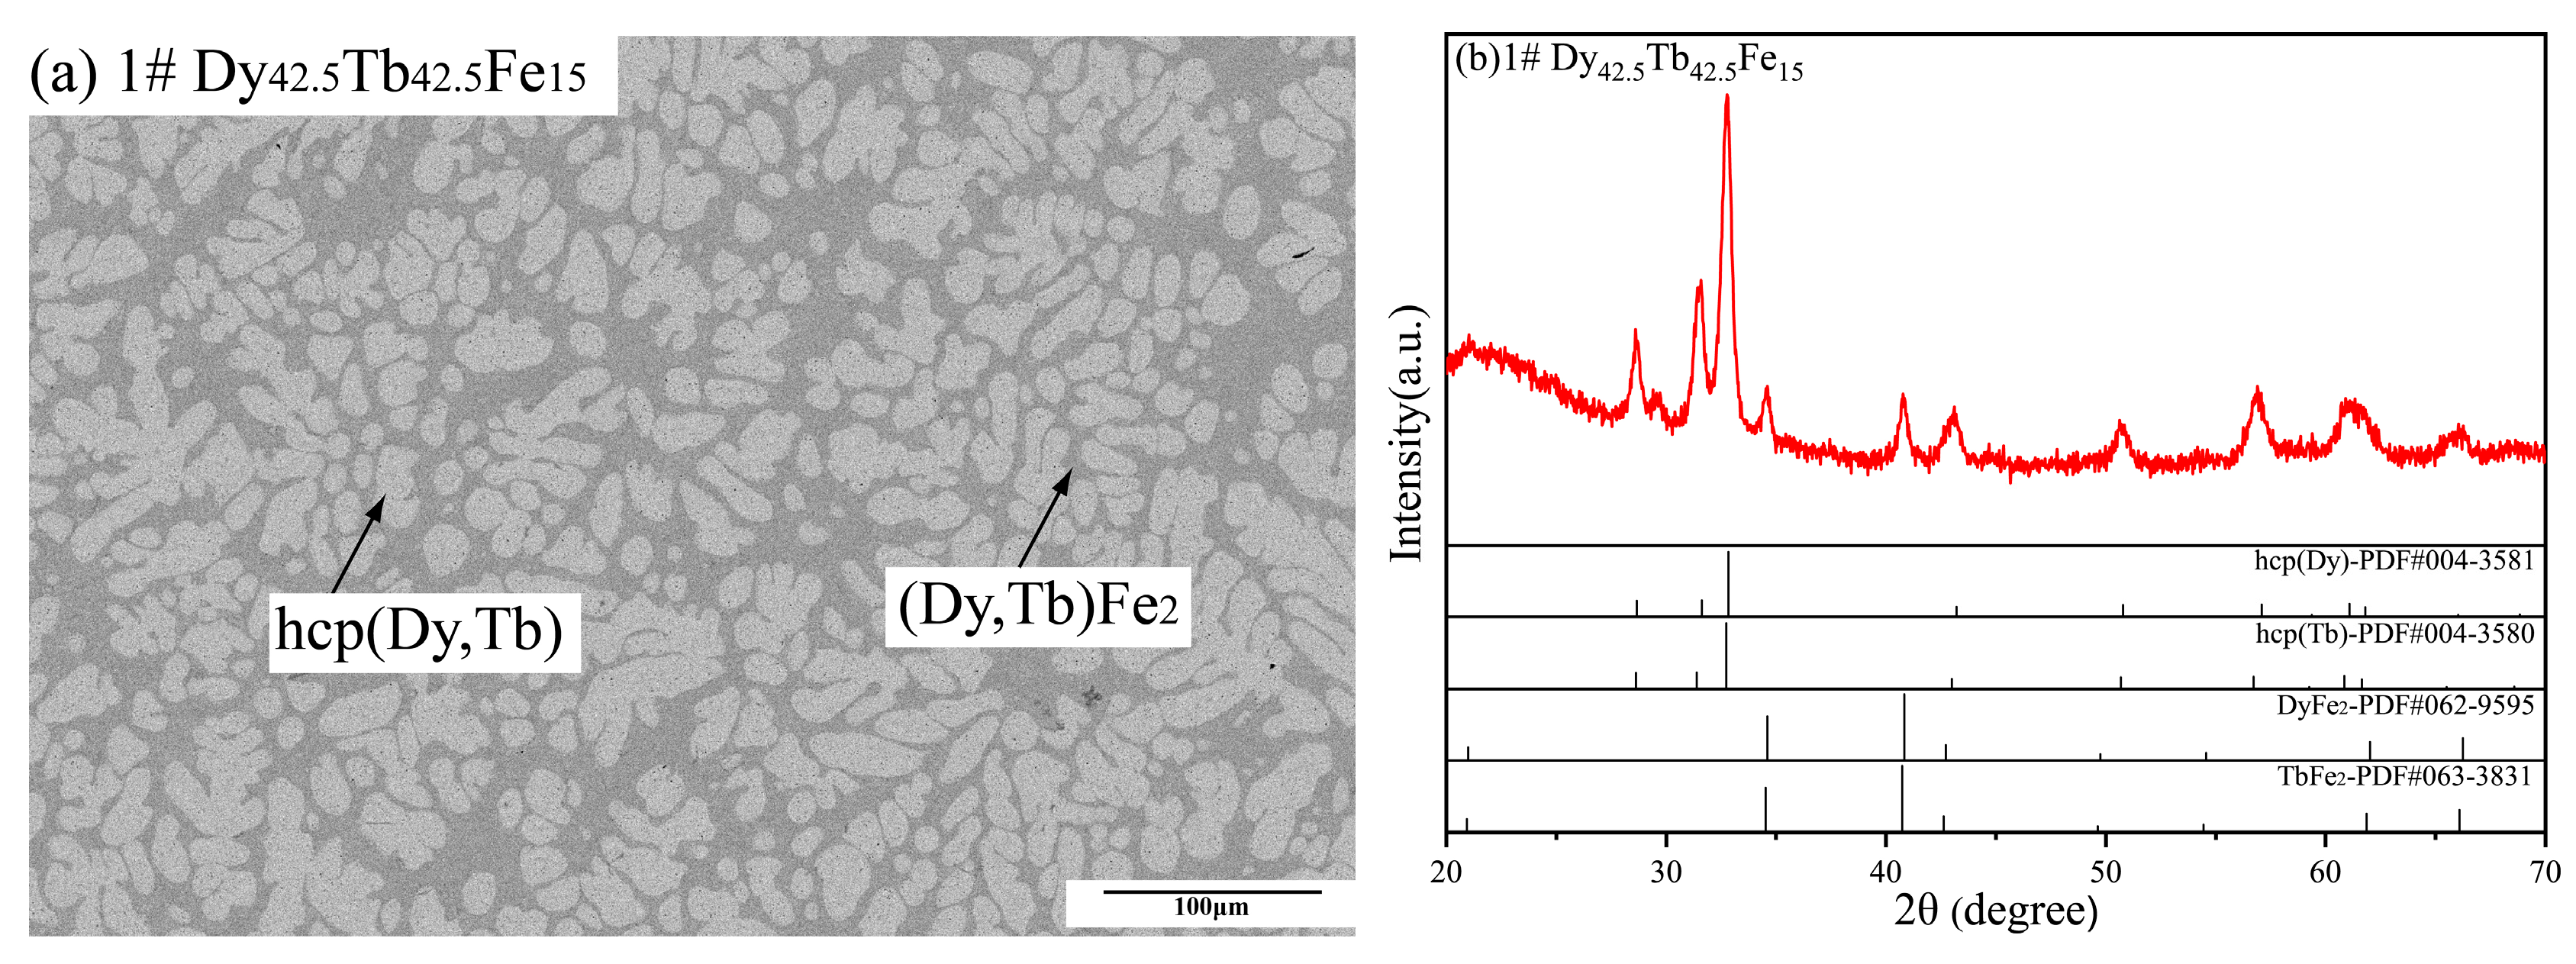
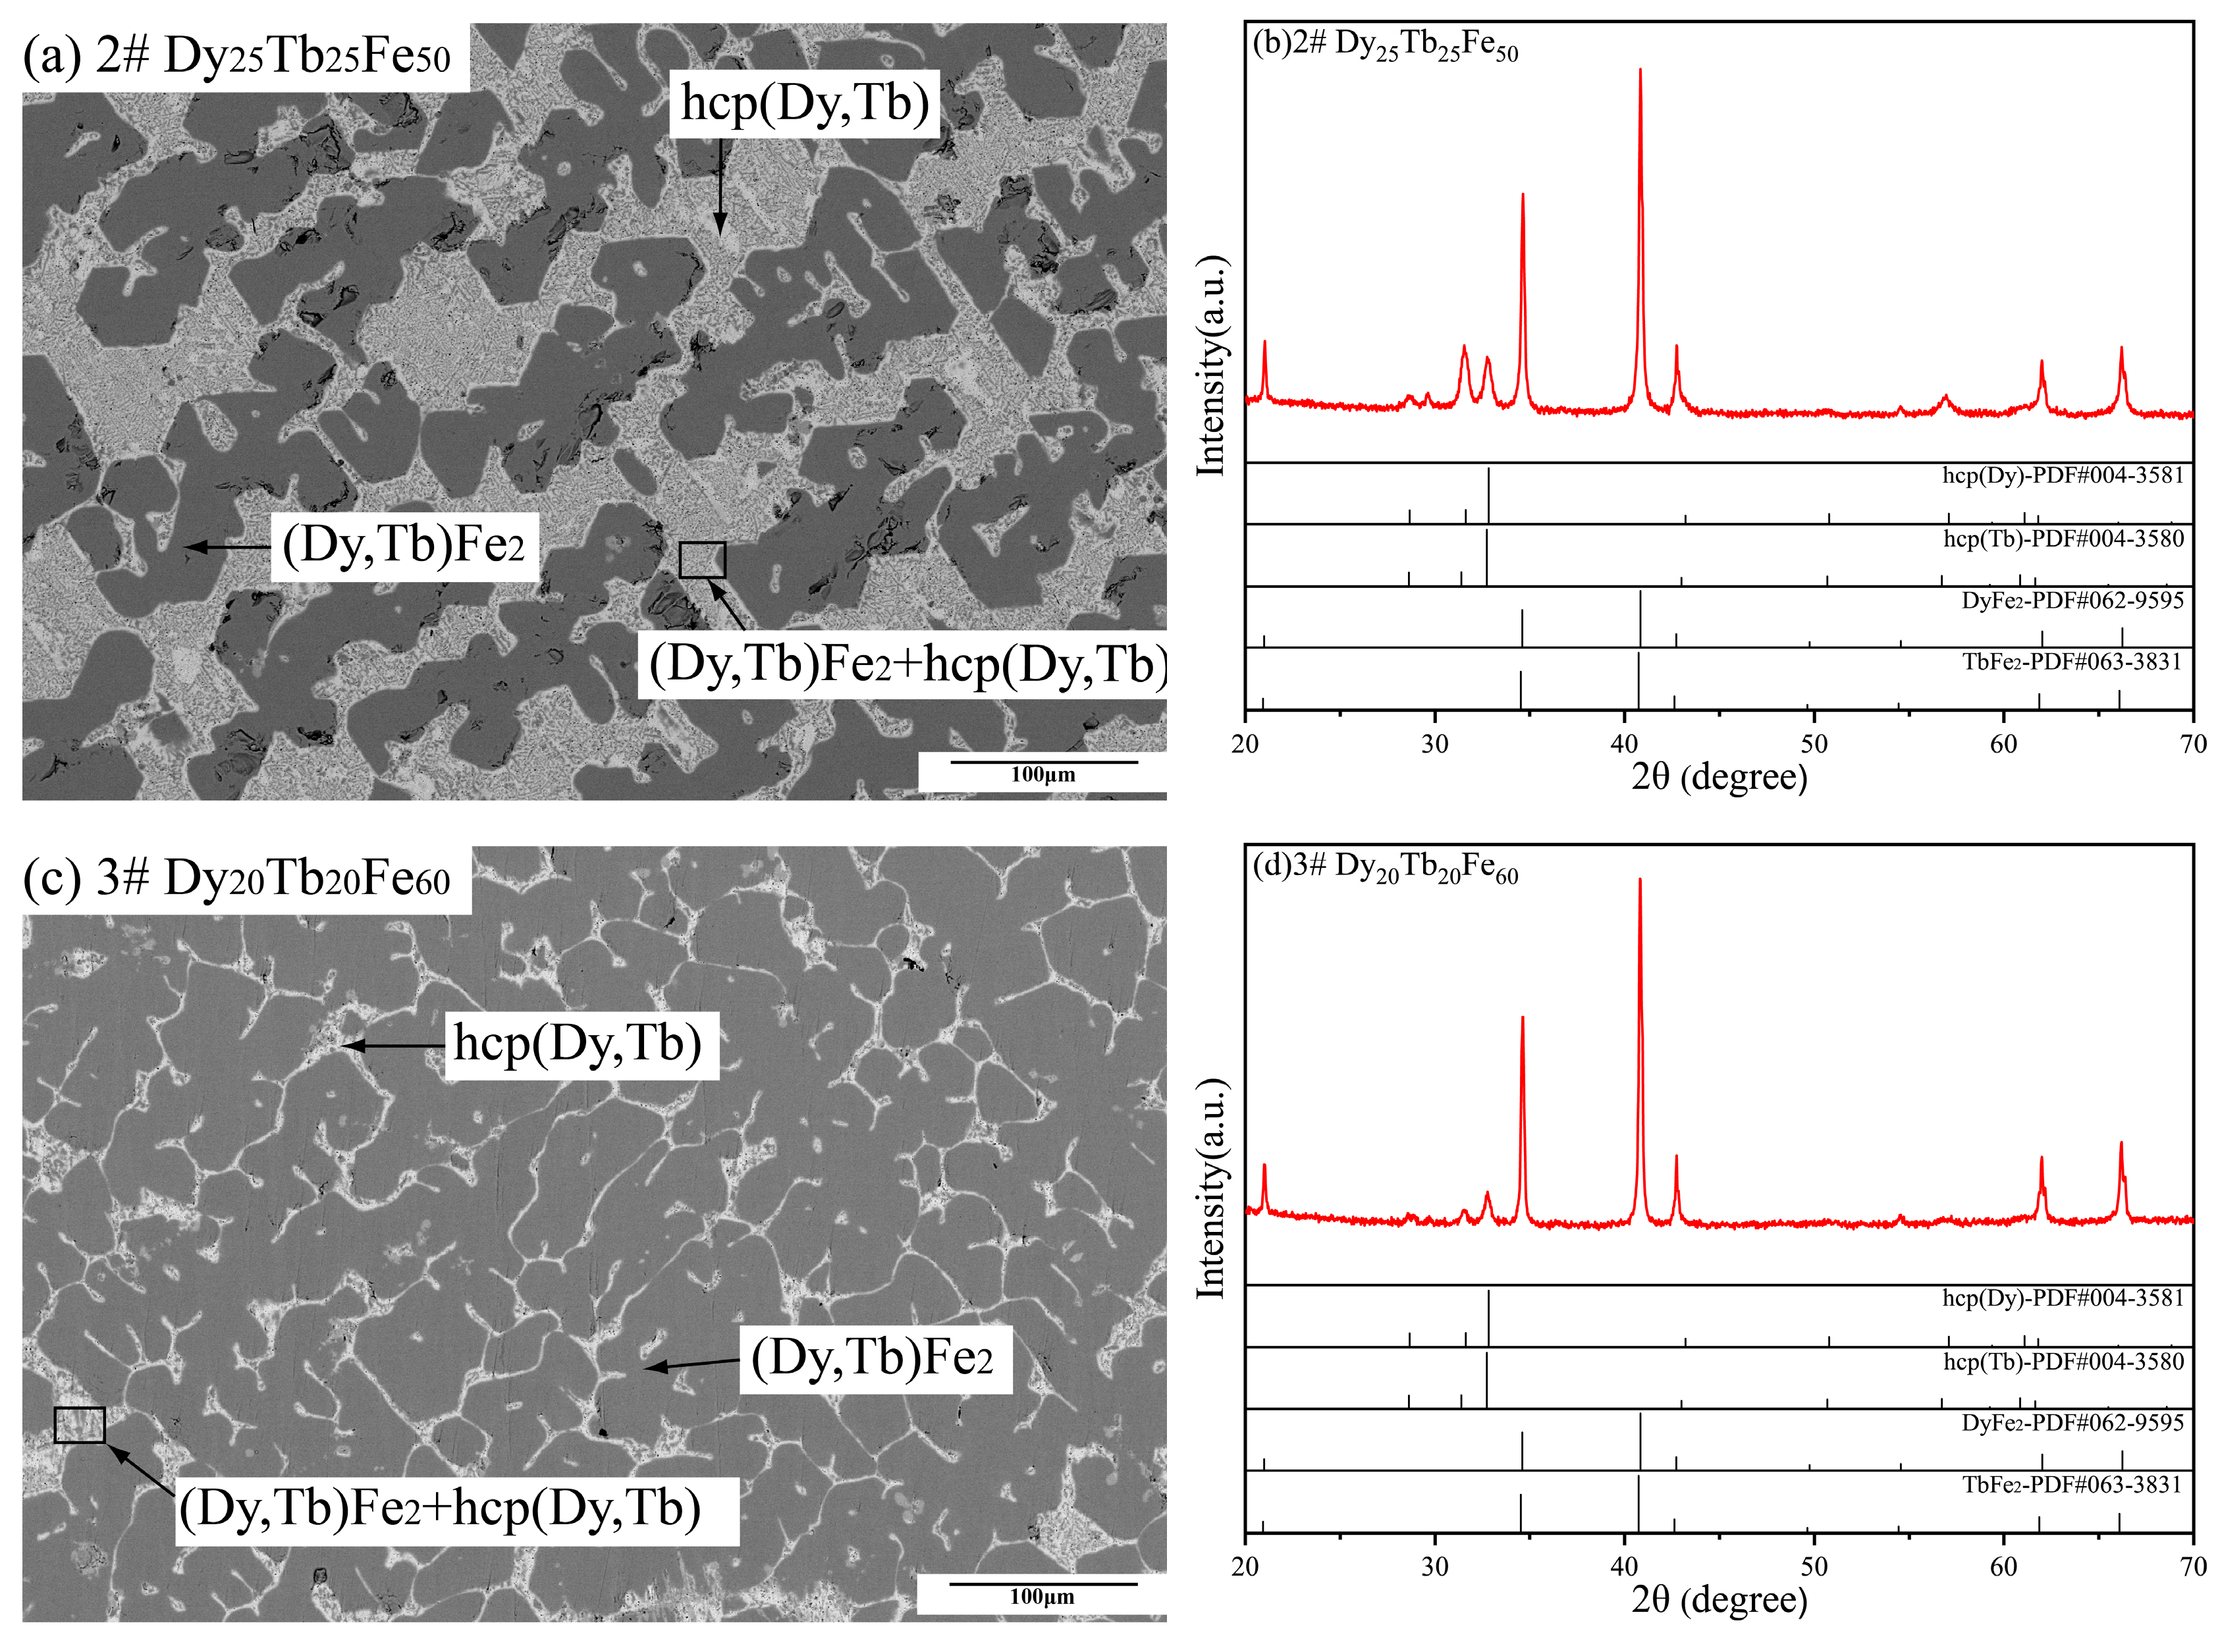
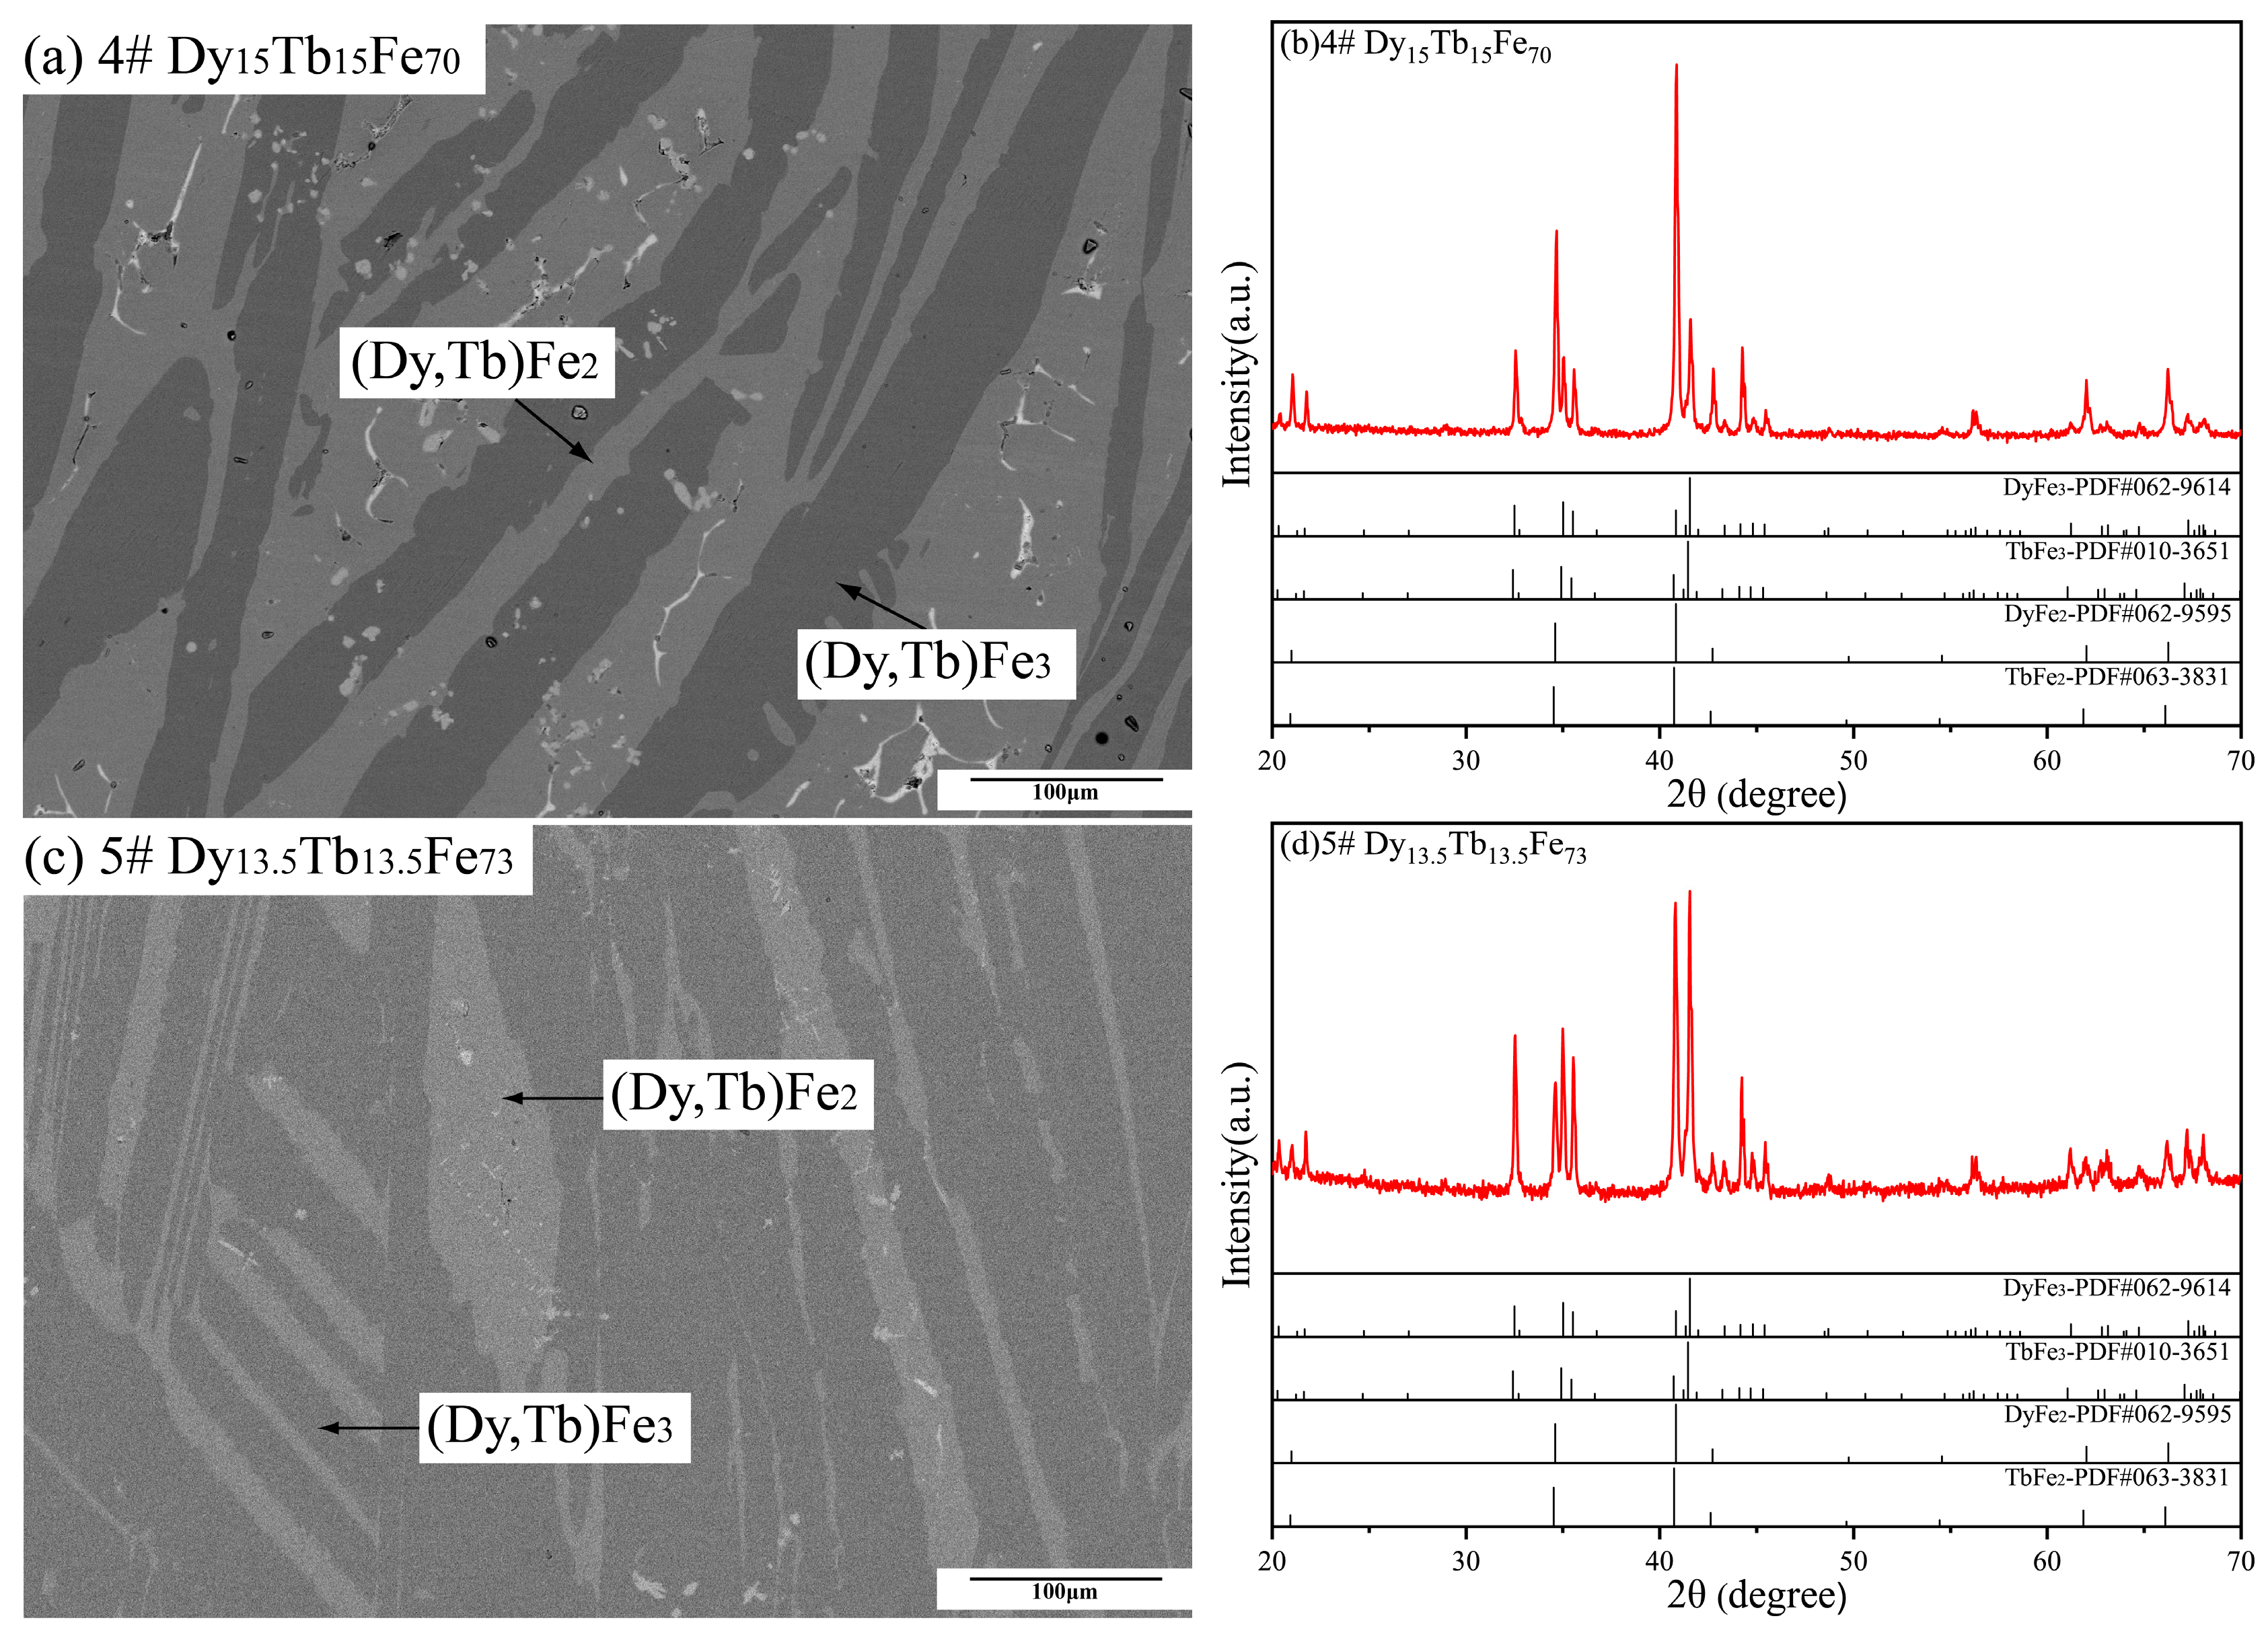
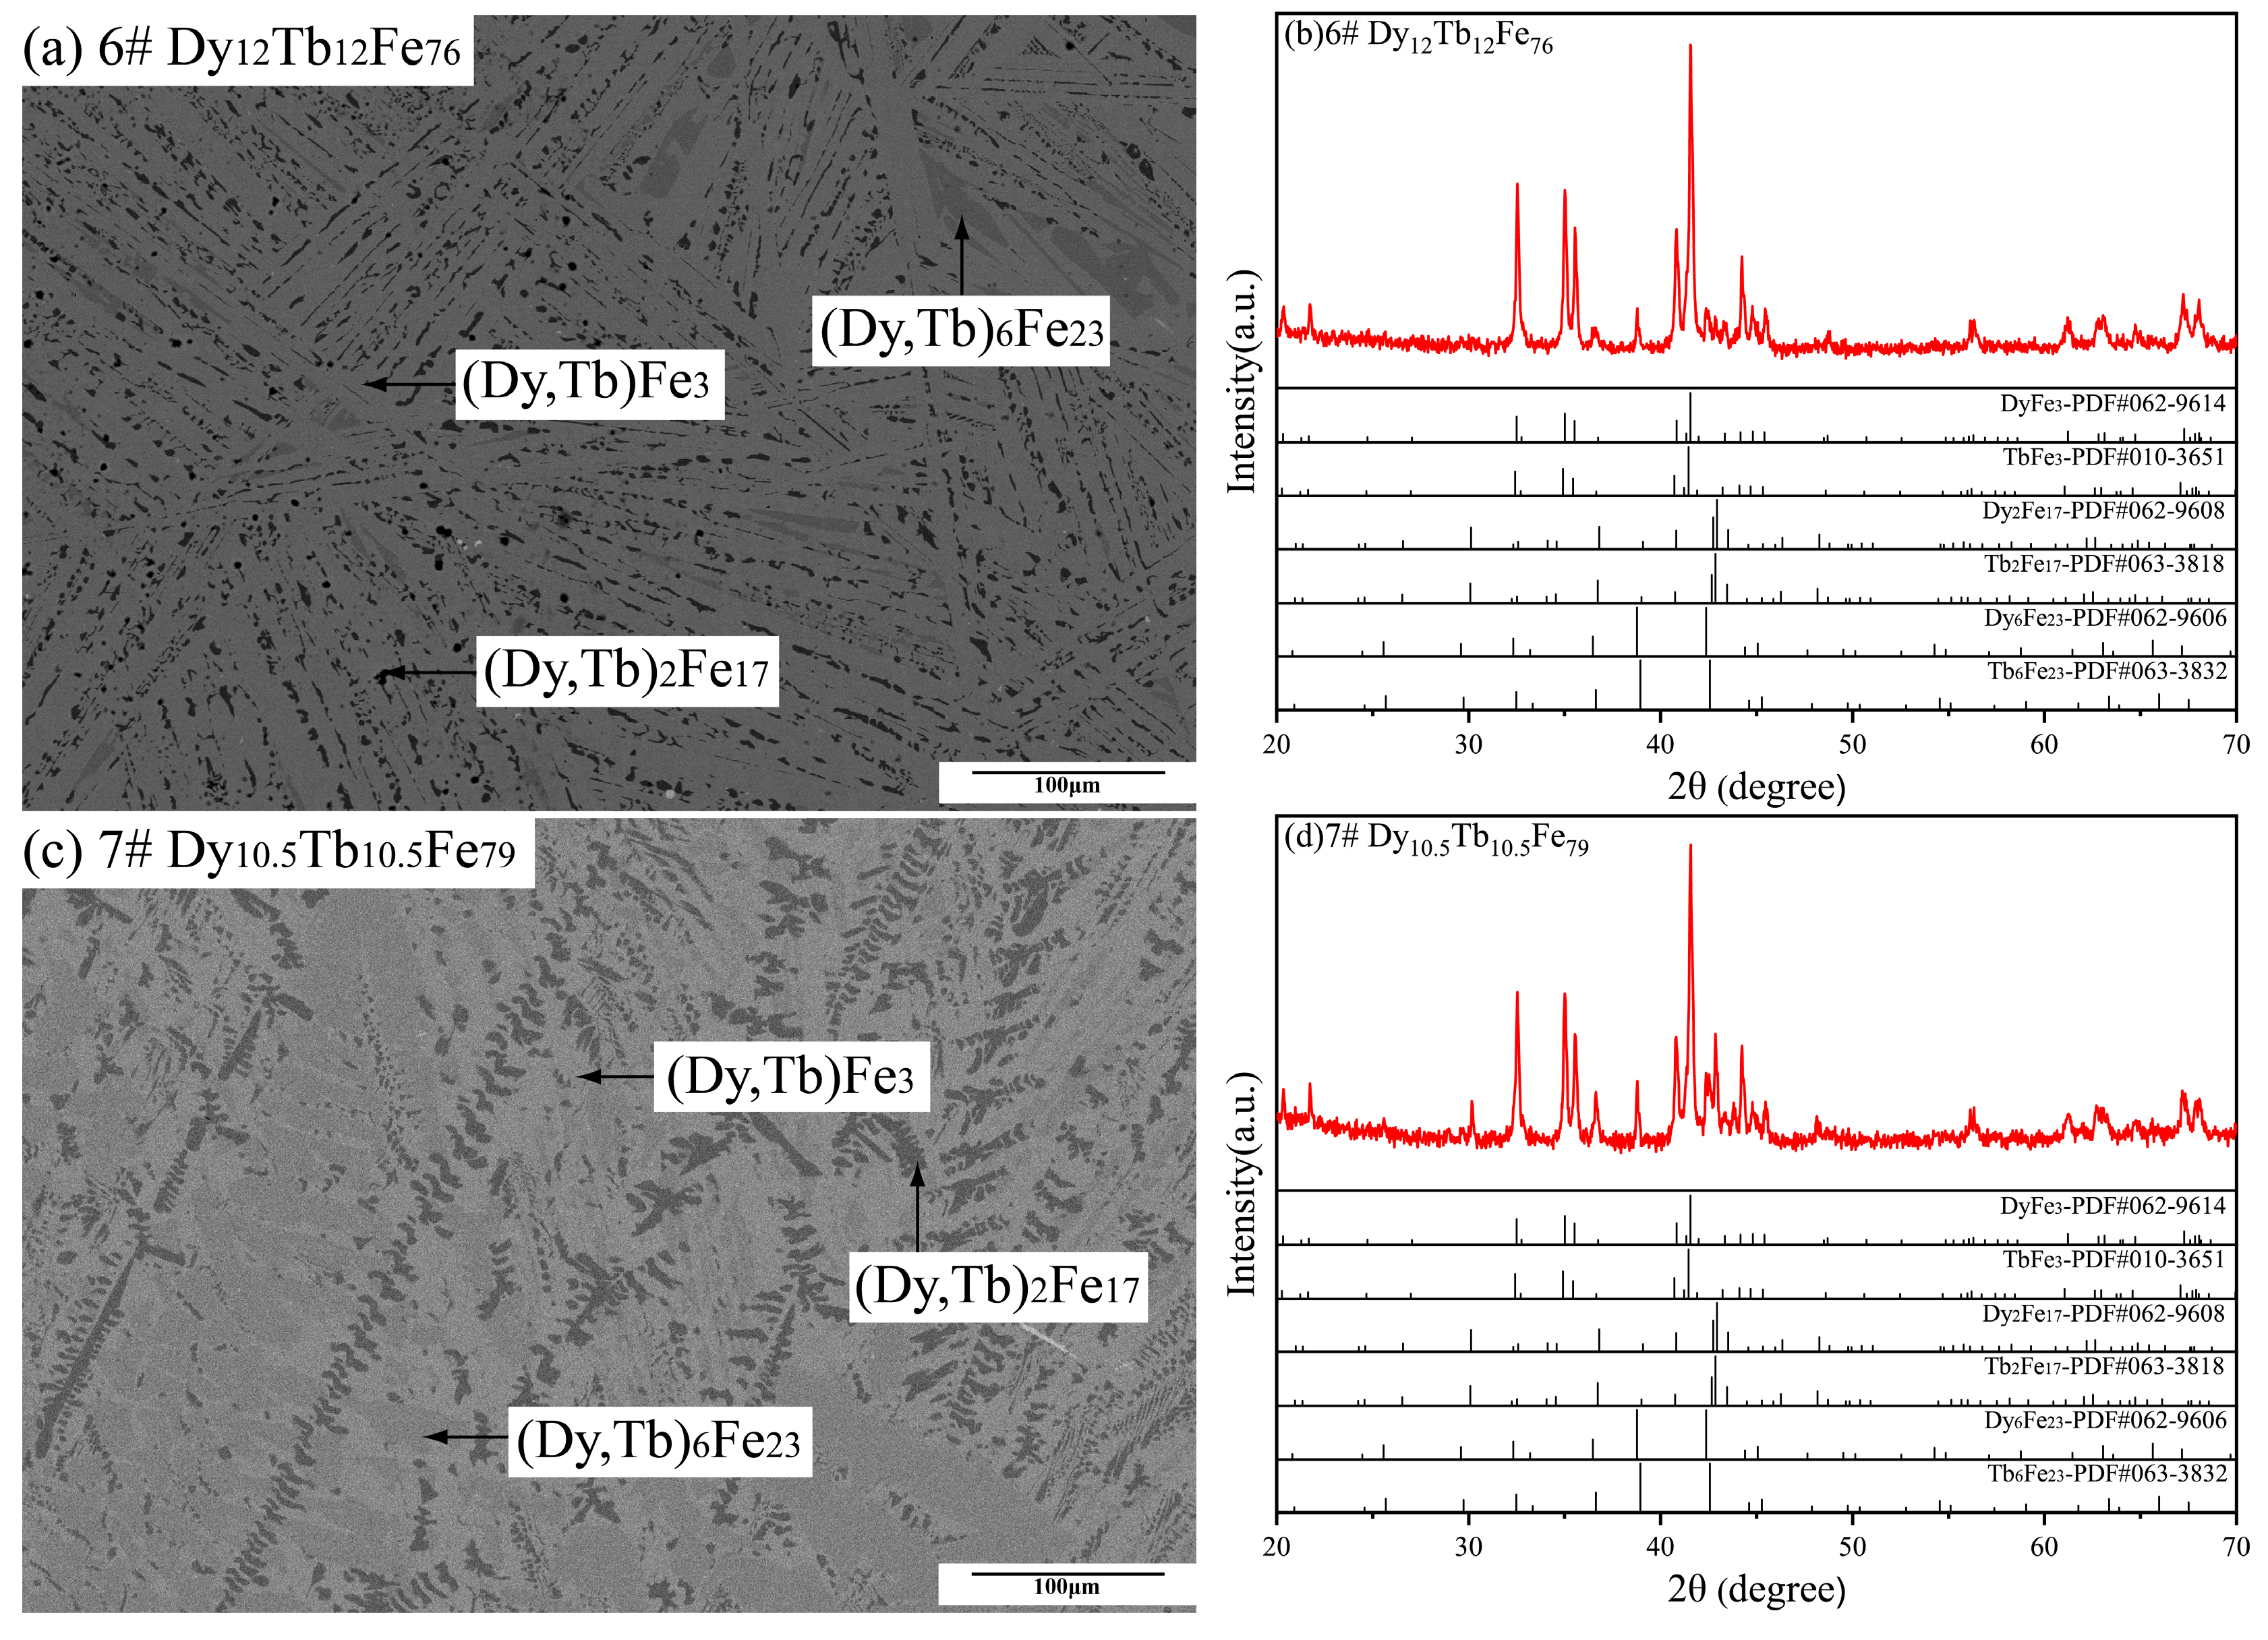
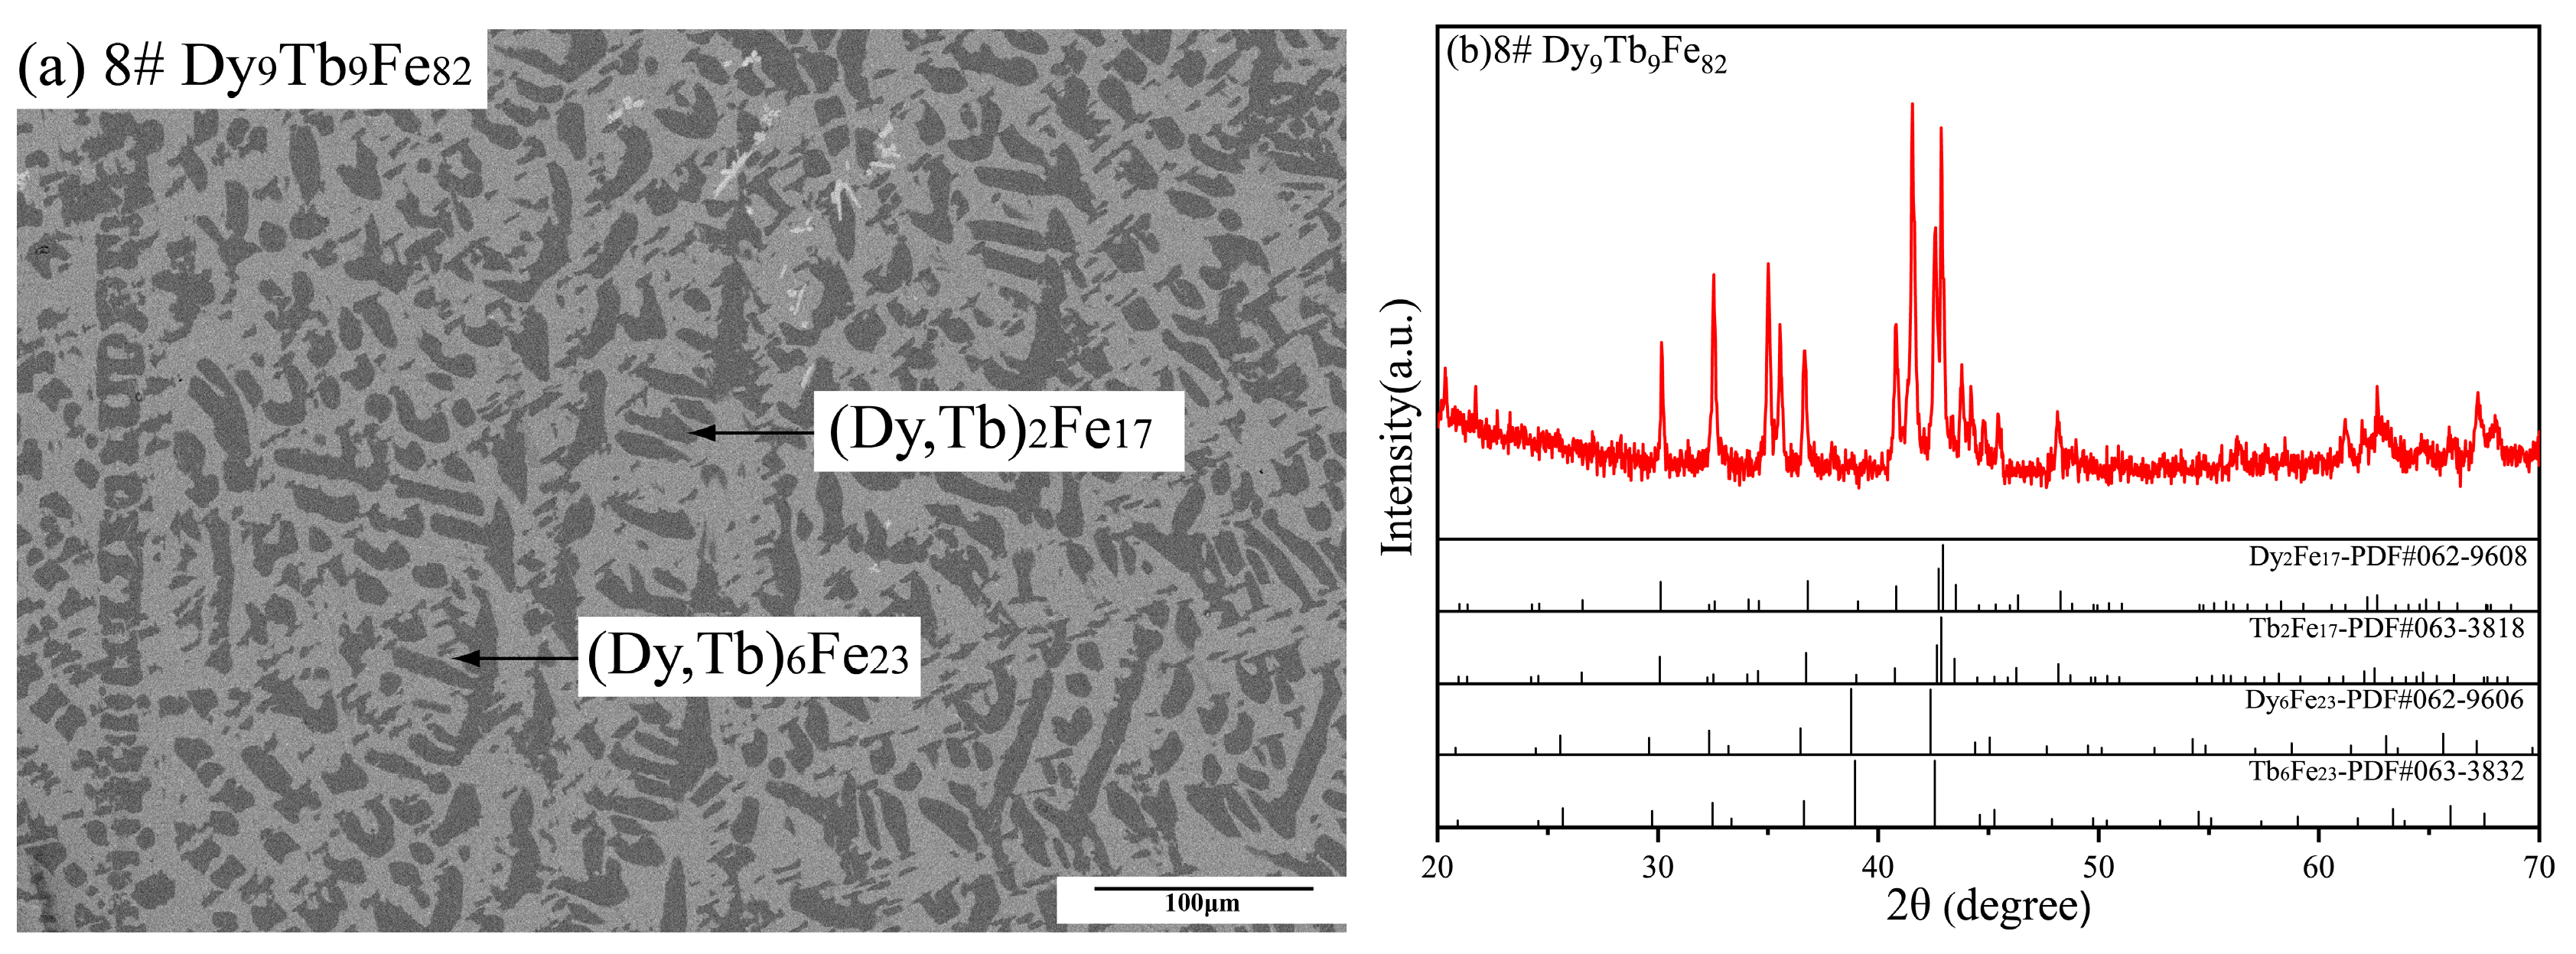
5.1. Solidification Microstructure
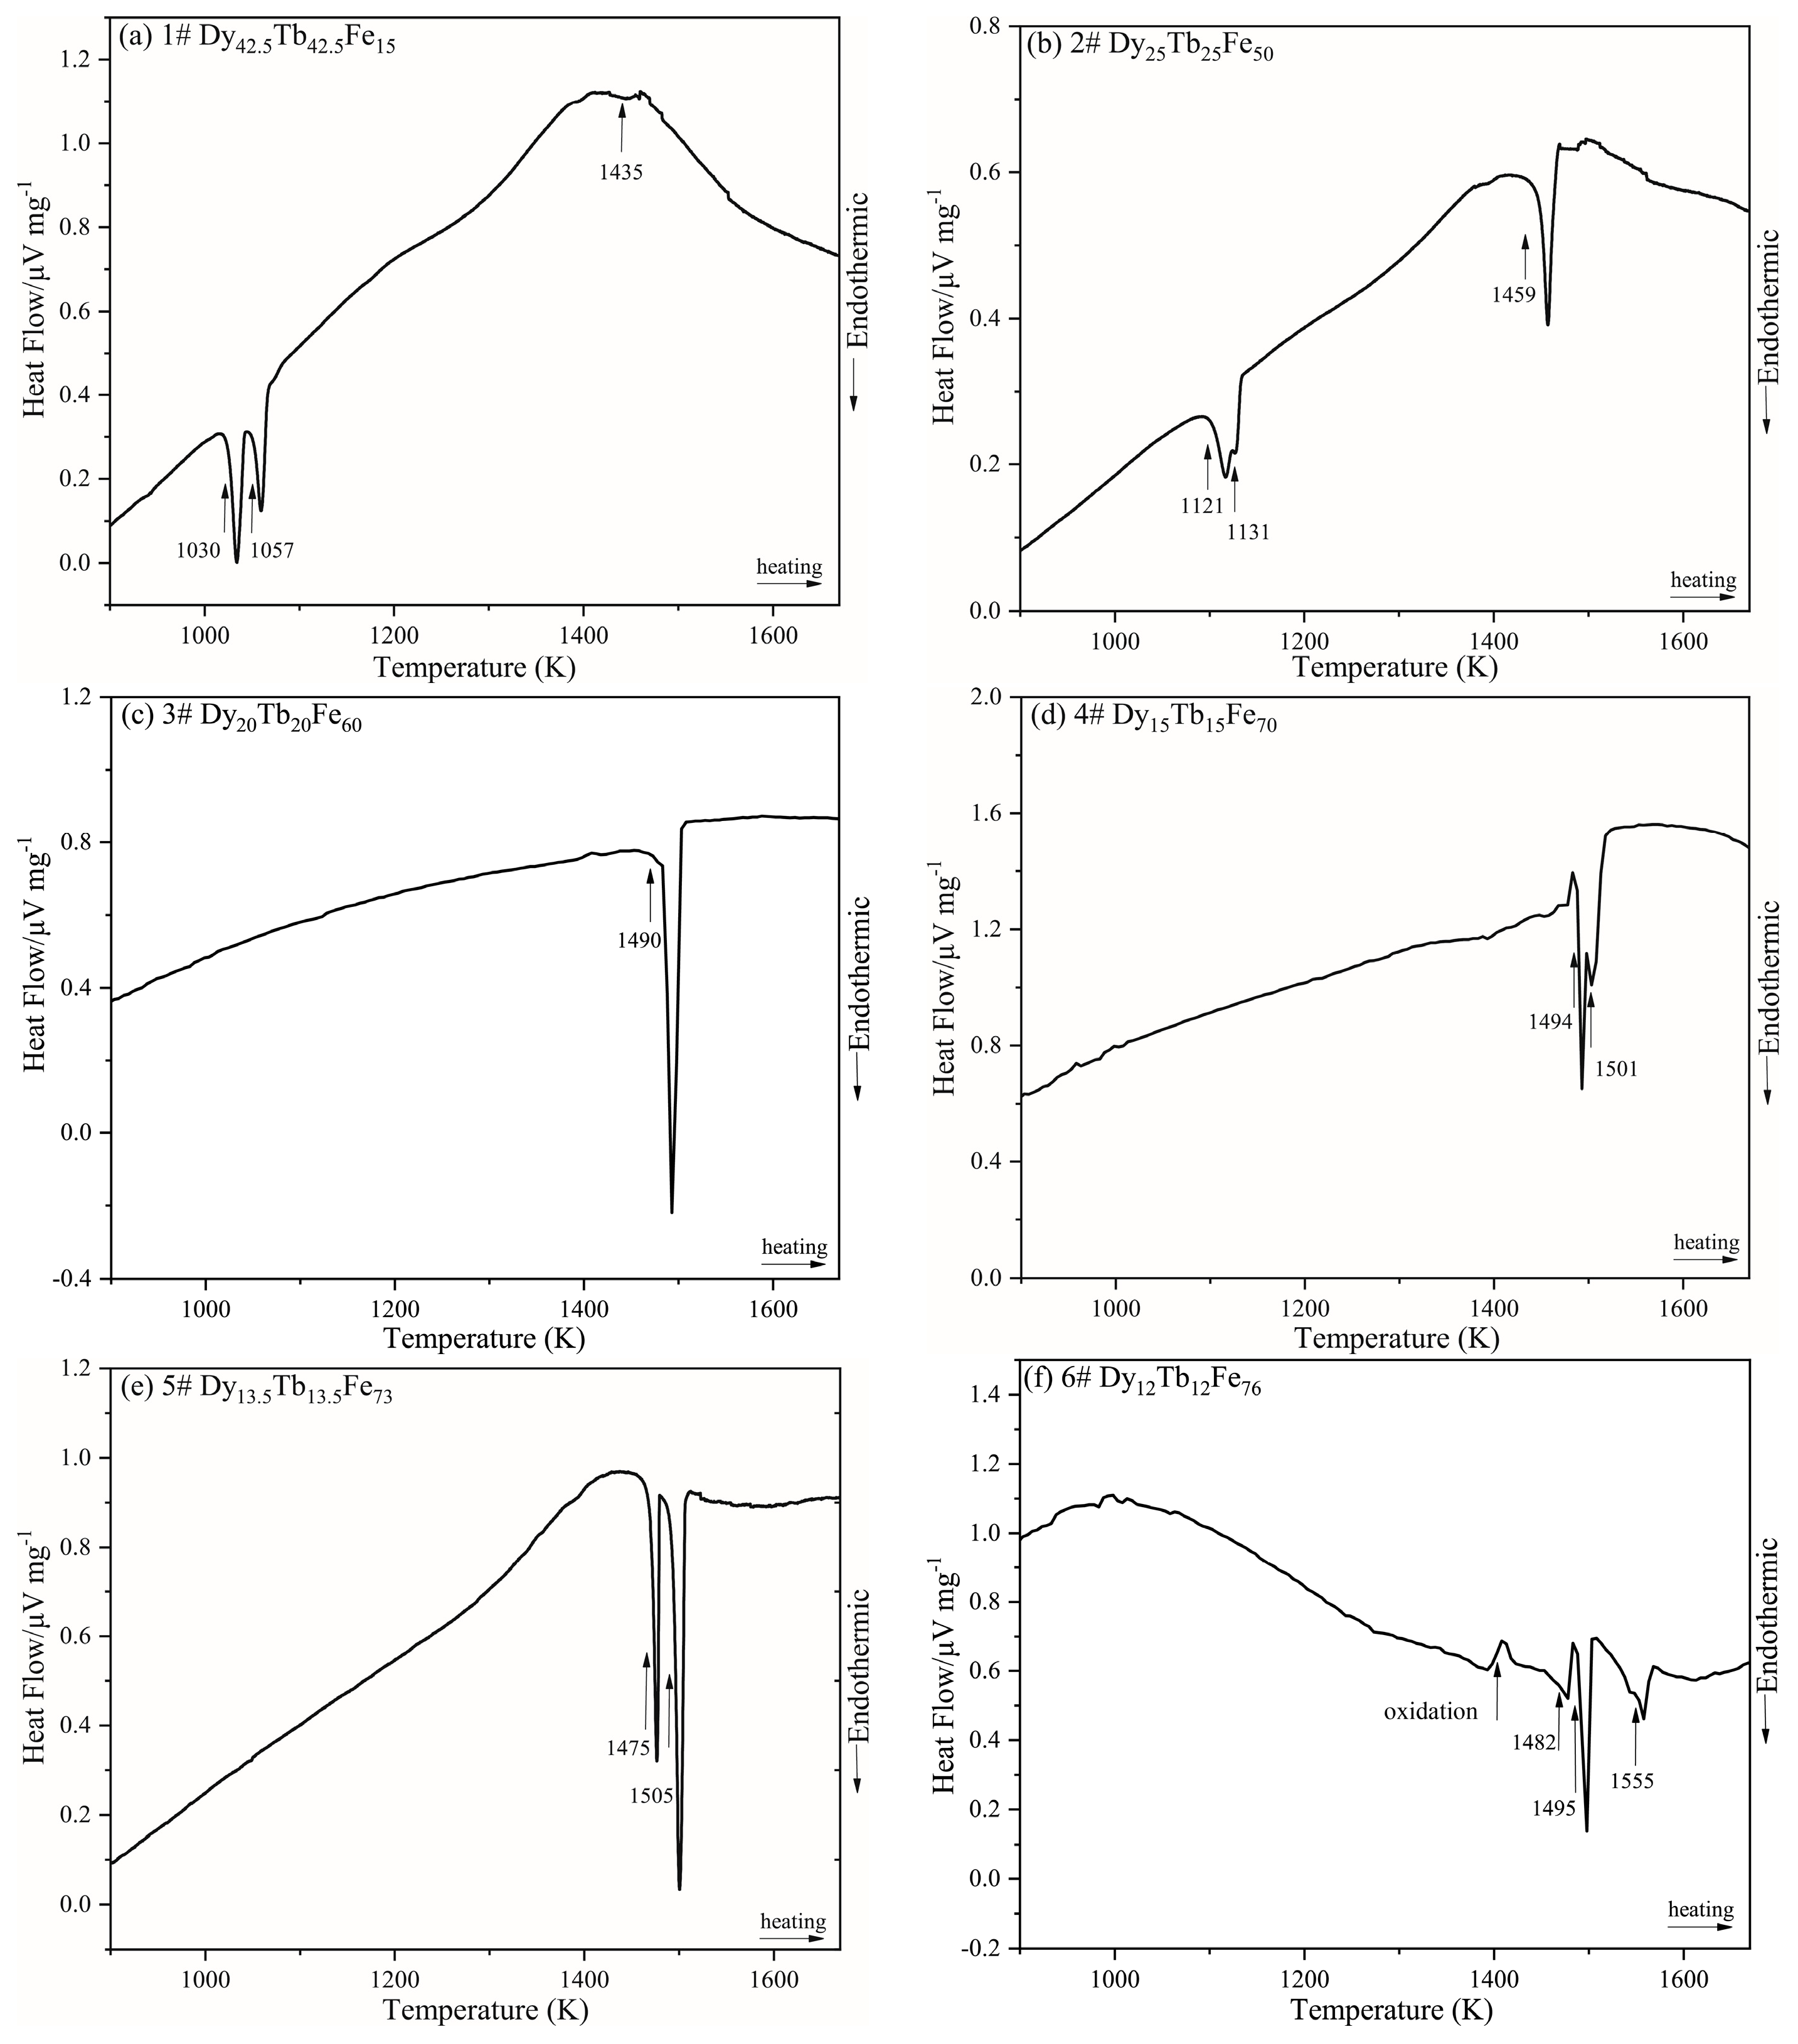
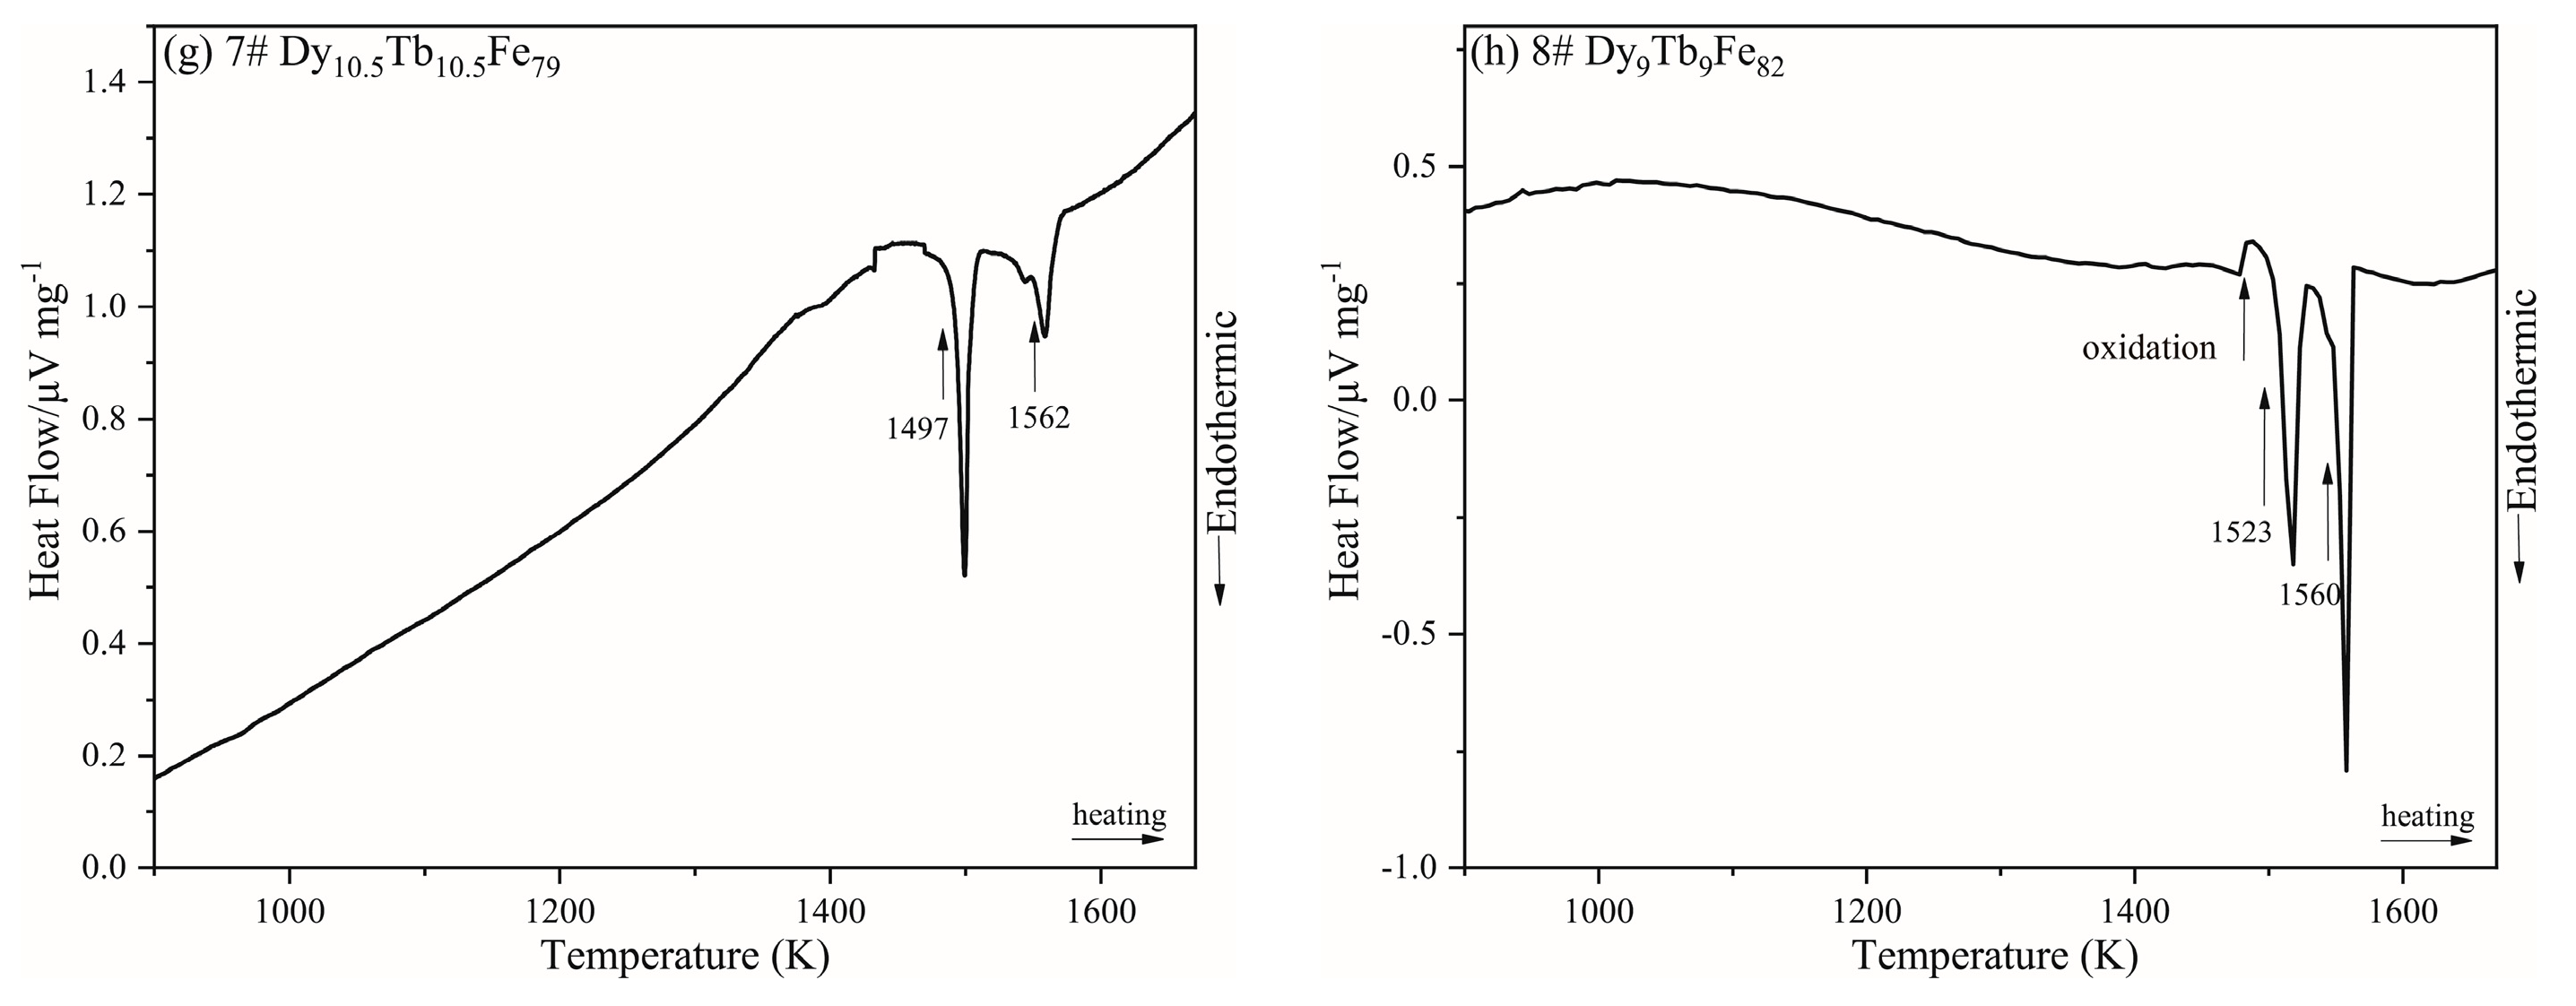
5.2. Phase Transition
5.3. Thermodynamic Calculation
6. Conclusions
- The phase transition temperatures and phase compositions of eight Dy-Tb-Fe alloy samples were determined. Based on the experimental results determined in this work and reported in the literature, the thermodynamic calculation of the Dy-Tb-Fe system was performed using the CALPHAD method. The calculated vertical section and liquidus projection are consistent with the experimental results.
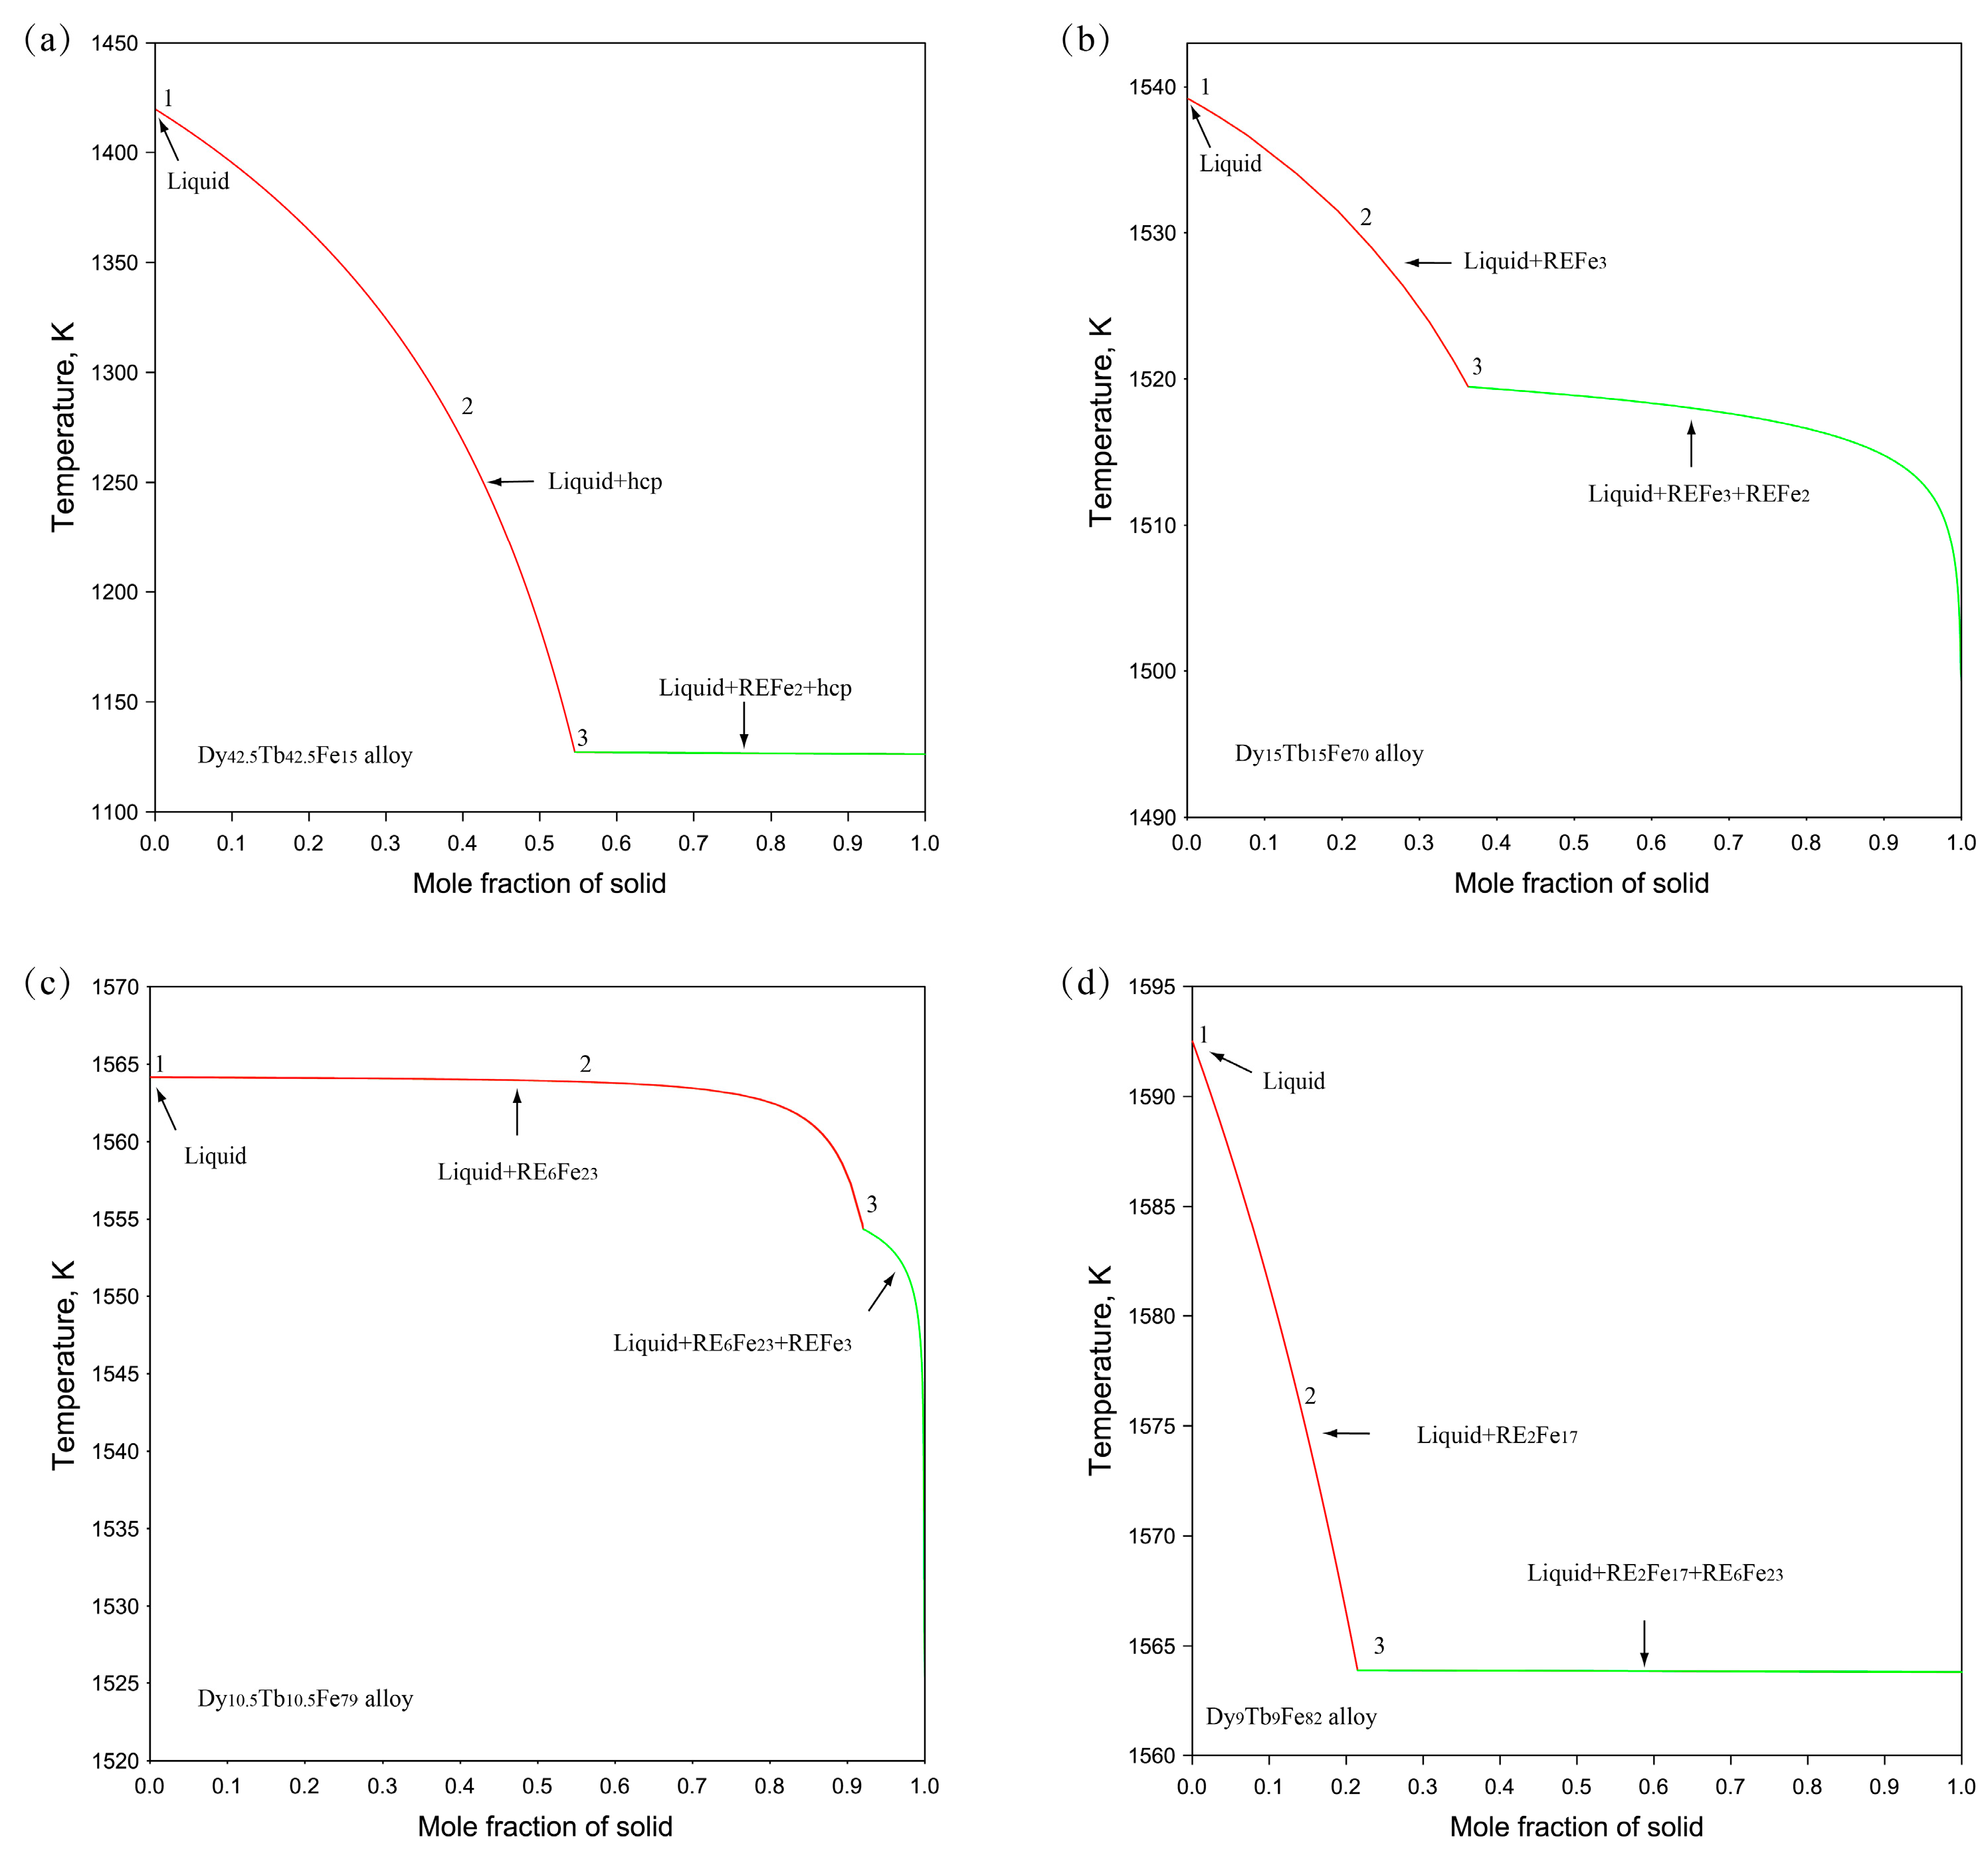
- The solidification behaviors of several Dy-Tb-Fe alloy samples were simulated by using the Gulliver–Scheil non-equilibrium model with the obtained thermodynamic parameters. The simulation results were compared with the solidification structure of the experimental samples, and they were in good agreement with the experimental results. This means that the thermodynamic parameters of the Dy-Tb-Fe system optimized in this work are reliable and will provide reference for the microstructure design of high-performance Nd-Dy-Tb-Fe-B magnets.
Author Contributions
Funding
Institutional Review Board Statement
Informed Consent Statement
Data Availability Statement
Acknowledgments
Conflicts of Interest
References
- Poudyal, N.; Liu, J.P. Advances in nanostructured permanent magnets research. J. Phys. D Appl. Phys. 2012, 46, 043001. [Google Scholar] [CrossRef]
- Coey, J.M.D. Perspective and prospects for rare earth permanent magnets. Engineering 2020, 6, 119–131. [Google Scholar] [CrossRef]
- Nakamura, H. The current and future status of rare earth permanent magnets. Scr. Mater. 2018, 154, 273–276. [Google Scholar] [CrossRef]
- Gutfleisch, O.; Willard, M.A.; Brück, E.; Chen, C.H.; Sankar, S.G.; Liu, J.P. Magnetic materials and devices for the 21st century: Stronger, lighter, and more energy efficient. Adv. Mater. 2011, 23, 821–842. [Google Scholar] [CrossRef]
- Sugimoto, S. Current status and recent topics of rare-earth permanent magnets. J. Phys. D Appl. Phys. 2011, 44, 064001. [Google Scholar] [CrossRef]
- Davies, B.E.; Mottram, R.S.; Harris, I.R. Recent developments in the sintering of NdFeB. Mater. Chem. Phys. 2001, 67, 272–281. [Google Scholar] [CrossRef]
- Li, W.F.; Ohkubo, T.; Hono, K.; Sagawa, M. The origin of coercivity decrease in fine grained Nd-Fe-B sintered magnets. J. Magn. Magn. Mater. 2009, 321, 1100–1105. [Google Scholar] [CrossRef]
- Li, J.; Sepehri-Amin, H.; Sasaki, T.; Ohkubo, T.; Hono, K. Most frequently asked questions about the coercivity of Nd-Fe-B permanent magnets. Sci. Technol. Adv. Mater. 2021, 22, 386–403. [Google Scholar] [CrossRef] [PubMed]
- Chen, F.; Zhang, T.; Zhao, Y.; Wang, X.; Jiang, C.; Chen, J.; Zhao, W. A novel strategy to design and fabricate Nd-Fe-B magnets. J. Alloys Compd. 2021, 867, 159102. [Google Scholar] [CrossRef]
- Trench, A.; Sykes, J.P. Rare earth permanent magnets and their place in the future economy. Engineering 2020, 6, 115–118. [Google Scholar] [CrossRef]
- Löewe, K.; Brombacher, C.; Katter, M.; Gutfleisch, O. Temperature-dependent Dy diffusion processes in Nd-Fe-B permanent magnets. Acta Mater. 2015, 83, 248–255. [Google Scholar] [CrossRef]
- Pan, M.; Zhang, P.; Li, X.; Ge, H.; Wu, Q.; Jiao, Z.; Liu, T. Effect of Terbium addition on the coercivity of the sintered NdFeB magnets. J. Rare Earths 2010, 28, 399–402. [Google Scholar] [CrossRef]
- Li, W.; Yang, L.; Zhang, Q.; Xu, C.; Zhu, Q.; Song, Z.; Zheng, B.; Hu, F.; Jiang, J. Effect of the grain boundary Tb/Dy diffused microstructure on the magnetic properties of sintered Nd-Fe-B magnets. J. Magn. Magn. Mater. 2020, 502, 166491. [Google Scholar] [CrossRef]
- Divinski, S.V.; Bokstein, B.S. Recent advances and unsolved problems of grain boundary diffusion. Defect Diffus. Forum 2011, 1212, 309–310. [Google Scholar] [CrossRef]
- Chen, F. Recent progress of grain boundary diffusion process of Nd-Fe-B magnets. J. Magn. Magn. Mater. 2020, 514, 167227. [Google Scholar] [CrossRef]
- Li, W.; Zhang, Q.; Zhu, Q.; Xiao, S.; Xu, C.; Yang, L.; Zheng, B.; Mao, S.; Song, Z. Formation of anti-shell/core structure of heavy rare earth elements (Tb, Dy) in sintered Nd-Fe-B magnet after grain boundary diffusion process. Scr. Mater. 2019, 163, 40–43. [Google Scholar] [CrossRef]
- Liu, Z.; He, J.; Ramanujan, R.V. Significant progress of grain boundary diffusion process for cost-effective rare earth permanent magnets: A review. Mater. Des. 2021, 209, 110004. [Google Scholar] [CrossRef]
- Luo, Q.; Guo, Y.; Liu, B.; Feng, Y.; Zhang, J.; Li, Q.; Chou, K. Thermodynamics and kinetics of phase transformation in rare earth–magnesium alloys: A critical review. J. Mater. Sci. Technol. 2020, 44, 171–190. [Google Scholar] [CrossRef]
- Schaffnit, P.; Stallybrass, C.; Konrad, J.; Stein, F.; Weinberg, M. A Scheil–Gulliver model dedicated to the solidification of steel. Calphad 2015, 48, 184–188. [Google Scholar] [CrossRef]
- Chen, T.L.; Wang, J.; Rong, M.H.; Rao, G.H.; Zhou, H.Y. Experimental investigation and thermodynamic assessment of the Fe-Pr and Fe-Nd binary systems. Calphad 2016, 55, 270–280. [Google Scholar] [CrossRef]
- Chen, X.L.; Wang, J.; Chen, T.L.; Lin, X.D.; Rong, M.H.; Rao, G.H.; Zhou, H.Y. Thermodynamic reassessment of the Fe-Gd and Fe-Sm binary systems. Calphad 2017, 58, 151–159. [Google Scholar] [CrossRef]
- Rong, M.H.; Chen, X.L.; Wang, J.; Rao, G.H.; Zhou, H.Y. Thermodynamic re-assessment of the Fe-Dy and Fe-Tb binary systems. Calphad 2017, 59, 154–163. [Google Scholar] [CrossRef]
- Xu, L.; Wang, J.; Li, S.; Chen, X.L.; Rong, M.H.; Rao, G.H.; Zhou, H.Y. Thermodynamic reassessment of the Fe-Tm and Fe-Ho binary systems. Calphad 2019, 66, 101646. [Google Scholar] [CrossRef]
- Ye, H.J.; Rong, M.H.; Yao, Q.R.; Wang, J.; Chen, Q.; Rao, G.H.; Zhou, H.Y. Assessment of phase equilibria and thermodynamic properties in the Fe-RE (RE = rare earth metals) binary systems. J. Mater. Inform. 2023, 3, 14. [Google Scholar]
- Li, S.; Rong, M.H.; Xu, L.; Wei, Q.; Wang, J.; Rao, G.H.; Zhou, H.Y. Thermodynamic assessment of the RE-B (RE = Ce, Dy, Lu) binary systems. Calphad 2020, 68, 101740. [Google Scholar] [CrossRef]
- Wei, Q.; Rong, M.H.; Li, S.; Su, D.; Yao, Q.R.; Wang, J.; Rao, G.H.; Zhou, H.Y. Thermodynamic assessment of the RE-B (RE = Ho, Er, Tm) binary systems. Calphad 2020, 70, 101796. [Google Scholar] [CrossRef]
- Wei, Q.; Rong, M.H.; Li, S.; Su, D.; Rao, Q.R.; Wang, J.; Chen, Q.; Rao, G.H.; Zhou, H.Y. Thermodynamic calculation of phase equilibria of rare earth metals with boron binary systems. Int. J. Mater. Res. 2022, 113, 400–418. [Google Scholar] [CrossRef]
- Yang, K.C.; Wang, J.; Yao, Q.R.; Lu, Z.; Rong, M.H.; Zhou, H.Y.; Rao, G.H. Phase diagrams of permanent magnet alloys: Binary rare earth alloy systems. J. Rare Earths 2019, 37, 1040–1046. [Google Scholar] [CrossRef]
- Su, D.; Yang, K.C.; Rong, M.H.; Liu, P.P.; Yao, Q.R.; Wang, J.; Chen, Q.; Rao, G.H.; Zhou, H.Y. Phase transition and solidification microstructure of Ce-La-Fe and Ce-Nd-Fe alloys: Experimental investigation and thermodynamic calculation. Calphad 2023, 80, 102506. [Google Scholar] [CrossRef]
- Su, D.; Rong, M.H.; Yang, K.C.; Yao, Q.R.; Wang, J.; Rao, G.H.; Zhou, H.Y. Thermodynamic calculation and solidification behavior of the La-Pr-Fe and Ce-Pr-Fe ternary systems. Calphad 2021, 74, 102285. [Google Scholar] [CrossRef]
- Chen, T.L.; Wang, J.; Guo, C.P.; Li, C.R.; Du, Z.M.; Rao, G.H.; Zhou, H.Y. Thermodynamic description of the Nd-Fe-B ternary system. Calphad 2019, 66, 101627. [Google Scholar] [CrossRef]
- Landin, S.; Ågren, J. Thermodynamic assessment of Fe-Tb and Fe-Dy phase diagrams and prediction of Fe-Tb-Dy phase diagram. J. Alloys Compd. 1994, 207, 449–453. [Google Scholar] [CrossRef]
- Gschneidner, K.A.; Calderwood, F.W. Use of systematics for the evaluation of rare-earth phase diagrams and crystallographic data. Bull. Alloy Phase Diagr. 1983, 4, 129–131. [Google Scholar] [CrossRef]
- Gschneidner, K.A.; Calderwood, F.W. Intra rare earth binary alloys: Phase relationships, lattice parameters and systematics. Handb. Phys. Chem. Rare Earths 1986, 8, 1–161. [Google Scholar] [CrossRef]
- Moffatt, W.G. Binary Phase Diagrams Handbook; General Electric Comp: Schenectady, NY, USA, 1987. [Google Scholar]
- Raghavan, V. Dy-Fe-Tb (dysprosium-iron-terbium). J. Phase Equilibria Diffus. 2004, 25, 169. [Google Scholar] [CrossRef]
- Westwood, P.; Abell, J.S.; Pitman, K.C. Phase relationships in the Tb-Dy-Fe ternary system. J. Appl. Phys. 1990, 67, 4998–5000. [Google Scholar] [CrossRef]
- Abell, J.S.; Lord, D.G. Microstructural studies of ternary rare earth-iron alloys. J. Less Common Met. 1986, 126, 107–112. [Google Scholar] [CrossRef]
- Dinsdale, A.T. SGTE data for pure elements. Calphad 1991, 15, 317–425. [Google Scholar] [CrossRef]
- Van der Goot, A.S.; Buschow, K.H.J. The dysprosium-iron system: Structural and magnetic properties of dysprosium-iron compounds. J. Less-Common Met. 1970, 21, 151–157. [Google Scholar] [CrossRef]
- Okamoto, H. Dy-Fe (dysprosium-iron). J. Phase Equilibria 1996, 17, 80–81. [Google Scholar] [CrossRef]
- Dariel, M.P.; Holthuis, J.T.; Pickus, M.R. The terbium-iron phase diagram. J. Less-Common Met. 1976, 45, 91–101. [Google Scholar] [CrossRef] [Green Version]


| Nominal Composition (at.%) | SEM-EDS Results (at.%) | Identified Phases by EDS and XRD | Phase Transitions (K) | Solidification Process | ||
|---|---|---|---|---|---|---|
| Dy | Tb | Fe | ||||
| 1#-Dy42.5Tb42.5Fe15 | 46.77 ± 0.2 | 47.74 ± 0.6 | 5.49 ± 0.4 | hcp (Dy, Tb) | 1030, 1057, 1435 | L → hcp (Dy, Tb) L → hcp (Dy, Tb) + (Dy, Tb) Fe2 |
| 17.88 ± 0.6 | 13.91 ± 0.2 | 68.21 ± 0.4 | (Dy, Tb) Fe2 | |||
| 2#-Dy25Tb25Fe50 | 17.51 ± 0.7 | 15.46 ± 0.3 | 67.03 ± 0.6 | (Dy, Tb) Fe2 | 1121, 1131, 1459 | L → (Dy, Tb) Fe2 L → hcp (Dy, Tb) + (Dy, Tb) Fe2 |
| 40.64 ± 0.2 | 52.09 ± 0.1 | 7.27 ± 0.2 | hcp (Dy, Tb) | |||
| 3#-Dy20Tb20Fe60 | 17.33 ± 0.7 | 15.96 ± 0.1 | 66.71 ± 0.8 | (Dy, Tb) Fe2 | 1490 | |
| 37.29 ± 0.4 | 55.31 ± 0.8 | 7.40 ± 1.0 | hcp (Dy, Tb) | |||
| 4#-Dy15Tb15Fe70 | 11.45 ± 0.6 | 11.81 ± 0.5 | 76.74 ± 0.6 | (Dy, Tb) Fe3 | 1494, 1501 | L → (Dy, Tb) Fe3 L → (Dy, Tb) Fe2 + (Dy, Tb) Fe3 |
| 14.57 ± 0.1 | 17.95 ± 0.1 | 67.48 ± 0.1 | (Dy, Tb) Fe2 | |||
| 5#-Dy13.5Tb13.5Fe73 | 10.34 ± 0.3 | 12.91 ± 0.2 | 76.75 ± 0.1 | (Dy, Tb) Fe3 | 1475, 1505 | |
| 13.07 ± 0.3 | 17.41 ± 0.3 | 69.52 ± 0.6 | (Dy, Tb) Fe2 | |||
| 6#-Dy12Tb12Fe76 | 3.96 ± 0.3 | 6.37 ± 0.5 | 89.67 ± 0.4 | (Dy, Tb)2 Fe17 | 1482, 1495, 1555 | L → (Dy, Tb)6 Fe23 L→ (Dy, Tb) Fe3 + (Dy, Tb)6 Fe23 |
| 9.05 ± 0.1 | 11.73 ± 0.3 | 79.22 ± 0.3 | (Dy, Tb)6 Fe23 | |||
| 11.01 ± 0.2 | 12.95 ± 0.3 | 76.04 ± 0.4 | (Dy, Tb) Fe3 | |||
| 7#-Dy10.5Tb10.5Fe79 | 3.54 ± 0.1 | 6.16 ± 0.5 | 90.30 ± 0.4 | (Dy, Tb)2 Fe17 | 1497, 1562 | |
| 9.14 ± 0.1 | 11.48 ± 0.2 | 79.38 ± 0.2 | (Dy, Tb)6 Fe23 | |||
| 10.10 ± 0.2 | 13.33 ± 0.2 | 76.57 ± 0.4 | (Dy, Tb) Fe3 | |||
| 8#-Dy9Tb9Fe82 | 3.54 ± 0.1 | 5.18 ± 0.3 | 91.28 ± 0.4 | (Dy, Tb)2 Fe17 | 1523, 1560 | L → (Dy, Tb)2 Fe17 L→ (Dy, Tb)2 Fe17 + (Dy, Tb)6 Fe23 |
| 10.21 ± 0.1 | 11.87 ± 0.4 | 77.92 ± 0.5 | (Dy, Tb)6 Fe23 | |||
| Phase | Thermodynamic Parameters | Reference |
|---|---|---|
| Liquid | [24] | |
| [24] | ||
| [24] | ||
| [24] | ||
| [24] | ||
| [24] | ||
| This work | ||
| bcc (α-Fe, δ-Fe, β-Dy, β-Tb) | [24] | |
| [24] | ||
| fcc (γ-Fe) | [24] | |
| [24] | ||
| [24] | ||
| [24] | ||
| hcp (α-Dy, α-Tb) | [24] | |
| [24] | ||
| Fe17RE2 (Fe17Dy2, Fe17Tb2) | [24] | |
| [24] | ||
| [24] | ||
| [24] | ||
| This work | ||
| Fe23RE6 (Fe23Dy6, Fe23Tb6) | [24] | |
| [24] | ||
| [24] | ||
| [24] | ||
| This work | ||
| Fe3RE (Fe3Dy, Fe3Tb) | [24] | |
| [24] | ||
| [24] | ||
| [24] | ||
| This work | ||
| Fe2RE (Fe2Dy, Fe2Tb) | [24] | |
| [24] | ||
| [24] | ||
| [24] | ||
| This work |
Disclaimer/Publisher’s Note: The statements, opinions and data contained in all publications are solely those of the individual author(s) and contributor(s) and not of MDPI and/or the editor(s). MDPI and/or the editor(s) disclaim responsibility for any injury to people or property resulting from any ideas, methods, instructions or products referred to in the content. |
© 2023 by the authors. Licensee MDPI, Basel, Switzerland. This article is an open access article distributed under the terms and conditions of the Creative Commons Attribution (CC BY) license (https://creativecommons.org/licenses/by/4.0/).
Share and Cite
Tan, C.; Wei, Q.; Cheng, W.; Liu, X.; Bai, Y.; Wang, J. Solidification Behavior of Dy-Tb-Fe Alloys through Experimental Study and Thermodynamic Calculation. Materials 2023, 16, 4697. https://doi.org/10.3390/ma16134697
Tan C, Wei Q, Cheng W, Liu X, Bai Y, Wang J. Solidification Behavior of Dy-Tb-Fe Alloys through Experimental Study and Thermodynamic Calculation. Materials. 2023; 16(13):4697. https://doi.org/10.3390/ma16134697
Chicago/Turabian StyleTan, Cong, Qi Wei, Weifeng Cheng, Xingyu Liu, Yuchen Bai, and Jiang Wang. 2023. "Solidification Behavior of Dy-Tb-Fe Alloys through Experimental Study and Thermodynamic Calculation" Materials 16, no. 13: 4697. https://doi.org/10.3390/ma16134697