
The Relationship between the Structural Characteristics of α-Fe2O3 Catalysts and Their Lattice Oxygen Reactivity Regarding Hydrogen

 , ,
, ,
Abstract
:1. Introduction
2. Materials and Methods
2.1. Chemicals and Materials
2.2. Characterization Techniques
2.3. Examination of the State Surface of Calcined α-Fe2O3 Samples
2.4. Temperature-Programmed Reduction of α-Fe2O3 Samples by Hydrogen
3. Results and Discussion
3.1. Reactivity of Calcined α-Fe2O3 Samples in the Temperature-Programmed Reduction by Hydrogen
3.2. Examination of Calcined α-Fe2O3 Samples using Raman Spectroscopy
3.3. Study of the α-Fe2O3 Surface in Calcined Samples
4. Conclusions
Author Contributions
Funding
Institutional Review Board Statement
Informed Consent Statement
Data Availability Statement
Acknowledgments
Conflicts of Interest
References
- Zhu, M.; Wachs, I.E. Iron-Based Catalysts for the High Temperature Water-Gas Shift (HT-WGS) Reaction: A Review. ACS Catal. 2016, 6, 722–732. [Google Scholar] [CrossRef]
- Wagloehner, S.; Reichert, D.; Leon-Sorzano, D.; Balle, P.; Geiger, B.; Kureti, S. Kinetic modeling of the oxidation of CO on Fe2O3 catalyst in excess of O2. J. Catal. 2008, 260, 305–314. [Google Scholar] [CrossRef]
- Wagloehner, S.; Kureti, S. Study on the mechanism of the oxidation of soot on Fe2O3 catalyst. Appl. Catal. B Environ. 2012, 125, 158–165. [Google Scholar] [CrossRef]
- Yu, Z.; Yang, Y.; Yang, S.; Zhang, Q.; Zhao, J.; Fang, Y.; Hao, X.; Guan, G. Iron-based oxygen carriers in chemical looping conversions: A review. Carbon Resour. Convers. 2019, 2, 23–34. [Google Scholar] [CrossRef]
- Cheng, Z.; Qin, L.; Guo, M.; Xu, M.; Fan, J.A.; Fan, L. Oxygen Vacancy Promoted Methane Partial Oxidation over Iron Oxide Oxygen Carrier in Chemical Looping Process. Phys. Chem. Chem. Phys. 2016, 18, 32418–32428. [Google Scholar] [CrossRef] [PubMed]
- Qin, L.; Cheng, Z.; Guo, M.; Xu, M.; Fan, J.A.; Fan, L.-S. Impact of 1% Lanthanum Dopant on Carbonaceous Fuel Redox Reactions with an Iron-Based Oxygen Carrier in Chemical Looping Processes. ACS Energy Lett. 2017, 2, 70–74. [Google Scholar] [CrossRef]
- Liu, X.; Wang, H. Hydrogen production from water decomposition by redox of Fe2O3 modified with single-or double-metal additives. J. Solid State Chem. 2010, 183, 1075–1082. [Google Scholar] [CrossRef]
- Bora, D.K.; Braun, A.; Erat, S.; Safonova, O.; Graule, T.; Constable, E.C. Evolution of structural properties of iron oxide nano particles during temperature treatment from 250 °C-900 °C: X-ray diffraction and Fe K-shell pre-edge X-ray absorption study. Curr. Appl. Phys. 2012, 12, 817–825. [Google Scholar] [CrossRef] [Green Version]
- Kryukova, G.N.; Tsybulya, S.V.; Solovyeva, L.P.; Sadykov, V.A.; Litvak, G.S.; Andrianova, M.P. Effect of heat treatment on microstructure evolution of haematite derived from synthetic goethite. Mater. Sci. Eng. A 1991, 149, 121–127. [Google Scholar] [CrossRef]
- Breault, R.W.; Yarrington, C.S.; Weber, J.M. The Effect of Thermal Treatment of Hematite Ore for Chemical Looping Combustion of Methane. J. Energy Resour. Technol. 2016, 138, 042202-1–042202-8. [Google Scholar] [CrossRef]
- Zhang, J.; Tao He, T.; Wang, Z.; Zhu, M.; Zhang, K.; Li, B.; Wu, J. The search of proper oxygen carriers for chemical looping partial oxidation of carbon. Appl. Energy 2017, 190, 1119–1125. [Google Scholar] [CrossRef]
- Riley, J.; Siriwardane, R.; Tian, H.; Benincosa, W.; Poston, J. Kinetic analysis of the interactions between calcium ferrite and coal char for chemical looping gasification applications: Identifying reduction routes and modes of oxygen transfer. Appl. Energy 2017, 201, 94–110. [Google Scholar] [CrossRef]
- Cheng, Z.; Qin, L.; Fan, J.A.; Fan, L.-S. New Insight into the Development of Oxygen Carrier Materials for Chemical Looping Systems. Engineering 2018, 4, 343–351. [Google Scholar] [CrossRef]
- Zhu, W.; Winterstein, J.; Maimon, I.; Yin, Q.; Yuan, L.; Kolmogorov, A.N.; Sharma, R.; Zhou, G. Atomic Structural Evolution during the Reduction of α-Fe2O3 Nanowires. J. Phys. Chem. C 2016, 120, 14854–14862. [Google Scholar] [CrossRef] [PubMed] [Green Version]
- Schöttner, L.; Nefedov, A.; Yang, C.; Heissler, S.; Wang, Y.; Wöll, C. Structural Evolution of α-Fe2O3(0001) Surfaces Under Reduction Conditions Monitored by Infrared Spectroscopy. Front. Chem. 2019, 7, 451. [Google Scholar] [CrossRef] [PubMed]
- Shimokawabe, M.; Furuichi, R.; Ishii, T. Influence of the preparation history of α-Fe2O3 on its reactivity for hydrogen reduction. Thermochim. Acta 1979, 28, 287–305. [Google Scholar] [CrossRef]
- Lamberov, A.A.; Dementieva, E.V.; Kuzmina, O.V.; Khazeev, B.R. Transformation of the structure of iron oxide (III) during thermal heating in air. Bull. Kazan Technol. Univ. 2013, 16, 37–41. (In Russian) [Google Scholar]
- Chen, Z.; Dang, J.; Hu, X.; Yan, H. Reduction Kinetics of Hematite Powder in Hydrogen Atmosphere at Moderate Temperatures. Metals 2018, 8, 751. [Google Scholar] [CrossRef] [Green Version]
- Kirik, N.P.; Yumashev, V.V.; Solovyov, L.A.; Rabchevskii, E.V.; Shishkina, N.N.; Anshits, A.G. Influence of Temperature and Duration of α-Fe2O3Calcination on Reactivity in Hydrogen Oxidation. J. Sib. Fed. Univ. Chem. 2023, 16, 66–77. [Google Scholar]
- Rouquerol, J.; Rouquerol, F.; Grillet, Y.; Triaca, M. Quasi-equilibrium nitrogen adsorption gravimetry: Comparison with volumetry for the determination of surface areas and pore size distributions. Thermochim. Acta 1986, 10, 89–96. [Google Scholar] [CrossRef]
- Lowell, S.; Shields, J.E.; Thomas, M.A.; Thommes, M. Characterization of Porous Solids and Powders: Surface Area, Pore Size, and Density; Springer Science + Business Media: New York, NY, USA, 2004. [Google Scholar] [CrossRef]
- de Boer, J.H.; Lippens, B.C.; Lippens, B.G.; Broekhoff, J.C.P.; van den Heuvel, A.; Osinga, T.V. The t-curve of multimolecular N2-adsorption. J. Colloid Interface Sci. 1966, 21, 405–414. [Google Scholar] [CrossRef]
- Solovyov, L.A. Full-profile refinement by derivative difference minimization. J. Appl. Crystallogr. 2004, 37, 743–749. [Google Scholar] [CrossRef]
- Anshits, A.G.; Bayukov, O.A.; Kondratenko, E.V.; Anshits, N.N.; Pletnev, O.N.; Rabchevskii, E.V.; Solovyov, L.A. Catalytic properties and nature of active centers of ferrospheres in oxidative coupling of methane. Appl. Catal. A General 2016, 524, 192–199. [Google Scholar] [CrossRef]
- Knyazev, Y.V.; Tarasov, A.S.; Platunov, M.S.; Trigub, A.L.; Bayukov, O.A.; Boronin, A.I.; Solovyov, L.A.; Rabchevskii, E.V.; Shishkina, N.N.; Anshits, A.G. Structural and electron transport properties of CaFe2O4 synthesized in air and in helium atmosphere. J. Alloys Compd. 2020, 820, 153073. [Google Scholar] [CrossRef]
- Seah, M.P. Quantification of AES and XPS. In Practical Surface Analysis, 2nd ed.; Briggs, D., Seah, M.P., Eds.; John Wiley & Sons: Chichester, UK, 1990; Volume 1, pp. 201–255. [Google Scholar]
- Wagner, C.D. Handbook of X-ray Photoelectron Spectroscopy; Wagner, C.D., Riggs, W.M., Davis, L.E., Moulder, J.F., Muilenberg, G.E., Eds.; Perkin-Elmer Corp., Physical Electronics Division: Eden Prairie, MN, USA, 1979; 190p. [Google Scholar] [CrossRef]
- Moulder, J.F.; Stickle, W.F.; Sobol, P.E.; Bomben, K.D. Handbook of X-ray Photoelectron Spectroscopy; Chastain, J., Ed.; Perkin-Elmer Corp., Physical Electronics Division: Eden Prairie, MN, USA, 1992; Corpus ID: 133719866. [Google Scholar]
- Baklanova, N.I.; Zima, T.M.; Boronin, A.I.; Kosheev, S.V.; Titov, A.T.; Isaeva, N.V.; Graschenkov, D.V.; Solntsev, S.S. Protective ceramic multilayer coatings for carbon fibers. Surf. Coat. Technol. 2006, 201, 2313–2319. [Google Scholar] [CrossRef]
- Ivanova, A.S.; Slavinskaya, E.M.; Gulyaev, R.V.; Zaikovskii, V.I.; Stonkus, O.A.; Danilova, I.G.; Plyasova, L.M.; Polukhina, I.A.; Boronin, A.I. Metal-support interactions in Pt/Al2O3 and Pd/Al2O3 catalysts for CO oxidation. Appl. Catal. B Environ. 2010, 97, 57–71. [Google Scholar] [CrossRef]
- DIN 51007:1994-06; Thermal Analysis; Differential Thermal Analysis. Principles, Deutsches Institut für Normung e. V.: Berlin, Germany, 1994.
- Sun, L.; Liang, X.; Liu, H.; Cao, H.; Liu, X.; Jin, Y.; Li, X.; Chen, S.; Wu, X. Activation of Co-O bond in (110) facet exposed Co3O4 by Cu doping for the boost of propane catalytic oxidation. J. Hazard. Mater. 2023, 15, 131319. [Google Scholar] [CrossRef]
- Massey, M.J.; Baier, U.; Merlin, R.; Weber, W.H. Effects of pressure and isotopic substitution on the Raman spectrum of a-Fe2O3: Identification of two-magnon scattering. Phys. Rev. B 1990, 41, 7822–7827. [Google Scholar] [CrossRef]
- Chamritski, I.; Burns, G. Infrared- and Raman-Active Phonons of Magnetite, Maghemite, and Hematite: A Computer Simulation and Spectroscopic Study. J. Phys. Chem. B 2005, 109, 4965–4968. [Google Scholar] [CrossRef]
- Chernyshova, I.V.; Hochella, M.F., Jr.; Madden, A.S. Size-dependent structural transformations of hematite nanoparticles. 1. Phase transition. Phys. Chem. Chem. Phys. 2007, 9, 1736–1750. [Google Scholar] [CrossRef]
- Jubb, A.M.; Allen, H.C. Vibrational Spectroscopic Characterization of Hematite, Maghemite, and Magnetite Thin Films Produced by Vapor Deposition. Appl. Mater. Interfaces 2010, 2, 2804–2812. [Google Scholar] [CrossRef]
- Bersani, D.; Lottici, P.P.; Montenero, A. Micro-Raman Investigation of Iron Oxide Films and Powders Produced by Sol–Gel Syntheses. J. Raman Spectrosc. 1999, 30, 355–360. [Google Scholar] [CrossRef]
- Hanesch, M. Raman spectroscopy of iron oxides and (oxy)hydroxides at low laser power and possible applications in environmental magnetic studies. Geophys. J. Int. 2009, 177, 941–948. [Google Scholar] [CrossRef]
- Parkinson, G.S. Iron oxide surfaces. Surf. Sci. Rep. 2016, 71, 272–365. [Google Scholar] [CrossRef] [Green Version]
- Wei, L.; Pang, X.; Liu, C.; Gao, K. Formation mechanism and protective property of corrosion product scale on X70 steel under supercritical CO2 environment. Corros. Sci. 2015, 100, 404–420. [Google Scholar] [CrossRef]
- Radu, T.; Iacovita, C.; Benea, D.; Turcu, R. X-Ray Photoelectron Spectroscopic Characterization of Iron Oxide Nanoparticles. Appl. Surf. Sci. 2017, 405, 337–343. [Google Scholar] [CrossRef]
- Yamashita, T.; Hayes, P. Analysis of XPS spectra of Fe2+ and Fe3+ ions in oxide materials. Appl. Surf. Sci. 2008, 254, 2441–2449. [Google Scholar] [CrossRef]
- Fujii, T.; de Groot, F.M.F.; Sawatzky, G.A.; Voogt, F.C.; Hibma, T.; Okada, K. In situ XPS analysis of various iron oxide films grown by NO2-assisted molecular-beam epitaxy. Phys. Rev. B 1999, 59, 3195–3202. [Google Scholar] [CrossRef] [Green Version]
- Deckmann, R. Point defects and transport in haematite (Fe2O3-Ɛ). Philos. Mag. 1993, 68, 725–745. [Google Scholar] [CrossRef]
- Lee, J.; Han, S. Thermodynamics of native point defects in α-Fe2O3: An ab initio study. Phys. Chem. Chem. Phys. 2013, 15, 18906–18914. [Google Scholar] [CrossRef]
- Warschkow, O.; Ellis, D.E. Defects and Charge Transport near the Hematite (0001) Surface: An Atomistic Study of Oxygen Vacancies. J. Am. Ceram. Soc. 2002, 85, 213–220. [Google Scholar] [CrossRef]
- Gieitzer, C.; Nowotny, J.; Rekas, M. Surface and Bulk Electrical Properties of the Hematite Phase Fe2O3. Appl. Phys. A 1991, 53, 310–316. [Google Scholar] [CrossRef]
- Ling, Y.; Wang, G.; Reddy, J.; Wang, C.; Zhang, J.Z.; Li, Y. The Influence of Oxygen Content on the Thermal Activation of Hematite Nanowires. Angew. Chem. 2012, 124, 4150–4155. [Google Scholar] [CrossRef]
- Ovcharenko, R.; Voloshina, E.; Sauer, J. Water adsorption and O-defect formation on Fe2O3 (0001) surfaces. Phys. Chem. Chem. Phys. 2016, 18, 25560–25568. [Google Scholar] [CrossRef] [PubMed] [Green Version]
- Yamamoto, S.; Kendelewicz, T.; Newberg, J.T.; Ketteler, G.; Starr, D.E.; Mysak, E.R.; Andersson, K.J.; Ogasawara, H.; Bluhm, H.; Salmeron, M.; et al. Water Adsorption on α-Fe2O3(0001) at near Ambient Conditions. J. Phys. Chem. C 2010, 114, 2256–2266. [Google Scholar] [CrossRef] [Green Version]
- Ismail, H.M.; Cadenhead, D.A.; Zaki, M.I. Surface Reactivity of Iron Oxide Pigmentary Powders toward Atmospheric Components: XPS, FESEM, and Gravimetry of CO and CO2 Adsorption. J. Colloid Interface Sci. 1997, 194, 482–488. [Google Scholar] [CrossRef]
- Ferretto, L.; Glisenti, A. Study of the surface acidity of an hematite powder. J. Mol. Catal. A Chem. 2002, 187, 119–128. [Google Scholar] [CrossRef]


| Tcal, °C | SSA, m2/g | Vpore, × 10−4 cm3/g | Dav, μm | DX, g/cm3 | Tin., °C | T95%, °C |
|---|---|---|---|---|---|---|
| 800 | 2.10 | 27.4 | ~0.2 | 5.2704(1) | 337 | 630 |
| 900 | 0.81 | 11.5 | - | 5.2707(1) | 385 | 668 |
| 1000 | 0.21 | 3.1 | - | 5.2711(1) | 429 | 737 |
| 1100 | 0.09 | 1.6 | ~2.5 | 5.2713(1) | 435 | 812 |
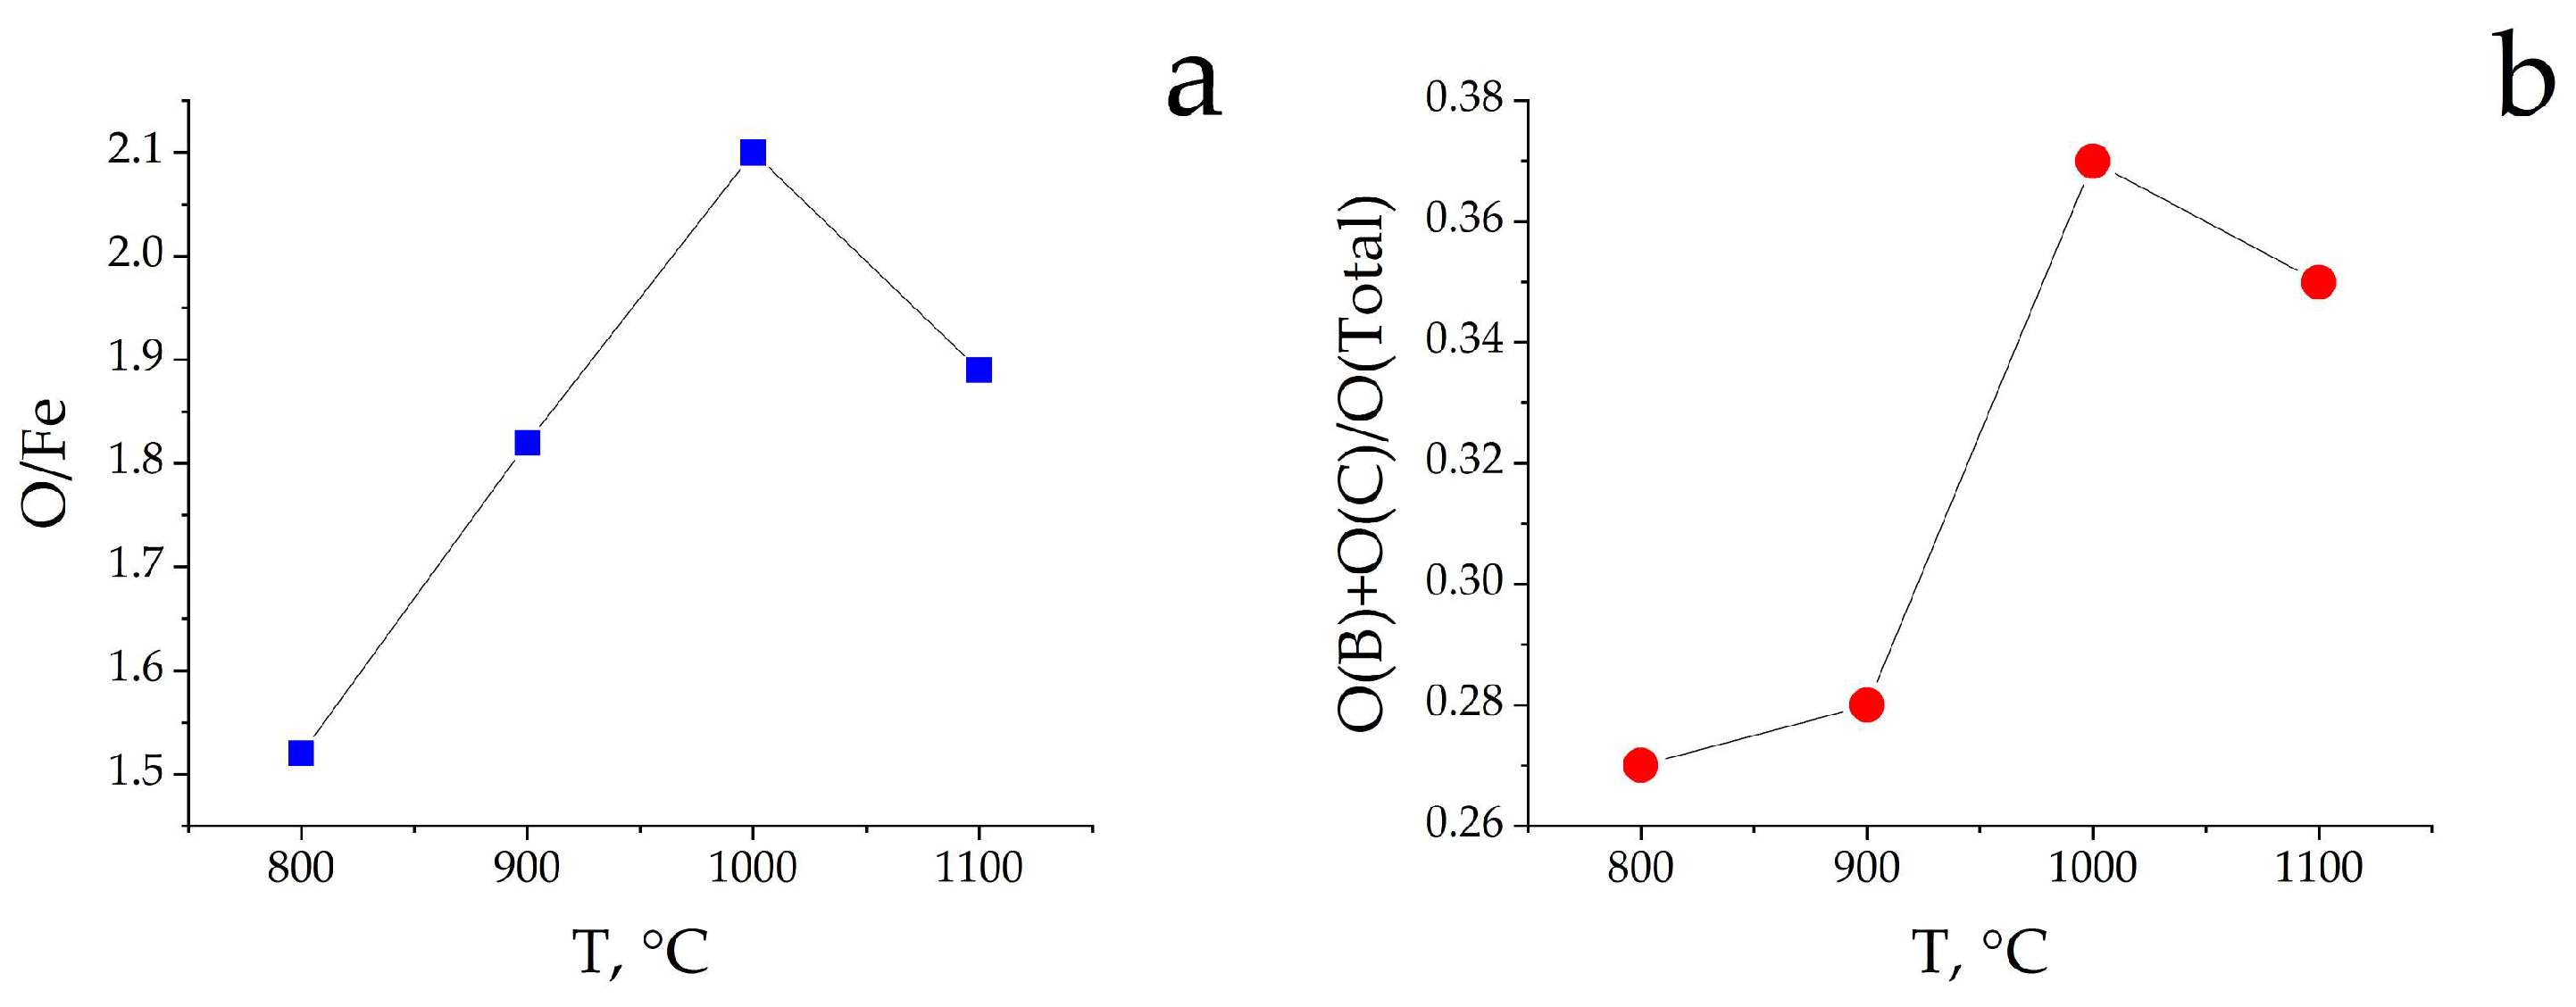
| Samples | Concentration of Elements, Atomic Ratios | ||||
|---|---|---|---|---|---|
| CΣ | C(CO3) | OΣ | Fe | Si * | |
| Fe2O3-800 | 1.21 | 0.04 | 1.52 | 1 | 0.08 |
| Fe2O3-900 | 1.77 | 0.13 | 1.82 | 1 | 0.24 |
| Fe2O3-1000 | 2.23 | 0.17 | 2.10 | 1 | 0.21 |
| Fe2O3-1100 | 1.59 | 0.14 | 1.89 | 1 | 0.10 |
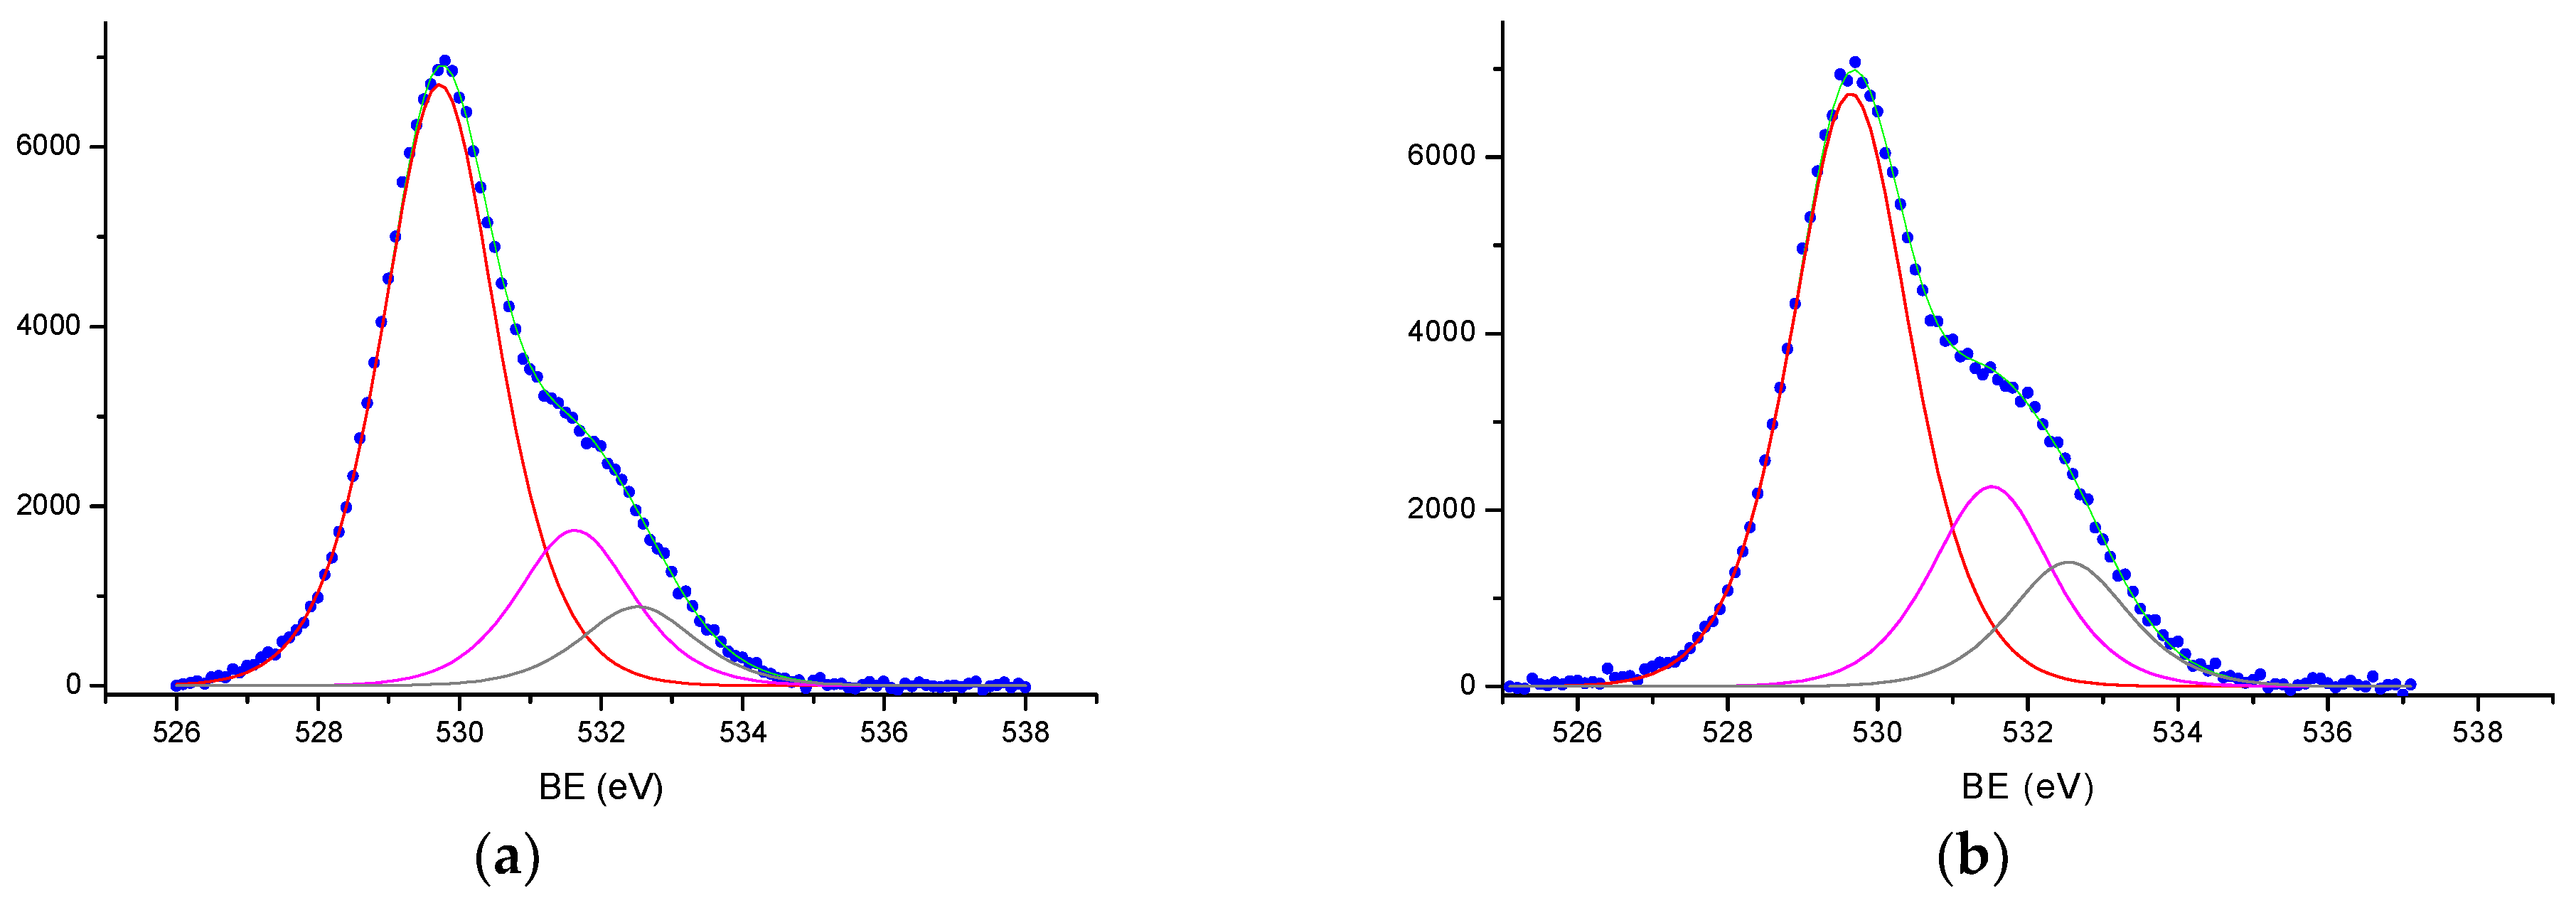
| Samples | Fe2p3/2 | O1s | C1s | |||||||
|---|---|---|---|---|---|---|---|---|---|---|
| Fe2+ | Fe3+ | A | B | C | A | B | C | |||
| Fe2O3-800 | 709.9 | 714.1 | 711.5 | 719.0 | 529.7 | 531.6 | 532.6 | 285.0 | 286 | 288.5 |
| Fe2O3-800 | 709.9 | 714.1 | 711.4 | 710.0 | 529.7 | 531.6 | 532.5 | 285.0 | - | 288.6 |
| Fe2O3-800 | 709.9 | 714.1 | 711.5 | 718.8 | 529.7 | 531.6 | 532.7 | 284.9 | - | 288.6 |
| Fe2O3-1100 | 709.8 | 714.1 | 711.6 | 718.9 | 529.6 | 531.5 | 532.7 | 285.0 | - | 288.7 |
Disclaimer/Publisher’s Note: The statements, opinions and data contained in all publications are solely those of the individual author(s) and contributor(s) and not of MDPI and/or the editor(s). MDPI and/or the editor(s) disclaim responsibility for any injury to people or property resulting from any ideas, methods, instructions or products referred to in the content. |
© 2023 by the authors. Licensee MDPI, Basel, Switzerland. This article is an open access article distributed under the terms and conditions of the Creative Commons Attribution (CC BY) license (https://creativecommons.org/licenses/by/4.0/).
Share and Cite
Kirik, N.; Krylov, A.; Boronin, A.; Koshcheev, S.; Solovyov, L.; Rabchevskii, E.; Shishkina, N.; Anshits, A. The Relationship between the Structural Characteristics of α-Fe2O3 Catalysts and Their Lattice Oxygen Reactivity Regarding Hydrogen. Materials 2023, 16, 4466. https://doi.org/10.3390/ma16124466
Kirik N, Krylov A, Boronin A, Koshcheev S, Solovyov L, Rabchevskii E, Shishkina N, Anshits A. The Relationship between the Structural Characteristics of α-Fe2O3 Catalysts and Their Lattice Oxygen Reactivity Regarding Hydrogen. Materials. 2023; 16(12):4466. https://doi.org/10.3390/ma16124466
Chicago/Turabian StyleKirik, Nadezhda, Alexander Krylov, Andrey Boronin, Sergey Koshcheev, Leonid Solovyov, Evgenii Rabchevskii, Nina Shishkina, and Alexander Anshits. 2023. "The Relationship between the Structural Characteristics of α-Fe2O3 Catalysts and Their Lattice Oxygen Reactivity Regarding Hydrogen" Materials 16, no. 12: 4466. https://doi.org/10.3390/ma16124466