
Enhancing the Mechanical Properties of Cu–Al–Ni Shape Memory Alloys Locally Reinforced by Alumina through the Powder Bed Fusion Process


Abstract
:1. Introduction
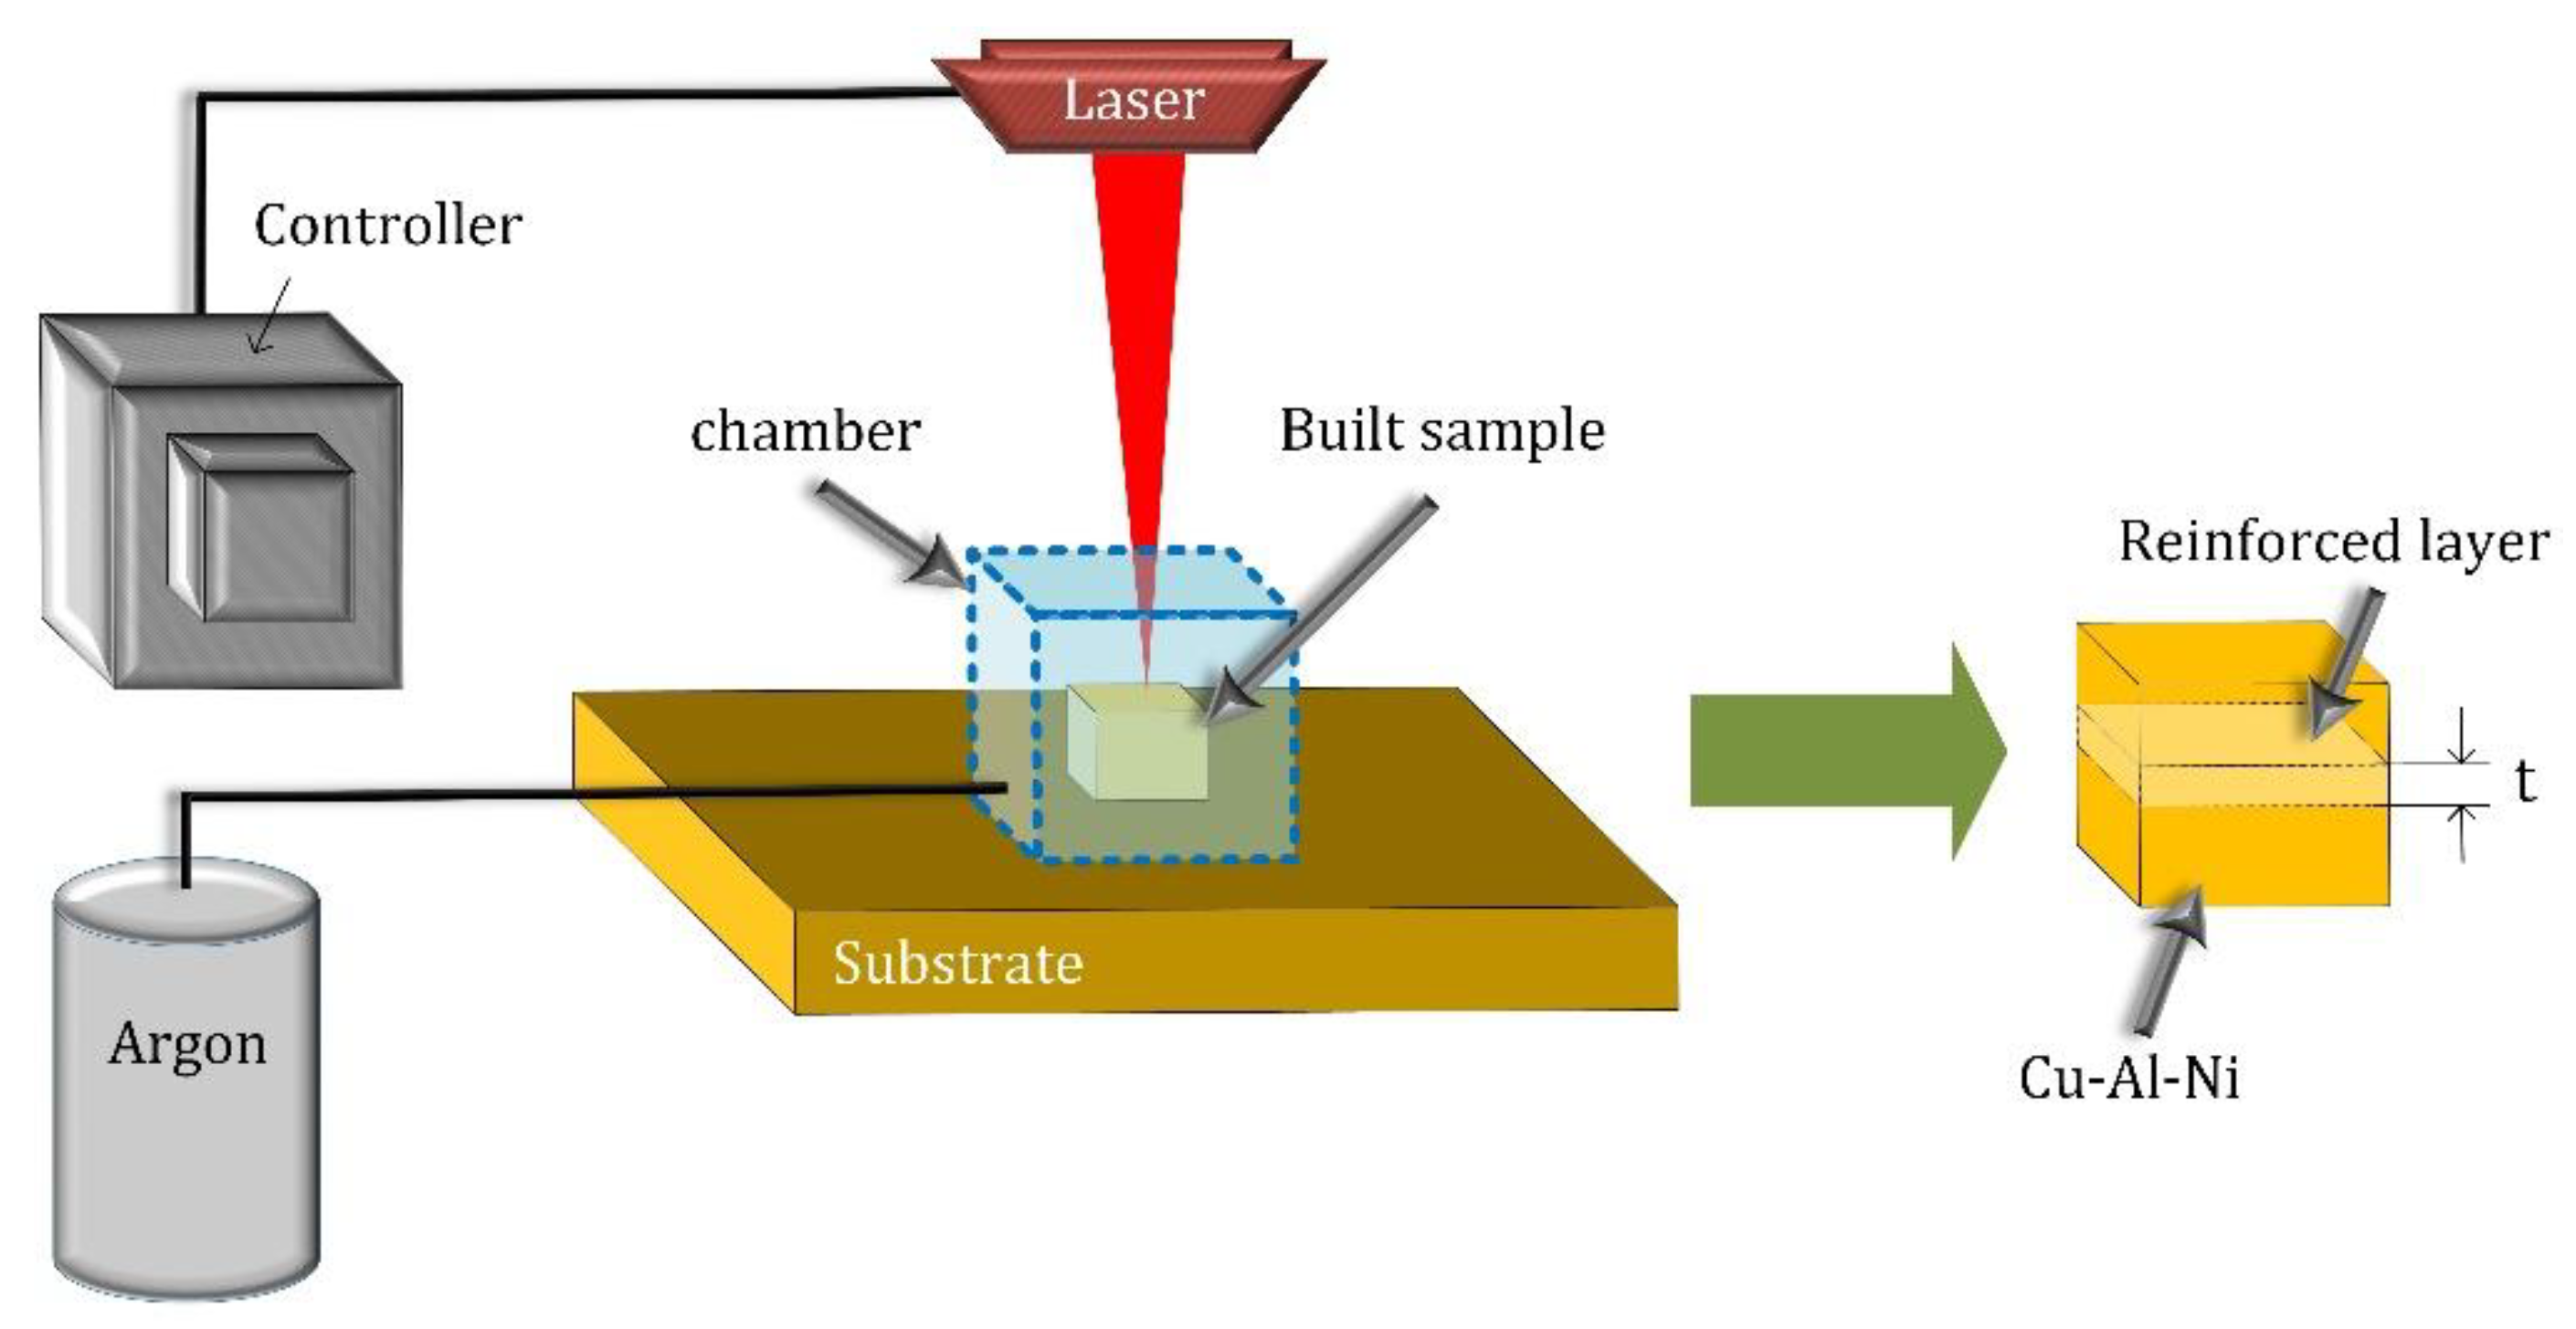
2. Experimental
3. Results and Discussion
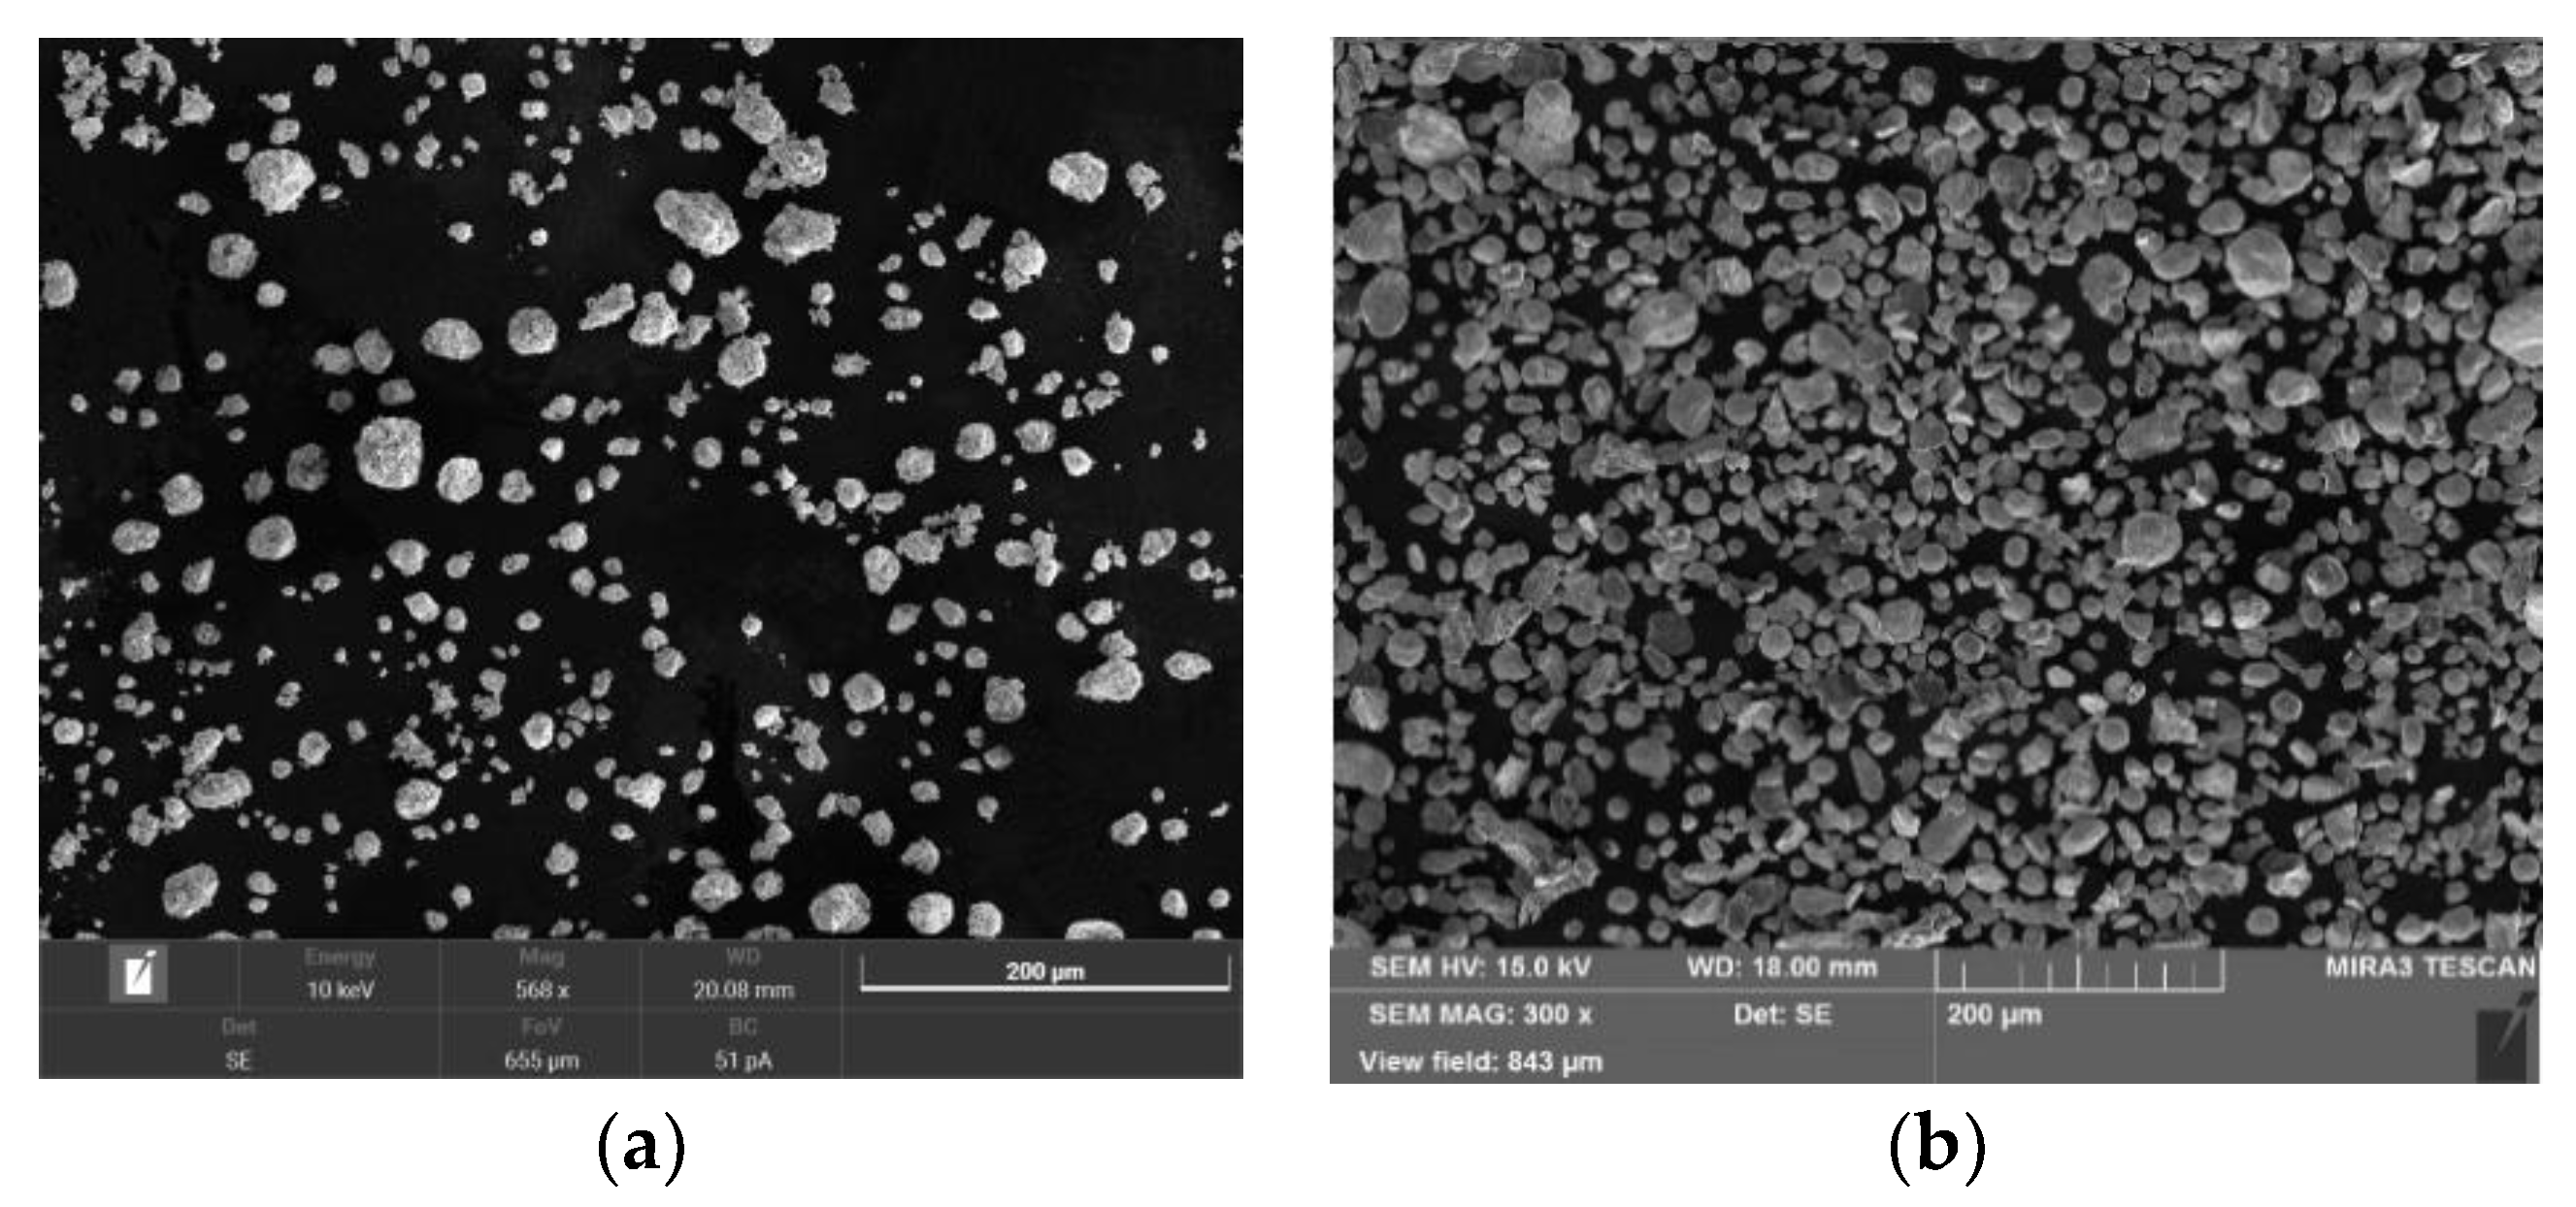
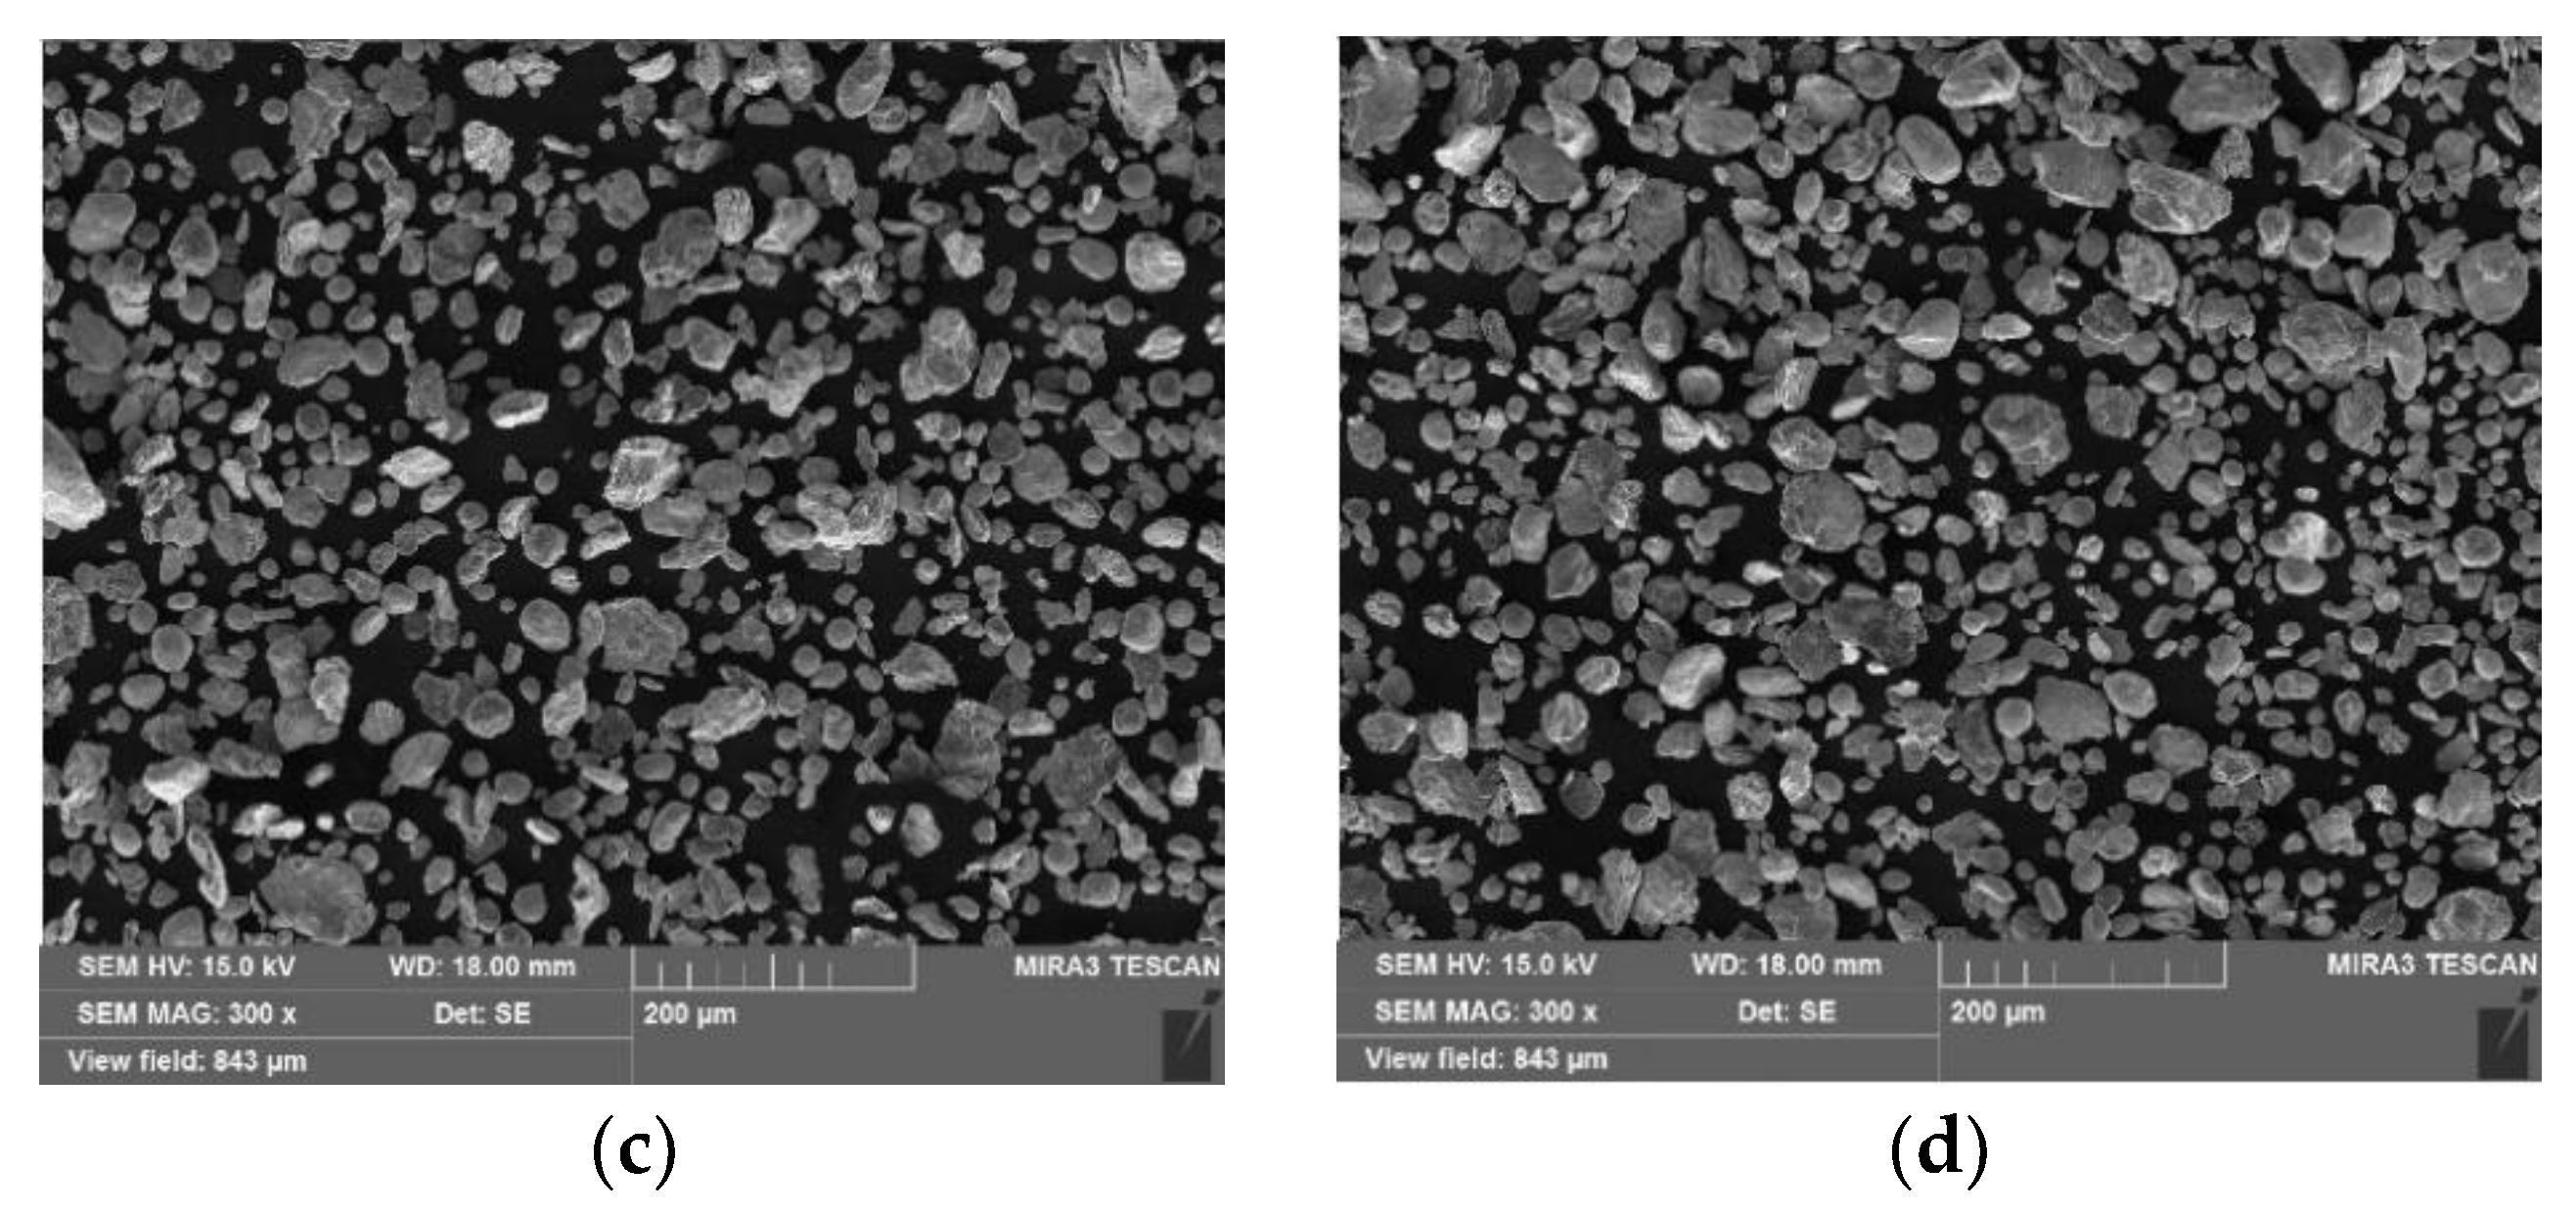
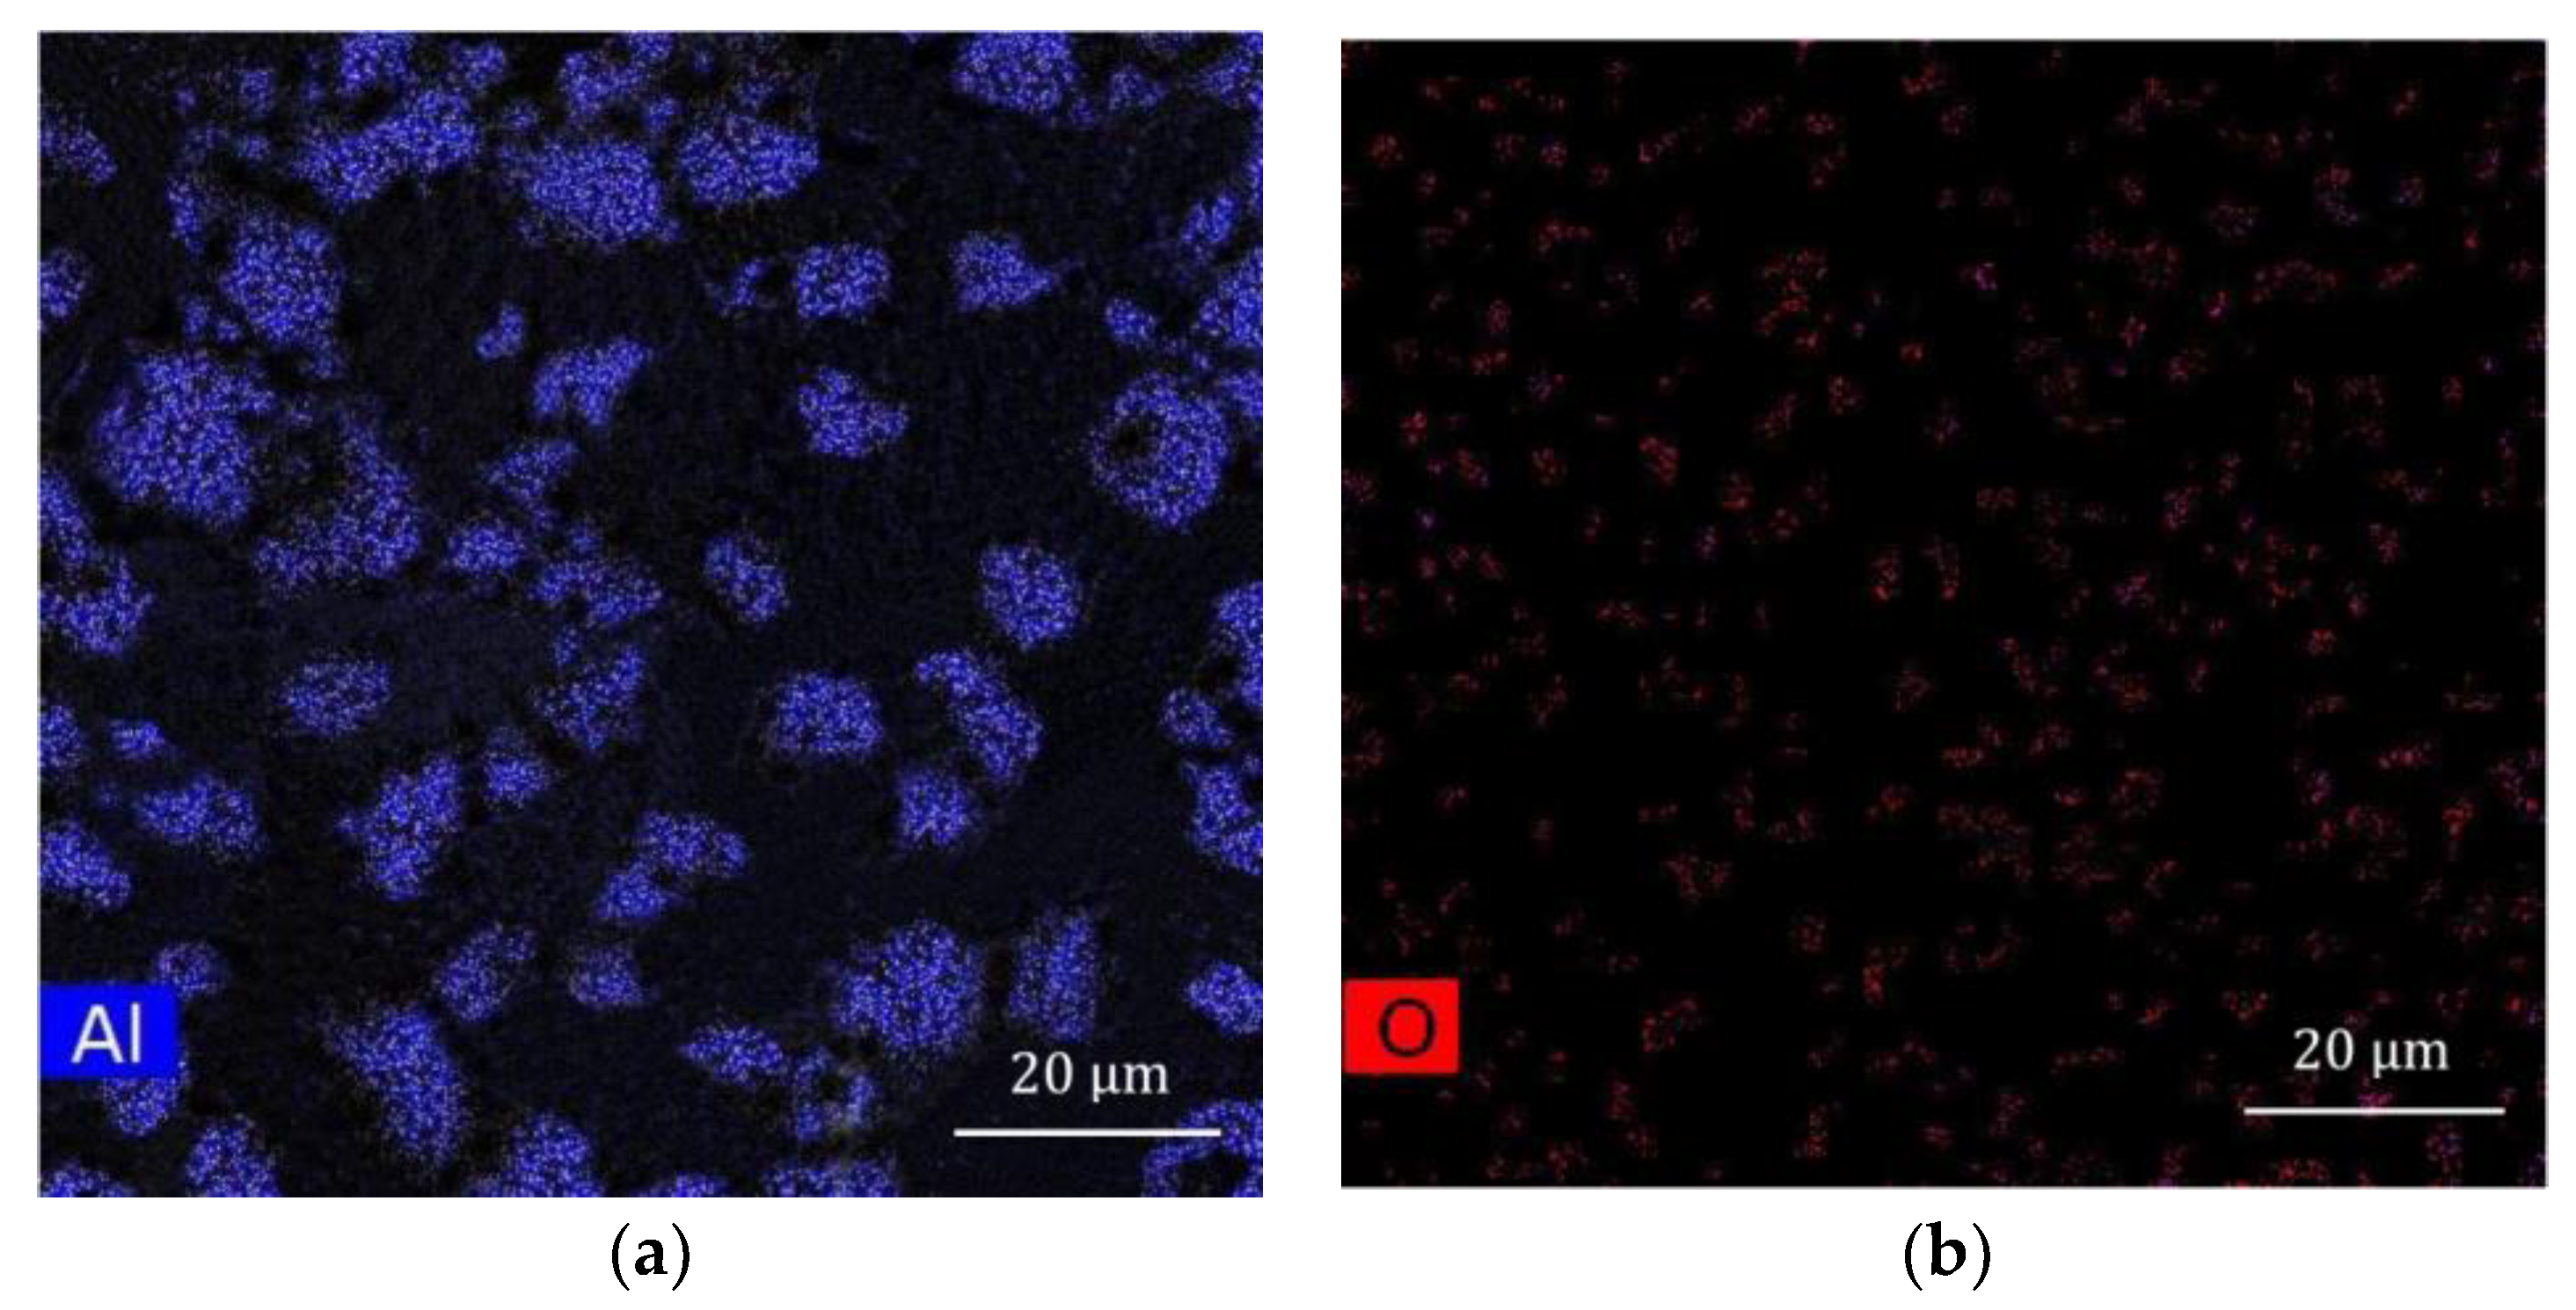
3.1. Microstructure
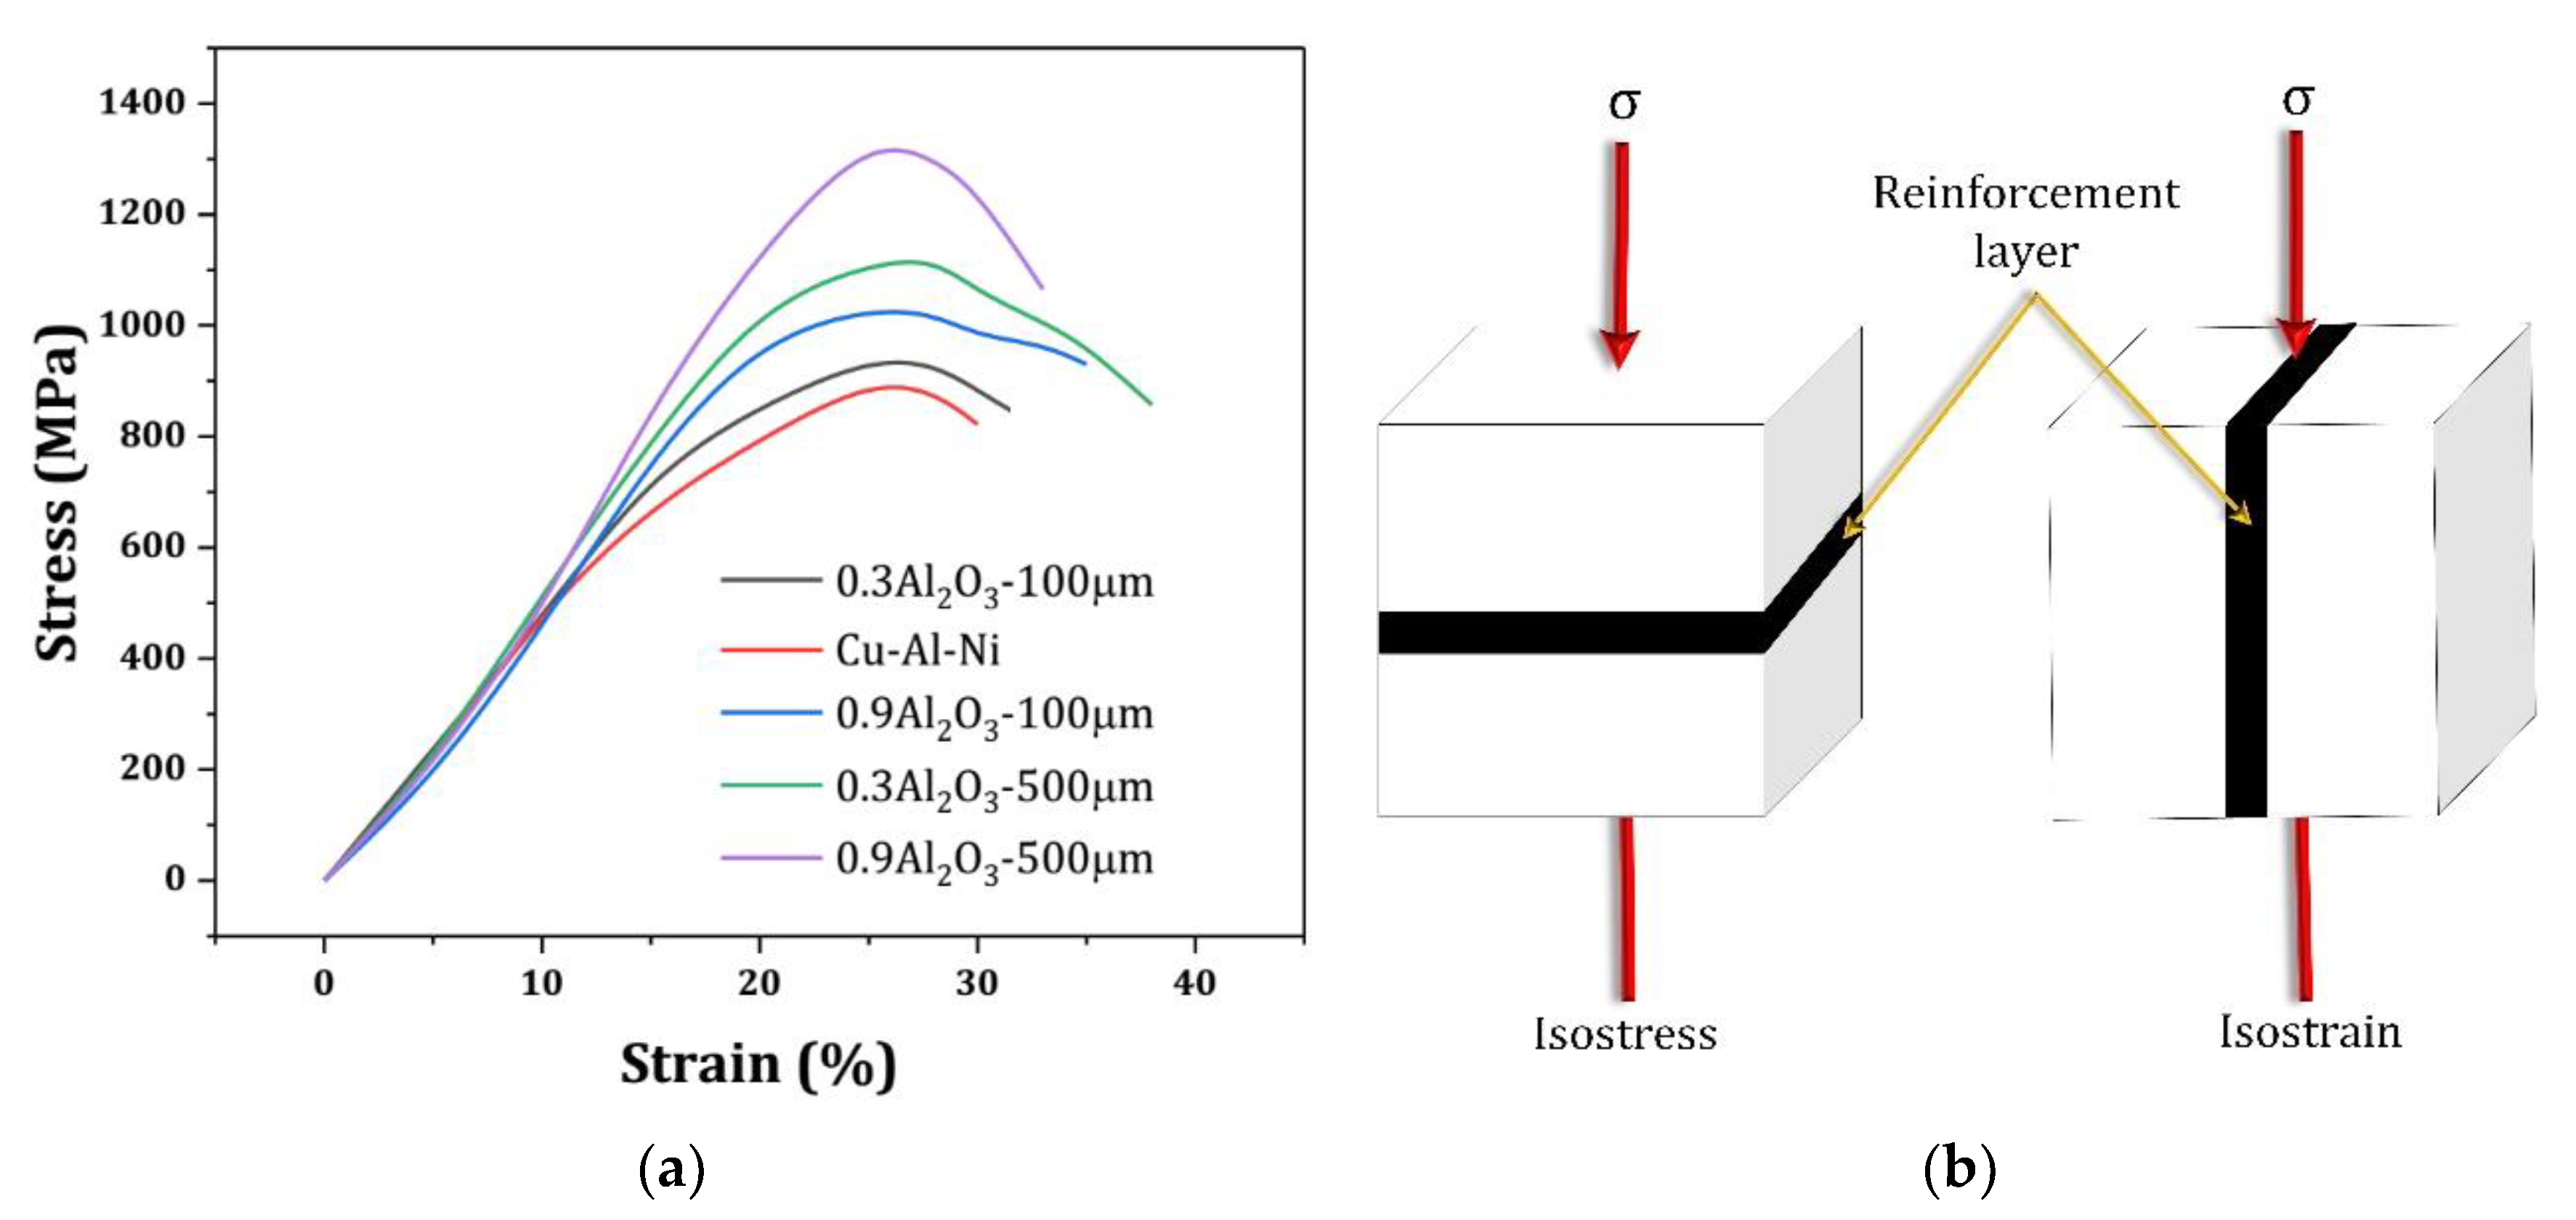
3.2. Mechanical Properties
4. Conclusions
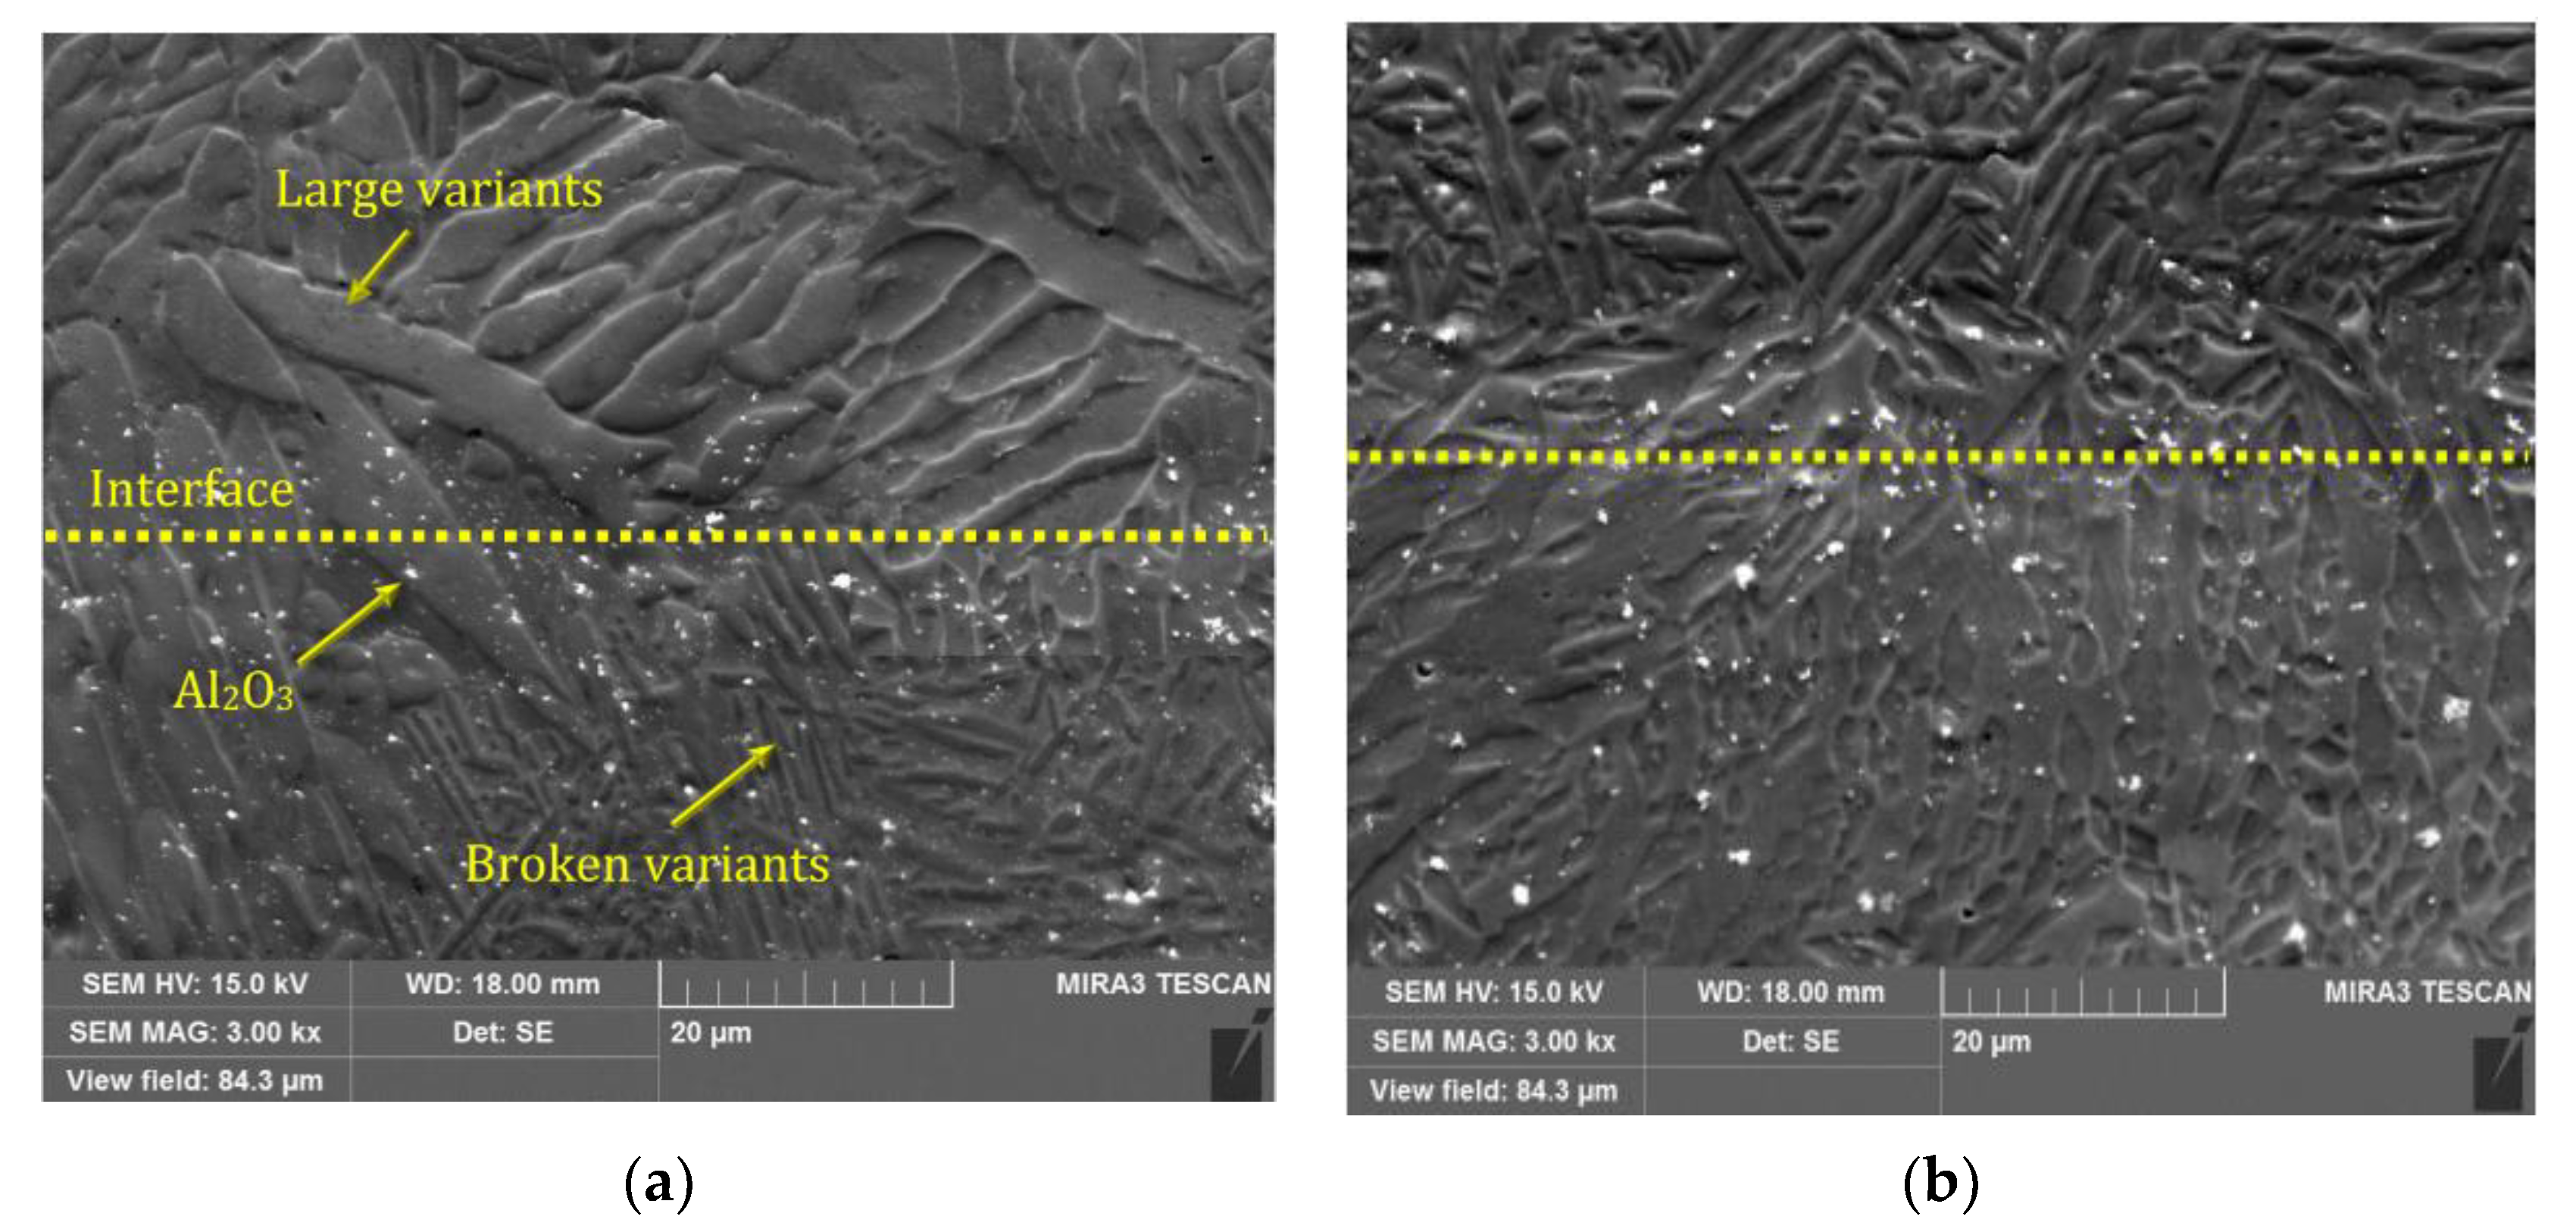
- The reinforcement particles can break martensite variants rather than grains. With an increase in Al2O3 content, the martensite variants were continuously refined, which is deleterious to SME.
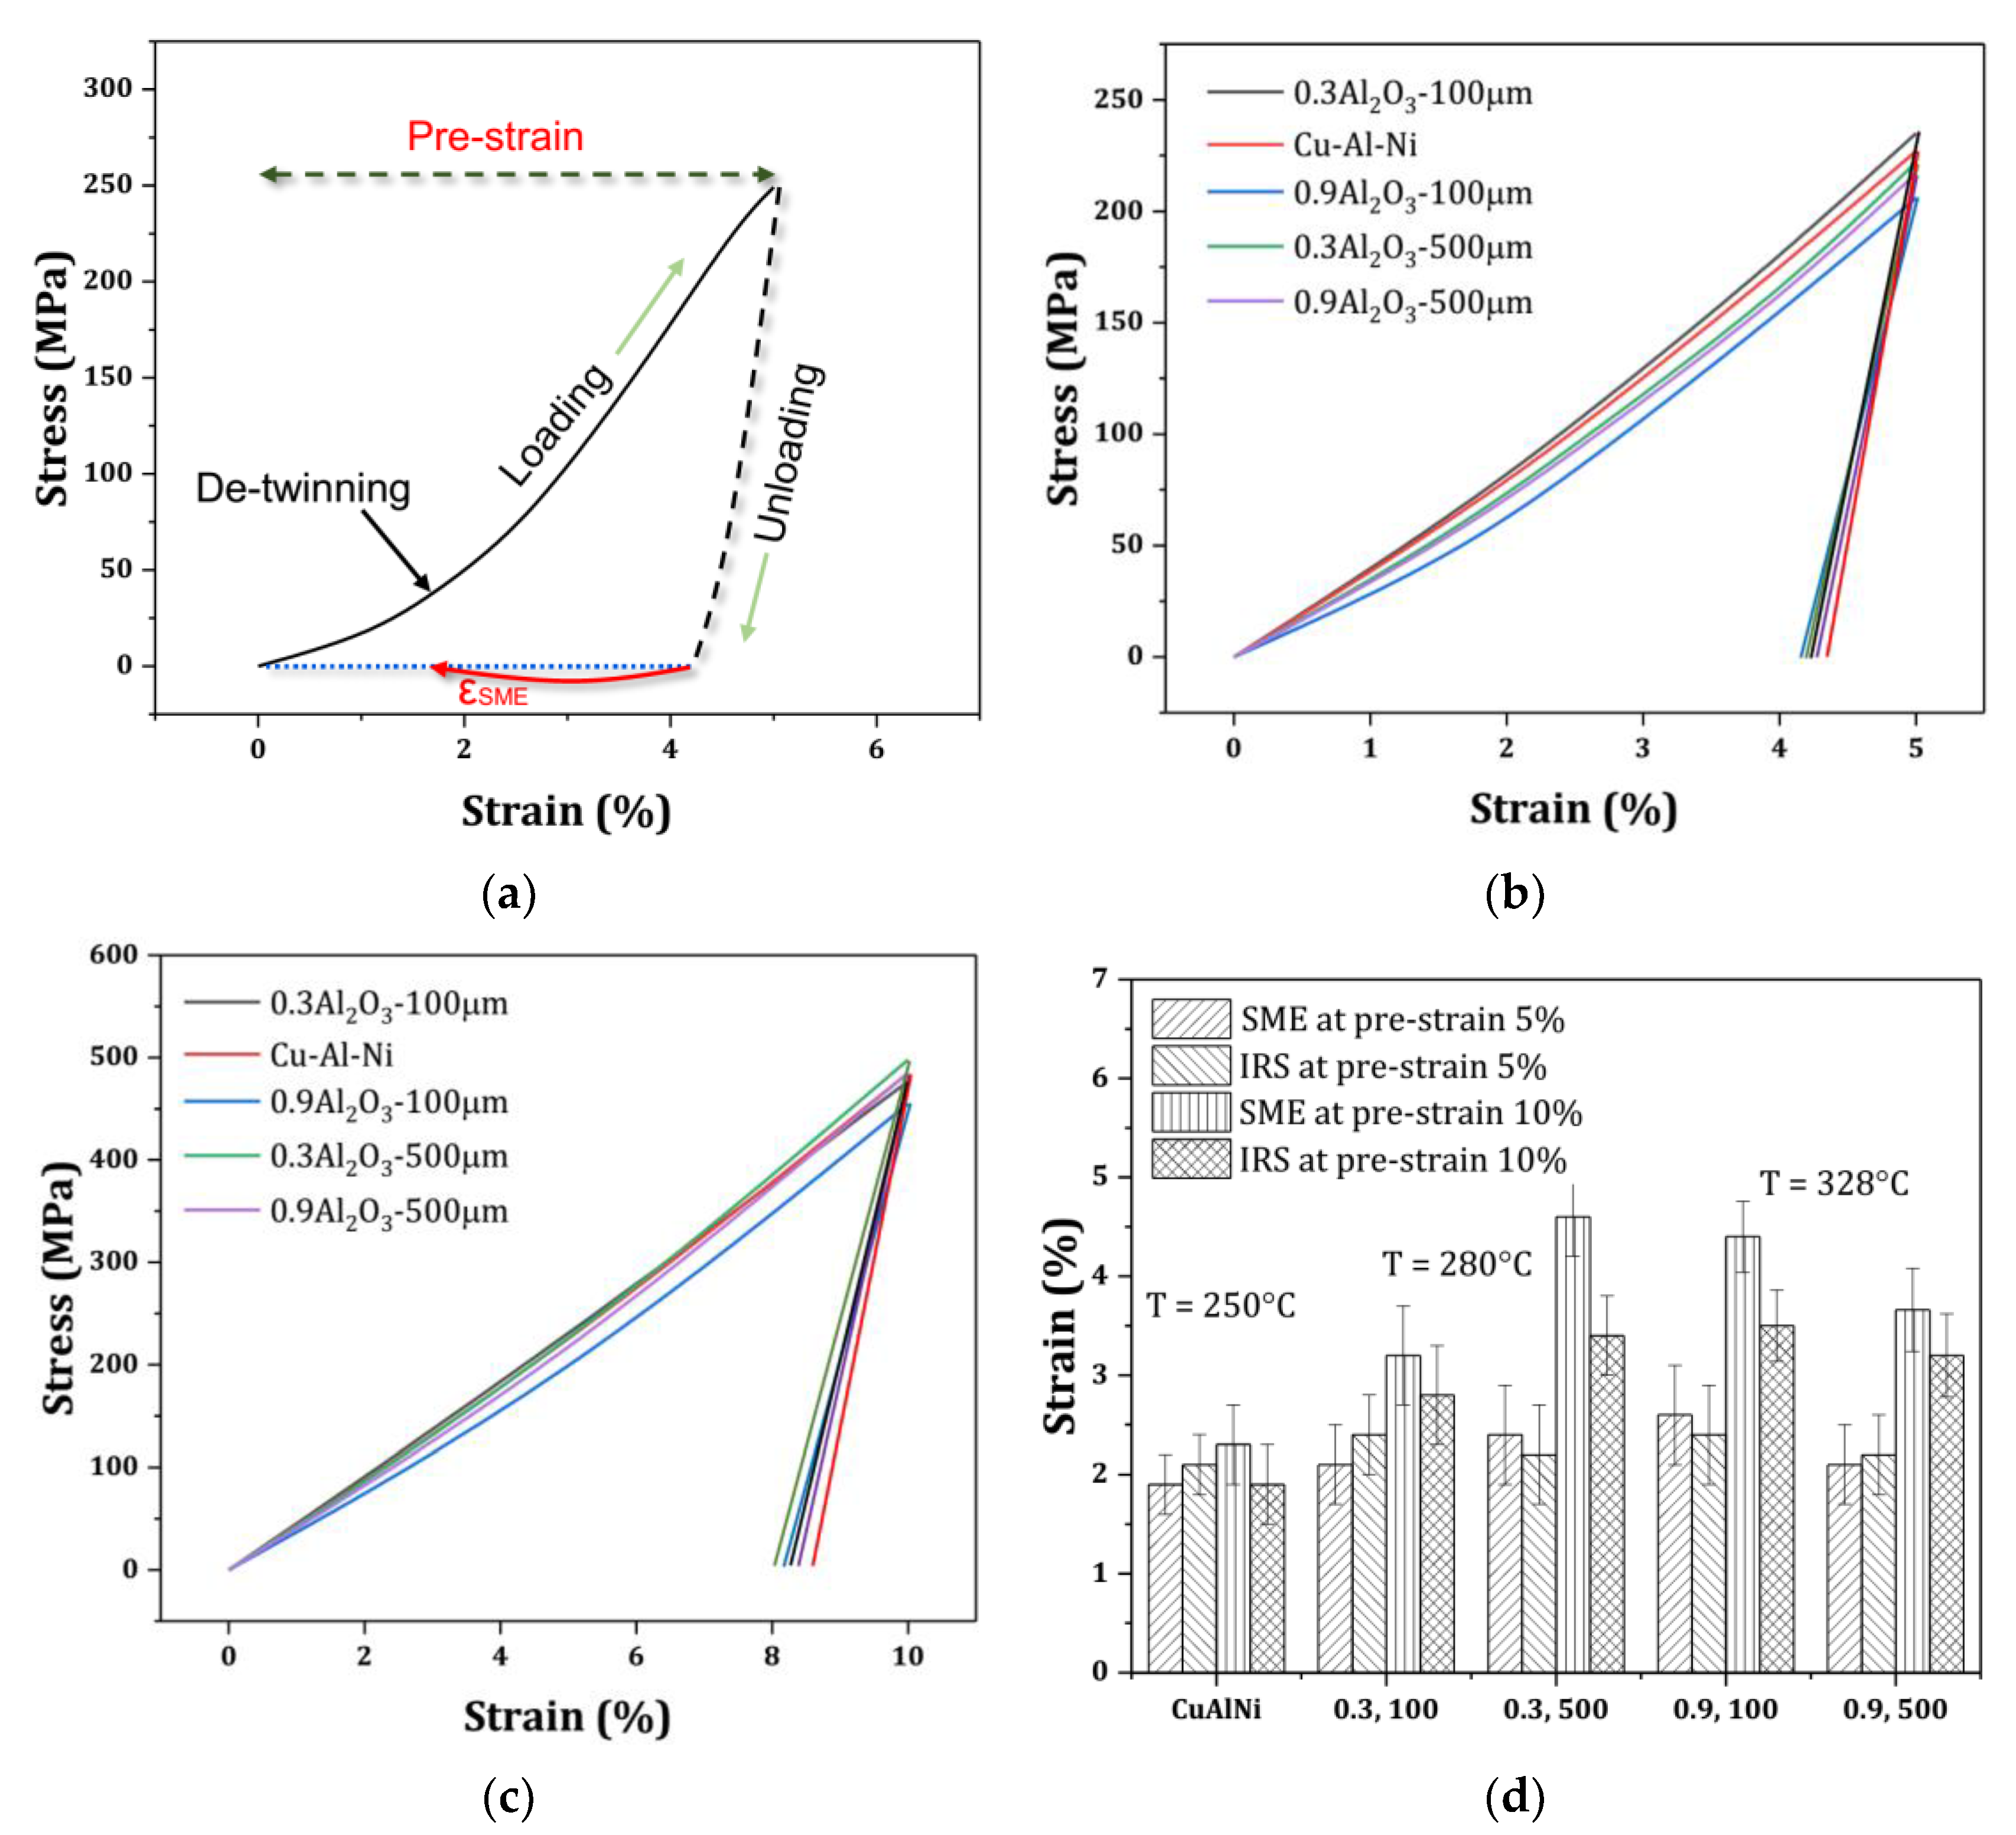
- The compressive samples show almost similar elastic moduli, but different compressive fracture strengths and flowing behaviors led to different SME behaviors.
- With the increase in pre-strain from 5% to 10%, the SME was increased, and an increase in the SME was observed. The increased SME was a result of the enhanced mismatch between the reinforcement particles and matrix around the neutral plane.
- A higher SME was achieved at a lower thickness of the local reinforcement layer accompanied by higher reinforcement content. The fracture mode and higher fracture strain are responsible for this observation.
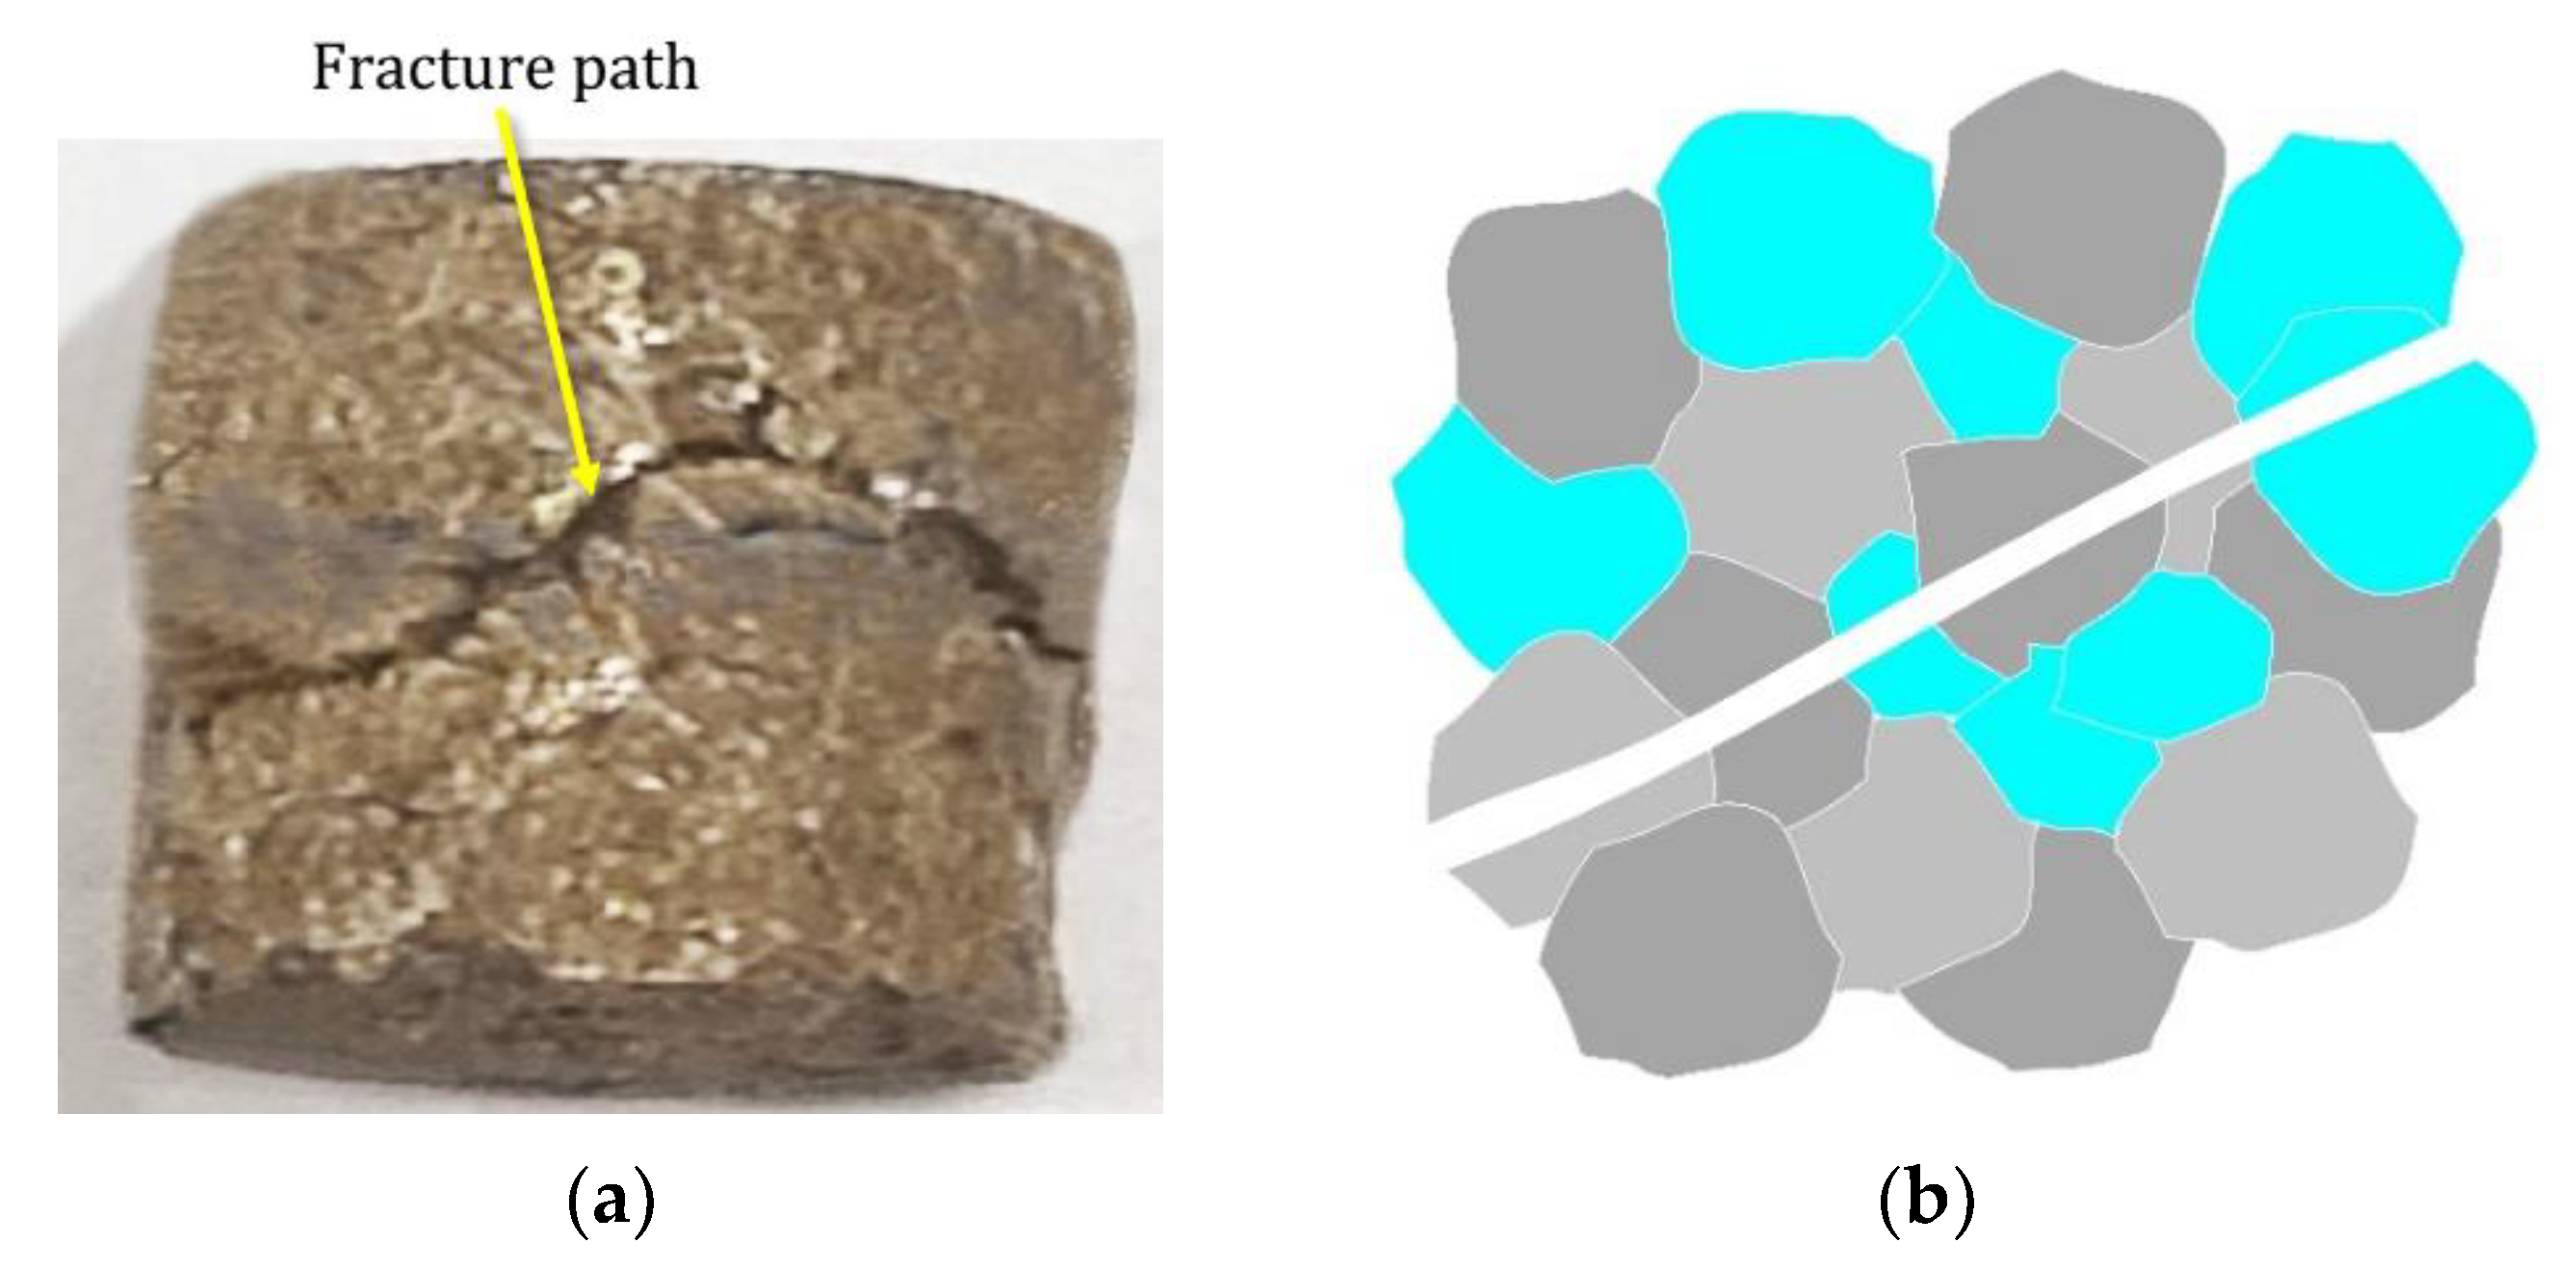
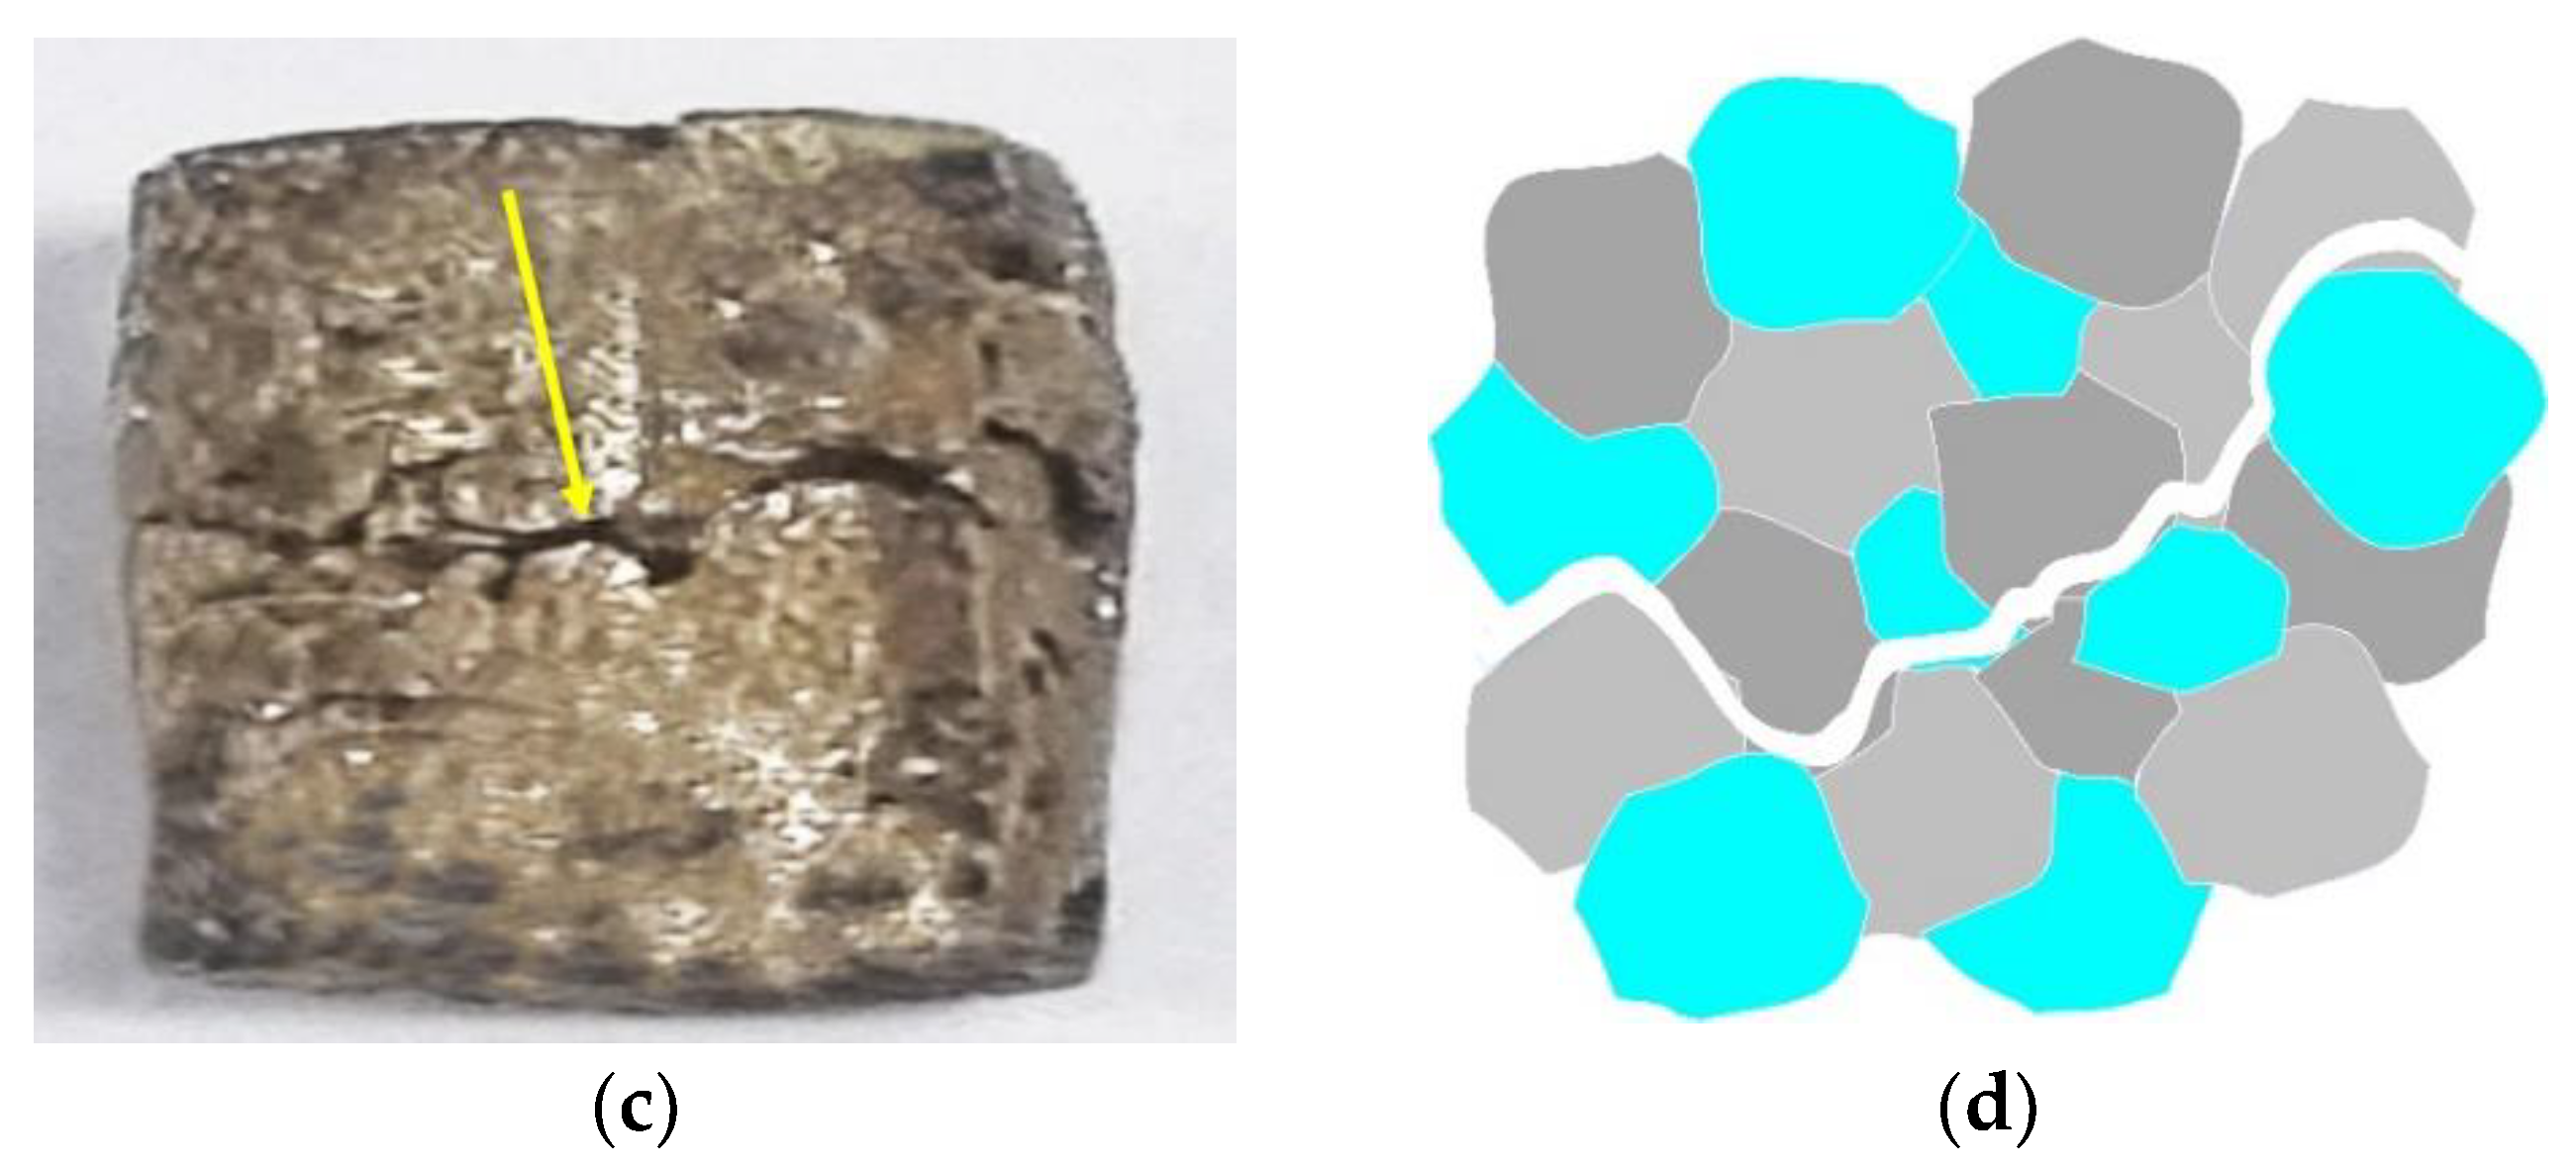
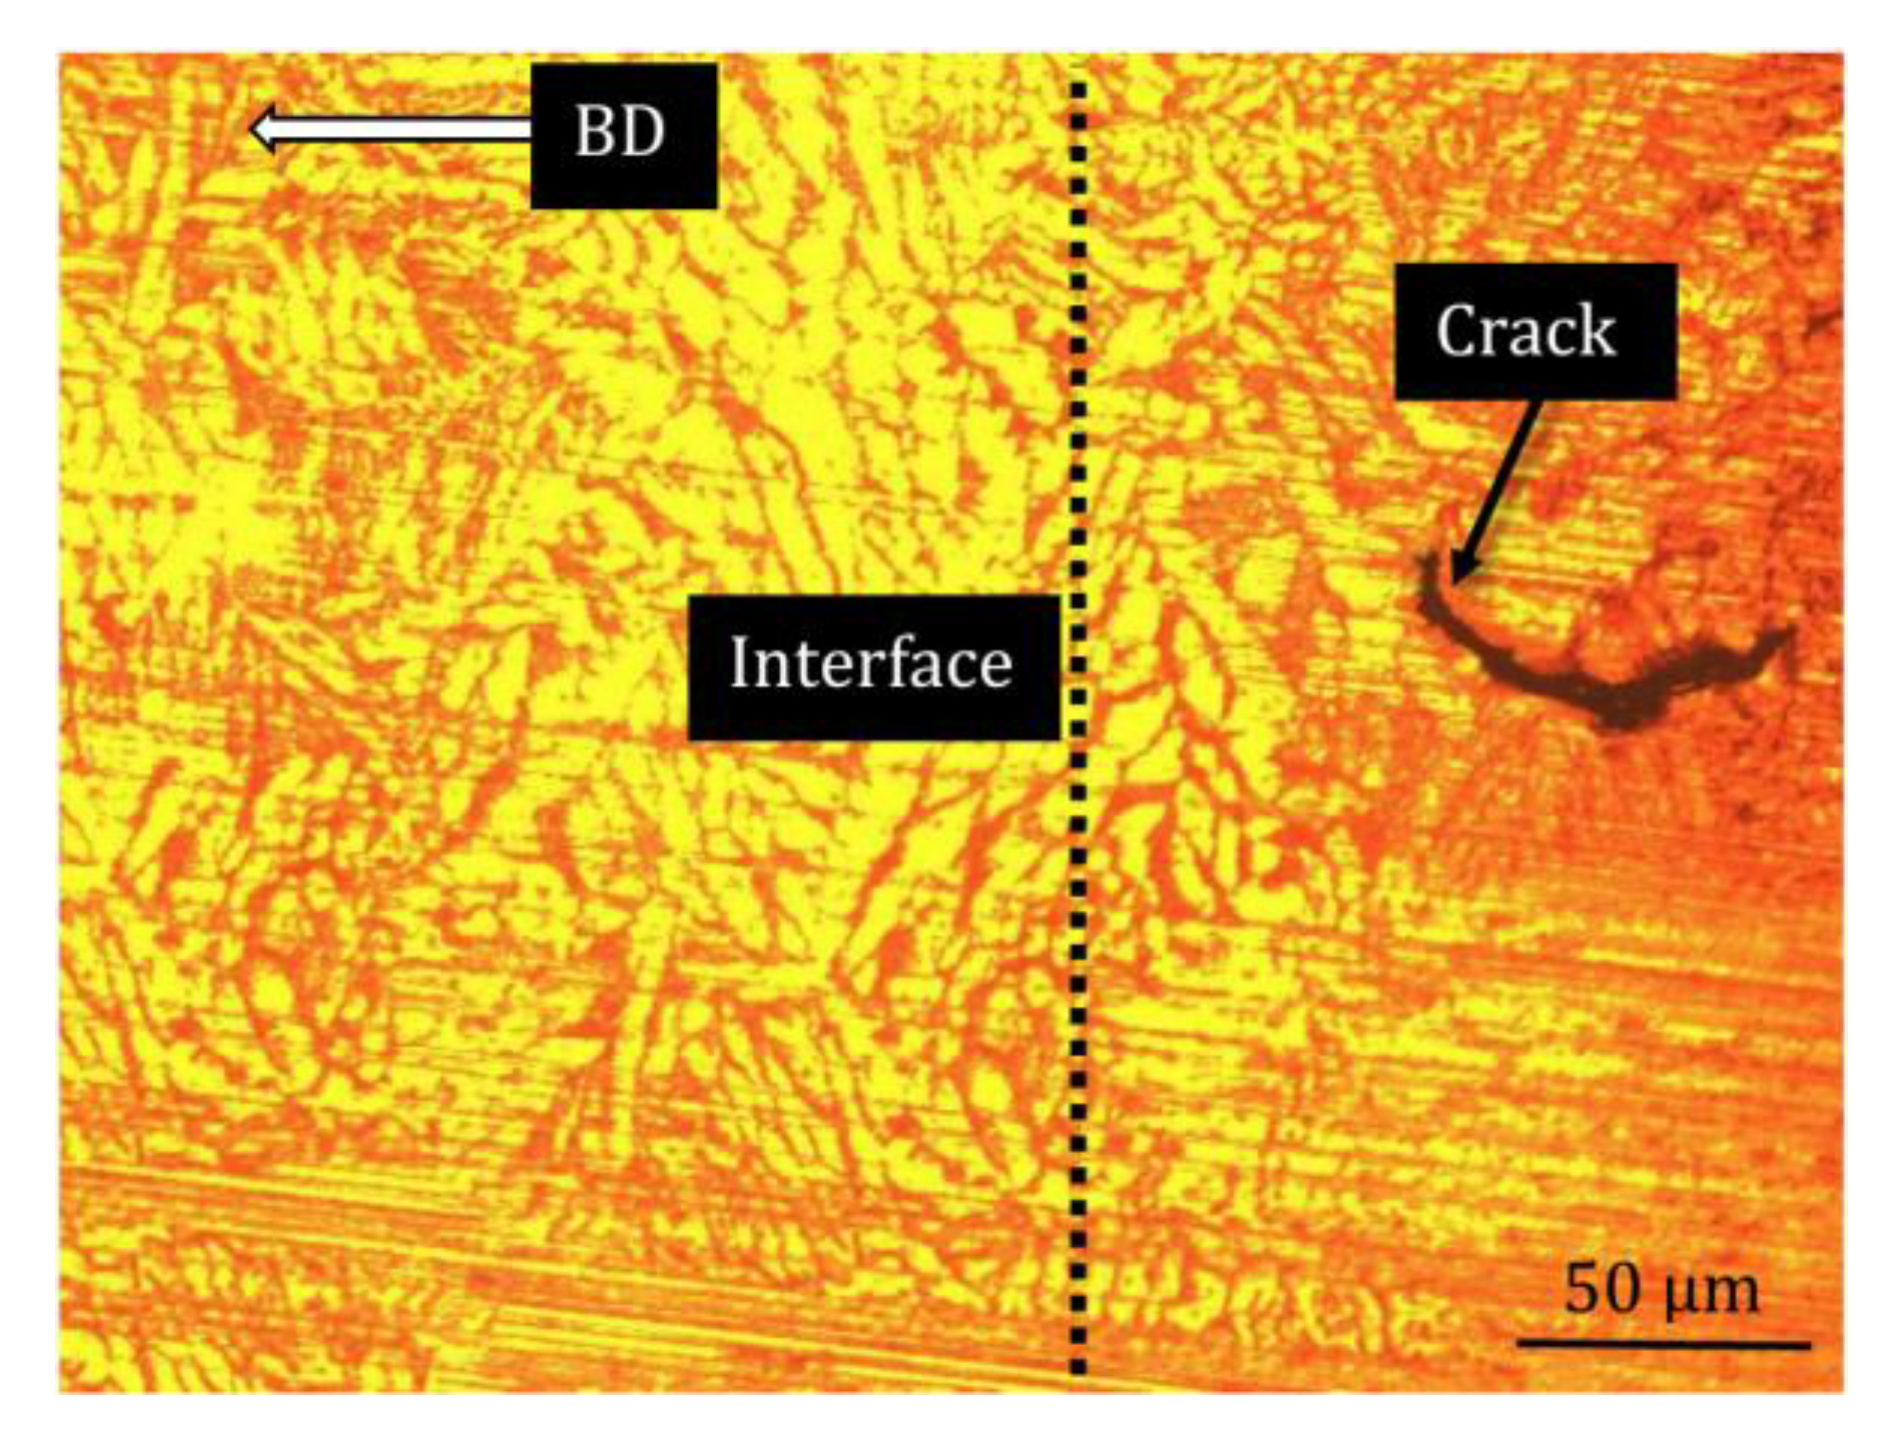
- The sharp propagation of the fracture path in the original Cu–Al–Ni alloy was inhibited by the locally reinforced layer, showing a curved fracture path. This implied the better ductility of the material, accompanied by a higher fracture strain, indicating an improvement in the brittle fracture at the triple junctions of the Cu–Al–Ni SMA.
Author Contributions
Funding
Institutional Review Board Statement
Informed Consent Statement
Data Availability Statement
Conflicts of Interest
References
- Agrawal, A.; Dube, R.K. Methods of fabricating Cu-Al-Ni shape memory alloys. J. Alloys Compd. 2018, 750, 235–247. [Google Scholar] [CrossRef]
- Shishkovsky, I.; Yadroitsev, I.; Morozov, Y. Laser-assisted synthesis in Cu-Al-Ni system and some of its properties. J. Alloys Compd. 2016, 658, 875–879. [Google Scholar] [CrossRef]
- Al-Humairi, S.N.S. Cu-based shape memory alloys: Modified structures and their related properties. In Recent Advancements in the Metallurgical Engineering and Electrodeposition; Al-Naib, U.B., Vikraman, D., Karuppasamy, K., Eds.; IntechOpen: London, UK, 2019. [Google Scholar] [CrossRef]
- Gustmann, T.; Schwab, H.; Kühn, U.; Pauly, S. Selective laser remelting of an additively manufactured Cu-Al-Ni-Mn shape-memory alloy. Mater. Des. 2018, 153, 129–138. [Google Scholar] [CrossRef]
- Ivanić, I.; Kožuh, S.; Grgurić, T.H.; Vrsalović, L.; Gojić, M. The effect of heat treatment on damping capacity and mechanical properties of CuAlNi shape memory alloy. Materials 2022, 15, 1825. [Google Scholar] [CrossRef] [PubMed]
- Zhang, X.; Cui, T.; Zhang, X.; Liu, Q.; Dong, Z.; Man, C. Effect of Nd addition on the microstructure, mechanical properties, shape memory effect and corrosion behaviour of Cu-Al-Ni high temperature shape memory alloys. J. Alloys Compd. 2021, 858, 157685. [Google Scholar] [CrossRef]
- Gustmann, T.; dos Santos, J.M.; Gargarella, P.; Kuhn, U.; Van Humbeeck, J.; Pauly, S. Properties of Cu-based shape-memory alloys prepared by selective laser melting. Shape Mem. Superelasticity 2017, 3, 24–36. [Google Scholar] [CrossRef]
- Tadaki, T. Cu-based shape memory alloys. In Shape Memory Materials; Otsuka, K., Wayman, C.M., Eds.; Cambridge University Press: Cambridge, UK, 1998; pp. 97–116. [Google Scholar]
- Abolhasani, D.; Han, S.W.; VanTyne, C.J.; Kang, N.; Moon, Y.H. Enhancing the shape memory effect of Cu-Al-Ni alloys via partial reinforcement by alumina through selective laser melting. J. Mater. Res. Technol. 2021, 15, 4032–4047. [Google Scholar] [CrossRef]
- Lu, H.Z.; Ma, H.W.; Cai, W.S.; Luo, X.; Wang, Z.; Song, C.H.; Yin, S.; Yang, C. Stable tensile recovery strain induced by a Ni4Ti3 nanoprecipitate in a Ni50.4Ti49.6 shape memory alloy fabricated via selective laser melting. Acta Mater. 2021, 219, 117261. [Google Scholar] [CrossRef]
- Santosh, S.; Kevin Thomas, J.; Rajkumar, K.; Sabareesh, A. Effect of Ni and Mn additions on the damping characteristics of Cu-Al-Fe based high temperature shape memory alloys. J. Alloys Compd. 2022, 924, 166258. [Google Scholar] [CrossRef]
- Santosh, S.; Srivatsan, S.; Vignesh Pandian, R. Unravelling the effect of CO2 laser machining parameters on the surface and shape memory characteristics of CuAlFeMn quaternary shape memory alloy. Opt. Laser Technol. 2023, 163, 109306. [Google Scholar] [CrossRef]
- Lu, H.Z.; Liu, L.H.; Yang, C.; Luo, X.; Song, C.H.; Wang, Z.; Wang, J.; Su, Y.D.; Ding, Y.F.; Zhang, L.C.; et al. Simultaneous enhancement of mechanical and shape memory properties by heat-treatment homogenization of Ti2Ni precipitates in TiNi shape memory alloy fabricated by selective laser melting. J. Mater. Sci. Technol. 2022, 101, 205–216. [Google Scholar] [CrossRef]
- Jeon, J.; Choi, S.G.; Seo, N.H.; Moon, Y.H.; Shon, I.J.; Lee, S.J. Effects of TiC addition on strain-induced martensite transformation and mechanical properties of nanocrystalline Fe-Mn alloy fabricated by spark plasma sintering. Arch. Metall. Mater. 2020, 65, 1249–1254. [Google Scholar] [CrossRef]
- Liu, Y.; Xie, Z. Detwinning in shape memory alloy. In Progress in Smart Materials and Structures; Nova Science Publishers, Inc.: Hauppauge, NY, USA, 2007. [Google Scholar]
- Li, X.; Jean Willy, H.; Chang, S.; Lu, W.; Herng, T.S.; Ding, J. Selective laser melting of stainless steel and alumina composite: Experimental and simulation studies on processing parameters, microstructure and mechanical properties. Mater. Des. 2018, 145, 1–10. [Google Scholar] [CrossRef]
- Abolhasani, D.; Seyedkashi, S.M.H.; Kang, N.; Kim, Y.J.; Woo, Y.Y.; Moon, Y.H. Analysis of melt-pool behaviors during selective laser melting of AISI 304 stainless-steel composites. Metals 2019, 9, 876. [Google Scholar] [CrossRef]
- Abolhasani, D.; Seyedkashi, S.M.H.; Hwang, T.W.; Moon, Y.H. Selective laser melting of AISI 304 stainless steel composites reinforced by Al2O3 and eutectic mixture of Al2O3–ZrO2 powders. Mater. Sci. Eng. A 2019, 763, 138161. [Google Scholar] [CrossRef]
- Abolhasani, D.; Moon, B.; Kang, N.H.; VanTyne, C.J.; Moon, Y.H. Feasibility of using graphene as a substitute to graphite in the laser surface hardening of ferritic stainless steel. J. Mater. Res. Technol. 2023, 23, 3232–3248. [Google Scholar] [CrossRef]
- Abolhasani, D.; Han, S.W.; VanTyne, C.J.; Kang, N.; Moon, Y.H. Powder bed fusion of two-functional Cu-Al-Ni shape memory alloys utilized for 4D printing. J. Alloys Compd. 2022, 922, 166228. [Google Scholar] [CrossRef]
- Najib, A.S.M.; Saud, S.N.; Hamzah, E. Corrosion Behavior of Cu–Al–Ni–xCo shape memory alloys coupled with low-carbon steel for civil engineering applications. J. Bio-Tribo-Corros. 2019, 5, 47. [Google Scholar] [CrossRef]
- Kim, H.S. On the rule of mixtures for the hardness of particle reinforced composites. Mater. Sci. Eng. 2000, 289, 30–33. [Google Scholar] [CrossRef]
- Wu, H. 9-Toughening and strengthening mechanisms in ceramic nanocomposites. In Woodhead Publishing Series in Composites Science and Engineering, Residual Stresses in Composite Materials, 2nd ed.; Mahmood, M.S., Ed.; Woodhead Publishing: Sawston, UK, 2021; pp. 279–311. [Google Scholar] [CrossRef]
- Kier, W.M. Commentary The diversity of hydrostatic skeletons. J. Exp. Biol. 2012, 215, 1247–1257. [Google Scholar] [CrossRef]
- Pushin, V.; Kuranova, N.; Svirid, A.E.; Ustyugov, Y. Mechanical behavior and structural characterization of a Cu-Al-Ni-based shape-memory alloy subjected to isothermal uniaxial megaplastic compression. Materials 2022, 15, 3713. [Google Scholar] [CrossRef] [PubMed]
- Yao, P.S.; Huang, H.Y.; Su, Y.J.; Xie, J.X. Two-Way shape memory effect induced by tensile deformation in columnar-grained Cu71.7Al18.1Mn10.2 alloy. Materials 2018, 11, 2109. [Google Scholar] [CrossRef] [PubMed]
- Lu, H.Z.; Chen, T.; Liu, L.H.; Wang, H.; Luo, X.; Song, C.H.; Wang, Z.; Yang, C. Constructing function domains in NiTi shape memory alloys by additive manufacturing. Virtual Phys. Prototyp. 2022, 17, 563–581. [Google Scholar] [CrossRef]
- Sarı, U.; Kırındı, T. Effects of deformation on microstructure and mechanical properties of a Cu–Al–Ni shape memory alloy. Mater. Charact. 2008, 59, 920–929. [Google Scholar] [CrossRef]
- Ma, J.; Hornbuckle, B.C.; Karaman, I.; Thompson, G.B.; Luo, Z.P.; Chumlyakov, Y.I. The effect of nanoprecipitates on the superelastic properties of FeNiCoAlTa shape memory alloy single crystals. Acta Mater. 2013, 61, 3445–3455. [Google Scholar] [CrossRef]
- Tseng, L.W.; Ma, J.; Hornbuckle, B.C.; Karaman, I.; Thompson, G.B.; Luo, Z.P.; Chumlyakov, Y.I. The effect of precipitates on the superelastic response of [100] oriented FeMnAlNi single crystals under compression. Acta Mater. 2015, 97, 234–244. [Google Scholar] [CrossRef]


| ID | Ms (°C) | Mf (°C) | As (°C) | Af (°C) |
|---|---|---|---|---|
| Cu–Al–Ni | 184 | 75 | 223 | 275 |
| Cu–Al–Ni-0.3Al2O3 | 225 | 103 | 246 | 320 |
| Cu–Al–Ni-0.9Al2O3 | 340 | 255 | 293 | 364 |
| Spectrum | Cu | Al | Ni | O |
|---|---|---|---|---|
| 1 | 81.0 | 11.5 | 7.4 | 0.1 |
| 2 | 82.7 | 12.2 | 5.0 | 0.1 |
Disclaimer/Publisher’s Note: The statements, opinions and data contained in all publications are solely those of the individual author(s) and contributor(s) and not of MDPI and/or the editor(s). MDPI and/or the editor(s) disclaim responsibility for any injury to people or property resulting from any ideas, methods, instructions or products referred to in the content. |
© 2023 by the authors. Licensee MDPI, Basel, Switzerland. This article is an open access article distributed under the terms and conditions of the Creative Commons Attribution (CC BY) license (https://creativecommons.org/licenses/by/4.0/).
Share and Cite
Abolhasani, D.; Kwon, H.-N.; Park, Y.-H.; Moon, Y.-H. Enhancing the Mechanical Properties of Cu–Al–Ni Shape Memory Alloys Locally Reinforced by Alumina through the Powder Bed Fusion Process. Materials 2023, 16, 3936. https://doi.org/10.3390/ma16113936
Abolhasani D, Kwon H-N, Park Y-H, Moon Y-H. Enhancing the Mechanical Properties of Cu–Al–Ni Shape Memory Alloys Locally Reinforced by Alumina through the Powder Bed Fusion Process. Materials. 2023; 16(11):3936. https://doi.org/10.3390/ma16113936
Chicago/Turabian StyleAbolhasani, Daniyal, Ha-Neul Kwon, Yong-Han Park, and Young-Hoon Moon. 2023. "Enhancing the Mechanical Properties of Cu–Al–Ni Shape Memory Alloys Locally Reinforced by Alumina through the Powder Bed Fusion Process" Materials 16, no. 11: 3936. https://doi.org/10.3390/ma16113936