
Advanced Tree-Based Techniques for Predicting Unconfined Compressive Strength of Rock Material Employing Non-Destructive and Petrographic Tests
 , ,
, , 
Abstract
:1. Introduction
2. Rock Strength Research Significance
3. Earlier Related Studies
4. Collection of Case Studies and Data
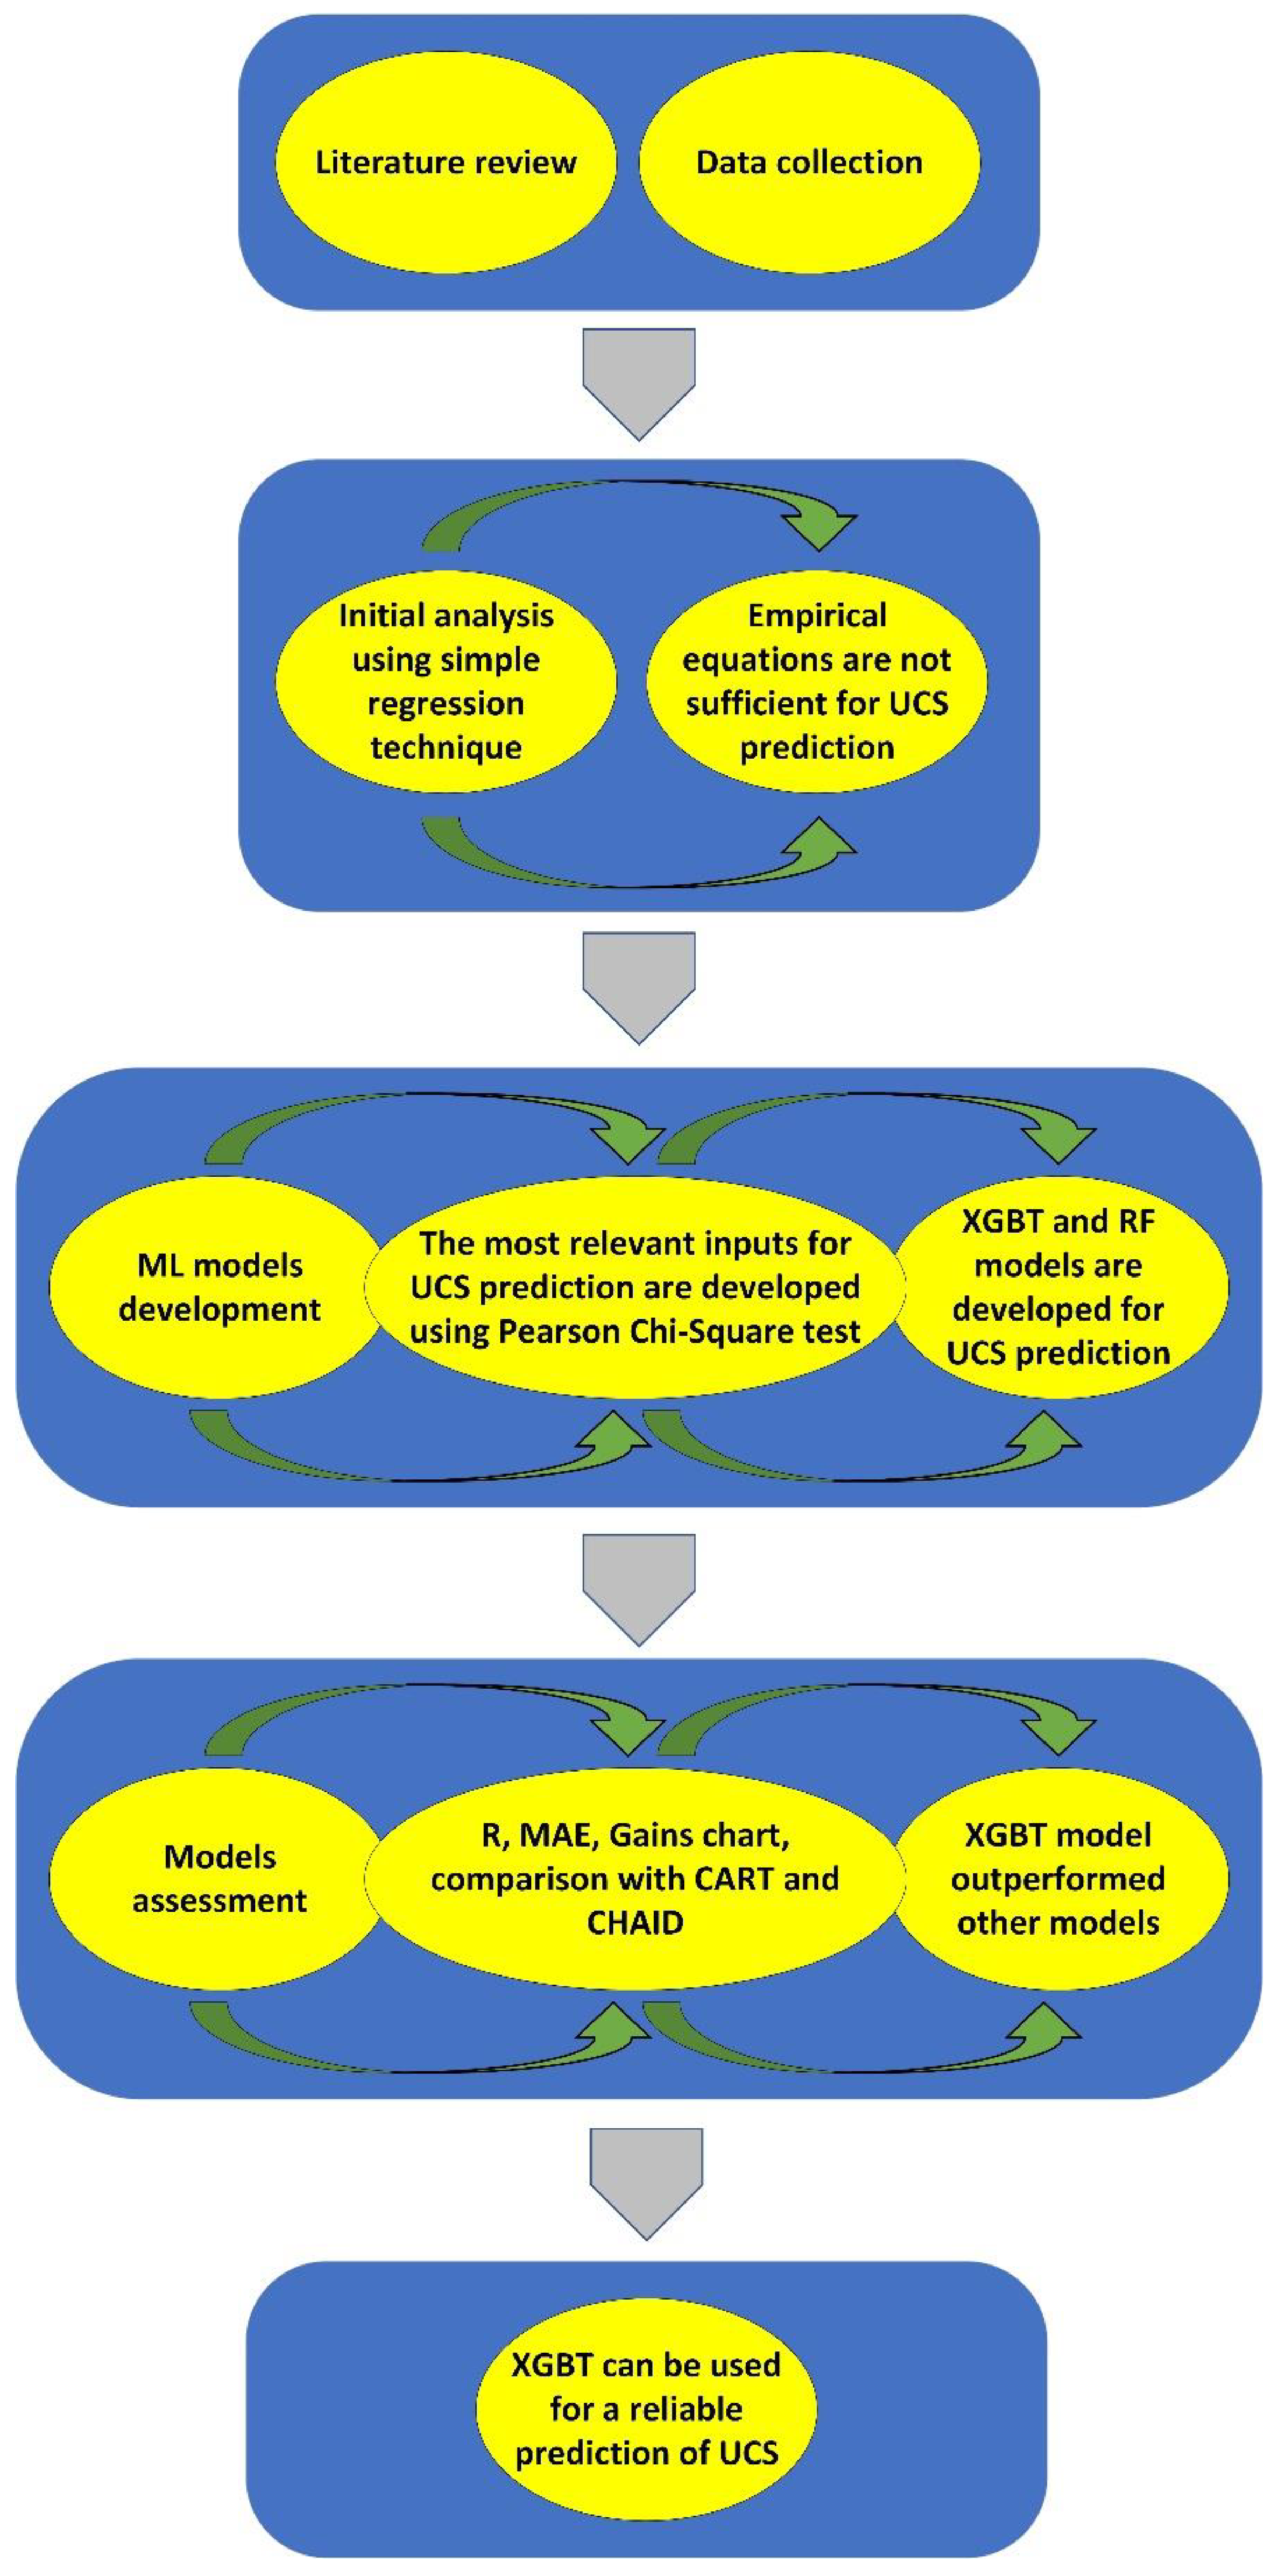
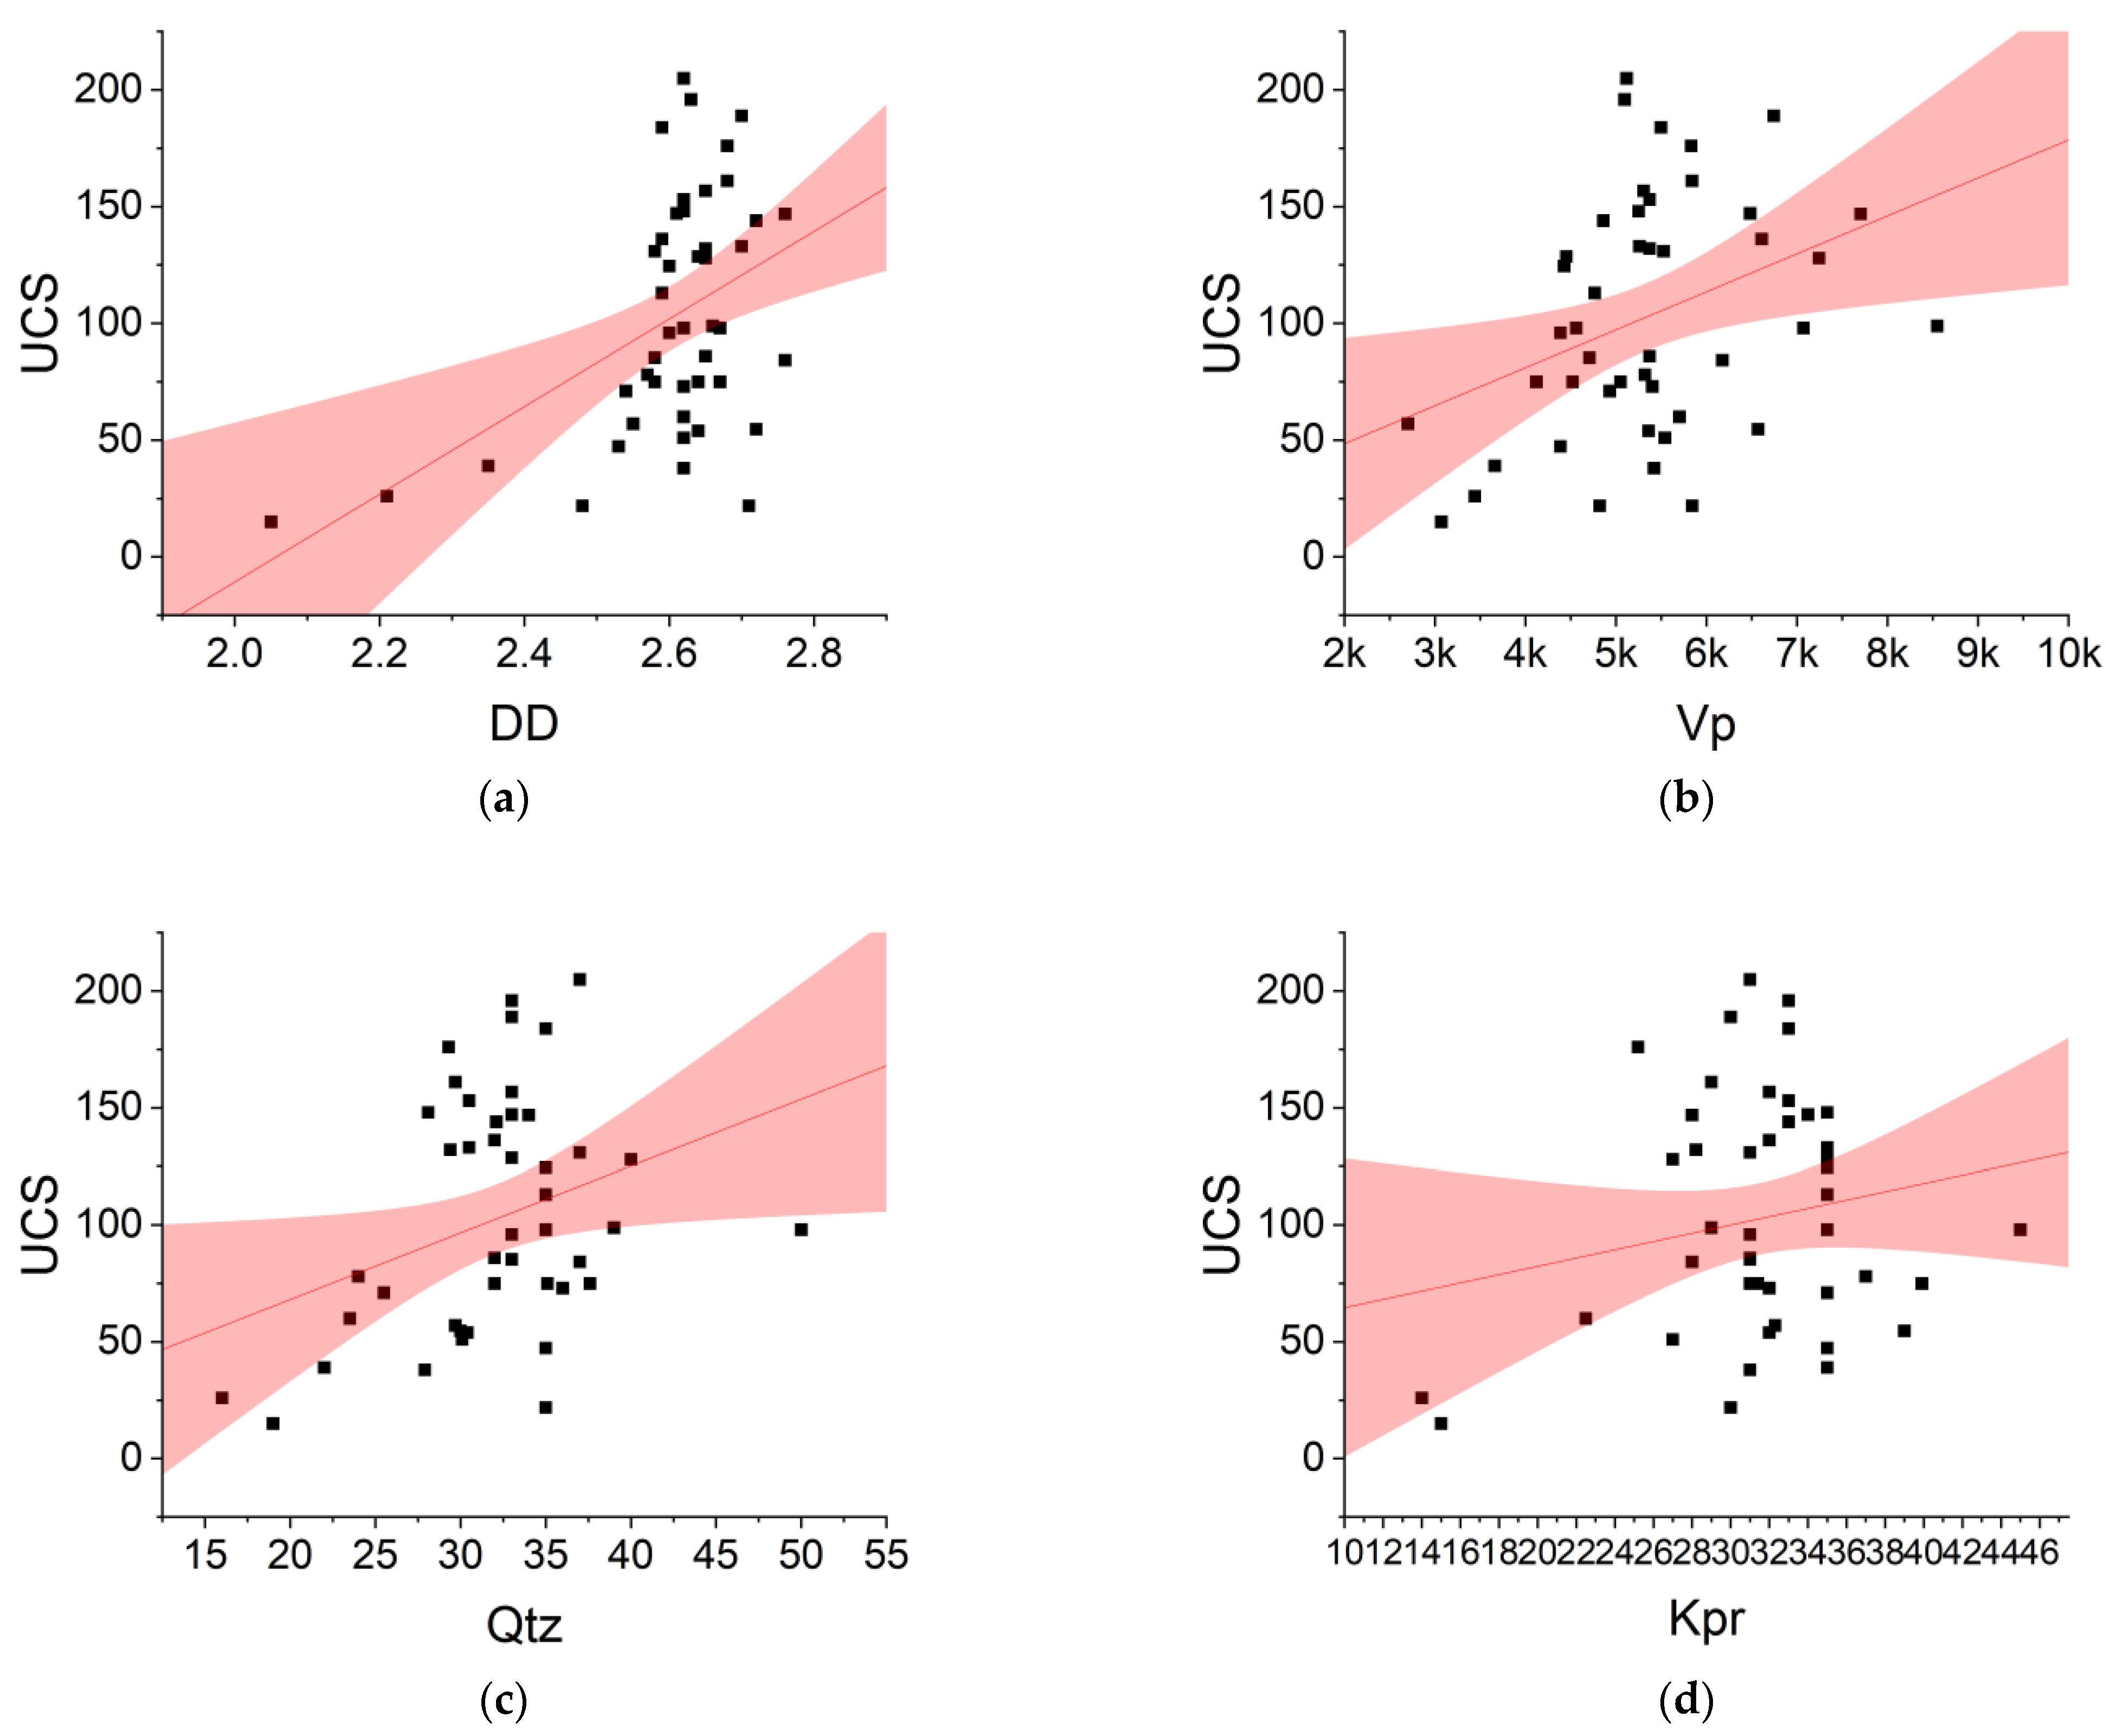
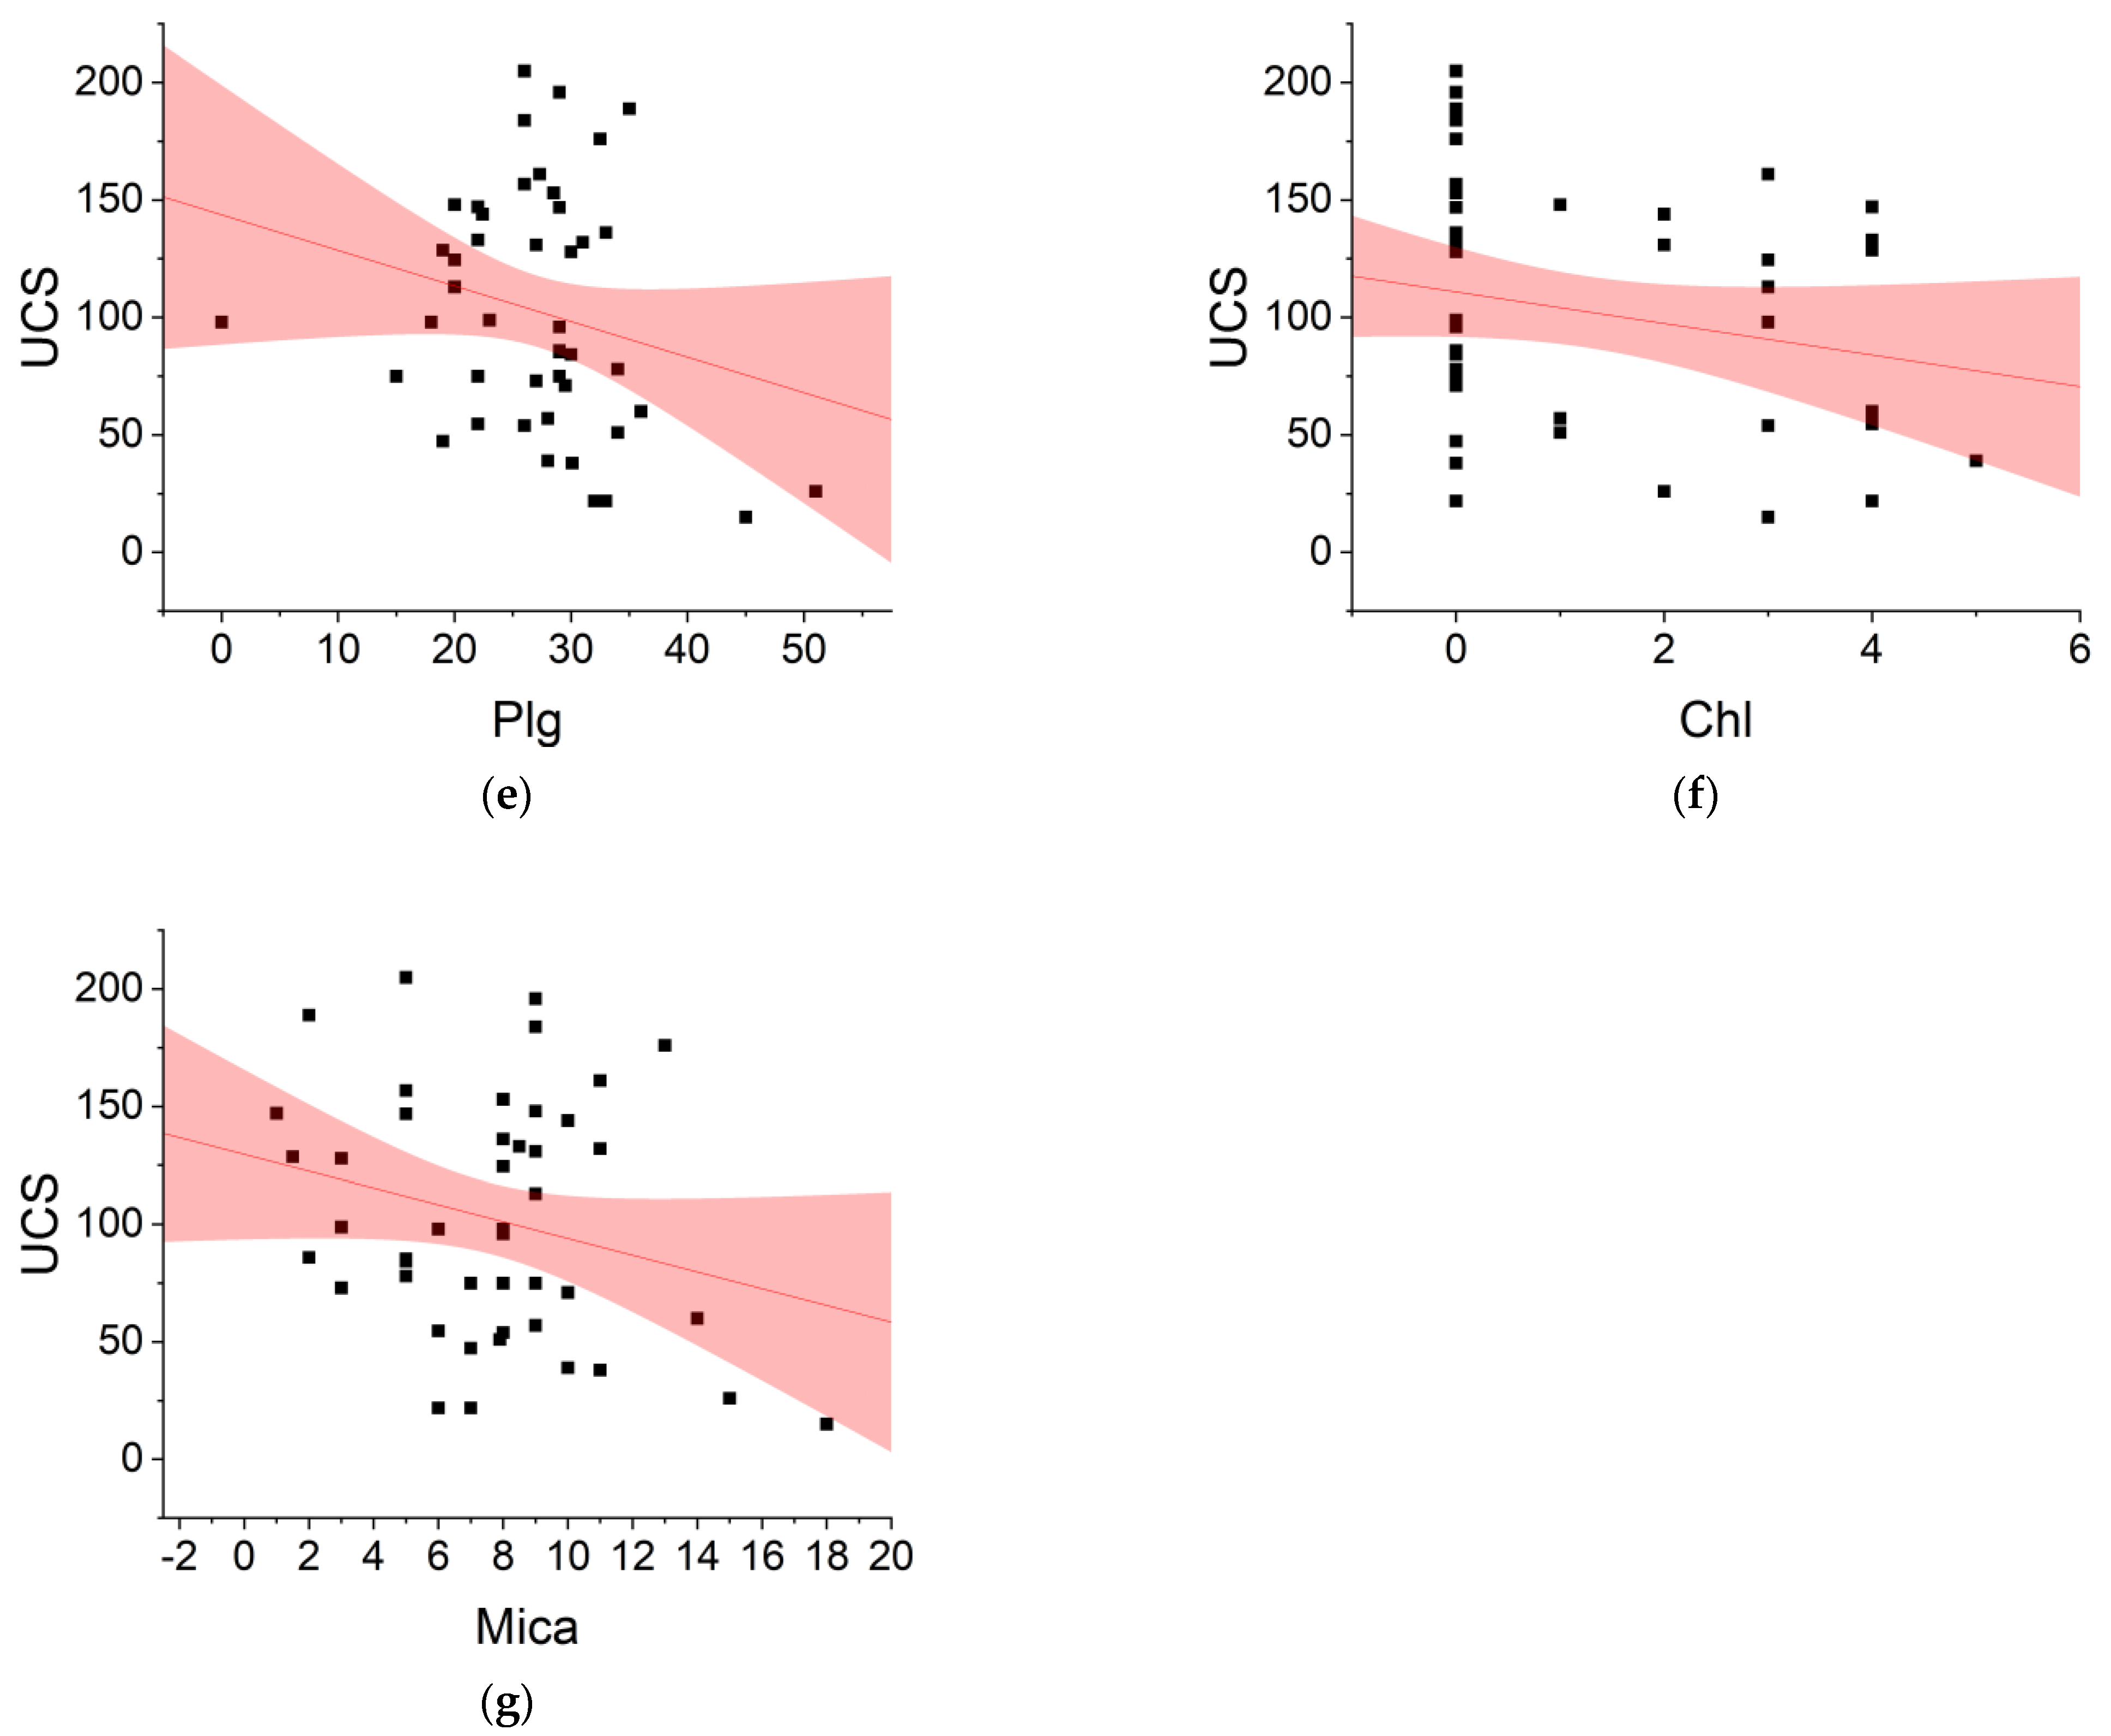
5. Analysis of Data
5.1. Regression Techniques
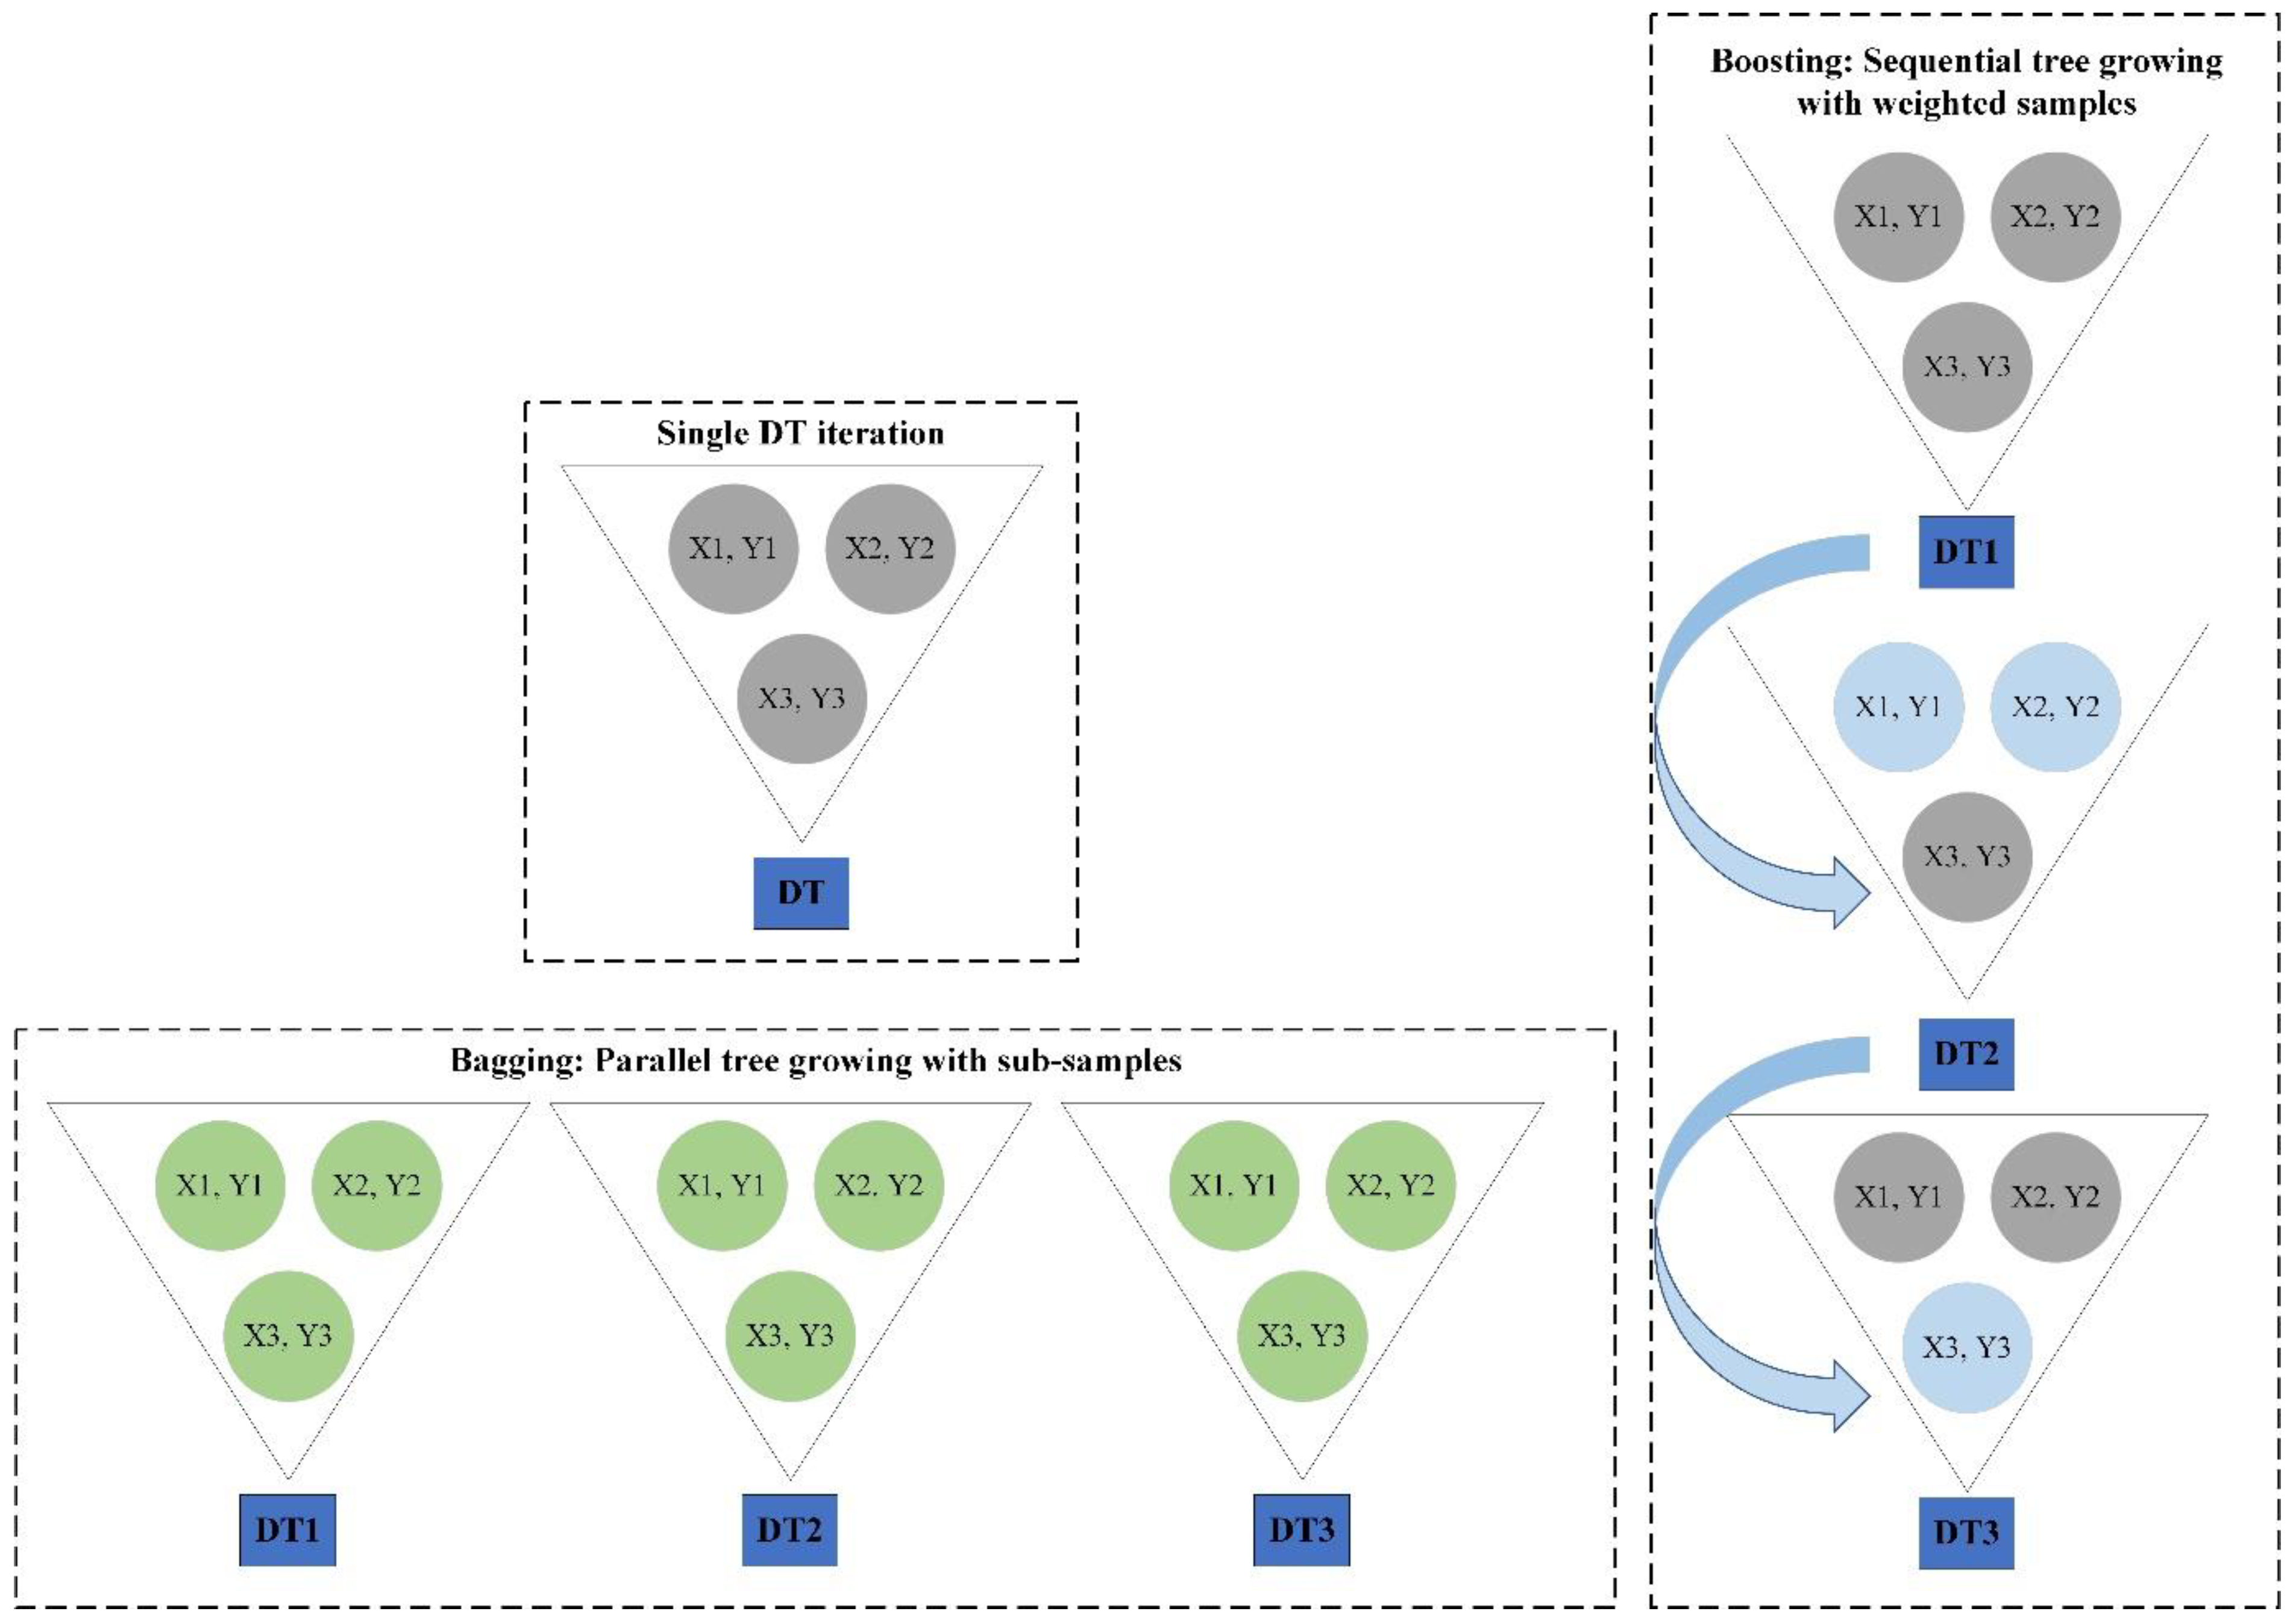
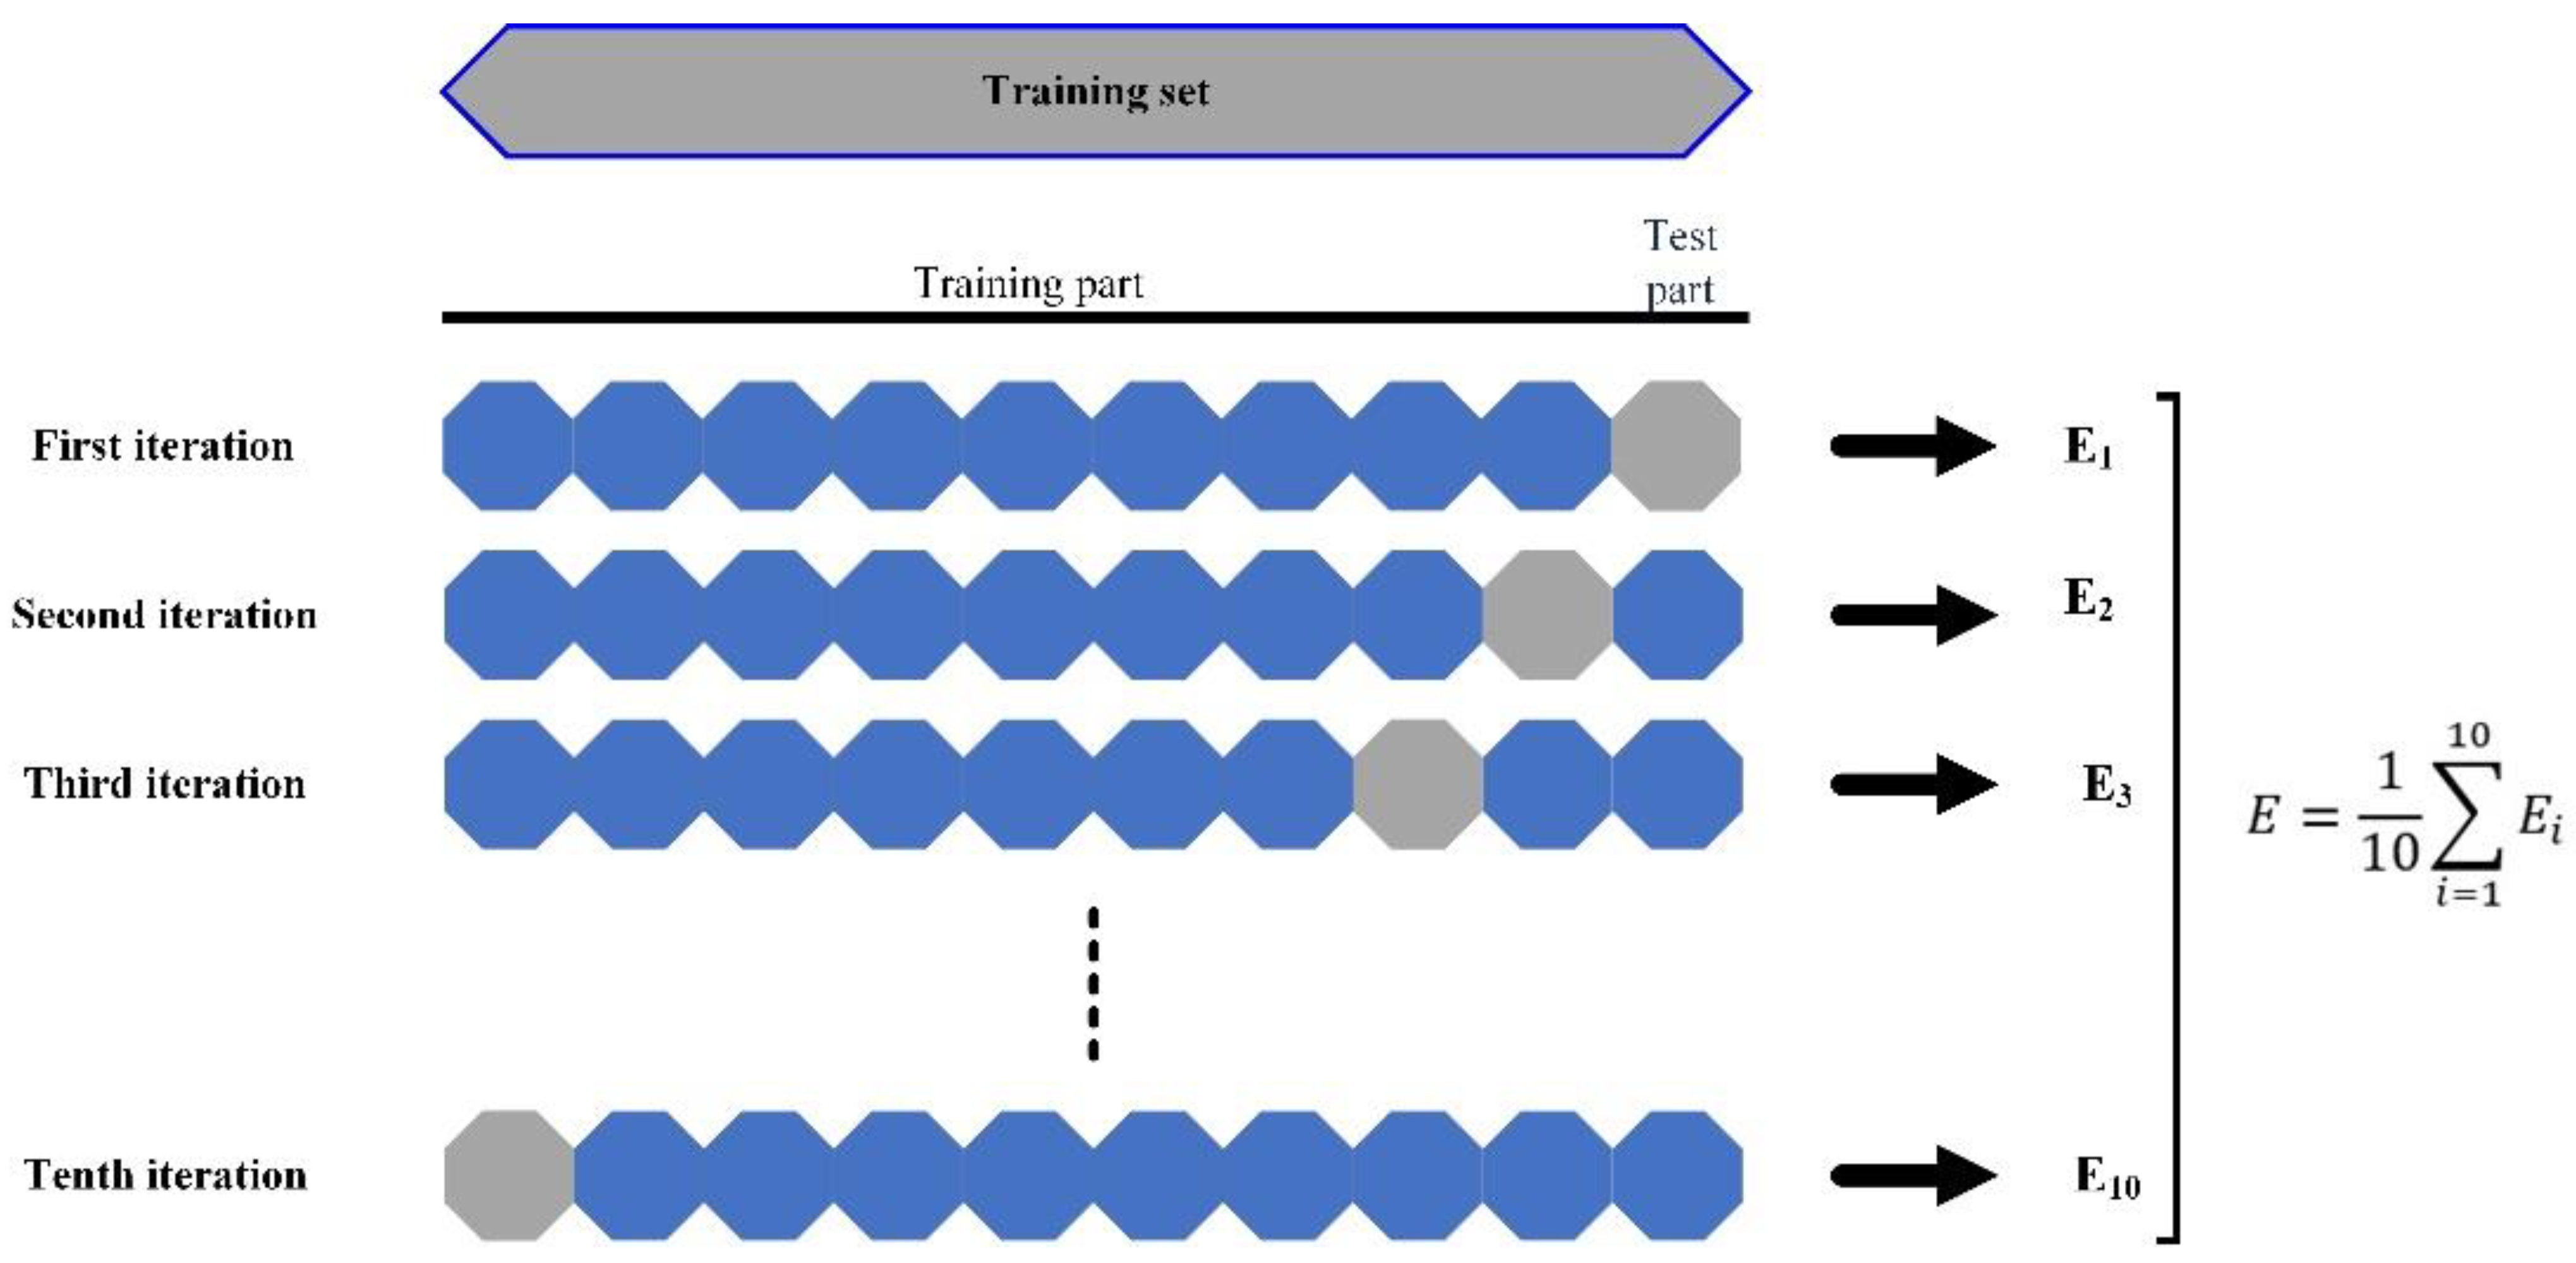
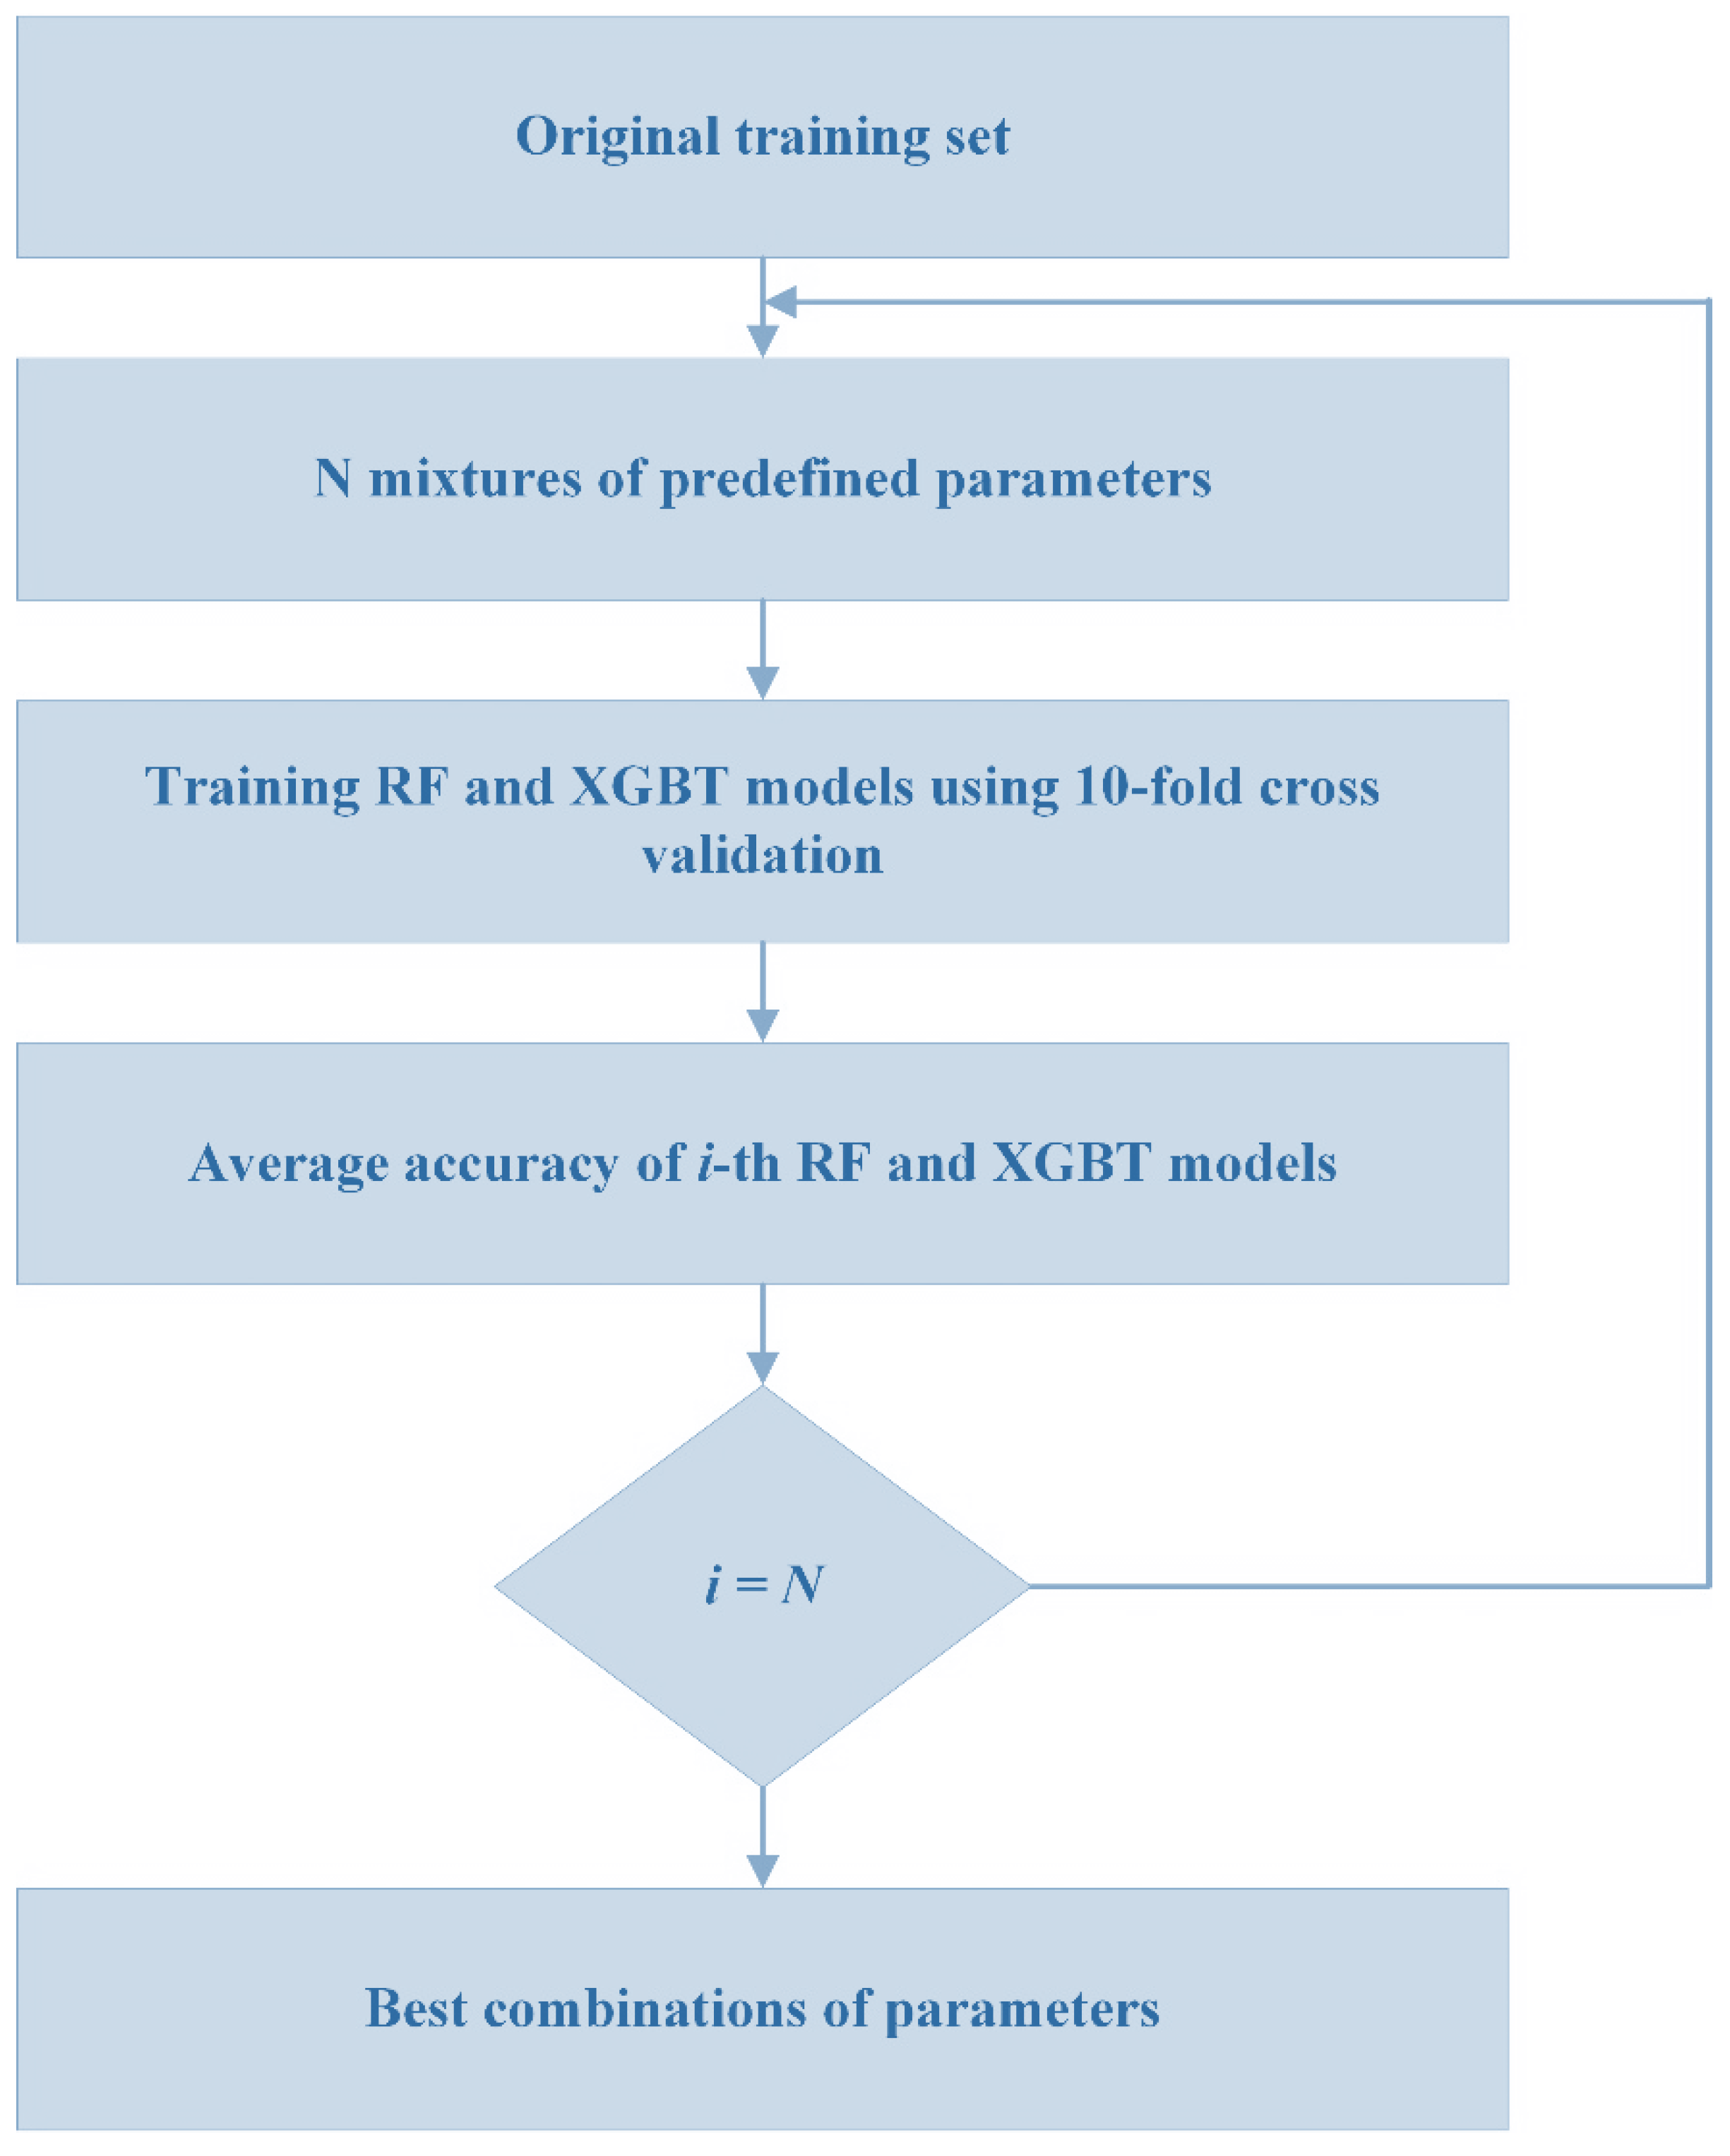
5.2. Decision Tree Models
6. Results and Discussion
7. Limitations and Future Works
8. Conclusions
Author Contributions
Funding
Institutional Review Board Statement
Informed Consent Statement
Data Availability Statement
Acknowledgments
Conflicts of Interest
References
- Singh, R.; Kainthola, A.; Singh, T. Estimation of elastic constant of rocks using an ANFIS approach. Appl. Soft Comput. 2012, 12, 40–45. [Google Scholar] [CrossRef]
- Monjezi, M.; Khoshalan, H.A.; Razifard, M. A neuro-genetic network for predicting uniaxial compressive strength of rocks. Geotech. Geol. Eng. 2012, 30, 1053–1062. [Google Scholar] [CrossRef]
- Kahraman, S. The determination of uniaxial compressive strength from point load strength for pyroclastic rocks. Eng. Geol. 2014, 170, 33–42. [Google Scholar] [CrossRef]
- Tandon, R.S.; Gupta, V. Estimation of strength characteristics of different Himalayan rocks from Schmidt hammer rebound, point load index, and compressional wave velocity. Bull. Eng. Geol. Environ. 2015, 74, 521–533. [Google Scholar] [CrossRef]
- Azarafza, M.; Hajialilue Bonab, M.; Derakhshani, R. A Deep Learning Method for the Prediction of the Index Mechanical Properties and Strength Parameters of Marlstone. Materials 2022, 15, 6899. [Google Scholar] [CrossRef]
- Luo, J.a.; He, J. Constitutive model and fracture failure of sandstone damage under high temperature–cyclic stress. Materials 2022, 15, 4903. [Google Scholar] [CrossRef]
- Yilmaz, I.; Yuksek, G. Prediction of the strength and elasticity modulus of gypsum using multiple regression, ANN, and ANFIS models. Int. J. Rock Mech. Min. Sci. 2009, 46, 803–810. [Google Scholar] [CrossRef]
- Dehghan, S.; Sattari, G.; Chelgani, S.C.; Aliabadi, M. Prediction of uniaxial compressive strength and modulus of elasticity for Travertine samples using regression and artificial neural networks. Min. Sci. Technol. 2010, 20, 41–46. [Google Scholar] [CrossRef]
- Beiki, M.; Majdi, A.; Givshad, A.D. Application of genetic programming to predict the uniaxial compressive strength and elastic modulus of carbonate rocks. Int. J. Rock Mech. Min. Sci. 2013, 63, 159–169. [Google Scholar] [CrossRef]
- O’Rourke, J. Rock index properties for geoengineering in underground development. Min. Eng. 1989, 41, 106–109. [Google Scholar]
- Rezaei, M.; Majdi, A.; Monjezi, M. An intelligent approach to predict unconfined compressive strength of rock surrounding access tunnels in longwall coal mining. Neural Comput. Appl. 2014, 24, 233–241. [Google Scholar] [CrossRef]
- Moradi, M.; Basiri, S.; Kananian, A.; Kabiri, K. Fuzzy logic modeling for hydrothermal gold mineralization mapping using geochemical, geological, ASTER imageries and other geo-data, a case study in Central Alborz, Iran. Earth Sci. Inform. 2015, 8, 197–205. [Google Scholar] [CrossRef]
- Su, C.; Xu, S.-J.; Zhu, K.-Y.; Zhang, X.-C. Rock classification in petrographic thin section images based on concatenated convolutional neural networks. Earth Sci. Inform. 2020, 13, 1477–1484. [Google Scholar] [CrossRef]
- Saporetti, C.M.; Goliatt, L.; Pereira, E. Neural network boosted with differential evolution for lithology identification based on well logs information. Earth Sci. Inform. 2021, 14, 133–140. [Google Scholar] [CrossRef]
- Di, Y.; Wang, E.; Li, Z.; Liu, X.; Li, B. Method for EMR and AE interference signal identification in coal rock mining based on recurrent neural networks. Earth Sci. Inform. 2021, 14, 1521–1536. [Google Scholar] [CrossRef]
- Atici, U. Prediction of the strength of mineral admixture concrete using multivariable regression analysis and an artificial neural network. Expert Syst. Appl. 2011, 38, 9609–9618. [Google Scholar] [CrossRef]
- Asadi, M.; Bagheripour, M.H.; Eftekhari, M. Development of optimal fuzzy models for predicting the strength of intact rocks. Comput. Geosci. 2013, 54, 107–112. [Google Scholar] [CrossRef]
- Yesiloglu-Gultekin, N.; Gokceoglu, C.; Sezer, E.A. Prediction of uniaxial compressive strength of granitic rocks by various nonlinear tools and comparison of their performances. Int. J. Rock Mech. Min. Sci. 2013, 62, 113–122. [Google Scholar] [CrossRef]
- Marto, A.; Hajihassani, M.; Jahed Armaghani, D.; Tonnizam Mohamad, E.; Makhtar, A.M. A novel approach for blast-induced flyrock prediction based on imperialist competitive algorithm and artificial neural network. Sci. World J. 2014, 2014, 643715. [Google Scholar] [CrossRef]
- Momeni, E.; Nazir, R.; Armaghani, D.J.; Maizir, H. Prediction of pile bearing capacity using a hybrid genetic algorithm-based ANN. Measurement 2014, 57, 122–131. [Google Scholar] [CrossRef]
- Chen, L.; Asteris, P.G.; Tsoukalas, M.Z.; Armaghani, D.J.; Ulrikh, D.V.; Yari, M. Forecast of Airblast Vibrations Induced by Blasting Using Support Vector Regression Optimized by the Grasshopper Optimization (SVR-GO) Technique. Appl. Sci. 2022, 12, 9805. [Google Scholar] [CrossRef]
- Le, T.-T.; Skentou, A.D.; Mamou, A.; Asteris, P.G. Correlating the Unconfined Compressive Strength of Rock with the Compressional Wave Velocity Effective Porosity and Schmidt Hammer Rebound Number Using Artificial Neural Networks. Rock Mech. Rock Eng. 2022, 55, 6805–6840. [Google Scholar] [CrossRef]
- Koopialipoor, M.; Asteris, P.G.; Mohammed, A.S.; Alexakis, D.E.; Mamou, A.; Armaghani, D.J. Introducing stacking machine learning approaches for the prediction of rock deformation. Transp. Geotech. 2022, 34, 100756. [Google Scholar] [CrossRef]
- Asteris, P.G.; Lourenço, P.B.; Roussis, P.C.; Adami, C.E.; Armaghani, D.J.; Cavaleri, L.; Chalioris, C.E.; Hajihassani, M.; Lemonis, M.E.; Mohammed, A.S. Revealing the nature of metakaolin-based concrete materials using artificial intelligence techniques. Constr. Build. Mater. 2022, 322, 126500. [Google Scholar] [CrossRef]
- Kardani, N.; Bardhan, A.; Samui, P.; Nazem, M.; Asteris, P.G.; Zhou, A. Predicting the thermal conductivity of soils using integrated approach of ANN and PSO with adaptive and time-varying acceleration coefficients. Int. J. Therm. Sci. 2022, 173, 107427. [Google Scholar] [CrossRef]
- Hasanipanah, M.; Monjezi, M.; Shahnazar, A.; Armaghani, D.J.; Farazmand, A. Feasibility of indirect determination of blast induced ground vibration based on support vector machine. Measurement 2015, 75, 289–297. [Google Scholar] [CrossRef]
- Zhu, W.; Rad, H.N.; Hasanipanah, M. A chaos recurrent ANFIS optimized by PSO to predict ground vibration generated in rock blasting. Appl. Soft Comput. 2021, 108, 107434. [Google Scholar] [CrossRef]
- Asteris, P.G.; Mamou, A.; Hajihassani, M.; Hasanipanah, M.; Koopialipoor, M.; Le, T.-T.; Kardani, N.; Armaghani, D.J. Soft computing based closed form equations correlating L and N-type Schmidt hammer rebound numbers of rocks. Transp. Geotech. 2021, 29, 100588. [Google Scholar] [CrossRef]
- Fattahi, H.; Hasanipanah, M. Prediction of blast-induced ground vibration in a mine using relevance vector regression optimized by metaheuristic algorithms. Nat. Resour. Res. 2021, 30, 1849–1863. [Google Scholar] [CrossRef]
- Zeng, F.; Amar, M.N.; Mohammed, A.S.; Motahari, M.R.; Hasanipanah, M. Improving the performance of LSSVM model in predicting the safety factor for circular failure slope through optimization algorithms. Eng. Comput. 2021, 38, 1755–1766. [Google Scholar] [CrossRef]
- Aghaabbasi, M.; Shekari, Z.A.; Shah, M.Z.; Olakunle, O.; Armaghani, D.J.; Moeinaddini, M. Predicting the use frequency of ride-sourcing by off-campus university students through random forest and Bayesian network techniques. Transp. Res. Part A Policy Pract. 2020, 136, 262–281. [Google Scholar] [CrossRef]
- Yu, Z.; Shi, X.; Miao, X.; Zhou, J.; Khandelwal, M.; Chen, X.; Qiu, Y. Intelligent modeling of blast-induced rock movement prediction using dimensional analysis and optimized artificial neural network technique. Int. J. Rock Mech. Min. Sci. 2021, 143, 104794. [Google Scholar] [CrossRef]
- Ke, B.; Khandelwal, M.; Asteris, P.G.; Skentou, A.D.; Mamou, A.; Armaghani, D.J. Rock-Burst Occurrence Prediction Based on Optimized Naïve Bayes Models. IEEE Access 2021, 9, 91347–91360. [Google Scholar] [CrossRef]
- Qiu, Y.; Zhou, J.; Khandelwal, M.; Yang, H.; Yang, P.; Li, C. Performance evaluation of hybrid WOA-XGBoost, GWO-XGBoost and BO-XGBoost models to predict blast-induced ground vibration. Eng. Comput. 2021, 38, 4145–4162. [Google Scholar] [CrossRef]
- He, Z.; Armaghani, D.J.; Masoumnezhad, M.; Khandelwal, M.; Zhou, J.; Murlidhar, B.R. A Combination of Expert-Based System and Advanced Decision-Tree Algorithms to Predict Air-Overpressure Resulting from Quarry Blasting. Nat. Resour. Res. 2021, 30, 1889–1903. [Google Scholar] [CrossRef]
- Bayat, P.; Monjezi, M.; Mehrdanesh, A.; Khandelwal, M. Blasting pattern optimization using gene expression programming and grasshopper optimization algorithm to minimise blast-induced ground vibrations. Eng. Comput. 2021, 38, 3341–3350. [Google Scholar] [CrossRef]
- Bayat, P.; Monjezi, M.; Rezakhah, M.; Armaghani, D.J. Artificial neural network and firefly algorithm for estimation and minimization of ground vibration induced by blasting in a mine. Nat. Resour. Res. 2020, 29, 4121–4132. [Google Scholar] [CrossRef]
- Zhou, J.; Li, X.; Mitri, H.S. Comparative performance of six supervised learning methods for the development of models of hard rock pillar stability prediction. Nat. Hazards 2015, 79, 291–316. [Google Scholar] [CrossRef]
- Le, T.-T.; Asteris, P.G.; Lemonis, M.E. Prediction of axial load capacity of rectangular concrete-filled steel tube columns using machine learning techniques. Eng. Comput. 2021, 38, 3283–3316. [Google Scholar] [CrossRef]
- Harandizadeh, H.; Armaghani, D.J.; Asteris, P.G.; Gandomi, A.H. TBM performance prediction developing a hybrid ANFIS-PNN predictive model optimized by imperialism competitive algorithm. Neural Comput. Appl. 2021, 33, 16149–16179. [Google Scholar] [CrossRef]
- Gavriilaki, E.; Asteris, P.G.; Touloumenidou, T.; Koravou, E.-E.; Koutra, M.; Papayanni, P.G.; Karali, V.; Papalexandri, A.; Varelas, C.; Chatzopoulou, F. Genetic justification of severe COVID-19 using a rigorous algorithm. Clin. Immunol. 2021, 226, 108726. [Google Scholar] [CrossRef]
- Shan, F.; He, X.; Armaghani, D.J.; Zhang, P.; Sheng, D. Success and challenges in predicting TBM penetration rate using recurrent neural networks. Tunn. Undergr. Space Technol. 2022, 130, 104728. [Google Scholar] [CrossRef]
- Indraratna, B.; Armaghani, D.J.; Correia, A.G.; Hunt, H.; Ngo, T. Prediction of resilient modulus of ballast under cyclic loading using machine learning techniques. Transp. Geotech. 2023, 38, 100895. [Google Scholar] [CrossRef]
- Tan, W.Y.; Lai, S.H.; Teo, F.Y.; Armaghani, D.J.; Pavitra, K.; El-Shafie, A. Three Steps towards Better Forecasting for Streamflow Deep Learning. Appl. Sci. 2022, 12, 12567. [Google Scholar] [CrossRef]
- Ghanizadeh, A.R.; Ghanizadeh, A.; Asteris, P.G.; Fakharian, P.; Armaghani, D.J. Developing Bearing Capacity Model for Geogrid-Reinforced Stone Columns Improved Soft Clay utilizing MARS-EBS Hybrid Method. Transp. Geotech. 2022, 38, 100906. [Google Scholar] [CrossRef]
- Skentou, A.D.; Bardhan, A.; Mamou, A.; Lemonis, M.E.; Kumar, G.; Samui, P.; Armaghani, D.J.; Asteris, P.G. Closed-Form Equation for Estimating Unconfined Compressive Strength of Granite from Three Non-destructive Tests Using Soft Computing Models. Rock Mech. Rock Eng. 2022, 56, 487–514. [Google Scholar] [CrossRef]
- Ghanizadeh, A.R.; Delaram, A.; Fakharian, P.; Armaghani, D.J. Developing Predictive Models of Collapse Settlement and Coefficient of Stress Release of Sandy-Gravel Soil via Evolutionary Polynomial Regression. Appl. Sci. 2022, 12, 9986. [Google Scholar] [CrossRef]
- Li, C.; Zhou, J.; Tao, M.; Du, K.; Wang, S.; Armaghani, D.J.; Mohamad, E.T. Developing hybrid ELM-ALO, ELM-LSO and ELM-SOA models for predicting advance rate of TBM. Transp. Geotech. 2022, 36, 100819. [Google Scholar] [CrossRef]
- Parsajoo, M.; Armaghani, D.J.; Mohammed, A.S.; Khari, M.; Jahandari, S. Tensile strength prediction of rock material using non-destructive tests: A comparative intelligent study. Transp. Geotech. 2021, 31, 100652. [Google Scholar] [CrossRef]
- Barkhordari, M.S.; Armaghani, D.J.; Mohammed, A.S.; Ulrikh, D.V. Data-Driven Compressive Strength Prediction of Fly Ash Concrete Using Ensemble Learner Algorithms. Buildings 2022, 12, 132. [Google Scholar] [CrossRef]
- Liu, Z.; Armaghani, D.J.; Fakharian, P.; Li, D.; Ulrikh, D.V.; Orekhova, N.N.; Khedher, K.M. Rock Strength Estimation Using Several Tree-Based ML Techniques. CMES-Comp. Model. Eng. Sci. 2022, 133, 799–824. [Google Scholar] [CrossRef]
- Pham, B.T.; Nguyen, M.D.; Nguyen-Thoi, T.; Ho, L.S.; Koopialipoor, M.; Quoc, N.K.; Armaghani, D.J.; Van Le, H. A novel approach for classification of soils based on laboratory tests using Adaboost, Tree and ANN modeling. Transp. Geotech. 2021, 27, 100508. [Google Scholar] [CrossRef]
- Asteris, P.G.; Mamou, A.; Ferentinou, M.; Tran, T.-T.; Zhou, J. Predicting clay compressibility using a novel Manta ray foraging optimization-based extreme learning machine model. Transp. Geotech. 2022, 37, 100861. [Google Scholar] [CrossRef]
- Rezazadeh Eidgahee, D.; Jahangir, H.; Solatifar, N.; Fakharian, P.; Rezaeemanesh, M. Data-driven estimation models of asphalt mixtures dynamic modulus using ANN, GP and combinatorial GMDH approaches. Neural Comput. Appl. 2022, 34, 17289–17314. [Google Scholar] [CrossRef]
- Naderpour, H.; Rafiean, A.H.; Fakharian, P. Compressive strength prediction of environmentally friendly concrete using artificial neural networks. J. Build. Eng. 2018, 16, 213–219. [Google Scholar] [CrossRef]
- Yang, H.; Song, K.; Zhou, J. Automated Recognition Model of Geomechanical Information Based on Operational Data of Tunneling Boring Machines. Rock Mech. Rock Eng. 2022, 55, 1499–1516. [Google Scholar] [CrossRef]
- Yang, H.; Wang, Z.; Song, K. A new hybrid grey wolf optimizer-feature weighted-multiple kernel-support vector regression technique to predict TBM performance. Eng. Comput. 2020, 38, 2469–2485. [Google Scholar] [CrossRef]
- Ikram, R.M.A.; Dai, H.-L.; Ewees, A.A.; Shiri, J.; Kisi, O.; Zounemat-Kermani, M. Application of improved version of multi verse optimizer algorithm for modeling solar radiation. Energy Rep. 2022, 8, 12063–12080. [Google Scholar] [CrossRef]
- Ikram, R.M.A.; Ewees, A.A.; Parmar, K.S.; Yaseen, Z.M.; Shahid, S.; Kisi, O. The viability of extended marine predators algorithm-based artificial neural networks for streamflow prediction. Appl. Soft Comput. 2022, 131, 109739. [Google Scholar] [CrossRef]
- Nguyen, H.; Bui, X.-N.; Bui, H.-B.; Cuong, D.T. Developing an XGBoost model to predict blast-induced peak particle velocity in an open-pit mine: A case study. Acta Geophys. 2019, 67, 477–490. [Google Scholar] [CrossRef]
- Ahmad, I.; Basheri, M.; Iqbal, M.J.; Rahim, A. Performance comparison of support vector machine, random forest, and extreme learning machine for intrusion detection. IEEE Access 2018, 6, 33789–33795. [Google Scholar] [CrossRef]
- Meulenkamp, F.; Grima, M.A. Application of neural networks for the prediction of the unconfined compressive strength (UCS) from Equotip hardness. Int. J. Rock Mech. Min. Sci. 1999, 36, 29–39. [Google Scholar] [CrossRef]
- Sonmez, H.; Tuncay, E.; Gokceoglu, C. Models to predict the uniaxial compressive strength and the modulus of elasticity for Ankara Agglomerate. Int. J. Rock Mech. Min. Sci. 2004, 41, 717–729. [Google Scholar] [CrossRef]
- Gokceoglu, C.; Zorlu, K. A fuzzy model to predict the uniaxial compressive strength and the modulus of elasticity of a problematic rock. Eng. Appl. Artif. Intell. 2004, 17, 61–72. [Google Scholar] [CrossRef]
- Mishra, D.; Basu, A. Estimation of uniaxial compressive strength of rock materials by index tests using regression analysis and fuzzy inference system. Eng. Geol. 2013, 160, 54–68. [Google Scholar] [CrossRef]
- Cevik, A.; Sezer, E.A.; Cabalar, A.F.; Gokceoglu, C. Modeling of the uniaxial compressive strength of some clay-bearing rocks using neural network. Appl. Soft Comput. 2011, 11, 2587–2594. [Google Scholar] [CrossRef]
- Singh, V.; Singh, D.; Singh, T. Prediction of strength properties of some schistose rocks from petrographic properties using artificial neural networks. Int. J. Rock Mech. Min. Sci. 2001, 38, 269–284. [Google Scholar] [CrossRef]
- Gokceoglu, C. A fuzzy triangular chart to predict the uniaxial compressive strength of the Ankara agglomerates from their petrographic composition. Eng. Geol. 2002, 66, 39–51. [Google Scholar] [CrossRef]
- Zorlu, K.; Gokceoglu, C.; Ocakoglu, F.; Nefeslioglu, H.; Acikalin, S. Prediction of uniaxial compressive strength of sandstones using petrography-based models. Eng. Geol. 2008, 96, 141–158. [Google Scholar] [CrossRef]
- Yagiz, S.; Sezer, E.; Gokceoglu, C. Artificial neural networks and nonlinear regression techniques to assess the influence of slake durability cycles on the prediction of uniaxial compressive strength and modulus of elasticity for carbonate rocks. Int. J. Numer. Anal. Methods Geomech. 2012, 36, 1636–1650. [Google Scholar] [CrossRef]
- Ceryan, N.; Okkan, U.; Kesimal, A. Prediction of unconfined compressive strength of carbonate rocks using artificial neural networks. Environ. Earth Sci. 2013, 68, 807–819. [Google Scholar] [CrossRef]
- Rabbani, E.; Sharif, F.; Koolivand Salooki, M.; Moradzadeh, A. Application of neural network technique for prediction of uniaxial compressive strength using reservoir formation properties. Int. J. Rock Mech. Min. Sci. 2012, 56, 100–111. [Google Scholar] [CrossRef]
- Armaghani, D.J.; Mohamad, E.T.; Momeni, E.; Narayanasamy, M.S. An adaptive neuro-fuzzy inference system for predicting unconfined compressive strength and Young’s modulus: A study on Main Range granite. Bull. Eng. Geol. Environ. 2015, 74, 1301–1319. [Google Scholar] [CrossRef]
- Ulusay, R.; Hudson, J.A. ISRM (2007) The Complete ISRM Suggested Methods for Rock Characterization, Testing and Monitoring: 1974–2006; Comm. Test Methods Int. Soc. Rock. Mech.; ISRM Turkish Natl Group: Ankara, Turkey, 2007; p. 628. [Google Scholar]
- Breiman, L. Random forests. Mach. Learn. 2001, 45, 5–32. [Google Scholar] [CrossRef]
- Chen, T.; Guestrin, C. Xgboost: A scalable tree boosting system. In Proceedings of the 22nd Acm Sigkdd International Conference on Knowledge Discovery and Data Mining, San Francisco, CA, USA, 13–17 August 2016; pp. 785–794. [Google Scholar]


| Author | ML Technique | Input | R |
|---|---|---|---|
| Beiki, Majdi and Givshad [9] | GP | Density, p-wave velocity, porosity | 0.91 |
| Ceryan et al. [71] | ANN | Porosity, slake durability index, p-wave velocity in solid part of the sample, effective porosity, petrography study values | 0.94 |
| Dehghan, Sattari, Chelgani, and Aliabadi [8] | ANN | P-wave velocity, slake durability index, porosity | 0.93 |
| Gokceoglu and Zorlu [64] | FIS | Slake durability index, block punch index, p-wave velocity, BTS | 0.82 |
| Meulenkamp and Grima [62] | ANN | Equotip value, porosity, density, grain size | 0.97 |
| Momeni, Nazir, Armaghani, and Maizir [20] | PSO-ANN | Density, p-wave velocity, slake durability index, | 0.98 |
| Rabbani et al. [72] | ANN | Porosity, bulk density, water saturation | 0.98 |
| Rezaei, Majdi, and Monjezi [11] | FIS | Density, porosity | 0.97 |
| Singh, Singh, and Singh [67] | ANN | Petrography study values | - |
| Marto, Hajihassani, Jahed Armaghani, Tonnizam Mohamad, and Makhtar [19] | PSO-ANN | Slake durability index, BTS, bulk density, p-wave velocity | 0.98 |
| Yesiloglu-Gultekin, Gokceoglu, and Sezer [18] | ANFIS | BTS, p-wave velocity | 0.77 |
| Yilmaz and Yuksek [7] | ANFIS | P-wave velocity, slake durability index, water content | 0.97 |
| Zorlu, Gokceoglu, Ocakoglu, Nefeslioglu, and Acikalin [69] | ANN | Quartz content, packing density, concavo convex | 0.87 |
| Specification | Value |
|---|---|
| Length | 44,600 m |
| Diameter | 5.2 m |
| Longitudinal gradient | 1/1.900 |
| Maximum discharge of raw water | 27.6 m3/s |
| RF | XGBT | |
|---|---|---|
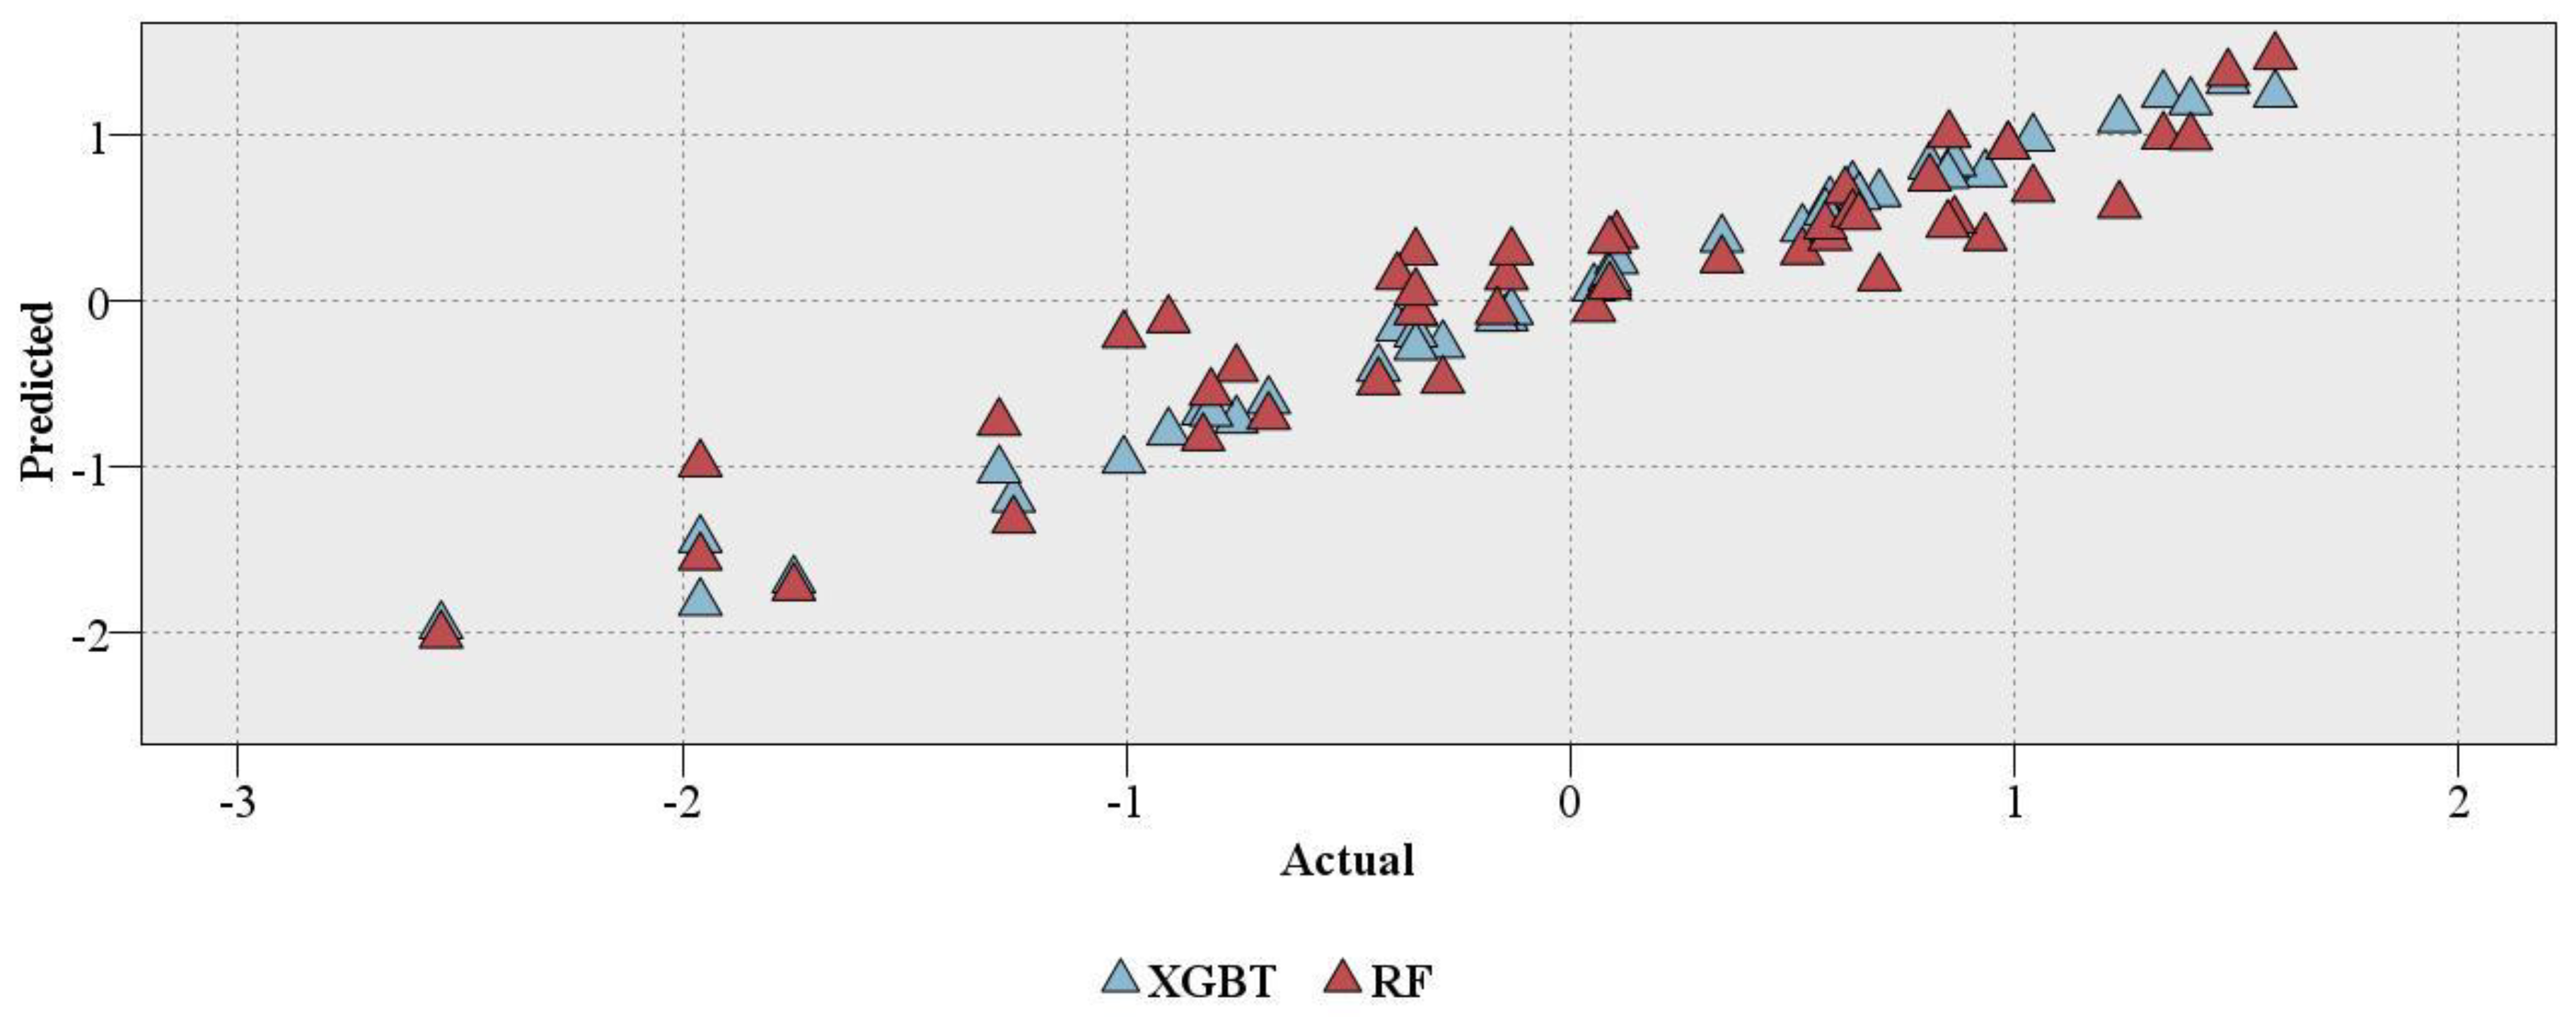
| Minimum error | −0.975 | −0.58 |
| Maximum error | 0.658 | 0.34 |
| Mean error | −0.062 | −0.041 |
Disclaimer/Publisher’s Note: The statements, opinions and data contained in all publications are solely those of the individual author(s) and contributor(s) and not of MDPI and/or the editor(s). MDPI and/or the editor(s) disclaim responsibility for any injury to people or property resulting from any ideas, methods, instructions or products referred to in the content. |
© 2023 by the authors. Licensee MDPI, Basel, Switzerland. This article is an open access article distributed under the terms and conditions of the Creative Commons Attribution (CC BY) license (https://creativecommons.org/licenses/by/4.0/).
Share and Cite
Wang, Y.; Hasanipanah, M.; Rashid, A.S.A.; Le, B.N.; Ulrikh, D.V. Advanced Tree-Based Techniques for Predicting Unconfined Compressive Strength of Rock Material Employing Non-Destructive and Petrographic Tests. Materials 2023, 16, 3731. https://doi.org/10.3390/ma16103731
Wang Y, Hasanipanah M, Rashid ASA, Le BN, Ulrikh DV. Advanced Tree-Based Techniques for Predicting Unconfined Compressive Strength of Rock Material Employing Non-Destructive and Petrographic Tests. Materials. 2023; 16(10):3731. https://doi.org/10.3390/ma16103731
Chicago/Turabian StyleWang, Yuzhen, Mahdi Hasanipanah, Ahmad Safuan A. Rashid, Binh Nguyen Le, and Dmitrii Vladimirovich Ulrikh. 2023. "Advanced Tree-Based Techniques for Predicting Unconfined Compressive Strength of Rock Material Employing Non-Destructive and Petrographic Tests" Materials 16, no. 10: 3731. https://doi.org/10.3390/ma16103731