Article

Adsorption–Desorption Behavior of Hydrogen Sulfide Capture on a Modified Activated Carbon Surface

by
Nurul Noramelya Zulkefli
1,
Adam Mohd Izhan Noor Azam
2,
Mohd Shahbudin Masdar
1,2,3,* and
Wan Nor Roslam Wan Isahak
1,3
1
Department of Chemical & Process Engineering, Faculty of Engineering & Built Environment, Universiti Kebangsaan Malaysia, Bangi 43600, Selangor, Malaysia
2
Fuel Cell Institute, Universiti Kebangsaan Malaysia, Bangi 43600, Selangor, Malaysia
3
Research Center for Sustainable Process Technology (CESPRO), Faculty of Engineering & Built Environment, Universiti Kebangsaan Malaysia, Bangi 43600, Selangor, Malaysia
*
Author to whom correspondence should be addressed.
Materials 2023, 16(1), 462; https://doi.org/10.3390/ma16010462
Submission received: 21 November 2022 / Revised: 4 December 2022 / Accepted: 6 December 2022 / Published: 3 January 2023
(This article belongs to the Special Issue Recent Progress in Advanced Adsorption Materials)

Abstract

:
Metal-based adsorbents with varying active phase loadings were synthesized to capture hydrogen sulfide (H2S) from a biogas mimic system. The adsorption–desorption cycles were implemented to ascertain the H2S captured. All prepared adsorbents were evaluated by nitrogen adsorption, Brunauer–Emmett–Teller surface area analysis, scanning electron microscopy–energy-dispersive X-ray spectroscopy, and Fourier transform infrared spectroscopy. From the results, modified adsorbents, dual chemical mixture (DCM) and a core–shell (CS) had the highest H2S adsorption performance with a range of 0.92–1.80 mg H2S/g. After several cycles of heat/N2 regeneration, the total H2S adsorption capacity of the DCM adsorbent decreased by 62.1%, whereas the CS adsorbent decreased by only 25%. Meanwhile, the proposed behavioral model for H2S adsorption–desorption was validated effectively using various analyses throughout the three cycles of adsorption–desorption samples. Moreover, as in this case, the ZnAc2/ZnO/CAC_OS adsorbents show outstanding performances with 30 cycles of adsorption–desorption compared to only 12 cycles of ZnAc2/ZnO/CAC_DCM. Thus, this research paper will provide fresh insights into adsorption–desorption behavior through the best adsorbents’ development and the adsorbents’ capability at the highest number of adsorption–desorption cycles.

1. Introduction

Fermentation of animal or agricultural waste in the absence of oxygen results in the production of biogas, a form of renewable energy. Heat energy derived from biogas can be directly converted into other forms of energy, and the byproduct can be utilized as fertilizer for agriculture. The primary components of biogas are 50%–70% CH4 and 30%–50% CO2, and the minor components consist of NH3 (80–100 ppm), H2S (500–1000 ppm), and a trace of hydrocarbon (100 ppm) [1]. The capability of biogas to directly generate electricity and heat energy has drawn significant attention for use in engineering applications. However, one of the challenges of biogas purification is that it results in the release of hydrogen sulfide (H2S), which might have a negative effect on the production, machinery and catalyst and result in health issues [2,3,4]. Hence, H2S removal requires biogas purification to improve its properties and make biogas comparable to natural gas as a fuel for automobiles.
H2S removal could be carried out in many ways using gas purification technology depending on how H2S is made up in the gas stream. Watanabe [5] looked closely at the liquid absorption, slurry reactors, and fixed-bed columns that are typically used to remove sulfur from natural gas. Alkylamine absorbents for sour gases [6] are often used in large facilities [7], but they are hard on the economy because of their high operating costs [8], problems with selectivity, and the way the liquid sorbent breaks down over time. Slurry reactors [9] allow good material exchange between solids and fluids at low operating temperatures. They may be a good alternative to fixed-bed reactors for sorbent recovery.
The latter has become well-known because of recent technological advances that have made them a true cornerstone in H2S capture, especially in the purification of biogas, a promising and renewable energy source made from the anaerobic digestion of organic wastes. Hence, desulfurization is often carried out through a process called adsorption, which is not as complicated as other methods and is thought to have a high removal efficiency [10]. The adsorption process can be divided into two distinct mechanisms, namely, physisorption and chemisorption, by which solid sorbents used in fixed-bed reactors for H2S capture may operate [11]. Chemisorption is based on the chemical bonds between the adsorbate and substrate, whereas physisorption involves the formation of weak bonds between H2S and the substrate.
Various types of adsorbents have been investigated for H2S and CO2 adsorption to improve adsorption capability. These adsorbents include metal–organic frameworks, which have demonstrated high adsorption capacity and selectivity toward H2S removal [12,13,14,15], as well as CO2 [16] and zeolites, which are commonly applied in CO2 removal owing to their high selectivity, ability to regenerate, and thermal resistance; H2S separation is performed through chemisorption at very low partial pressures [17,18,19,20] or physisorption from low to moderate partial pressures [21,22,23,24,25].
Due to its high specific surface area and porous structure, activated carbon (AC) is commonly employed as an adsorbent for H2S. According to a number of studies [26,27,28], the surface properties of carbon (such as pH, functional groups, pore size distribution, and specific surface area) are considerably correlated with H2S removal. Generally, modified AC has gained much attention to enhance the capability of AC in captured H2S. Modified AC with metal and alkaline adsorbents has a considerable influence toward H2S adsorption capabilities compared with commercial AC [29,30,31,32]. Compared with unimpregnated adsorbents (commercial AC), the advantages of impregnated ACs for H2S removal are their high efficiency and rapid kinetics of reaction [32]. The impregnation technique is essential for ensuring the uniform distribution of chemicals on the surface of AC, preserving maximum access to the pore structure to provide the target contaminants (H2S) with maximum contact efficiency to the impregnated AC [33].
Chiang et al. [34] tested the performance on H2S adsorption using the impregnated AC technique with NaOH, Na2CO3, KOH, and K2CO3. The adsorbents’ performances were ranked as follows for H2S adsorption: NaOH > Na2CO3 > KOH > K2CO3. Yan et al. [33,35] tested alkaline AC under 1% H2S and 80% relative humidity (RH). After pre-humidification (RH = 100%), alkaline AC could hold more H2S than before.
AC impregnated with iron (III) chloride is also capable of removing H2S selectively [36]. Transition metal oxides (e.g., ZnO, CuO, Mn2O3, Fe2O3, CeO2) and mixed transition metal oxides (e.g., zinc ferrite [ZnFe2O4], Zn-Ti-O, CuO-CeO2) were used as adsorbents for downstream hot gas desulfurization [37]. During the sulfidation stage, these metal oxides are typically transformed to metal sulfides and then consecutively regenerated by oxidation of metal sulfides to metal oxides. The use of ZnO was studied by Basyooni et al. [38] who showed its potential to demonstrate higher sensitivity towards CO2 and H2S gas in gas sensing. In another study, Basyooni et al. concluded that ZnO might be affected in positive ways in order to enhance the adsorption process when introduced in a similar to the impregnation technique [39]. However, Zulkefli et al. [29,30,31,32] confirmed that only specific chemicals suited for H2S removal can improve the adsorption process. Unfortunately, at a certain point, the adsorbents’ performance can be degraded after prolonged use in multiple cycles of the adsorption–desorption process, and they become no longer usable. Moreover, the performance of H2S adsorption capacity may drop up to 23% when other gases, such as CO2, are introduced into the same adsorber system [29].
Commonly, AC is difficult to reuse because the oxidation of sulfur polymers that are resistant to oxidation makes it nearly waterproof [40]. Replacing spent AC with new CAC is a typical practice in the industry to lower operating costs and address regeneration difficulties. Alternative strategies transform saturated adsorbents into fertilizers or value-added commodities, such as gypsum, to reduce destruction. In any case, further study is needed on the stability of the sulfur component after adsorption before the safe disposal of saturated adsorbents can be carried out. The use of agricultural waste as a H2S gas adsorbent is the first step towards an eco-friendly method, but the main challenge will be maintaining the finished product after removal.
Thus, the spent AC can be recycled through thermal processing or cold/hot water washing. A study on AC regeneration by cold and hot water purification at 300 °C in ambient air reported that H2S adsorption capacity fell by 60% due to adsorption on non-reverse chemicals in the active area [41]. In another study [40], the AC used as adsorbent for H2S adsorption was regenerated using nitrogen and heating for 10 min at 500 °C. A performance drop in AC can be avoided using this method, which can only be applied on a laboratory scale and could also be opened to industrial sizes (eliminating the opportunity for AC self-ignition).
Therefore, in this study, metal-based adsorbents with varying active phase loadings are synthesized by modifying a commercial AC surface with a zinc acetate and zinc oxide reagent. Then, the adsorption–desorption cycles are implemented to ascertain the H2S captured to capture hydrogen sulfide (H2S) in order to examine the profile of adsorption–desorption and evaluate the H2S adsorption capacity. Moreover, all prepared adsorbents are characterized by nitrogen adsorption, Brunauer–Emmett–Teller surface area analysis, scanning electron microscopy–energy-dispersive X-ray spectroscopy, and Fourier transform infrared spectroscopy before and after the adsorption–desorption cycles. Furthermore, the behavioral model for H2S adsorption–desorption is proposed and validated using various analyses throughout adsorption–desorption samples. The relationship between the adsorbent’s characterization and behavioral model is discussed on the basis of the adsorption–desorption profile and H2S adsorption capacity.

2. Methodology

2.1. Materials

Commercial coconut shell activated carbon (CAC) with a granular shape was used as the main porous adsorbent in this study. Fresh AC samples were first sieved to 3–5 mm before modification by dual chemical mixture (DCM) and core–shell (CS) methods. Both methods require certain reagents, such as zinc acetate (ZnC4H6O4) at 98% purity, 99.5% zinc oxide (ZnO), 95% ammonia (NH3), and 98% tetraethyl orthosilicate (TEOS), all of which were purchased from Friendemann Schmidt Chemicals, Malaysia and used as-is without purification. Laboratory-scale experiments were conducted in a continuous atmospheric packed bed reactor or adsorber column with 0.5 cm diameter, 10 cm bed height, and 0.2 L total bed volume. Linde Malaysia Sdn Bhd provided 5000 ppm H2S-balanced N2 for this study’s feed gas. This gas concentration was selected based on the general H2S produced in the biogas system of palm oil mills. However, the exact biogas composition, including other gases (CH4, CO2, etc.), were not considered in this study as we focused on adsorbents’ development and their capability of capturing H2S gas.

2.2. Adsorbent Modifications

AC modifications were conducted by DCM and CS methods as mentioned in detail by Zulkefli et al. [30] and Zulkefli et al. [31]. The basic preparations for the DCM and CS methods require CAC to be immersed in the designated solution prepared at 0.2 M concentration and continuously stirred for about 49 min up at 95 °C. The solution was then filtered, washed multiple times, and dried at 120 °C for 24 h through an oven unit. The DCM and CS adsorbents are denoted as ZnAc2/ZnO/CAC_DCM and ZnAc2/ZnO/CAC_CS, respectively, throughout this study.

2.3. H2S Adsorption–Desorption

Adsorption tests were conducted with constant feed concentration (5000 ppm H2S diluted in N2), flow rate (5.5 L/min), absolute pressure (1.5 bar), and temperature 30 °C (room temperature). Before H2S gas was introduced, 100 g of the prepared adsorbent was loaded into the column. For environmental safety, the outlet H2S concentration was maintained at 5 ppm. All output concentrations were measured by portable H2S analyzers (model GC310). Three adsorption–desorption cycles were performed on the adsorbents. For each desorption process, the adsorbent was regenerated at 150 °C. The details of the desorption process were previously described by Zulkefli et al. [29,30,31,32]. The general equations used for adsorption capacity and adsorbent performance degradation were adapted from a previous study [29]. The H2S adsorption capacity and degradation of adsorption in the next cycles were calculated based on an equation used as in a previous study [29,42].

2.4. Behavior Mechanism on Prepared Adsorbents and Adsorption–Desorption Process

This process was utilized to identify chemical, carbon, and H2S gas interactions that may influence H2S gas adsorption. Two main procedures were involved in the mechanism study of the selected adsorbents. The first mechanism was based on the pH changes that occur at each synthesis level. The pH conditions of distilled water, chemical solution, and CAC solution after 49 min were measured by a pH meter. All pH change data were recorded, and the characterization process was performed solely on the adsorbent that had been completed, and the adsorbents were labeled as DCM/CAC (F) and CS/CAC (F) for fresh adsorbents.
Next, the behavior mechanism was determined through adsorption–desorption up to three cycles. The best adsorbents in this investigation were ZnAc2/ZnO/CAC_DCM and ZnAc2/ZnO/CAC_OS, which were analyzed using characterization techniques such as Brunauer–Emmett–Teller (BET) surface area analysis, scanning electron microscopy (SEM)–energy-dispersive X-ray spectroscopy (EDX), and Fourier transform infrared (FTIR) analysis in each cycle. The sampling process was observed on fresh adsorbents (F), the adsorbent saturated in the first cycle of adsorption (T1), the adsorbent desorbed in the first cycle (D1), the adsorbent saturated in the second cycle (T2), the adsorbent desorbed in the second cycle (D2), the adsorbents saturated in the third cycle (T3), and the adsorbents desorbed in the third cycle (D3). This method was only applied to the two most effective types of adsorbents. The mechanism study depended on the analysis of the adsorption–desorption process.

2.5. Behavior Mechanism Study

All of the synthesized adsorbents were subjected to numerous physical and chemical testing, including SEM, BET, FTIR, and thermogravimetric (TG) analyses. The surface morphology and chemical content of DCM adsorbent particles were observed with a scanning electron microscope (model EDAX APOLLO X, Mahwah, NJ, USA) and a CARL ZEISS EVO MA10 (Jena, Germany), respectively. The examination was conducted under a 10 kV accelerating voltage to reveal the details of adsorbent characteristics in terms of structure particles and the weight percentages of elements present on the adsorbents’ surfaces. Micrometric ASAP 2010 Version 4.0 was utilized in BET calculation (Micrometric, Lincoln, UK). The physical properties of the adsorbents were evaluated by N2 adsorption–desorption at 196 °C using a Quantachrome Autosorb 1 °C after 4 h of degassing at 150 °C. The precise surface was derived using BET calculation. The surface area was measured using the BET isotherm, and the pore volumes and standard pore volumes were computed using the N2 adsorption isotherm at P/P0 = 0.98. Prior to examination, powdered AC samples were combined with KBr. A PerkinElmer FTIR spectrometer was utilized to monitor FTIR spectra with a frequency range of 600–4000 cm−1.

3. Results and Discussion

3.1. Effect of pH and Their Behavior in Adsorbents Synthesize

The development of the selected adsorbents was also investigated to determine the effect of pH on the CAC modification process. In this section, two types of adsorbents were chosen: ZnAc2/ZnO/CAC_DCM and ZnAc2/ZnO/CAC_OS. pH variations throughout the saturation process were used to study the adsorbents. The adsorbents were produced in 0.22 M impregnation solution for 49 min at 35, 65 and 95 °C.
The pH data are presented in Table 1. The pH became acidic at pH 4.23–5.6 after ZnAc2 was mixed with distilled water because the molecules come from acidic groups. Then, the pH decreased when ZnO compounds were mixed into the solution. This drop indicates that the acidity of the solution increased. The pH of the ZnAc2 and ZnO combination solution was likewise raised by the addition of raw CAC. pH levels considerably dropped after soaking for 49 min. This drop is a result of ZnAc2 and ZnO materials depositing on the CAC’s surface and pores. Furthermore, increasing the temperature during adsorbent synthesis also influenced the decrease in pH.
Figure 1 depicts the ZnAc2 and ZnO modification processes that occur on the raw CAC surface. This adsorbent’s synthesis describes the likelihood of the mechanism involved during the saturation process. ZnAc2 and ZnO react to form Zn2+, O2−, OH, and H+ ions. When the raw CAC was soaked in a compound solution, its strong negative charge attracted positive ions, particularly H+, resulting in an increase in pH value as indicated in Table 1. Zn2+ ions combine with hydroxyl to generate Zn(OH)2, which is then adsorbed on the CAC’s surface and pores.
ZnAc2/ZnO/CAC_OS was prepared under the same parameter as ZnAc2/ZnO/CAC_DCM. The influence of pH on ZnAc2/ZnO/CAC_OS is shown in Table 2 and Figure 2. The pattern in the table reveals that preparation temperature had a major impact on the development of this adsorbent. The pH increased when CAC was added to a compound solution with other adsorbents. A remarkable drop in pH was also observed after 49 min of immersion, which was probably caused by chemicals being deposited on the CAC’s surface and pores.
The solution’s pH value decreased as the preparation temperature rose. This outcome may be due to the chemical breakdown of the molecule utilized. However, the production of additional adsorbents and the immersion of CAC into the solution increased the pH level. After 49 min of immersion, the pH readings started to fall, possibly as a result of chemicals being deposited on CAC surfaces and pores.

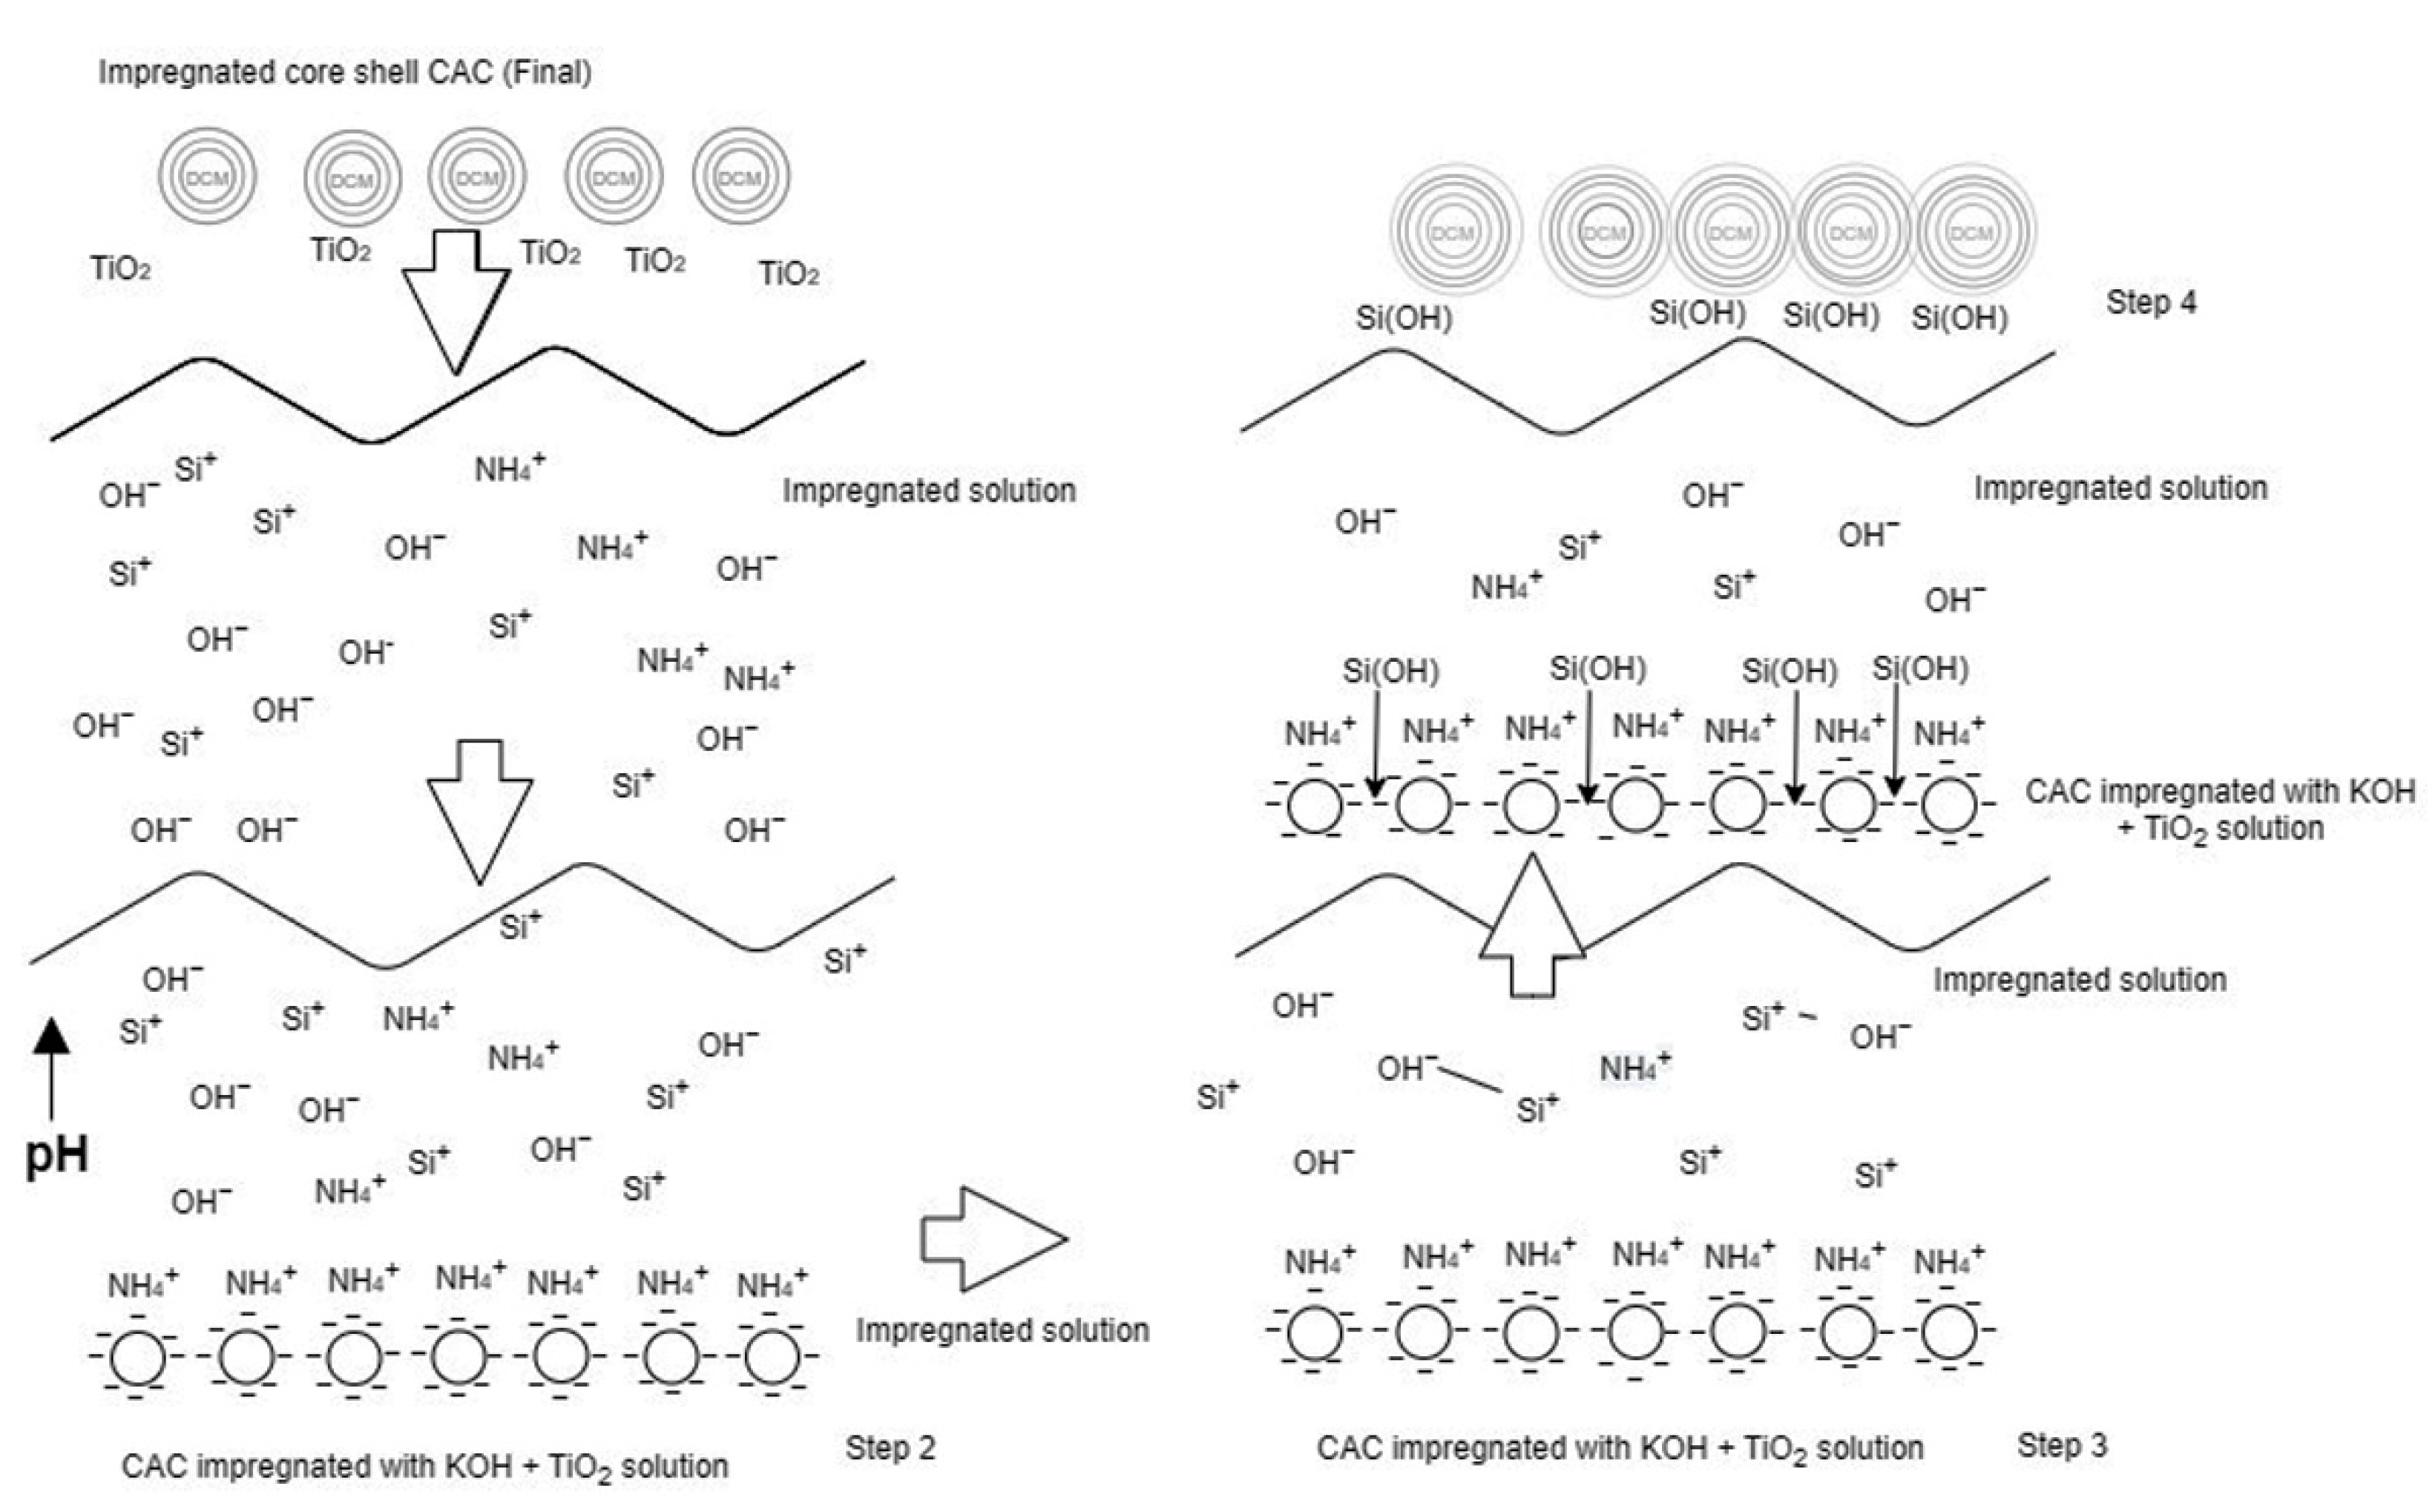
3.2. Adsorption–Desorption Behavior

The mechanisms of the adsorption processes of ZnAc2/ZnO/CAC_DCM and ZnAc2/ZnO/CAC_OS were investigated in this work using multiple characterization techniques, such as SEM-EDX, BET, and FTIR. Characterization was performed three times for each grunting procedure. Each sample was labelled as described in Section 2.4.
(a)
SEM-EDX analysis
The morphological structures of fresh ZnAc2/ZnO/CAC_DCM and ZnAc2/ZnO/CAC_OS and the presence of elements on the adsorbents’ surfaces were performed using micrographic pictures and SEM mapping, respectively. Figure 3 depicts the morphological structure of each adsorbent below the 2.5K× magnification range and the 2-micron scale. The existence of colorful spots that form layers as a basis for the presence of chemical compounds on the surface of the adsorbent may be noticed in the ensuing image of the morphological structure observation. In general, the red spot on Figure 3a refers to the deposited overall elements including Zn and C, while Figure 3b shows the deposits of Zn, O, Si and C as presented by the blue spot. Additionally, the map shows the overall elements that were observed in detail, as presented by several other color spots.
The deposition of coating layers on the surface of the adsorbent is believed to enhance gas adsorption. Thus, adsorbent addition via the saturation approach alters the morphological structure, which is believed to reduce the natural pores (based on the raw CAC) that are capable of enhancing the H2S-adsorbing surface area. In addition, observations of the adsorption–desorption cycle process were performed via data collected using EDX for the investigation of elements on the surfaces of DCM/CAC and CS/CAC for three complete cycles. Table 3 and Table 4 represent the elements that exist on the surface of the adsorbent depending on the mass percentage of the fresh adsorbent until the third adsorption cycle.
Among the elements found were carbon, calcium, zinc, oxygen, potassium, titanium, and sulfur. In accordance with the adsorbent obtained from carbon-type mesopores and the primary source of agricultural products, each adsorbent has carbon and calcium as components [43]. Carbon is the primary medium for this adsorbent; therefore, the amounts of carbon present on the surfaces of both adsorbents were considerably larger than the amounts of other elements.
For the first cycle, the saturated adsorbent materials had a drop in zinc content (18.8% for ZnAc2/ZnO/CAC DCM and 25.9% for ZnAc2/ZnO/CAC OS). However, the total amounts of zinc elements required for breakdown dropped by 26% (ZnAc2/ZnO/CAC DCM) and 14.5% (ZnAc2/ZnO/CAC OS) in the third cycle. This drop is the result of the formation of ZnS on the surface of the adsorbent, which causes the decomposition of the decomposition cycle in preparation for the subsequent cycle.
The presence of moisture and oxygen has a substantial impact on effective adsorption. The reduction in the amount of oxygen element from fresh ZnAc2/ZnO/CAC_DCM to the saturated adsorbent in the first cycle was 28.6%, and the overall reduction in the amount of oxygen element in the third adsorption cycle was around 27%. The loss of oxygen during the first cycle in the saturated ZnAc2/ZnO/CAC_OS was 27%, whereas the loss of oxygen element during the entire process was only 15%. Compared with ZnAc2/ZnO/CAC_DCM, ZnAc2/ZnO/CAC_OS exhibited a lower oxygen element reduction, which is an indication that ZnAc2/ZnO/CAC_OS can be utilized more than once.
The presence of potassium and titanium elements was only detectable in ZnAc2/ZnO/CAC_OS when KOH and TiO compounds were used to synthesize the adsorbents During adsorption, K2S and TiS were formed, resulting in a decrease in saturation level. The drop was 16% for potassium element and 42% for element titanium element in the adsorption phase. This outcome is likely due to the fact that the TiO2 layer is the outermost layer following the TEOS layer, which is strongly bonded to the sulfur material. This result indicates that other layers may be reused multiple times and adsorb H2S gas over time. In addition, the fact that the silicon element on the outer layer decreased by 59% during the third adsorption cycle suggests that hazardous H2S gas is likely to damage the silica layer.
One may see an increase in ZnS production with each desorption step with increasing adsorption–desorption cycles. However, the ZnS increase in the ZnAc2/ZnO/CAC_DCM was more than that in ZnAc2/ZnO/CAC_OS (4.04% and 1.38%, respectively). The increase in ZnS on the surface of ZnAc2/ZnO/CAC_DCM may indicate a decline in performance over the subsequent cycle. Even after the adsorption process was completed, the sulfur substance, which affects the surface of the adsorbent, was difficult to remove. The presence of sulfur following the adsorption process was likewise consistent with the results of a previous study [43].
(b)
BET analysis
Figure 4 depicts the adsorption of N2 gas as a function of pore volume in ZnAc2/ZnO/CAC_DCM. According to the IUPAC classification, the isothermal adsorption of N2 gas exhibits type I(b) isotherm with type IV hysteria, indicating that the adsorbent is formed by micropores [15,44,45]. Fresh adsorbents have a lesser volume of N2 adsorption than saturated and diabetic adsorbents. The adsorbent becomes saturated and increases in surface area, pore volume, and pore size during H2S gas adsorption, because the micropore area is blocked with metal compounds and H2S [37,46].
The desorbed adsorbents (D1, D2, and D3) showed a decrease in the volume of N2 adsorption compared with the saturated adsorbents (T1, T2, and T3). The procedure of dissolving at 150 °C and the combination of air regeneration agents and N2 demonstrated a positive influence on the next cycle’s adsorption efficiency. This decrease correlates with the findings of Shi et al. [47], who observed a decrease in adsorbent (AC) decomposition throughout the N2 adsorption study. In addition, pore structure was detected via the computation of isothermal N2 adsorption, and average pore volume was estimated using N2 adsorption at the relative pressure of 0.98. Micropore volume was also determined using the t-plot method. Table 5 provides a summary of the comprehensive pore structure, including the BET surface area (SBET), average pore volume, micropore area, and pore size.
A study of the BET surface areas and adsorbent pore counts for each of the adsorption–desorption processes revealed a decrease in comparison with ZnAc2/ZnO/CAC_DCM (F), with the exception of D1 and D3 adsorbents. The considerable drop in N2 adsorption volume was probably caused by metal particles obstructing the surface of the pores in the deepest pores [48]. Various essential issues must be addressed, such as the assessment of adsorption material regeneration, to keep the effectiveness of H2S gas adsorption for a period of the adsorption-desorption cycle. This finding is a result of the vapor’s probable performance degradation with each grunt cycle. The loss of surface area and obstruction of active sites on the surface of adsorbents because of multiple vapor–pore cycles may lead to a potential reduction in the efficiency of H2S gas adsorption.
The micropore area of the T1 adsorbent increased compared with the ZnAc2/ZnO/CAC_DCM (F) adsorbent owing to the presence of H2S particles within the pores of the adsorbent. The rise in micropore area and pore volume is indicative of H2S gas adsorption. The adsorbent in T1 phase was then degraded, and a decrease in surface characteristics was observed in the D1 adsorbent. The reduction in micropore area was 26% compared with that of fresh raw CAC. This result indicates that the adsorbents of type ZnAc2/ZnO/CAC_DCM may sustain 74% adsorption capability in the subsequent cycle. Compared with ZnAc2/ZnO/CAC_DCM, the adsorbent’s performance degraded through the micropore area at 1.2% and 3.1% during the second and third adsorption cycles, respectively.
The presence of metal in an adsorbent has no effect on the pore size factor. However, in this study, things are different. H2S gas adsorption is impacted by variations in pore size. In comparison with fresh and dehydrated adsorbent, the saturated adsorbents (T1, T2 and T3) had smaller pores. This finding demonstrates how well this adsorbent works. The results of the adsorption–desorption cycle, which are deteriorated for each cycle, can be matched by the low adsorption capability of this low pore size.
Furthermore, surface characterization and N2 gas adsorption investigations were performed on ZnAc2/ZnO/CAC_OS materials to investigate its adsorption–desorption processes. Its N2 isotherm adsorption based on IUPAC was identical to the type 1 investigation. ZnAc2/ZnO/CAC_OS (F) was compared with its saturated (T1, T2 and T3) and desorbed counterparts (D1, D2, D3). All saturated materials (T1, T2 and T3) exhibited higher N2 adsorption than the fresh adsorbent as displayed in Figure 5. The result indicates that the H2S gas adsorbent on the ZnAc2/ZnO/CAC_OS surface has a higher surface area, micropore area, and pore volume for adsorption [37,46].
The N2 adsorption–desorption isotherm has acted upon the pore structure characteristics of ZnAc2/ZnO/CAC_OS that experienced three adsorption–desorption cycles. Each adsorption-desorption procedure of ZnAc2/ZnO/CAC_OS was calculated using BET analysis. Nitrogen intake at P/P0 = 0.98 was used to calculate the pore volume. The volume of micropores was determined using the t-plot approach. Table 6 provides a summary of the detailed pore structure of the parameter, including SBET, micropores volume, and pore size.
SBET increased after H2S gas adsorption. The increase in SBET for ZnAc2/ZnO/CAC_OS (T1) was 13% more than that for ZnAc2/ZnO/CAC_OS (T2) compared to ZnAc2/ZnO/CAC_OS (F). Among the exhausted adsorbents, ZnAc2/ZnO/CAC_OS (T1) exhibits a 19.1% decrease in SBET compared with ZnAc2/ZnO/CAC_OS (D1). This phenomenon can be observed in the next adsorption–desorption cycle. Furthermore, the ZnAc2/ZnO/CAC_OS (D1) had an 8.6% reduction in active site, which decreased the SBET values compared with ZnAc2/ZnO/CAC_OS (F) and decreased the pore size by 0.21%. Compared with ZnAc2/ZnO/CAC_OS (F), ZnAc2/ZnO/CAC_OS (D2) and ZnAc2/ZnO/CAC_OS (D3) were diminished by 5.1–5.7%. Hence, the reduction in ZnAc2/ZnO/CAC_OS in three adsorption–desorption cycles was stable and not excessive.
ZnAc2/ZnO/CAC_OS, in particular, is able to maintain a micropore area of 93.7% following a regeneration procedure compared with the micropore of fresh adsorbents, and its reduction in the next 2–3 cycles was negligible. This micropore area was substantial in the H2S gas adsorption process because it contains active sites that function effectively for effective H2S adsorption. Furthermore, the amount adsorbed in ZnAc2/ZnO/CAC_OS pores contributed to the reduction in surface area. Thus, chemical interactions with a reduction in micropore area and physical adsorption influence the H2S removal capability of the ZnAc2/ZnO/CAC_OS surface, which resulted in a decrease in pore size. This result is consistent with the findings of Wang et al. [49], Shi et al. [47], and De Oliveira et al. [15], who discovered that the regeneration of this adsorbent is dependent on the micropore area.
(c)
FTIR analysis
After the adsorption–desorption process, a reduction in pore volume makes the chemical adsorption process for H2S hazardous to the adsorbent [15,50]. Chemical adsorption is influenced by a functional group of hydrophilic carbon, surface pH, and the presence of moisture film on the surface of the adsorbent; therefore, the reduction in pore volume can be demonstrated by a number of other characterization methods [15,49,50].
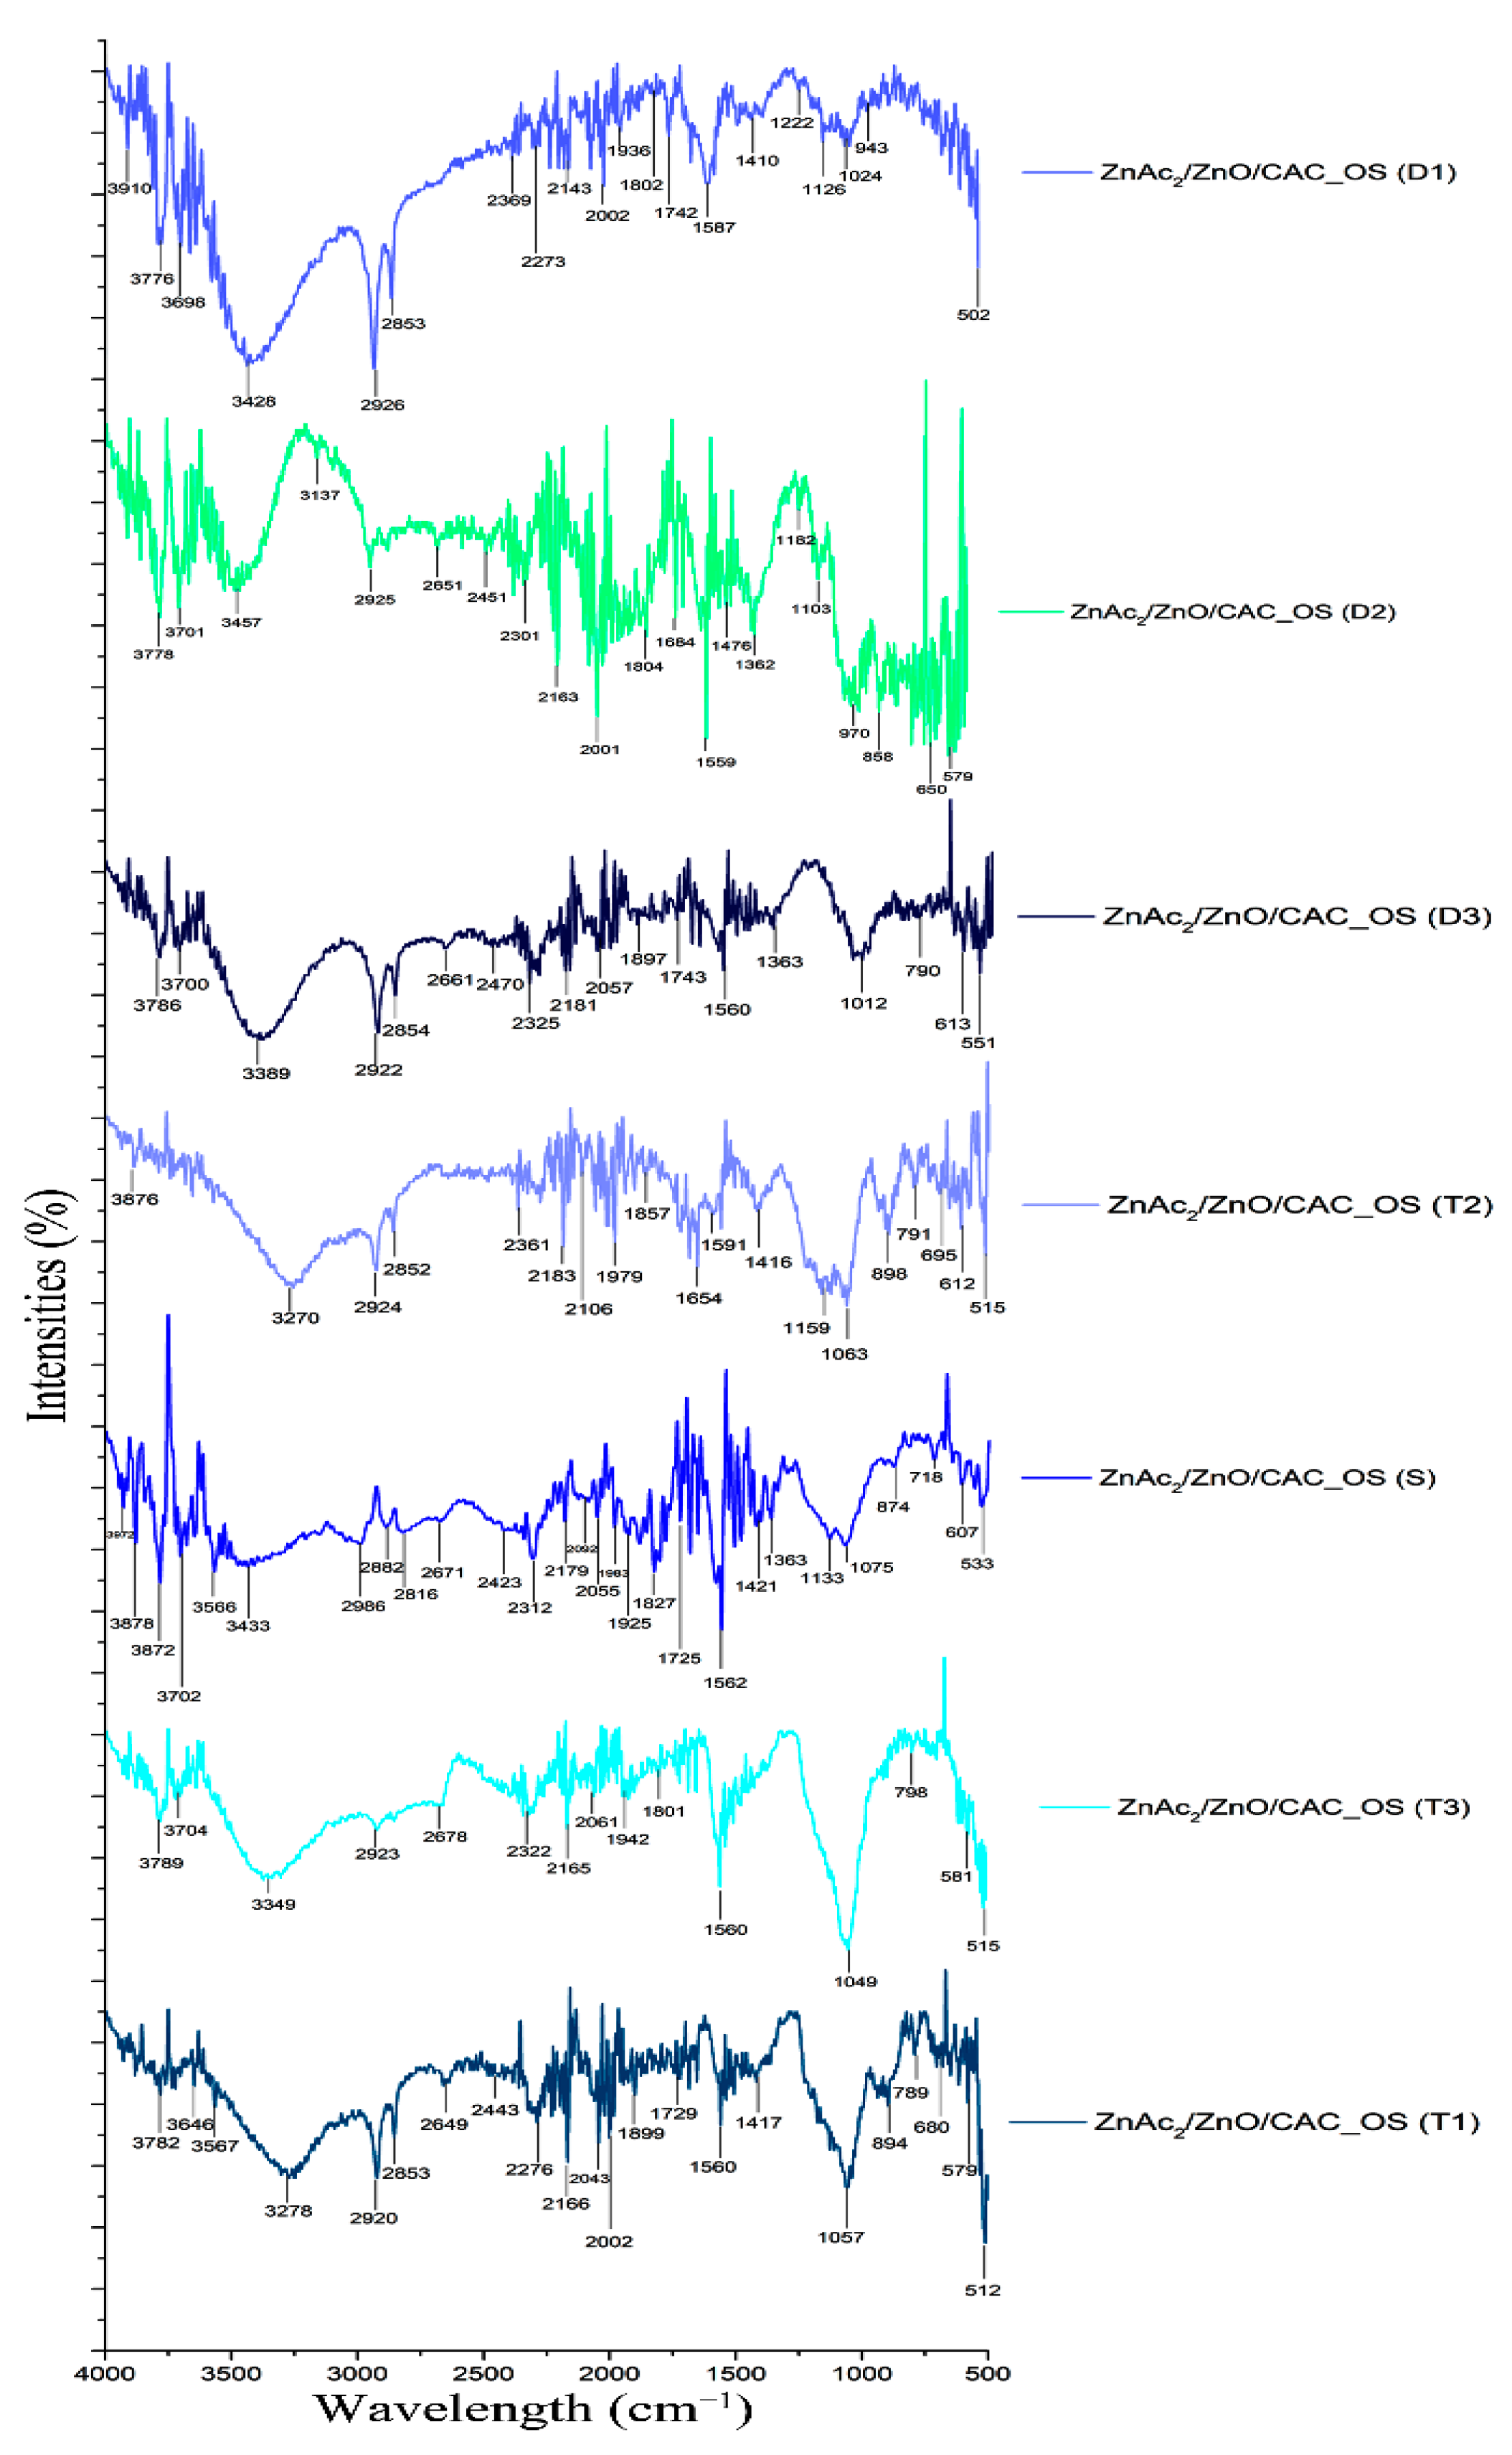
This chemical adsorption can be demonstrated by identifying the functional groups on the surface of the adsorbent using FTIR analysis. The comparison of these functional group pathways is attributable to the H2S gas adsorption mechanism of two adsorbents: ZnAc2/ZnO/CAC_DCM (Figure 6) and ZnAc2/ZnO/CAC_OS (Figure 7). Samples were collected at each adsorption (T1, T2, T3) and desorption step (D1, D2 and D3) to identify the functional groups on the surface of the adsorbent.
Few repeating peaks were identified and previously addressed. These peaks correspond to the hydroxyl group (OH), alkene (C–H), and carbonyl groups (C=O). Additionally, the chemical impregnated onto the adsorbent surface with metal oxide materials, such as ZnO, was also discovered at peaks between 1400 and 1600 cm−1 [51]. The presence of oxygen produced peak differences in the chemical adsorbents of ZnO, NH3, TEOS, KOH, and TiO2, showing that functional groups, such as carboxylic acid (O–H), ether (strain C–O–C), hydroxyl (O–H), acid anhydride (RC [=O] OC [=O] R), and the aromatic group (C=C ring) are at the peak wavelengths of 1550–1200 cm−1 [52,53].
The peak detection at 405 cm−1 for the Zn–C bond shows evidence of the interaction between the phase of metal material that was linked with the CAC [54]. The 470 cm−1 apex corresponds to Zn–O vibration [55]. Furthermore, the peaks at 418 cm−1 and 1400–1600 cm−1 are reserved for O–H and Zn–O, respectively [51]. The Zn–O path, however, vanished after the desorption process. After the adsorption procedure, the Zn–S functional group was found on the vibration band at 961 cm−1 [53,56]. However, the metal oxide route returns in the FTIR spectrum of the adsorbed substance. This finding demonstrates that the chemical link between the metal atom and atomic oxygen is broken during the desorption process, which is consistent with the earlier EDX research.
The carbon surface’s hydroxyl groups (OH) promote SO2 binding through ion–dipole interactions with COS. Therefore, the activity and selectivity of the concentrated compounds on precursors, such as AC, are remarkably impacted by the presence of functional groups in the oxidation reaction of H2S catalysts [57]. The Zn–S vibration band may be seen at 961 cm−1 [53,56]. The peak also supports the decryption of the EDX characterization of the sulfur element on the adsorbent, which states that the chemical link between the metal and oxygen atom is changed to the metal and sulfur atoms during the sulfidation process.
Adsorbents that have adsorbed gas under saturated circumstances (T1, T2 and T3) can be found in a variety of functional groups when compared with fresh adsorbents, particularly ZnAc2/ZnO/CAC_DCM (F). H2S gas adsorption exhibits numerous peaks involving sulfur bonds, including sulfate (S=O), sulfur oxide (S=O), and sulfonate (S=O), having peaks of 1415–1380, 1070–1030, and 1372–1335 cm−1, respectively. Peaks for weak aromatic groups with C–H swelling developed along the 2000–1650 cm−1 peak. The wavenumbers for saturated and diabetic adsorbents (D1, D2, and D3) were identical in terms of the functional groups present but differ in terms of wavenumber percentage of intensity. The percentage of intensity for saturated adsorbents was often higher than that for the adsorbed adsorbent.
Furthermore, additional functional groups for ZnAc2/ZnO/CAC_OS were added, such as N–H bonding of amine salt (3000–2800 cm−1), C–N bond strain weak for nitrile group (2260–2222 cm−1), N–H swelling band at 1650–1580 cm−1, the path of thiocyanate group with strong S–CN stretching (2175–2140 cm−1), and isotiocyanate (2140–1990 cm−1). The 1086 cm−1 strip depicts cyclic Si–O–Si bonding, whereas the 473 cm−1 strip depicts the SiO pathway [58]. The ZnAc2/ZnO/CAC_OS adsorbent had a lower intensity band than the ZnAc2/ZnO/CAC_DCM adsorbent, which has an amine functional group on the adsorbent. This amine group is thought to protect the Si–OH group from stretching vibrations and improve the adsorbent’s thermal stability on the adsorbent’s surface. It is associated with asymmetric bending and primary amine symmetry (–NH2) in the 1564 and 1480 cm−1 bands and secondary amine bending (–N[R]H) in the 1652 cm−1 band [59]. Finally, the functional group was analyzed in this adsorption process to illustrate the gas adsorption process via chemical adsorption, in which the groups interact with sulfur material on each saturated adsorbent and decompose.

3.3. Adsorbent Performance in H2S Adsorption–Desorption

The adsorption–desorption process was analyzed using ZnAc2/ZnO/CAC_DCM and ZnAc2/ZnO/CAC_OS to determine adsorption through the regeneration of saturated adsorption materials. Each adsorbent underwent desorption at 150 °C. The profile of ZnAc2/ZnO/CAC_DCM in three adsorption–desorption cycles is shown in Figure 8.
Each of these adsorbents performed well in the first adsorption–desorption cycle. This outcome is most likely due to the adsorbent’s surface pores having a high active site. In the first cycle, the amounts of H2S gas adsorption were approximately 1.75, 1.00, and 0.75 mg H2S/g for ZnAc2/ZnO/CAC_DCM, ZnAc2/ZnO/CAC_OS, and raw CAC, respectively. The second adsorption performance was observed after the first desorption process. The adsorption capacity in the second cycle decreased by 35.4% for ZnAc2/ZnO/CAC_DCM. While, 25% and 22.7% decrease were recorded in the second cycles of ZnAc2/ZnO/CAC_DCM. However, in the third cycle, the H2S gas adsorption of ZnAc2/ZnO/CAC_DCM and raw CAC kept decreasing by another 20.4% and 6.9%, respectively, whereas ZnAc2/ZnO/CAC_OS showed no changes in adsorption capability for current cycles.
In conclusion, ZnAc2/ZnO/CAC_DCM had the capability to adsorb more H2S gas compared with other adsorbents; however, this adsorbent seems difficult to regenerate, as its adsorption capacity dropped drastically and was obviously not stable for longer adsorption–desorption cycles. However, ZnAc2/ZnO/CAC_OS performed better and was more stable compared with ZnAc2/ZnO/CAC_DCM and raw CAC. The decrease in adsorption capability with increasing adsorption–desorption cycles is caused by chemical interactions that reduce the adsorbent’s surface catalytic activity [59,60,61]. The interaction between sulfur and the adsorbent surface is one of factors that reduces H2S adsorption capability. Additionally, the production of stable sulfur polymers impairs adsorbent regeneration.
Ozekmekci et al. [60] suggested the application of a higher temperature in the desorption process to increase the adsorption capability in the next cycle as a good regeneration procedure that demands high temperatures of 500–600 °C in inert conditions. However, the researcher also advised to keep the adsorbent’s surface structure and effectiveness at temperatures below 400 °C [60]. Furthermore, based on the TG analysis of Zulkefli et al. [37,38,39,40], this temperature range might change the structure of the adsorbent’s surface, which could lessen its ability to adsorb H2S.
The successful adsorption–desorption of H2S in three cycles motivated us to observe further the capability of adsorbents until the maximum cycles. Raw CAC, ZnAc2/ZnO/CAC_DCM, and ZnAc2/ZnO/CAC_OS were evaluated for adsorption–desorption until they were saturated and could no longer be regenerated. Figure 9 depicts the comparison profile of the adsorbent up to the last adsorption–desorption cycle.
According to Figure 9, the raw CAC was capable of regenerating up to the 9th cycle with a final adsorption capability of 0.04 mg H2S/g. In comparison, ZnAc2/ZnO/CAC_DCM and ZnAc2/ZnO/CAC_OS had outstanding adsorption capabilities with 12 and 30 cycles, respectively, and their final adsorption capacities were 0.04 mg H2S/g. Hence, ZnAc2/ZnO/CAC_OS showed the most prominent stabilization with a large number of cycles in the regeneration process. The stability of its adsorption–desorption cycles were 70% and 60% longer than those of raw CAC and ZnAc2/ZnO/CAC_DCM, respctively. As a result, ZnAc2/ZnO/CAC_OS had a higher number of regeneration cycles. Its adsorption capability can be further investigated to enhance its adsorption capacity in a longer regeneration cycle.

4. Conclusions

Metal-based adsorbents with varying active phase loadings were synthesized to capture hydrogen sulfide (H2S). The behavior of adsorbents and the adsorption–desorption process were observed through pH changes and supported with several characterization analyses. The SEM-EDX, N2 adsorption–desorption isotherms, BET, and FTIR analysis were discussed based on physical changes toward selective adsorbents throughout three adsorption–desorption cycles. From the findings, modified adsorbents, dual chemical mixture (DCM) and a core–shell (CS) had the highest H2S adsorption performance with a range of 0.92–1.80 mg H2S/g. A further examination of the maximum adsorption–desorption cycle, i.e., more than 30 cycles, for each adsorbent type was performed until the minimum adsorption capacity of 0.04 mg H2S/g was recorded at the final adsorption cycles. The most stable and longer adsorption–desorption cycles with prominent capability of capturing H2S gas up to 70% more than raw CAC were ZnAc2/ZnO/CAC_OS. Even though the adsorption capacity of ZnAc2/ZnO/CAC_OS showed a 42.9% difference than ZnAc2/ZnO/CAC_DCM, further investigations can potentially be used to capture H2S gas with ZnAc2/ZnO/CAC_OS owing to their high efficiency, high stabilization, and economic feasibility. Meanwhile, the proposed behavioral model for H2S adsorption–desorption was validated effectively using various analyses throughout three cycles of adsorption–desorption samples. Furthermore, additional comprehensive analyses, i.e., X-ray Photoelectron Spectroscopy (XPS), and adsorption–desorption operation data, are required for the evaluation of the kinetics and mechanism of the H2S adsorption–desorption process.

Author Contributions

Methodology, N.N.Z. and A.M.I.N.A.; Formal analysis, N.N.Z., M.S.M. and W.N.R.W.I.; Investigation, N.N.Z. and A.M.I.N.A.; Writing—original draft, N.N.Z. and A.M.I.N.A.; Writing—review & editing, M.S.M. and W.N.R.W.I.; Supervision, M.S.M.; Project administration, M.S.M. All authors have read and agreed to the published version of the manuscript.

Funding

This research was funded by the Ministry of Higher Education, Malaysia, under research code FRGS/1/2020/TK0/UKM/02/4 and by Universiti Kebangsaan Malaysia under research code DPK-2020-009 and PP-FKAB-2022.

Institutional Review Board Statement

Not applicable.

Informed Consent Statement

Not applicable.

Data Availability Statement

All relevant data are contained in the present manuscript.

Conflicts of Interest

The authors declare no conflict of interest.

References

  1. Chen, Q.J.; Wang, Z.; Long, D.H.; Liu, X.J.; Zhan, L.; Lian, X.Y.; Qiao, W.M.; Ling, L.C. Role of pore structure of activated carbon fibers in the catalytic oxidation of H2S. Ind. Eng. Chem. Res. 2010, 49, 3152–3159. [Google Scholar] [CrossRef]
  2. Khabazipour, M.; Anbia, M. Removal of hydrogen sulfide from gas streams using porous materials: A review. Ind. Eng. Chem. Res. 2019, 58, 22133–22164. [Google Scholar] [CrossRef]
  3. Chen, F.E.; Mandel, R.M.; Woods, J.J.; Lee, J.-H.; Kim, J.; Hsu, J.H.; Fuentes-Rivera, J.J.; Wilson, J.J.; Milner, P.J. Biocompatible metal–organic frameworks for the storage and therapeutic delivery of hydrogen sulfide. Chem. Sci. 2021, 12, 7848–7857. [Google Scholar] [CrossRef]
  4. Johari, A.; Ahmed, S.I.; Hashim, H.; Alkali, H.; Ramli, M. Economic and environmental benefits of landfill gas from municipal solid waste in Malaysia. Renew. Sustain. Energy Rev. 2012, 16, 2907–2912. [Google Scholar] [CrossRef]
  5. Watanabe, S. Chemistry of H2S over the surface of common solid sorbents in industrial natural gas desulfurization. Catal. Today 2020, 371, 204–220. [Google Scholar] [CrossRef]
  6. Comite, A.; Costa, C.; Demartini, M.; DiFelice, R.; Rotondi, M. Rate of CO2 transfer to loaded MEA solutions using a membrane contactor device. Int. J. Greenh. Gas Control 2016, 52, 378–386. [Google Scholar] [CrossRef]
  7. Comite, A.; Costa, C.; Demartini, M.; DiFelice, R.; Oliva, M. Exploring CO2 capture from pressurized industrial gaseous effluents in a membrane contactor-based pilot plant. Int. J. Greenh. Gas Control 2017, 67, 60–70. [Google Scholar] [CrossRef]
  8. Tian, X.-F.; Wang, L.-M.; Fu, D. Absorption and removal efficiency of low-partial-pressure H2S in a tetramethylammonium glycinate activated N-methyldiethanolamine aqueous solution. Energy Fuels 2019, 33, 8413–8422. [Google Scholar] [CrossRef]
  9. Wang, T.; Hu, B.; Li, J.-W.; Nie, L.-H.; Tan, J.-J. Removal of hydrogen sulfide by hydroxyl-ferric oxide in a slurry reactor at low temperature. Ind. Eng. Chem. Res. 2020, 59, 1402–1412. [Google Scholar] [CrossRef]
  10. Okoro, O.V.; Sun, Z. Desulphurisation of biogas: A systematic qualitative and economic-based quantitative review of alternative strategies. Chem. Eng. 2019, 3, 76. [Google Scholar] [CrossRef]
  11. Georgiadis, A.G.; Charisiou, N.D.; Goula, M.A. Removal of hydrogen sulfide from various industrial gases: A review of the most promising adsorbing materials. Catalysts 2020, 10, 521. [Google Scholar] [CrossRef]
  12. Bhatt, P.M.; Belmabkhout, Y.; Assen, A.H.; Weselinski, Ł.J.; Jiang, H.; Cadiau, A.; Xue, D.-X.; Eddaoudi, M. Isoreticular rare earth fcu-MOFs for the selective removal of H2S from CO2 containing gases. Chem. Eng. J. 2017, 324, 392–396. [Google Scholar] [CrossRef] [Green Version]
  13. Hamon, L.; Serre, C.; Devic, T.; Loiseau, T.; Millange, F.; Ferey, G.; Weireld, G.D. Comparative study of hydrogen sulfide adsorption in the MIL-53(Al, Cr, Fe), MIL-47(V), MIL-100(Cr), and MIL-101(Cr) metalorganic frameworks at room temperature. J. Am. Chem. Soc. 2009, 131, 8775–8777. [Google Scholar] [CrossRef] [PubMed]
  14. Petit, C.; Mendoza, B.; Bandosz, T.J. Hydrogen sulfide adsorption on MOFs and MOF/graphite oxide composites. ChemPhysChem 2010, 11, 3678–3684. [Google Scholar] [CrossRef]
  15. De Oliveira, L.H.; Meneguin, J.G.; Pereira, M.V.; do Nascimento, J.F.; Arroyo, P.A. Adsorption of hydrogen sulfide, carbon dioxide, methane, and their mixtures on activated carbon. Chem. Eng. Commun. 2019, 206, 1533–1553. [Google Scholar] [CrossRef]
  16. Sumida, K.; Rogow, D.L.; Mason, J.A.; McDonald, T.M.; Bloch, E.D.; Herm, Z.R.; Bae, T.-H.; Long, J.R. Carbon dioxide capture by metal organic frameworks. Chem. Rev. 2012, 112, 724–781. [Google Scholar] [CrossRef]
  17. Forster, H.; Schuldt, M. Infrared spectroscopic study of the adsorption of hydrogen sulfide on zeolites NaA and NaCaA. J. Colloid Interface Sci. 1975, 52, 380–385. [Google Scholar] [CrossRef]
  18. Maugé, F.; Sahibed-Dine, A.; Gaillard, M.; Ziolek, M. Modification of the acidic properties of NaY zeolite by H2S Adsorption—An infrared study. J. Catal. 2002, 207, 353–360. [Google Scholar] [CrossRef]
  19. Grande, C.A.; Blom, R.; Moller, A.; Möllmer, J. High-pressure separation of CH4/CO2 using activated carbon. Chem. Eng. Sci. 2013, 89, 10–20. [Google Scholar] [CrossRef]
  20. Garshasbi, V.; Jahangiri, M.; Anbia, M. Equilibrium CO2 adsorption on zeolite 13X prepared from natural clays. Appl. Surf. Sci. 2017, 393, 225–233. [Google Scholar] [CrossRef]
  21. Hamon, L.; Frere, M.; De Weireld, G. Development of a new apparatus for gas mixture adsorption measurements coupling gravimetric and chromatographic techniques. Adsorption 2008, 14, 493–499. [Google Scholar] [CrossRef]
  22. Somy, A.; Mehrnia, M.R.; Amrei, H.D.; Ghanizadeh, A.; Safari, M. Adsorption of carbon dioxide using impregnated activated carbon promoted by zinc. Int. J. Greenh. Gas Control 2009, 3, 249–254. [Google Scholar] [CrossRef]
  23. Vargas, D.P.; Giraldo, L.; Moreno-Pirajan, J.C. Carbon dioxide and methane adsorption at high pressure on activated carbon materials. Adsorption 2013, 19, 1075–1082. [Google Scholar] [CrossRef]
  24. Wang, J.; Zhang, P.; Liu, L.; Zhang, Y.; Yang, J.; Zeng, Z.; Deng, S. Controllable synthesis of bifunctional porous carbon for efficient gas-mixture separation and high-performance supercapacitor. Chem. Eng. J. 2018, 348, 57–66. [Google Scholar] [CrossRef]
  25. Zhang, P.; Zhong, Y.; Ding, J.; Wang, J.; Xu, M.; Deng, Q.; Zeng, Z.; Deng, S. A new choice of polymer precursor for solvent-free method: Preparation of Nenriched porous carbons for highly selective CO2 capture. Chem. Eng. J. 2019, 355, 963–973. [Google Scholar] [CrossRef]
  26. Adib, F.; ABagreev, T.J. Bandosz, Effect of pH and surface chemistry on the mechanism of H2S removal by activated carbons. J. Colloid Interface Sci. 1999, 216, 360–369. [Google Scholar] [CrossRef]
  27. Bandosz, T.J. Effect of pore structure and surface chemistry of virgin activated carbons on removal of hydrogen sulfide. Carbon 1999, 37, 483–491. [Google Scholar] [CrossRef]
  28. Bagreev, A.; Adib, F.; Bandosz, T.J. pH of activated carbon surface as an indication of its suitability for H2S removal from moist air streams. Carbon 2001, 39, 1897–1905. [Google Scholar] [CrossRef]
  29. Zulkefli, N.N.; Masdar, M.S.; Wan Isahak, W.N.R.; Md Jahim, J.; Md Rejab, S.A.; Chien Lye, C. Removal of hydrogen sulfide from a biogas mimic by using impregnated activated carbon adsorbent. PLoS ONE 2019, 14, e0211713. [Google Scholar] [CrossRef] [Green Version]
  30. Zulkefli, N.N.; Mathuray Veeran, L.S.; Noor Azam, A.M.I.; Masdar, M.S.; Wan Isahak, W.N.R. Effect of Bimetallic-Activated Carbon Impregnation on Adsorption– Desorption Performance for Hydrogen Sulfide (H2S) Capture. Materials 2022, 15, 5409. [Google Scholar] [CrossRef]
  31. Zulkefli, N.N.; Seladorai, R.; Masdar, M.S.; Mohd Sofian, N.; Wan Isahak, W.N.R. Core Shell Nanostructure: Impregnated Activated Carbon as Adsorbent for Hydrogen Sulfide Adsorption. Molecules 2022, 27, 1145. [Google Scholar] [CrossRef] [PubMed]
  32. Zulkefli, N.N.; Masdar, M.S.; Wan Isahak, W.N.R.; Abu Bakar, S.N.H.; Abu Hasan, H.; Mohd Sofian, N. Application of Response Surface Methodology for Preparation of ZnAC2/CAC Adsorbents for Hydrogen Sulfide (H2S) Capture. Catalysts 2021, 11, 545. [Google Scholar] [CrossRef]
  33. Yan, R.; Liang, D.T.; Tsen, L.; Tay, J.H. Kinetics and mechanisms of H2S adsorption by alkaline activated carbon. Environ. Sci. Technol. 2002, 36, 4460–4466. [Google Scholar] [CrossRef] [PubMed]
  34. Chiang, H.L.; Tsai, J.H.; Tsai, C.L.; Hsu, Y.C. Adsorption characteristics of alkaline activated carbon exemplified by water vapor, H2S, and CH3SH gas. Sep. Sci. Technol. 2000, 35, 903–918. [Google Scholar] [CrossRef]
  35. Yan, R.; Chin, T.; Ng, Y.L.; Duan, H.; Liang, D.T.; Tay, J.H. Influence of surface properties on the mechanism of H2S removal by alkaline activated carbons. Environ. Sci. Technol. 2004, 38, 316–323. [Google Scholar] [CrossRef]
  36. Nakamura, T.; Kawasaki, N.; Hirata, M.; Oida, Y.; Tanada, S. Adsorption of Hydrogen Sulfide by Zinc-Containing Activated carbon. Toxicol. Environ. Chem. 2002, 82, 93–98. [Google Scholar] [CrossRef]
  37. Sitthikhankaew, R.; Chadwick, D.; Assabumrungrat, S.; Laosiripojana, N. Effect of KI and KOH Impregnations over Activated Carbon on H2S Adsorption Performance at Low and High Temperatures. Sep. Sci. Technol. 2014, 49, 354–366. [Google Scholar] [CrossRef]
  38. Basyooni, M.A.; Zaki, S.E.; Alfryyan, N.; Tihtih, M.; Eker, Y.R.; Attia, G.F.; Yılmaz, M.; Ates, S.; Shaban, M. Nanostructured MoS2 and WS2 Photoresponses under Gas Stimuli. Nanomaterials 2022, 12, 3585. [Google Scholar] [CrossRef]
  39. Basyooni, M.A.; Shaban, M.; El Sayed, A.M. Enhanced Gas Sensing Properties of Spin-coated Na-doped ZnO Nanostructured Films. Sci. Rep. 2016, 7, 41716. [Google Scholar] [CrossRef] [Green Version]
  40. Boudou, J.P.; Chehimi, M.; Broniek, E.; Siemieniewska, T.; Bimer, J. Adsorption of H2S or SO2 on an activated carbon cloth modified by ammonia treatment. Carbon 2003, 41, 1999–2007. [Google Scholar] [CrossRef]
  41. Huang, C.; Chen, C.; Chu, S. Effect of moisture on H2S adsorption by copper impregnated activated carbon. J. Hazard. Mater. 2006, 136, 866–873. [Google Scholar] [CrossRef] [PubMed]
  42. Yusuf NY, M.; Masdar, M.S.; Isahak WN, R.W.; Nordin, D.; Husaini TMajlan, E.H.; Lye, C.C. Impregnated carbon–ionic liquid as innovative adsorbent for H2 /CO2 separation from biohydrogen. Int. J. Hydrog. Energy 2018, 44, 3414–3424. [Google Scholar] [CrossRef]
  43. Isik-Gulsac, I. Investigation of Impregnated Activated Carbon Properties Used in Hydrogen Sulfide Fine Removal. Braz. J. Chem. Eng. 2016, 33, 1021–1030. [Google Scholar] [CrossRef]
  44. Thommes, M.; Kaneko, K.; Neimark, A.V.; Olivier, J.P.; Rodriguez-Reinoso, F.; Rouquerol, J.; Sing, K.S.W. Physisorption of gases, with special reference to the evaluation of surface area and pore size distribution (IUPAC technical report). Pure Appl. Chem. 2015, 87, 1051–1069. [Google Scholar] [CrossRef] [Green Version]
  45. Shi, L.; Yang, K.; Zhao, Q.; Wang, H.; Cui, Q. Characterization and Mechanisms of H2S and SO2 Adsorption by Activated Carbon. Energy Fuels 2015, 29, 6678–6685. [Google Scholar] [CrossRef]
  46. Yu, T.; Chen, Z.; Liu, Z.; Xu, J.; Wang, Y. Review of Hydrogen Sulfide Removal from Various Industrial Gases by Zeolites. Separations 2022, 9, 229. [Google Scholar] [CrossRef]
  47. Shi, J.; Wang, Y.; Yu, X.; Du, W.; Hou, Z. Production of 2,5-dimethylfuran from 5-hydroxymethylfurfural over reduced graphene oxides supported Pt catalyst under mild conditions. Fuel 2016, 163, 74–79. [Google Scholar] [CrossRef]
  48. Petrovic, B.; Gorbounov, M.; Masoudi Soltani, S. Influence of surface modification on selective CO2 adsorption: A technical review on mechanisms and methods. Microporous Mesoporous Mater. 2021, 312, 110751. [Google Scholar] [CrossRef]
  49. Wang, J.; Ju, F.; Han, L.; Qin, H.; Hu, Y.; Chang, L.; Bao, W. Effect of activated carbon supports on removing H2S from coal-based gases using Mn-based sorbents. Energy Fuels 2015, 29, 488–495. [Google Scholar] [CrossRef]
  50. Jurablu, S.; Farahmandjou, M.; Firoozabadi, T.P. Sol-Gel Synthesis of Zinc Oxide (ZnO) Nanoparticles: Study of Structural and Optical Properties. J. Sci. 2015, 26, 281–285. [Google Scholar]
  51. Saleem, J.; Shahid, U.B.; Hijab, M.; Mackey, H.; McKay, G. Production and applications of activated carbons as adsorbents from olive stones. Biomass- Convers. Biorefinery 2019, 9, 775–802. [Google Scholar]
  52. Feng, Y.; Dou, J.; Tahmasebi, A.; Xu, J.; Li, X.; Yu, J.; Yin, F. Regeneration of Fe–Zn–Cu Sorbents Supported on Activated Lignite Char for the Desulfurization of Coke Oven Gas. Energy Fuels 2015, 29, 7124–7134. [Google Scholar] [CrossRef]
  53. Li, X.; Ju, Y.; Hou, Q.; Li, Z.; Fan, J. FTIR and Raman Spectral Research on Metamorphism and Deformation of Coal. J. Geol. Res. 2012, 2012, 590857. [Google Scholar] [CrossRef] [Green Version]
  54. Cai, R.; Wu, J.G.; Sun, L.; Liu, Y.J.; Fang, T.; Zhu, S.; Li, S.Y.; Wang, Y.; Guo, L.F.; Zhao, C.E.; et al. 3D graphene/ZnO composite with enhanced photocatalytic activity. Mater. Des. 2016, 90, 839–844. [Google Scholar] [CrossRef]
  55. Muthukumaran, S.; Kumar, M.A. Structural, FTIR and photoluminescence properties of ZnS:Cu thin films by chemical bath deposition method. Mater. Lett. 2013, 93, 223–225. [Google Scholar] [CrossRef]
  56. Khairudin, N.F.; Mohammadi, M.; Mohamed, A.R. An investigation on the relationship between physicochemical characteristics of alumina-supported cobalt catalyst and its performance in dry reforming of methane. Environ. Sci. Pollut. Res. 2021, 28, 29157–29176. [Google Scholar] [CrossRef] [PubMed]
  57. Mao, J.; Ma, Y.; Zang, L.; Xiao, C.; Ji, D. Efficient adsorption of hydrogen sulfide at room temperature using fumed silica-supported deep eutectic solvents. Aerosol. Air Qual. Res. 2020, 20, 203–215. [Google Scholar] [CrossRef]
  58. Jaiboon, V.; Yoosuk, B.; Prasassarakich, P. Amine modified silica xerogel for H2S removal at low temperature. Fuel Process. Technol. 2014, 128, 276–282. [Google Scholar] [CrossRef]
  59. Zhang, J.J.; Wang, W.Y.; Shen, L.P.; Wang, G.J.; Song, H. Synthesis and characterization of MnxOy–ZnxOy/AC adsorbents for adsorptive removal of H2S from natural gas. Adsorpt. Sci. Technol. 2016, 34, 331–341. [Google Scholar] [CrossRef] [Green Version]
  60. Ozekmekci, M.; Salkic, G.; Fellah, M.F. Use of zeolites for the removal of H2S: A mini-review. Fuel Processing Technol. 2015, 139, 49–60. [Google Scholar] [CrossRef]
  61. Sidek, M.Z.; Masdar, M.S.; Nik Dir, N.M.H.; Amran, N.F.A.; Ajit Sing, S.K.D.; Wong, W.L. Integrasi Sistem Penulenan Biohidrogen dan Aplikasi Sel Fuel. J. Kejuruter. 2018, 1, 41–48. [Google Scholar]
Figure 1. Impregnation step behavior of ZnAc2/ZnO/CAC_DCM.
Materials 16 00462 g001
Figure 2. Impregnation step behavior of ZnAc2/ZnO/CAC_OS.
Materials 16 00462 g002
Figure 3. SEM mapping images of (a) ZnAc2/ZnO/CAC_DCM (F) and (b) ZnAc2/ZnO/CAC_OS (F) at 2.5K× magnification.
Materials 16 00462 g003
Figure 4. N2 adsorption–desorption isotherms of ZnAc2/ZnO/CAC_DCM in three H2S adsorption–desorption cycles.
Materials 16 00462 g004
Figure 5. N2 adsorption–desorption isotherms of ZnAc2/ZnO/CAC_OS adsorbents through three H2S adsorption–desorption cycles.
Materials 16 00462 g005
Figure 6. FTIR spectra of ZnAc2/ZnO/CAC_DCM through three H2S adsorption–desorption cycles.
Materials 16 00462 g006
Figure 7. FTIR spectra of ZnAc2/ZnO/CAC_OS through three H2S adsorption–desorption cycles.
Materials 16 00462 g007
Figure 8. Adsorption–desorption profiles of raw CAC, ZnAc2/ZnO/CAC_DCM, and ZnAc2/ZnO/CAC_OS in three cycles.
Materials 16 00462 g008
Figure 9. Maximum H2S adsorption–desorption profiles of ZnAc2/ZnO/CAC_DCM, ZnAc2/ZnO/CAC_OS, and raw CAC.
Materials 16 00462 g009
Table 1. pH value in each impregnation step of ZnAc2/ZnO/CAC_DCM at different soaking temperatures.
Impregnation SteppH at 35 °CpH at 65 °CpH at 95 °C
Distilled water7.007.007.00
ZnAc2 solution 5.604.924.23
ZnAc2 + ZnO solution 5.574.794.19
ZnAc2 + ZnO + raw CAC solution 5.745.044.82
Solution after 49 min4.674.964.59
Table 2. pH value in each impregnation step of ZnAc2/ZnO/CAC_OS at different soaking temperatures.
Impregnation SteppH at 35 °CpH at 65 °CpH at 95 °C
Distilled water7.007.007.00
KOH solution 12.3712.0311.71
KOH + core (CAC) solution 12.8912.6312.35
Solution after 49 min8.218.037.79
TiO2 solution 7.396.526.11
TiO2 + core (CAC) solution 7.617.066.74
Solution after 49 min7.436.826.48
TEOS solution 6.396.585.73
TEOS + NH3 solution 9.138.818.70
TEOS + NH3+ core (CAC) solution 9.238.908.74
Solution after 49 min7.697.347.29
Table 3. Element contents of the ZnAc2/ZnO/CAC_DCM surface in 3 cycles of H2S adsorption–desorption.
Adsorbent SamplesCCaOZnS
ZnAc2/ZnO/CAC_DCM (F)38.070.1726.7535.010.00
ZnAc2/ZnO/CAC_DCM (T1)30.931.2219.1128.4320.31
ZnAc2/ZnO/CAC_DCM (D1)39.340.7925.7733.270.83
ZnAc2/ZnO/CAC_DCM (T2)29.671.7320.1427.1921.27
ZnAc2/ZnO/CAC_DCM (D2)40.110.8025.2132.671.21
ZnAc2/ZnO/CAC_DCM (T3)28.421.9018.7528.5422.39
ZnAc2/ZnO/CAC_DCM (D3)49.610.8819.5625.914.04
Table 4. Element contents of the ZnAc2/ZnO/CAC_OS surface in three cycles of H2S adsorption–desorption.
AdsorbentCCaOZnKTiSiS
ZnAc2/ZnO/CAC_OS (F)27.460.6737.2723.731.881.597.400.00
ZnAc2/ZnO/CAC_OS (T1)19.632.5327.2217.581.390.770.5720.31
ZnAc2/ZnO/CAC_OS (D1)36.870.8133.0221.671.801.473.570.79
ZnAc2/ZnO/CAC_OS (T2)17.802.3328.3817.280.780.431.7321.27
ZnAc2/ZnO/CAC_OS (D2)38.410.9432.1921.351.601.363.280.87
ZnAc2/ZnO/CAC_OS (T3)19.392.6826.2217.190.860.451.8221.39
ZnAc2/ZnO/CAC_OS (D3)40.030.9131.8420.291.580.933.041.38
Table 5. Porous properties of ZnAc2/ZnO/CAC_DCM in three H2S adsorption–desorption cycles.
Adsorbent SamplesSBET (m2/g)Average Pore Volume (cm3/g)Micropore Area (m2/g)Pore Size (Å)
ZnAc2/ZnO/CAC_DCM (F)847.100.41688.1419.21
ZnAc2/ZnO/CAC_DCM (T1)921.010.42725.7918.42
ZnAc2/ZnO/CAC_DCM (D1)688.430.33509.2319.28
ZnAc2/ZnO/CAC_DCM (T2)957.170.45747.3318.98
ZnAc2/ZnO/CAC_DCM (D2)875.900.42680.1519.00
ZnAc2/ZnO/CAC_DCM (T3)900.480.43668.2418.89
ZnAc2/ZnO/CAC_DCM (D3)812.730.38667.1218.93
Table 6. Porous properties for ZnAc2/ZnO/CAC_OS through three H2S adsorption–desorption cycles.
Adsorbent SamplesSBET (m2/g)Average Pore Volume (cm3/g)Micropore Area (m2/g)Pore Size (Å)
ZnAc2/ZnO/CAC_OS (F)940.410.45756.5319.17
ZnAc2/ZnO/CAC_OS (T1)1062.230.51805.5219.11
ZnAc2/ZnO/CAC_OS (D1)859.410.41709.1619.13
ZnAc2/ZnO/CAC_OS (T2)1011.290.48816.1519.10
ZnAc2/ZnO/CAC_OS (D2)877.910.42717.5919.25
ZnAc2/ZnO/CAC_OS (T3)962.150.46760.7819.08
ZnAc2/ZnO/CAC_OS (D3)872.160.42713.6919.10
Disclaimer/Publisher’s Note: The statements, opinions and data contained in all publications are solely those of the individual author(s) and contributor(s) and not of MDPI and/or the editor(s). MDPI and/or the editor(s) disclaim responsibility for any injury to people or property resulting from any ideas, methods, instructions or products referred to in the content.

