
Precise Modeling of Thermal and Strain Rate Effect on the Hardening Behavior of SiC/Al Composite


Abstract
:1. Introduction
2. Experimental Procedures
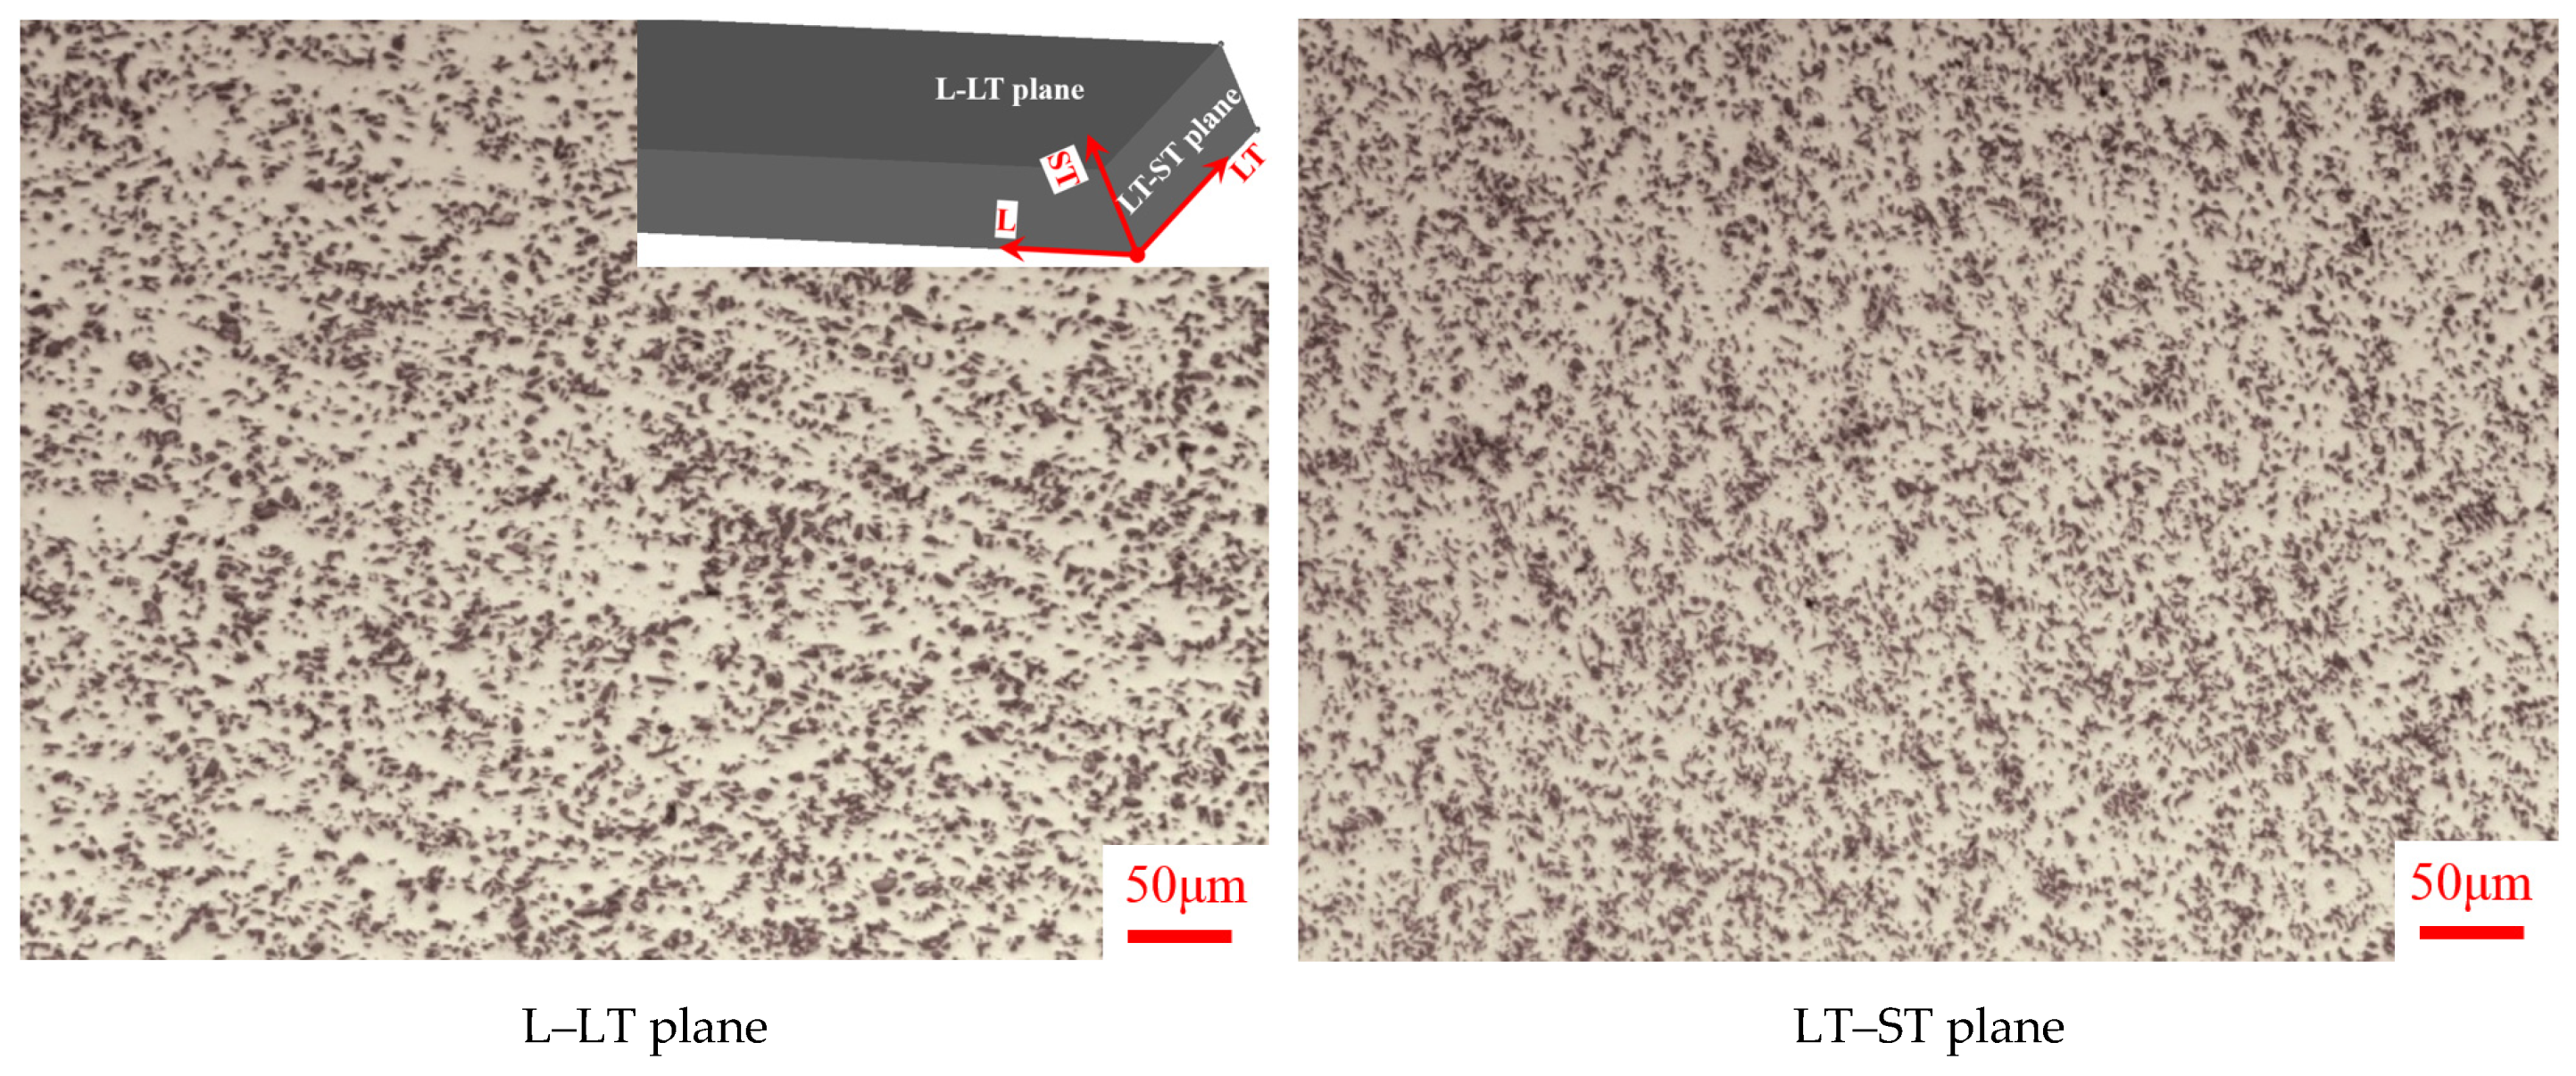
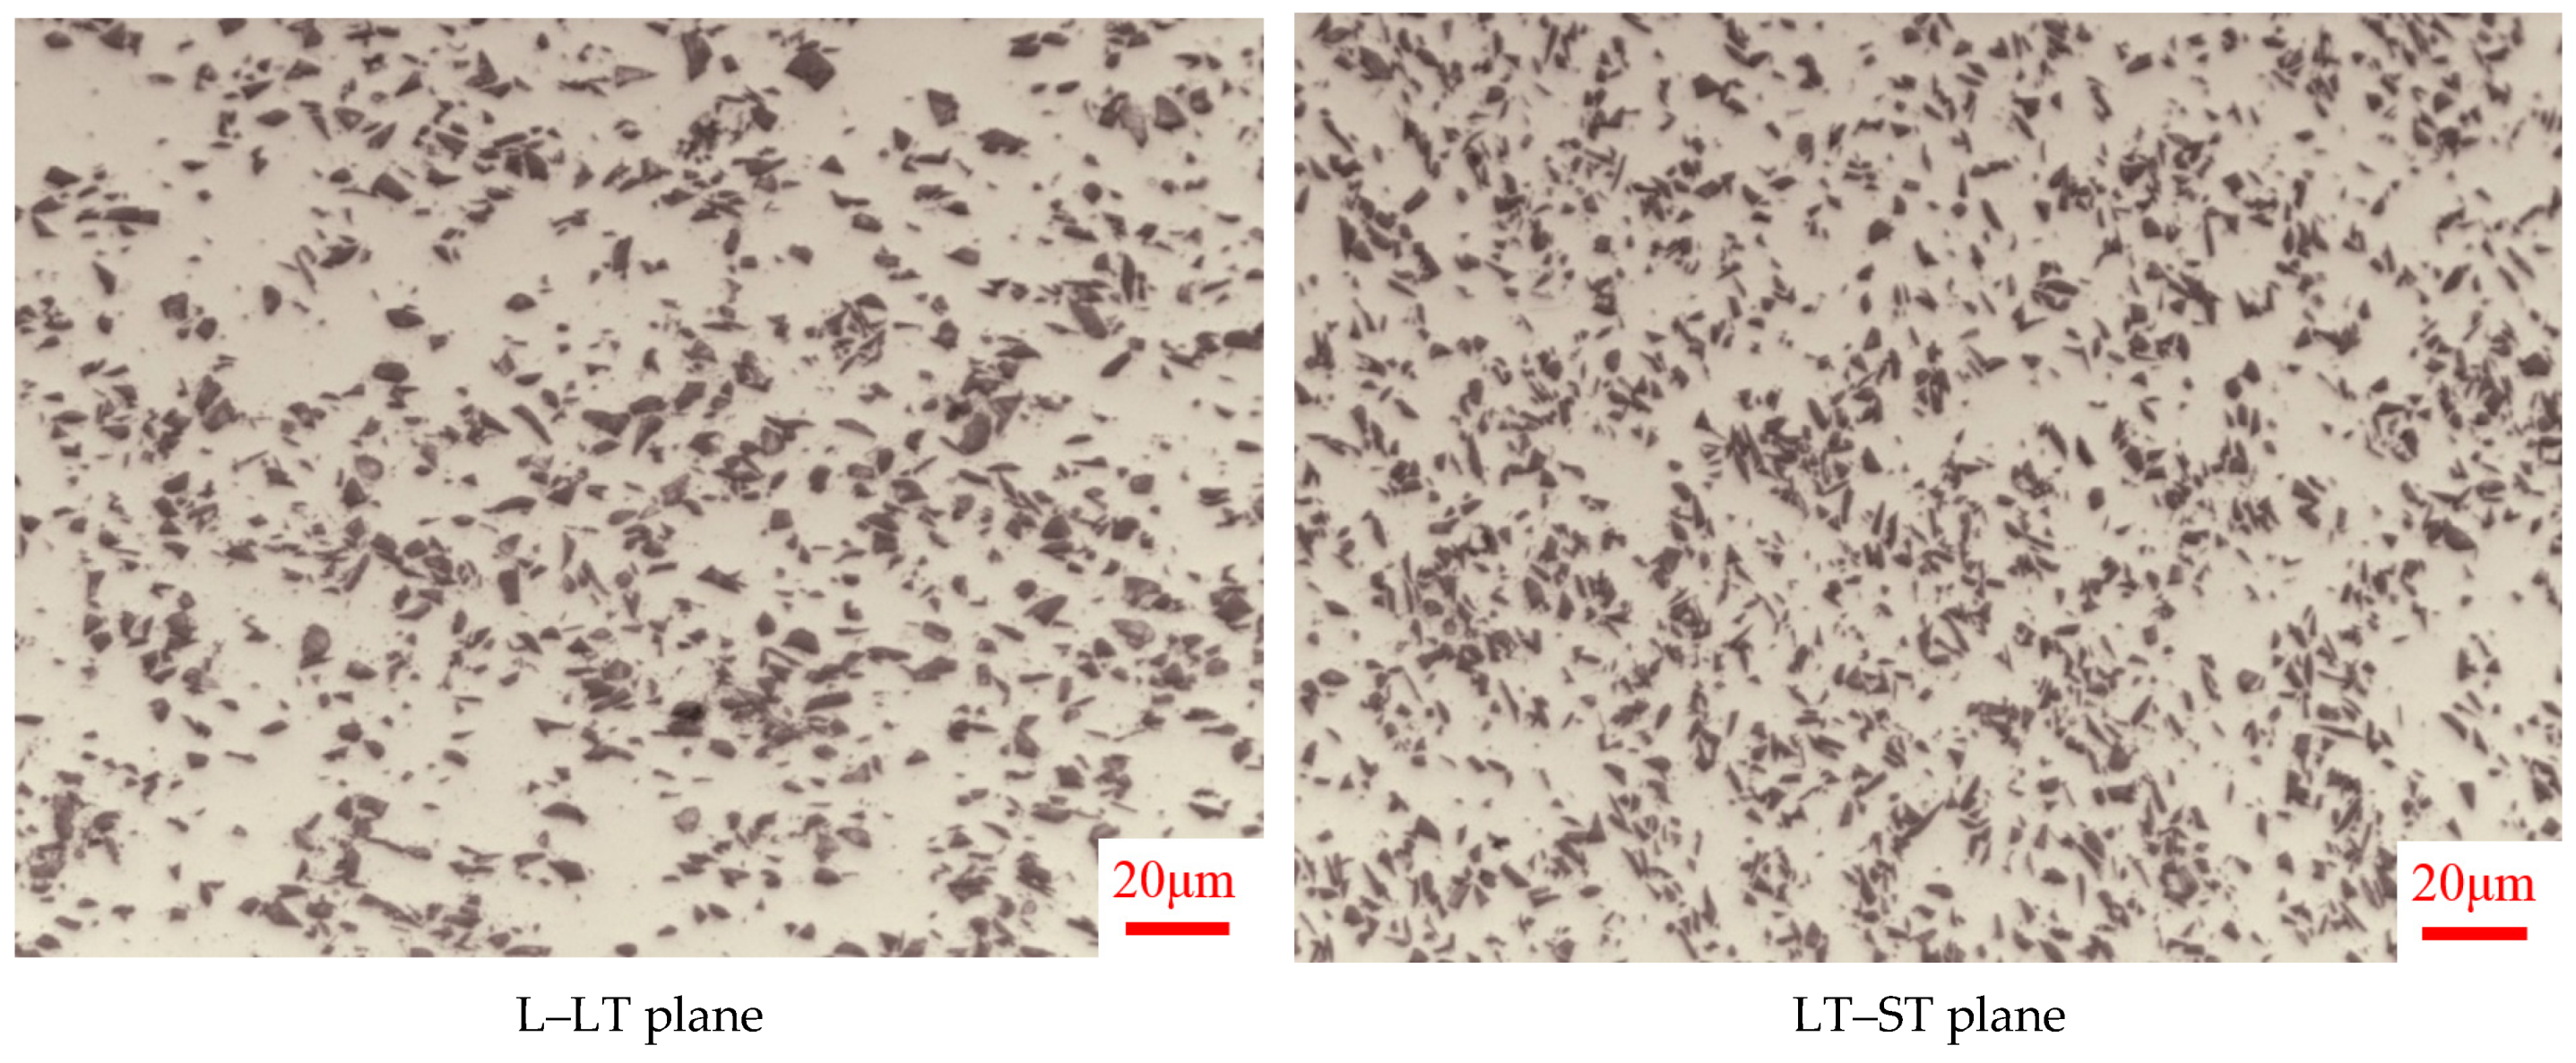
2.1. Experimental Material
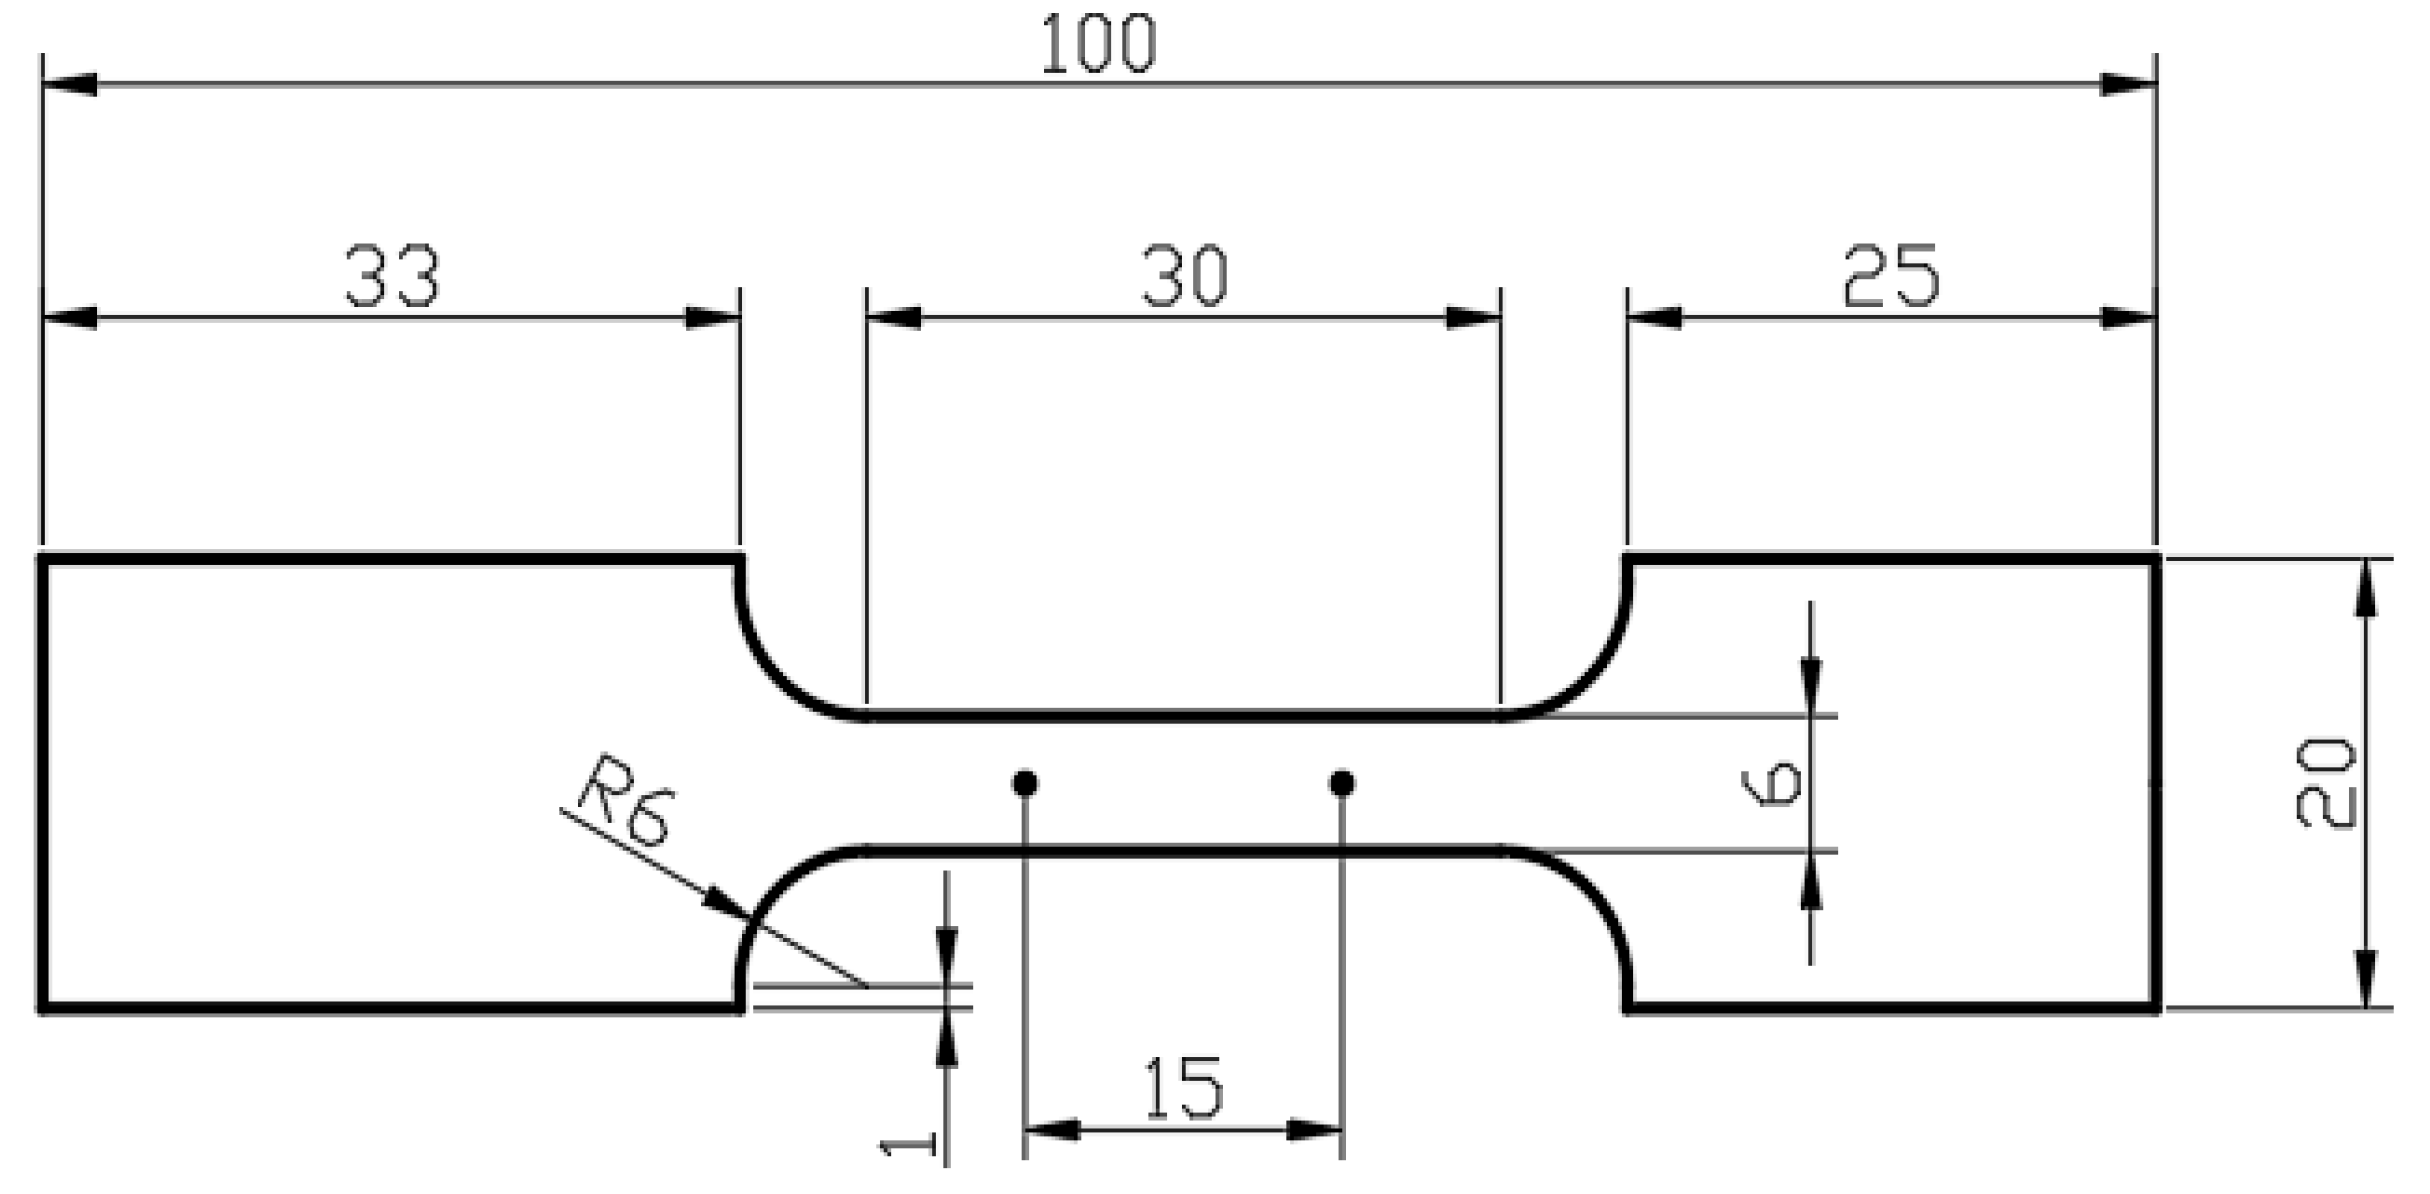
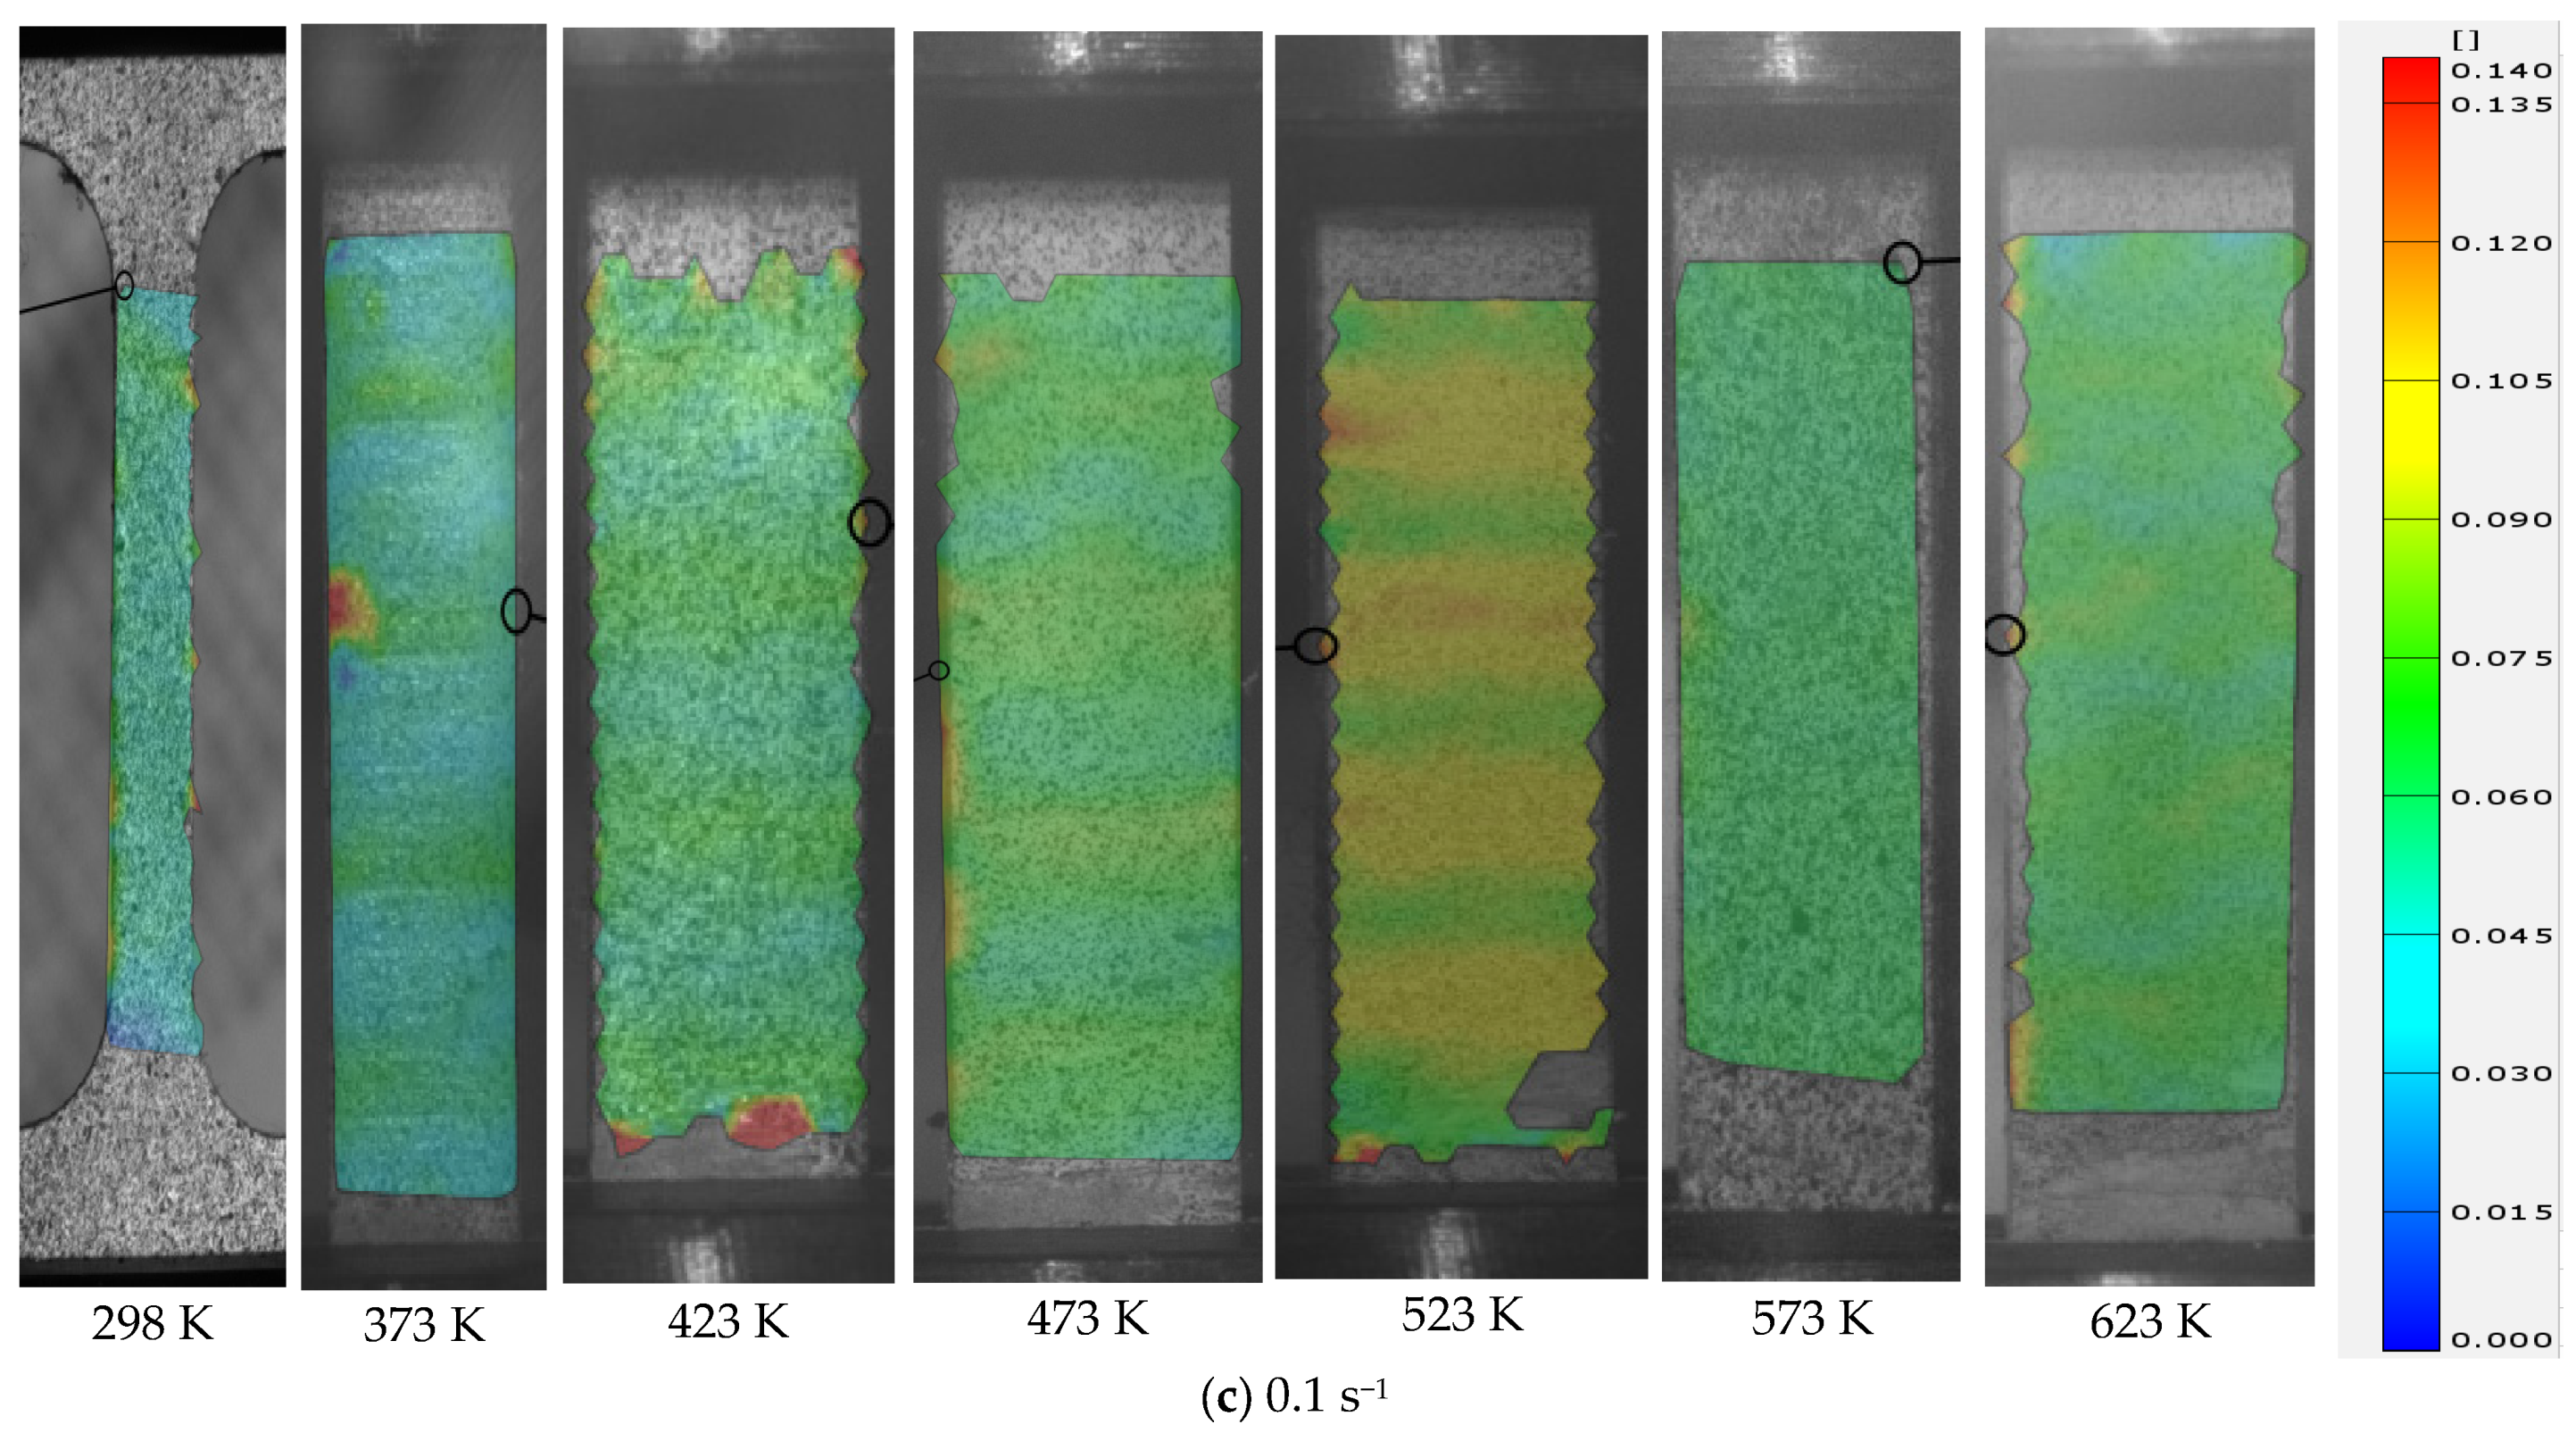
2.2. Mechanical Test
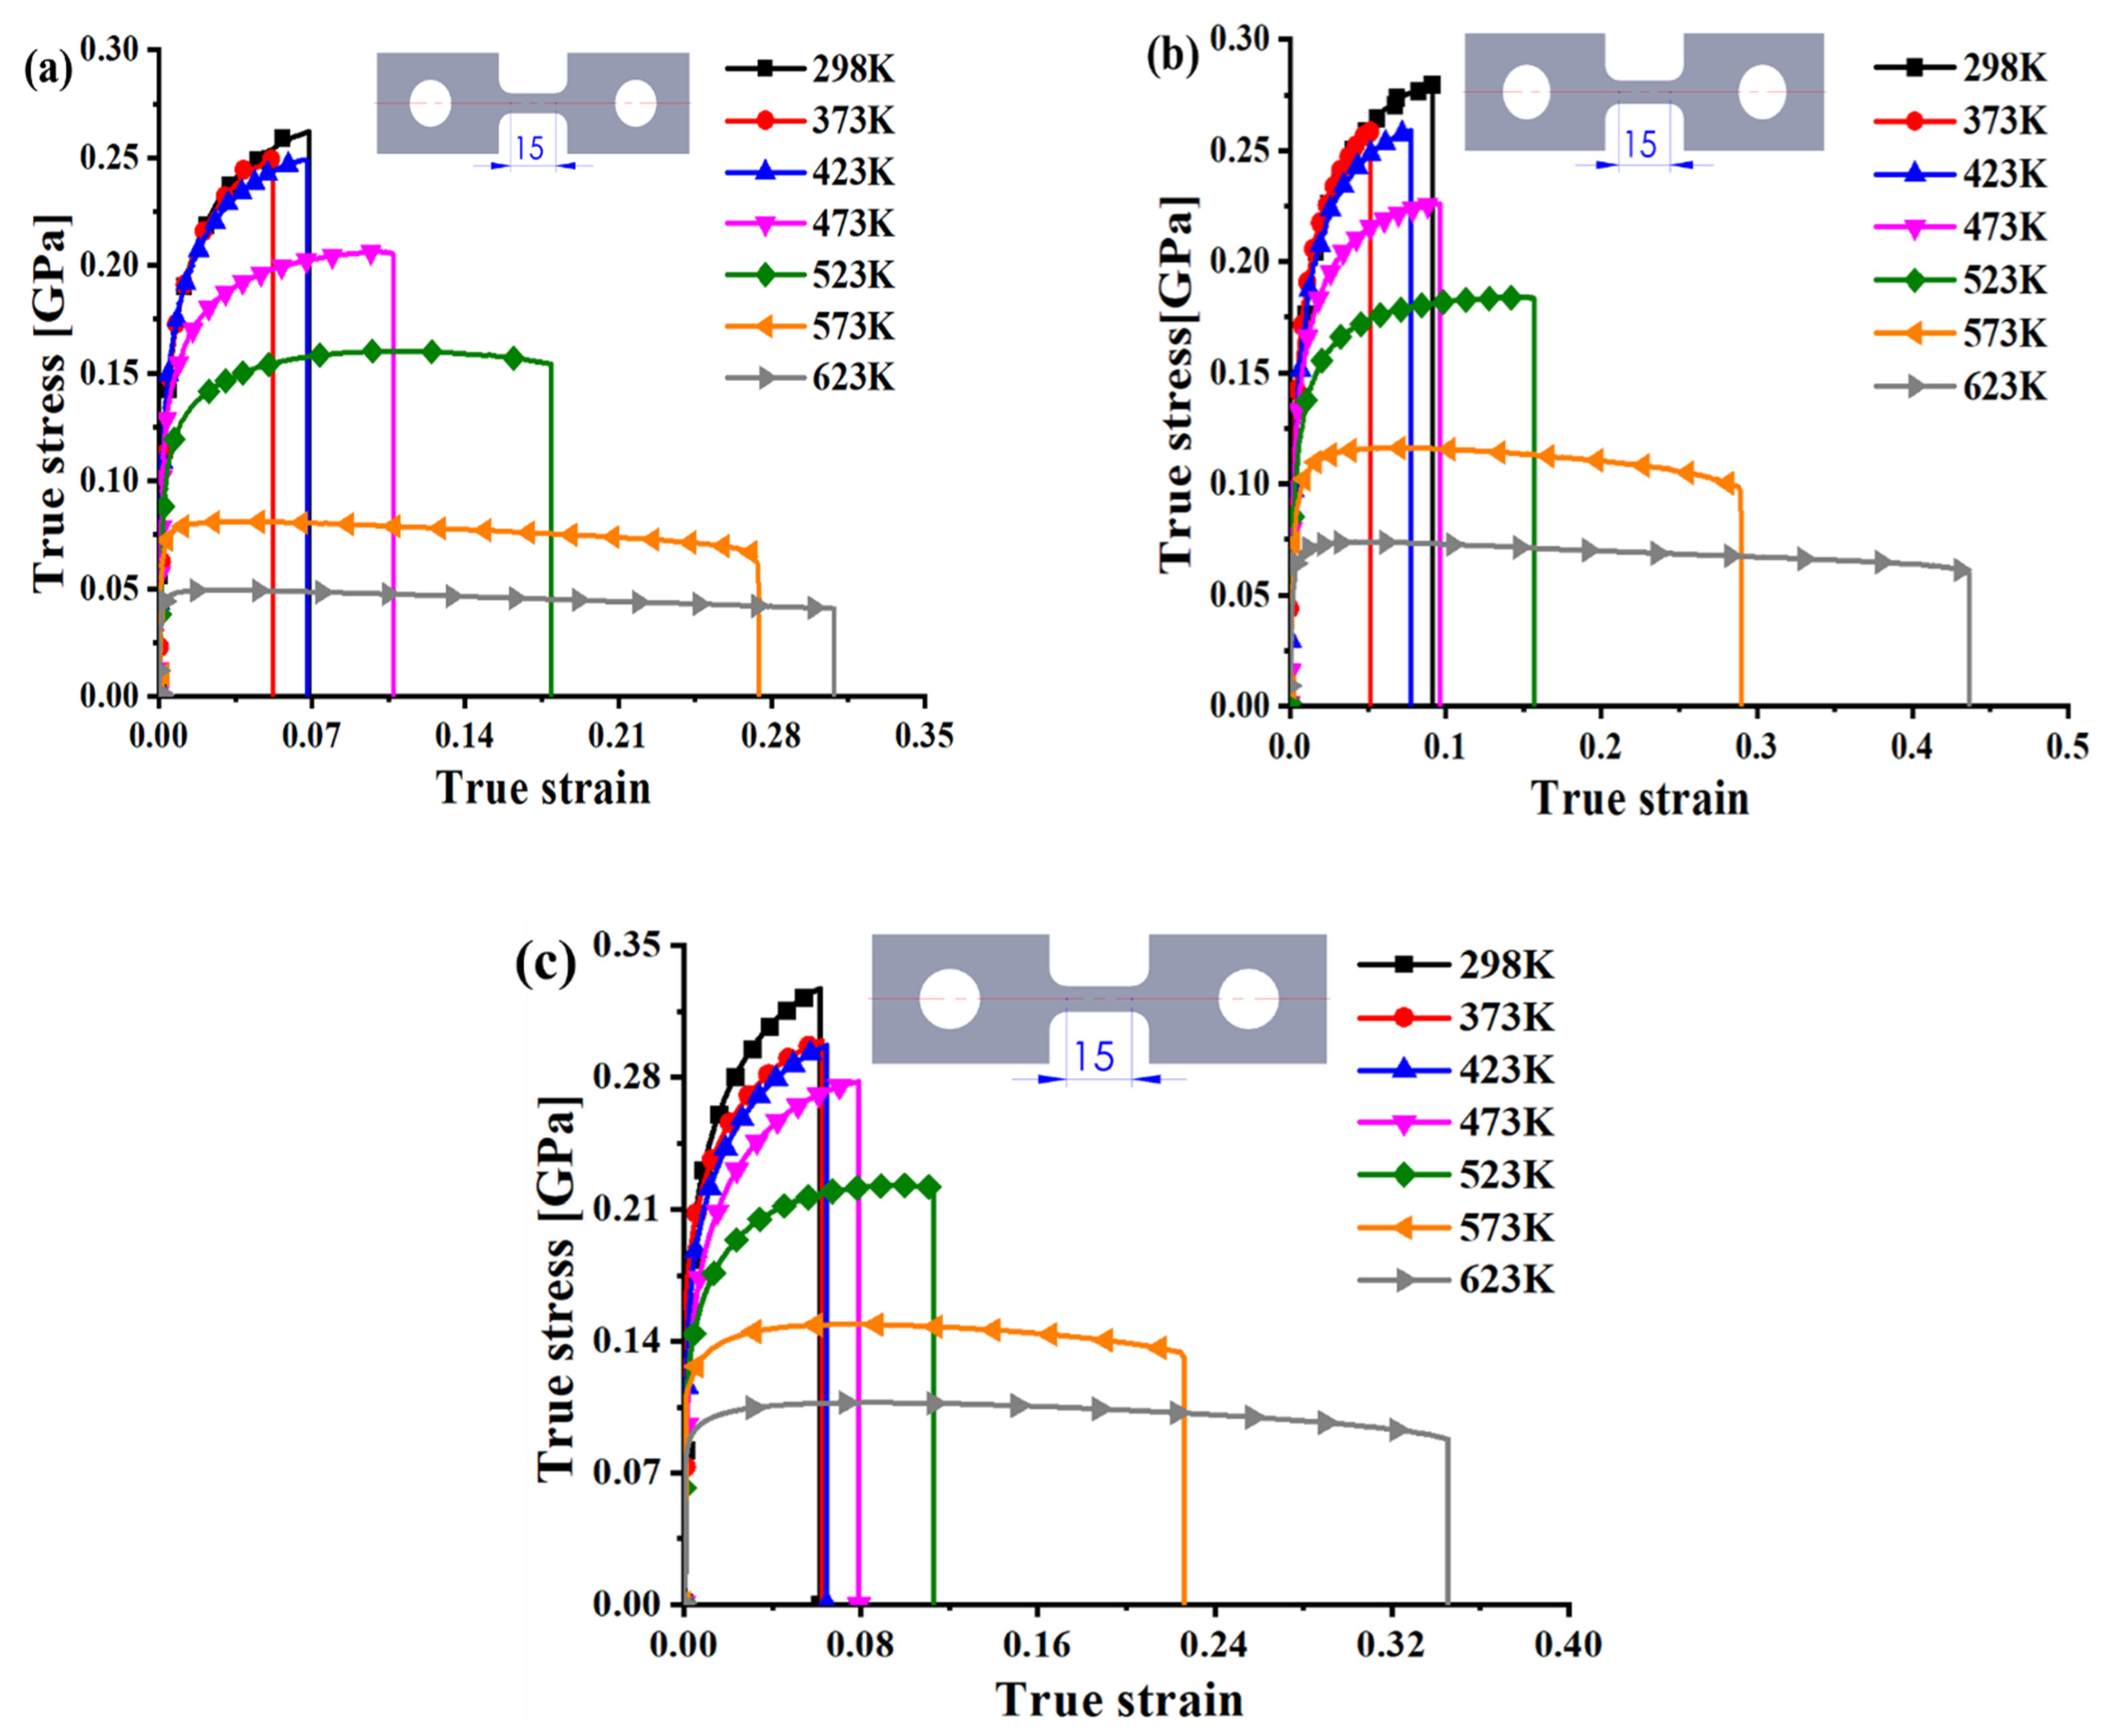
3. Result
4. Constitutive Modeling
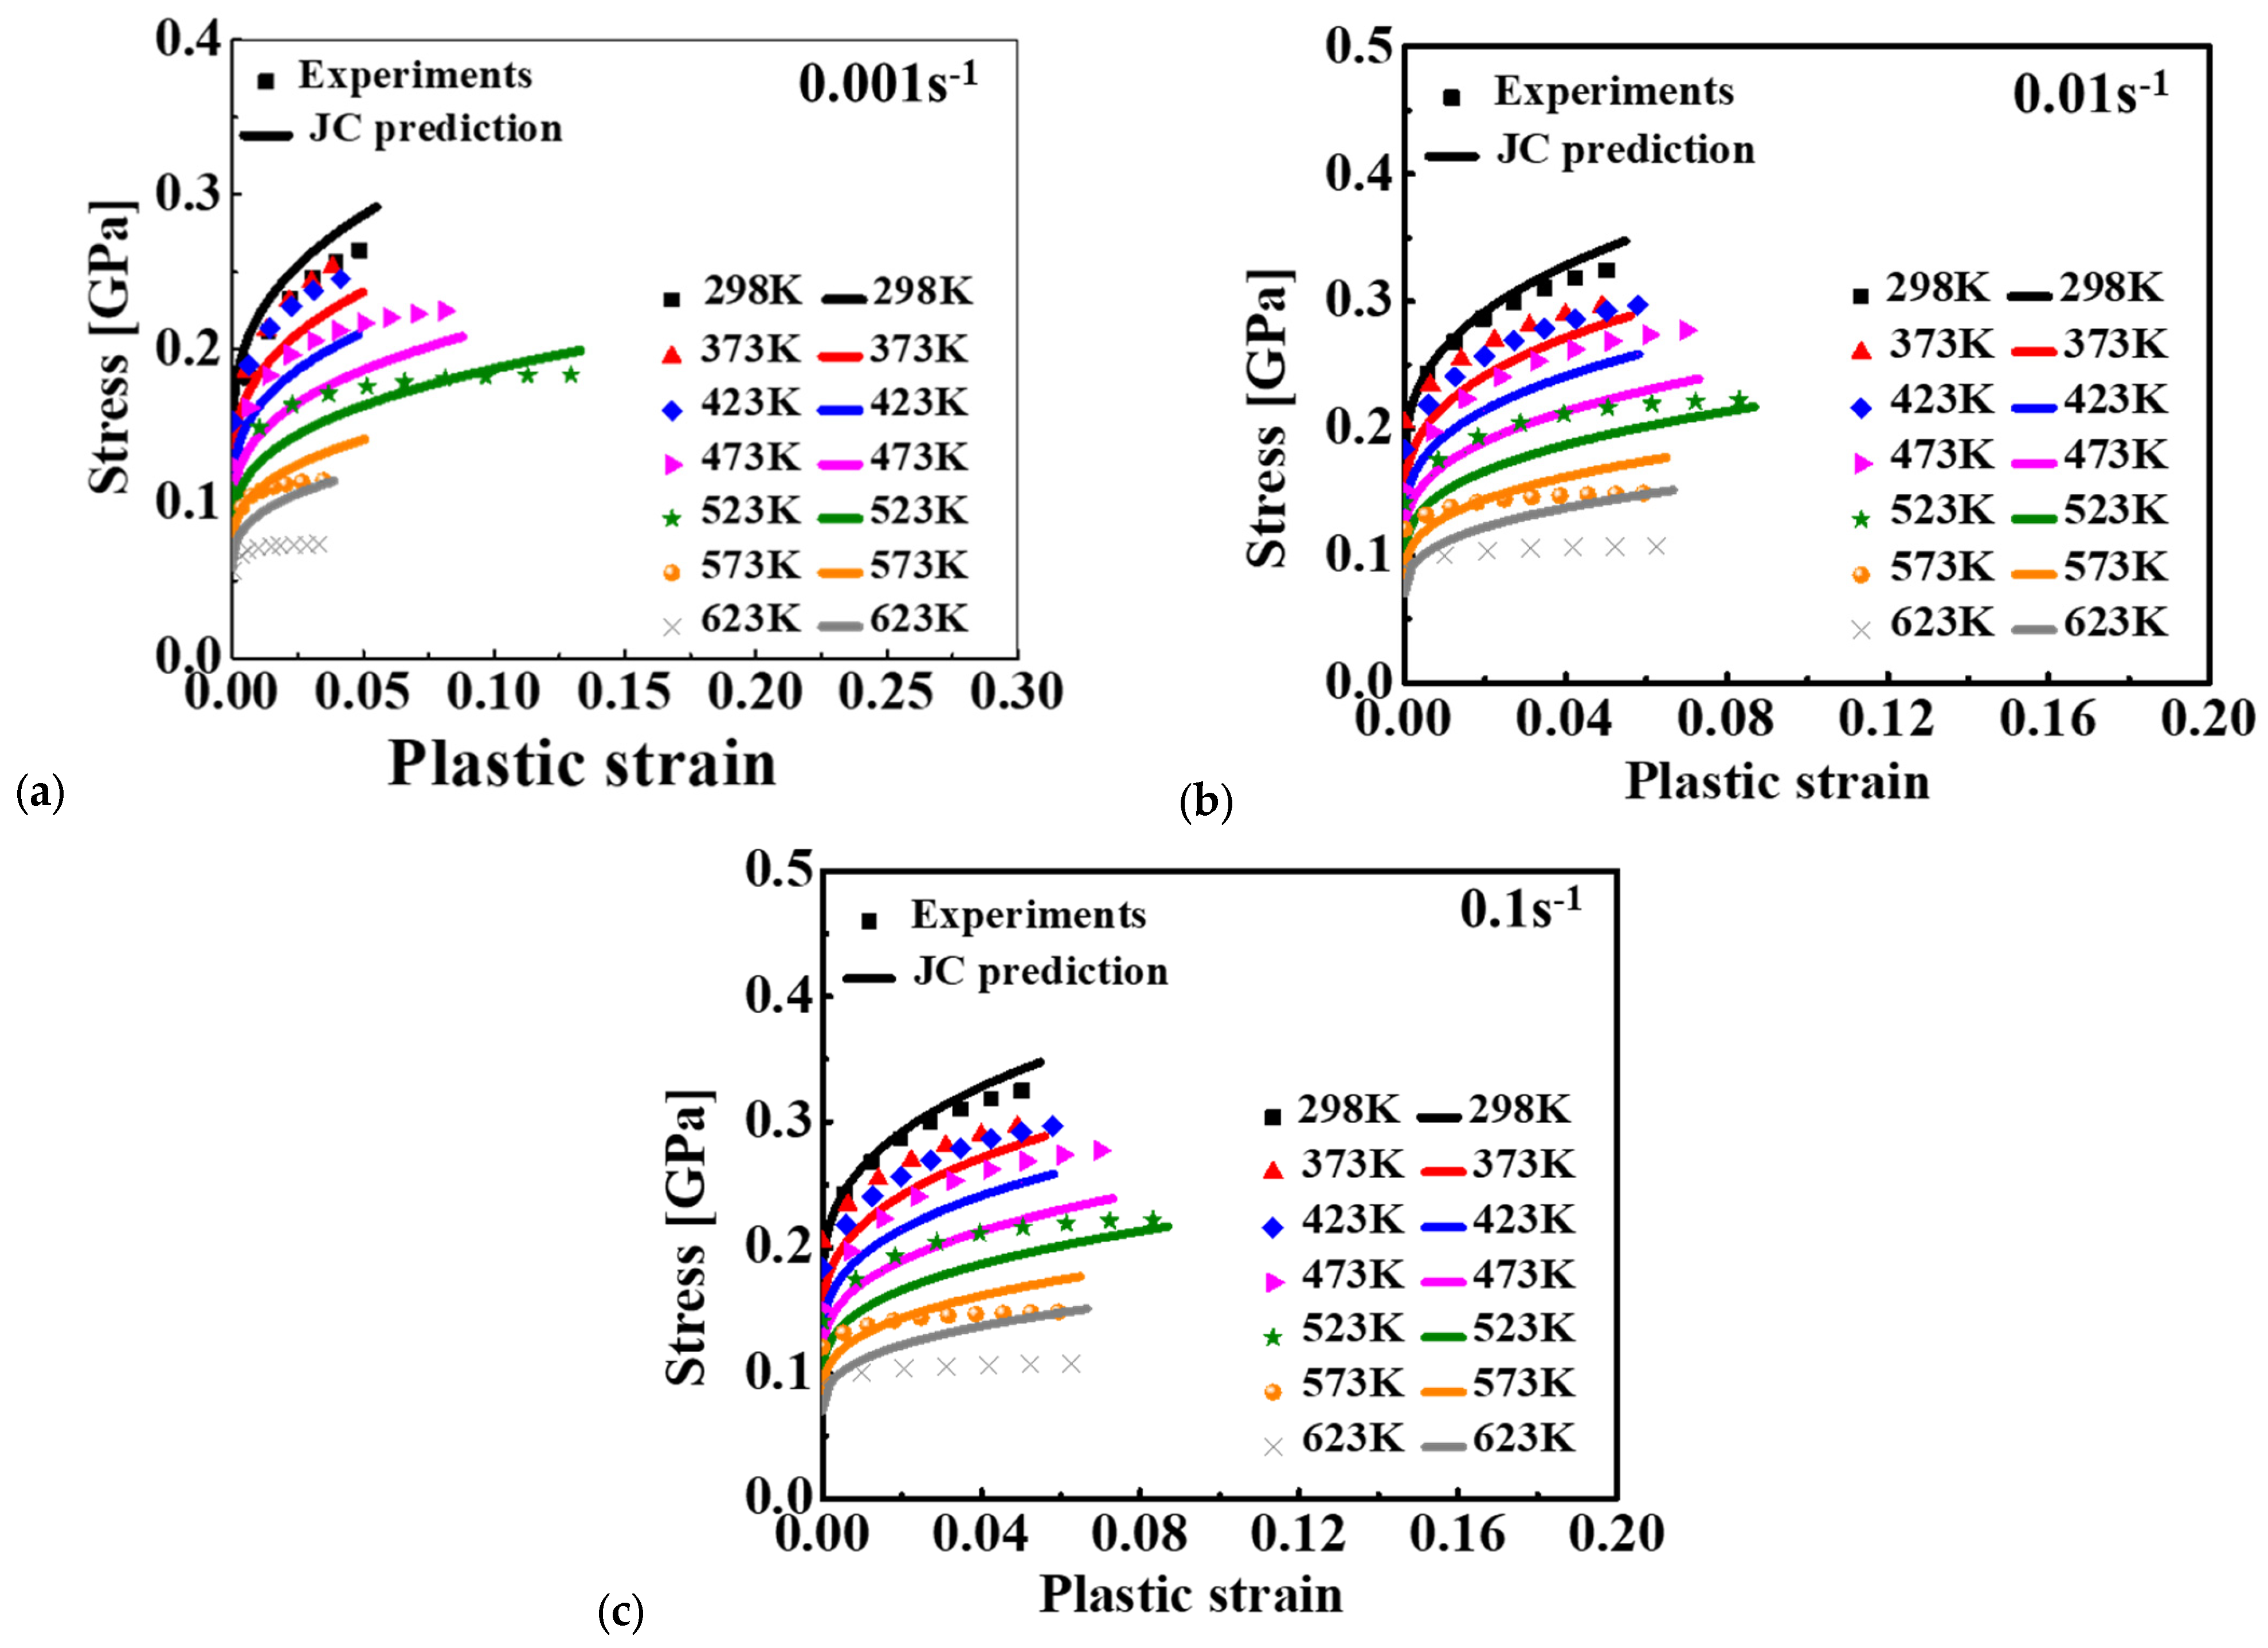
4.1. JC Model
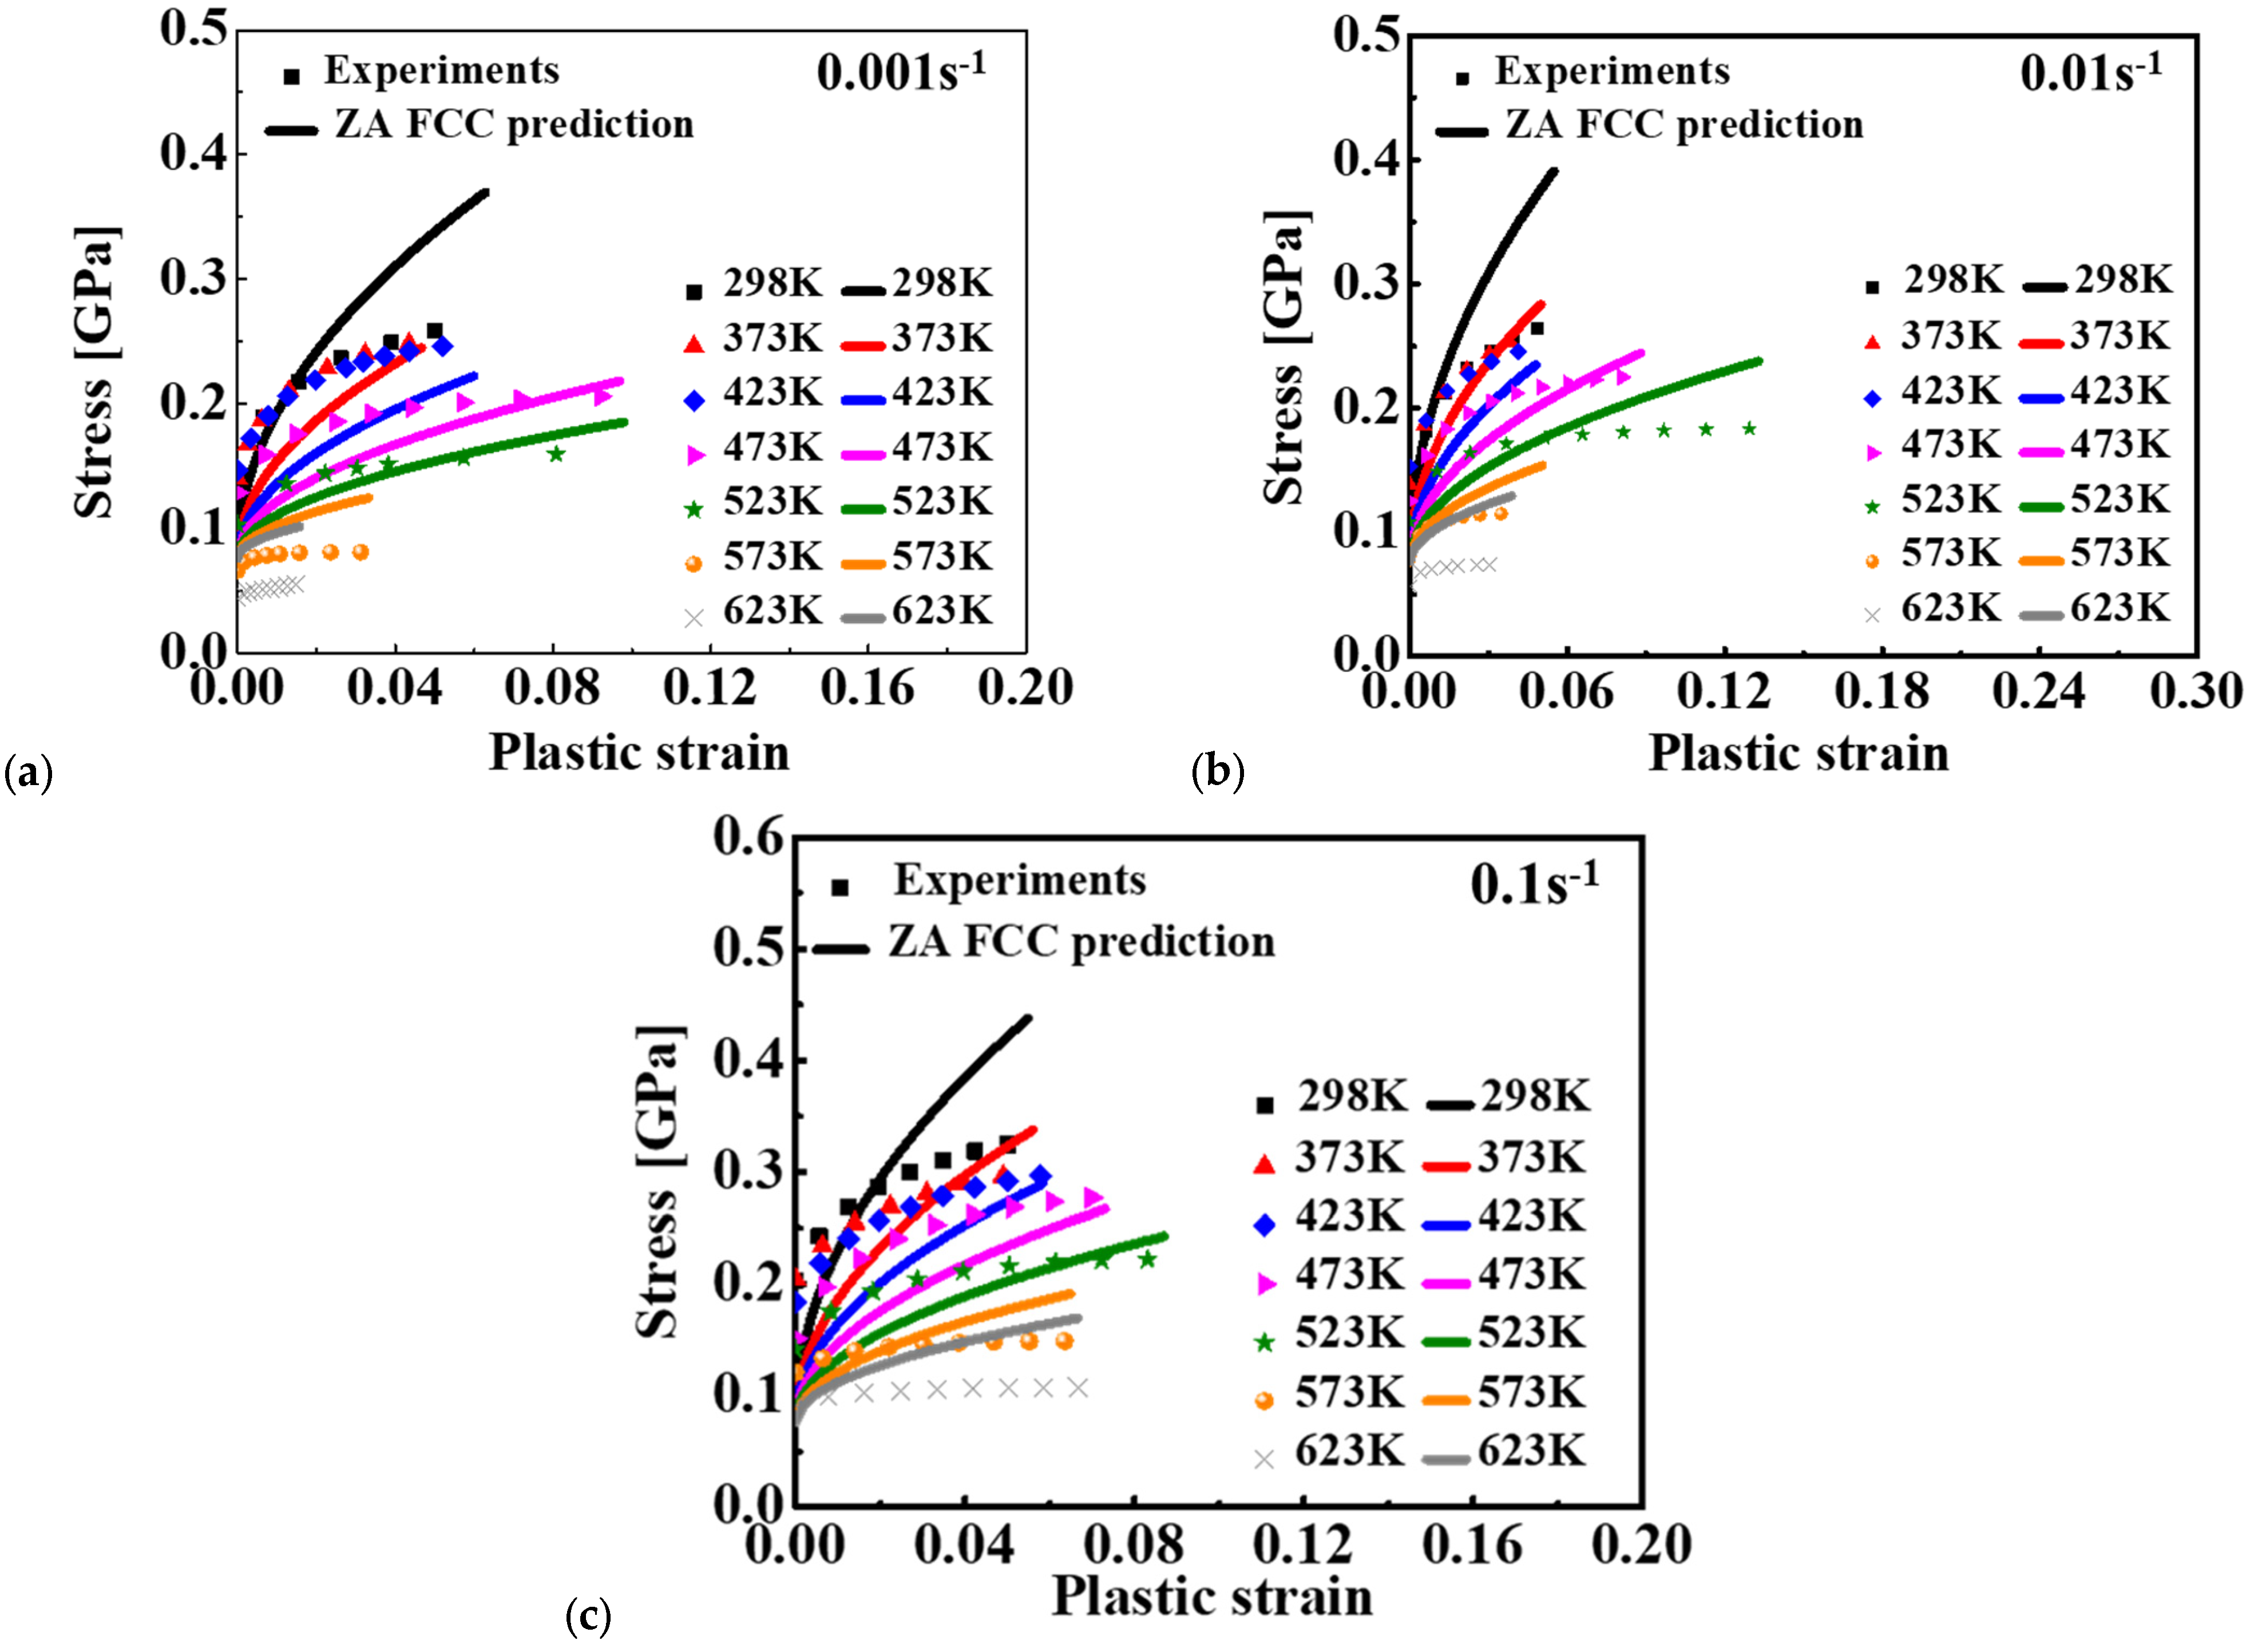
4.2. ZA Model
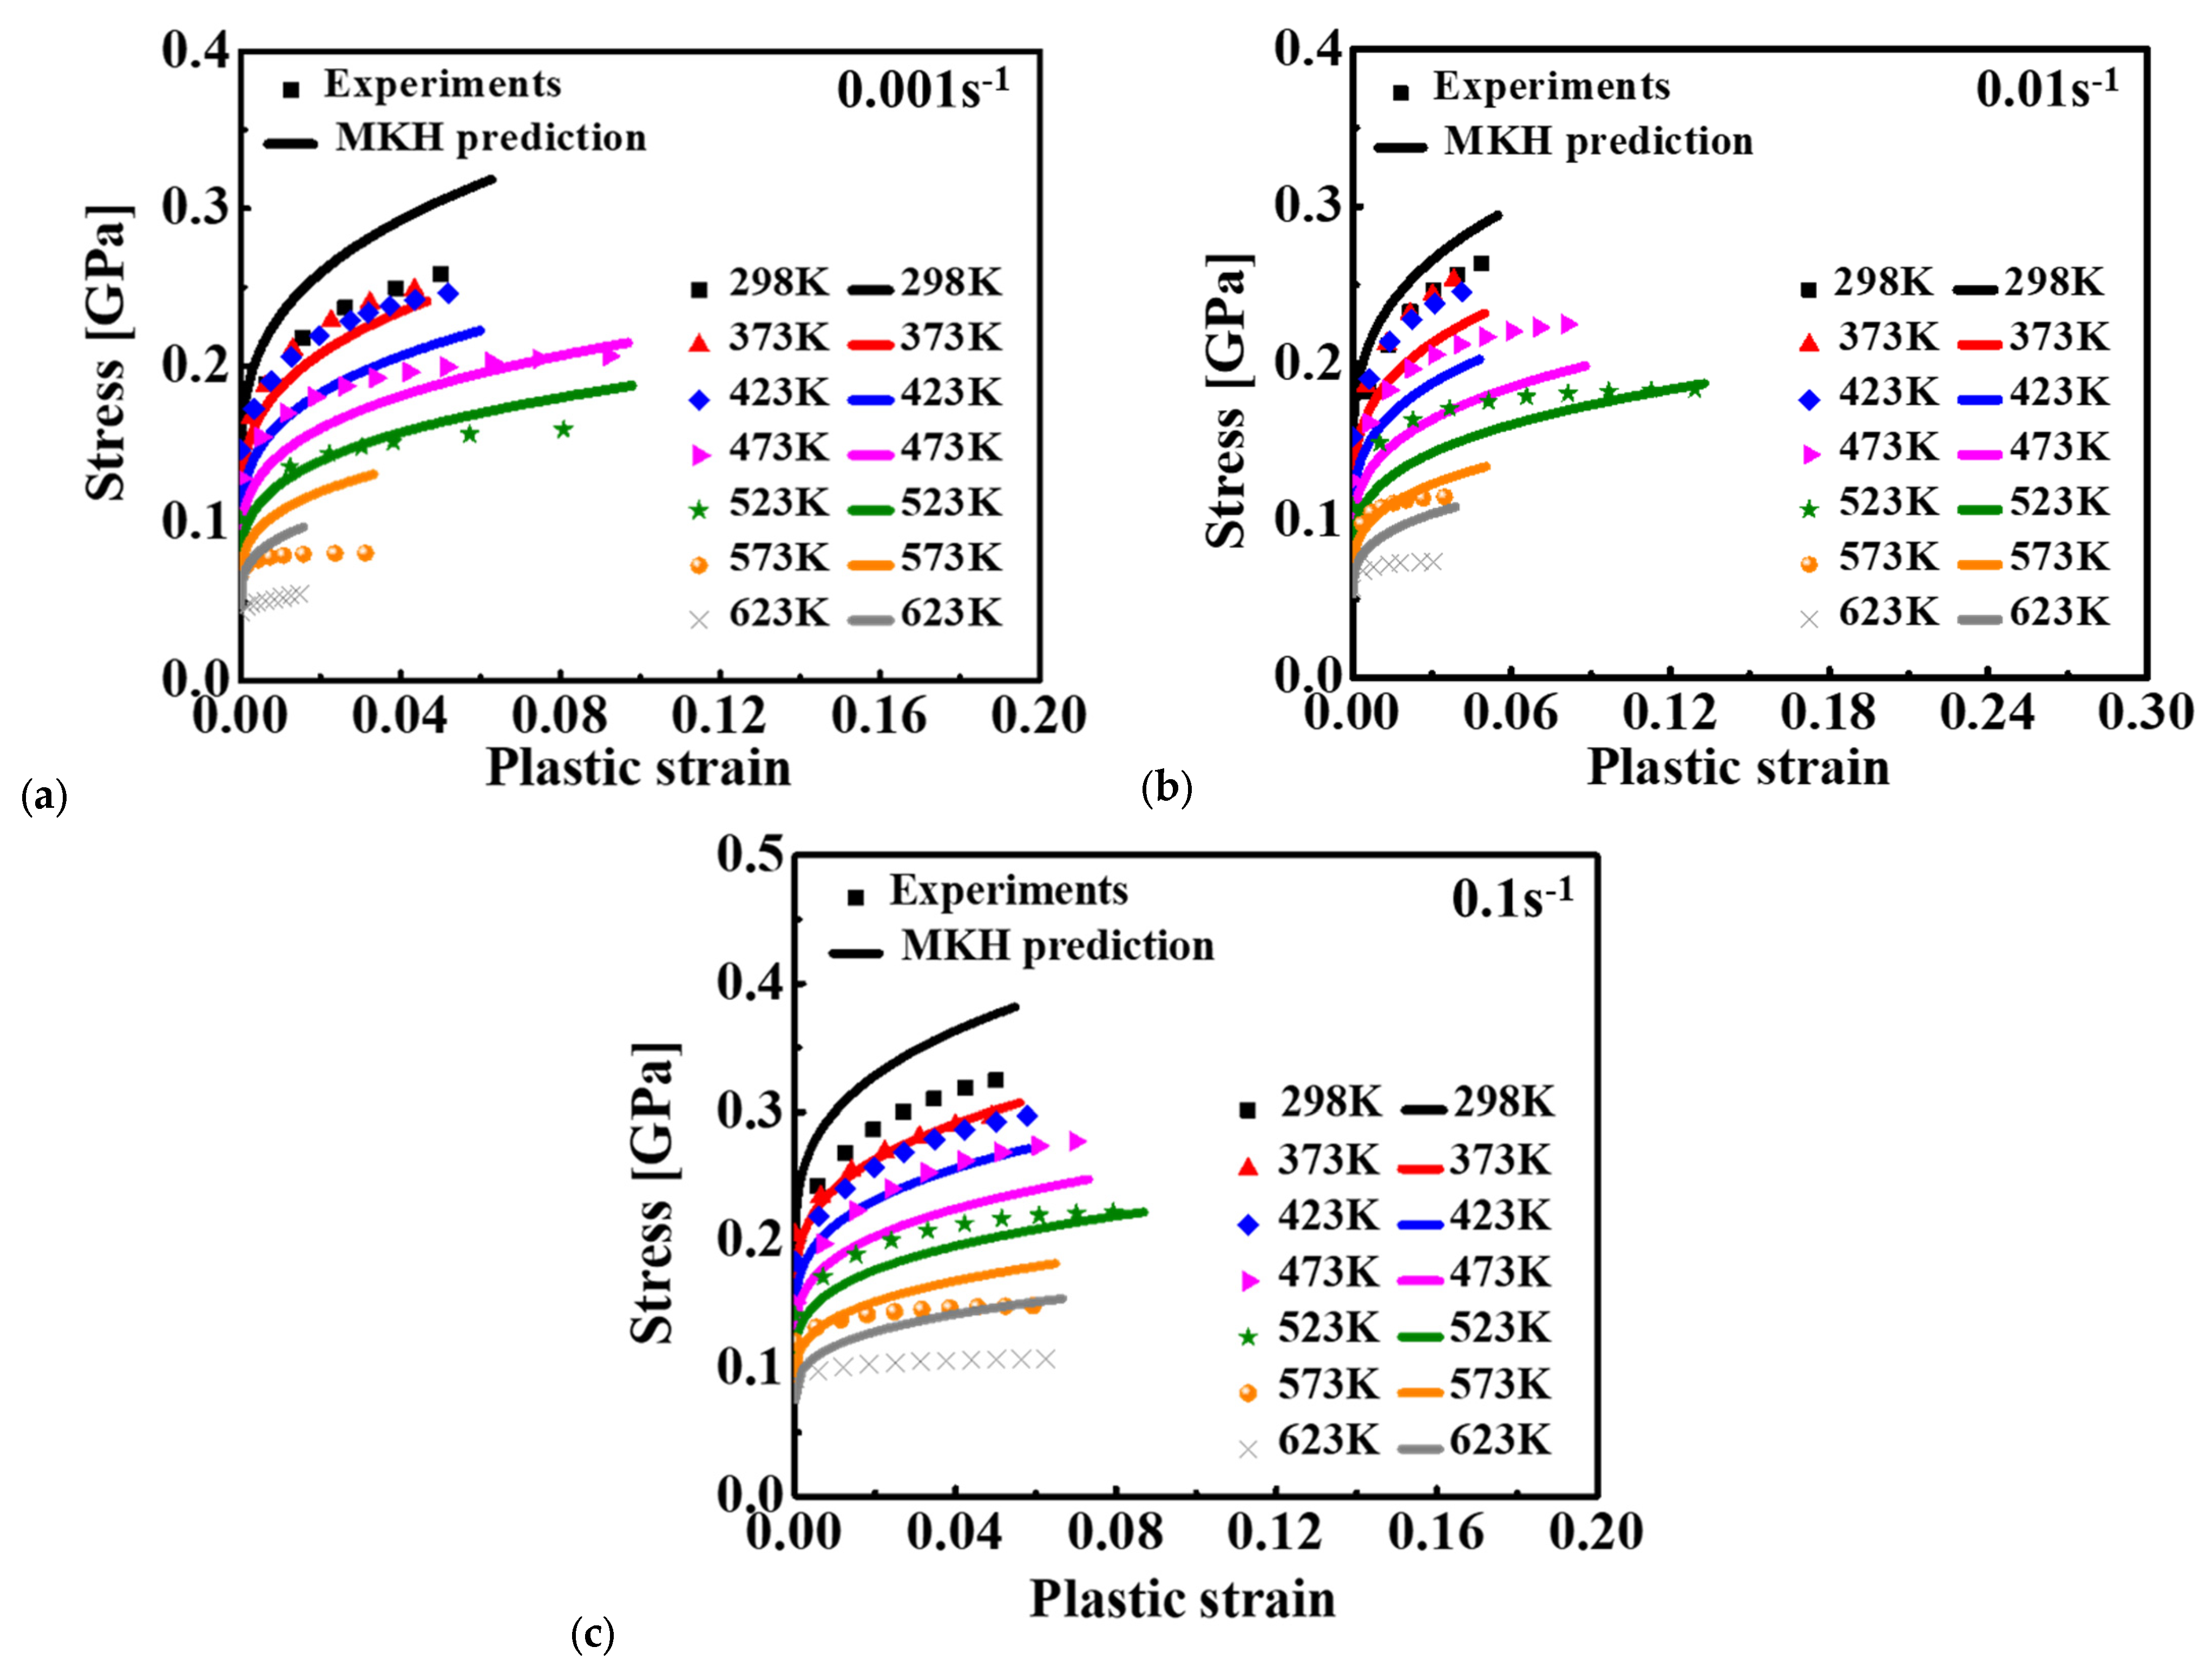
4.3. MKH Model
4.4. MLH Model
5. ANN Model
6. Evaluation of Four Conventional Models and the BP Network
7. Conclusions
- (1)
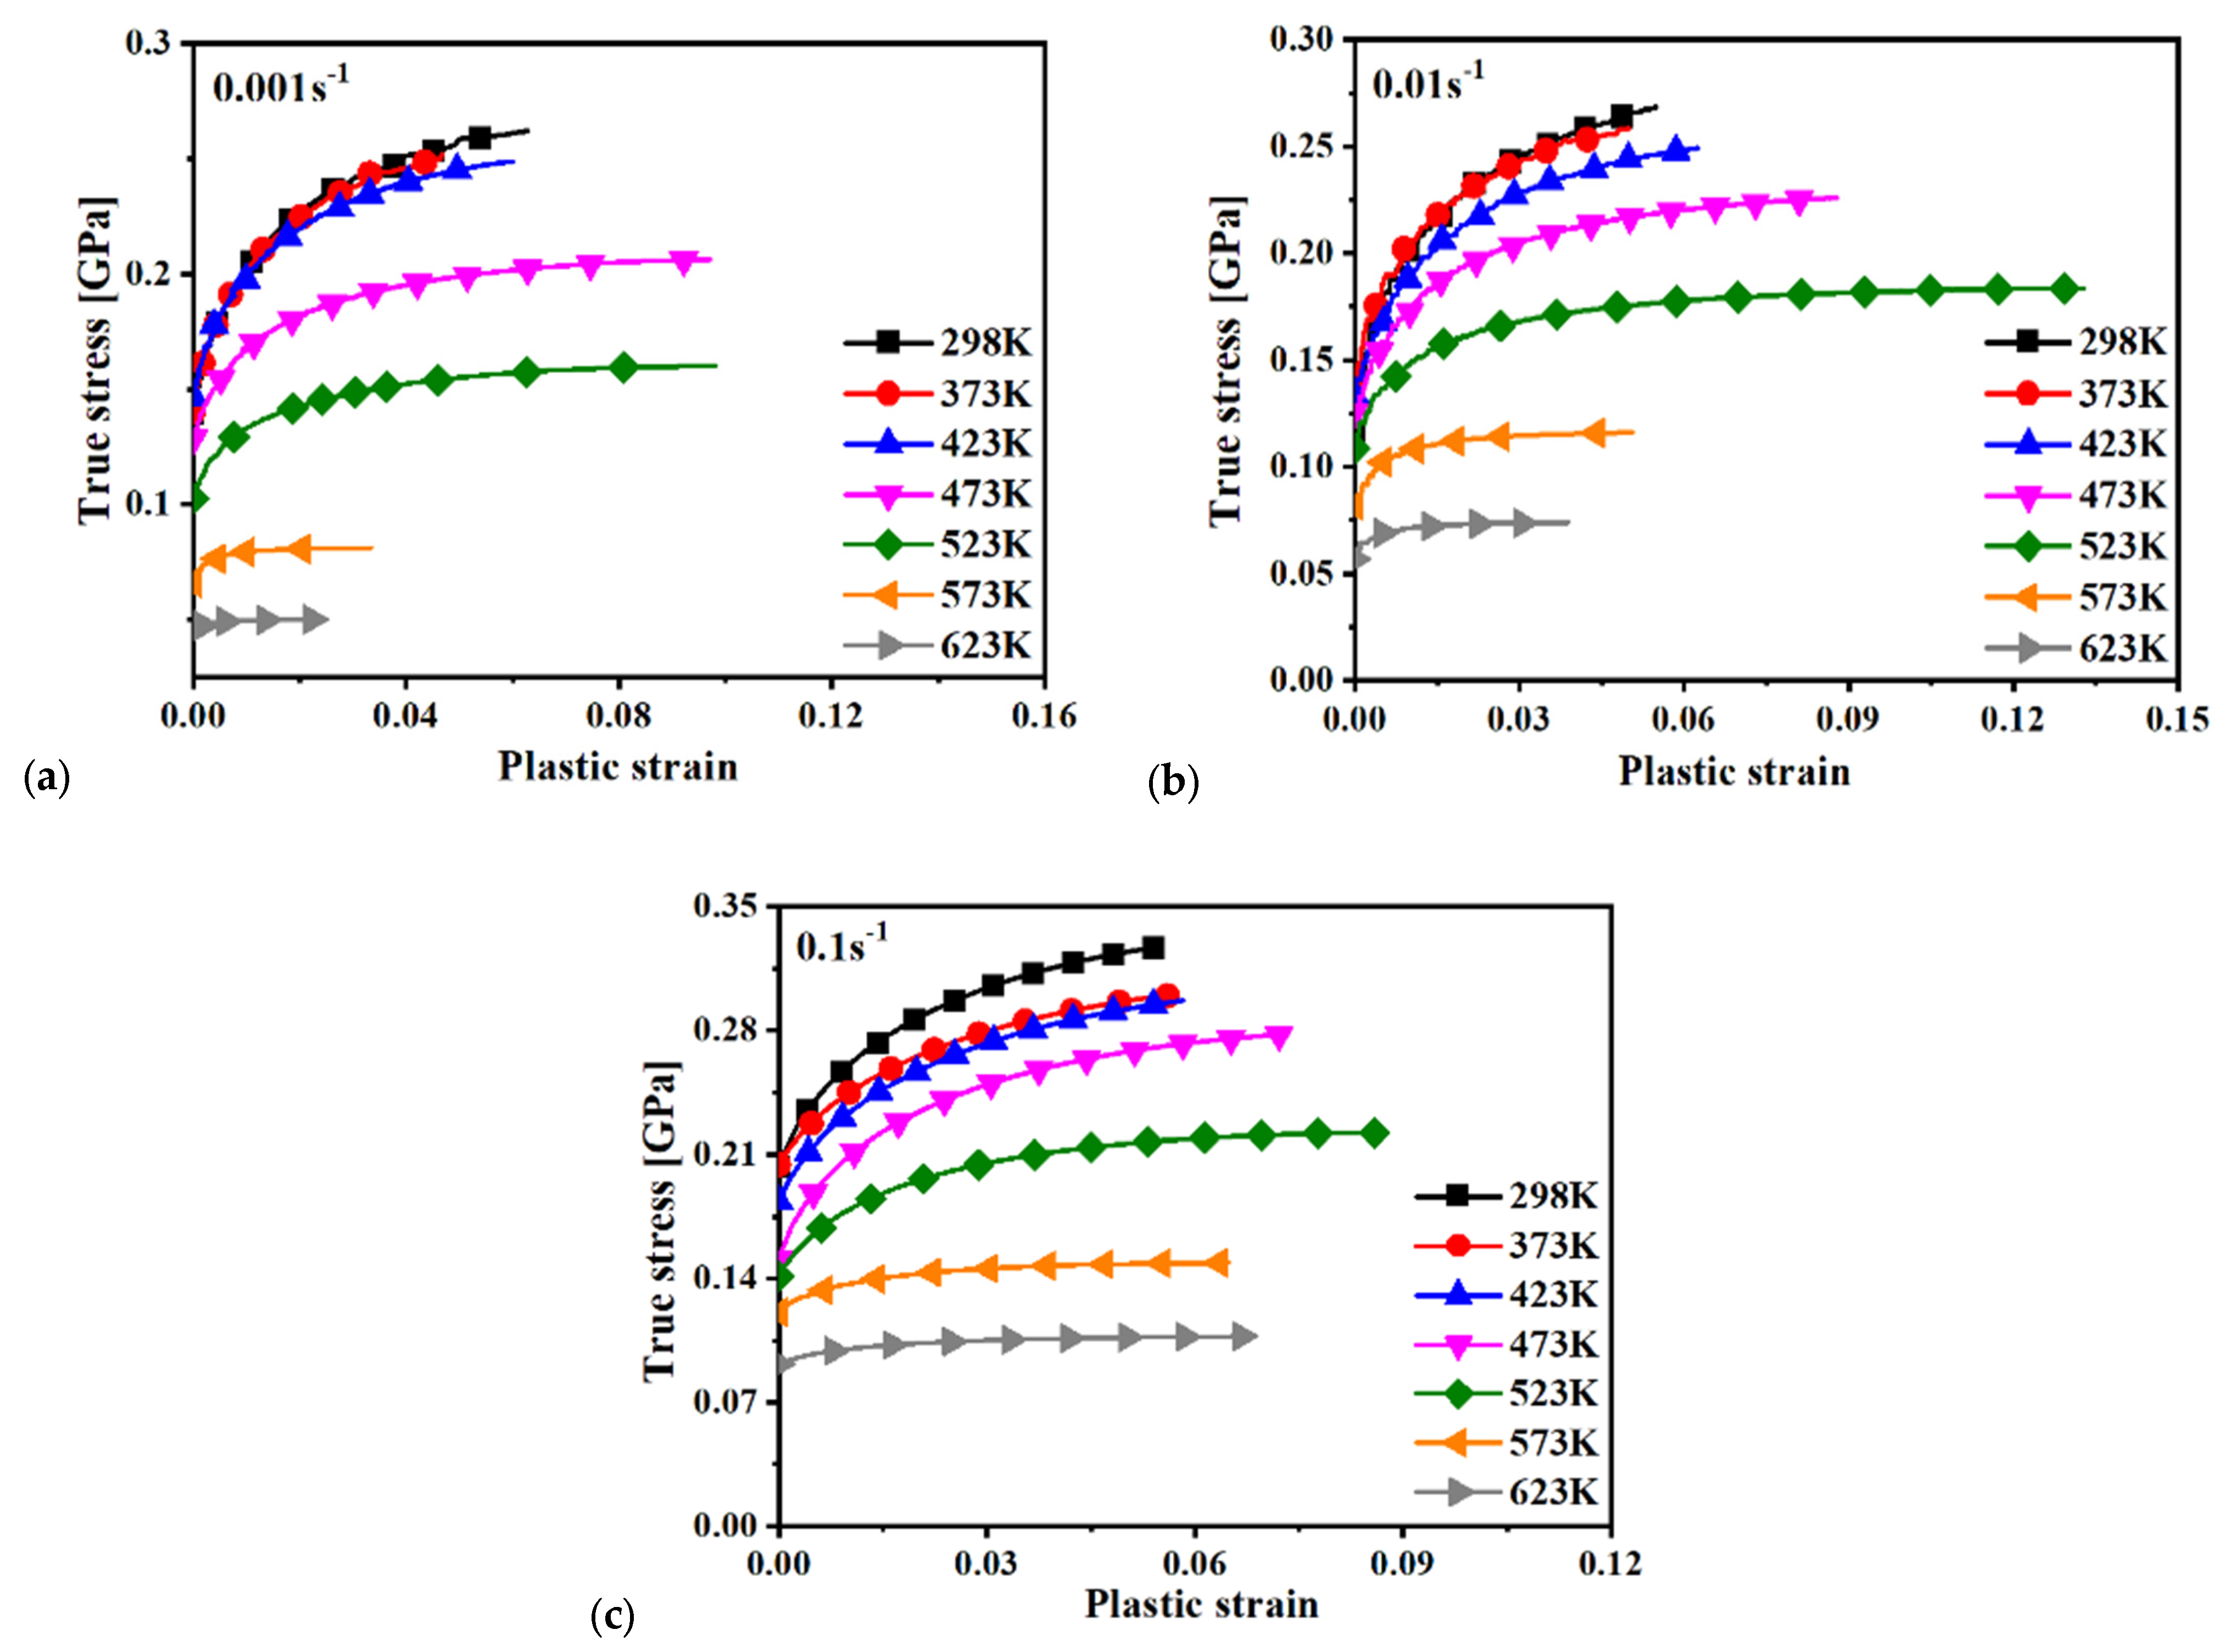
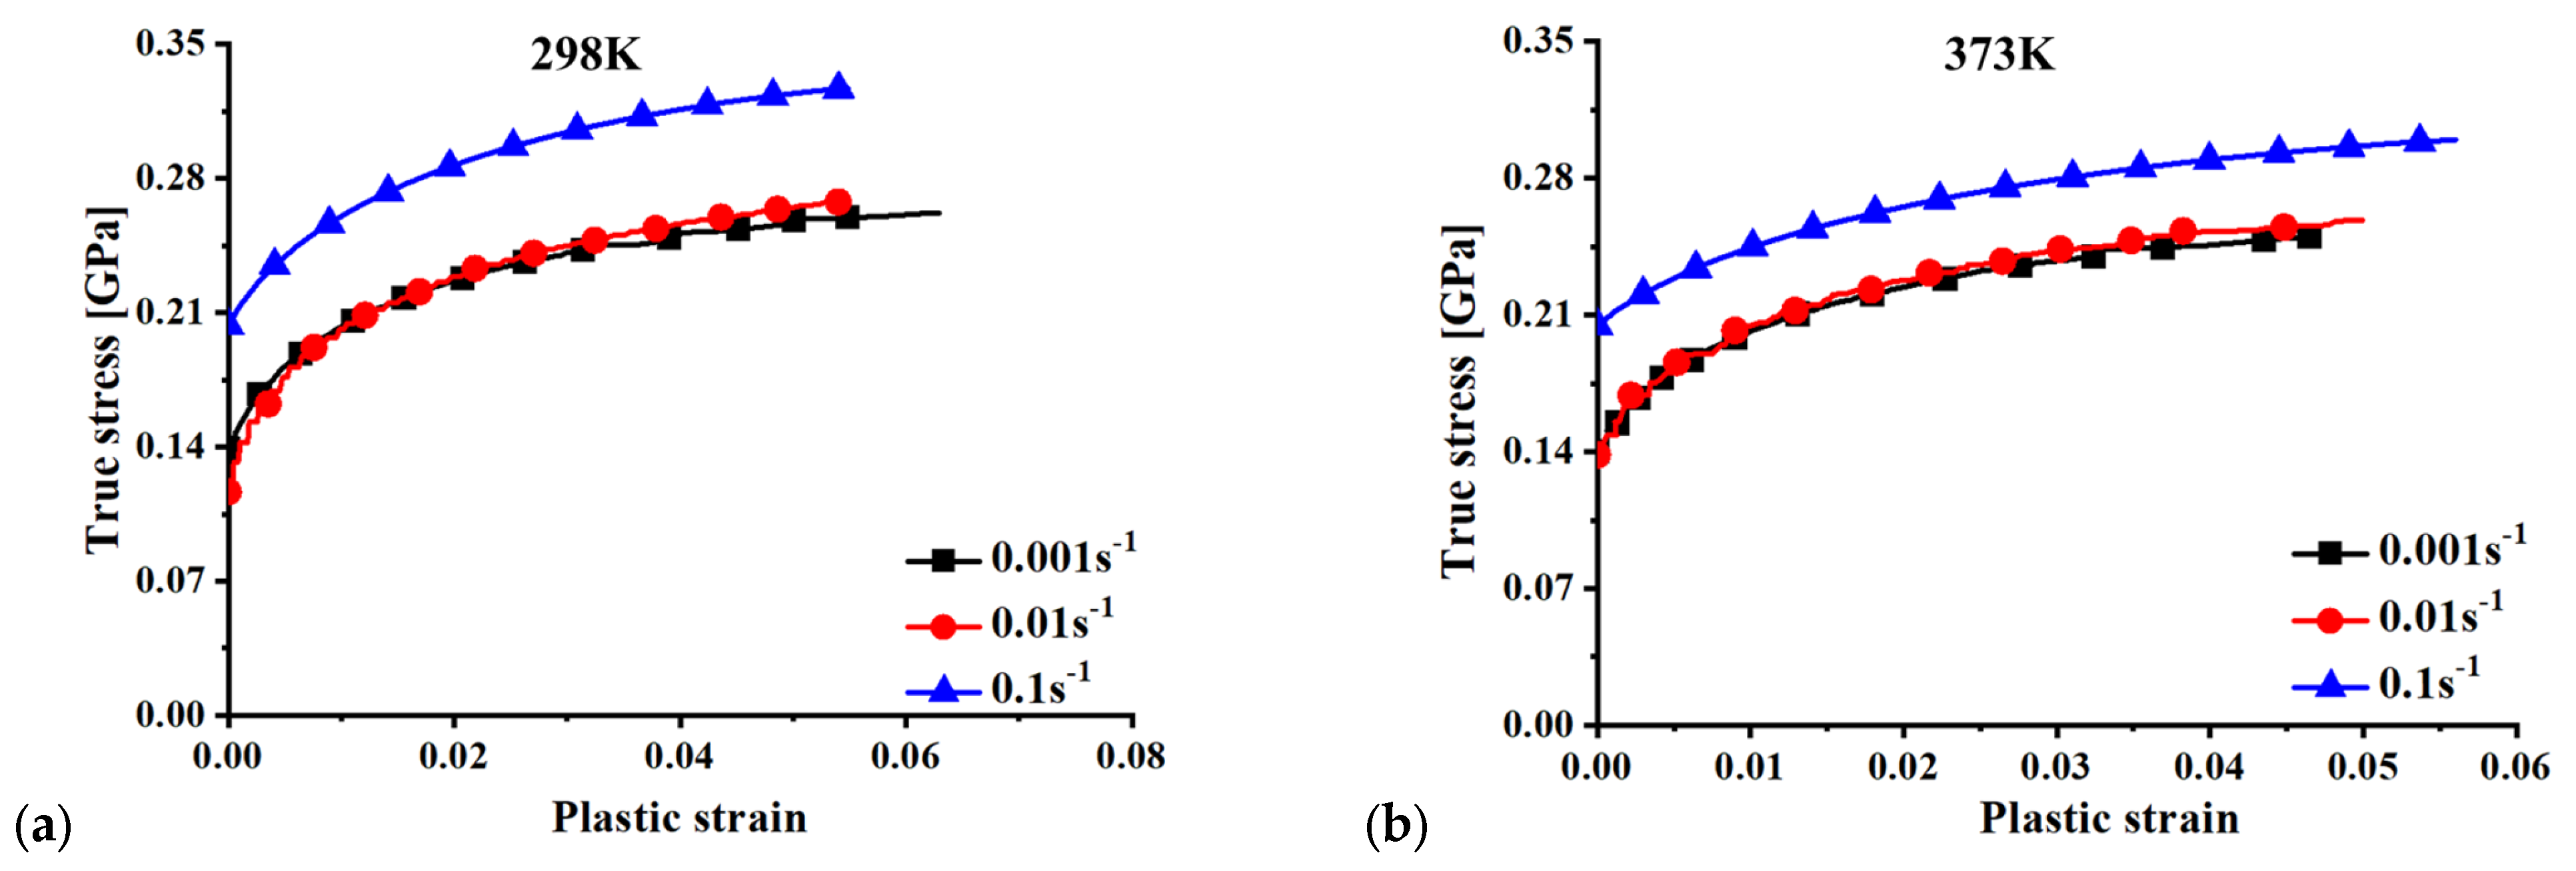
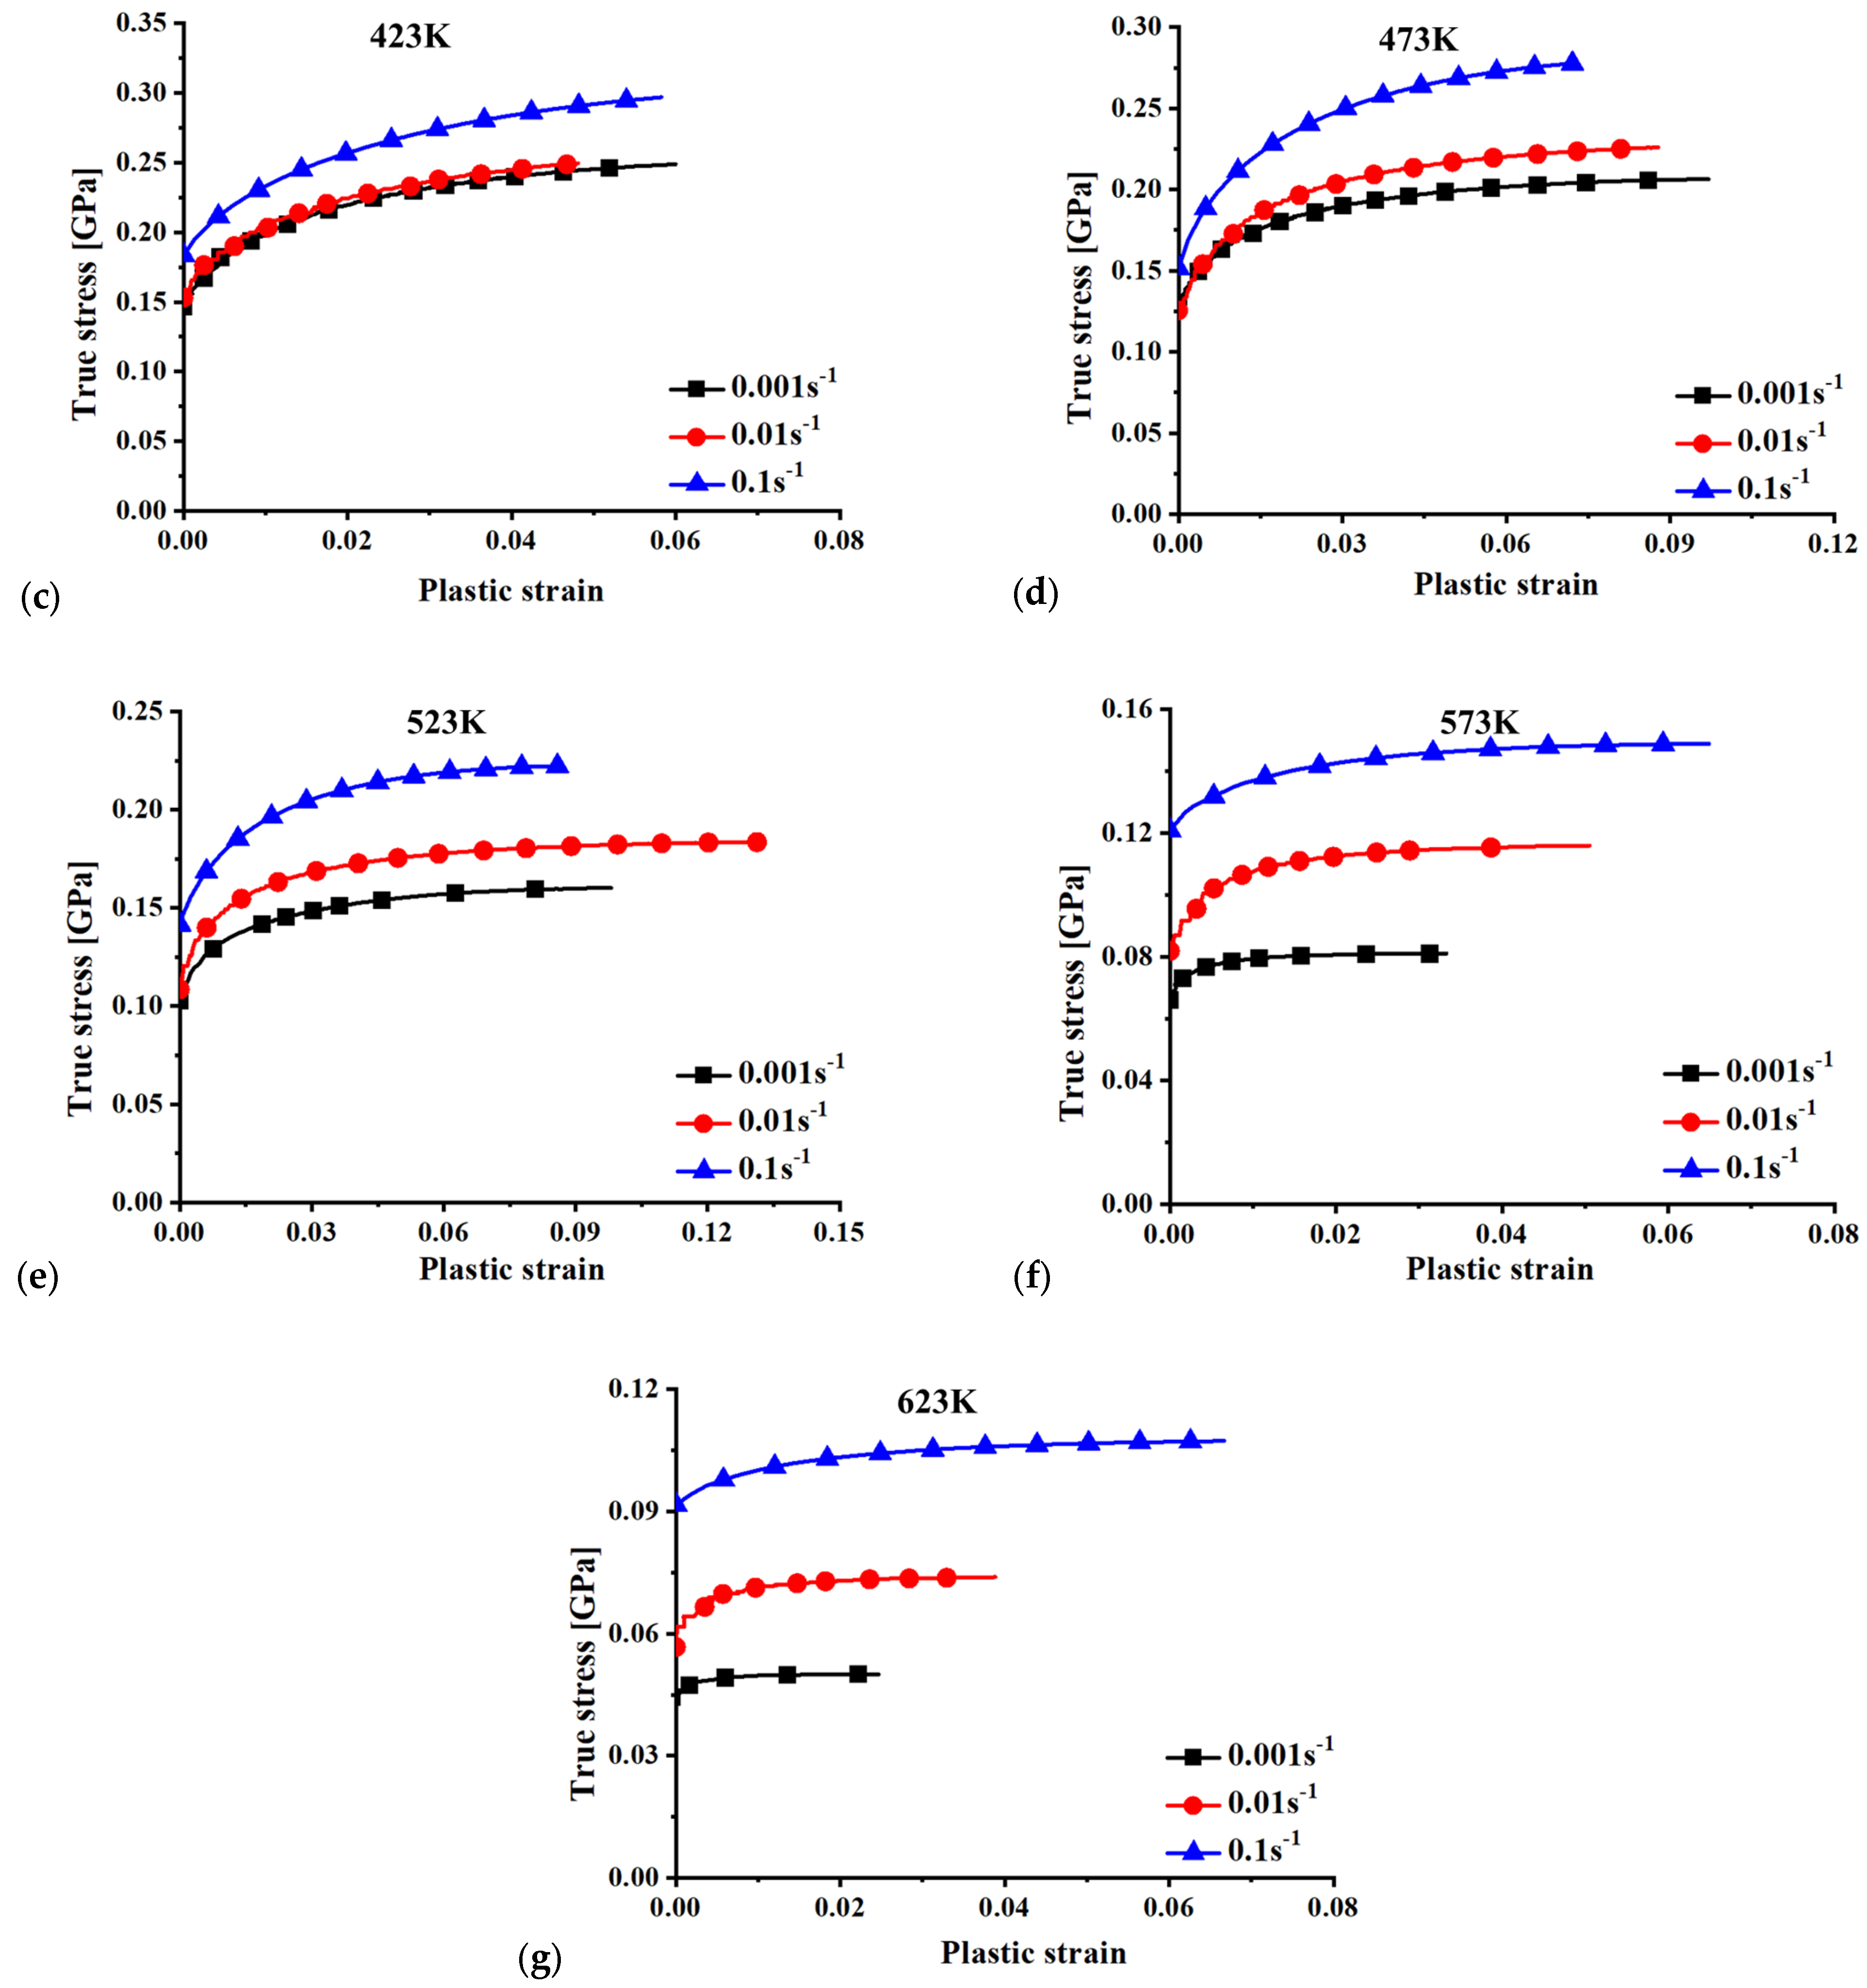
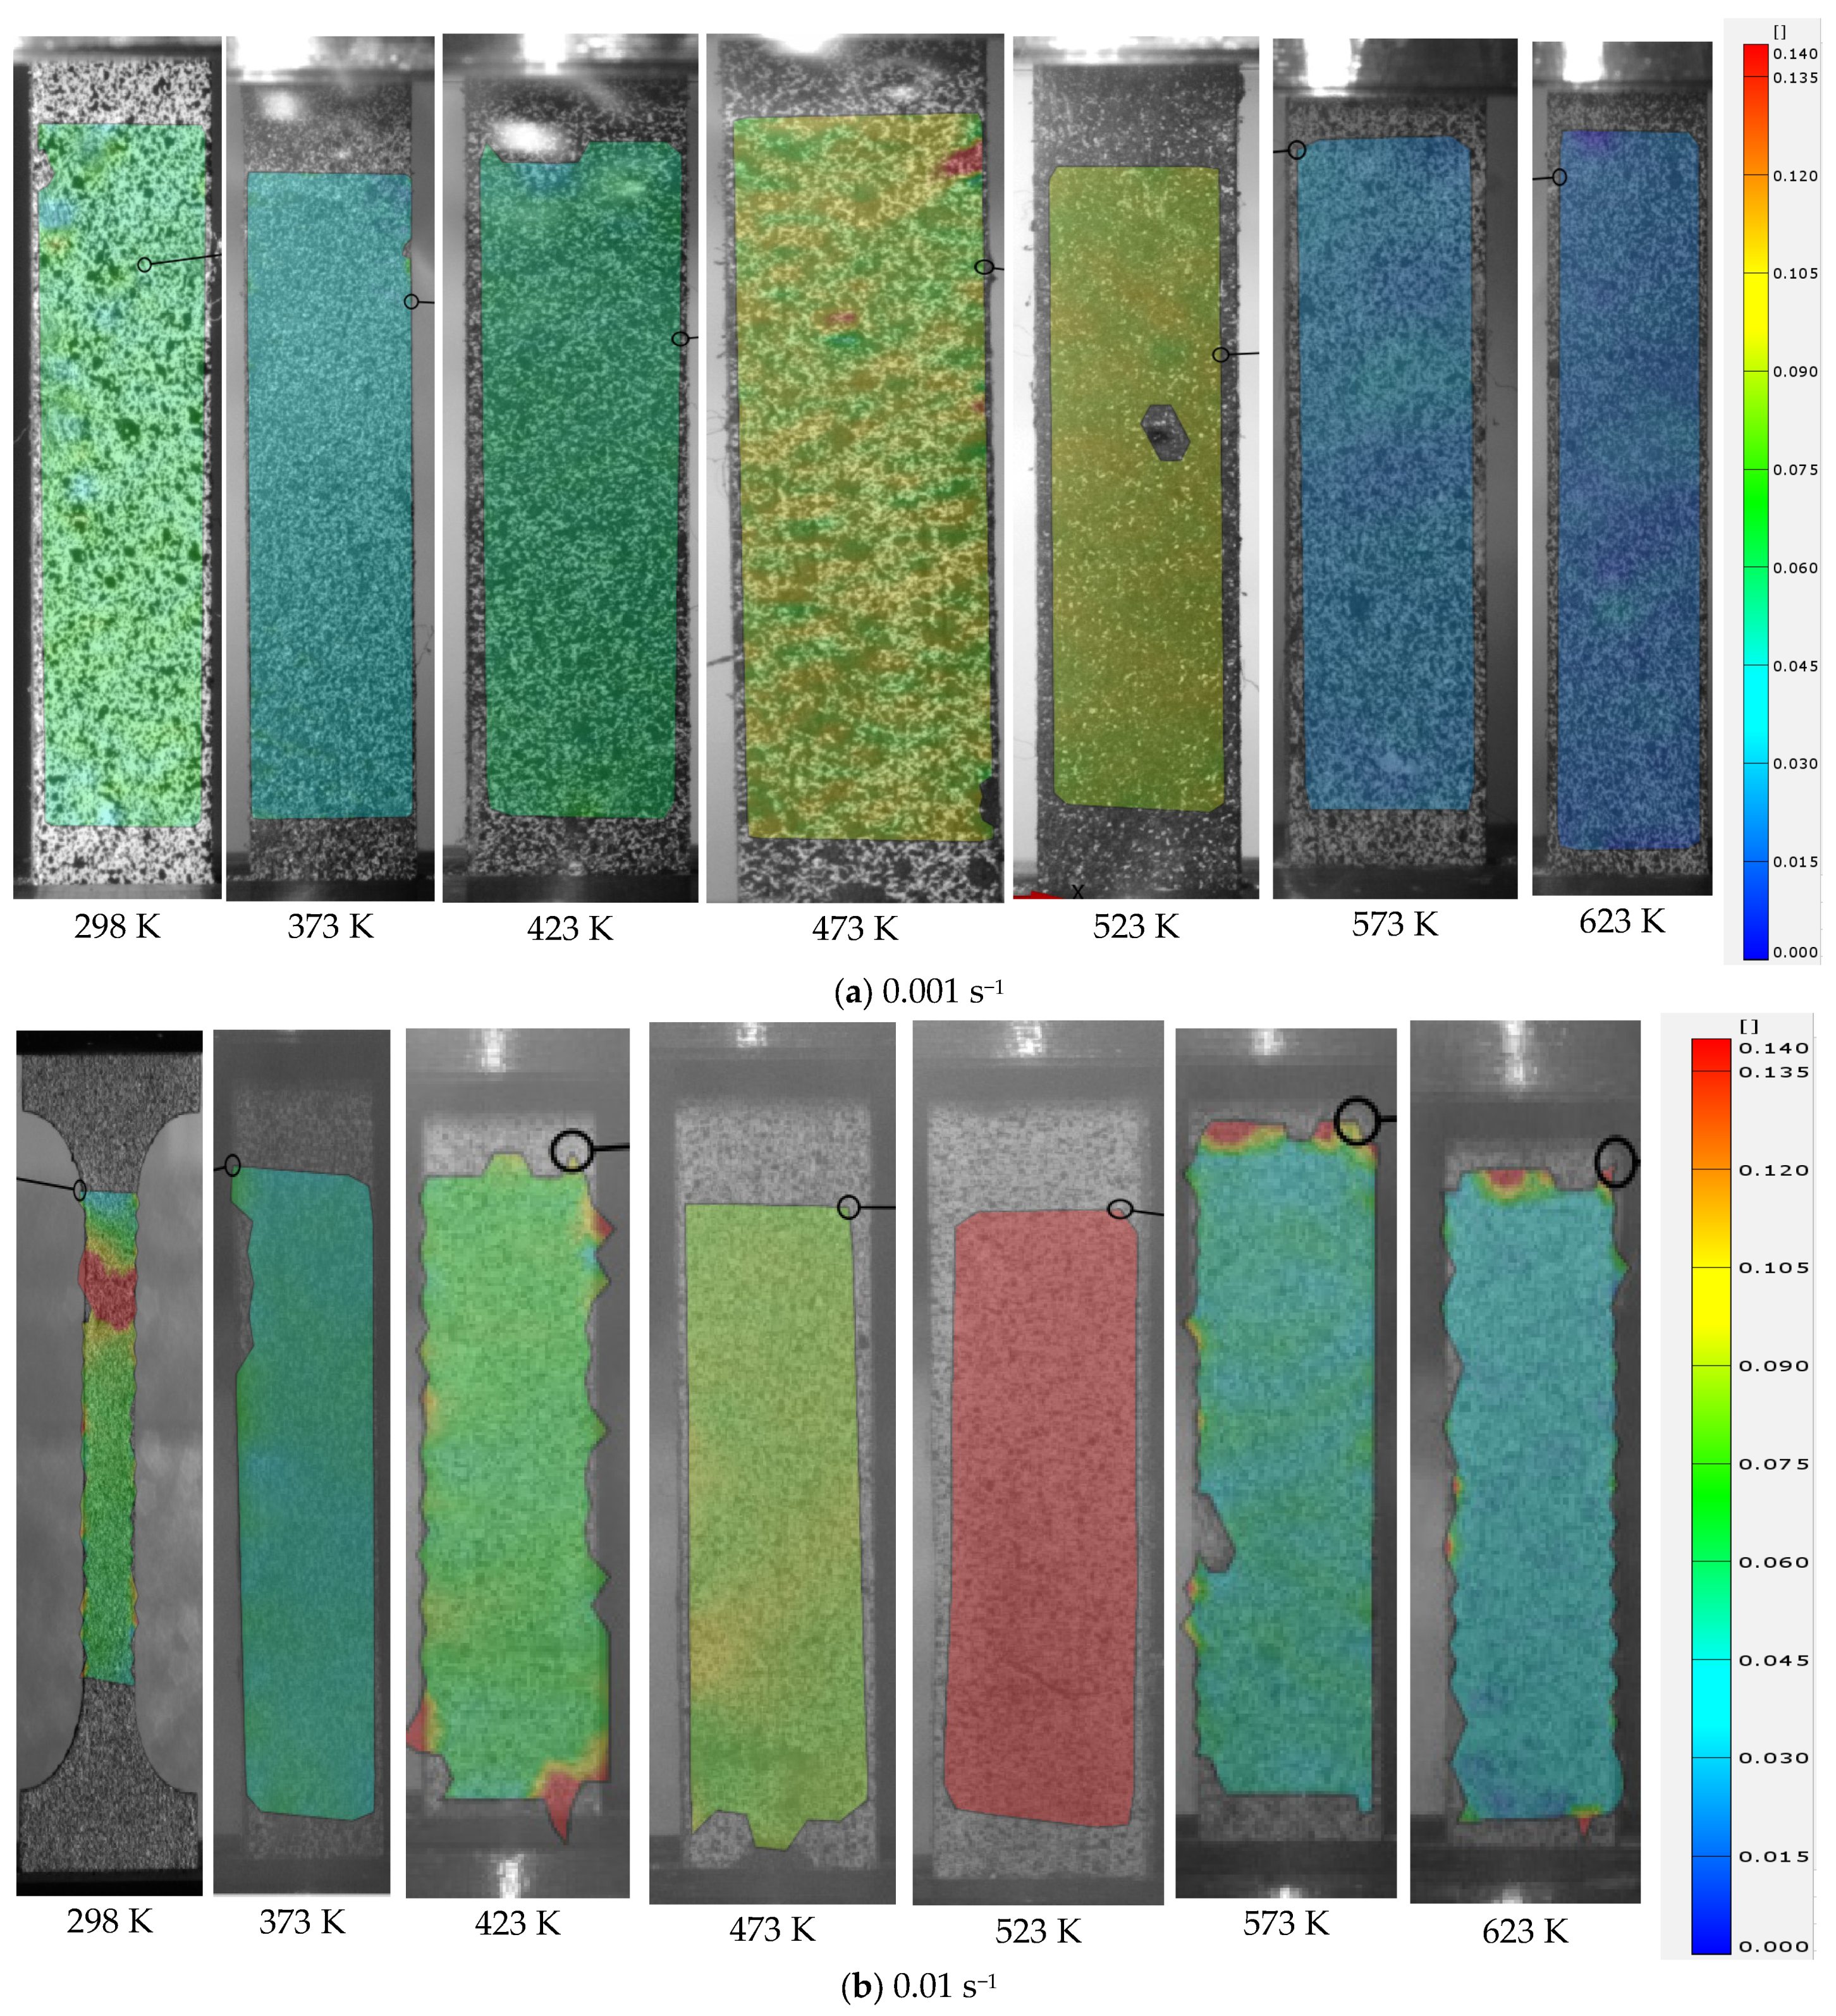
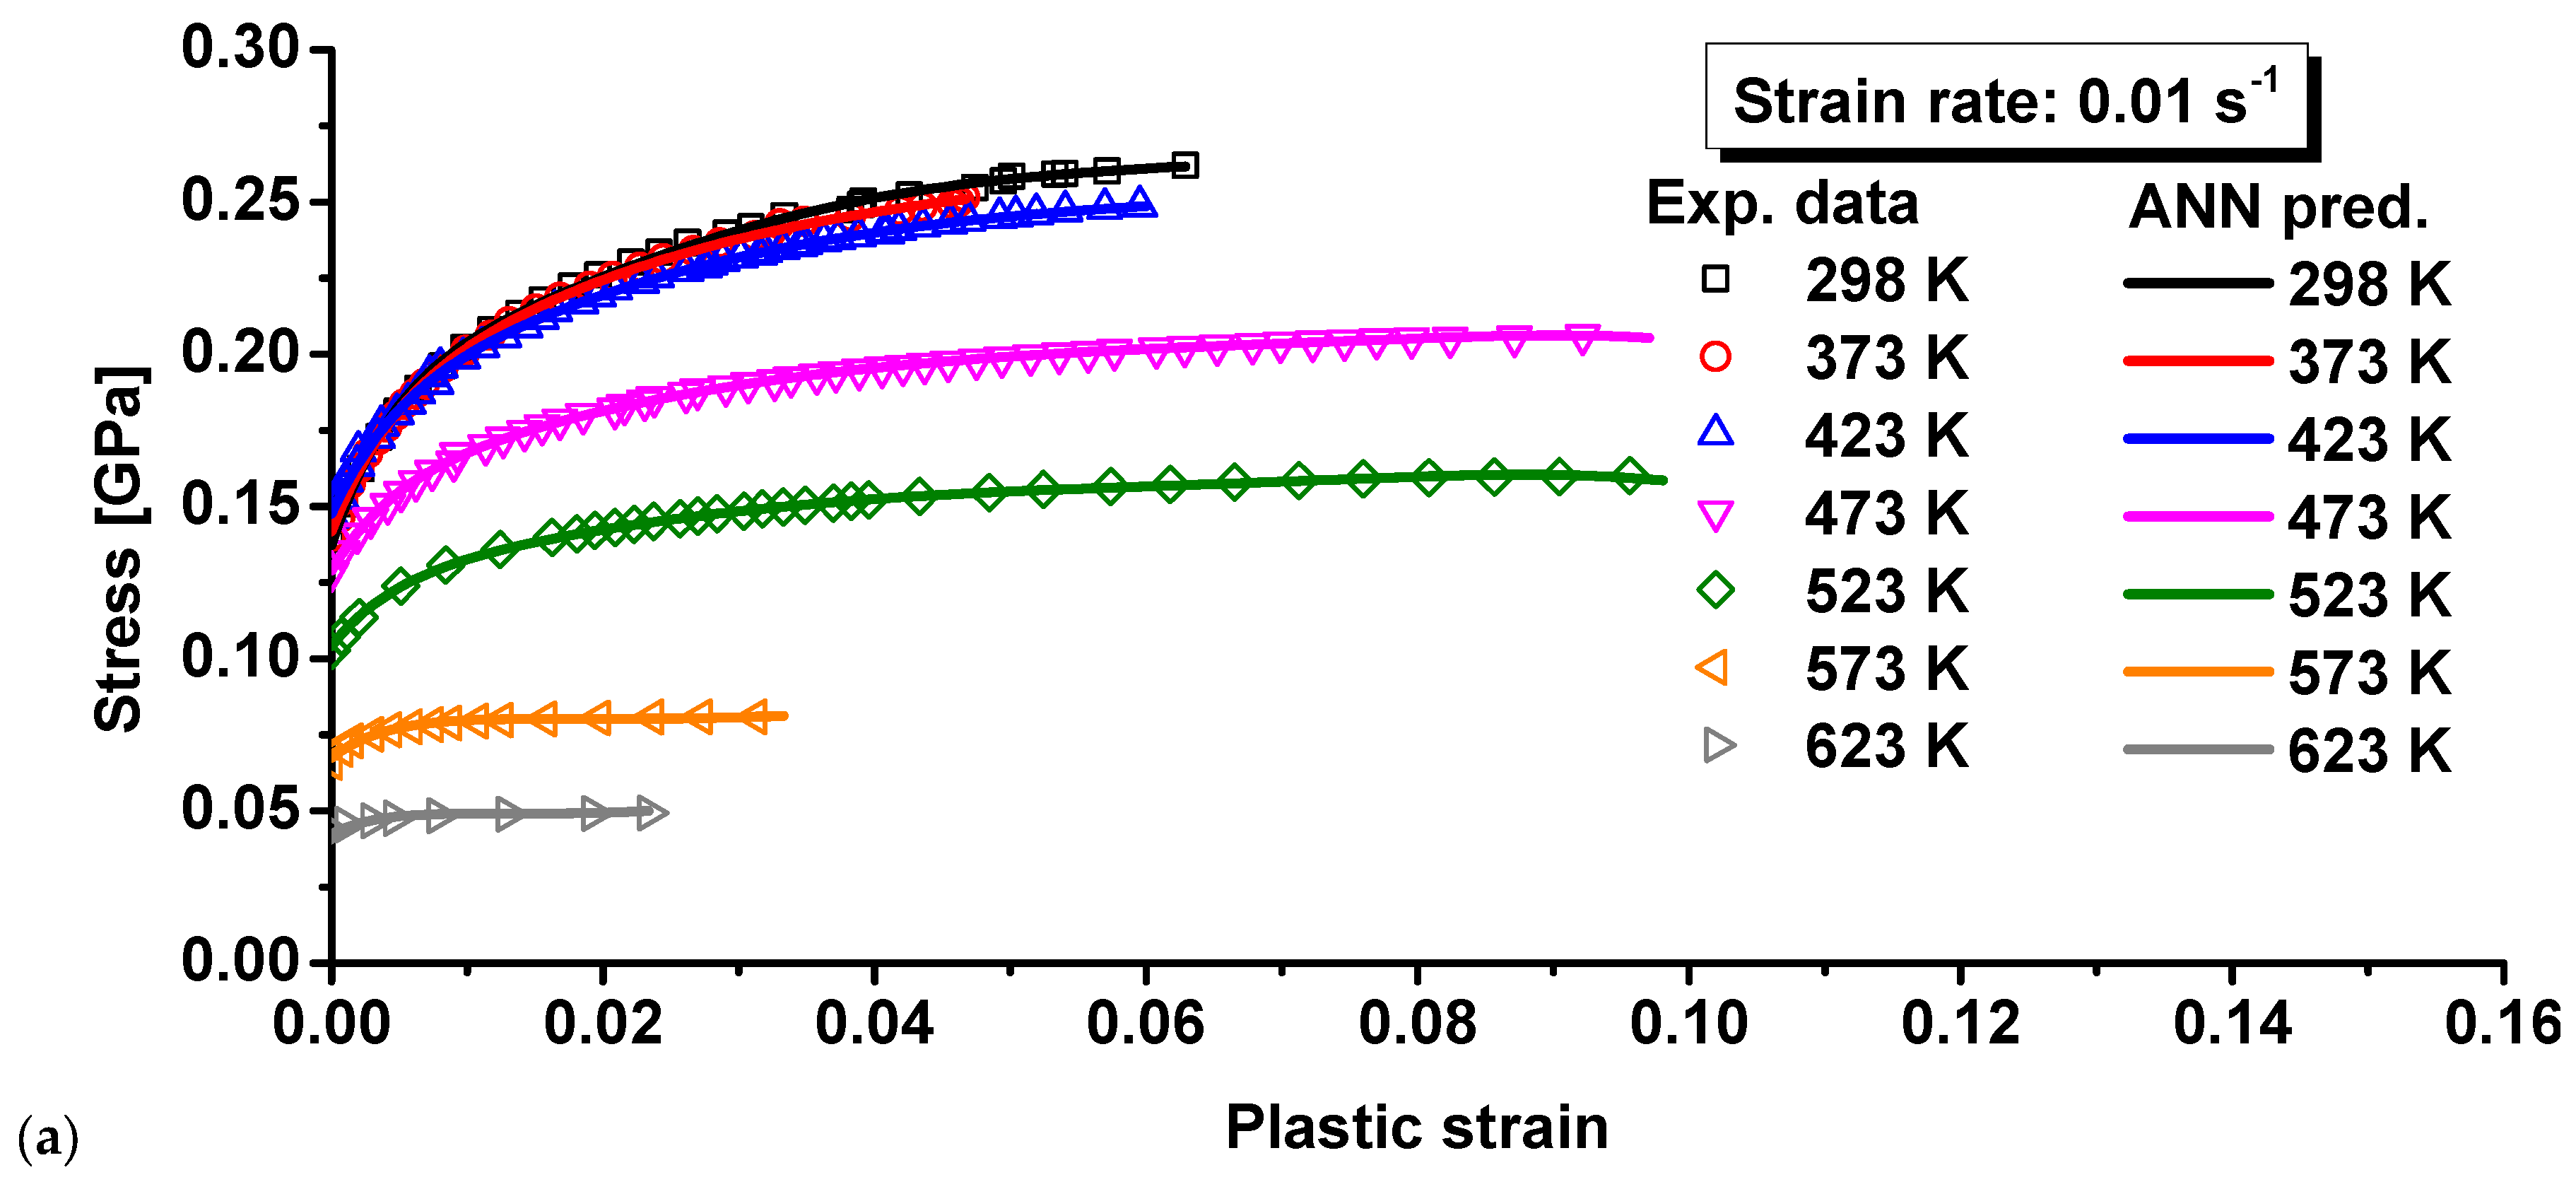
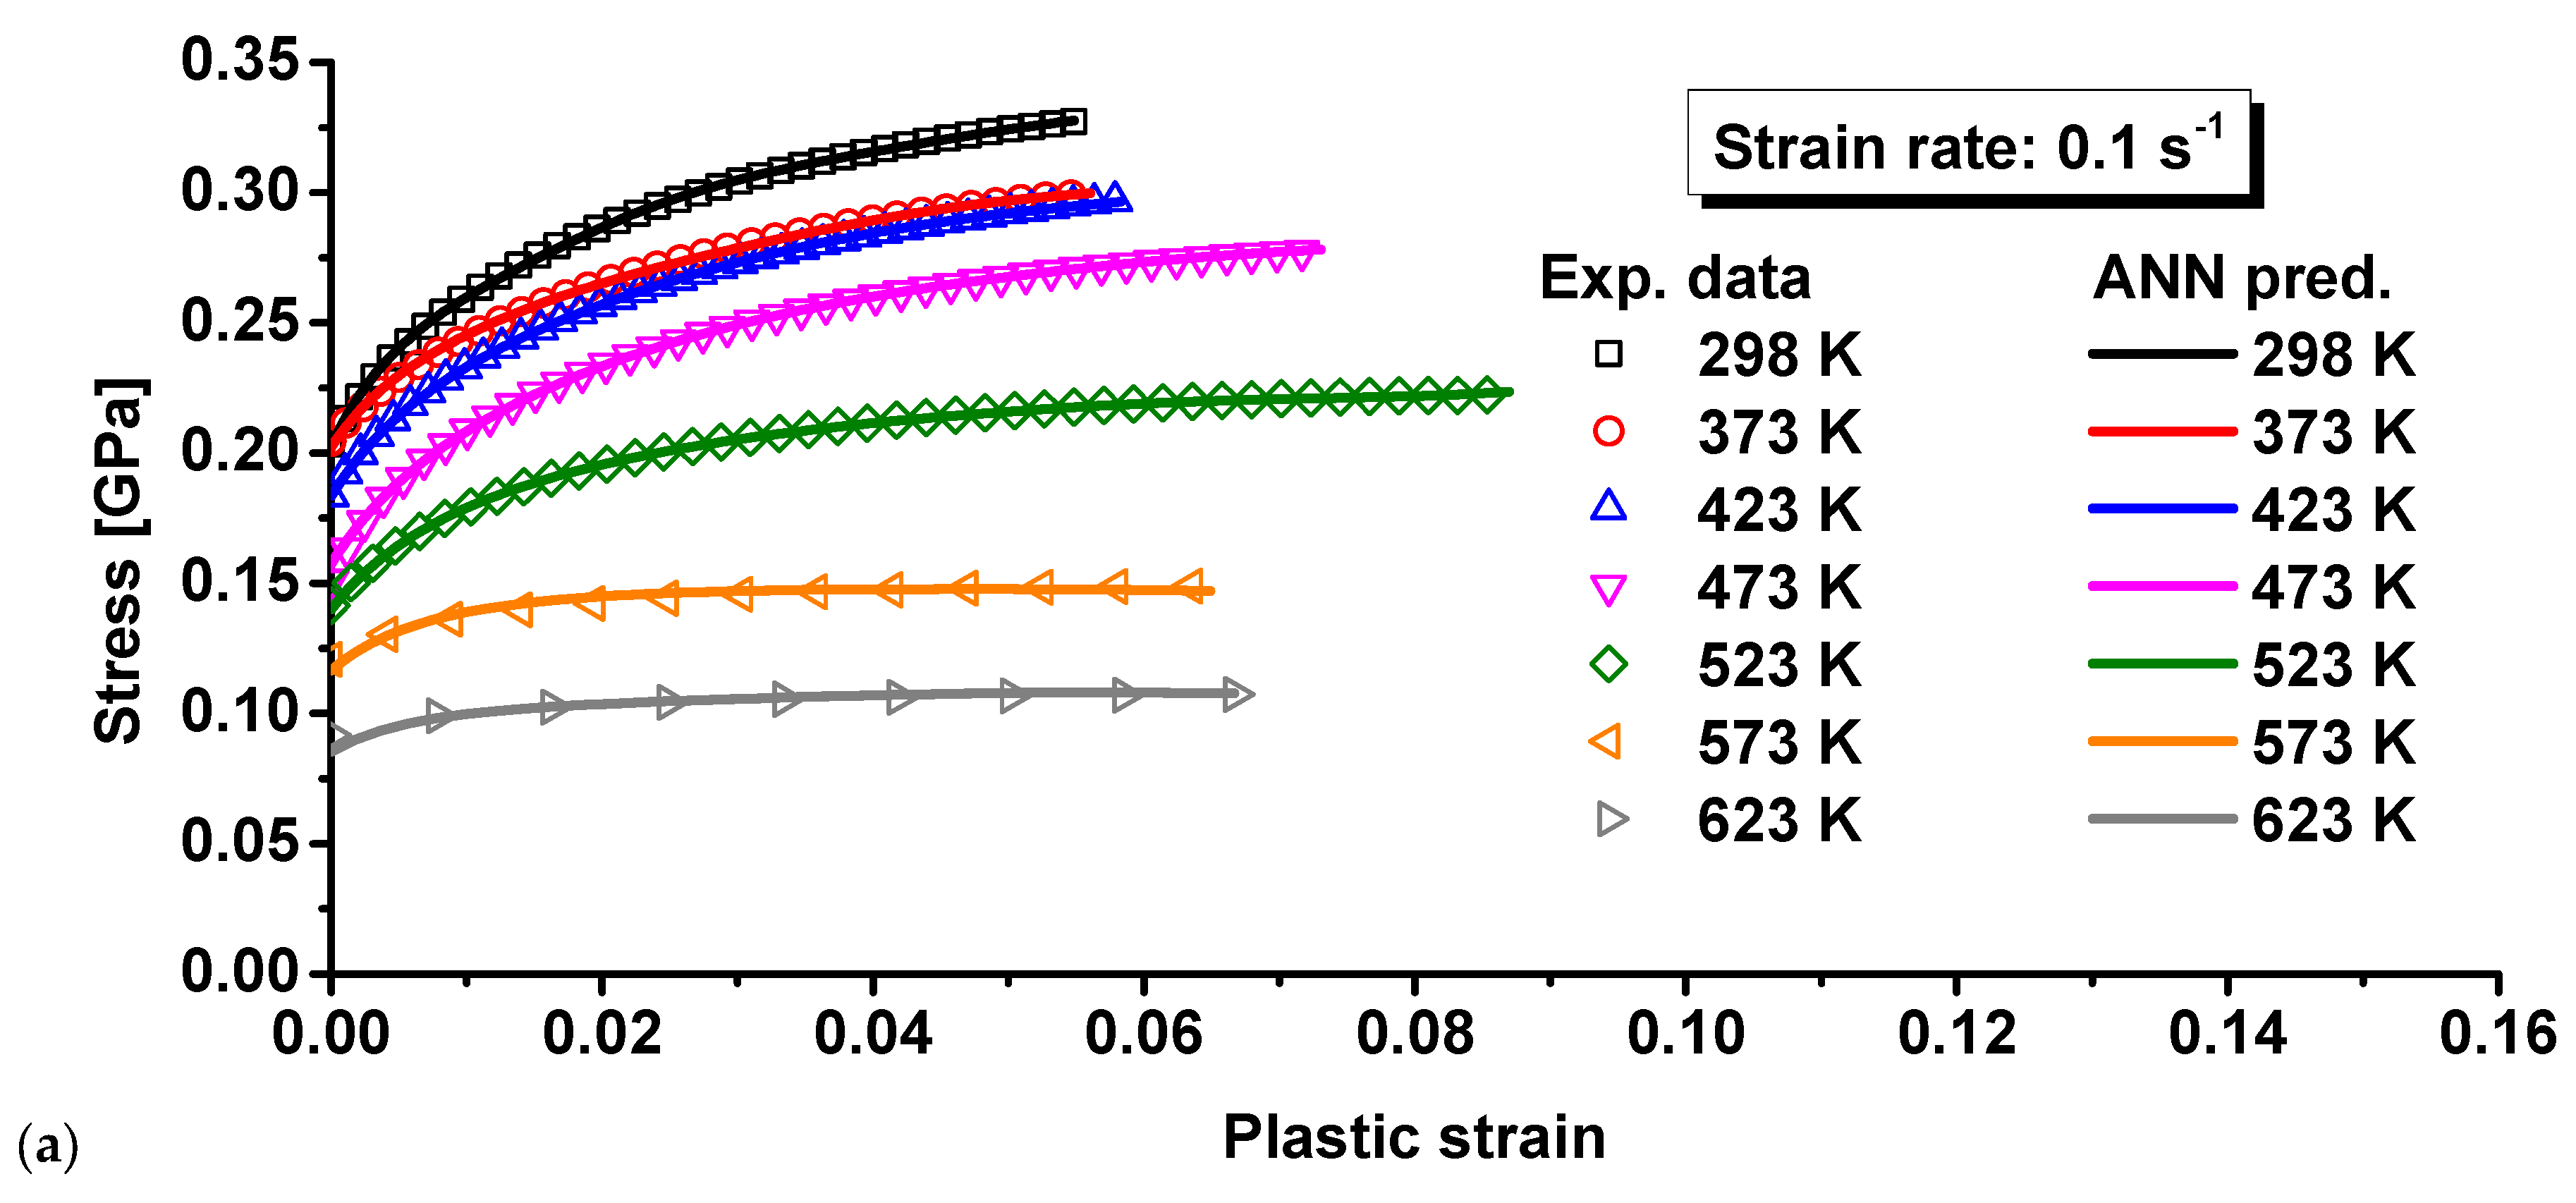
- The experimental result indicates that there is a strong correlation between the strain rate and the plastic flow strength of 15%SiC/Al 2009 composite. The temperature has a remarkable influence on the plastic flow behavior of 15%SiC/Al 2009 composite. The plastic deformation behavior of 15%SiC/Al 2009 composite under different temperatures and strain rates possesses strong coupling effect of strain, strain rate, and temperature.
- (2)
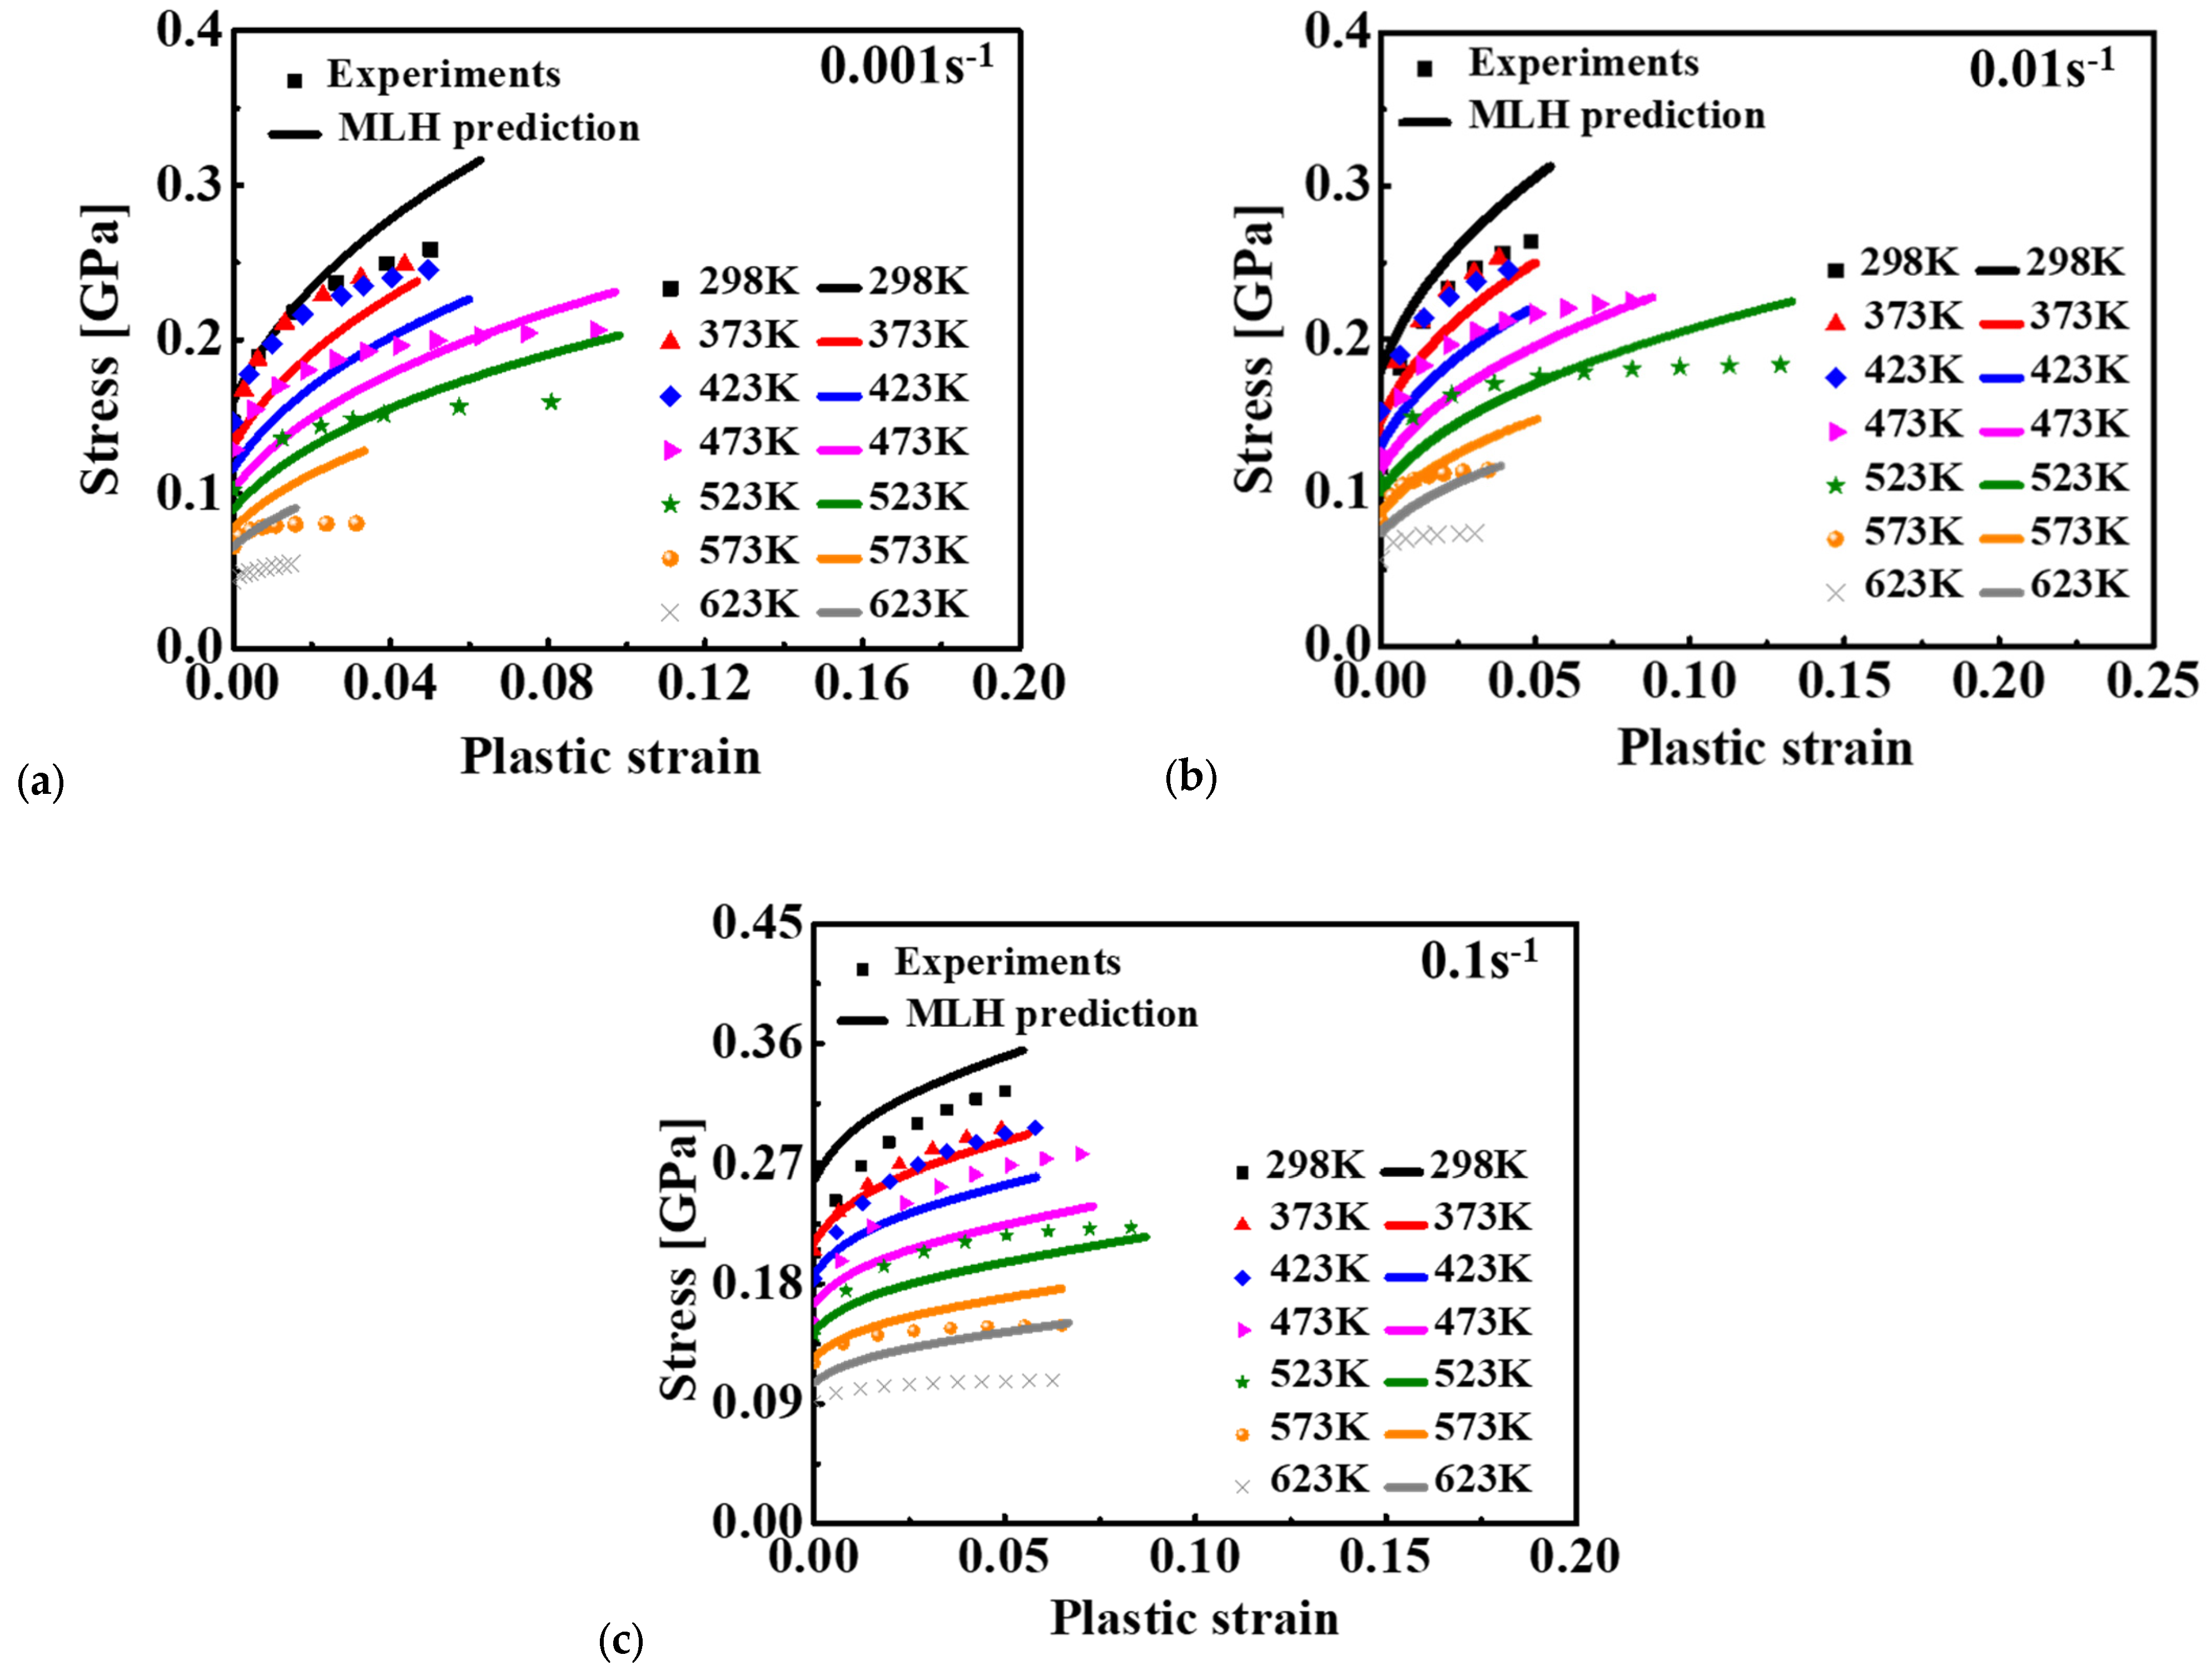
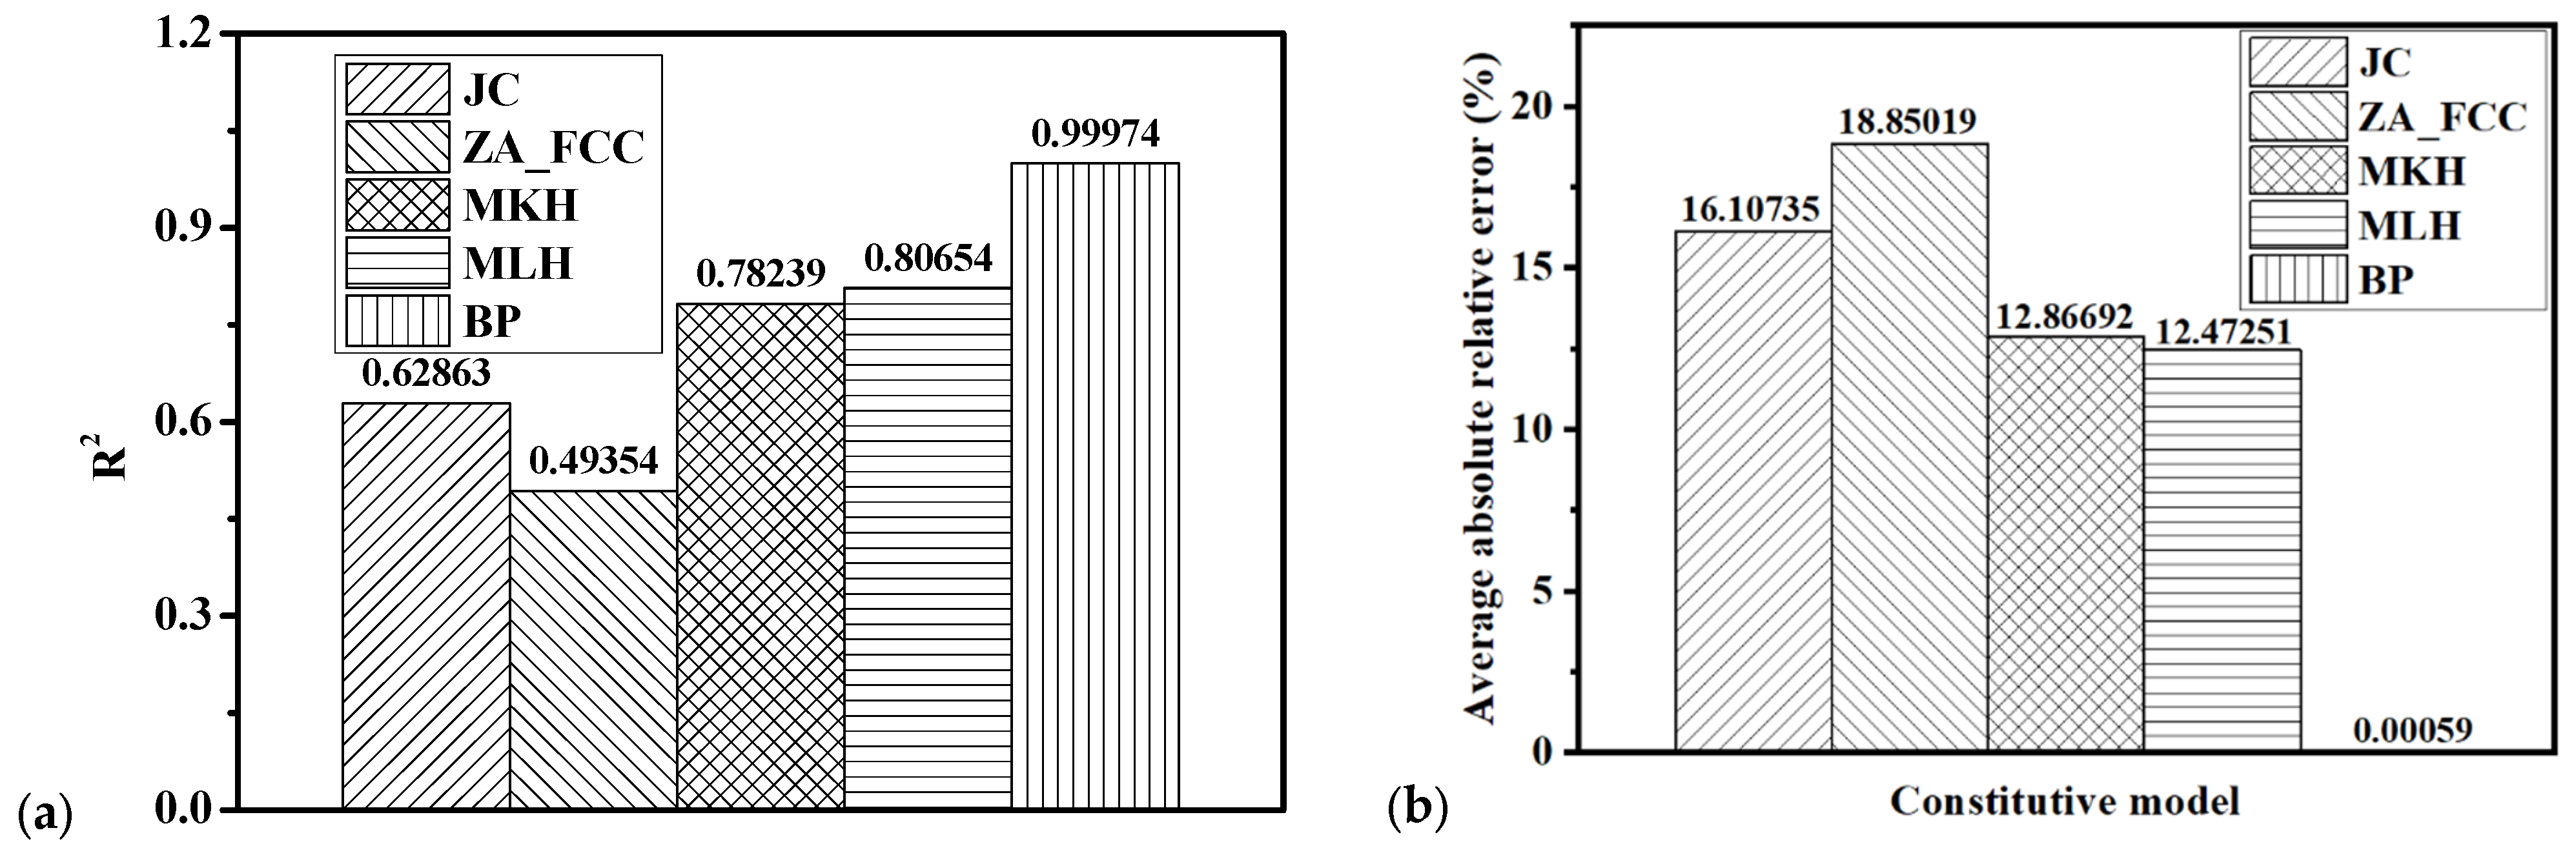
- The true stress–plastic strain curves under different temperatures and strain rates were modeled by the four popular strain rate hardening and thermal softening models of JC, ZA, MKH, and MLH. The characterized deformation behavior of the MLH model had better agreement with the experimental data than that of the JC, ZA, and MKH models as the MLH model is capable of modeling the coupling effect of strain, strain rate, and temperature. However, all the conventional models failed to characterize the flow curves at different strain rates and temperatures with satisfactory accuracy for the composite.
- (3)
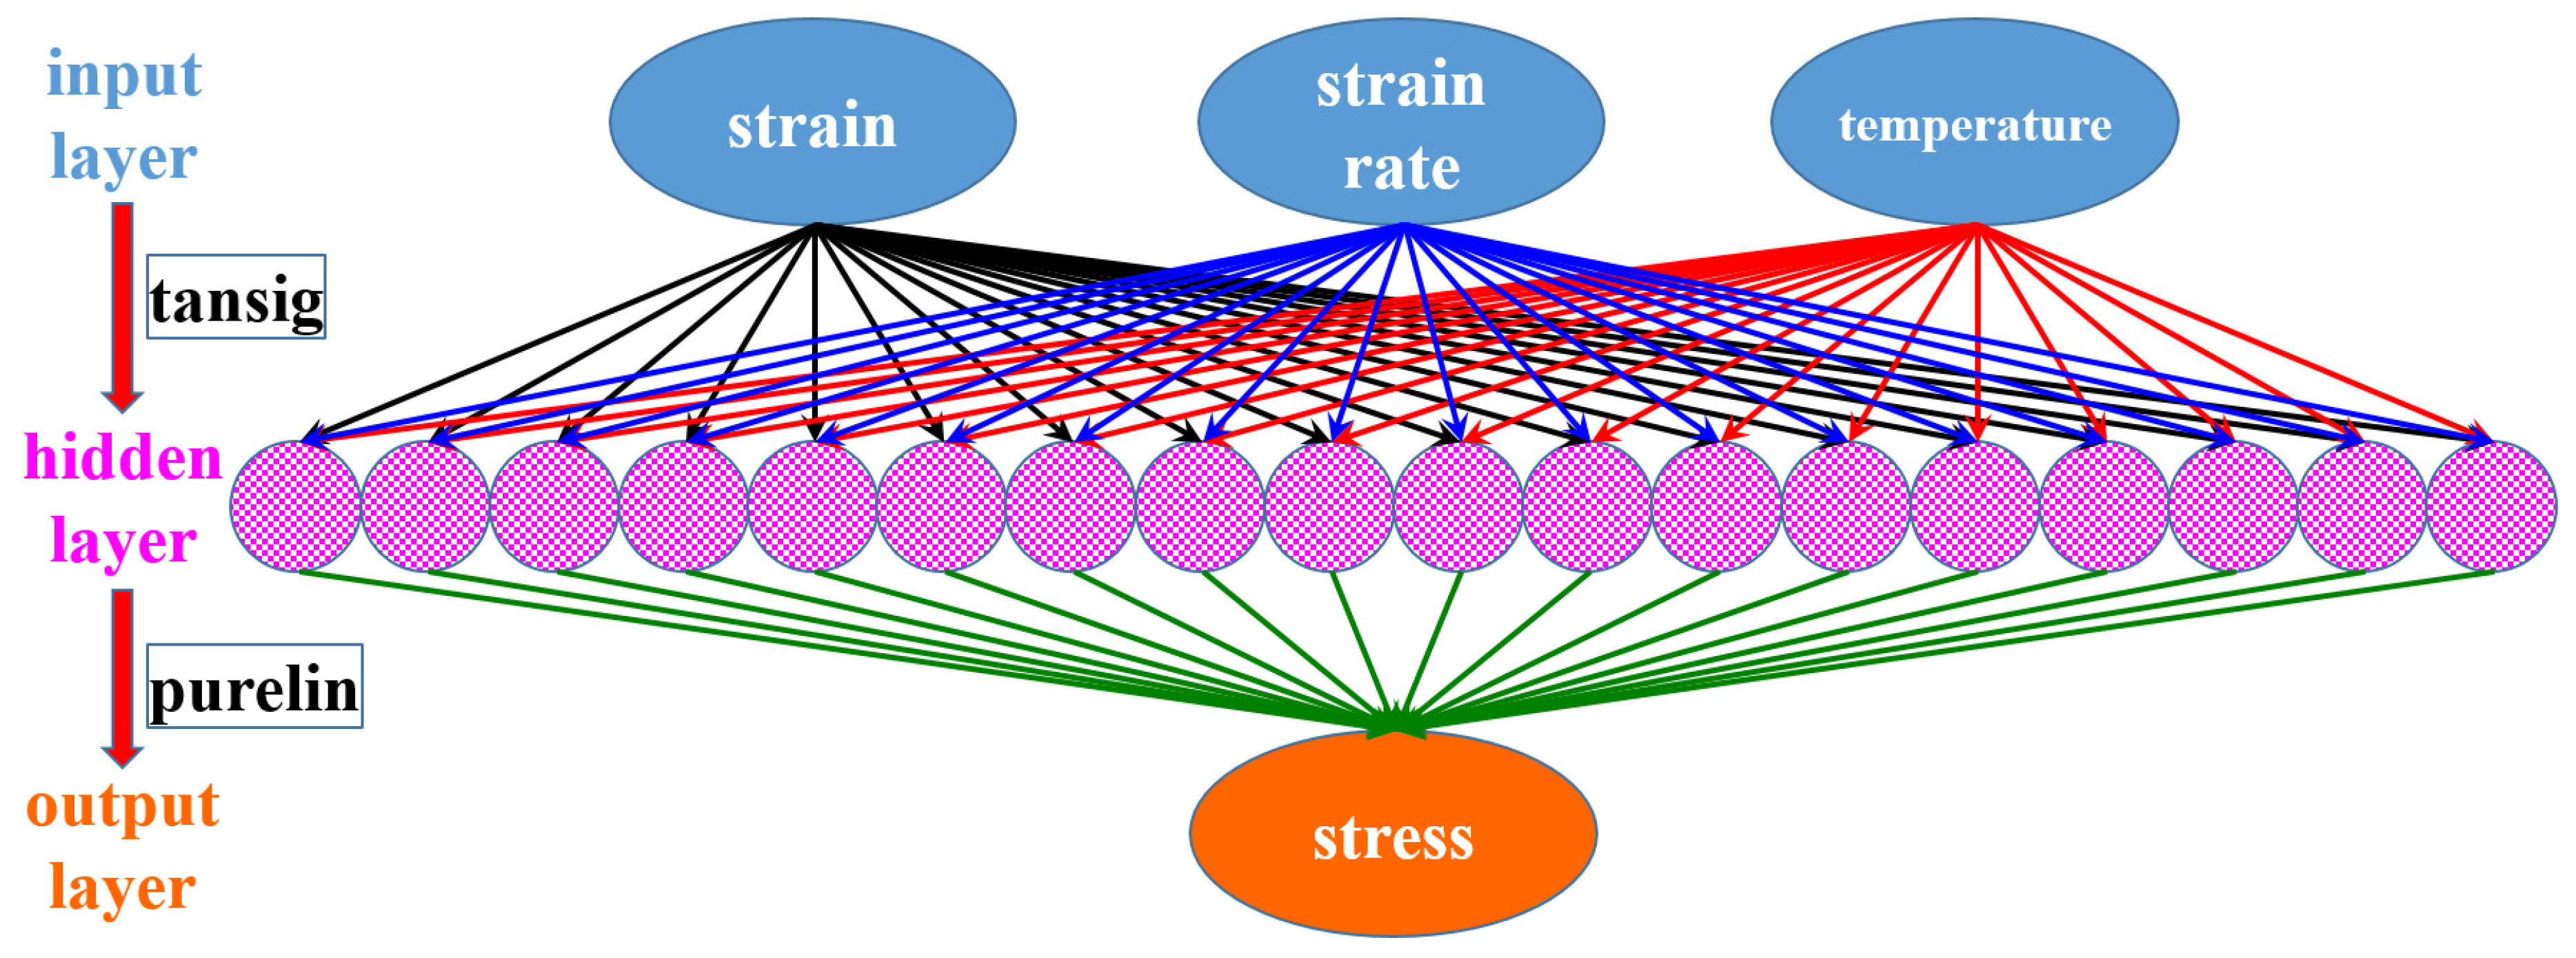
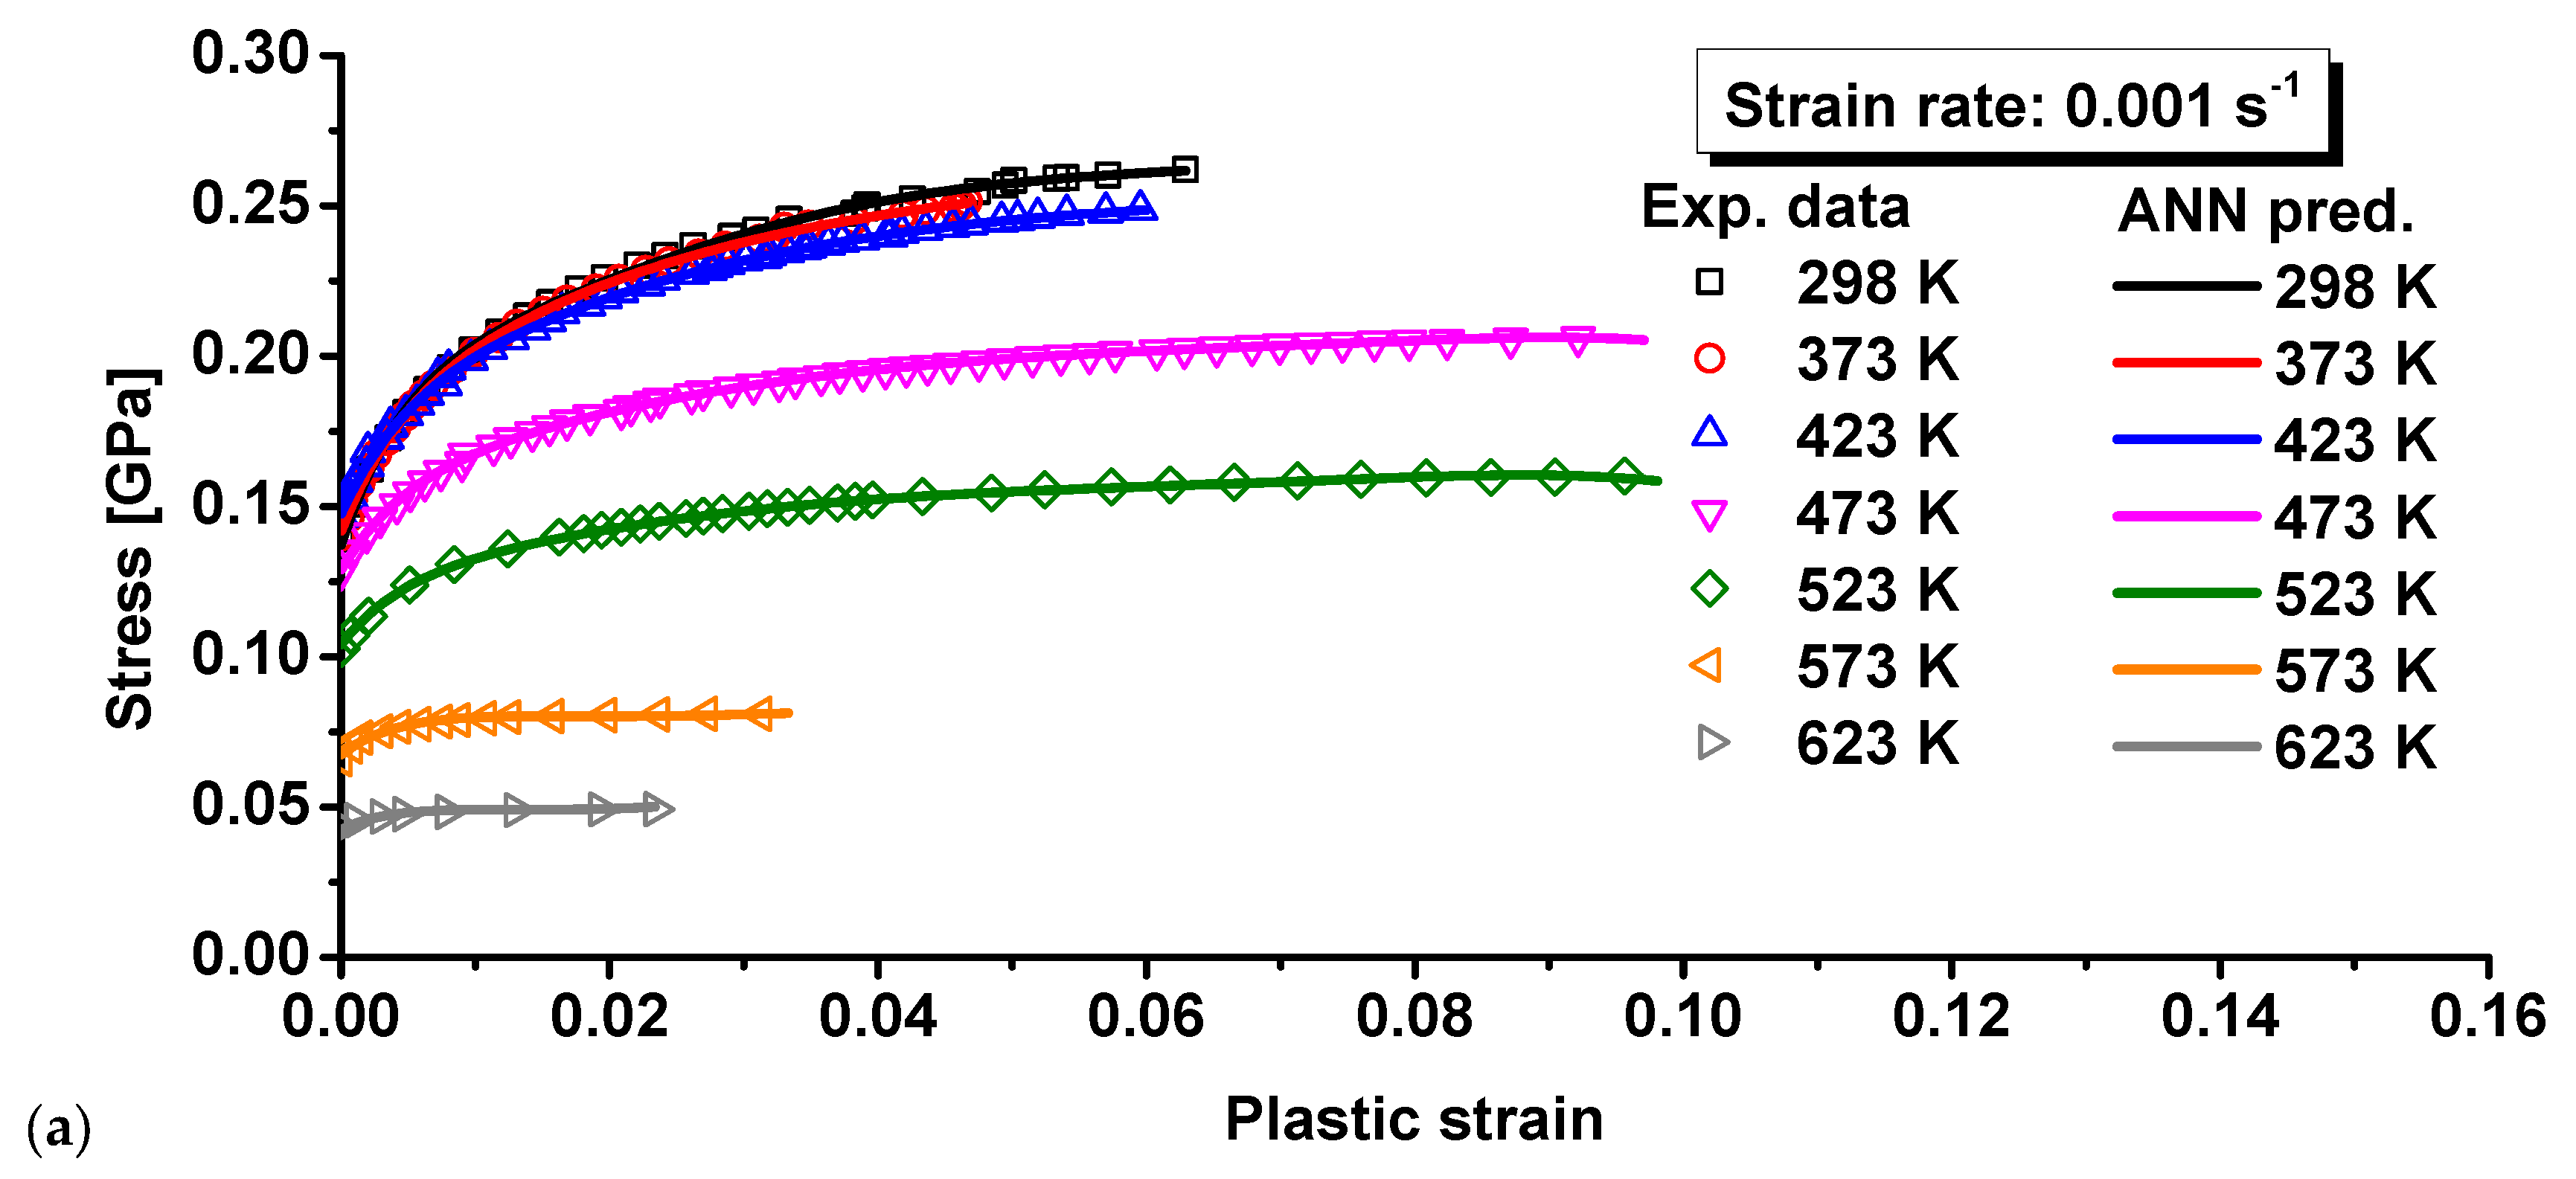
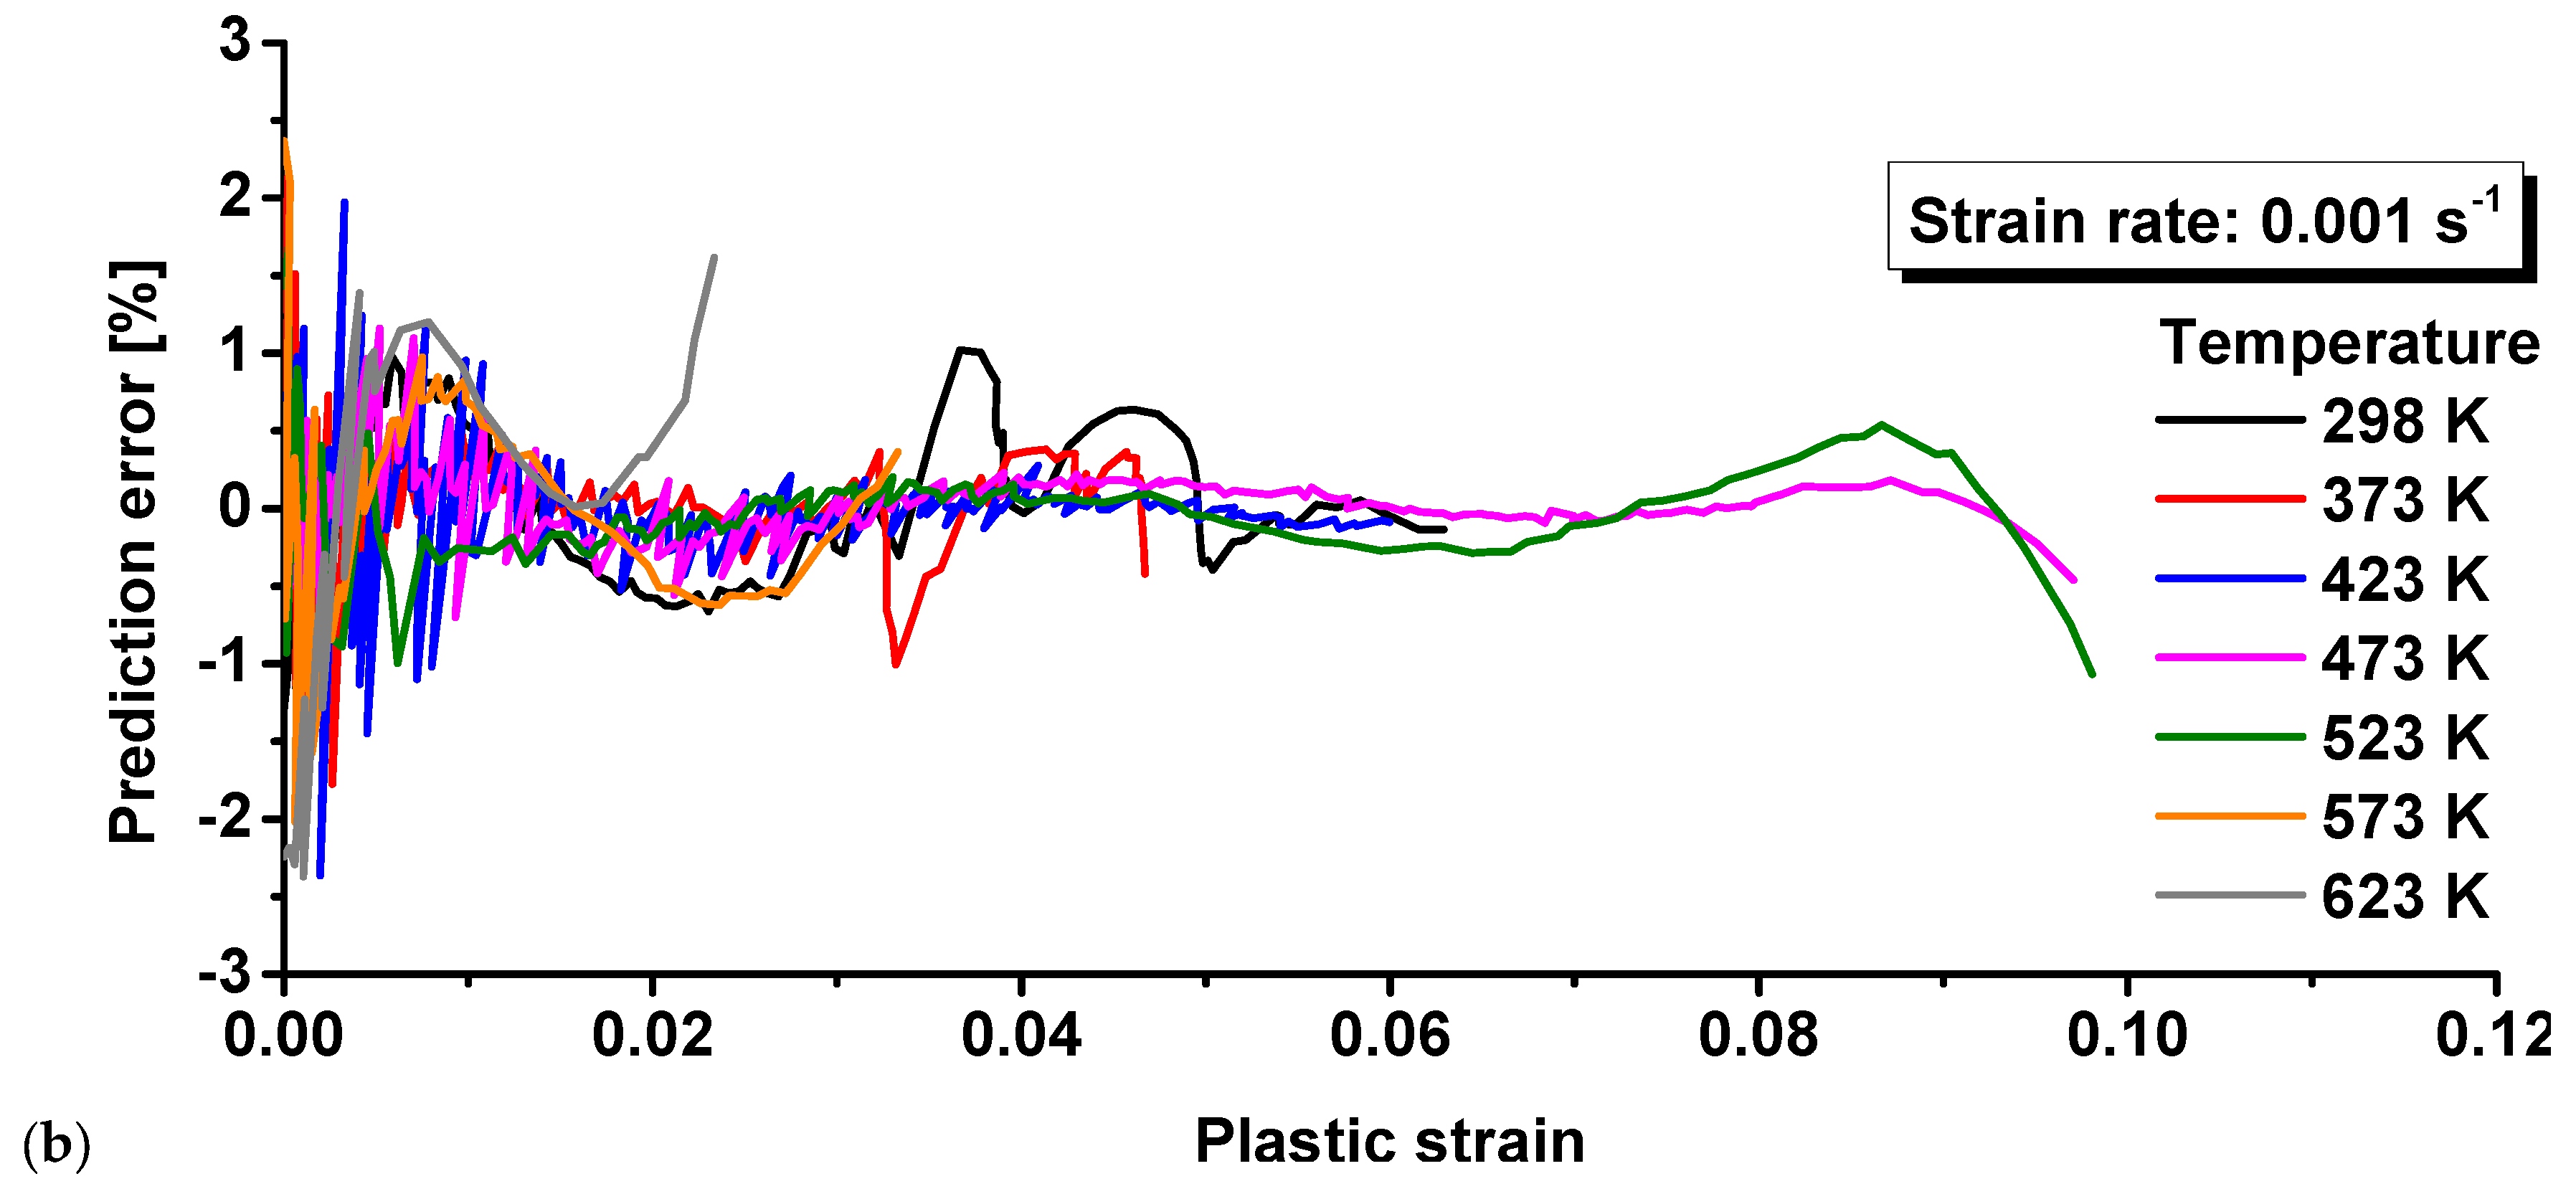
- Compared to the conventional models, the ANN-based BP model was shown to highly improve the prediction accuracy of the yield stress at different strains, strain rates, and temperatures for the composite used in this study. Precise modeling of the strain rate and thermal effects for the composite is a great challenge for conventional models, and the BP model is an alternative but very competing approach for accurate modeling of strain rate and thermal effect of the composite. Therefore, the BP model is recommended to characterize the plastic behavior of the composite in numerical simulation and analysis of warm forging and plastic forming.
Author Contributions
Funding
Institutional Review Board Statement
Informed Consent Statement
Data Availability Statement
Conflicts of Interest
References
- Li, Y.; Ramesh, K.T. Influence of particle volume fraction, shape, and aspect ratio on the behavior of particle-reinforced metal-matrix composites at high rates of strain. Acta Mater. 1998, 46, 5633–5646. [Google Scholar] [CrossRef]
- Chen, X.; Fu, D.; Teng, J.; Zhang, H. Hot deformation behavior and mechanism of hybrid aluminum-matrix composites re-inforced with micro-SiC and nano-TiB2. J. Alloys Compd. 2018, 753, 566–575. [Google Scholar] [CrossRef]
- Suo, Y.; Deng, Z.; Wang, B.; Gong, Y.; Jia, P. Constitutive model of metal matrix composites at high strain rates and its application. Mater. Today Commun. 2021, 27, 102328. [Google Scholar] [CrossRef]
- Srivastava, V.C.; Jindal, V.; Uhlenwinkel, V.; Bauckhage, K. Hot deformation behaviour of spray-formed 2014 Al+SiCP met-al matrix composites. Mater. Sci. Eng. A 2008, 477, 86–95. [Google Scholar] [CrossRef]
- Wang, L.; Guan, P.; Teng, J.; Liu, P.; Chen, D.; Xie, W.; Kong, D.; Zhang, S.; Zhu, T.; Zhang, Z.; et al. New twinning route in face-centered cubic nanocrystalline metals. Nat. Commun. 2017, 8, 2142. [Google Scholar] [CrossRef] [PubMed]
- Wang, L.; Du, K.; Yang, C.; Teng, J.; Fu, L.; Guo, Y.; Zhang, Z.; Han, X. In situ atomic-scale observation of grain size and twin thickness effect limit in twin-structural nanocrystalline platinum. Nat. Commun. 2020, 11, 1167. [Google Scholar] [CrossRef] [PubMed] [Green Version]
- Fu, L.; Yang, C.; Wei, R.; Pei, X.; Teng, J.; Kong, D.; Lu, Y.; Guo, Y.; Liu, T.; Hu, Y.; et al. In Situ Atomic-scale Observation of AuCu Alloy Nanowire with Superplasticity and High Strength at Room Temperature. Mater. Today Nano 2021, 15, 100123. [Google Scholar] [CrossRef]
- Johnson, G.R.; Cook, W.H. A Constitutive Model and Data for Metals Subjected to Large Strains, High Strain Rates and High Temperatures. In Proceedings of the Seventh International Symposium on Ballistics, Hague, The Netherlands, 19–21 April 1983. [Google Scholar]
- Khan, A.; Huang, S. Experimental and Theoretical Study of Mechanical Behavior of 1100 aluminum in the strain rate range 10-5-104s-1. Int. J. Plast. 1992, 8, 397–424. [Google Scholar] [CrossRef]
- Huh, H.; Ahn, K.; Lim, J.H.; Kim, H.W.; Park, L.J. Evaluation of Dynamic Hardening Models for BCC, FCC, and HCP Metals at a Wide Range of Strain Rates. J. Mater. Process. Technol. 2014, 214, 1326–1340. [Google Scholar] [CrossRef]
- Song, J.; Huh, H. The Effect of Strain Rate on the Material Characteristics of Nickel-Based Superalloy Inconel 718. Key Eng. Mater. 2007, 340–341, 283–288. [Google Scholar] [CrossRef]
- Piao, M.J.; Huh, H.; Lee, I.J. Characterization of Hardening Behavior at Ultra-high Strain Rate, Large Strain, and High Tem-perature. Key Eng. Mater. 2016, 725, 138–142. [Google Scholar] [CrossRef]
- Zerilli, F.J.; Armstrong, R.W. Dislocation-mechanics-based Constitutive relations for material dynamics calculations. J. Appl. Phys. 1987, 61, 1816–1825. [Google Scholar] [CrossRef] [Green Version]
- Khan, A.S.; Liu, J. A deformation mechanism based crystal plasticity model of ultrafine-grained/nanocrystalline FCC poly-crystals. Int. J. Plast. 2016, 86, 56–69. [Google Scholar] [CrossRef]
- Djordjevic, N.; Vignjevic, R.; Kiely, L.; Case, S.; Vuyst, T.D.; Campbell, J.; Hughes, K. Modelling of shock waves in fcc and bcc metals using a combined continuum and dislocation kinetic approach. Int. J. Plast. 2018, 105, 211–224. [Google Scholar] [CrossRef]
- Chen, S.F.; Li, D.Y.; Zhang, S.H.; Han, H.N.; Lee, H.W.; Lee, M.G. Modelling continuous dynamic recrystallization of aluminum alloys based on the polycrystal plasticity approach. Int. J. Plast. 2020, 131, 102710. [Google Scholar] [CrossRef]
- Gupta, S.; Bronkhorst, C.A. Crystal plasticity model for single crystal Ni-based superalloys: Capturing orientation and temperature dependence of flow stress. Int. J. Plast. 2021, 137, 102896. [Google Scholar] [CrossRef]
- Tirtom, İ.; Güden, M.; Yıldız, H. Simulation of the strain rate sensitive flow behavior of SiC-particulate reinforced aluminum metal matrix composites. Comput. Mater. Sci. 2008, 42, 570–578. [Google Scholar] [CrossRef] [Green Version]
- Rajamuthamilselvan, M.; Ramanathan, S.; Karthikeyan, R. Processing Map for Hot Working of SiCp/7075 Al Composites. Trans. Nonferrous Met. Soc. 2010, 20, 668–674. [Google Scholar] [CrossRef]
- Moćko, W.; Kowalewski, Z.L. Mechanical Properties of A359/SiCp Metal Matrix Composites at Wide Range of Strain Rates. Appl. Mech. Mater. 2011, 82, 166–171. [Google Scholar] [CrossRef]
- Hao, S.M.; Xie, J.P. Hot Deformation Behaviors of SiCp/Al Composites. Adv. Mater. Res. 2014, 1058, 165–169. [Google Scholar] [CrossRef]
- Yuan, Z.; Li, F.; Ji, G.; Qiao, H.; Li, J. Flow Stress Prediction of SiCp/Al Composites at Varying Strain Rates and Elevated Temperatures. J. Mater. Eng. Perform. 2014, 23, 1016–1027. [Google Scholar] [CrossRef]
- Zhang, J.; Ouyang, Q.; Guo, Q.; Li, Z.; Fan, G.; Su, Y.; Jiang, L.; Lavernia, E.J.; Schoenung, J.M.; Zhang, D. 3D Microstructure-based finite element modeling of deformation and fracture of SiCp/Al composites. Compos. Sci. Technol. 2016, 123, 1–9. [Google Scholar] [CrossRef] [Green Version]
- Zhang, J.F.; Zhang, X.X.; Wang, Q.Z.; Xiao, B.L.; Ma, Z.Y. Simulations of deformation and damage processes of SiCp/Al composites during tension. J. Mater. Sci. Technol. 2018, 34, 627–634. [Google Scholar] [CrossRef]
- Tang, B.; Wang, H.; Jin, P.P.; Jiang, X.Q. A modified Johnson-Cook model for dynamic behavior of spray-deposition 17 vol.% SiCp/7055Al composites at high strain rates. Mater. Res. Express 2020, 7, 056521. [Google Scholar] [CrossRef]
- Lou, Y.; Zhang, S.; Yoon, J. Strength modeling of sheet metals from shear to plane strain tension. Int. J. Plast. 2020, 134, 102813. [Google Scholar] [CrossRef]
- Zhang, C.; Lou, Y.; Zhang, S.; Clausmeyer, T.; Tekkaya, A.E.; Fu, L.; Chen, Q.; Zhang, Q. Large strain flow curve identification for sheet metals under complex stress states. Mech. Mater. 2021, 161, 103–997. [Google Scholar] [CrossRef]
- Li, X.; Roth, C.C.; Mohr, D. Machine-learning based temperature- and rate-dependent plasticity model: Application to analysis of fracture experiments on DP steel. Int. J. Plast. 2019, 118, 320–344. [Google Scholar] [CrossRef]
- Shang, H.; Wu, P.; Lou, Y.; Wang, J.; Chen, Q. Machine learning-based modeling of the coupling effect of strain rate and temperature on strain hardening for 5182-O aluminum alloy. J. Mater. Process. Technol. 2022, 302, 117501. [Google Scholar] [CrossRef]


| Composition | Cu | Mg | Fe | Si | O | Al |
|---|---|---|---|---|---|---|
| wt % | 3.2–4.4 | 1.0–1.6 | <0.1 | <0.1 | <0.1 | Bal. |
| A | B | n | C | m |
|---|---|---|---|---|
| 0.1896 | 0.6139 | 0.3575 | 0.0463 | 0.7843 |
| 0.0758 | 5.8315 | 0.0040 | 2.077 × 10⁻⁴ |
| A | B | m | C | p | ||
|---|---|---|---|---|---|---|
| 0.1260 | 0.2679 | 0.7218 | 2.0539 | 0.3148 | 0.0034 | 3.2904 |
| A | n | |||||||||
|---|---|---|---|---|---|---|---|---|---|---|
| 0.5296 | 0.0014 | 0.1865 | 0.2948 | 0.2864 | 2.5321 | 0.0001 | 0.0386 | 7.5816 | 0.6628 | 0.0256 |
Publisher’s Note: MDPI stays neutral with regard to jurisdictional claims in published maps and institutional affiliations. |
© 2022 by the authors. Licensee MDPI, Basel, Switzerland. This article is an open access article distributed under the terms and conditions of the Creative Commons Attribution (CC BY) license (https://creativecommons.org/licenses/by/4.0/).
Share and Cite
Wang, Y.; Wu, P.; He, X.; Zhao, W.; Lan, X.; Lou, Y. Precise Modeling of Thermal and Strain Rate Effect on the Hardening Behavior of SiC/Al Composite. Materials 2022, 15, 2000. https://doi.org/10.3390/ma15062000
Wang Y, Wu P, He X, Zhao W, Lan X, Lou Y. Precise Modeling of Thermal and Strain Rate Effect on the Hardening Behavior of SiC/Al Composite. Materials. 2022; 15(6):2000. https://doi.org/10.3390/ma15062000
Chicago/Turabian StyleWang, Yanju, Pengfei Wu, Xiaolei He, Wei Zhao, Xiang Lan, and Yanshan Lou. 2022. "Precise Modeling of Thermal and Strain Rate Effect on the Hardening Behavior of SiC/Al Composite" Materials 15, no. 6: 2000. https://doi.org/10.3390/ma15062000