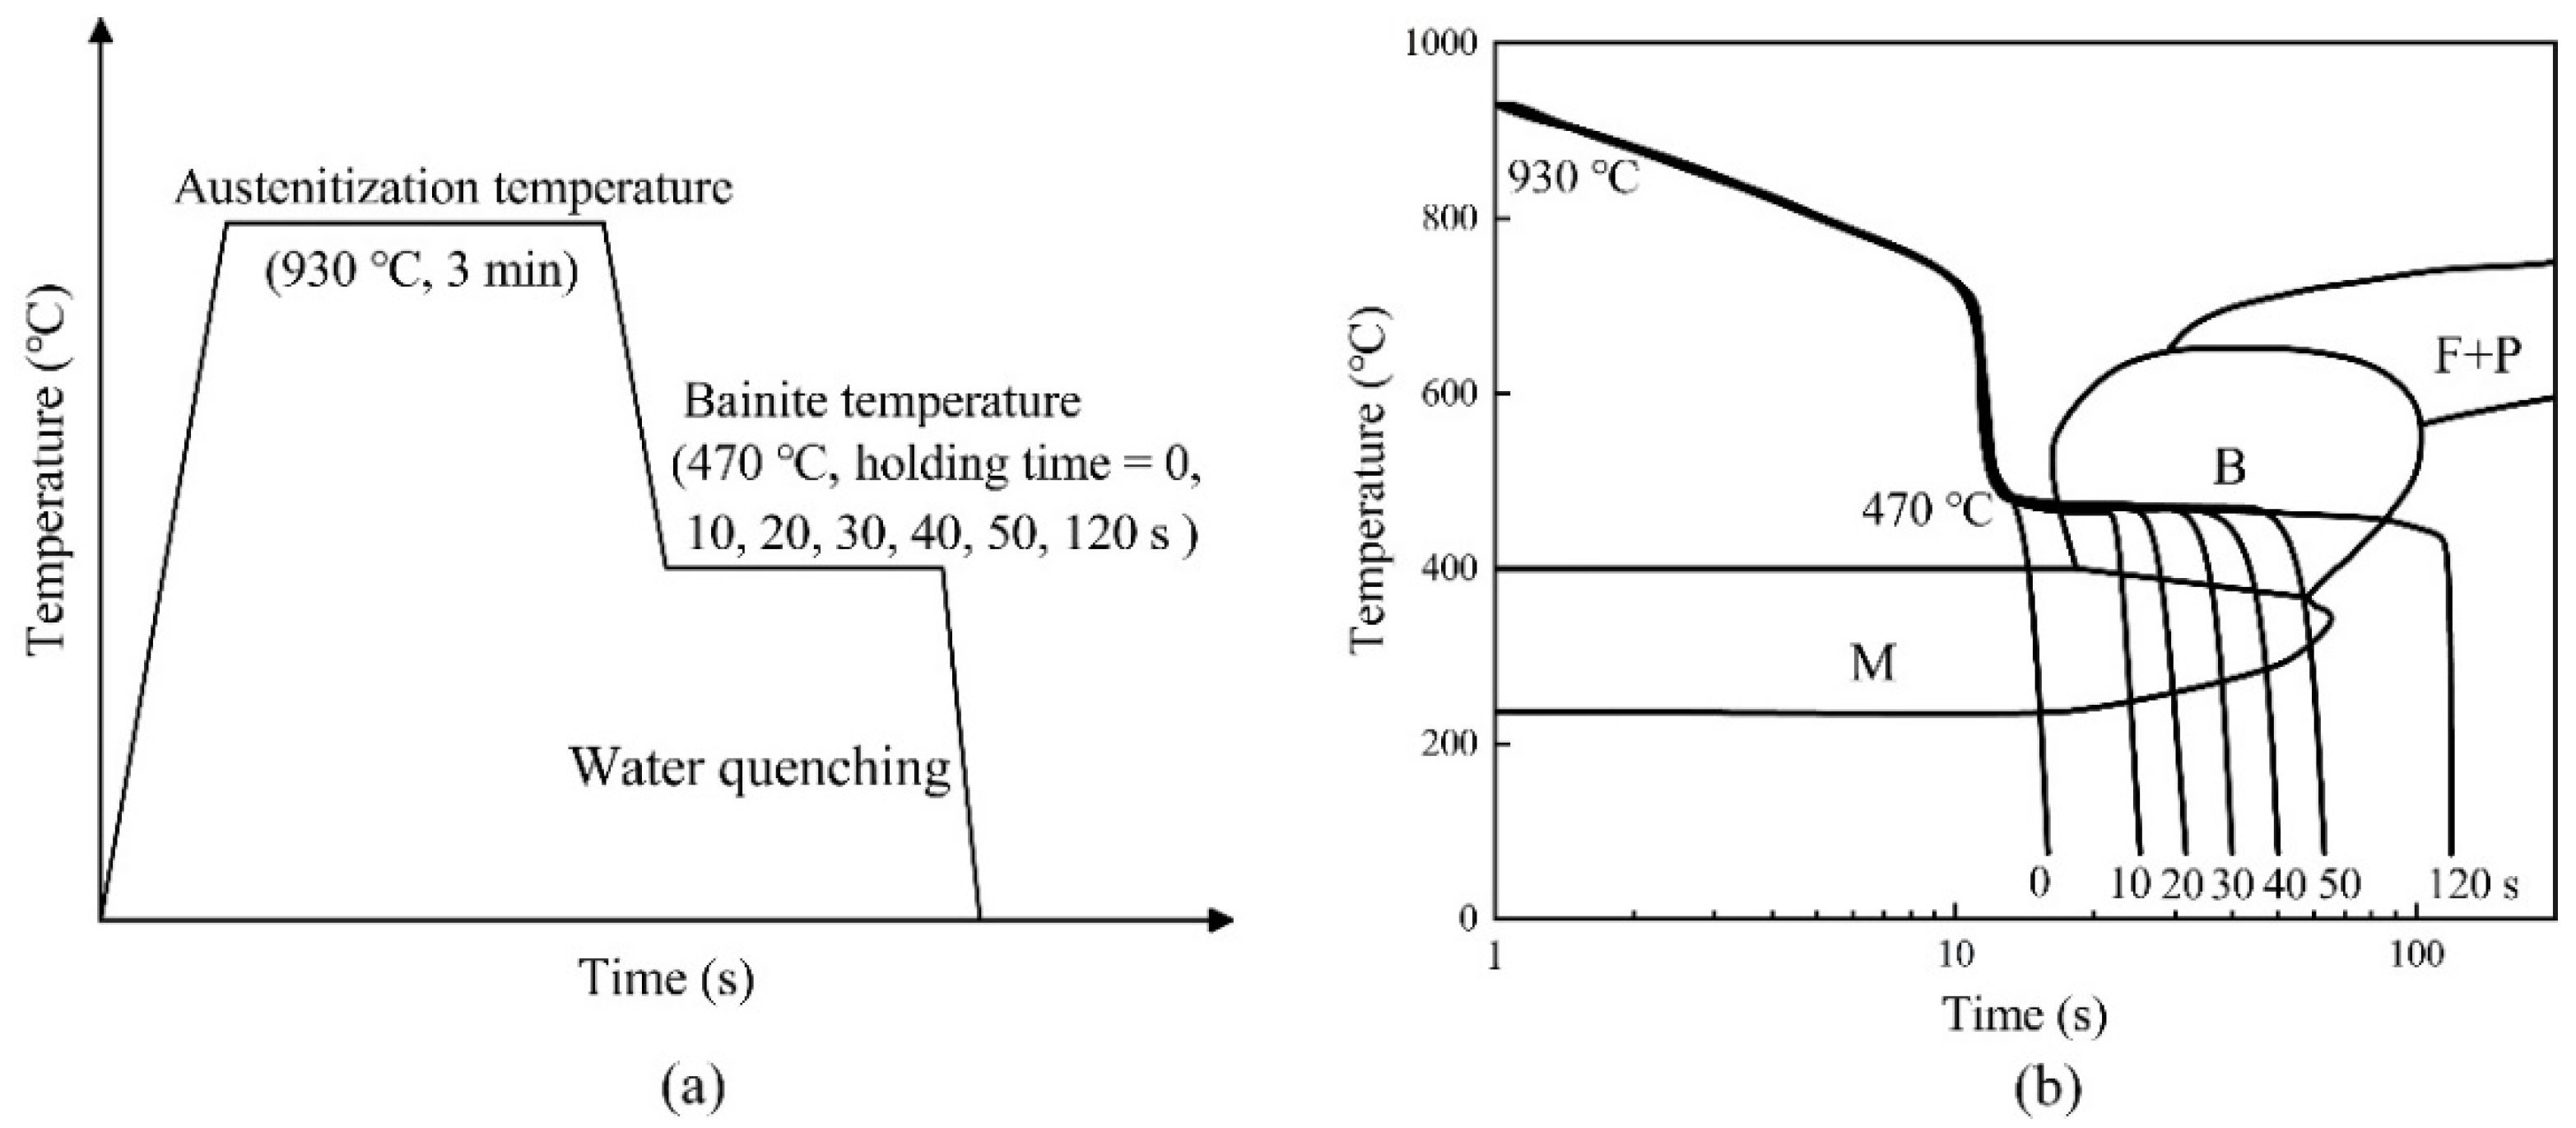
Figure 1.
Heat treatment process in this study: (a) schematic diagram of heat-treatment procedures; (b) schematic diagram of time-temperature cycles with 22MnB5 CCT.
Figure 1.
Heat treatment process in this study: (a) schematic diagram of heat-treatment procedures; (b) schematic diagram of time-temperature cycles with 22MnB5 CCT.
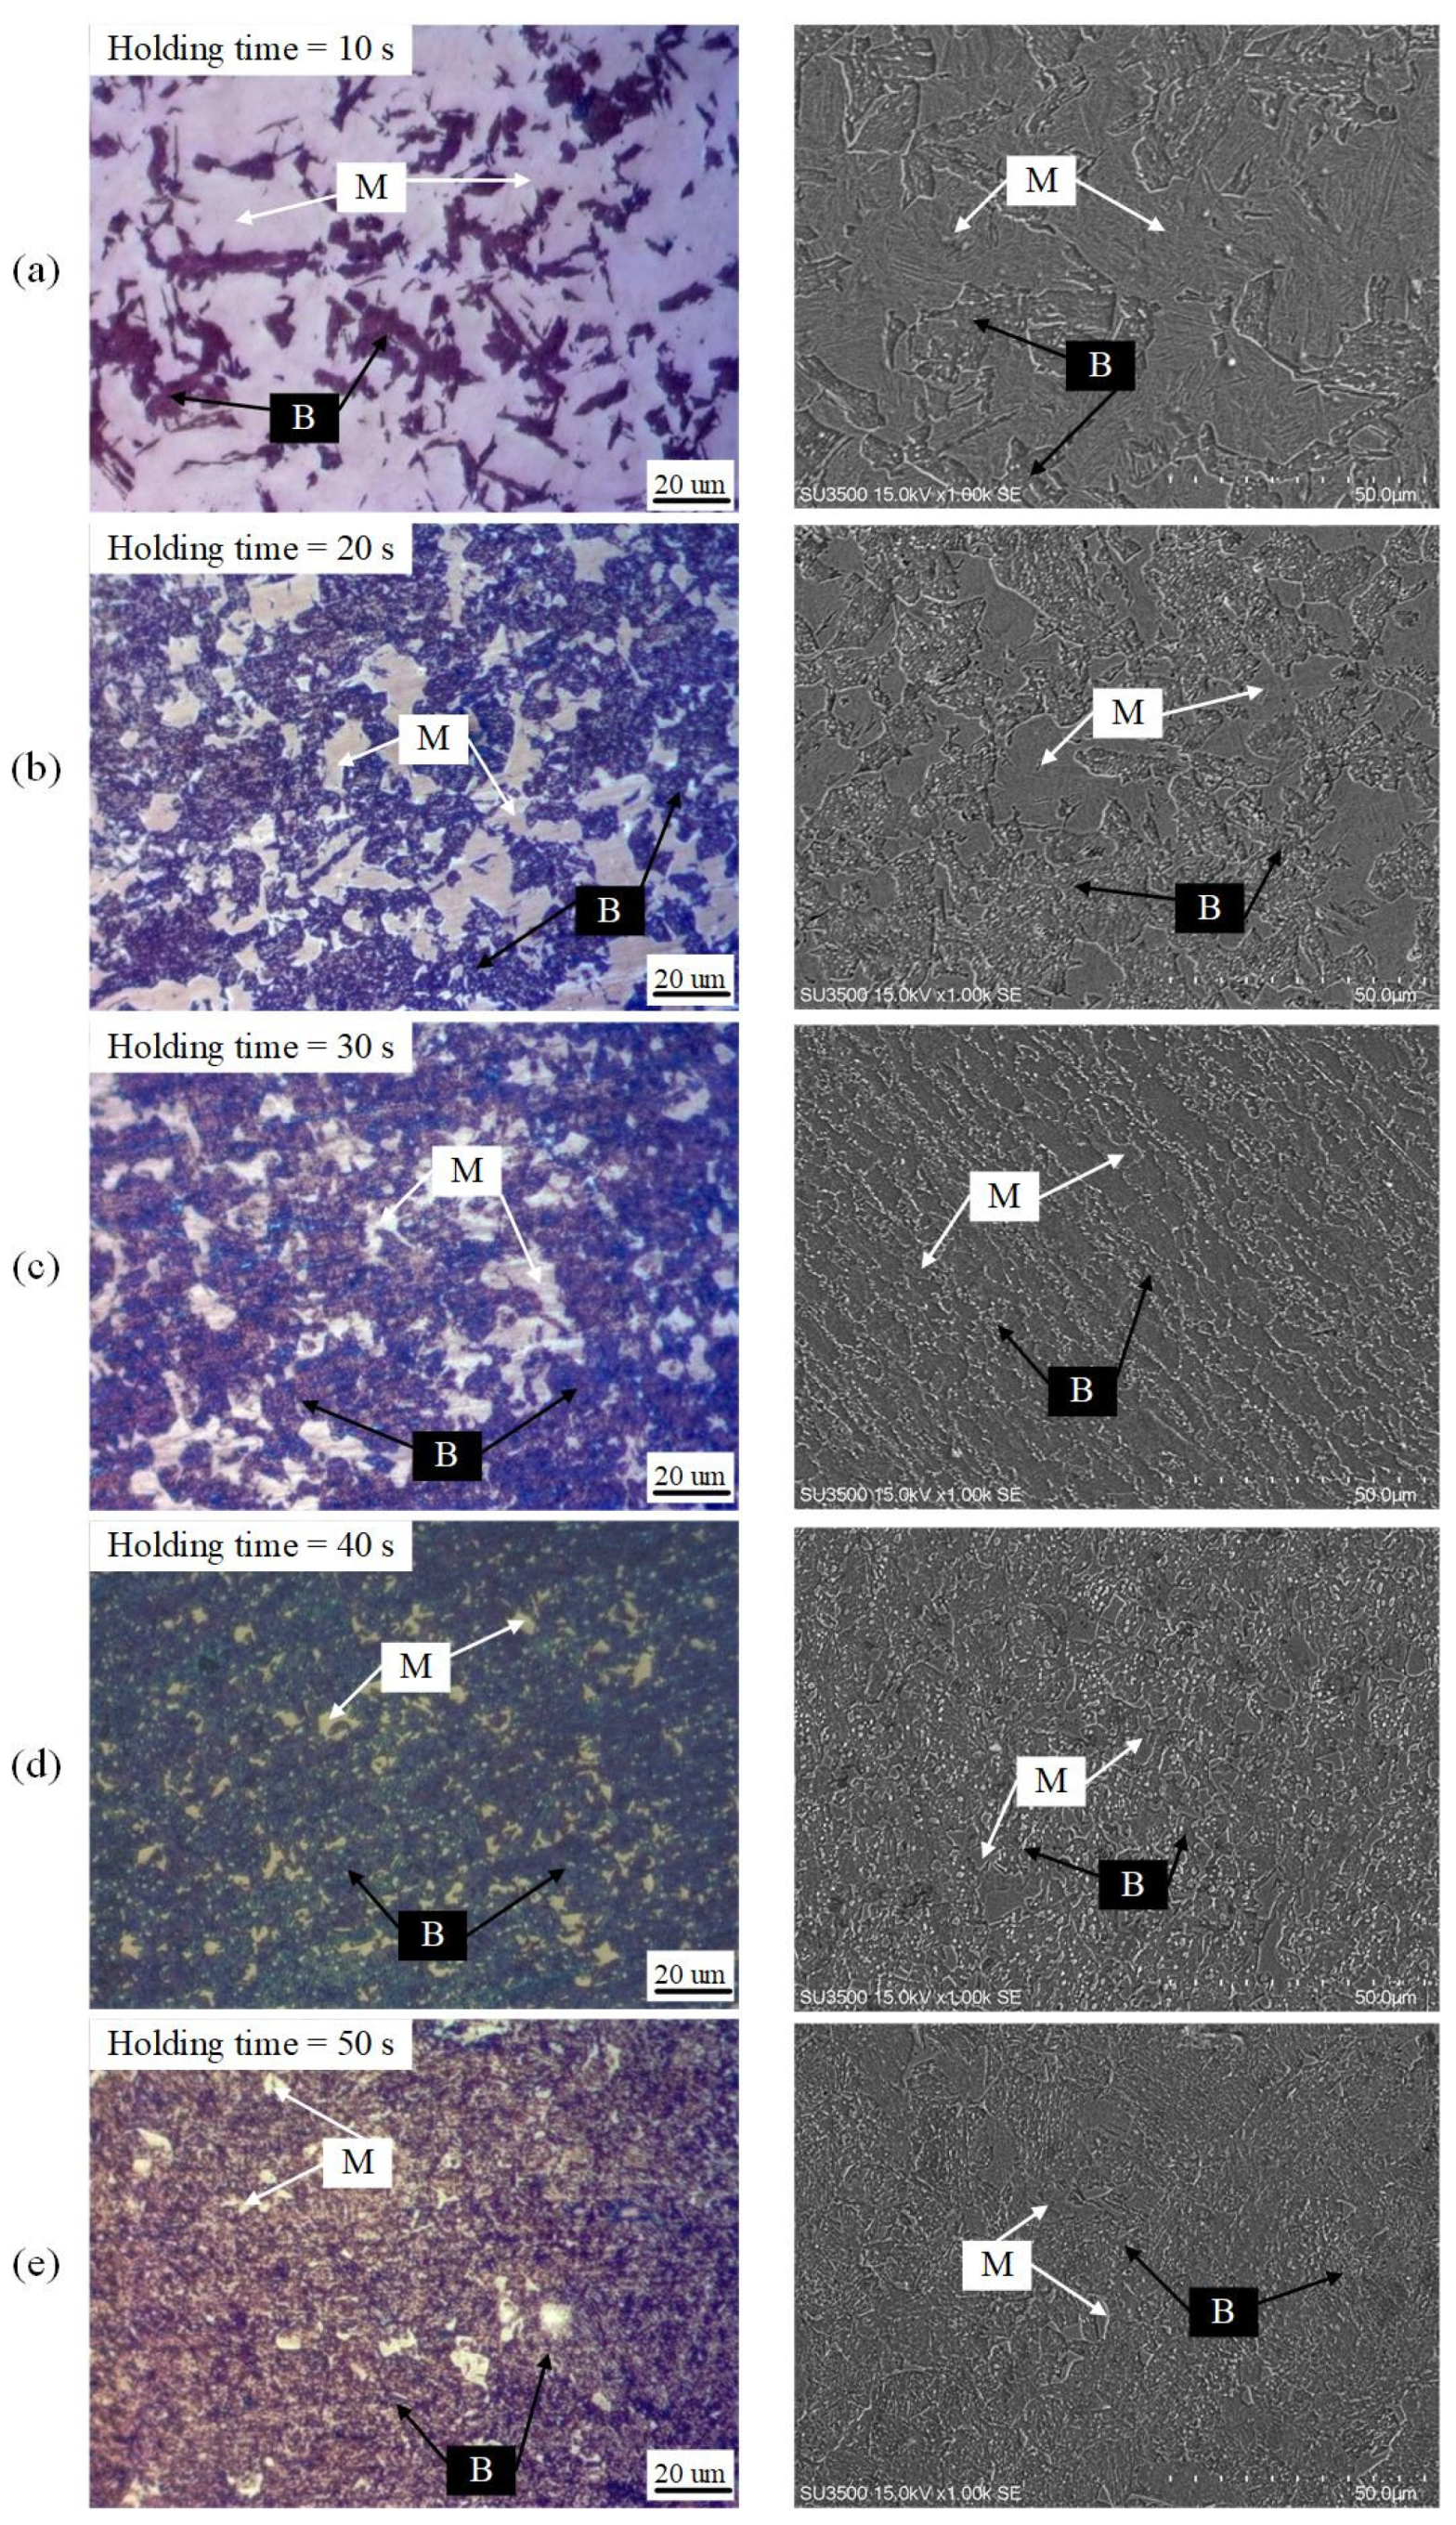
Figure 2.
Optical micrographs (left) and SEM images (right) of heat-treated samples with varying holding times (a) 10 s, (b) 20 s, (c) 30 s, (d) 40 s, and (e) 50 s (In the figure, B and M represent bainite and martensite, respectively.).
Figure 2.
Optical micrographs (left) and SEM images (right) of heat-treated samples with varying holding times (a) 10 s, (b) 20 s, (c) 30 s, (d) 40 s, and (e) 50 s (In the figure, B and M represent bainite and martensite, respectively.).
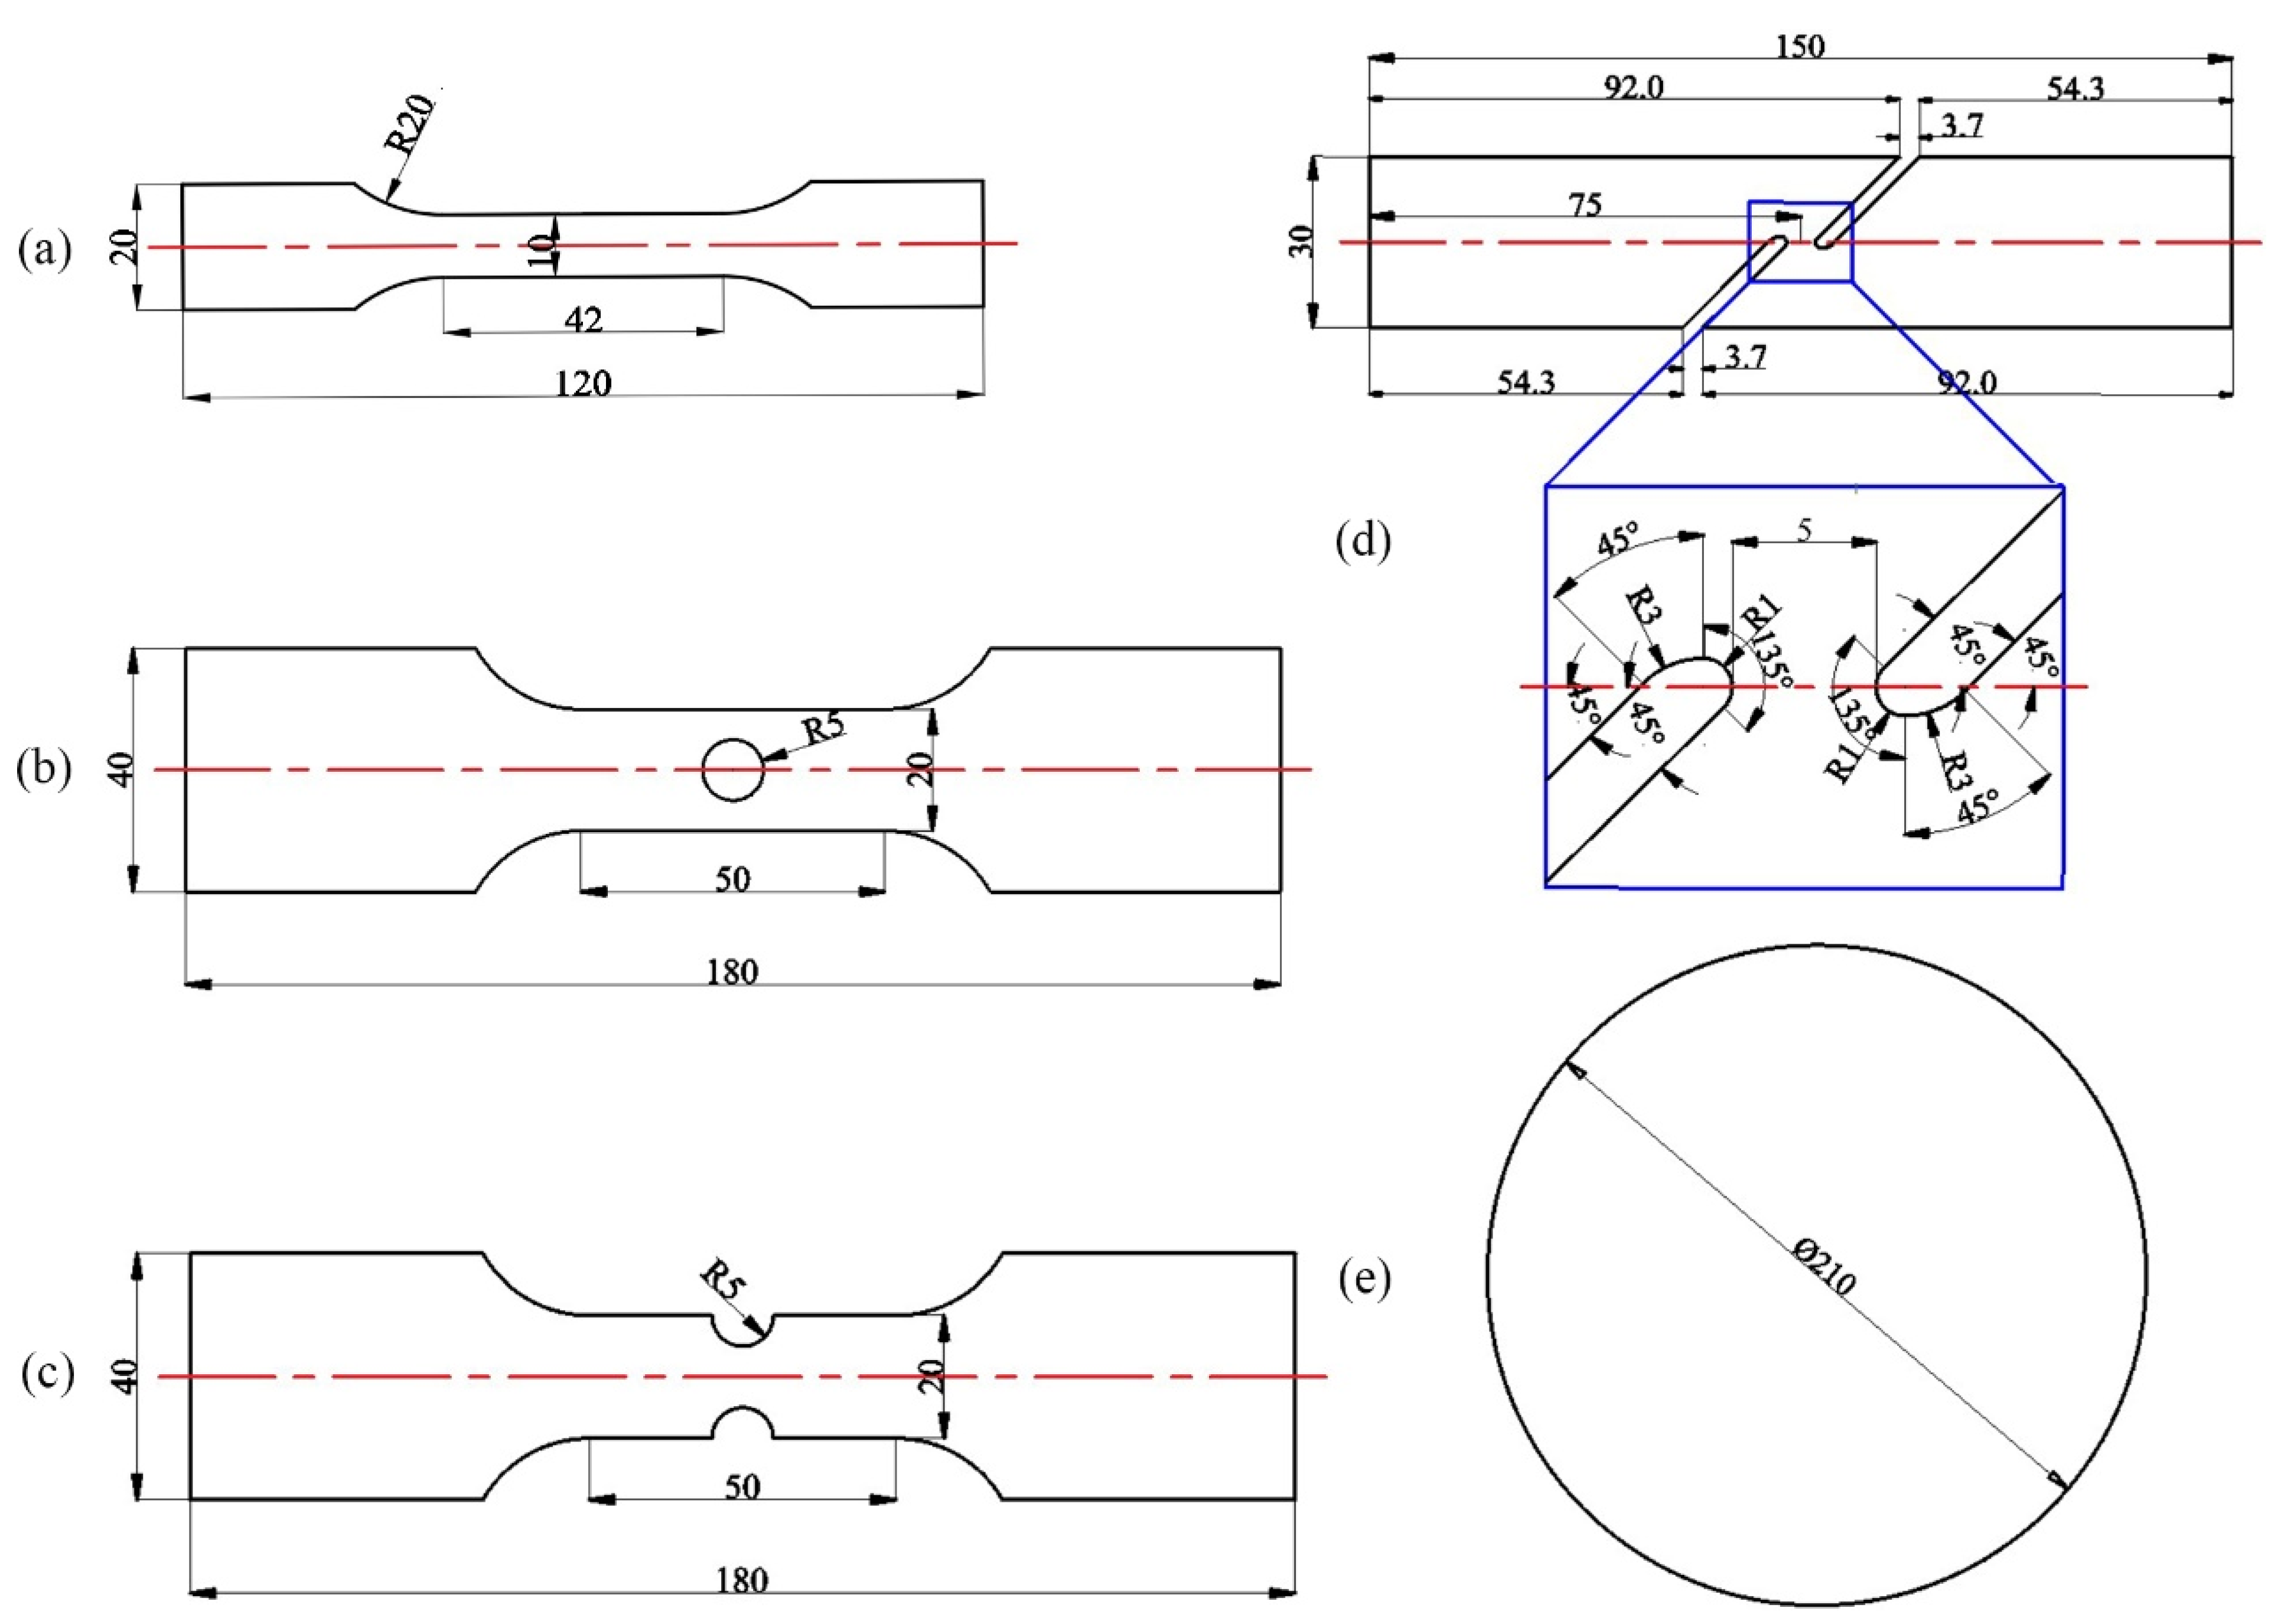
Figure 3.
Geometrical dimension of five tensile specimens: (a) dogbone; (b) central hole; (c) notched (R5); (d) in-plane shear; and (e) Nakajima (Units: mm).
Figure 3.
Geometrical dimension of five tensile specimens: (a) dogbone; (b) central hole; (c) notched (R5); (d) in-plane shear; and (e) Nakajima (Units: mm).
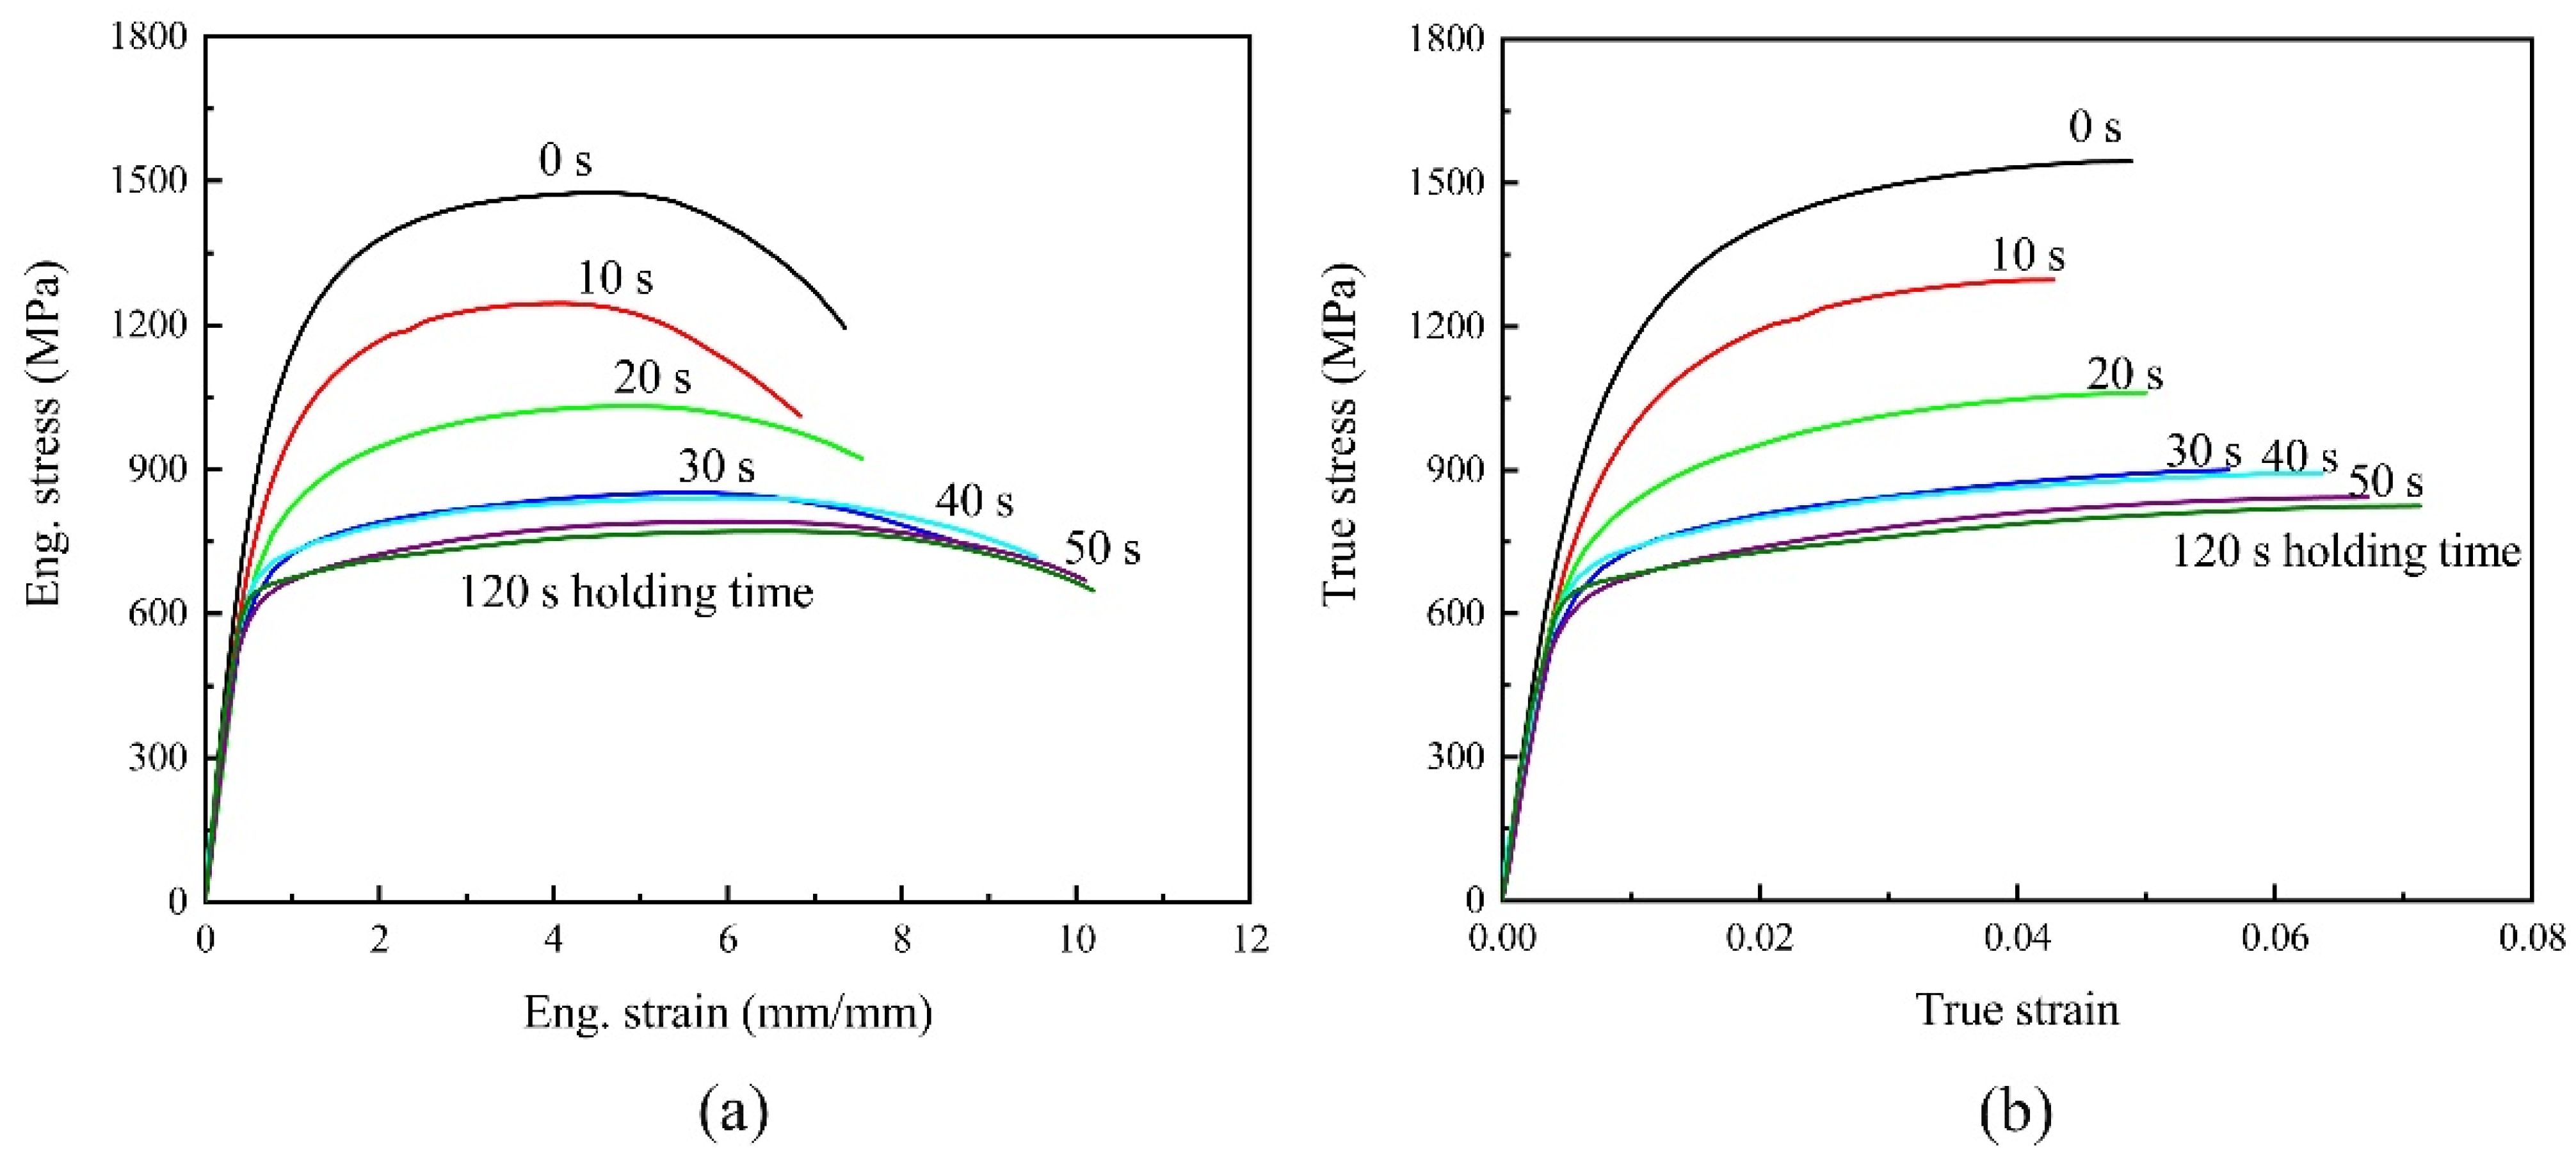
Figure 4.
Flow curves of dogbone tensile specimens with different holding times: (a) engineering stress–strain curves; (b) true stress–strain curves.
Figure 4.
Flow curves of dogbone tensile specimens with different holding times: (a) engineering stress–strain curves; (b) true stress–strain curves.
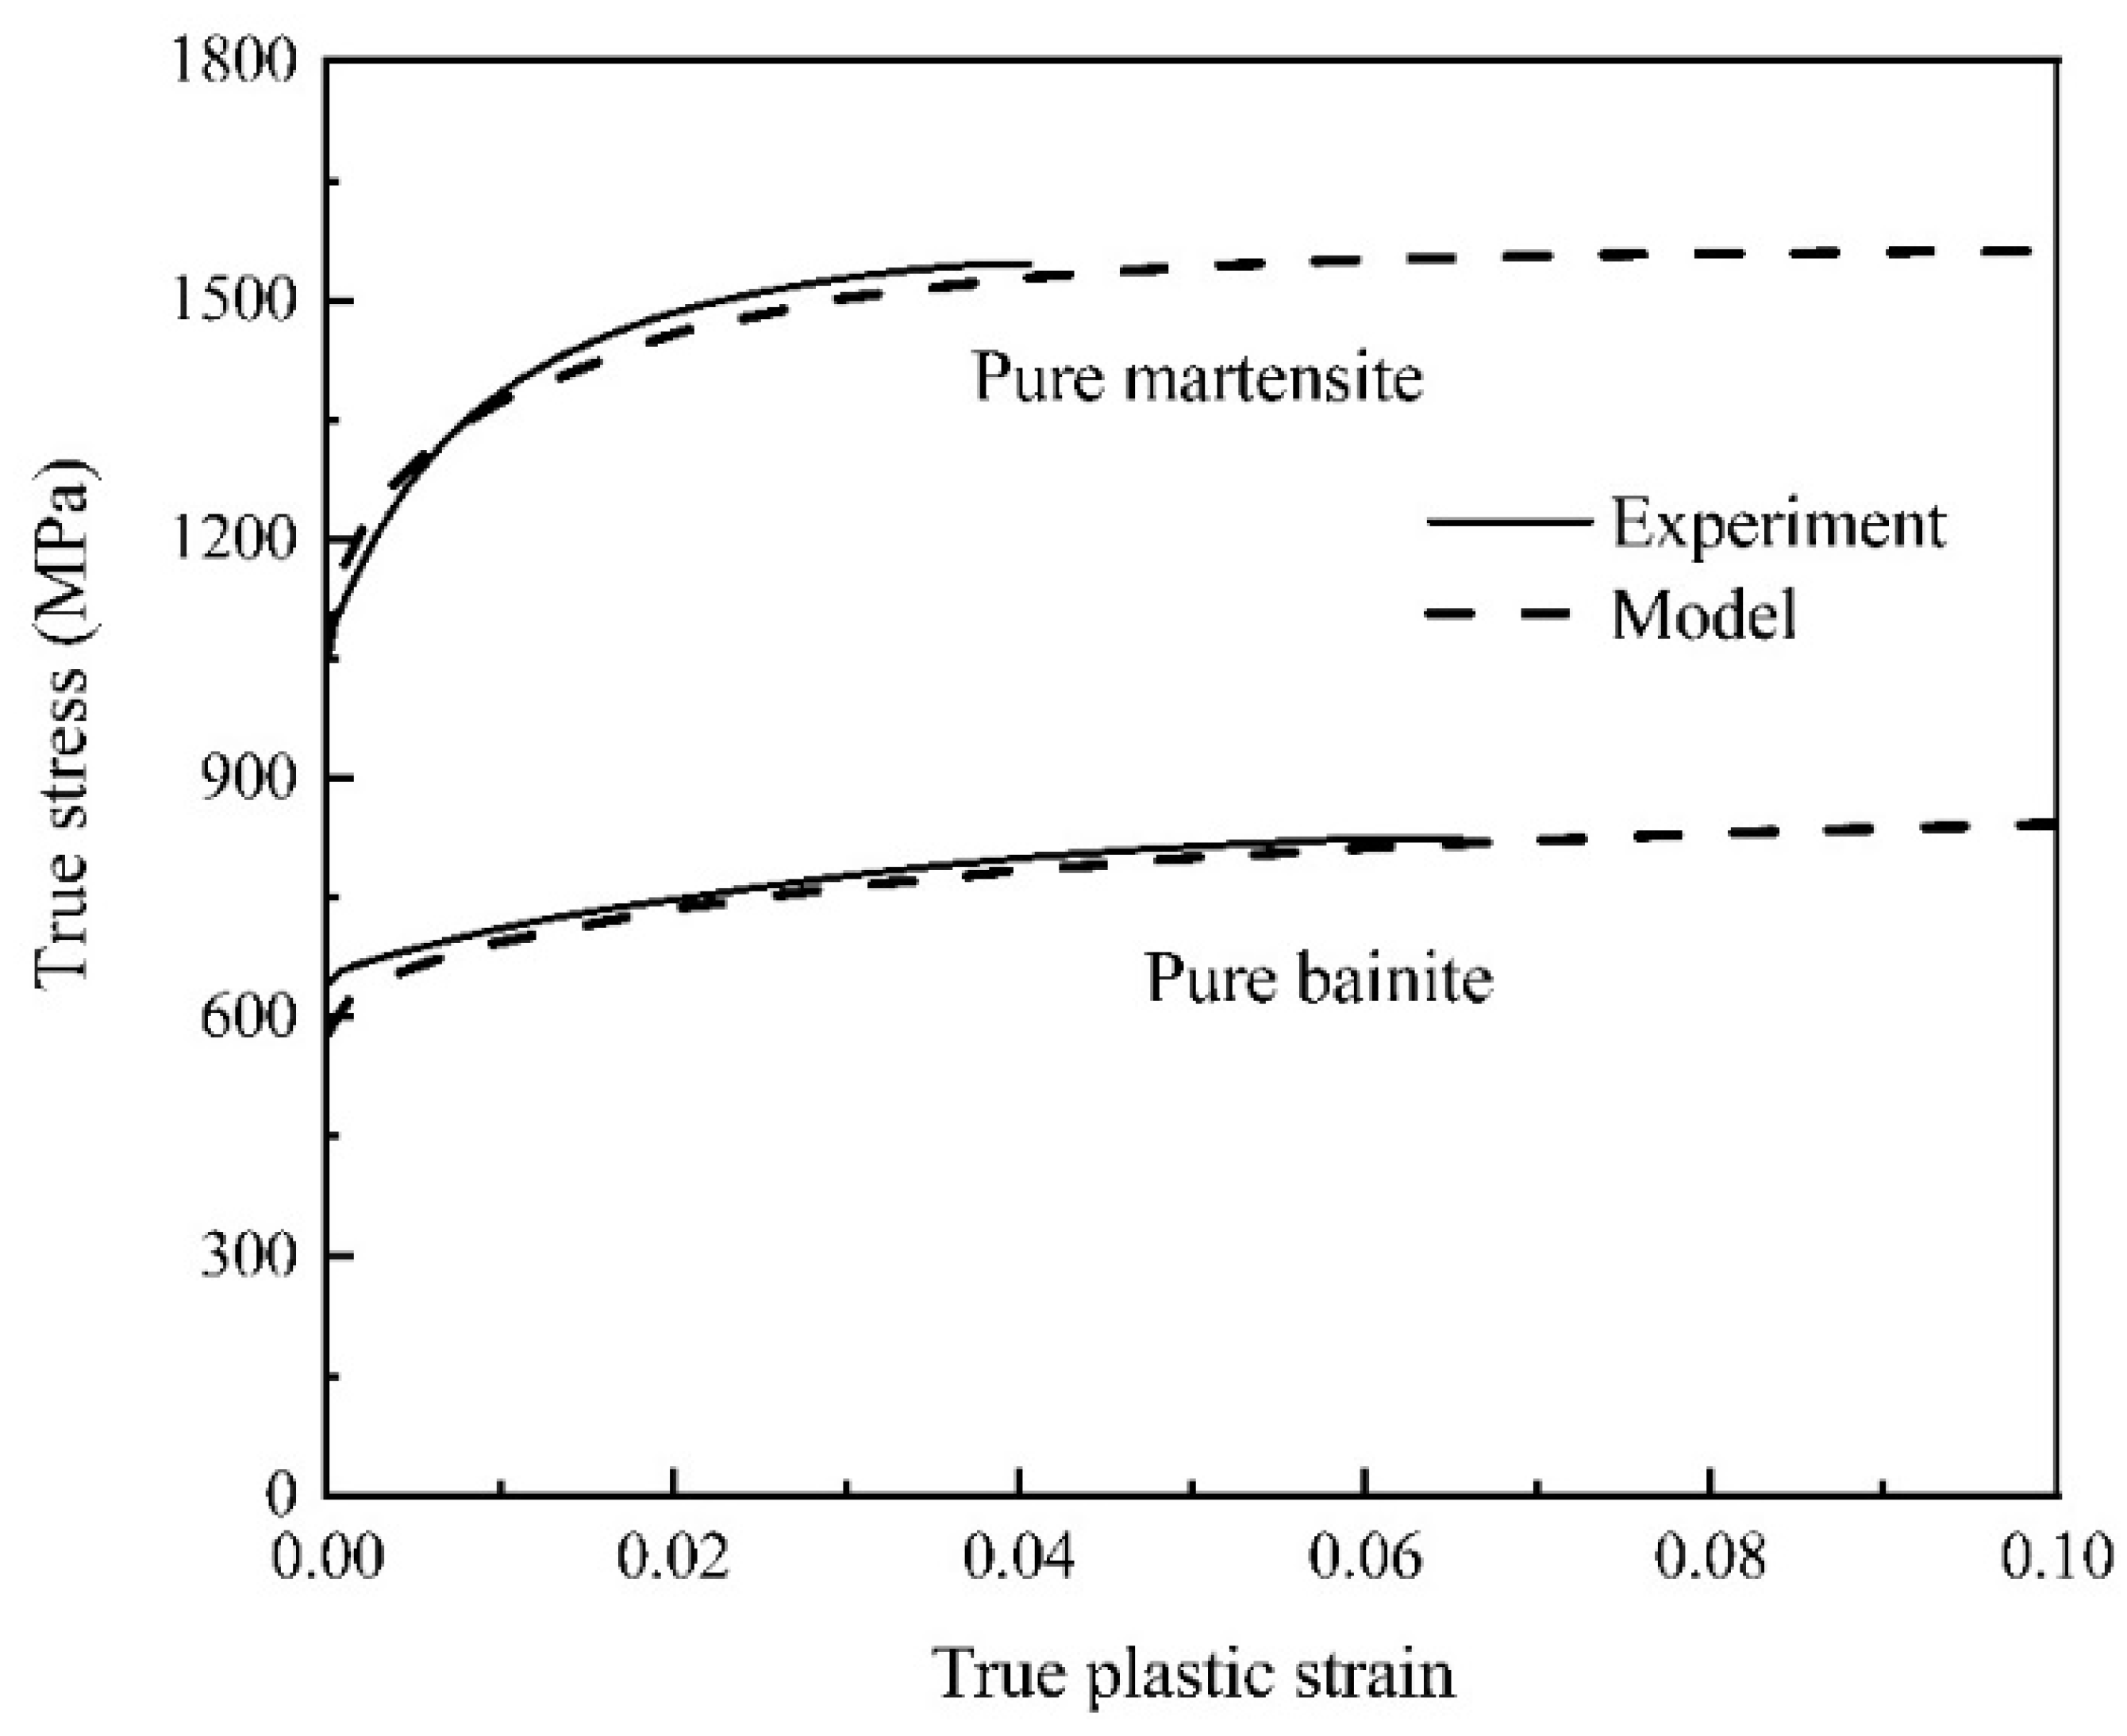
Figure 5.
Flow curves for pure martensite and pure bainite specimens were simulated and compared with experimental data (solid lines represent experimental values and dash lines represent fitting values in constitutive model).
Figure 5.
Flow curves for pure martensite and pure bainite specimens were simulated and compared with experimental data (solid lines represent experimental values and dash lines represent fitting values in constitutive model).
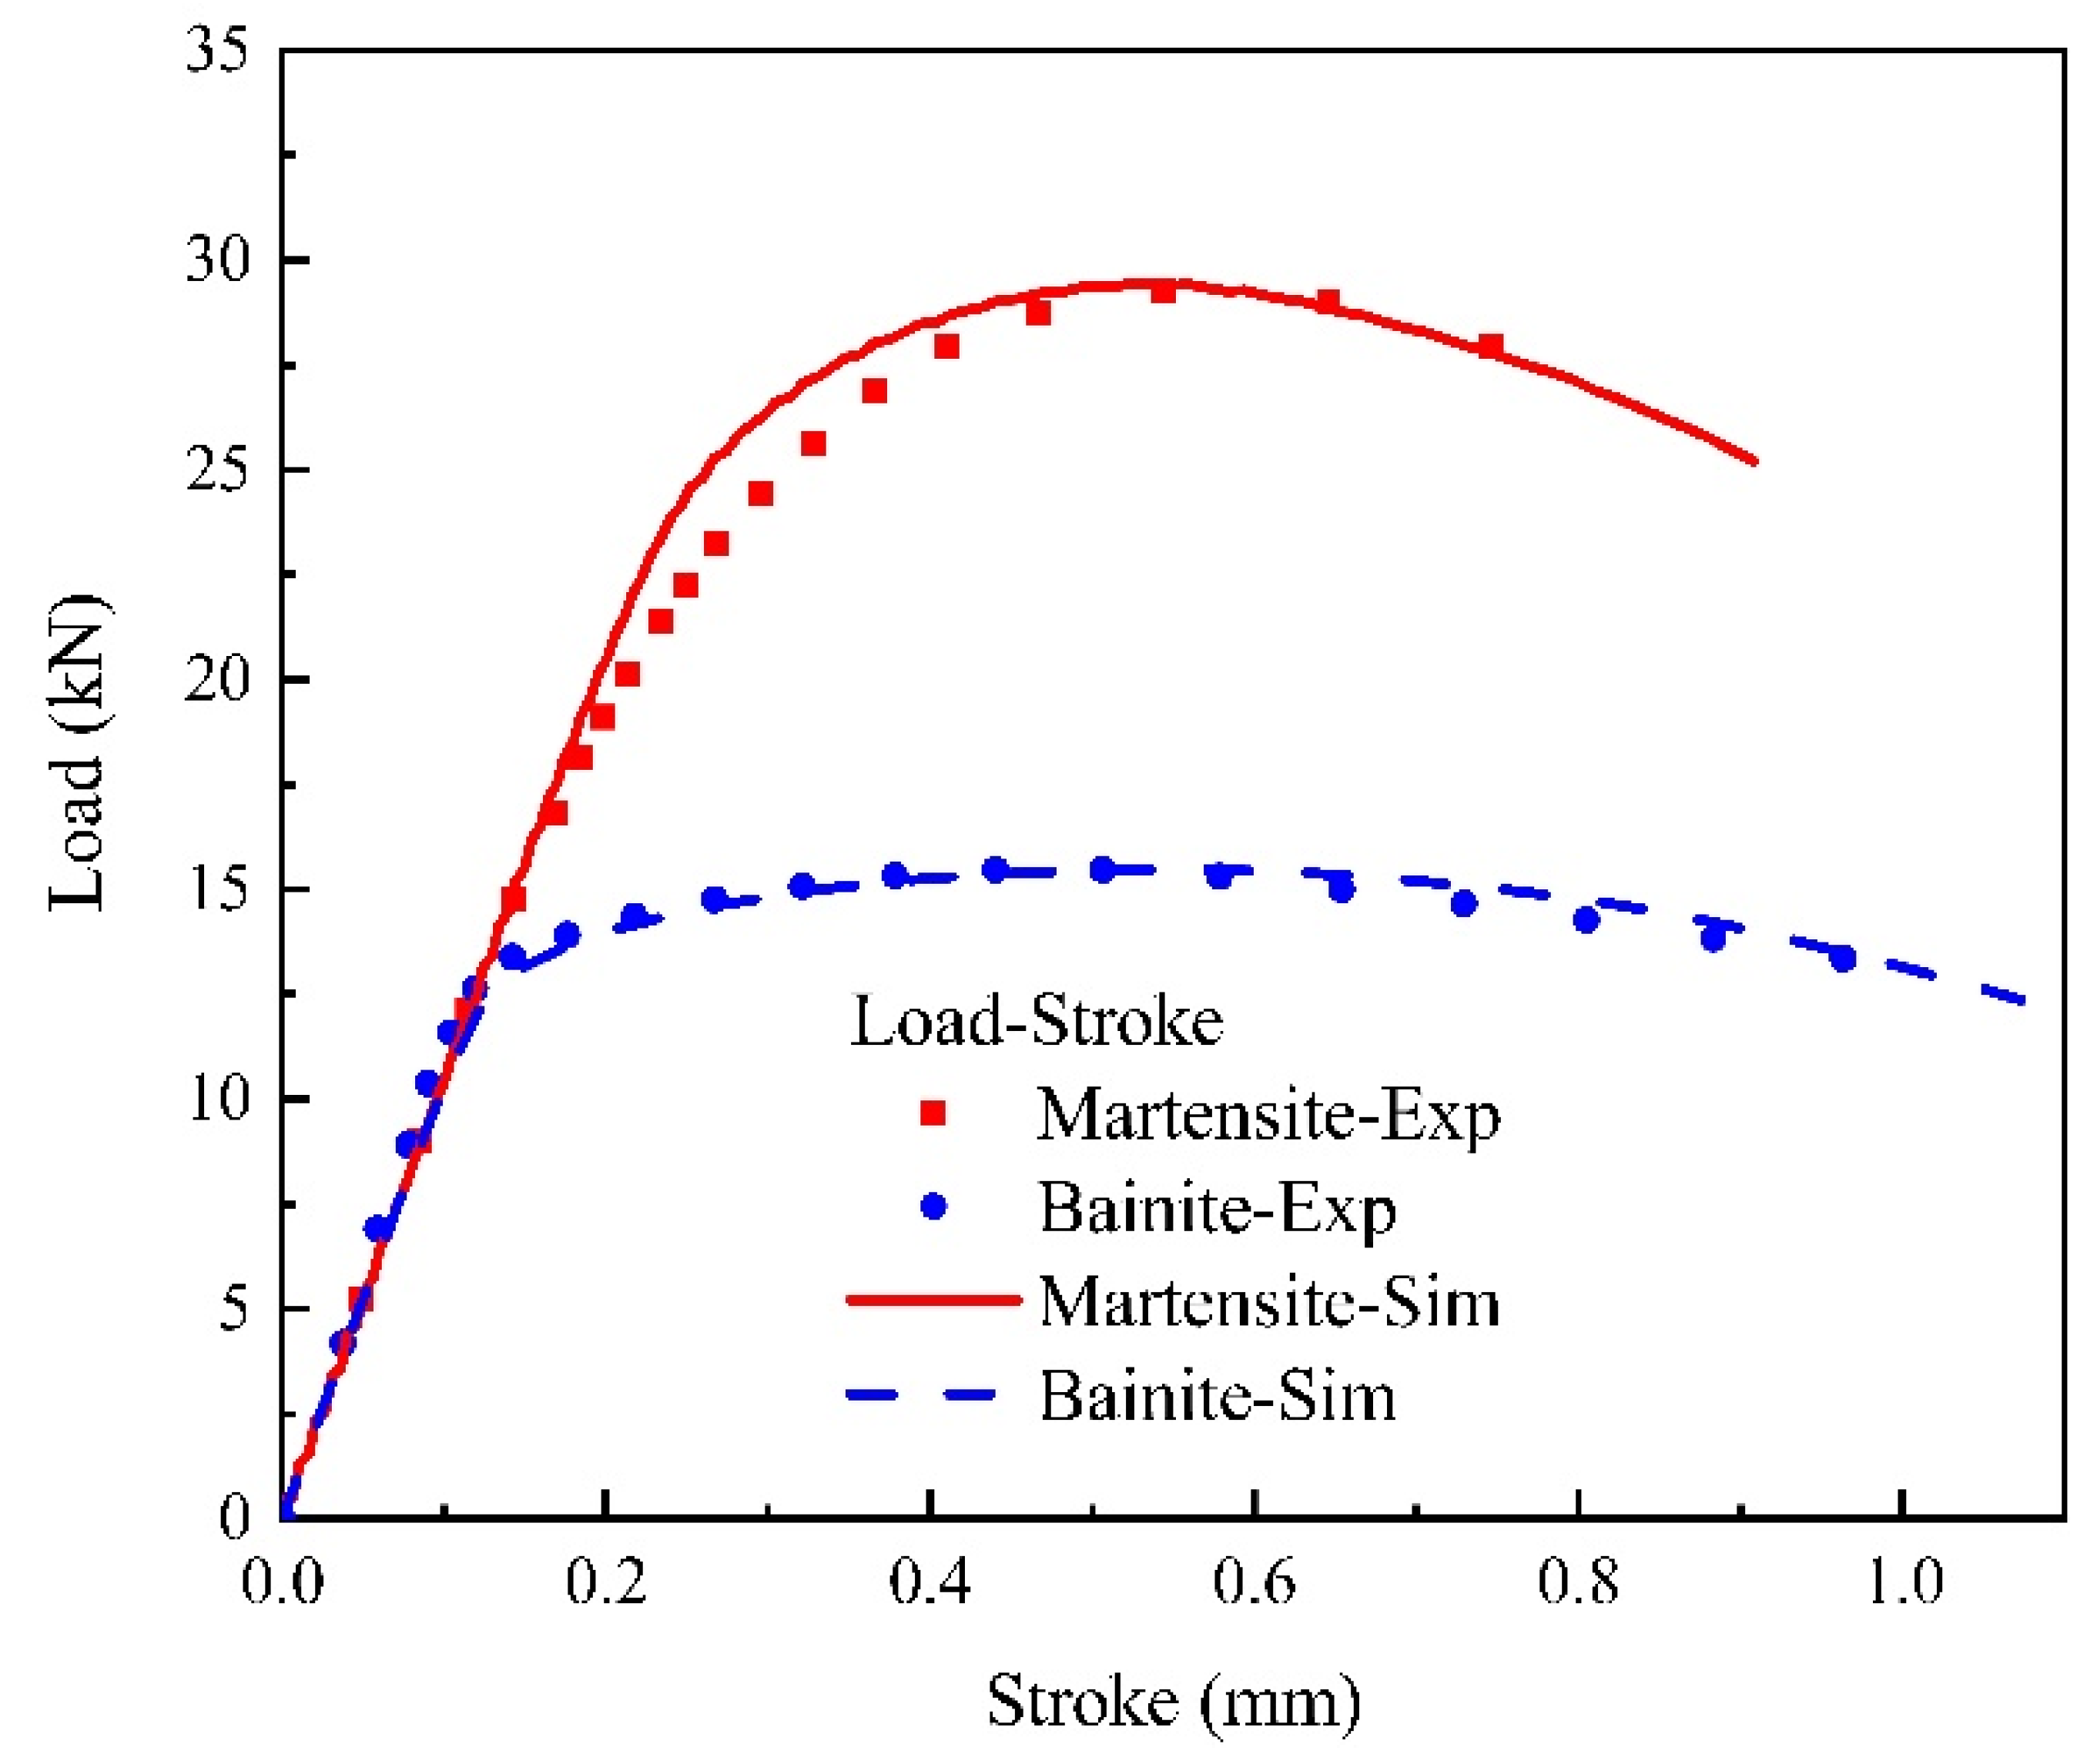
Figure 6.
Load–stroke curves comparison for martensite and bainite specimens, respectively (experiment vs. simulation).
Figure 6.
Load–stroke curves comparison for martensite and bainite specimens, respectively (experiment vs. simulation).
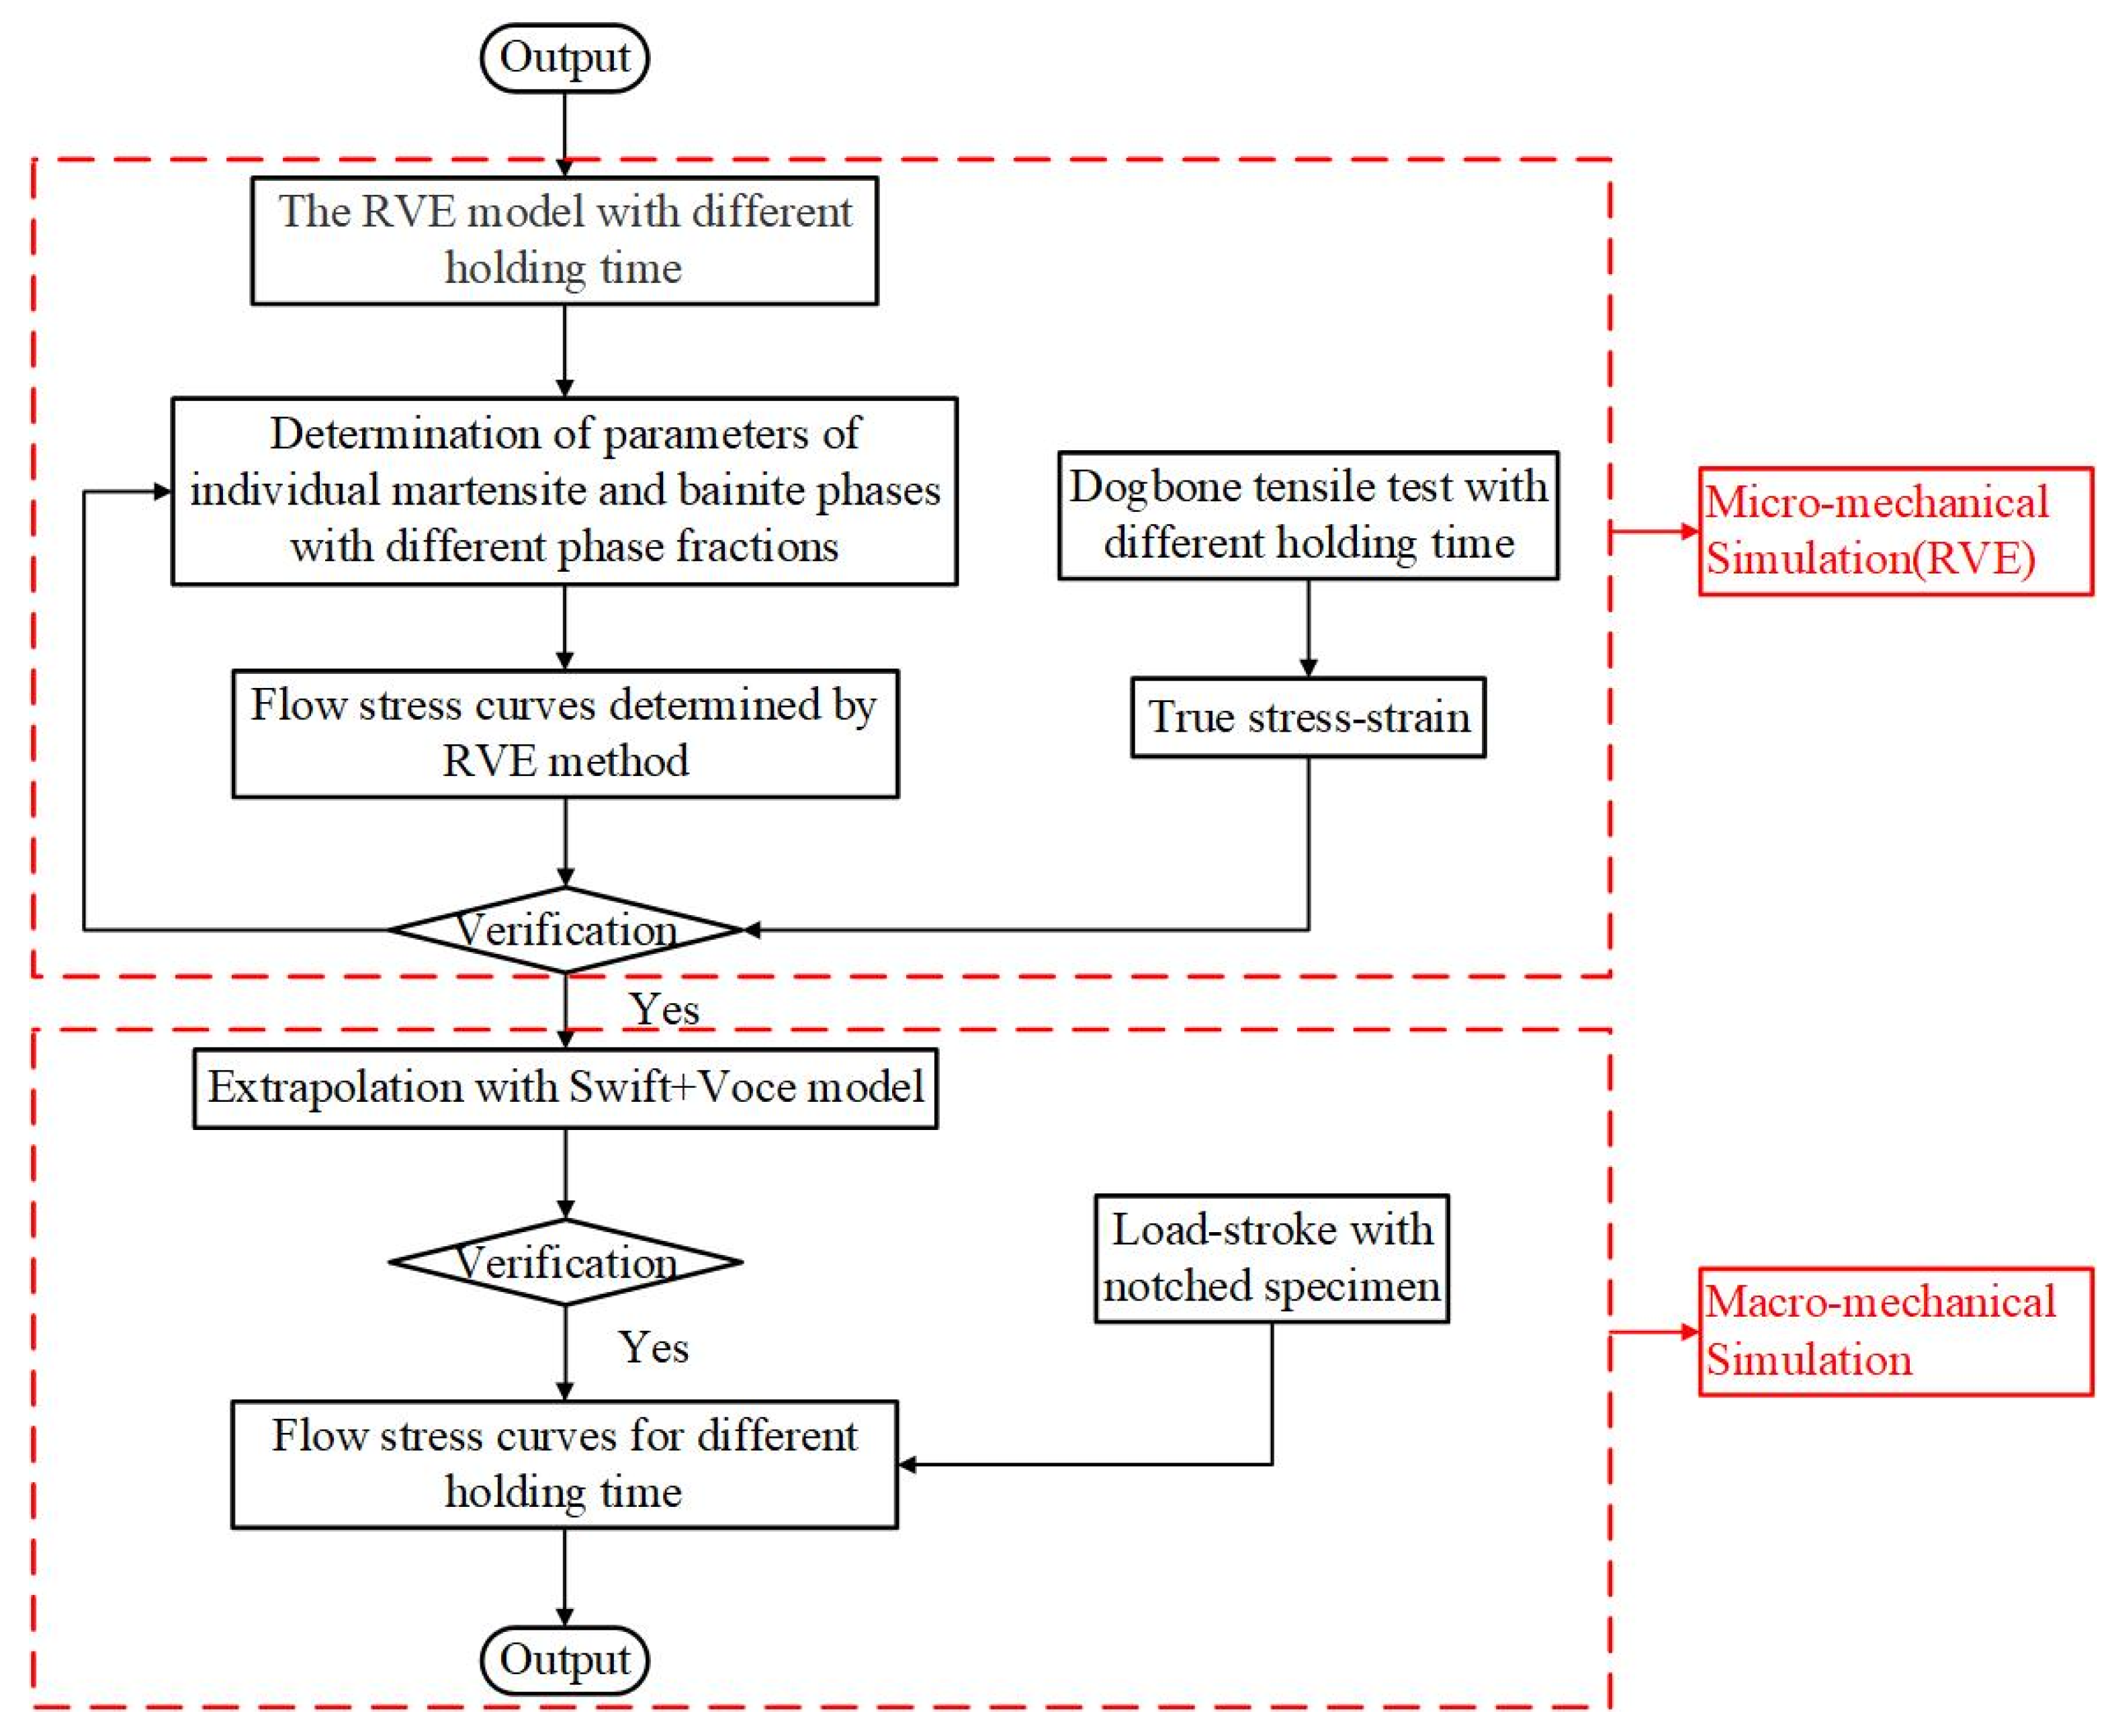
Figure 7.
Flowchart to determine the stress–strain curves of bainite and martensite constituent phases.
Figure 7.
Flowchart to determine the stress–strain curves of bainite and martensite constituent phases.
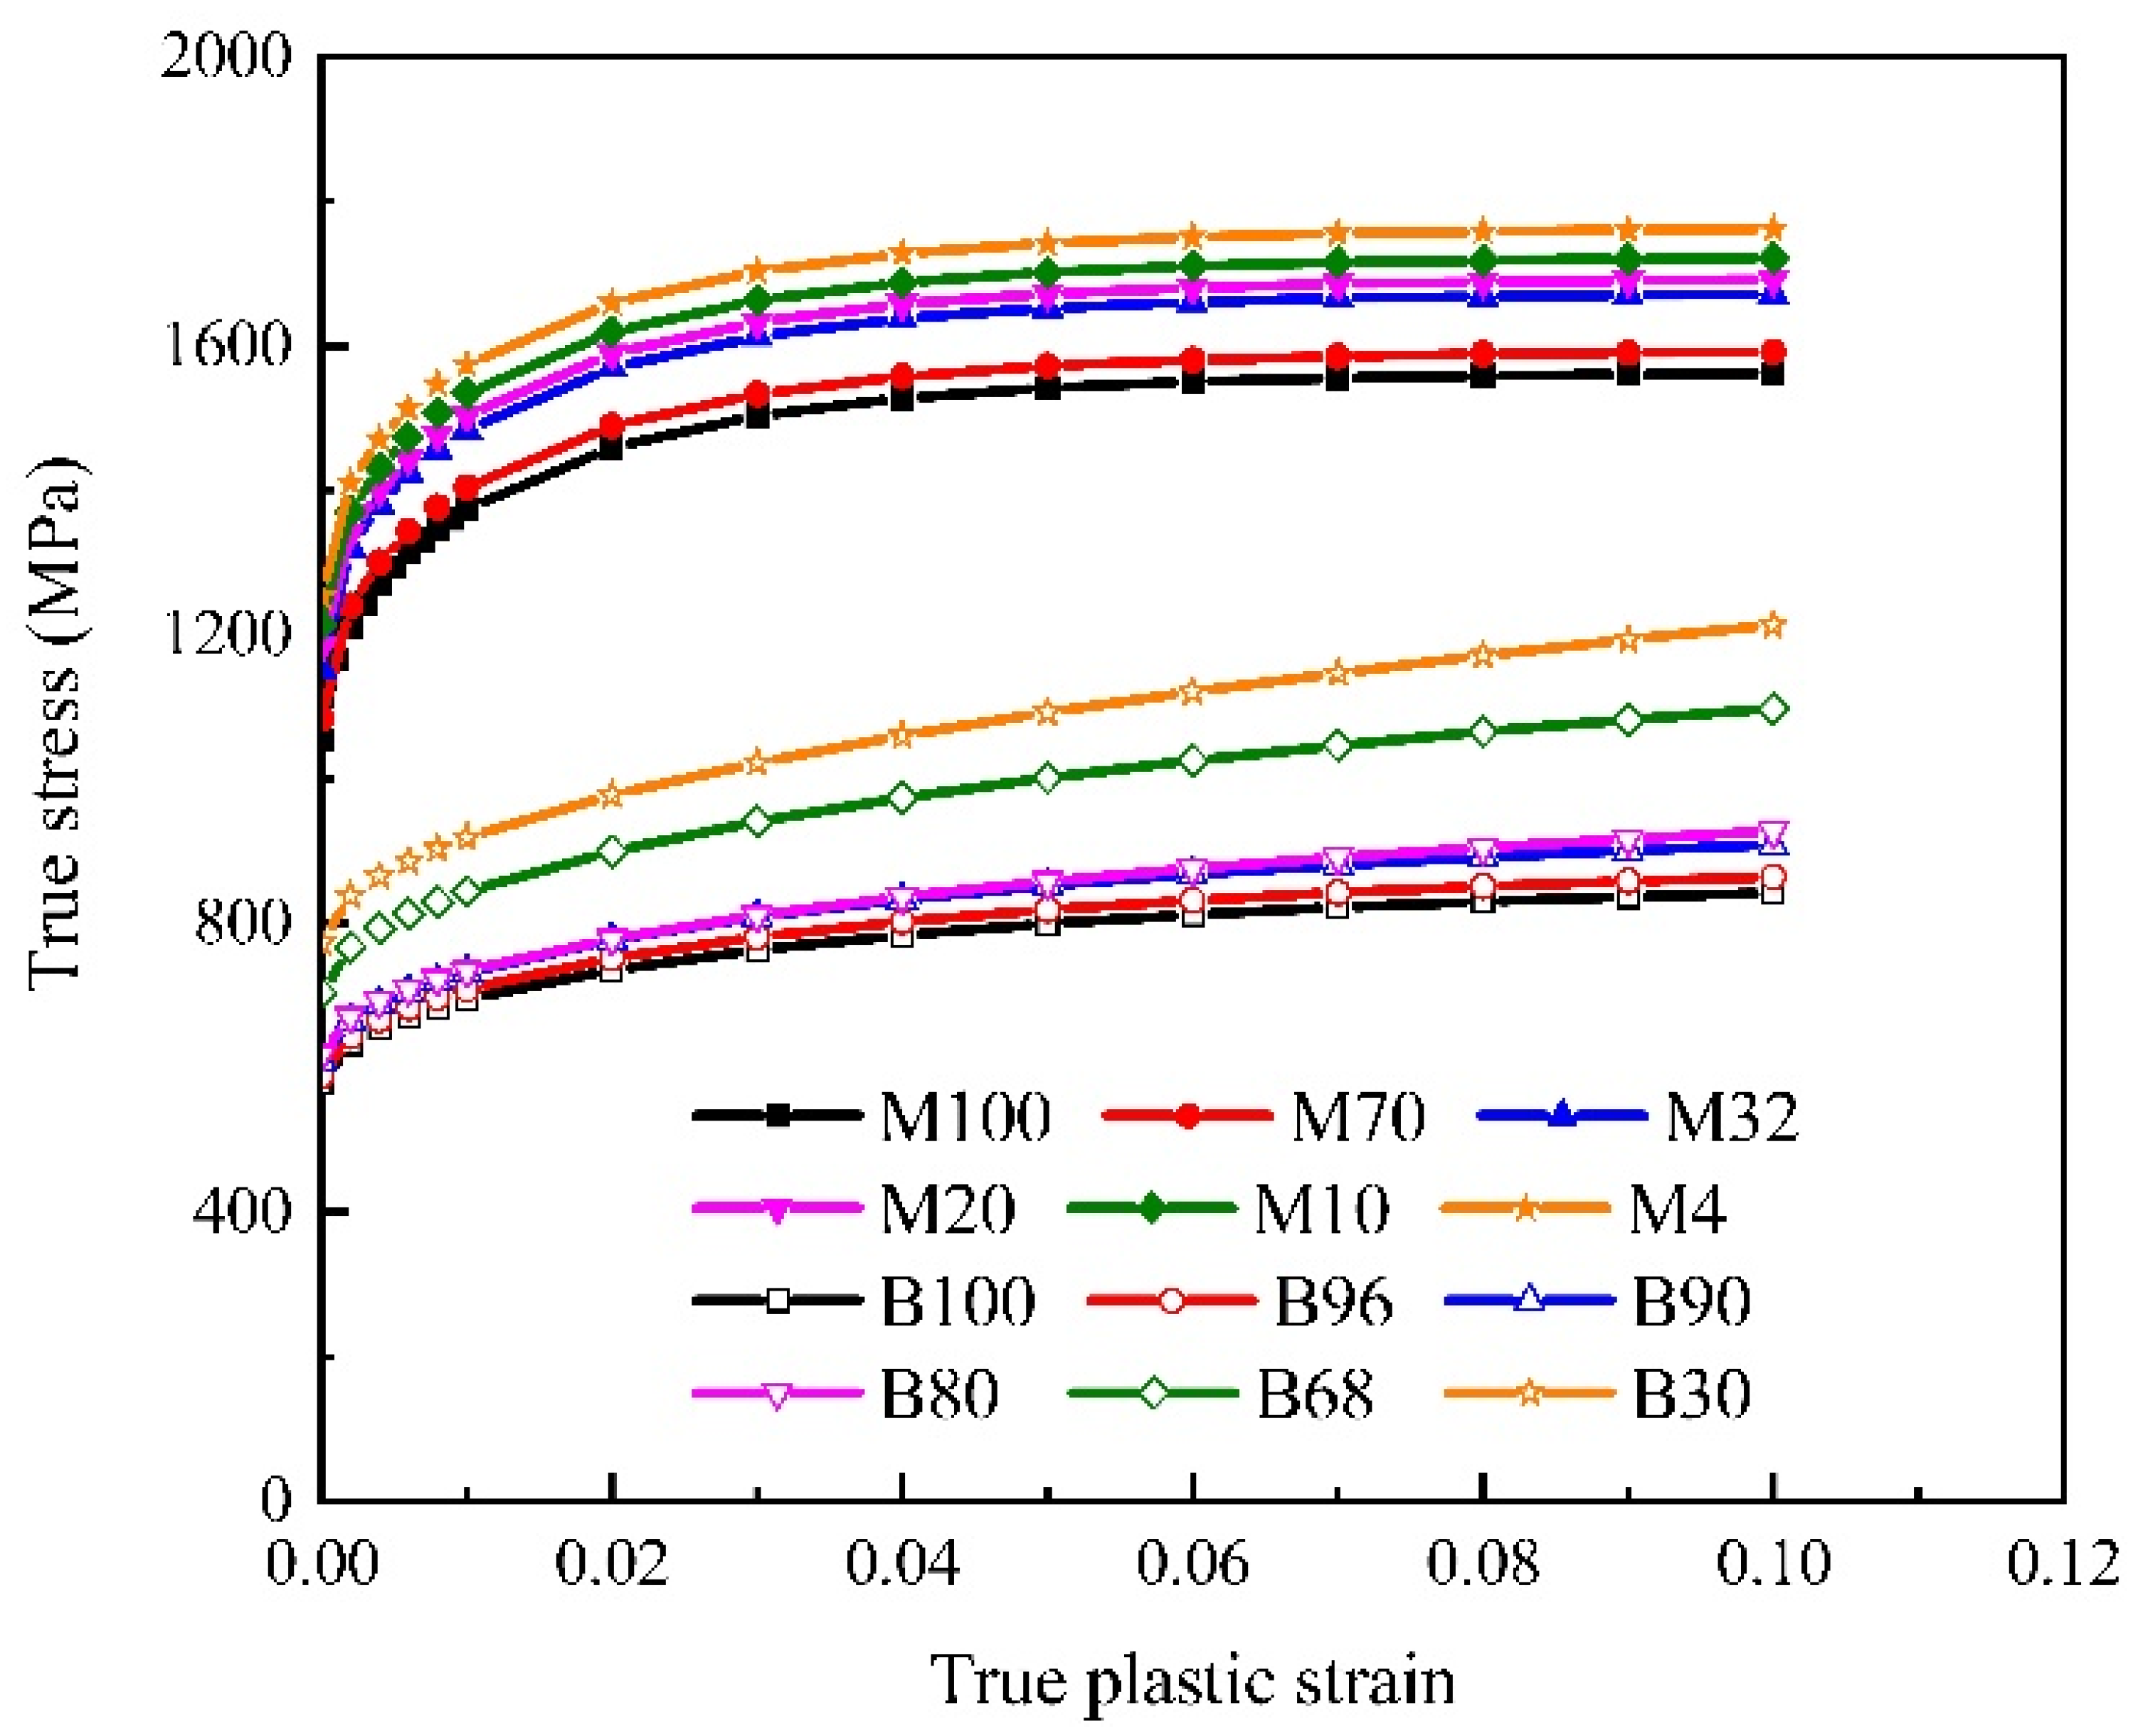
Figure 8.
Flow curve predictions of the specimens with varying B/M phase volume fractions.
Figure 8.
Flow curve predictions of the specimens with varying B/M phase volume fractions.
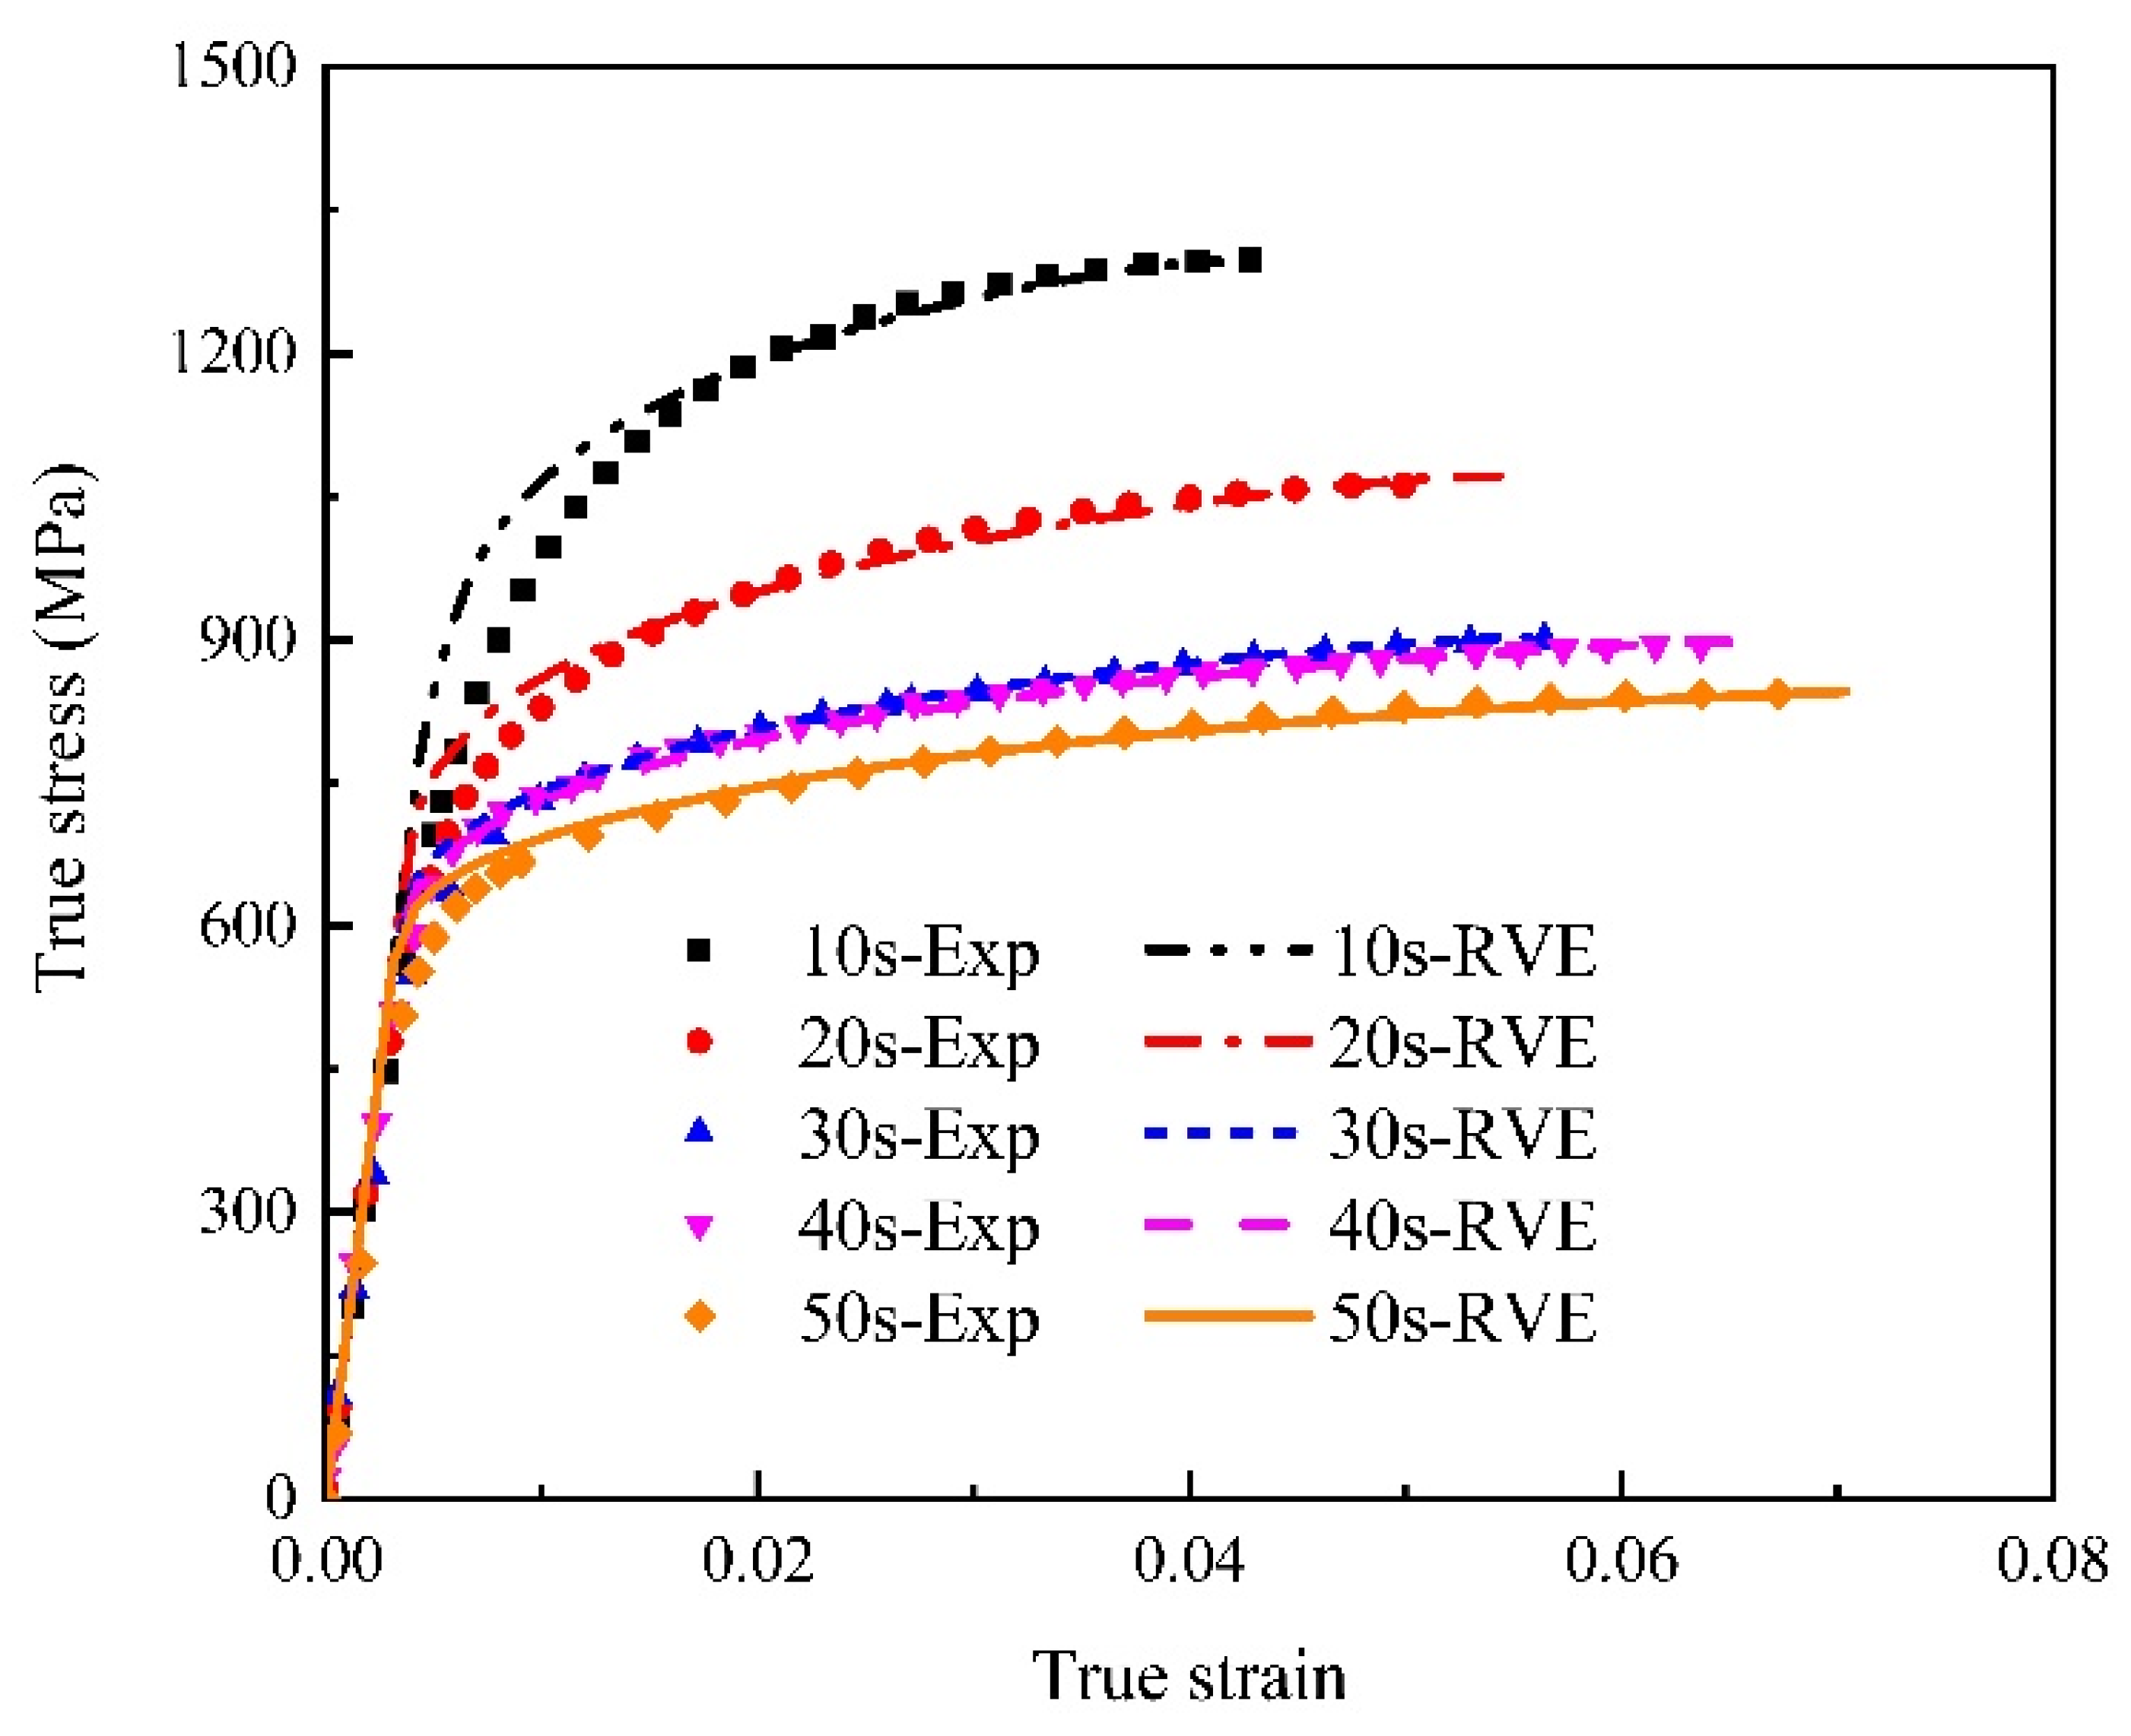
Figure 9.
Comparisons of flow curves determined by RVEs with experimental results (the dots represent experimental values and the lines represent simulated values in RVE).
Figure 9.
Comparisons of flow curves determined by RVEs with experimental results (the dots represent experimental values and the lines represent simulated values in RVE).
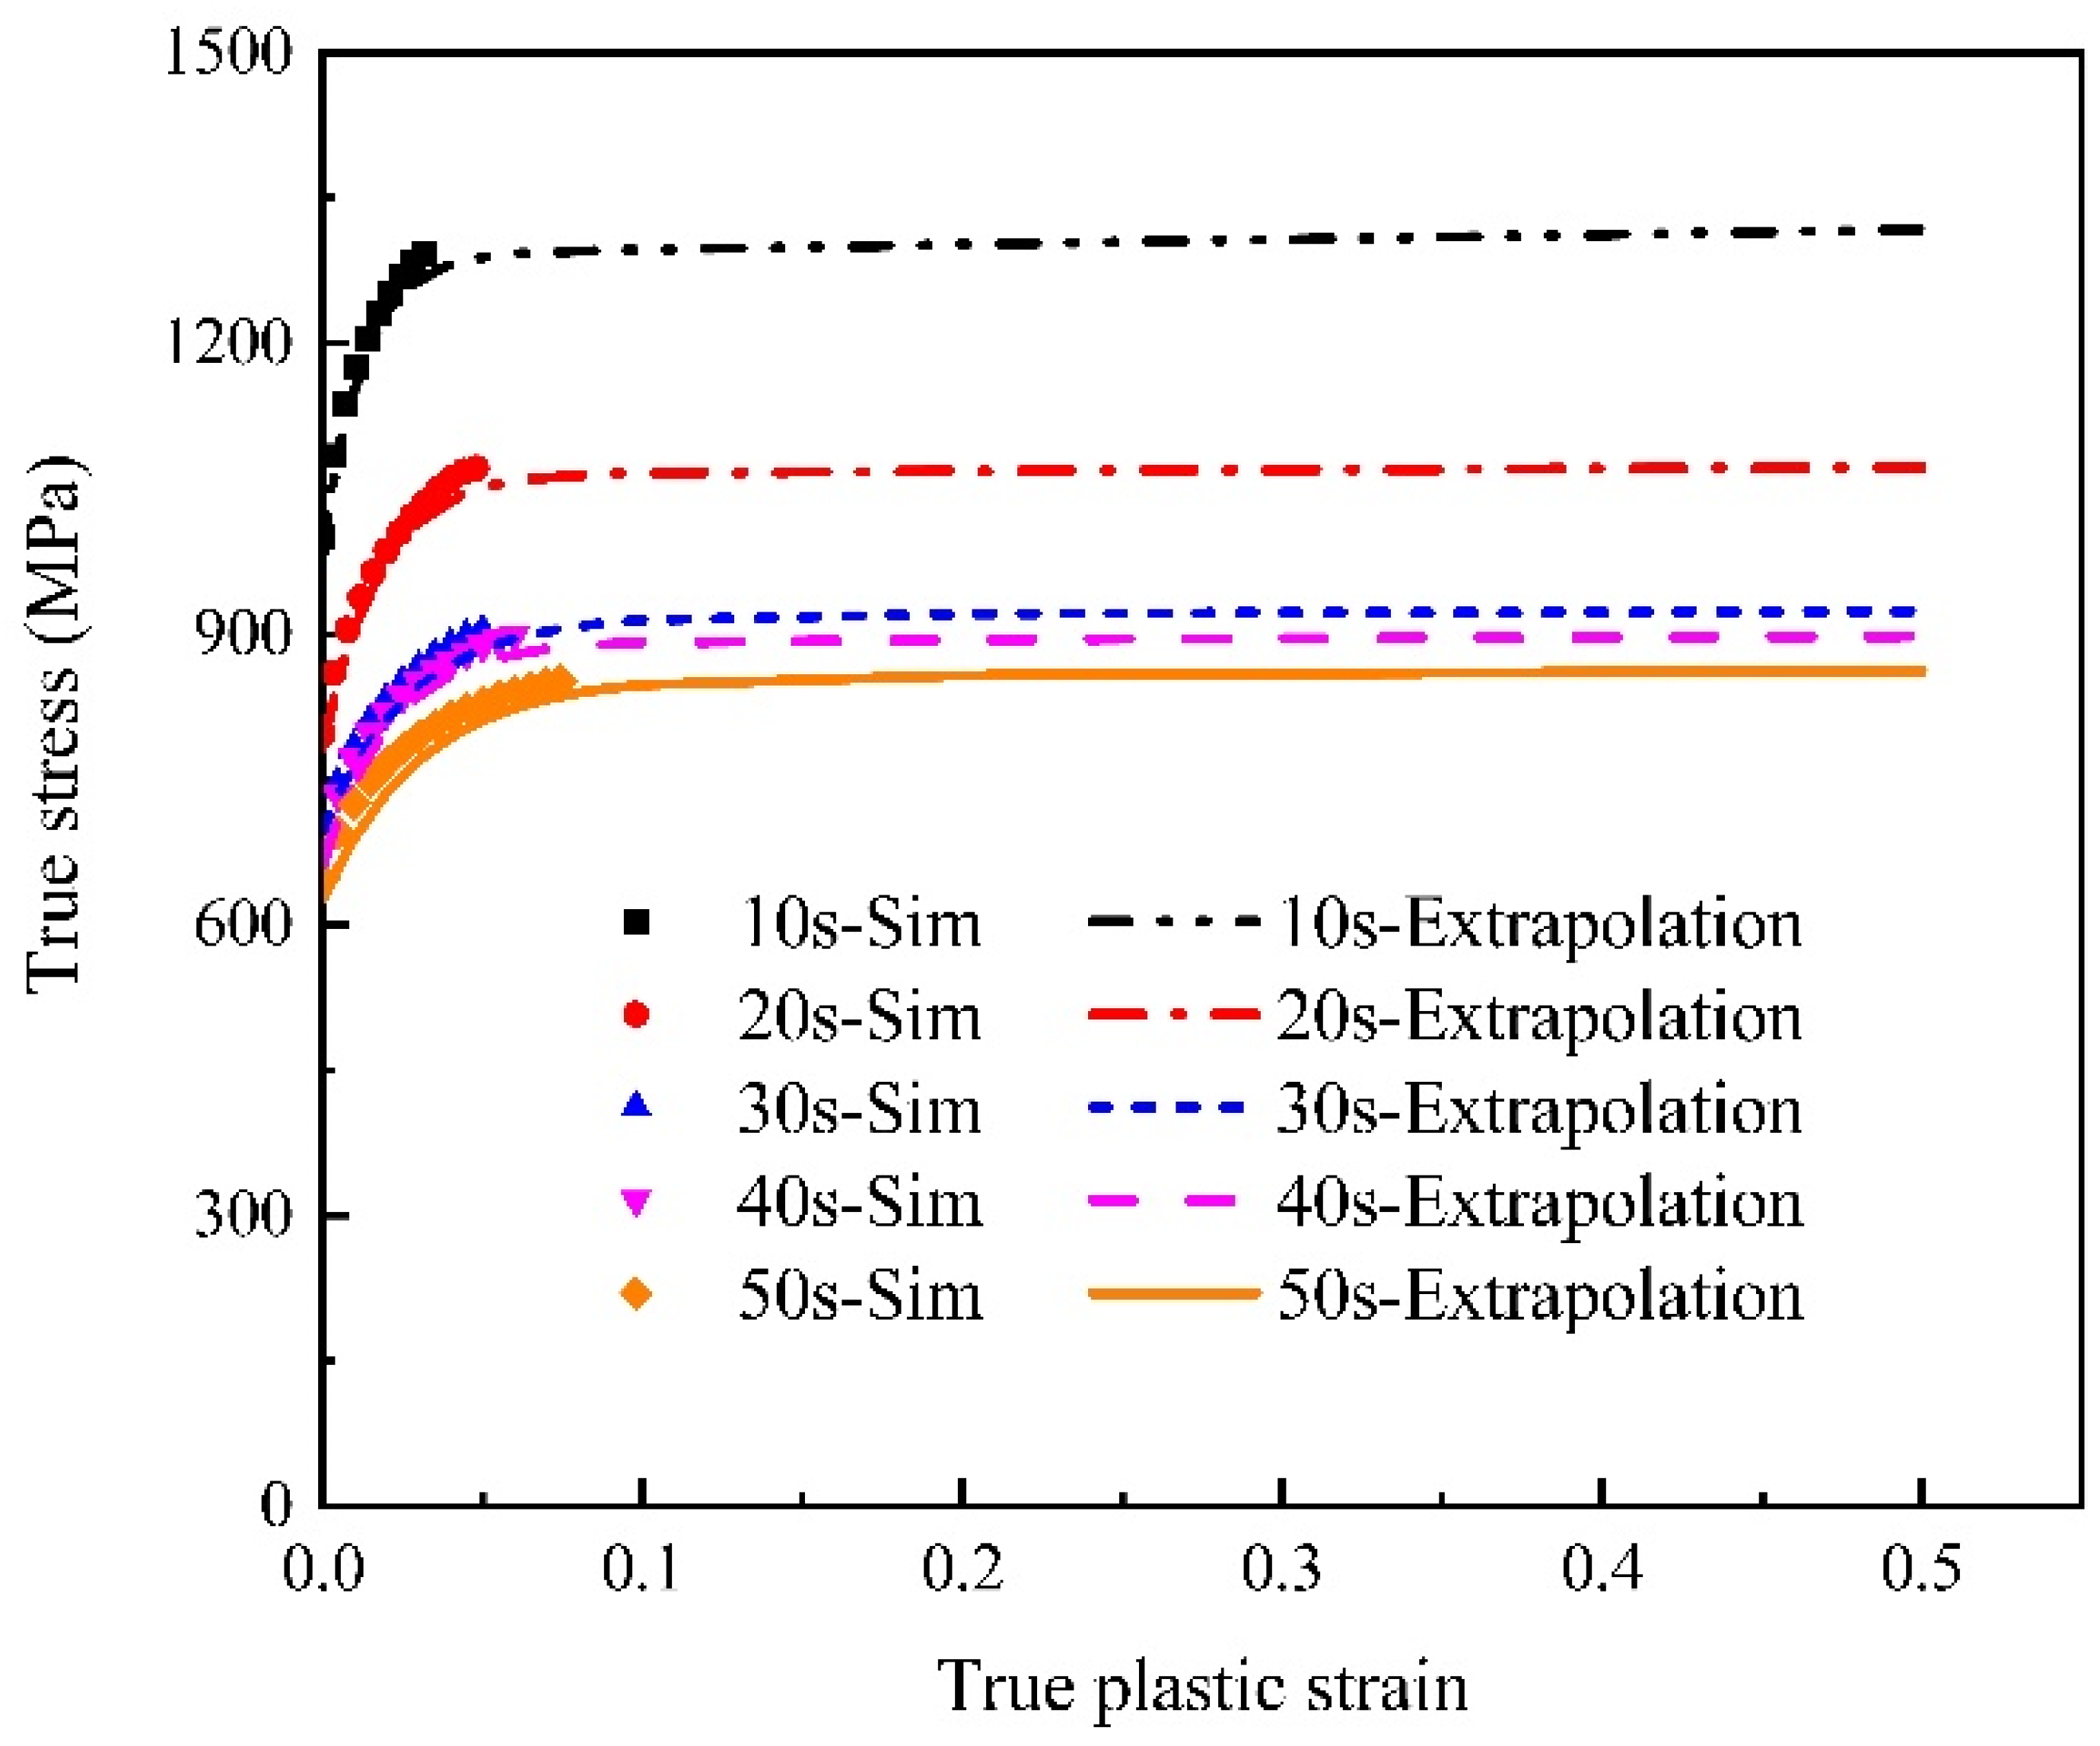
Figure 10.
Flow stress curves of extrapolation for different holding times (the dots represent simulated values in RVE and the lines represent extrapolation values).
Figure 10.
Flow stress curves of extrapolation for different holding times (the dots represent simulated values in RVE and the lines represent extrapolation values).
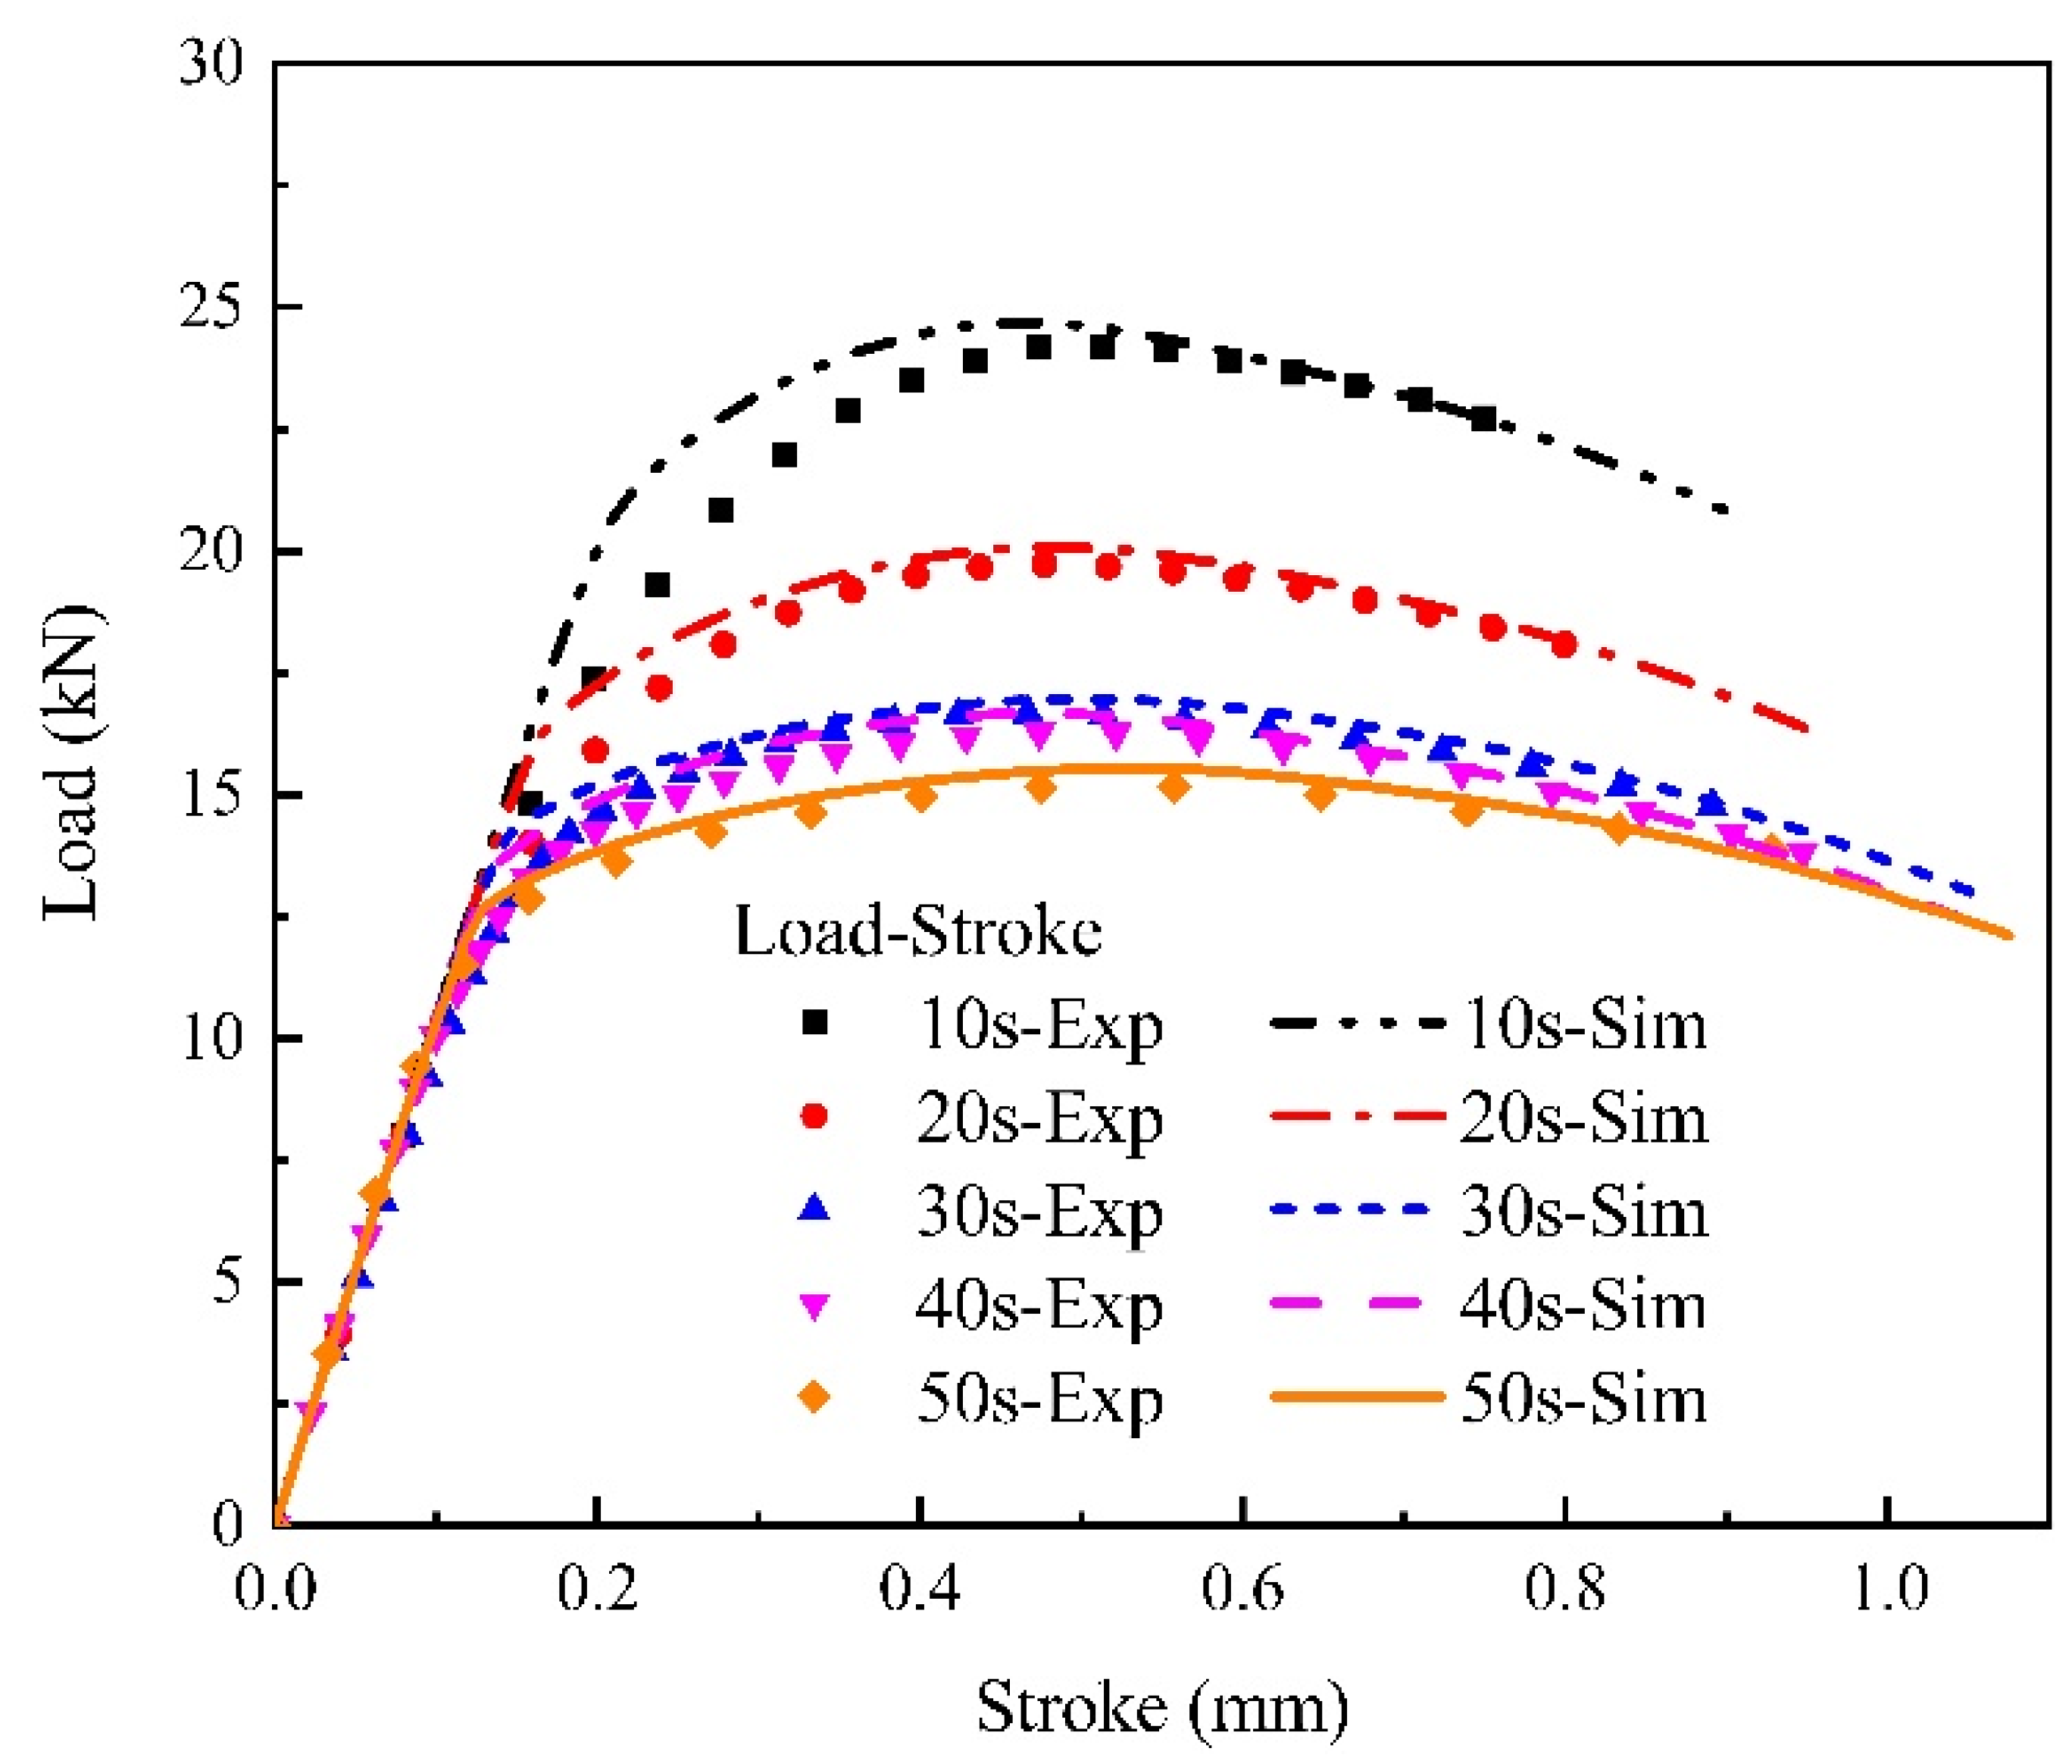
Figure 11.
Load–stroke curve comparisons between experiment and simulation for different holding times (the dots represent experimental values and the lines represent simulated values).
Figure 11.
Load–stroke curve comparisons between experiment and simulation for different holding times (the dots represent experimental values and the lines represent simulated values).
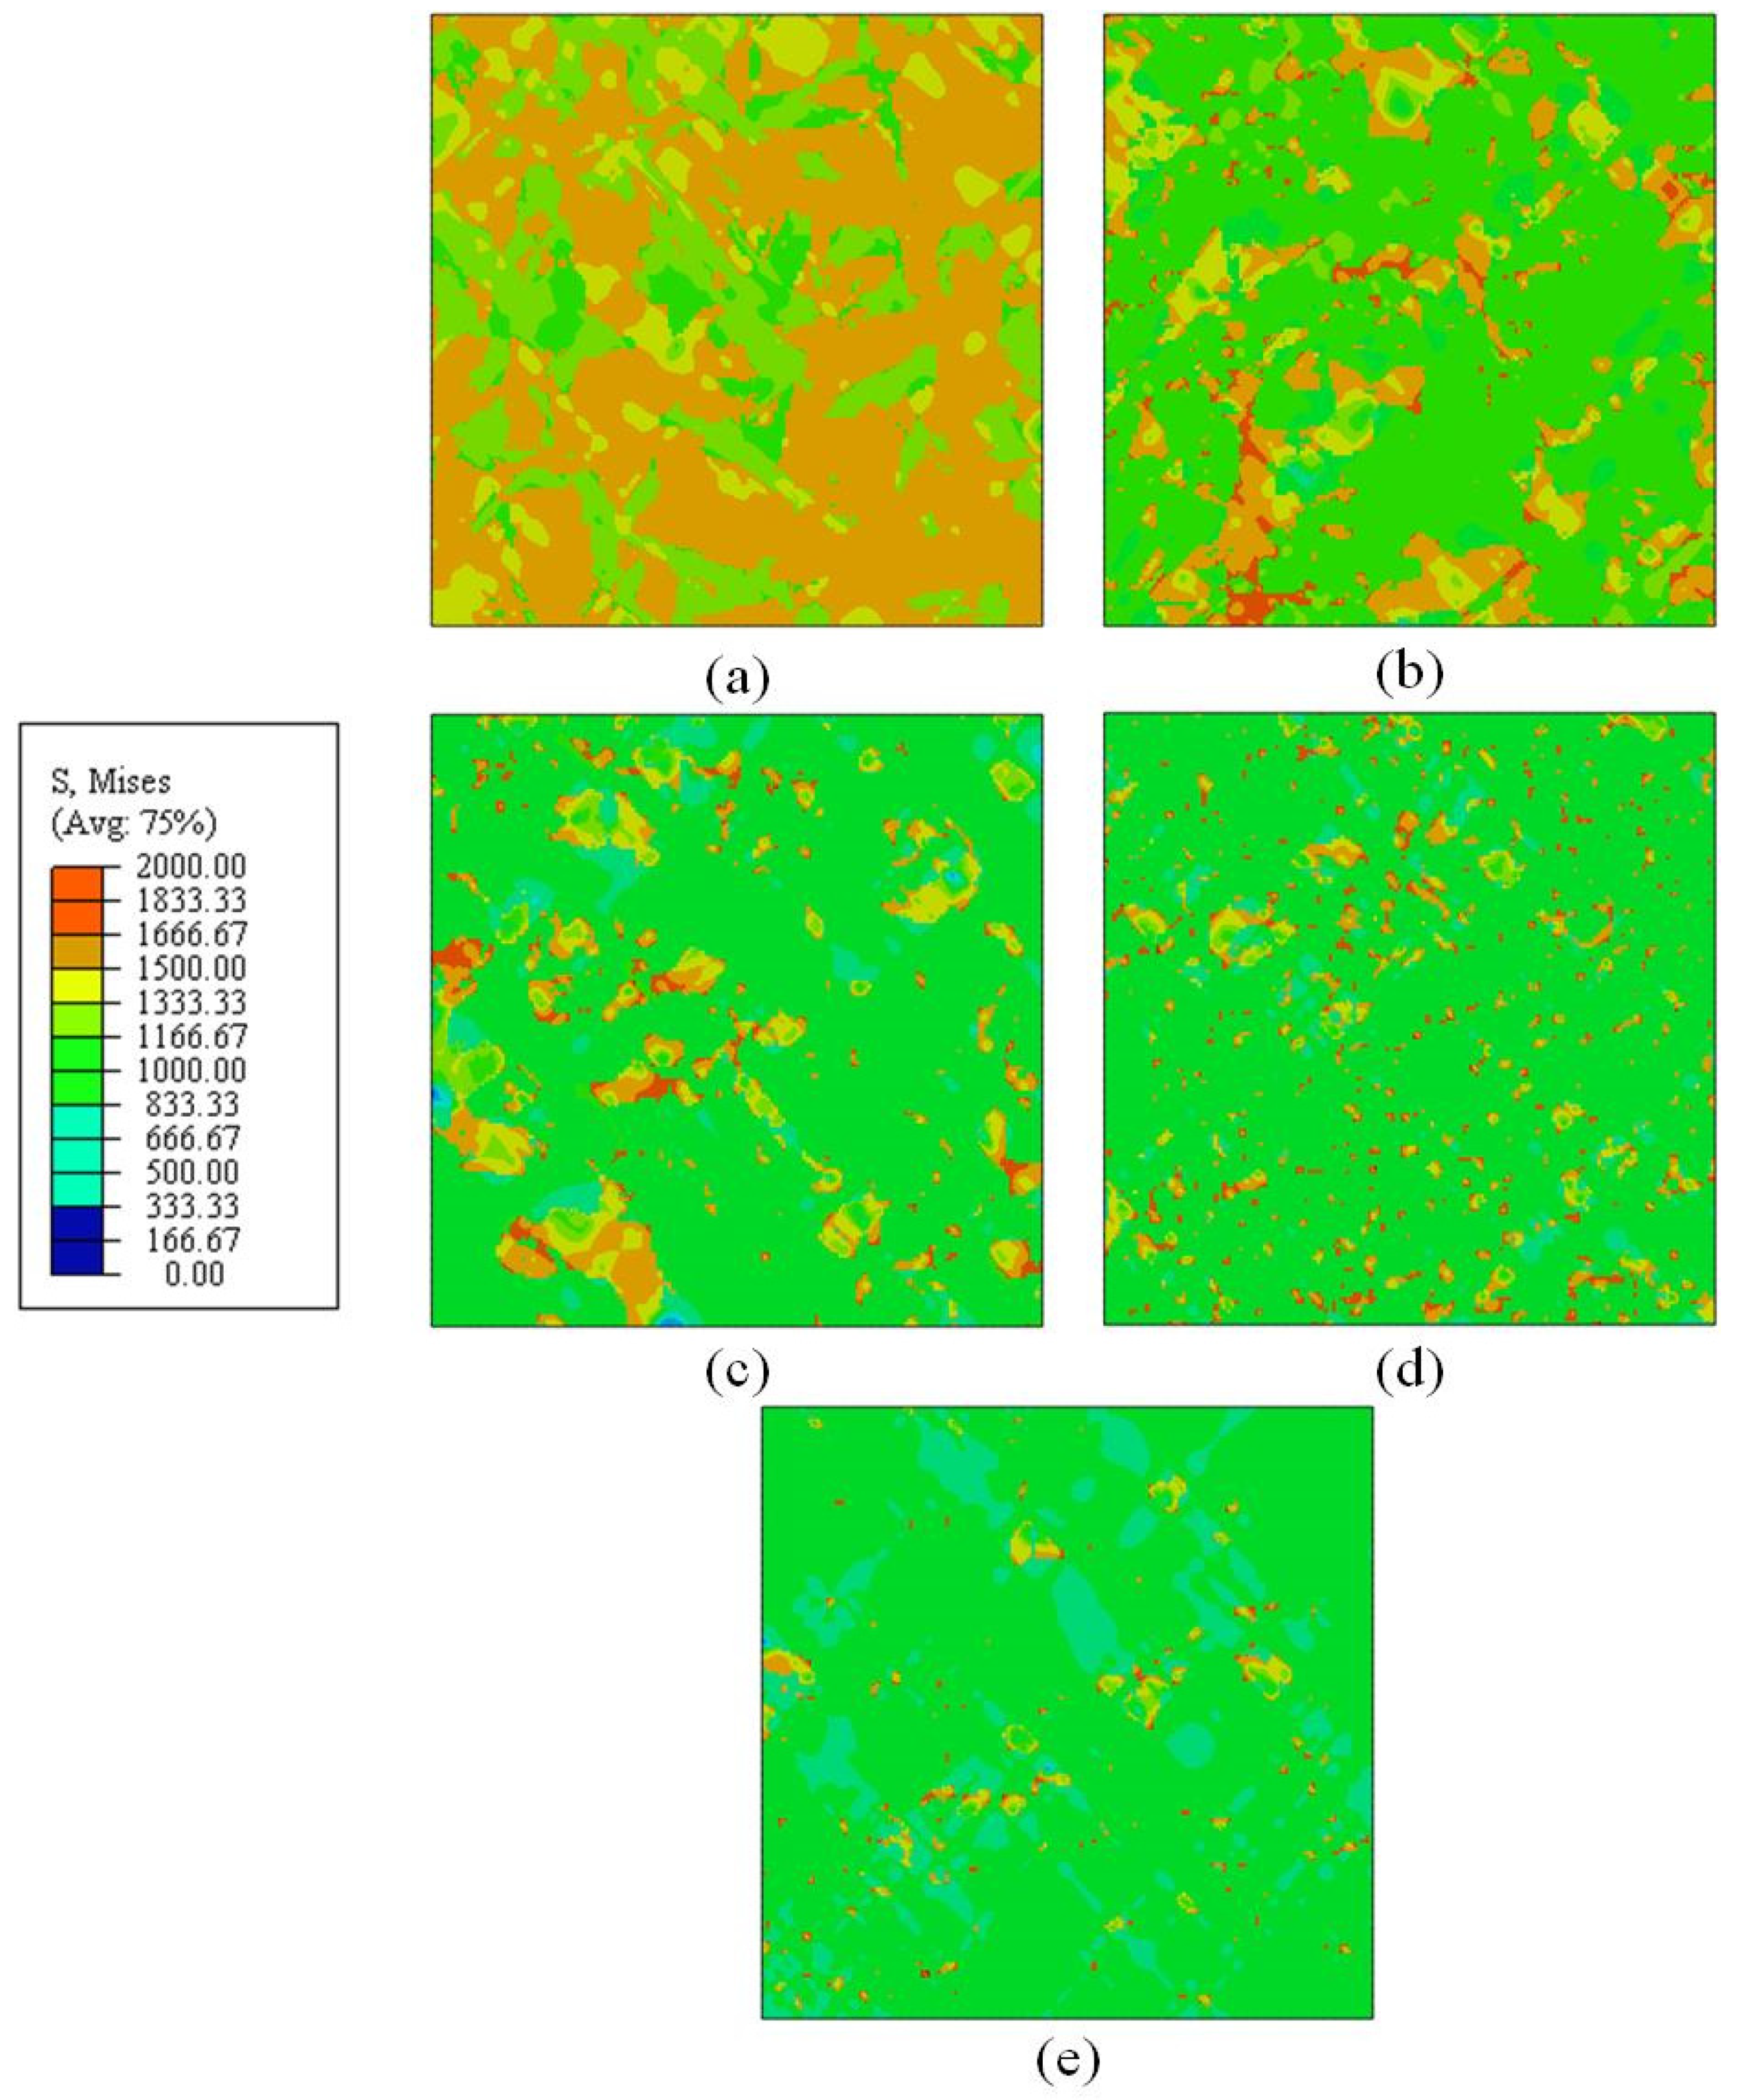
Figure 12.
Predicted local distributions of von Mises equivalent stress at the overall strain of 7% for RVEs with varying B/M phase volume fractions (a) 30%B + 70%M; (b) 68%B + 32%M; (c) 80%B + 20%M; (d) 90%B + 10%M; (e) 96%B + 4%M (Units: Pa).
Figure 12.
Predicted local distributions of von Mises equivalent stress at the overall strain of 7% for RVEs with varying B/M phase volume fractions (a) 30%B + 70%M; (b) 68%B + 32%M; (c) 80%B + 20%M; (d) 90%B + 10%M; (e) 96%B + 4%M (Units: Pa).
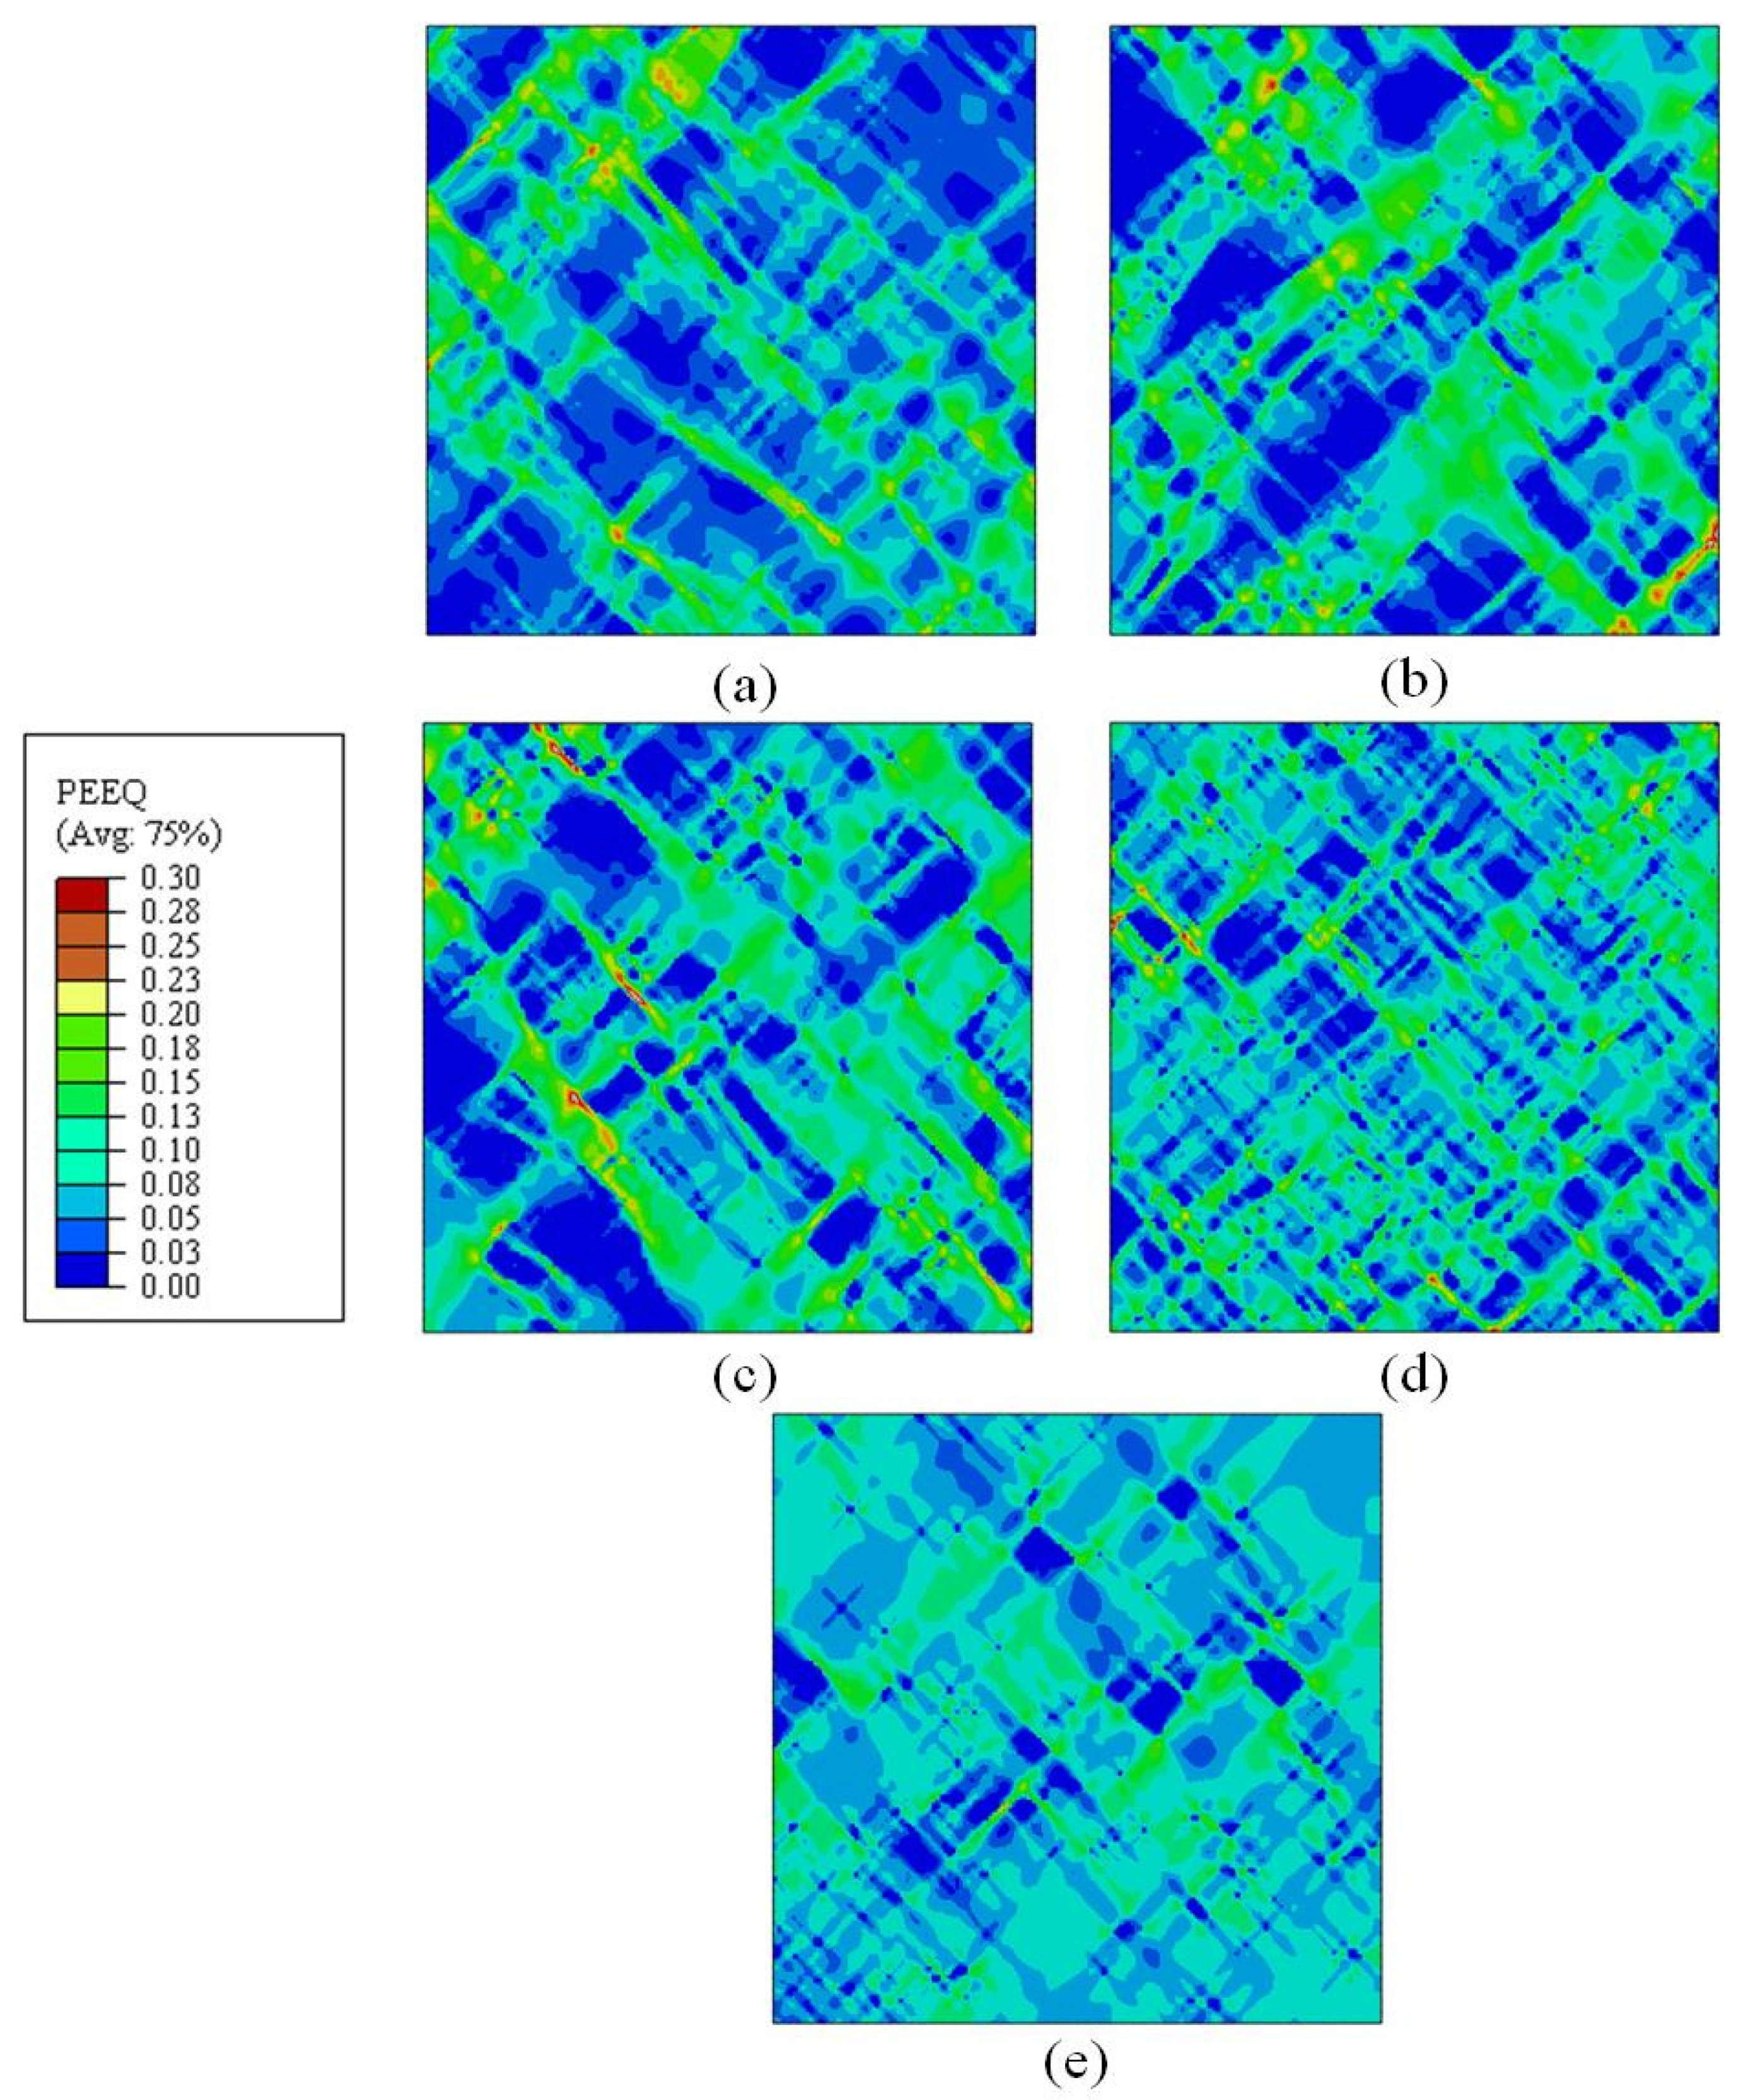
Figure 13.
Predicted local distributions of equivalent plastic strain (PEEQ) at the overall strain of 7% for RVEs with varying B/M phase volume fractions (a) 30%B + 70%M; (b) 68%B + 32%M; (c) 80%B + 20%M; (d) 90%B + 10%M; (e) 96%B + 4%M.
Figure 13.
Predicted local distributions of equivalent plastic strain (PEEQ) at the overall strain of 7% for RVEs with varying B/M phase volume fractions (a) 30%B + 70%M; (b) 68%B + 32%M; (c) 80%B + 20%M; (d) 90%B + 10%M; (e) 96%B + 4%M.
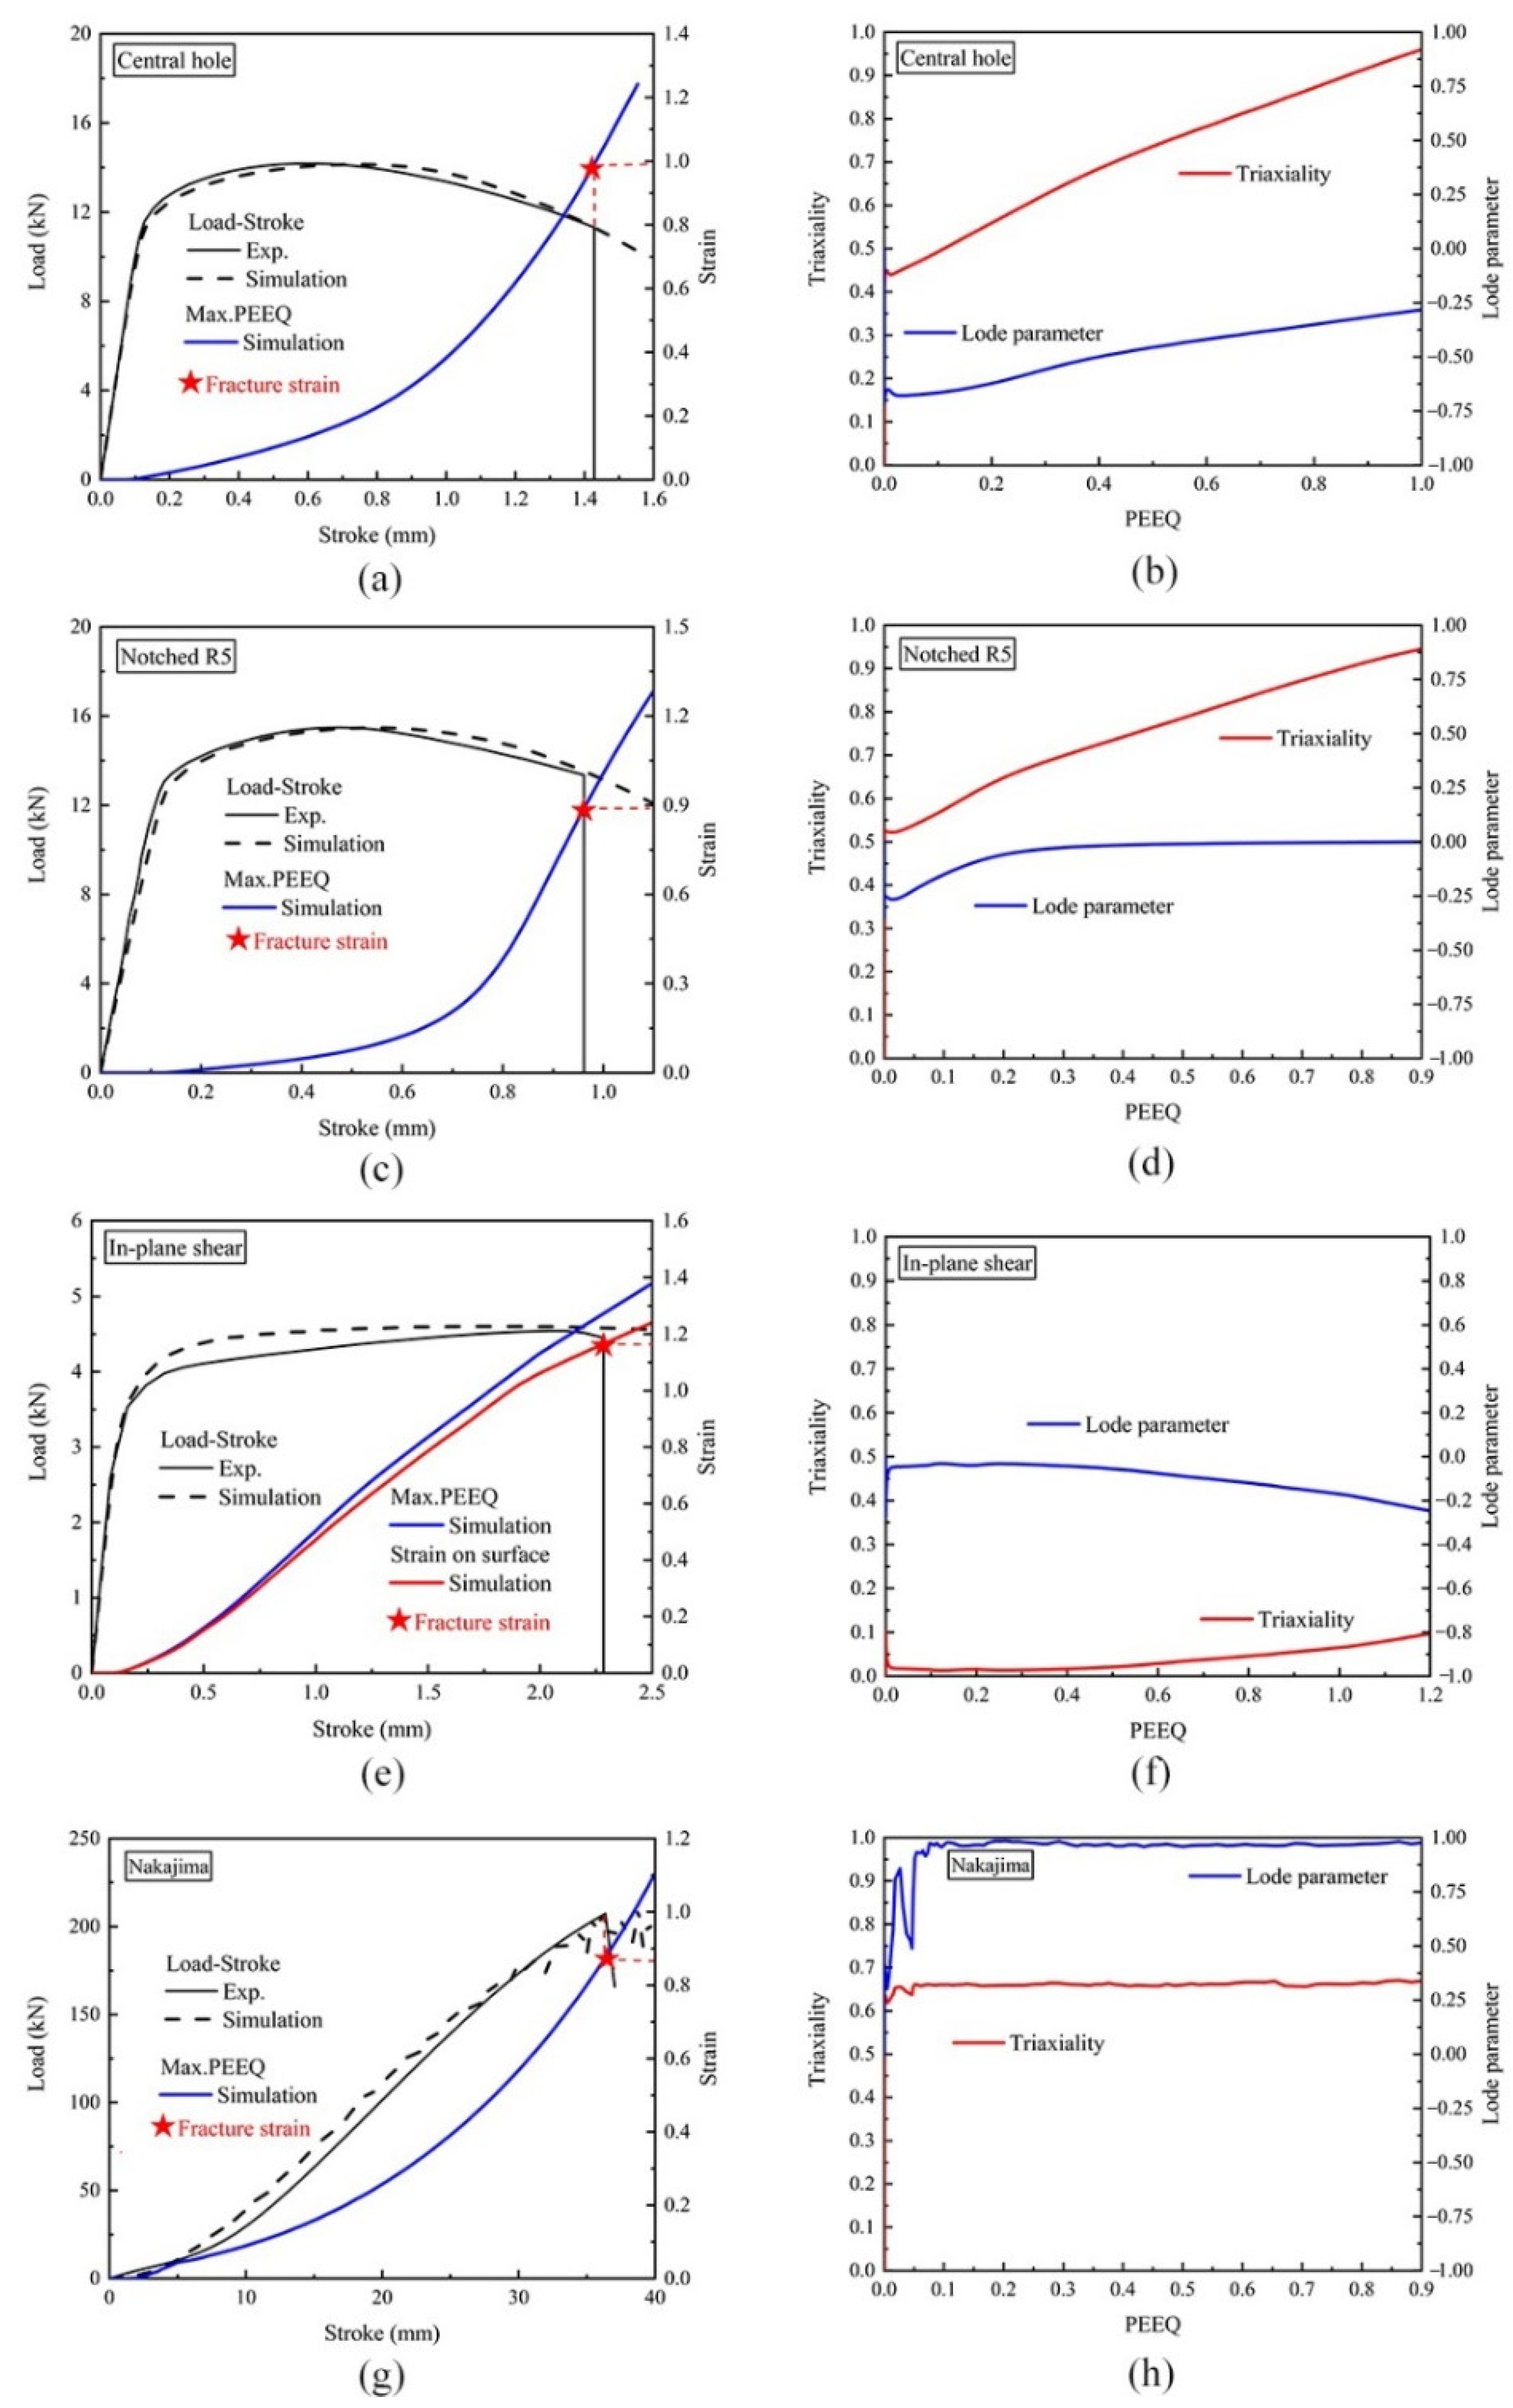
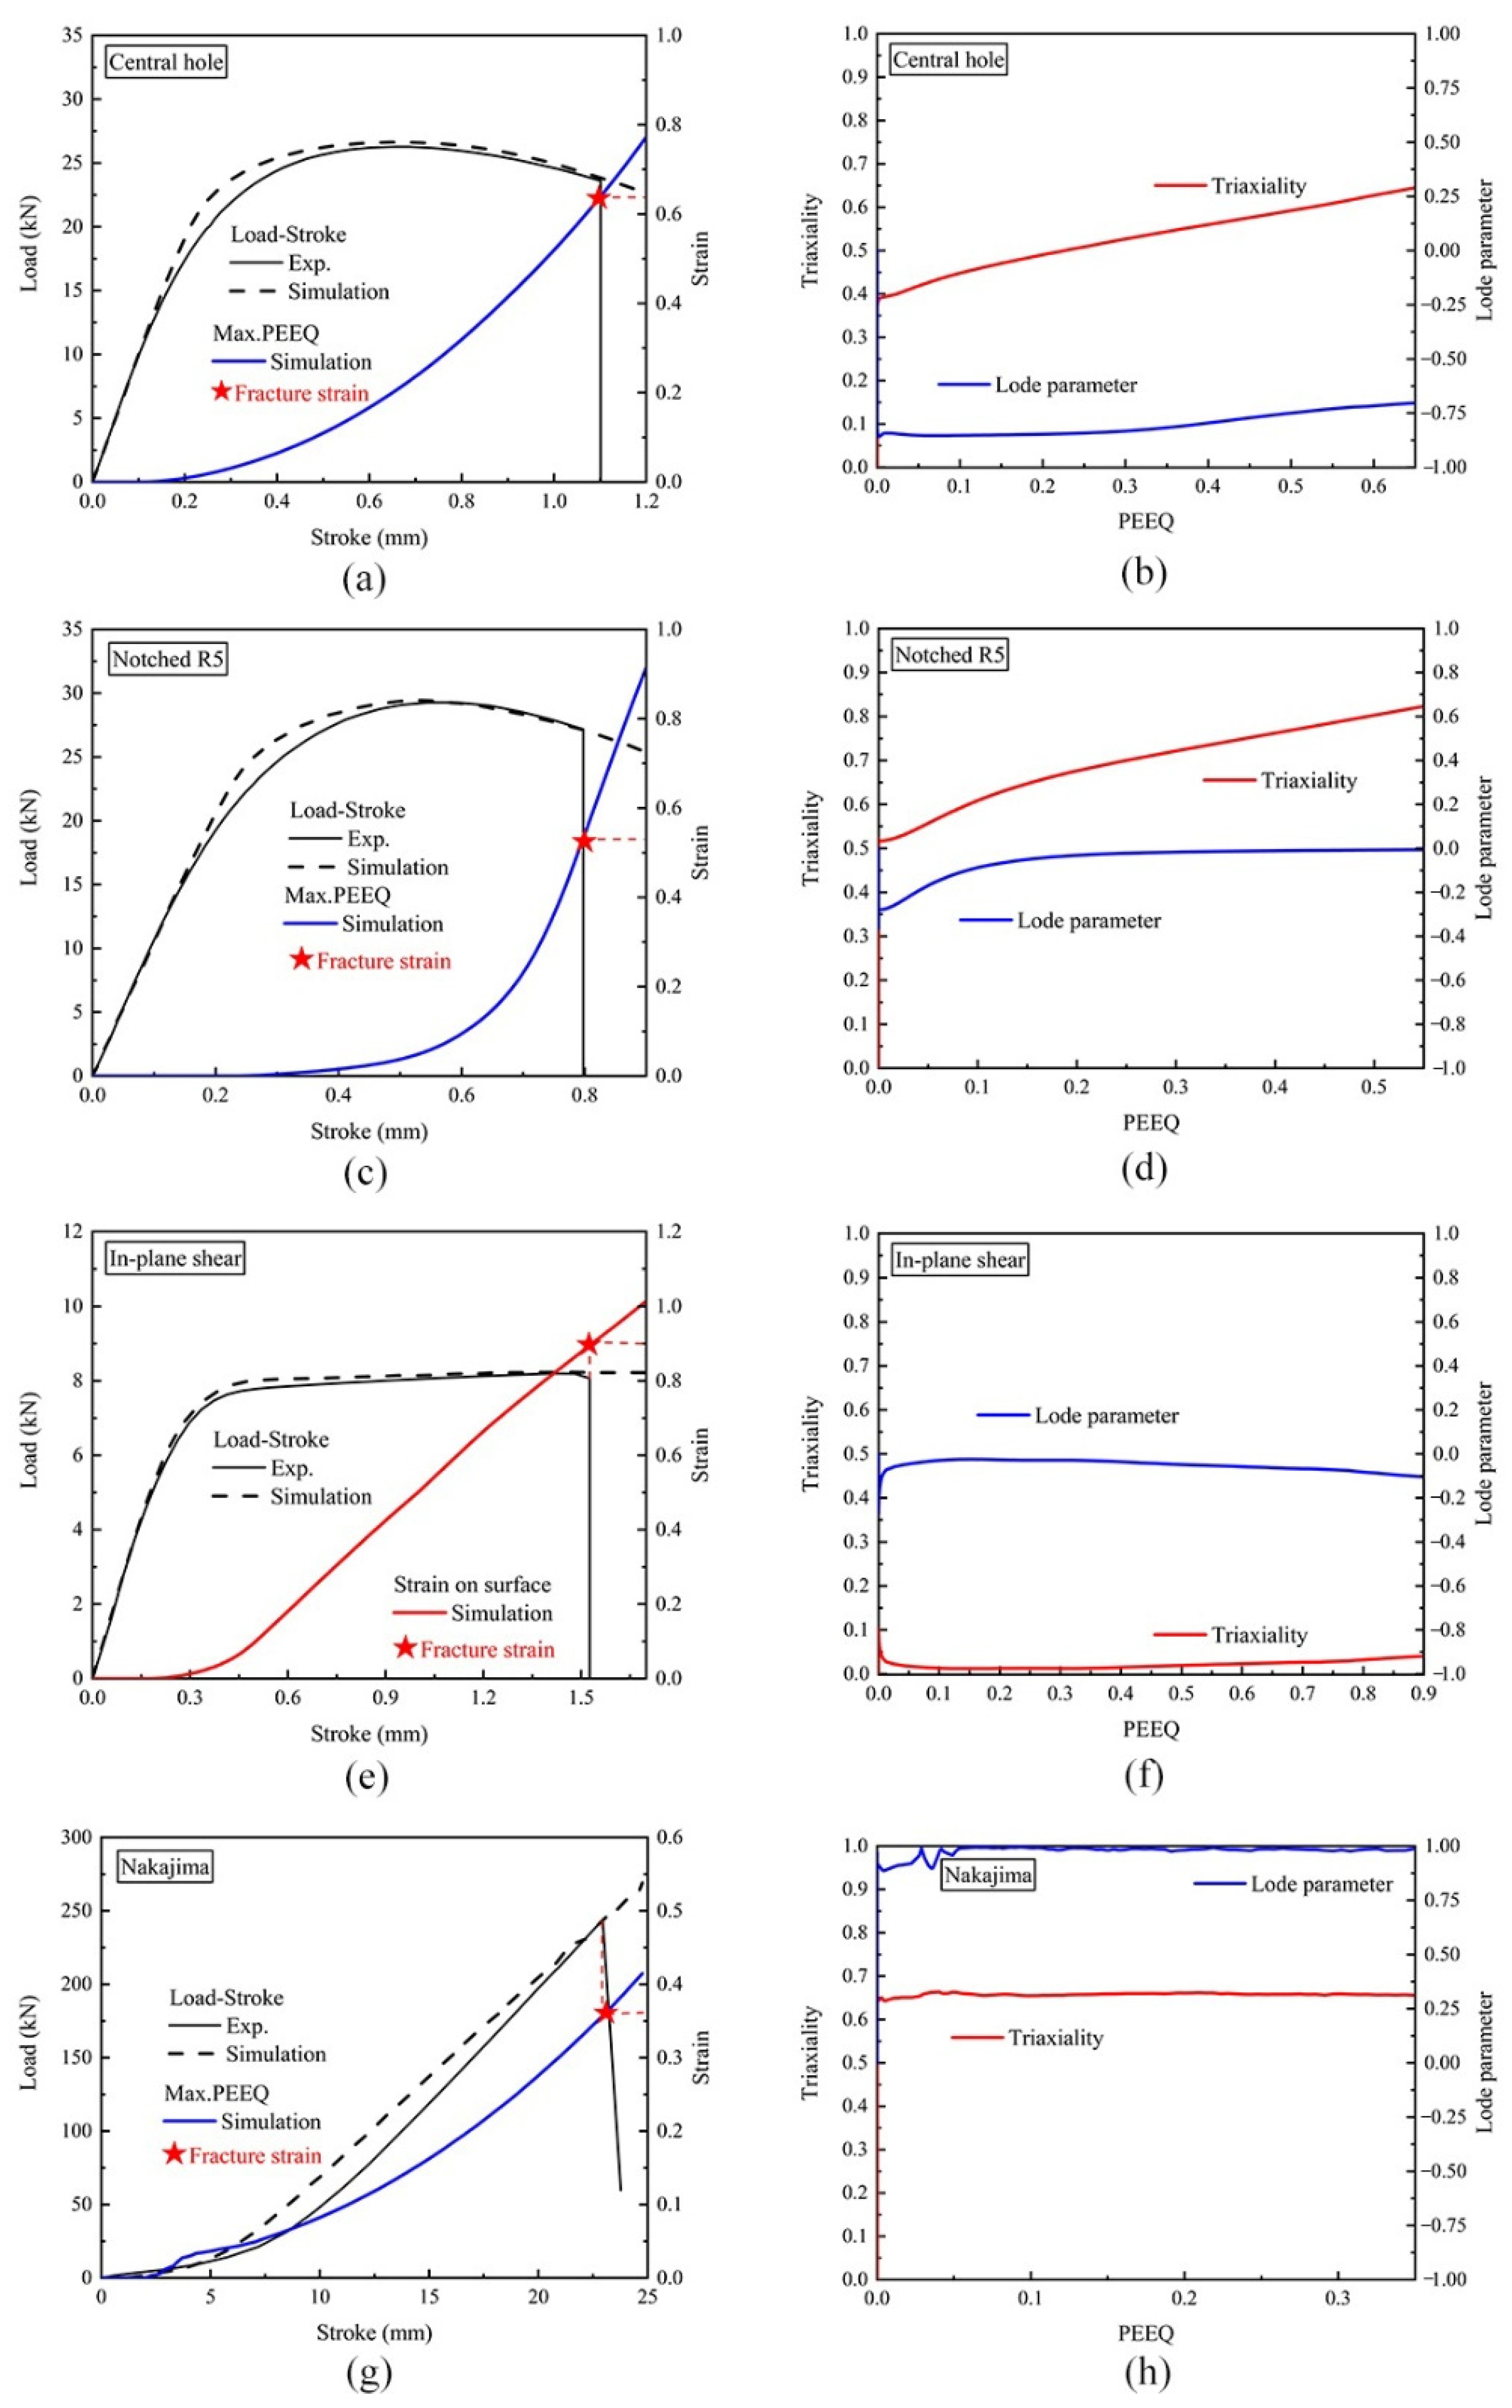
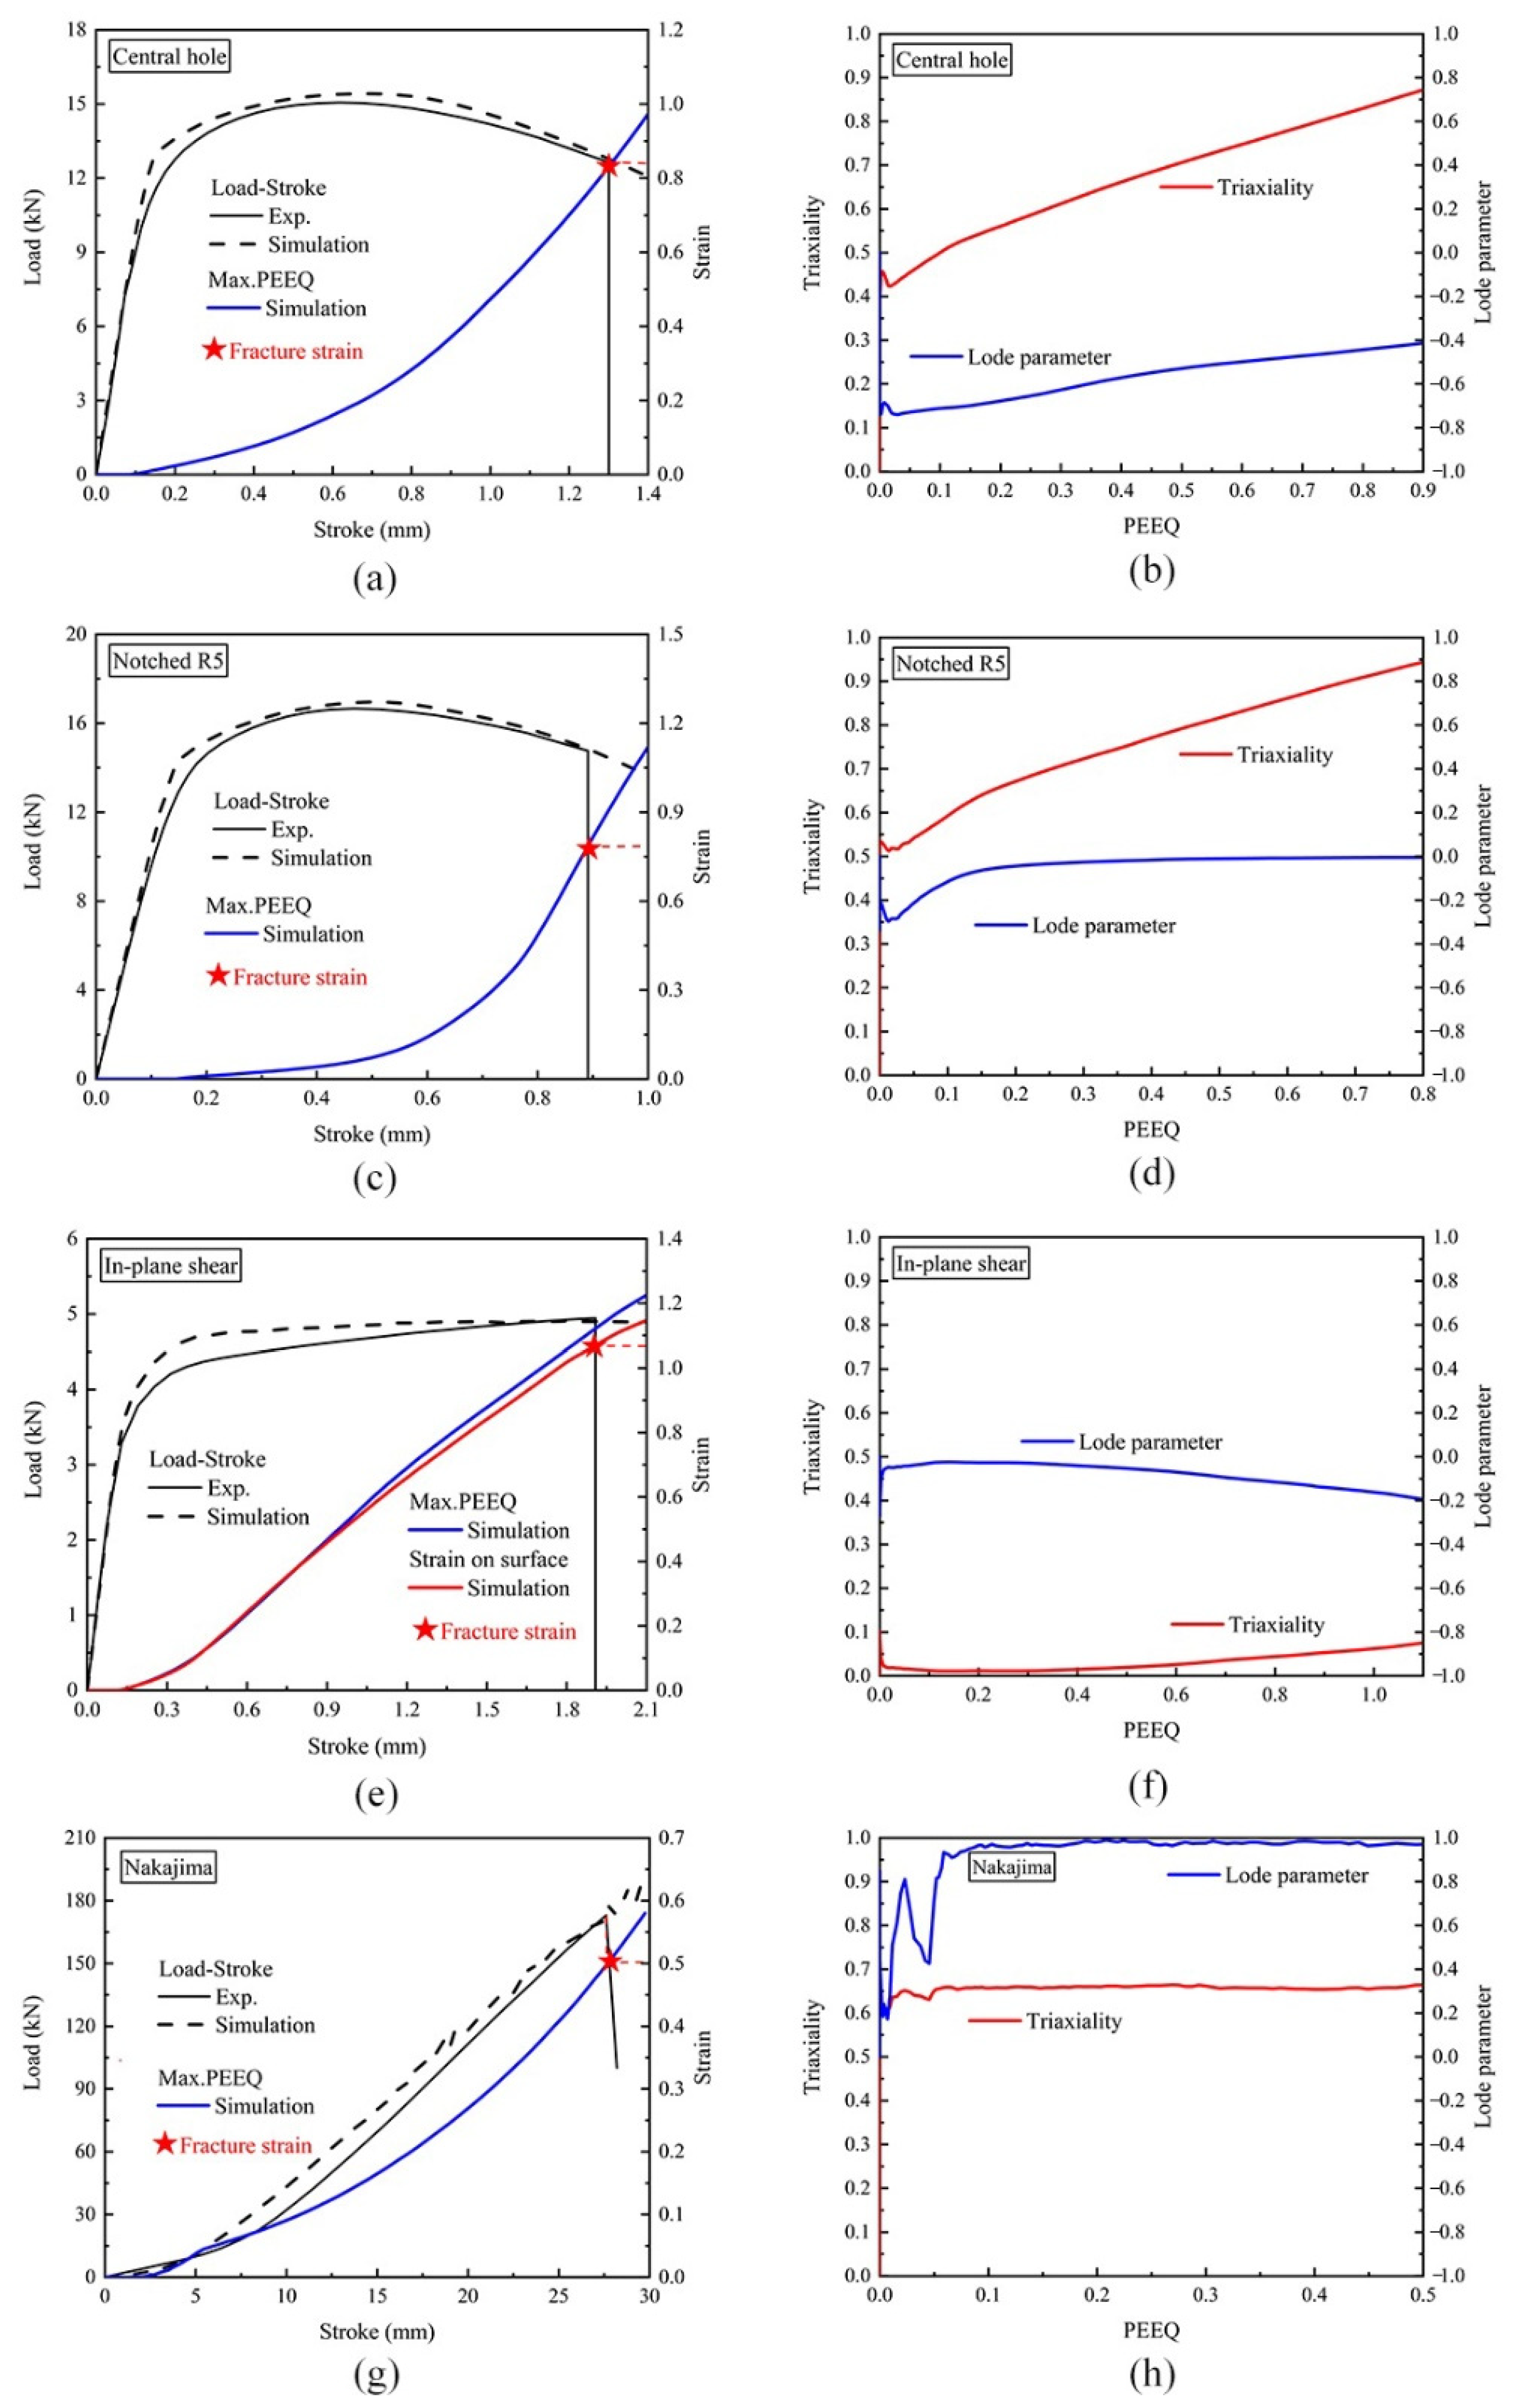
Figure 14.
Numerical and experimental tensile results for different bainite specimens: (a) central hole, (c) notched, (e) in-plane shear, and (g) Nakajima specimen simulated load–stroke curves and PEEQ distribution, compared with experimental results; (b) central hole, (d) notched, (f) in-plane shear, and (h) Nakajima specimen calculated evolutions of the Lode parameter and the triaxiality towards PEEQ.
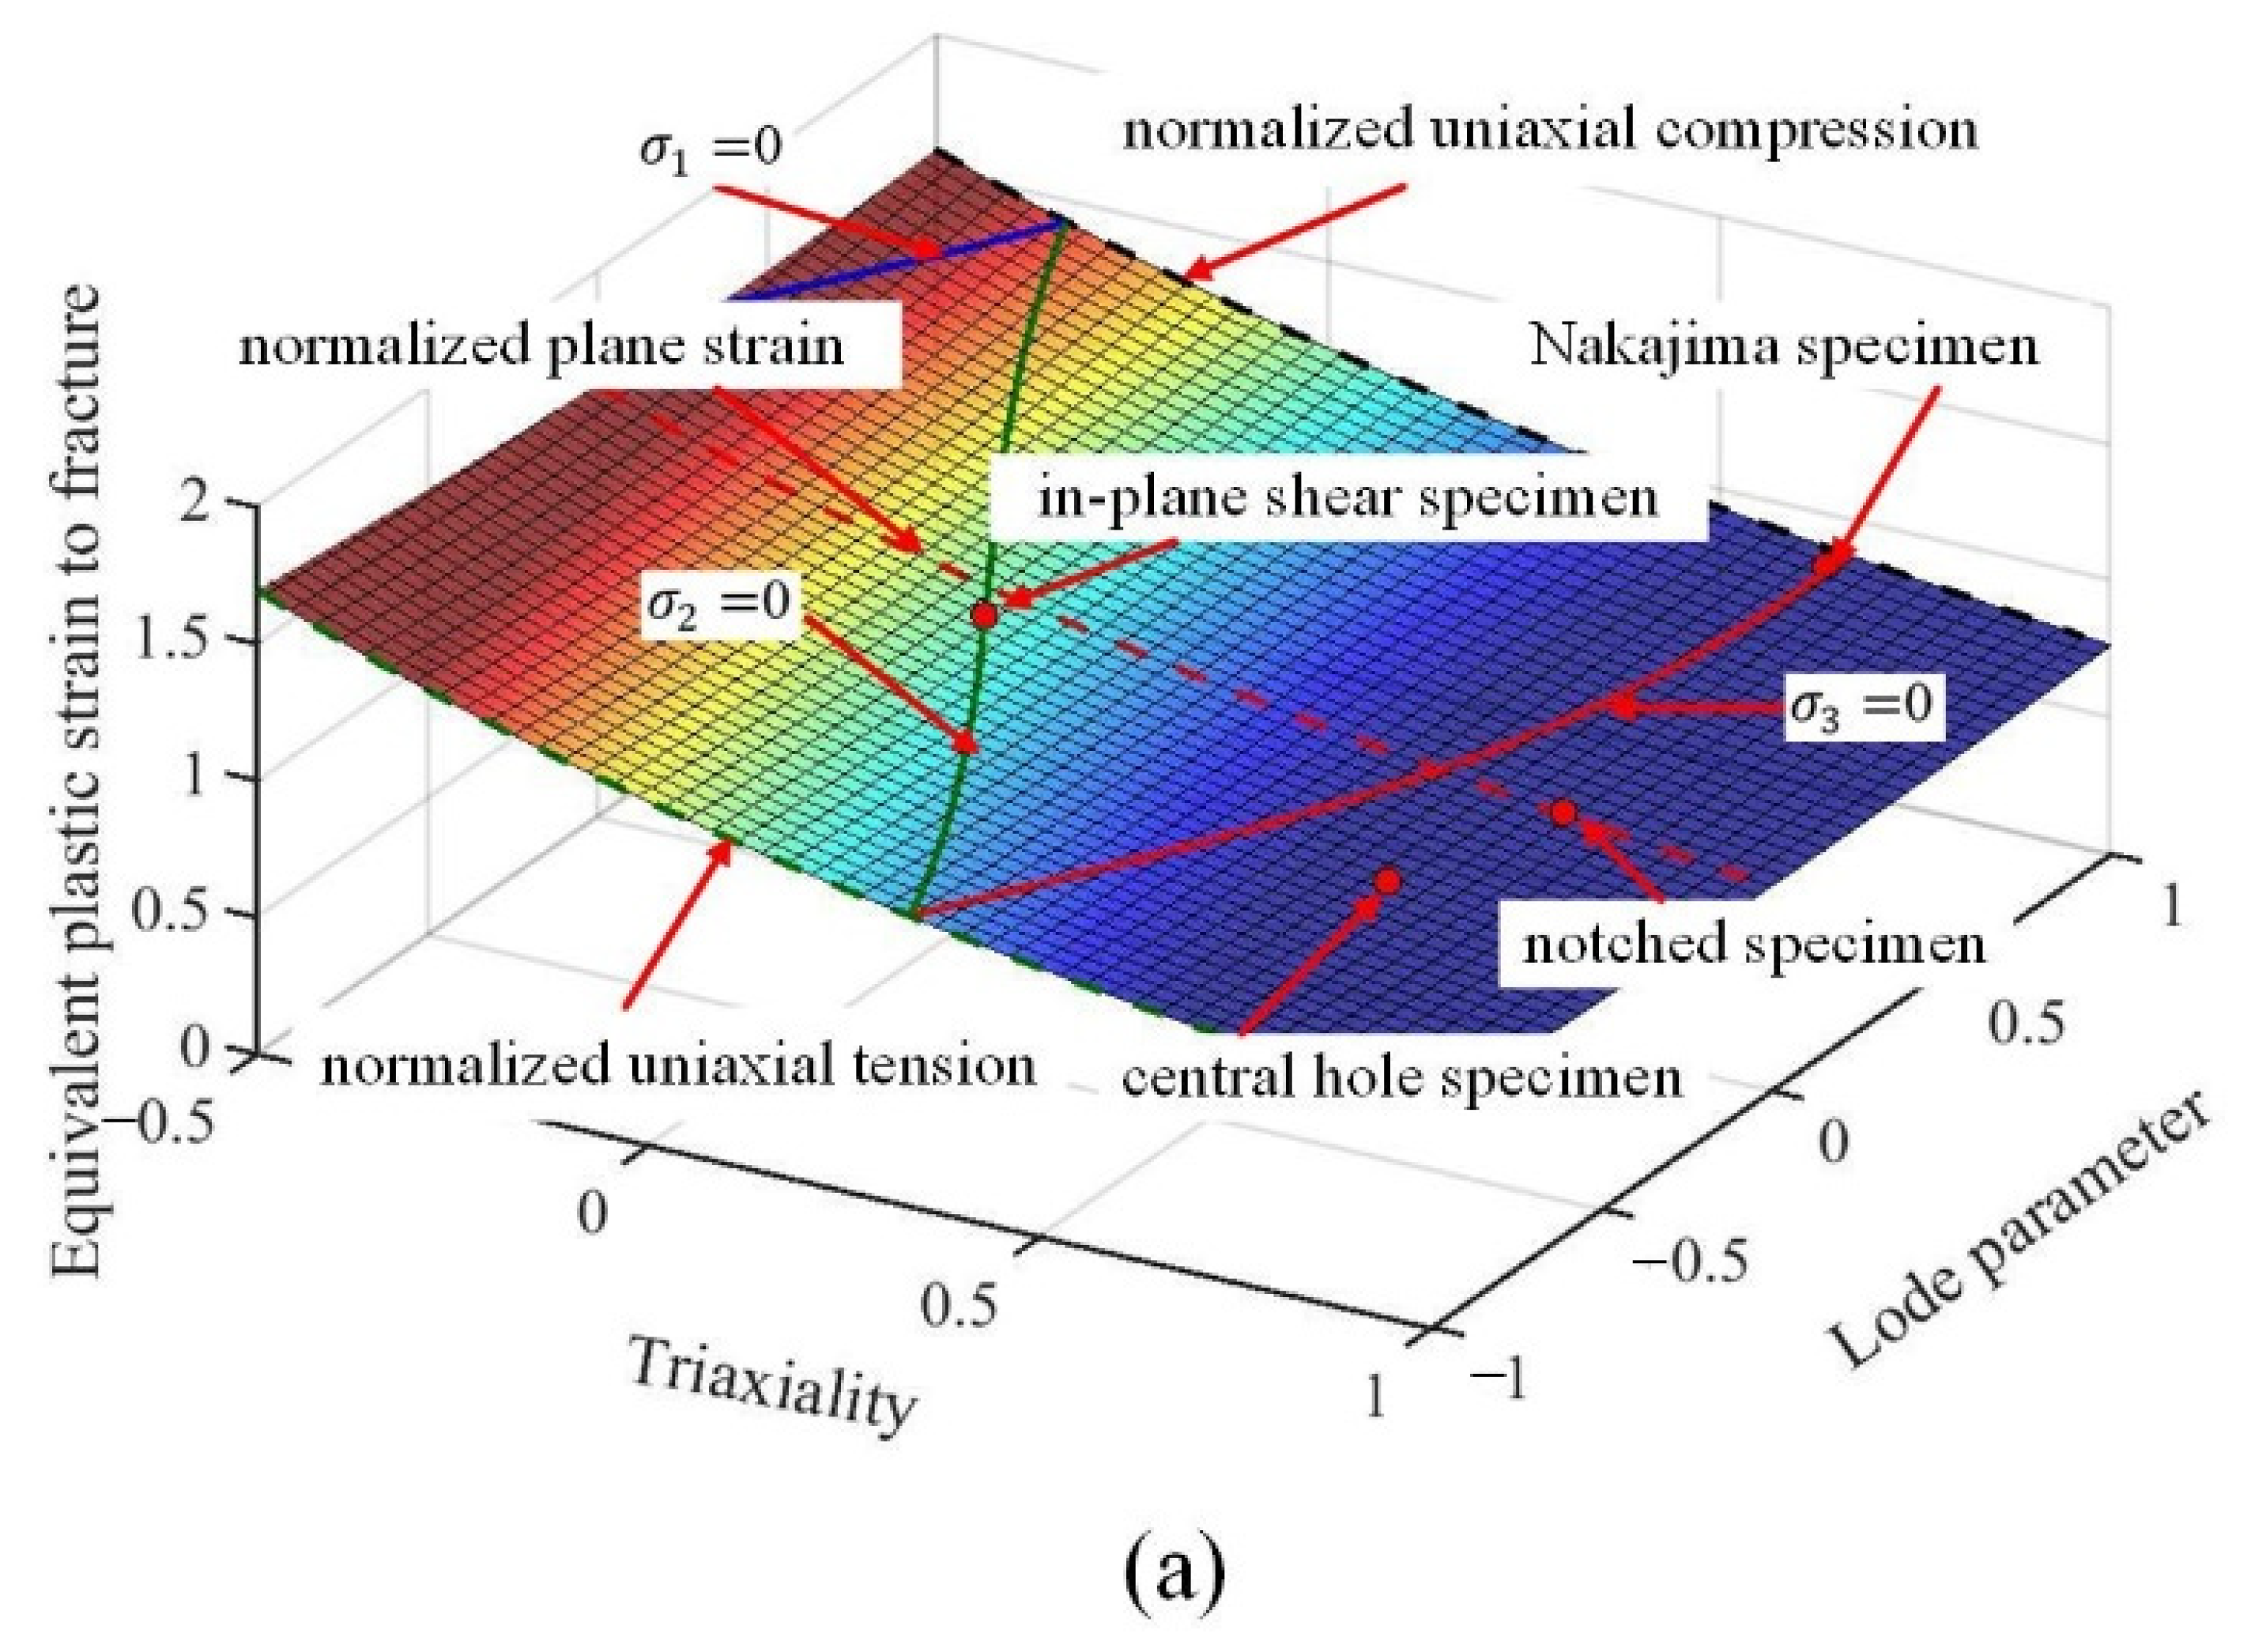
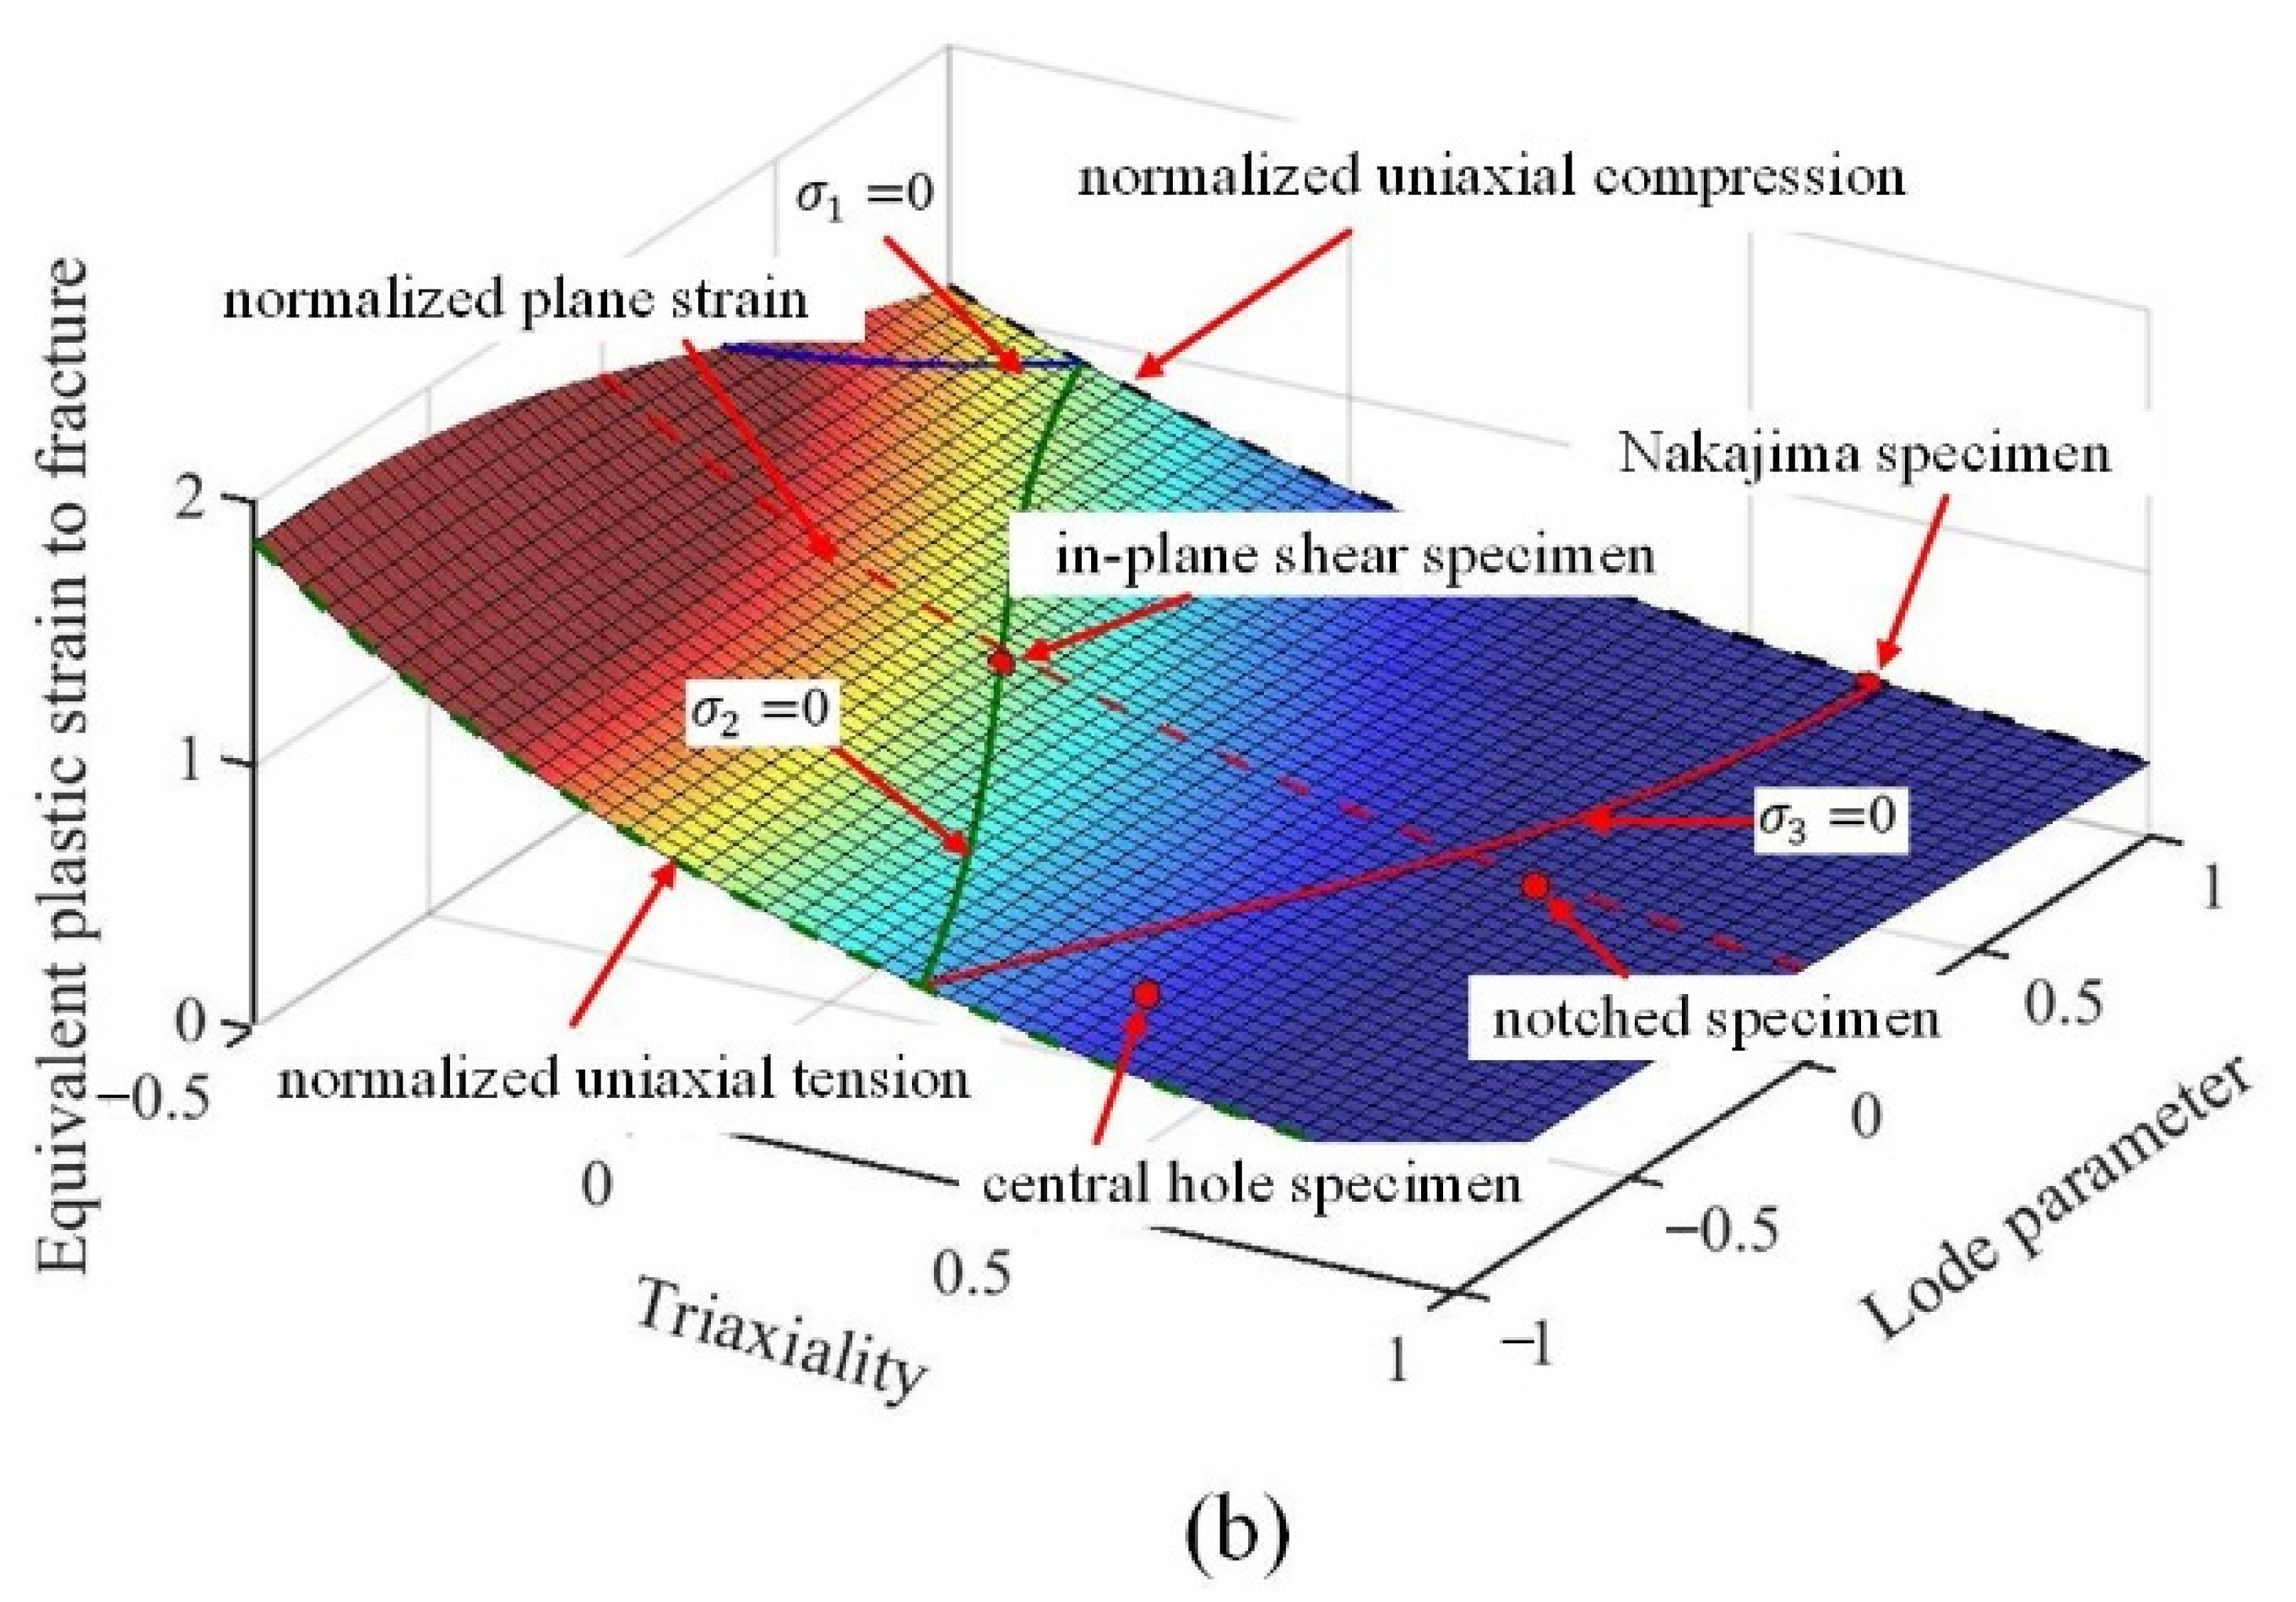
Figure 15.
The constructed fracture loci optimized according to the predicted fracture strain in varying stress states and compared with experimental data: (a) bainite; (b) martensite.
Figure 15.
The constructed fracture loci optimized according to the predicted fracture strain in varying stress states and compared with experimental data: (a) bainite; (b) martensite.
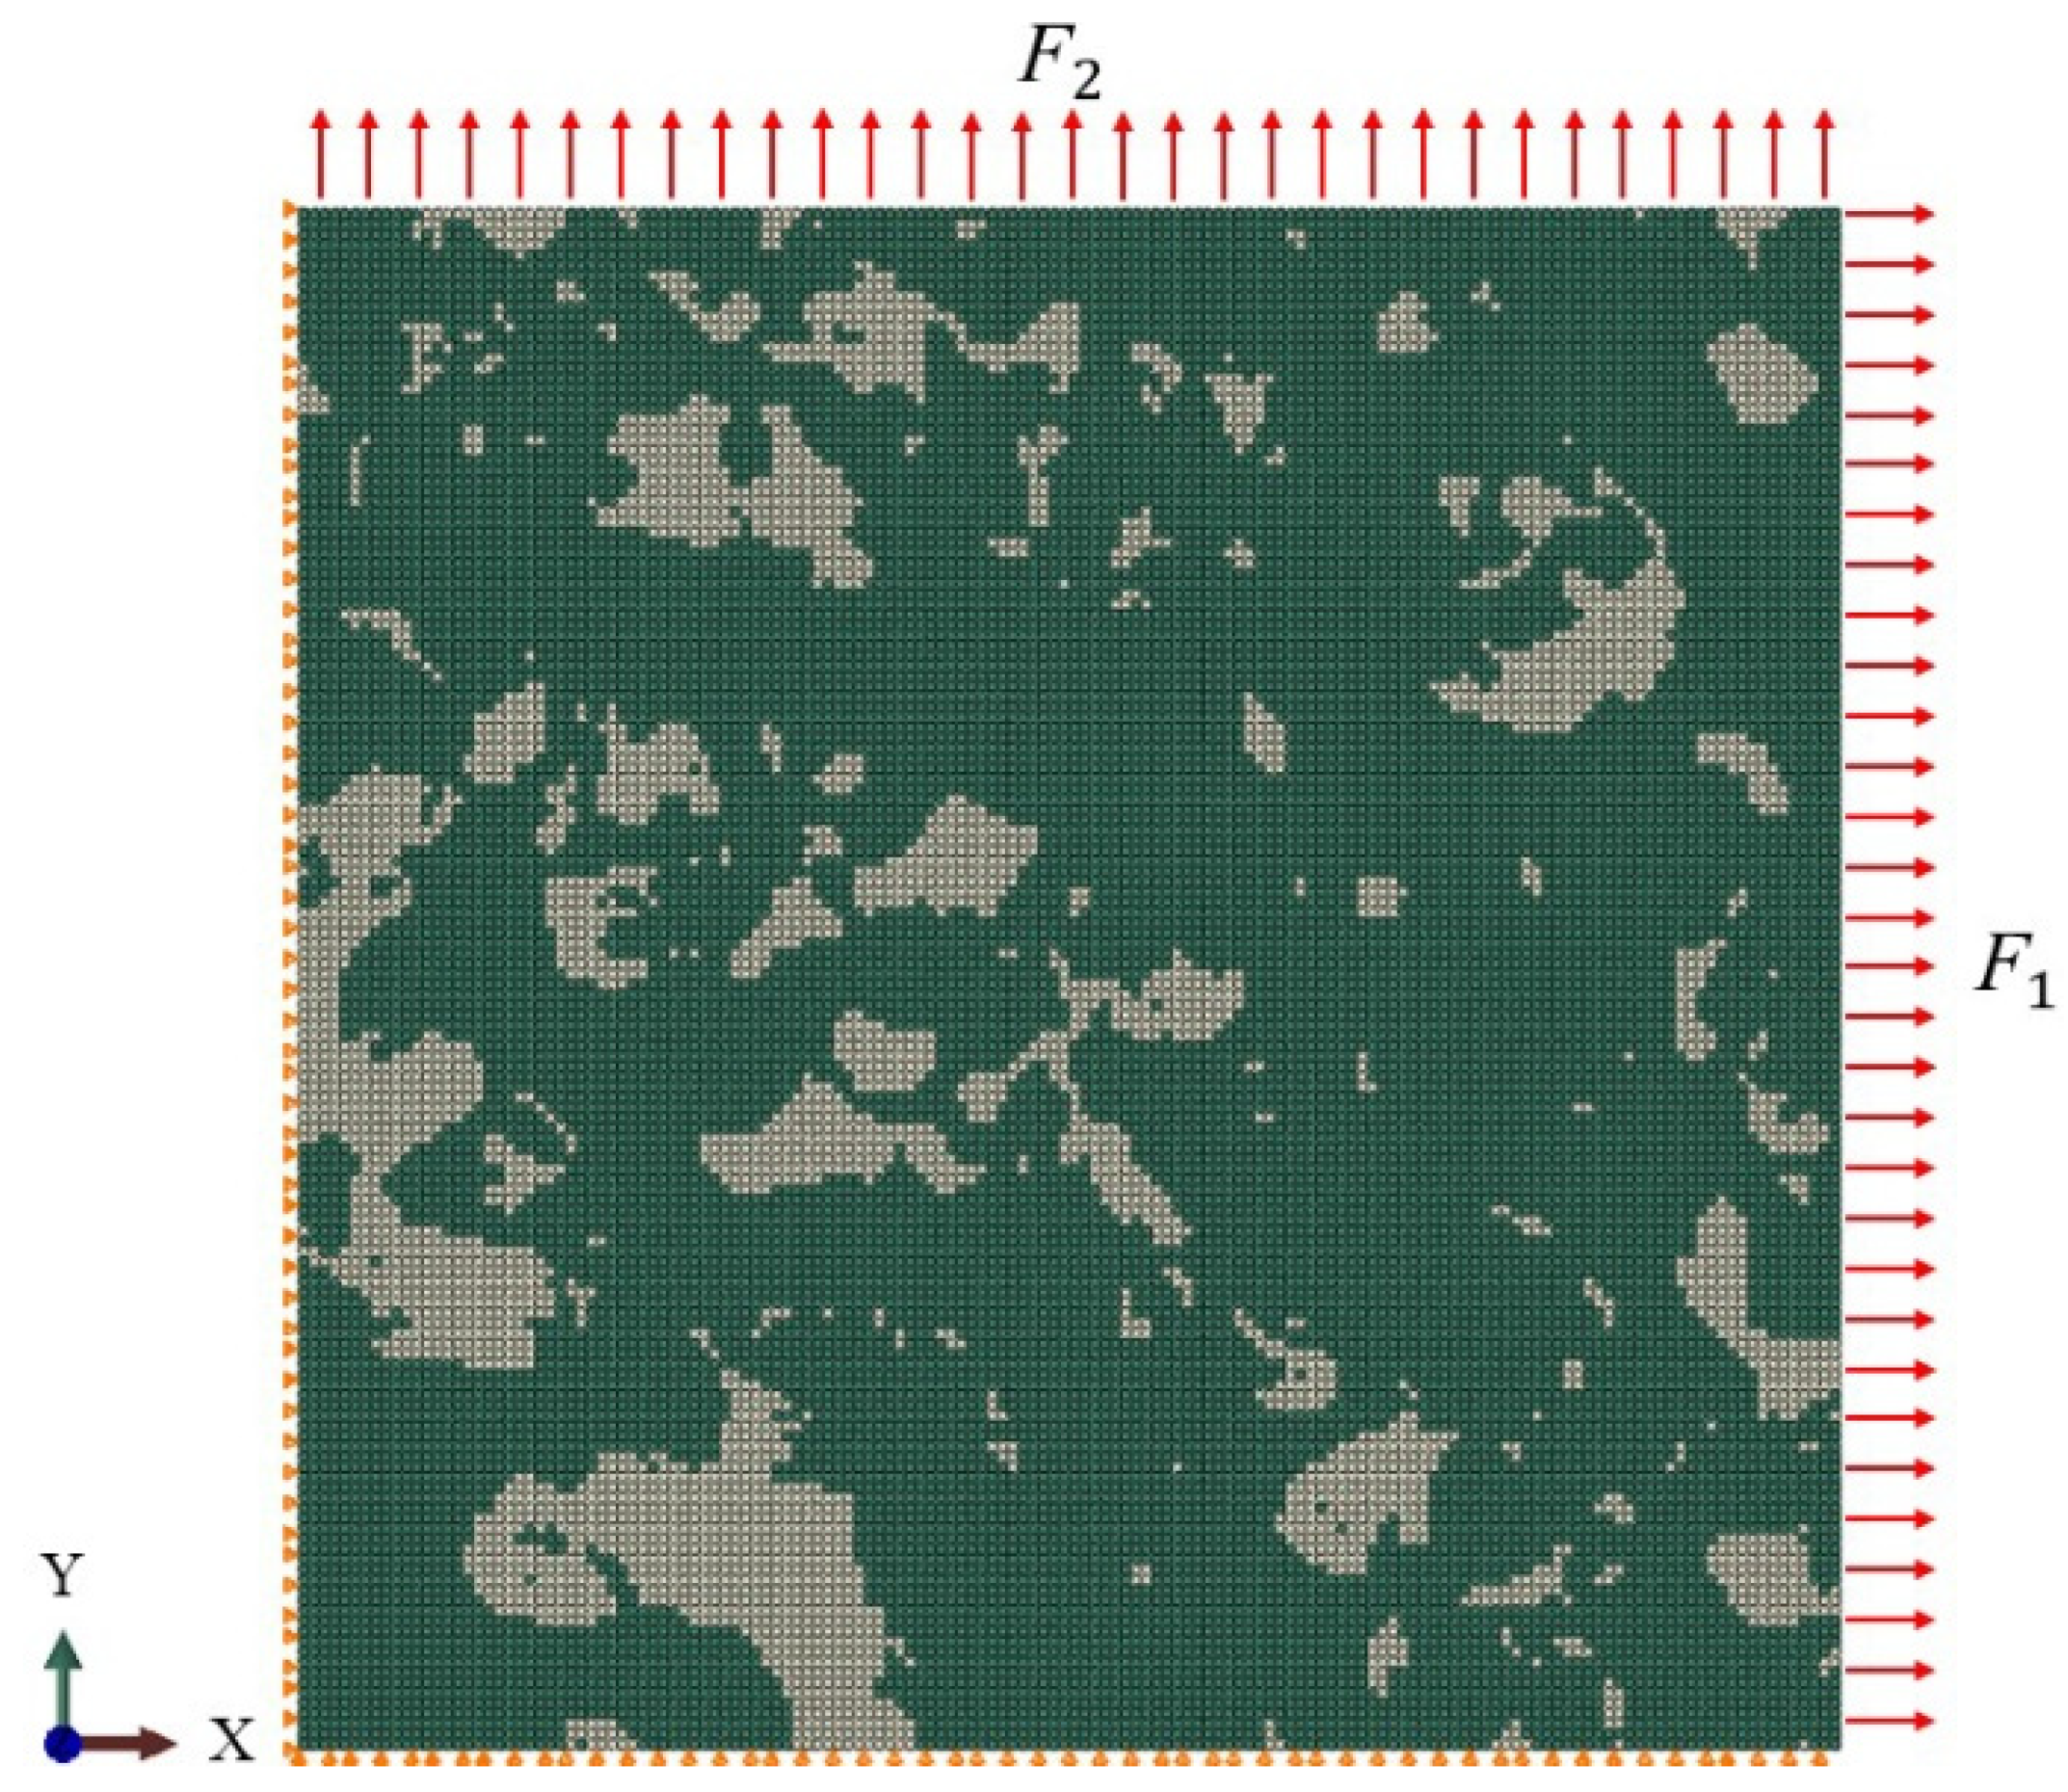
Figure 16.
Boundary conditions for RVE simulations (the left edge and bottom edge were both fixed in the X- and Y-direction, and the uniform loads and were applied on the right and at the top which was fixed and was varied).
Figure 16.
Boundary conditions for RVE simulations (the left edge and bottom edge were both fixed in the X- and Y-direction, and the uniform loads and were applied on the right and at the top which was fixed and was varied).
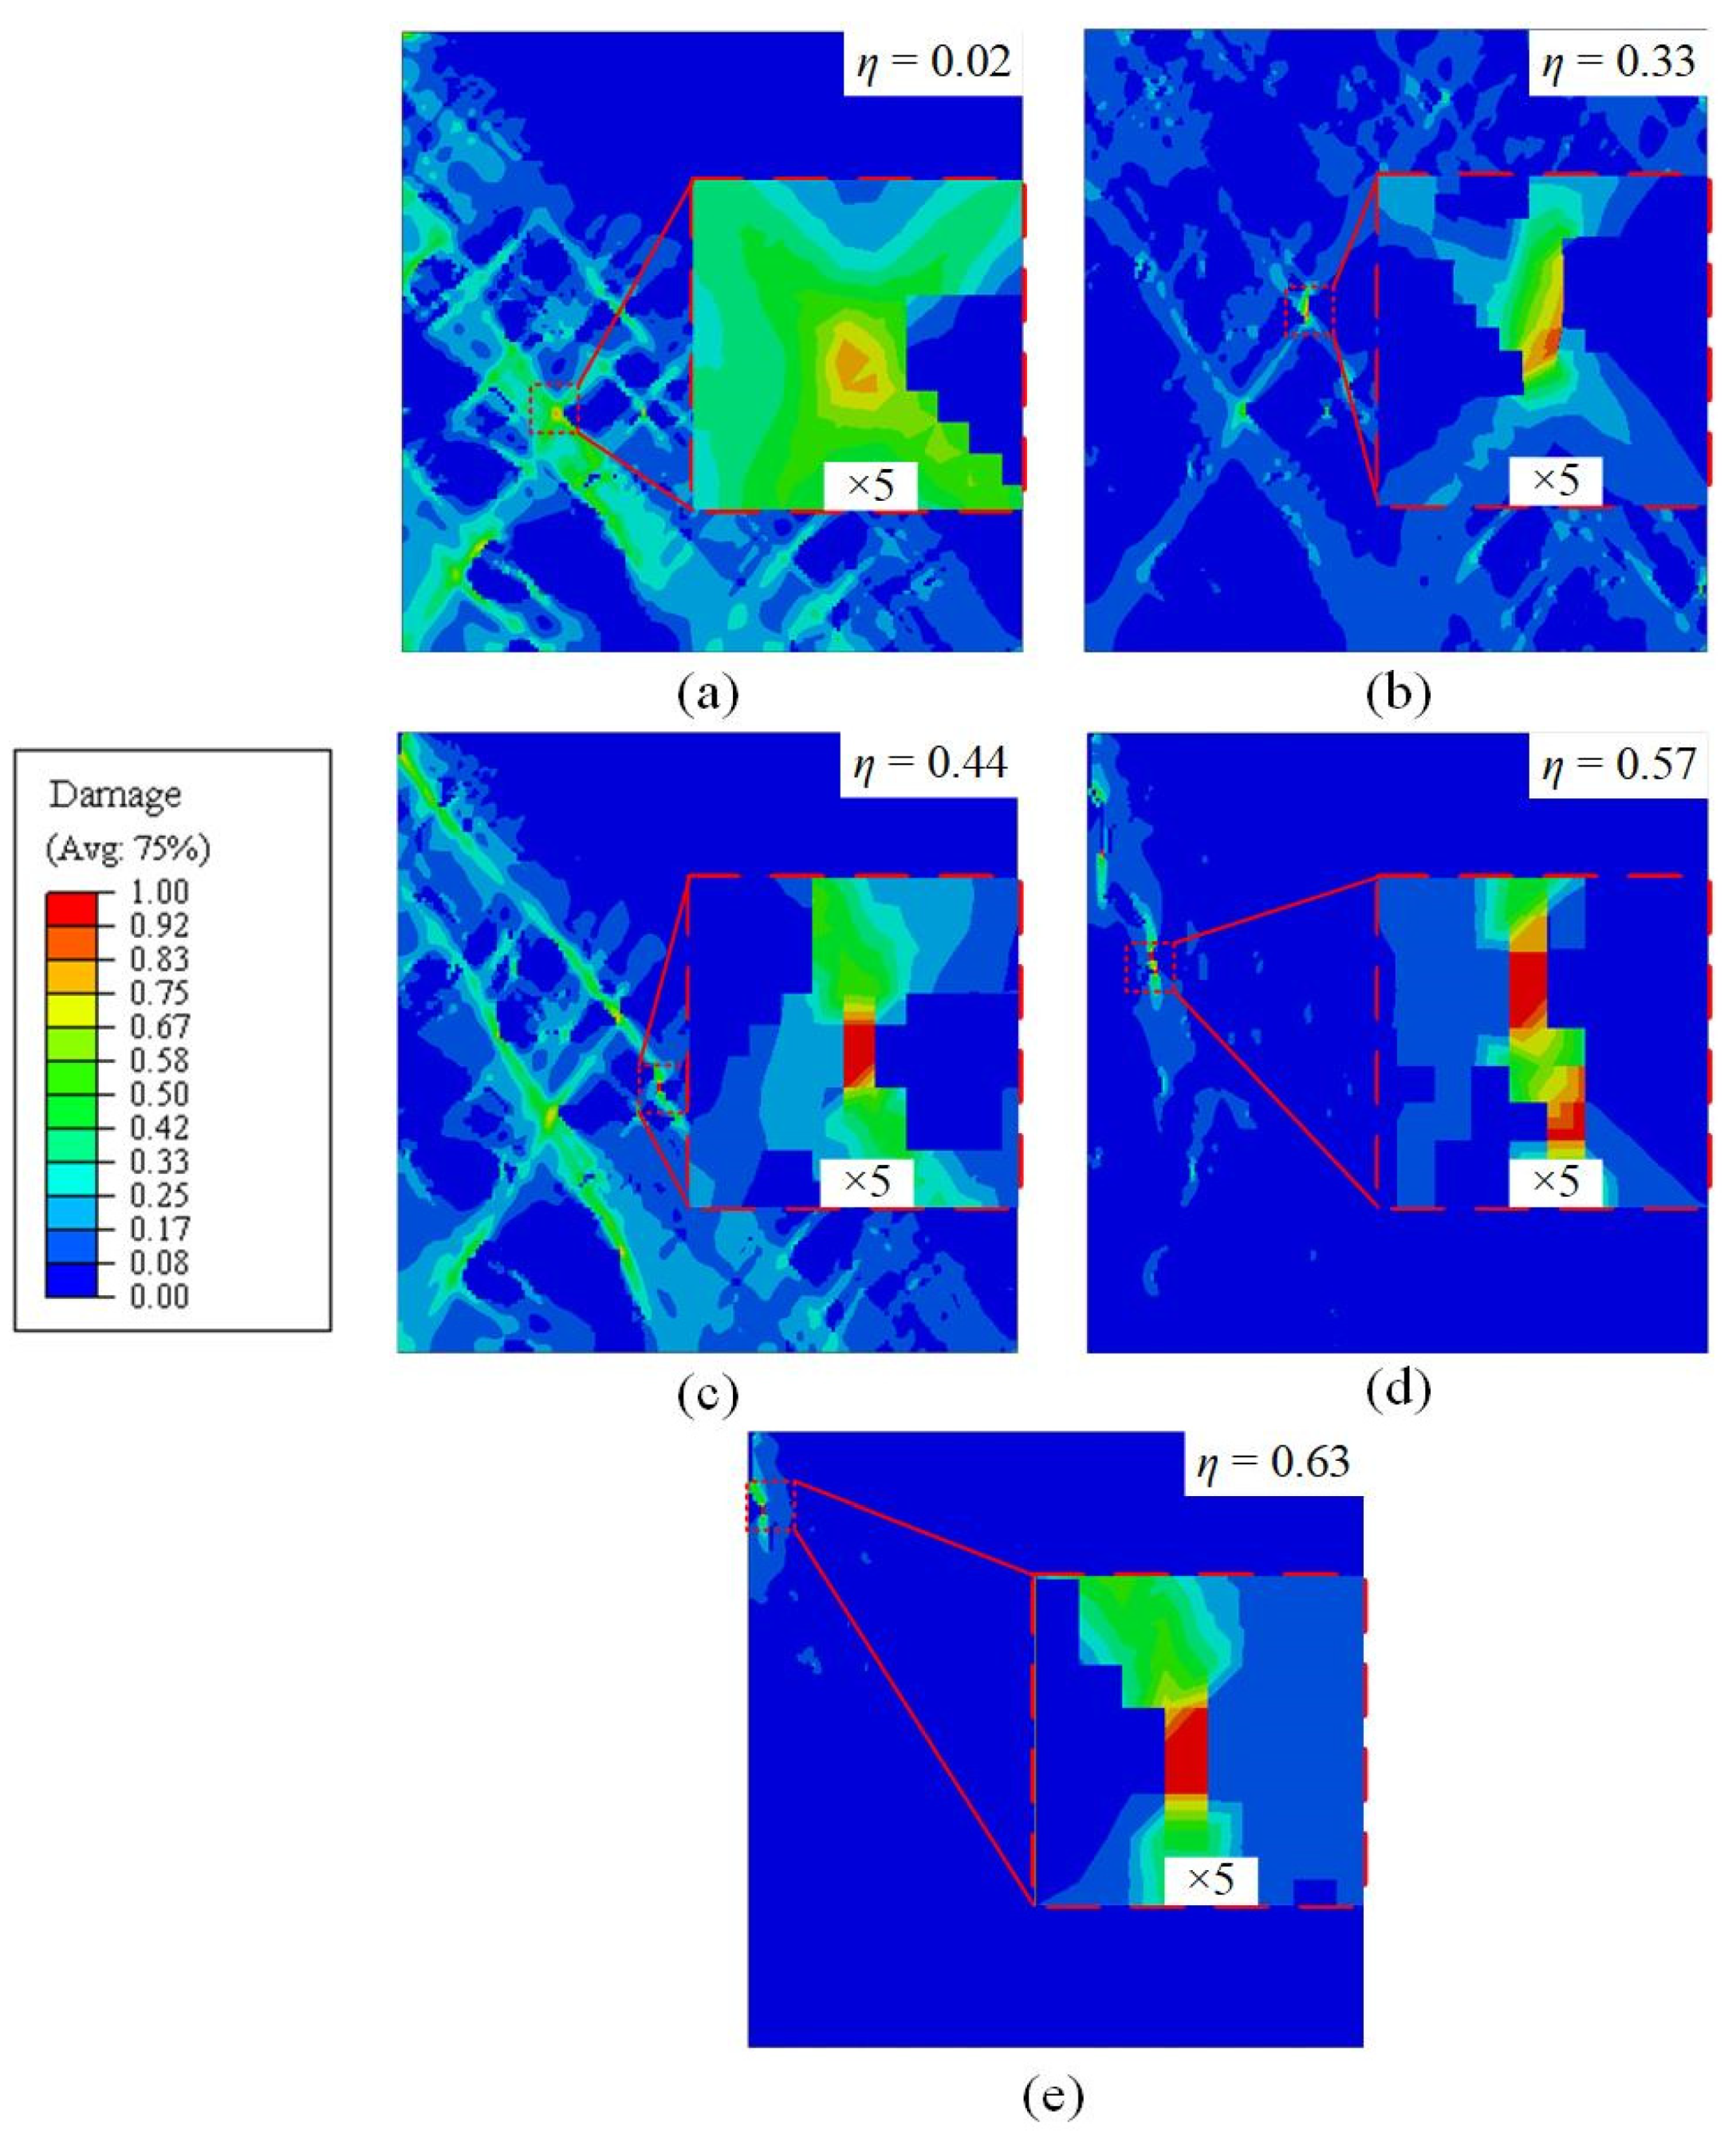
Figure 17.
Simulated distribution of ductile damage initiation in RVEs for the mixed B/M microstructures in varying loading conditions: (a) pure shear; (b) uniaxial tension; (c) uniaxial tension with a central hole; (d) plane strain tension; (e) equi-biaxial tension.
Figure 17.
Simulated distribution of ductile damage initiation in RVEs for the mixed B/M microstructures in varying loading conditions: (a) pure shear; (b) uniaxial tension; (c) uniaxial tension with a central hole; (d) plane strain tension; (e) equi-biaxial tension.
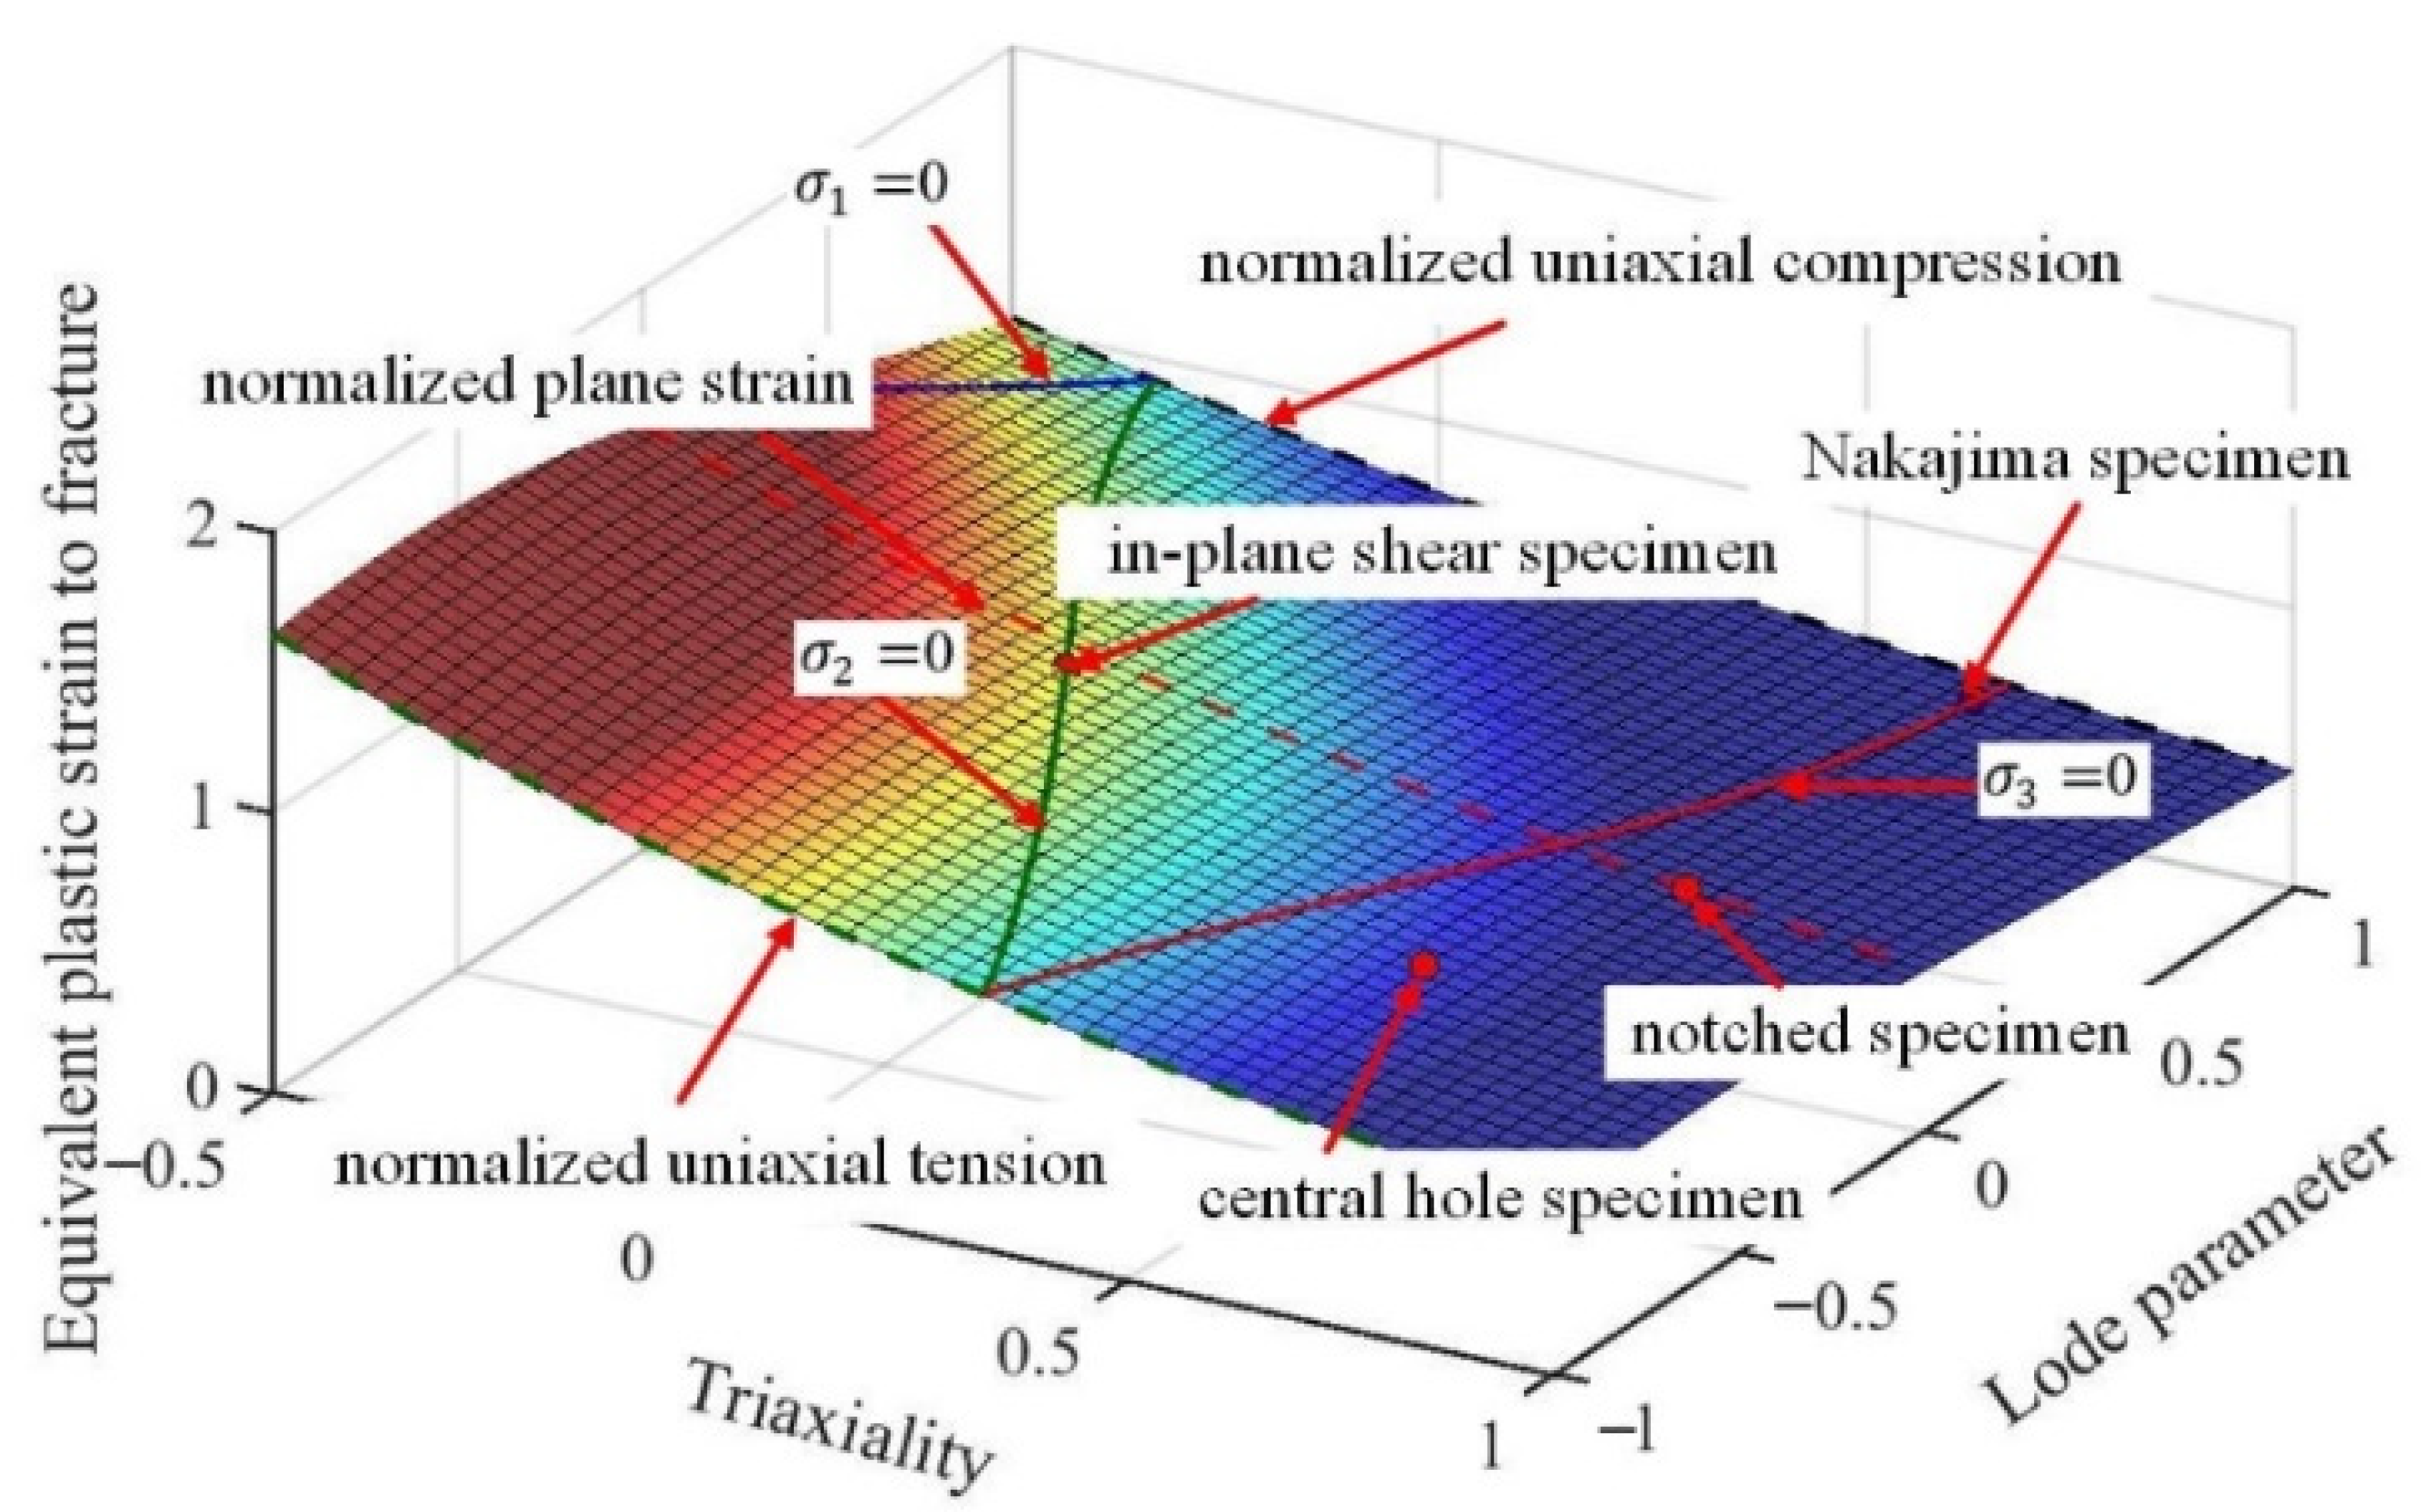
Figure 18.
Fracture locus constructed based on the obtained fracture strains in different stress states and compared with experimental data for 80%B + 20%M specimens (red dots denote experimental values).
Figure 18.
Fracture locus constructed based on the obtained fracture strains in different stress states and compared with experimental data for 80%B + 20%M specimens (red dots denote experimental values).
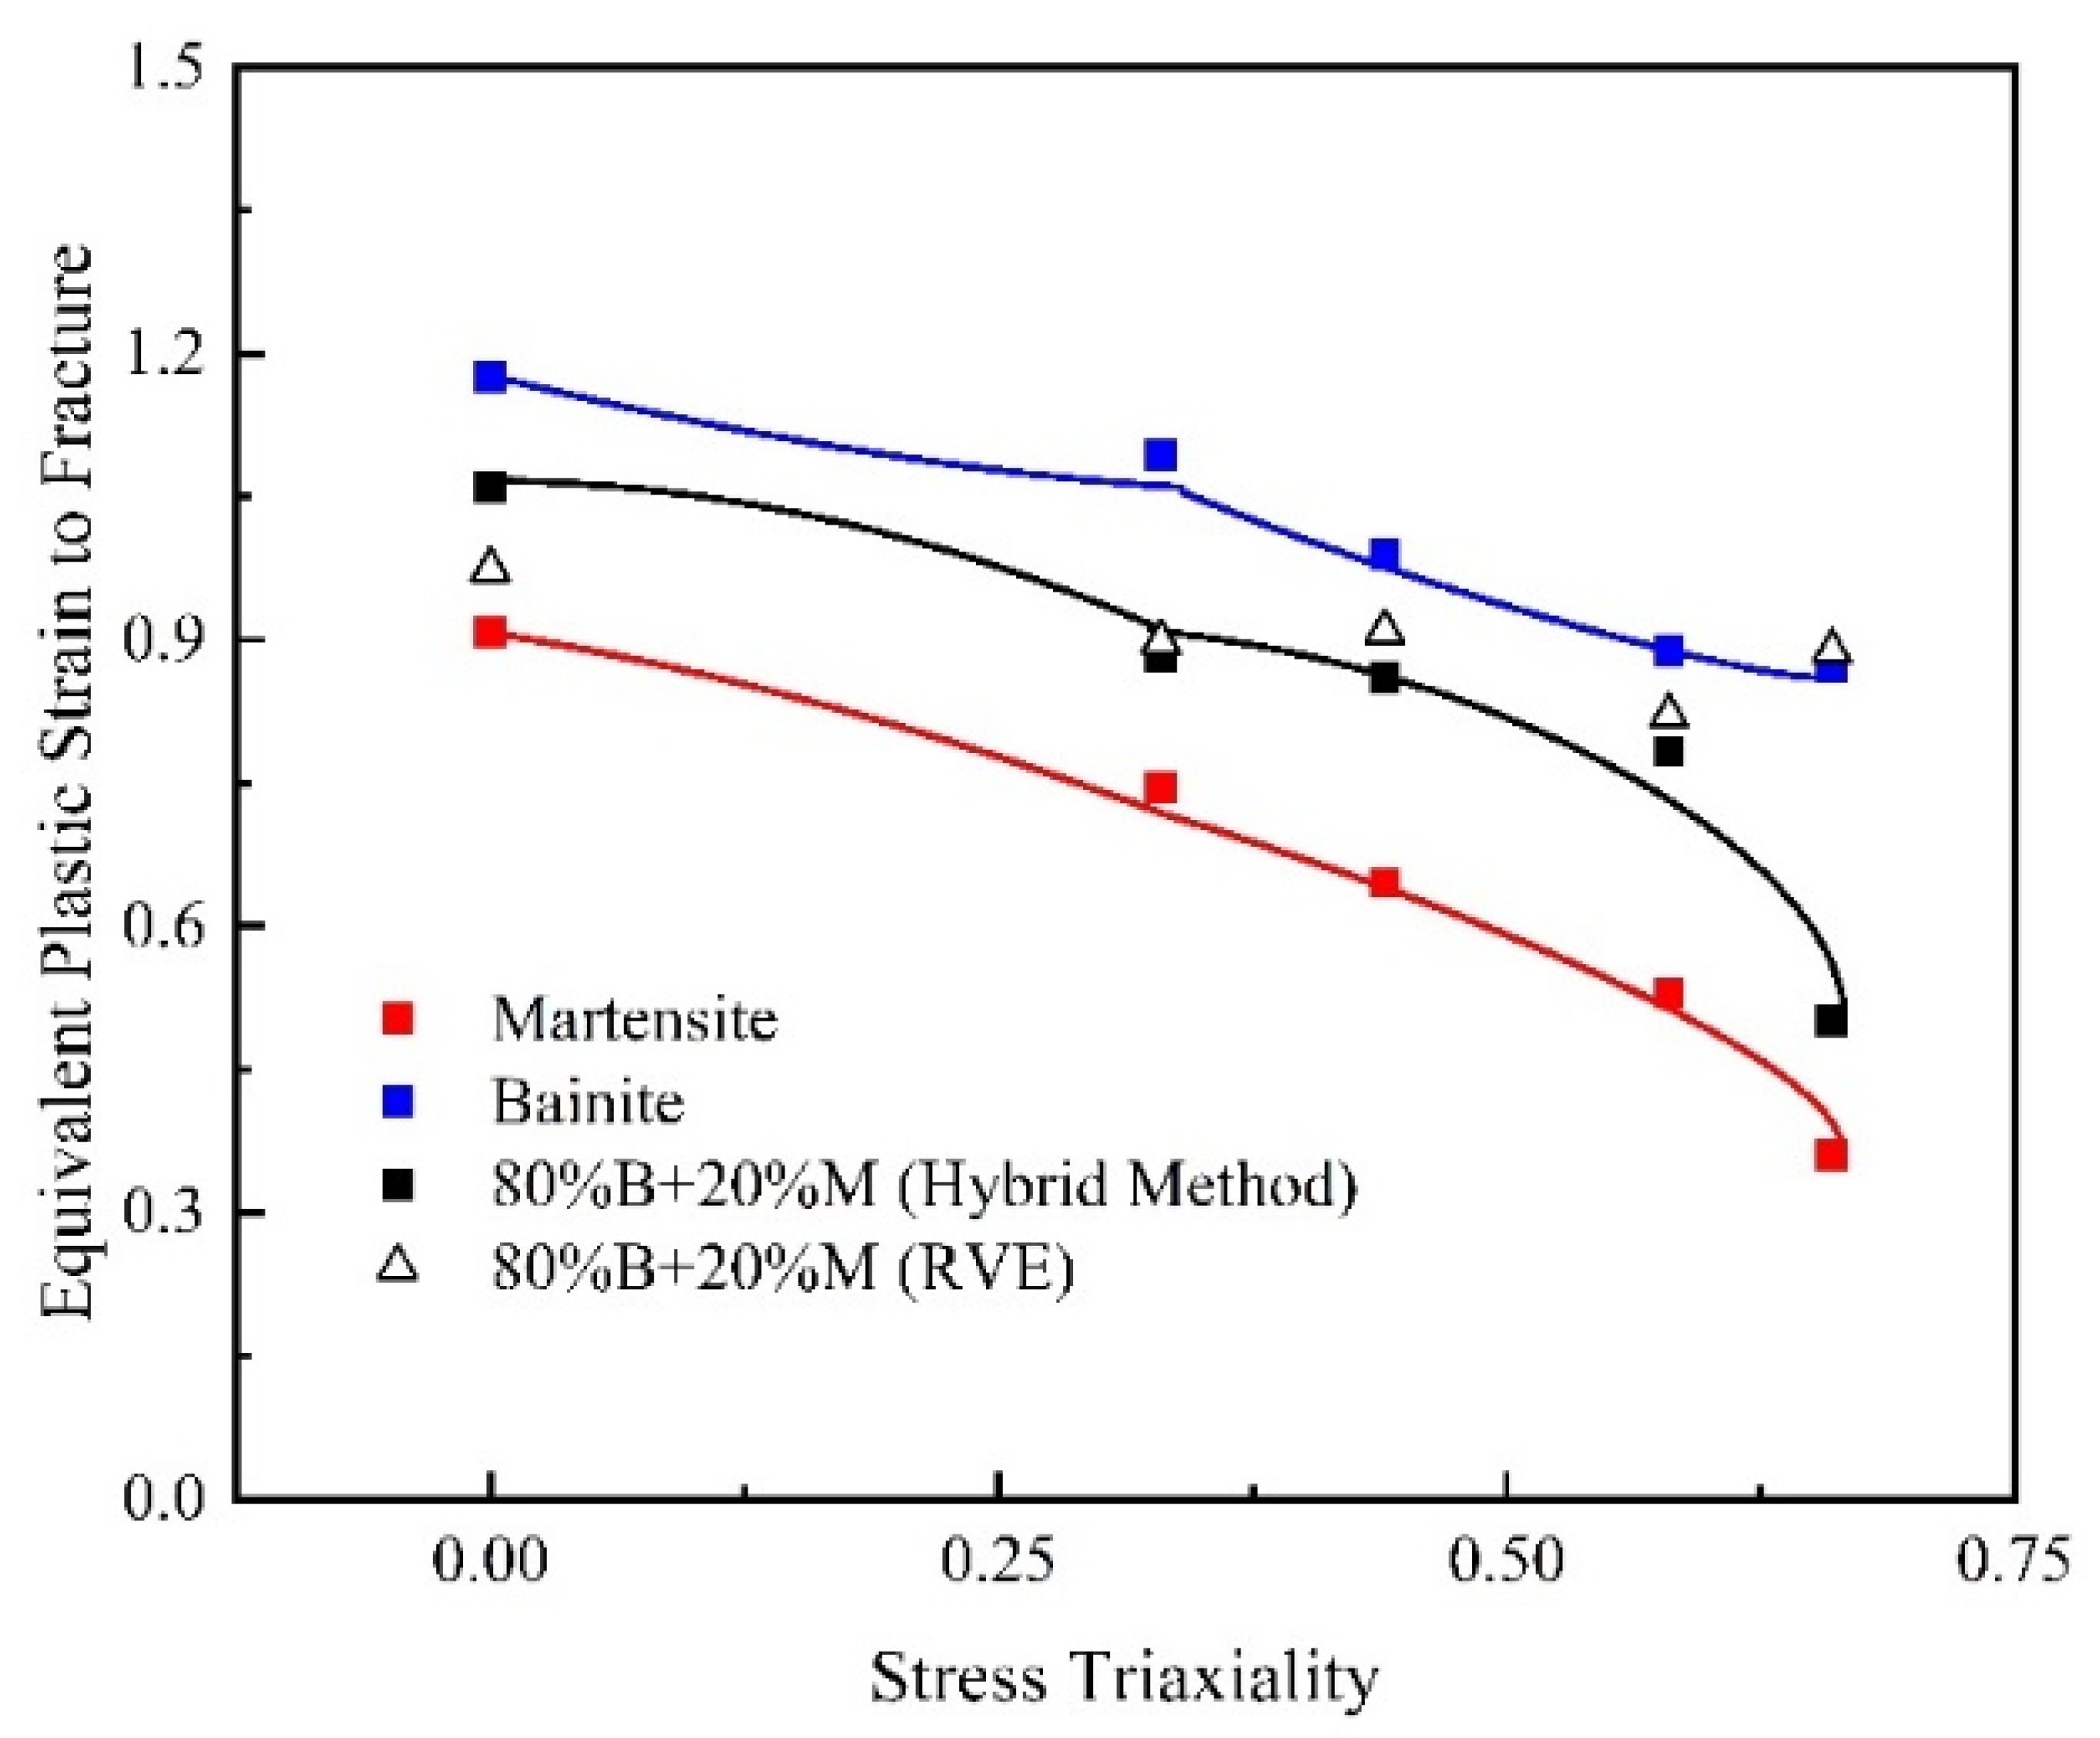
Figure 19.
Predicted damage curves for B/M mixed microstructure and compared with damage curves of pure bainite and martensite (blue indicates bainite specimens, red indicates martensite specimens, and black indicates 80%B + 20%M specimens).
Figure 19.
Predicted damage curves for B/M mixed microstructure and compared with damage curves of pure bainite and martensite (blue indicates bainite specimens, red indicates martensite specimens, and black indicates 80%B + 20%M specimens).
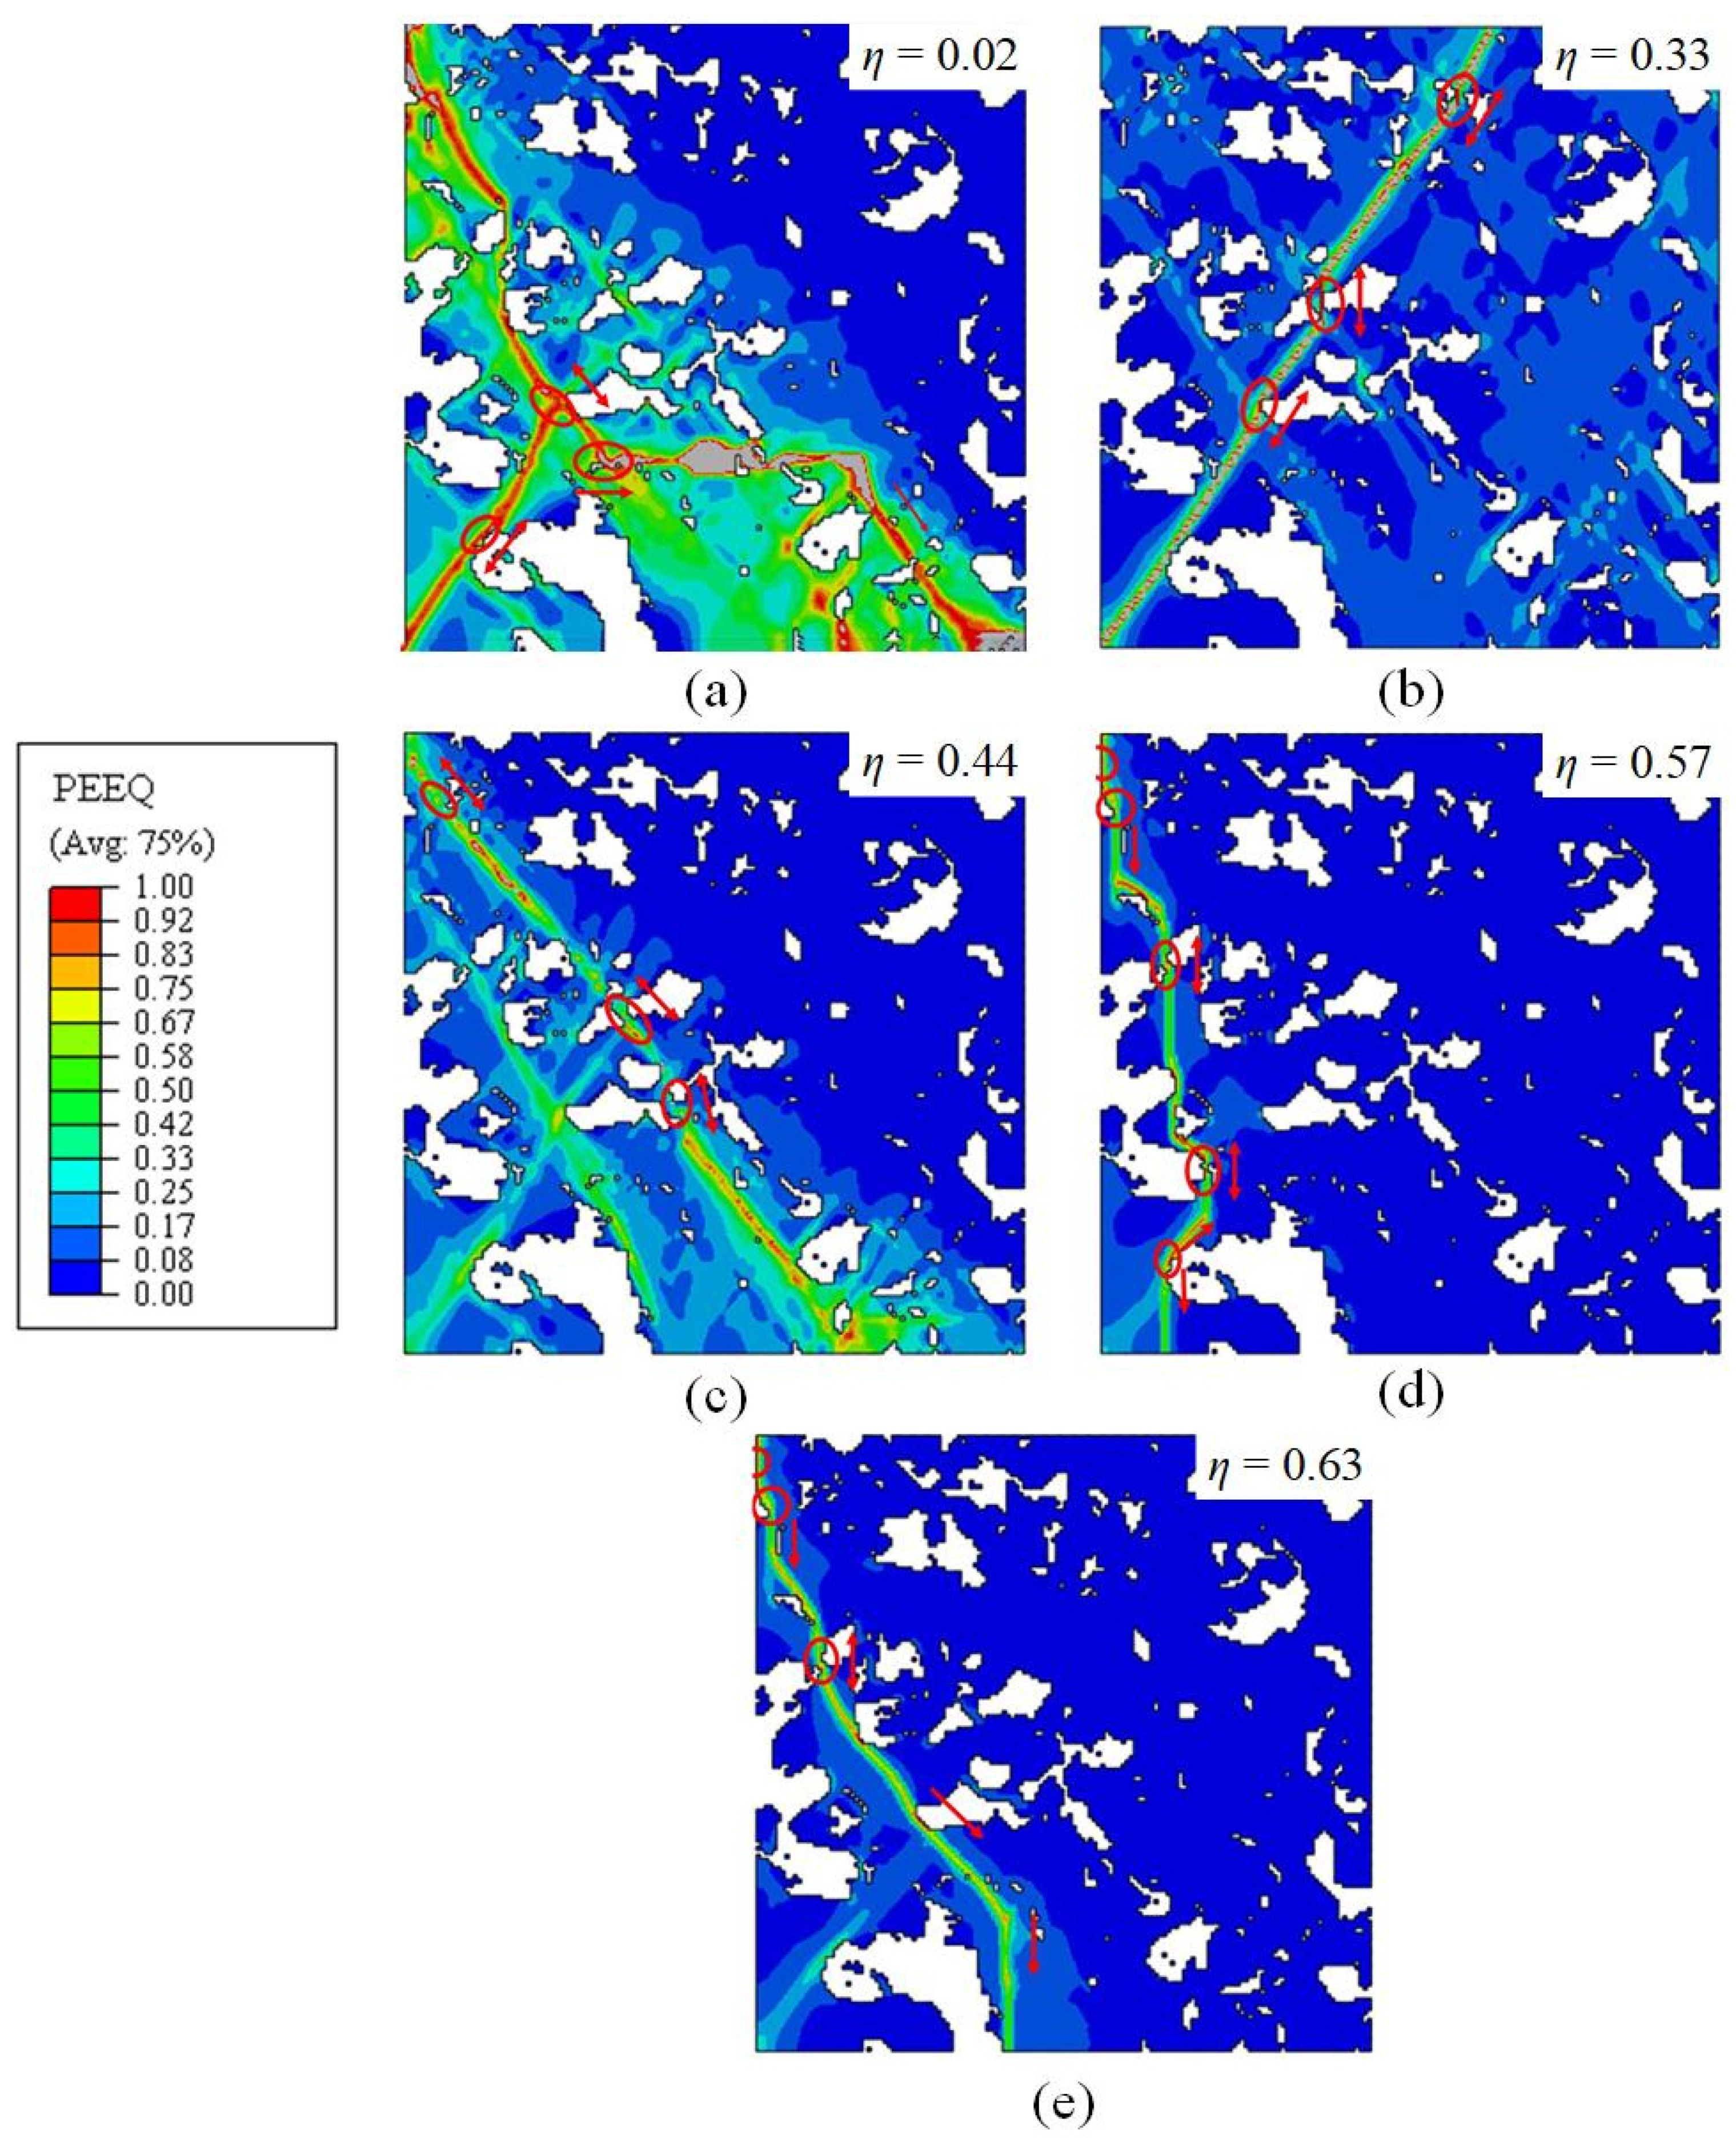
Figure 20.
Calculated PEEQ in RVE under different loading conditions for the B/M microstructure (80%B + 20%M): (a) pure shear; (b) uniaxial tension; (c) uniaxial tension with a central hole; (d) plane strain tension; (e) equi-biaxial tension (white zones indicate the martensite phase, red circles denote the initiation positions of the failure and arrows indicate the directions of SBP).
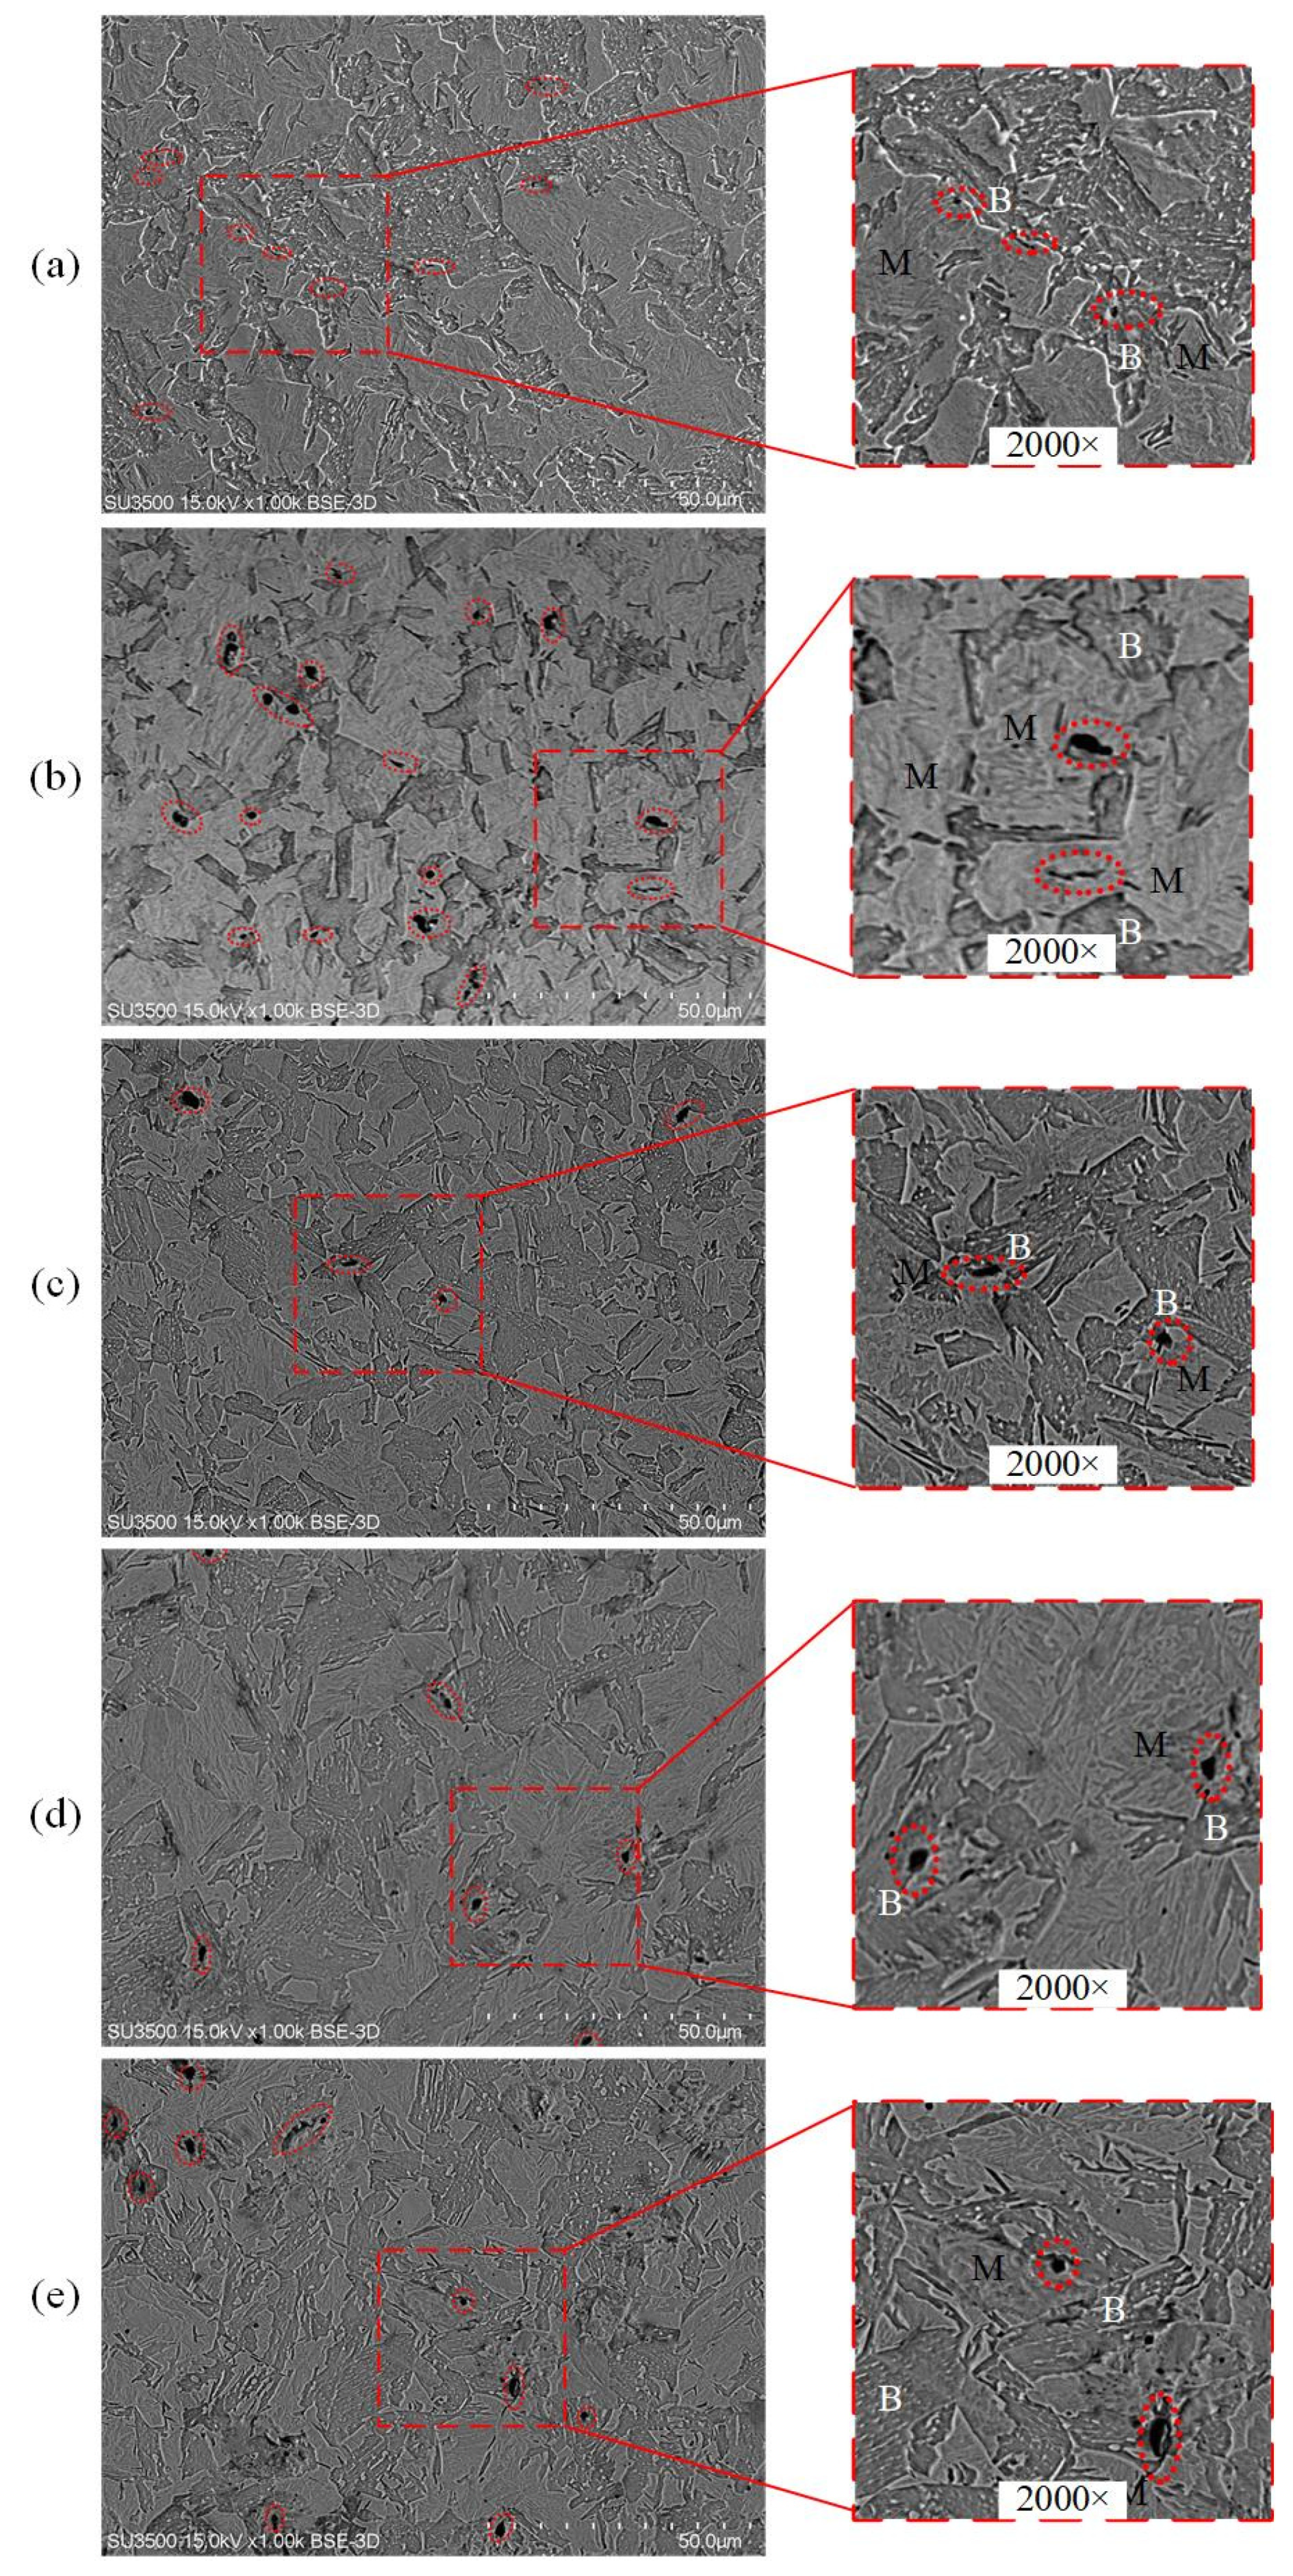
Figure 21.
SEM micrographs showing void initiation and crack growth for 30%B + 70%M specimens under varying stress states: (a) pure shear specimen; (b) dogbone uniaxial tension specimen; (c) uniaxial tension specimen with a central hole; (d) plane strain tension specimen; (e) equi-biaxial tension specimen.
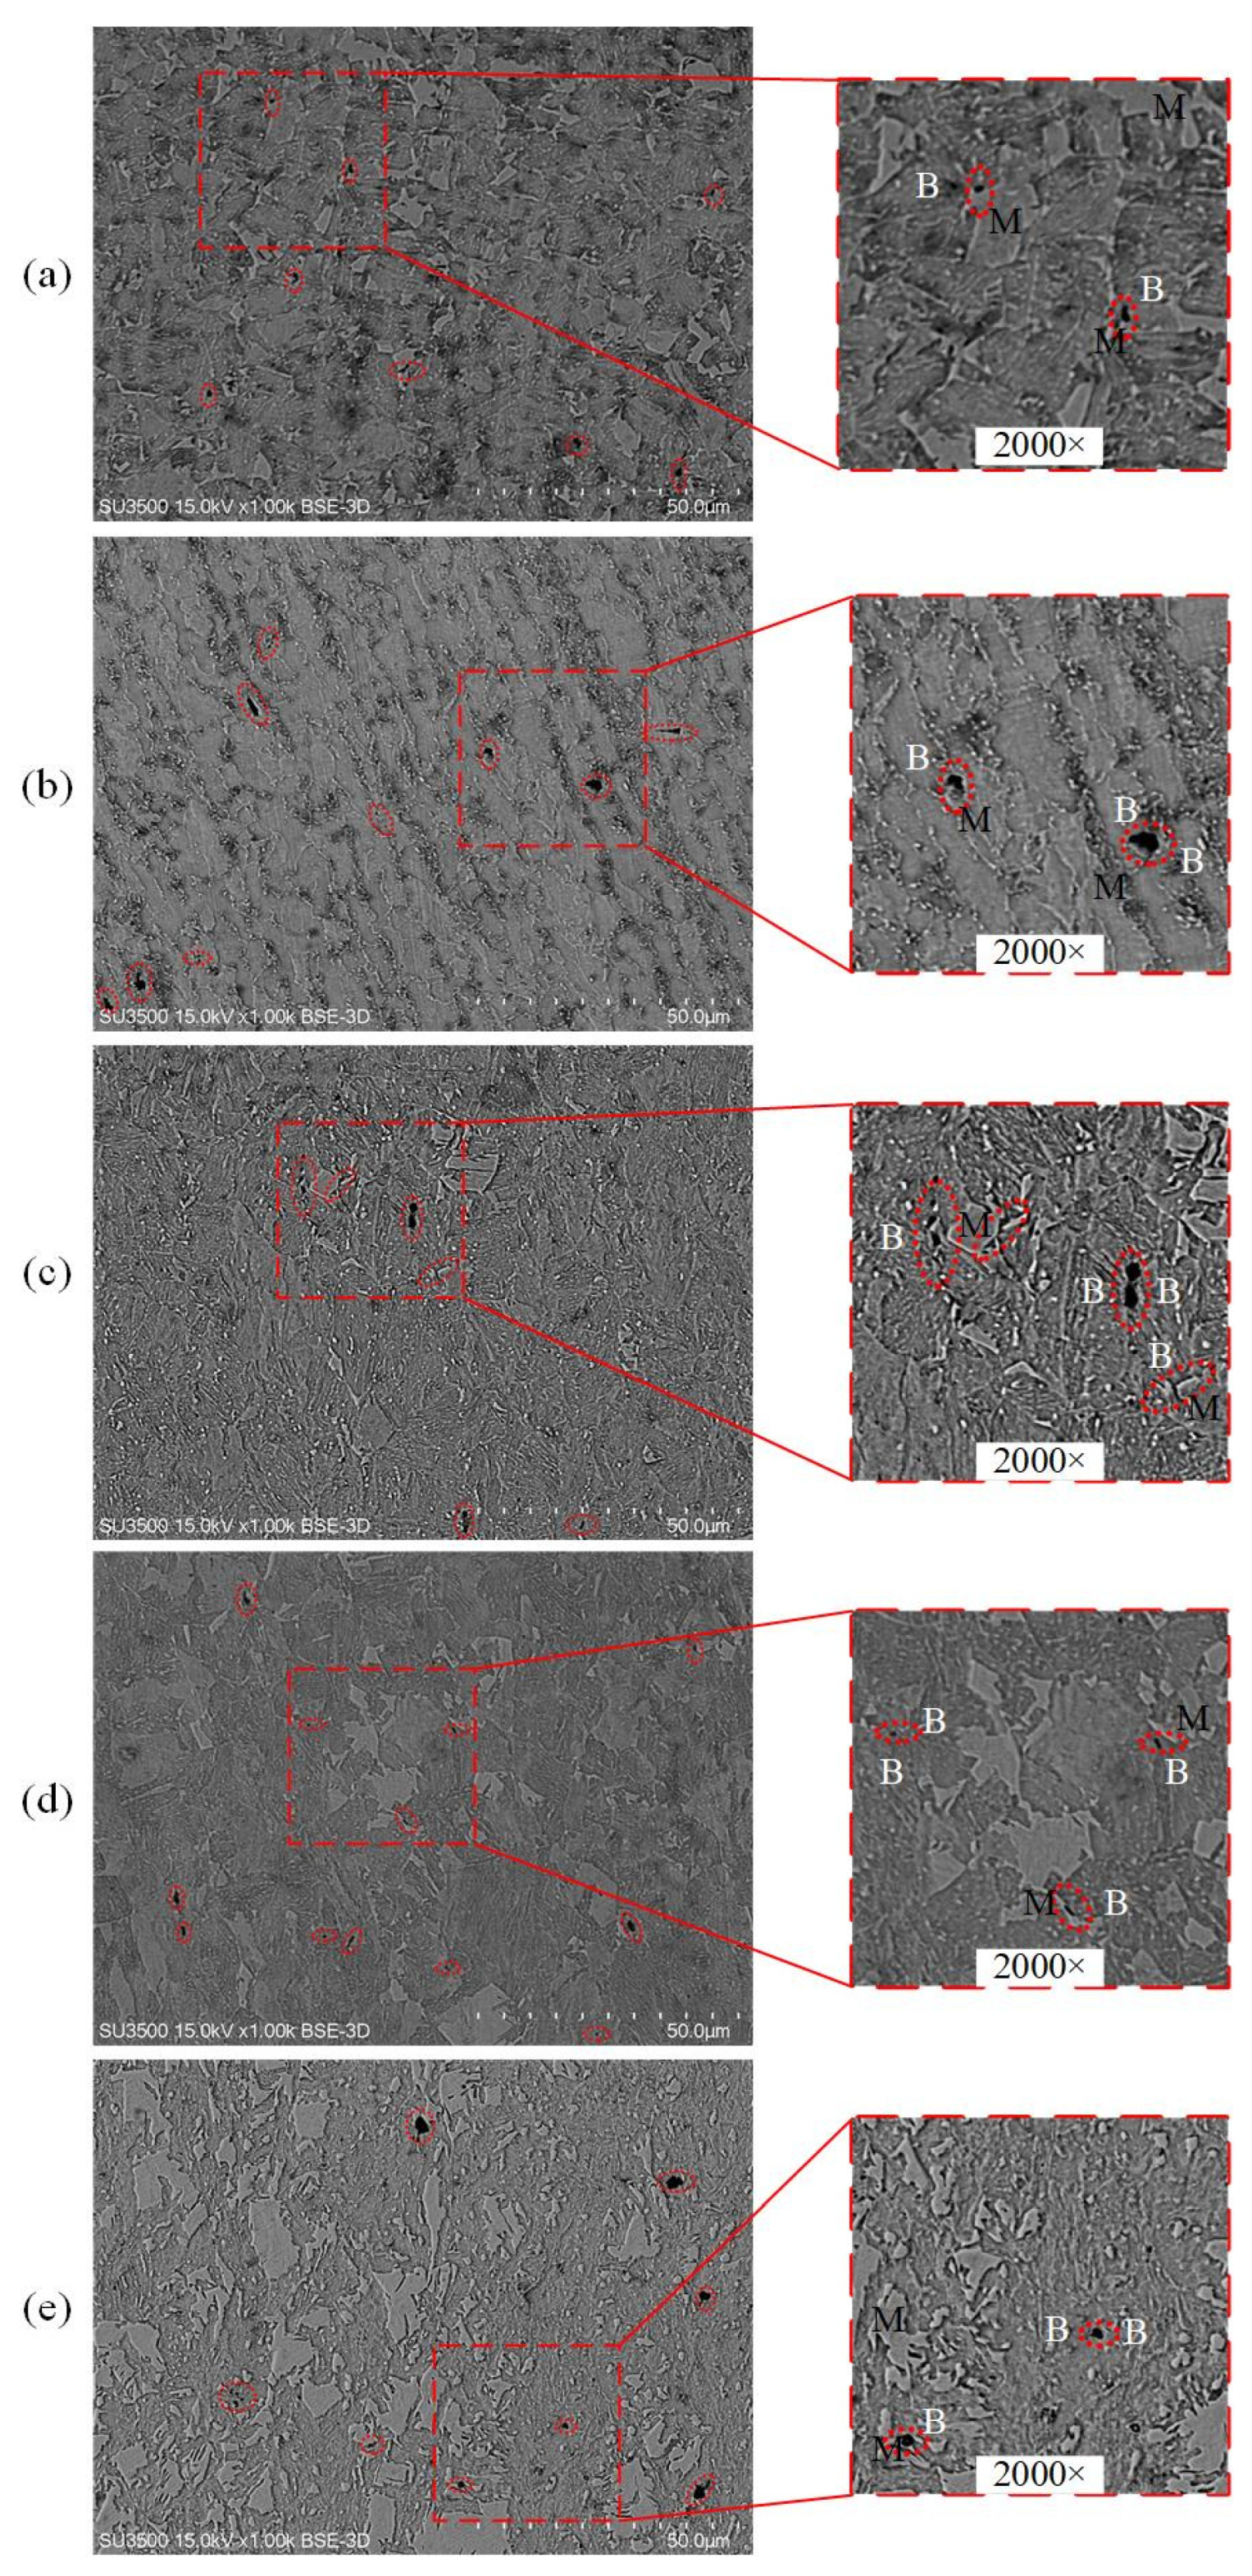
Figure 22.
SEM micrographs showing void initiation and crack growth for 80%B + 20%M specimens under varying stress states: (a) pure shear specimen; (b) dogbone uniaxial tension specimen; (c) uniaxial tension specimen with a central hole; (d) plane strain tension specimen; (e) equi-biaxial tension specimen.
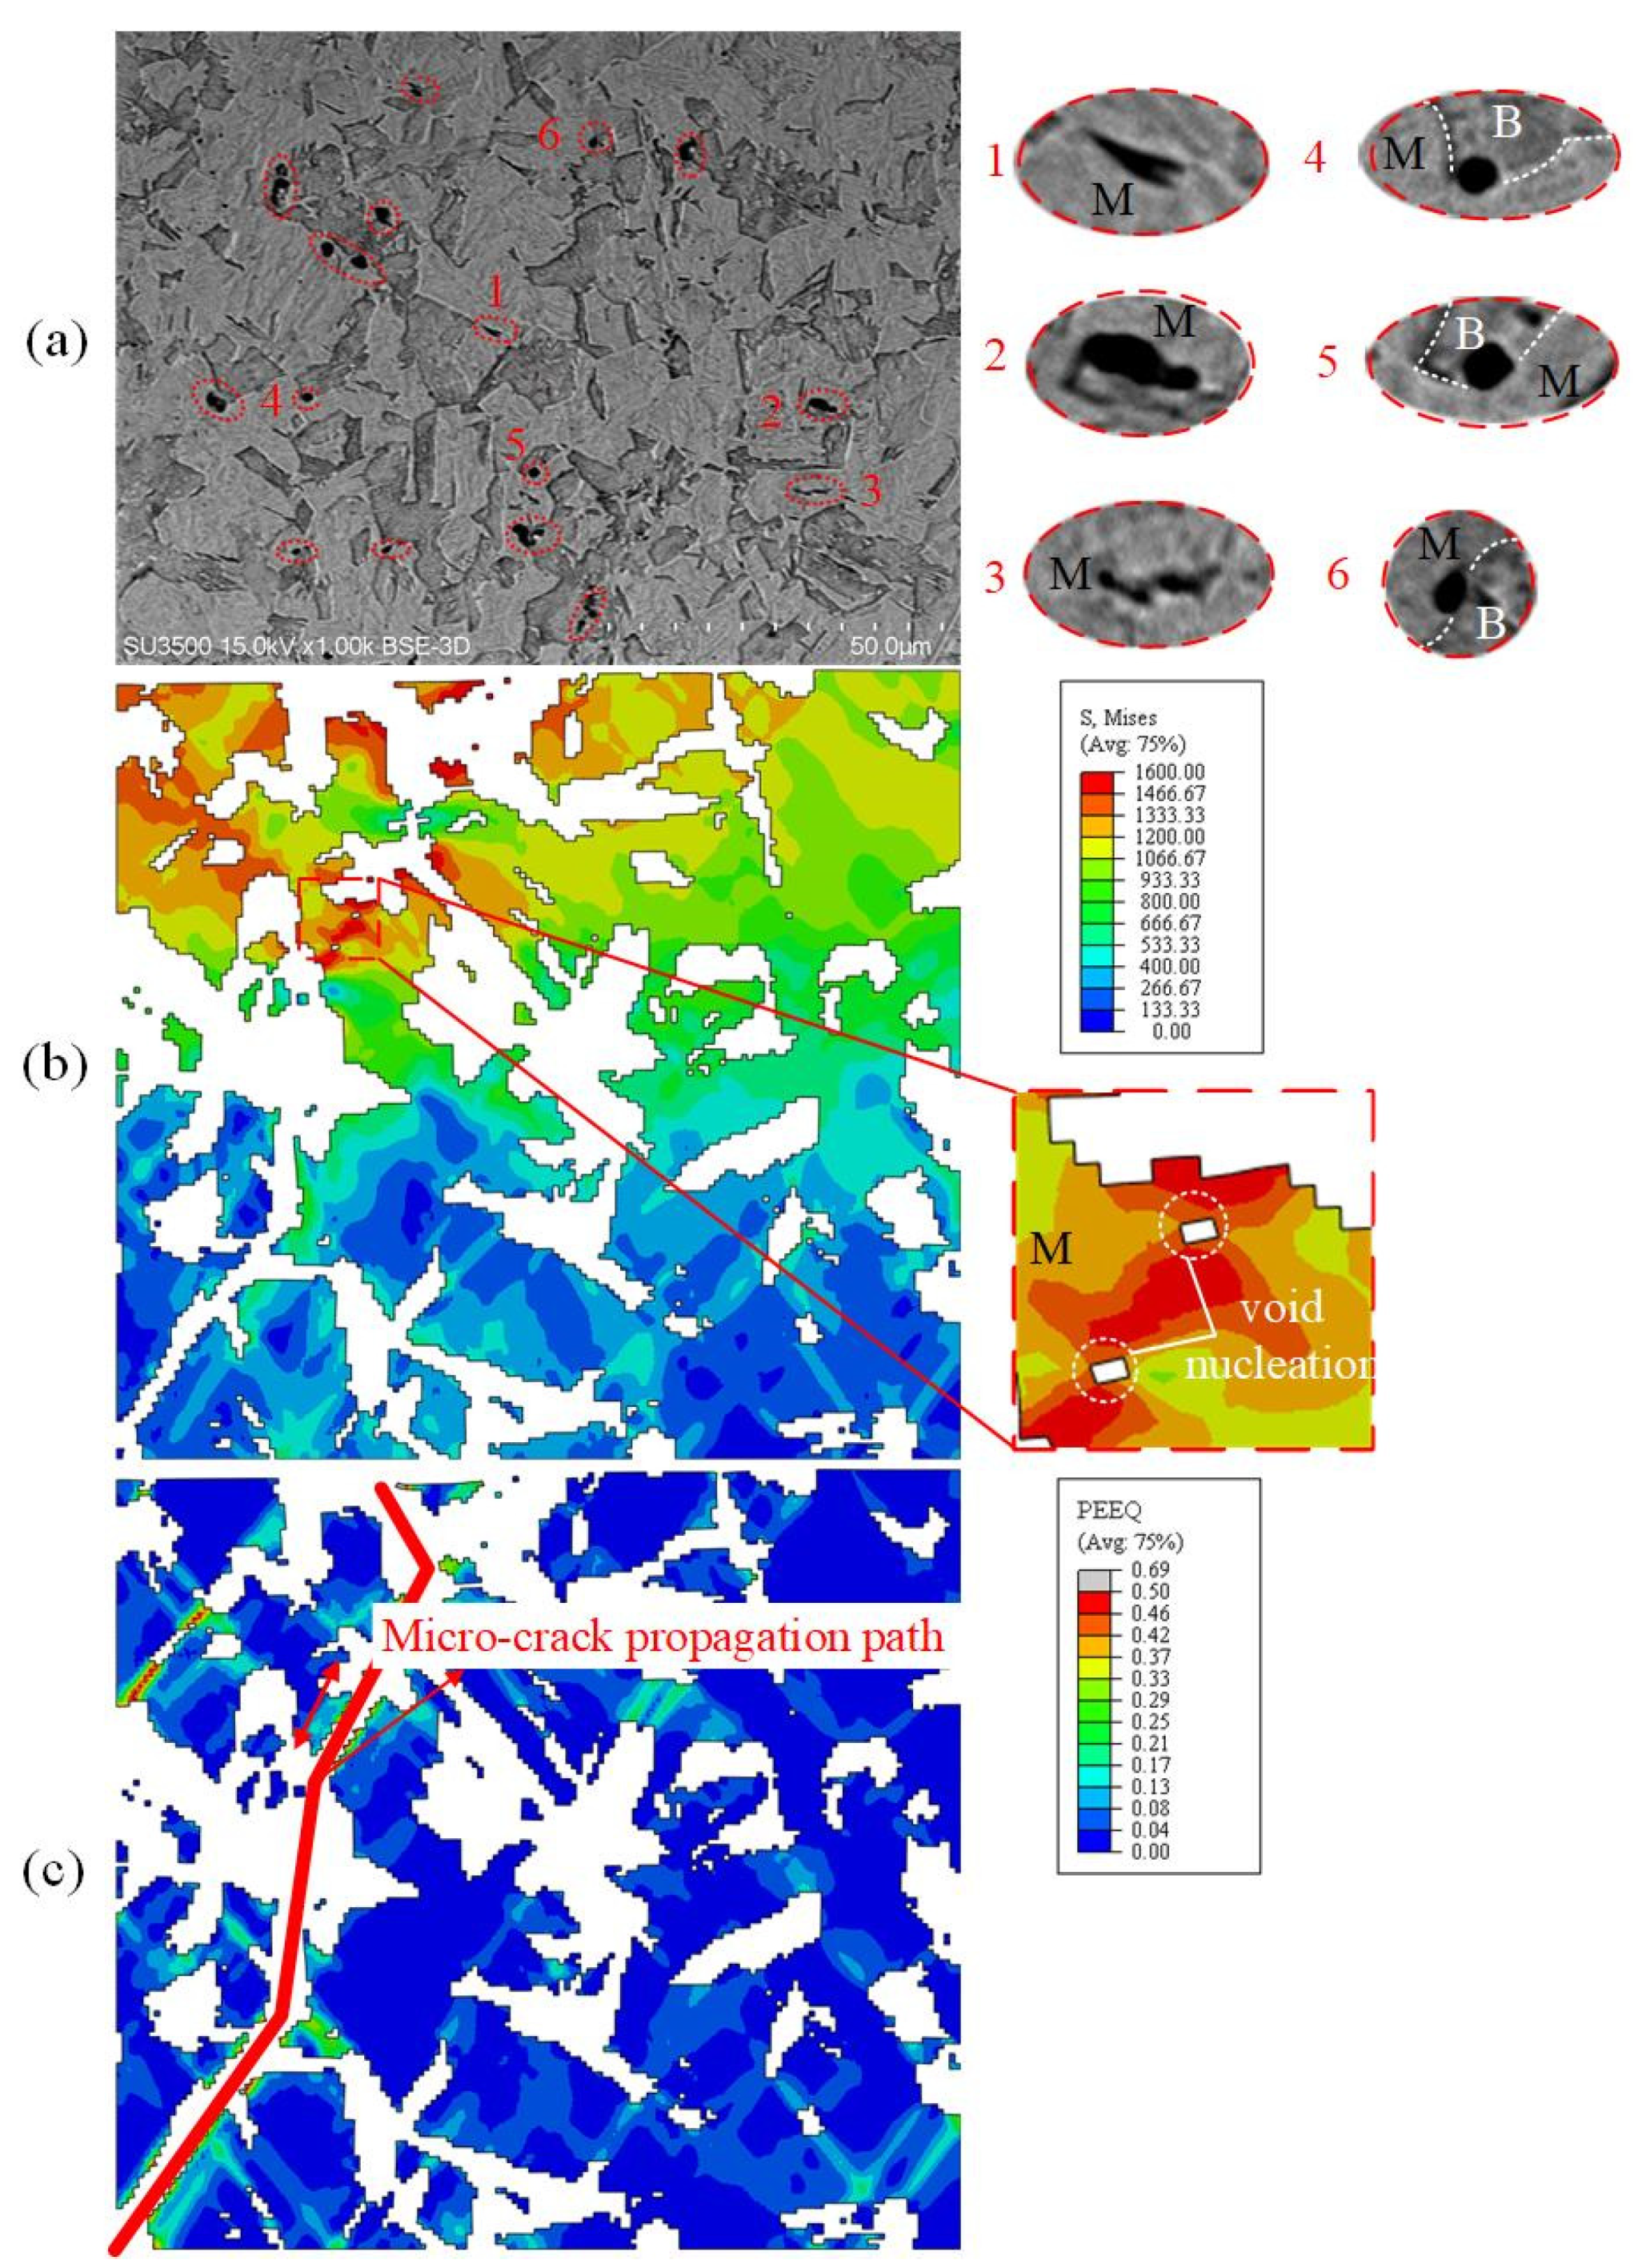
Figure 23.
Comparison between SEM and simulation of 30%B + 70%M uniaxial tensile specimens: (a) SEM micrographs of damage mechanisms; (b) von Mises equivalent stress during void nucleation; (c) PEEQ at complete fracture.
Figure 23.
Comparison between SEM and simulation of 30%B + 70%M uniaxial tensile specimens: (a) SEM micrographs of damage mechanisms; (b) von Mises equivalent stress during void nucleation; (c) PEEQ at complete fracture.
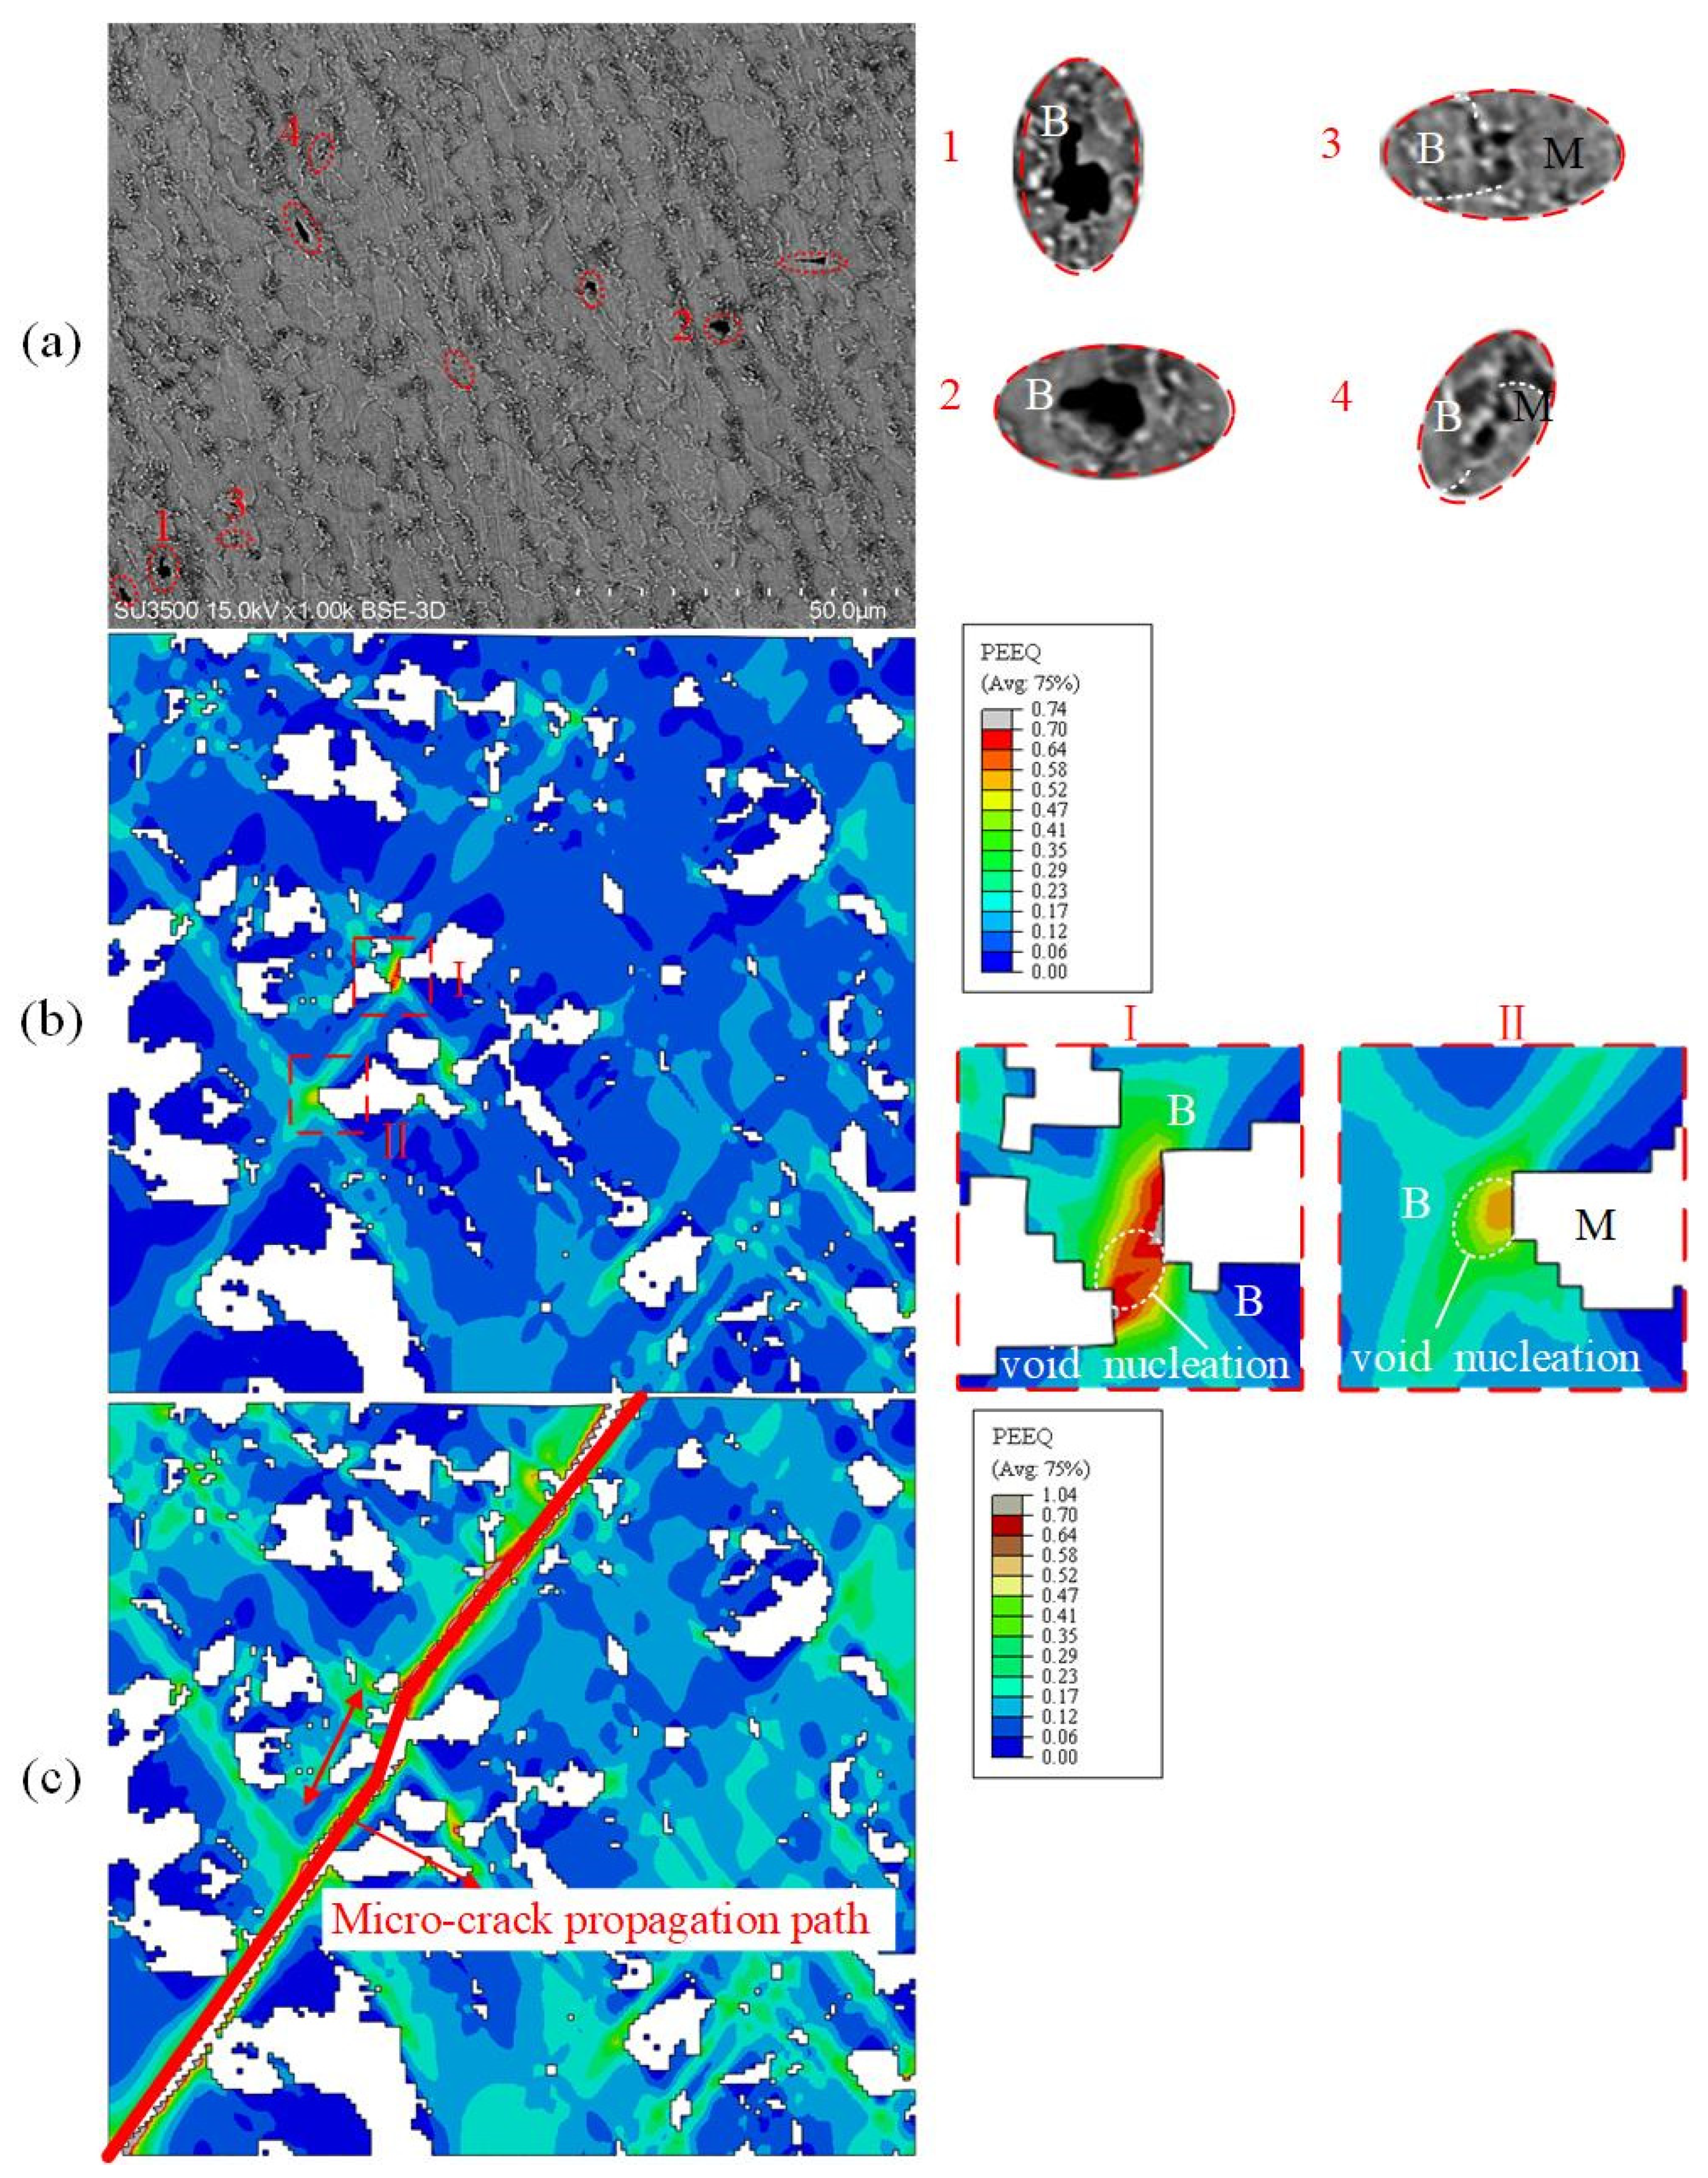
Figure 24.
Comparison between SEM and simulation of 80%B + 20%M uniaxial tensile specimens: (a) SEM micrographs of damage mechanisms; (b) PEEQ during void nucleation; (c) PEEQ at complete fracture.
Figure 24.
Comparison between SEM and simulation of 80%B + 20%M uniaxial tensile specimens: (a) SEM micrographs of damage mechanisms; (b) PEEQ during void nucleation; (c) PEEQ at complete fracture.
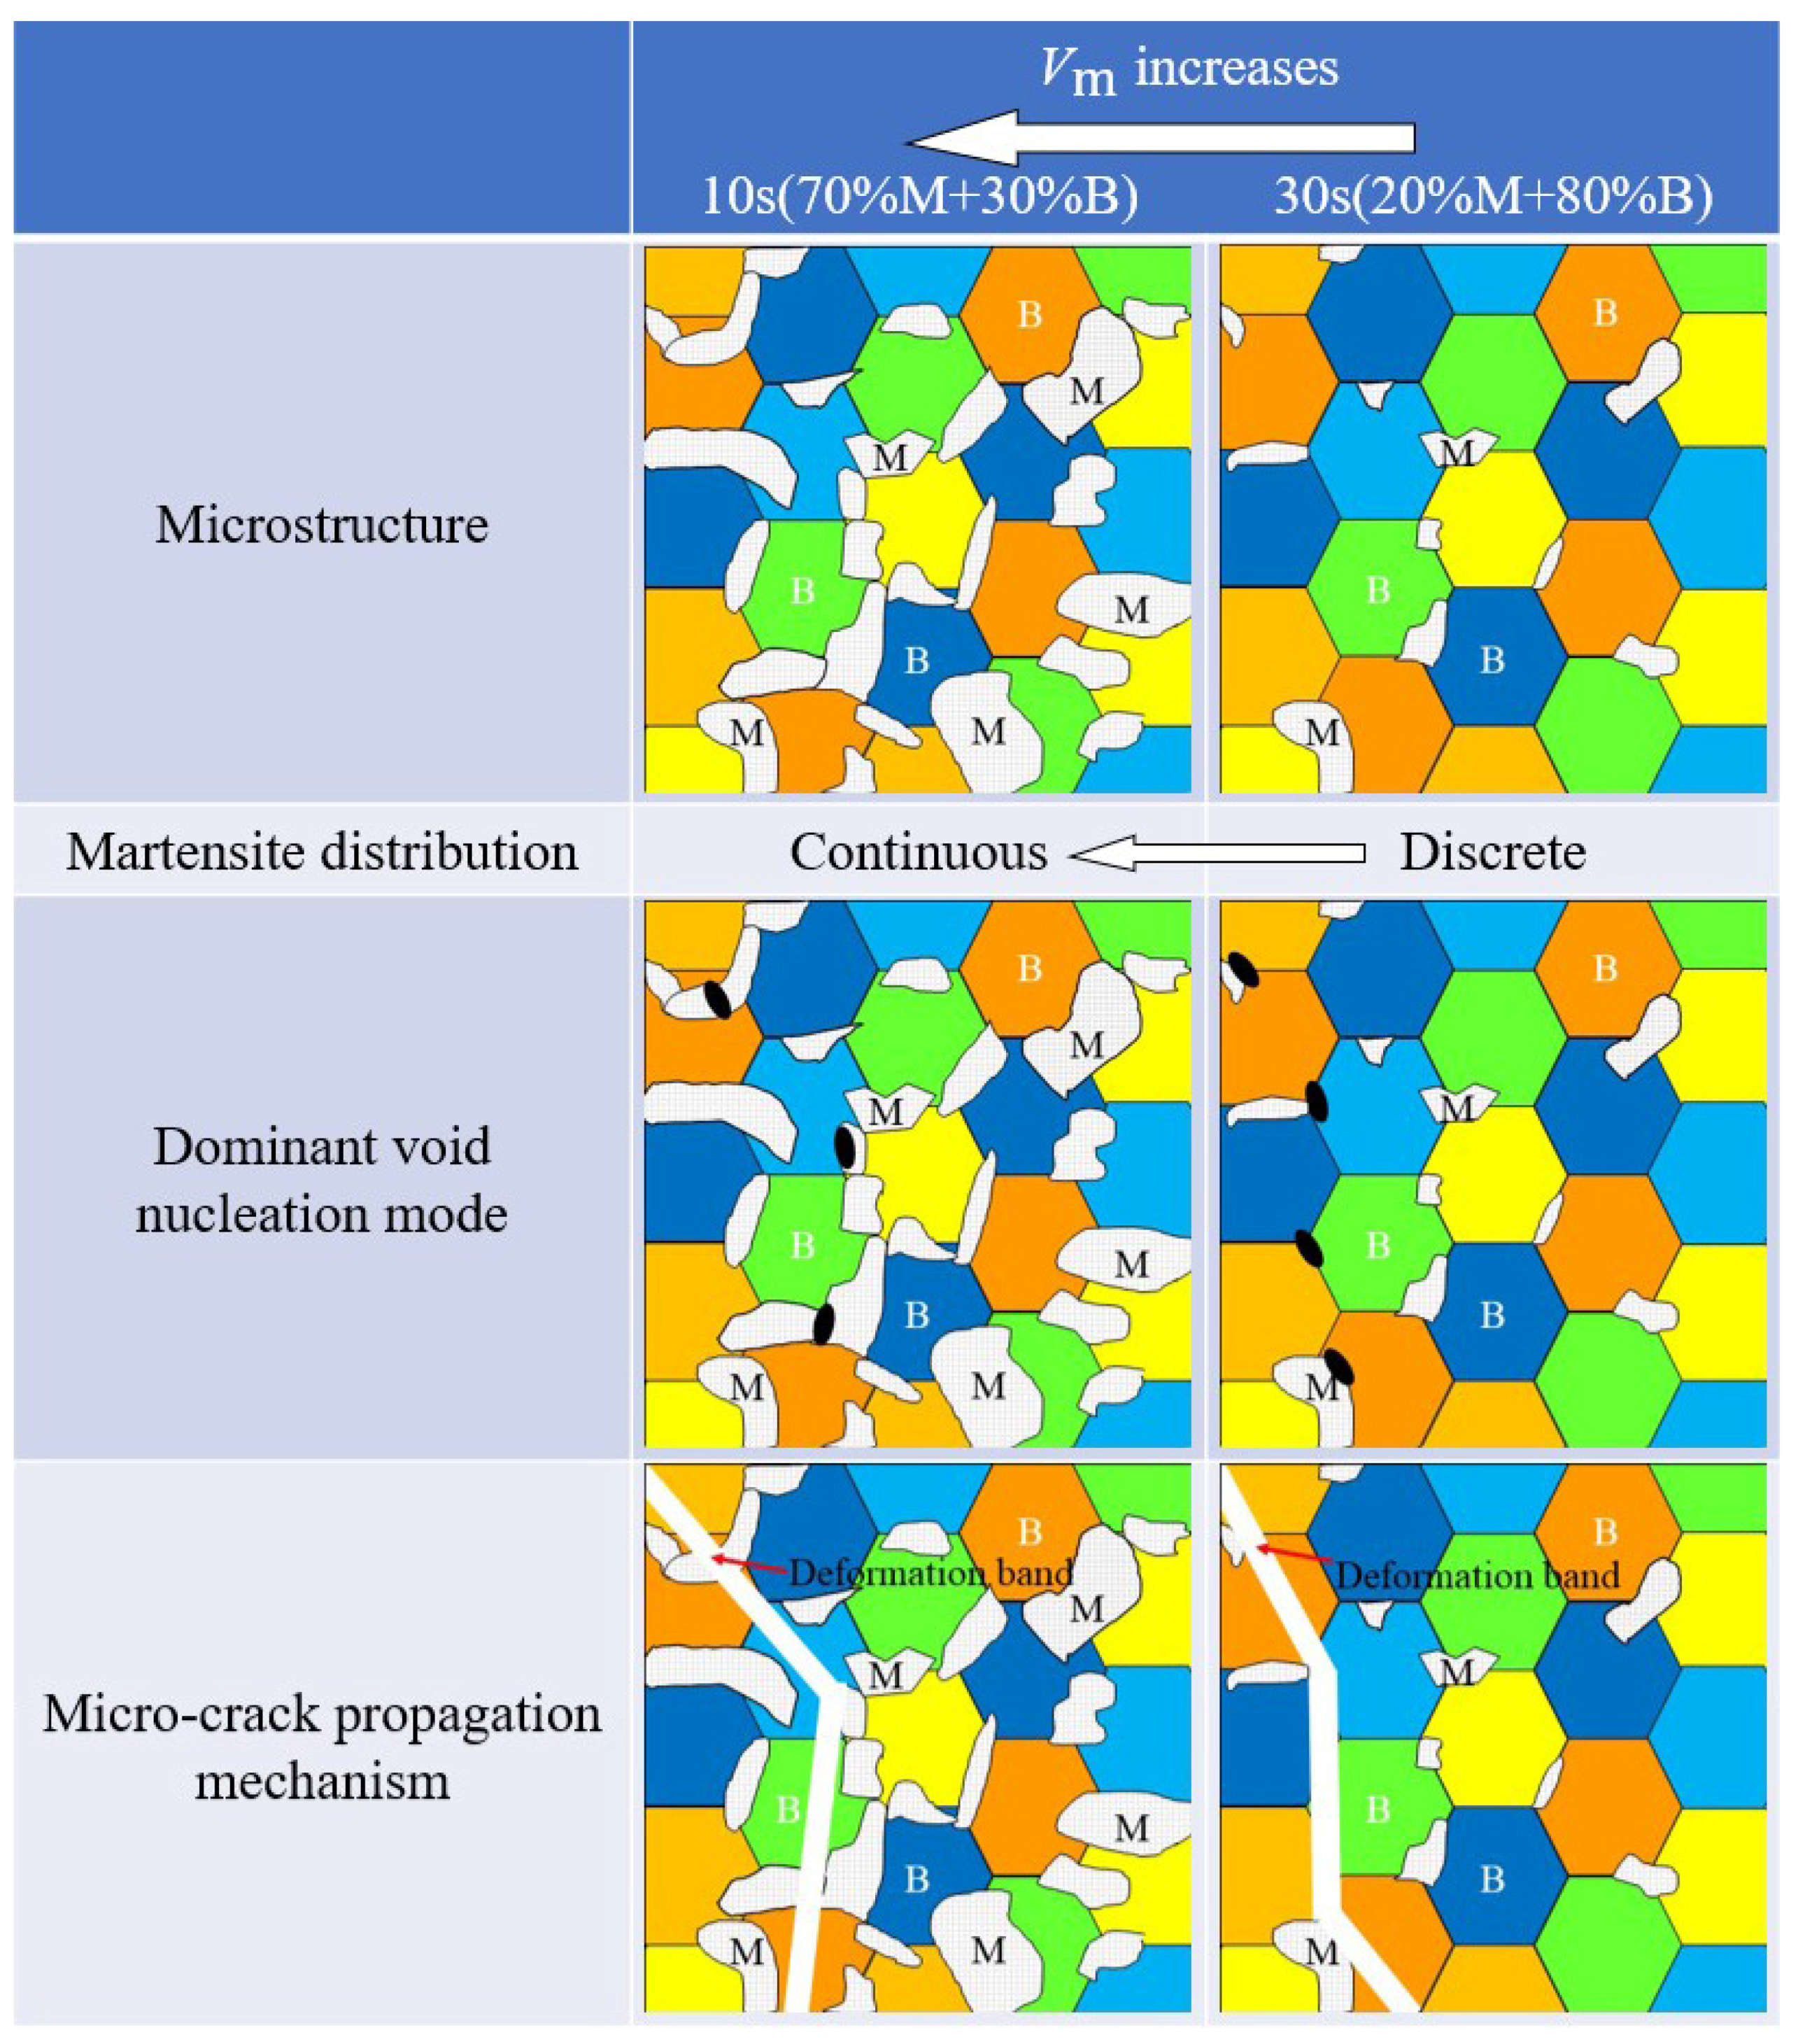
Figure 25.
Schematic diagram of the connections among the Vm, martensite distribution, dominant void nucleation mode, and micro-crack propagation mechanism.
Figure 25.
Schematic diagram of the connections among the Vm, martensite distribution, dominant void nucleation mode, and micro-crack propagation mechanism.
Table 1.
The composition percentages of the as-delivered 22MnB5 boron steel sheet (in wt. %).
Table 1.
The composition percentages of the as-delivered 22MnB5 boron steel sheet (in wt. %).
| C | Si | Mn | P | S | Cr | Ti | B |
|---|
| 0.21 | 0.25 | 1.34 | 0.009 | 0.006 | 0.20 | 0.03 | 0.002 |
Table 2.
The comparison of phase volume fractions of 22MnB5 samples with varying holding time by two-stage color tint-etching approach and SEM.
Table 2.
The comparison of phase volume fractions of 22MnB5 samples with varying holding time by two-stage color tint-etching approach and SEM.
| Time (s) | Modified LePera | SEM |
|---|
| Martensite (%) | Bainite (%) | Martensite (%) | Bainite (%) |
|---|
| 10 | 70 | 30 | 64 | 36 |
| 20 | 32 | 68 | 34 | 66 |
| 30 | 20 | 80 | 18 | 82 |
| 40 | 10 | 90 | 12 | 88 |
| 50 | 4 | 96 | 5 | 95 |
Table 3.
The crosshead velocity for different specimens in order to obtain quasi-static loading conditions (mm/min) [
15].
Table 3.
The crosshead velocity for different specimens in order to obtain quasi-static loading conditions (mm/min) [
15].
| Dogbone | Central Hole | Notched | In-Plane Shear | Nakajima |
|---|
| 1.8 | 0.3 | 0.5 | 0.5 | 30 |
Table 4.
Material parameters to predict the phase flow curves of pure bainite and martensite specimens, respectively.
Table 4.
Material parameters to predict the phase flow curves of pure bainite and martensite specimens, respectively.
| Phase | | | | | (m) | | k | |
|---|
| Bainite | 218.29 | 360.97 | 0.33 | 3 | | 80 | 5.75 | |
| Martensite | 218.29 | 834.73 | 0.33 | 3 | | 80 | 16.75 | |
Table 5.
Determined constants used for prediction the flow curves of the specimens with varying bainite volume fractions.
Table 5.
Determined constants used for prediction the flow curves of the specimens with varying bainite volume fractions.
| Phase Fraction | | k | |
|---|
| B30 | 555.4 | 0.644 | |
| B68 | 484.8 | 1.958 | |
| B80 | 400.4 | 2.7 | |
| B90 | 390.4 | 4.4 | |
| B96 | 370.4 | 5.6 | |
Table 6.
Determined constants used for prediction the flow curves of the specimens with varying martensite volume fractions.
Table 6.
Determined constants used for prediction the flow curves of the specimens with varying martensite volume fractions.
| Phase Fraction | | k | |
|---|
| M4 | 1034.73 | 16.75 | |
| M10 | 994.73 | 16.75 | |
| M20 | 964.73 | 16.75 | |
| M32 | 934.73 | 16.75 | |
| M70 | 864.73 | 16.75 | |
Table 7.
Fracture stain, the Lode parameter, and the stress triaxiality obtained by hybrid numerical–experimental approach for bainite specimens.
Table 7.
Fracture stain, the Lode parameter, and the stress triaxiality obtained by hybrid numerical–experimental approach for bainite specimens.
| Specimen | Lode
Parameter | Lode Angle | Normalized Lode Angle | Stress
Triaxiality | Fracture Strain |
|---|
| Central hole | −0.4775 | 0.2546 | 0.5138 | 0.7169 | 0.9901 |
| Notched R5 | −0.0458 | 0.4972 | 0.0505 | 0.7527 | 0.8896 |
| In-plane shear | −0.0945 | 0.4691 | 0.1041 | 0.0365 | 1.1766 |
| Nakajima | 0.9469 | 1.0239 | −0.9555 | 0.6603 | 0.8719 |
Table 8.
Fracture stain, the Lode parameter, and the stress triaxiality obtained by hybrid numerical–experimental approach for martensite specimens.
Table 8.
Fracture stain, the Lode parameter, and the stress triaxiality obtained by hybrid numerical–experimental approach for martensite specimens.
| Specimen | Lode
Parameter | Lode Angle | Normalized Lode Angle | Stress
Triaxiality | Fracture Strain |
|---|
| Central hole | −0.8030 | 0.0895 | 0.8291 | 0.5290 | 0.6458 |
| Notched R5 | −0.0537 | 0.4926 | 0.0592 | 0.6892 | 0.5155 |
| In-plane shear | −0.0517 | 0.4937 | 0.0570 | 0.0211 | 0.9076 |
| Nakajima | 0.9780 | 1.0376 | −0.9817 | 0.6578 | 0.3612 |
Table 9.
The values of applied uniform loads and for different stress triaxialities.
Table 9.
The values of applied uniform loads and for different stress triaxialities.
| | | Stress Triaxiality |
|---|
| 100 | −80 | −0.8 | 0.02 |
| 100 | 0 | 0 | 0.33 |
| 100 | 18 | 0.18 | 0.44 |
| 100 | 60 | 0.6 | 0.57 |
| 100 | 100 | 1 | 0.63 |
Table 10.
Fracture stains, the Lode parameter, and the stress triaxiality obtained by hybrid numerical-experimental approach for 80%B + 20%M specimens.
Table 10.
Fracture stains, the Lode parameter, and the stress triaxiality obtained by hybrid numerical-experimental approach for 80%B + 20%M specimens.
| Specimen | Lode Parameter | Lode Angle | Normalized Lode Angle | Stress Triaxiality | Fracture Strain |
|---|
| Central hole | −0.5738 | 0.2037 | 0.6110 | 0.6635 | 0.8608 |
| Notched R5 | −0.0465 | 0.4968 | 0.0513 | 0.7549 | 0.7835 |
| In-plane shear | −0.0766 | 0.4794 | 0.0844 | 0.0294 | 1.0672 |
| Nakajima | 0.9243 | 1.0138 | −0.9362 | 0.6564 | 0.5019 |


