Article

On Structural Rearrangements during the Vitrification of Molten Copper

by
Michael I. Ojovan
1,2,* and
Dmitri V. Louzguine-Luzgin
3,4
1
Department of Materials, South Kensington Campus, Imperial College London, Exhibition Road, London SW7 2AZ, UK
2
Department of Radiochemistry, Faculty of Chemistry, Lomonosov Moscow State University, Leninskie Gory 1, Bd. 3, 119991 Moscow, Russia
3
Advanced Institute for Materials Research (WPI-AIMR), Tohoku University, Sendai 980-8577, Japan
4
MathAM-OIL, National Institute of Advanced Industrial Science and Technology (AIST), Sendai 980-8577, Japan
*
Author to whom correspondence should be addressed.
Materials 2022, 15(4), 1313; https://doi.org/10.3390/ma15041313
Submission received: 26 December 2021 / Revised: 30 January 2022 / Accepted: 7 February 2022 / Published: 10 February 2022
(This article belongs to the Special Issue Feature Paper Collection of Topical Advisory Members)

Abstract

:
We utilise displacement analysis of Cu-atoms between the chemical bond-centred Voronoi polyhedrons to reveal structural changes at the glass transition. We confirm that the disordered congruent bond lattice of Cu loses its rigidity above the glass transition temperature (Tg) in line with Kantor–Webman theorem due to percolation via configurons (broken Cu-Cu chemical bonds). We reveal that the amorphous Cu has the Tg = 794 ± 10 K at the cooling rate q = 1 × 10¹³ K/s and that the determination of Tg based on analysis of first sharp diffraction minimum (FDSM) is sharper compared with classical Wendt–Abraham empirical criterion.

1. Introduction

Spatial distributions and displacement analysis through and between Voronoi polyhedrons are widely used to reveal structural changes in various materials in wide ranges of temperature and composition utilising molecular dynamic (MD) simulations [1,2]. The Voronoi polyhedrons are constructed using tessellations (honeycombs)-atomic centred polyhedrons which are regular or semiregular polyhedrons in crystalline materials and irregular polyhedrons in amorphous materials which are characterised by topological disorder. MD simulations are particularly effective in detecting changes that occur on vitrification of melts or melting of glasses (glass transition). Pure metals having only one sort of atoms are attractive as they enable a simplified approach compared to multiatomic compounds or metallic alloys. There are several ways in which amorphous materials including metallic systems can be produced. These include enough rapid cooling of melts, physical vapor deposition, solid-state reactions, irradiation- and pressure-induced amorphization. Amorphous Cu was produced both by extra-rapid cooling and ultrahigh pressure 14 GPa [3,4]. Many researchers utilise MD simulations to investigate its behaviour and properties [5]. The most intriguing question is about structural changes at the glass transition which was analysed using MD simulations for Fe [6,7], Ni [8,9], Cu [10], Al [11] as well as for other metals [12]. We aim here to analyse the glass transition (vitrification) of Cu revealing the structural differences below and above the glass transition temperature (Tg) and utilising the pair distribution functions, mainly their first sharp diffraction minimum (FSDM) as a tool to identify the Tg.

2. Structural Differences between Glasses and Melts

It is believed that both glasses and liquids have almost the same topologically disordered structure despite of the fact that their properties are completely different. Variations of specific volume and thermodynamic parameters of amorphous materials such as enthalpy, entropy, heat capacity indicate on a second order-like phase transformation at Tg whereas attempts to directly unveil the structural differences of atomic distributions below and above the Tg fail as standard symmetries which are typically broken on phase transformations remain unchanged e.g., translation and rotation symmetries. The structural difference between glasses and melts is however unambiguously revealed by the set theory which accounts for the Hausdorff–Besicovitch dimensionality of bonding system of materials [13,14,15,16].
The set theory as a branch of mathematical logic that studies abstract sets which has been used to characterise the configuron phase formed in amorphous materials out of broken chemical bonds termed configurons. The configuron phase behaves differently in glasses and melts forming a condensed-like phase in melts and occurring as a point-like (defect) phase in glasses. It has therefore different Hausdorff–Besicovitch dimensions in melts and glasses. The Hausdorff–Besicovitch dimension is defined as the limit D = lim(ε→0)[logN(ε)/log(1/ε)] where N(ε) is the number of boxes of side length ε required to cover the set. It has been revealed that the set has the Hausdorff–Besicovitch dimension D when N(ε) grows proportionally to (1/ε)D as ε tends to zero. The dimensionality of the set of configurons (of the configuron phase) changes at the glass transition temperature (Tg) from 0 (which is typical for point-like systems such as gases) to D = 2.55 ± 0.05 (which is fractal and is typical for liquids) above it. The stepwise change of Hausdorff–Besicovitch dimension of the set of configurons is due to the formation of the condensed configuron phase above the Tg and has as consequence the appearance of a kink in the first sharp diffraction minimum of scattered X-rays or neutrons [17,18]. Thus, the set theory provides clear evidence of structural differences between glasses and melts as both glassy and liquid structures near Tg are disordered, however they have different Hausdorff–Besicovitch dimensions.

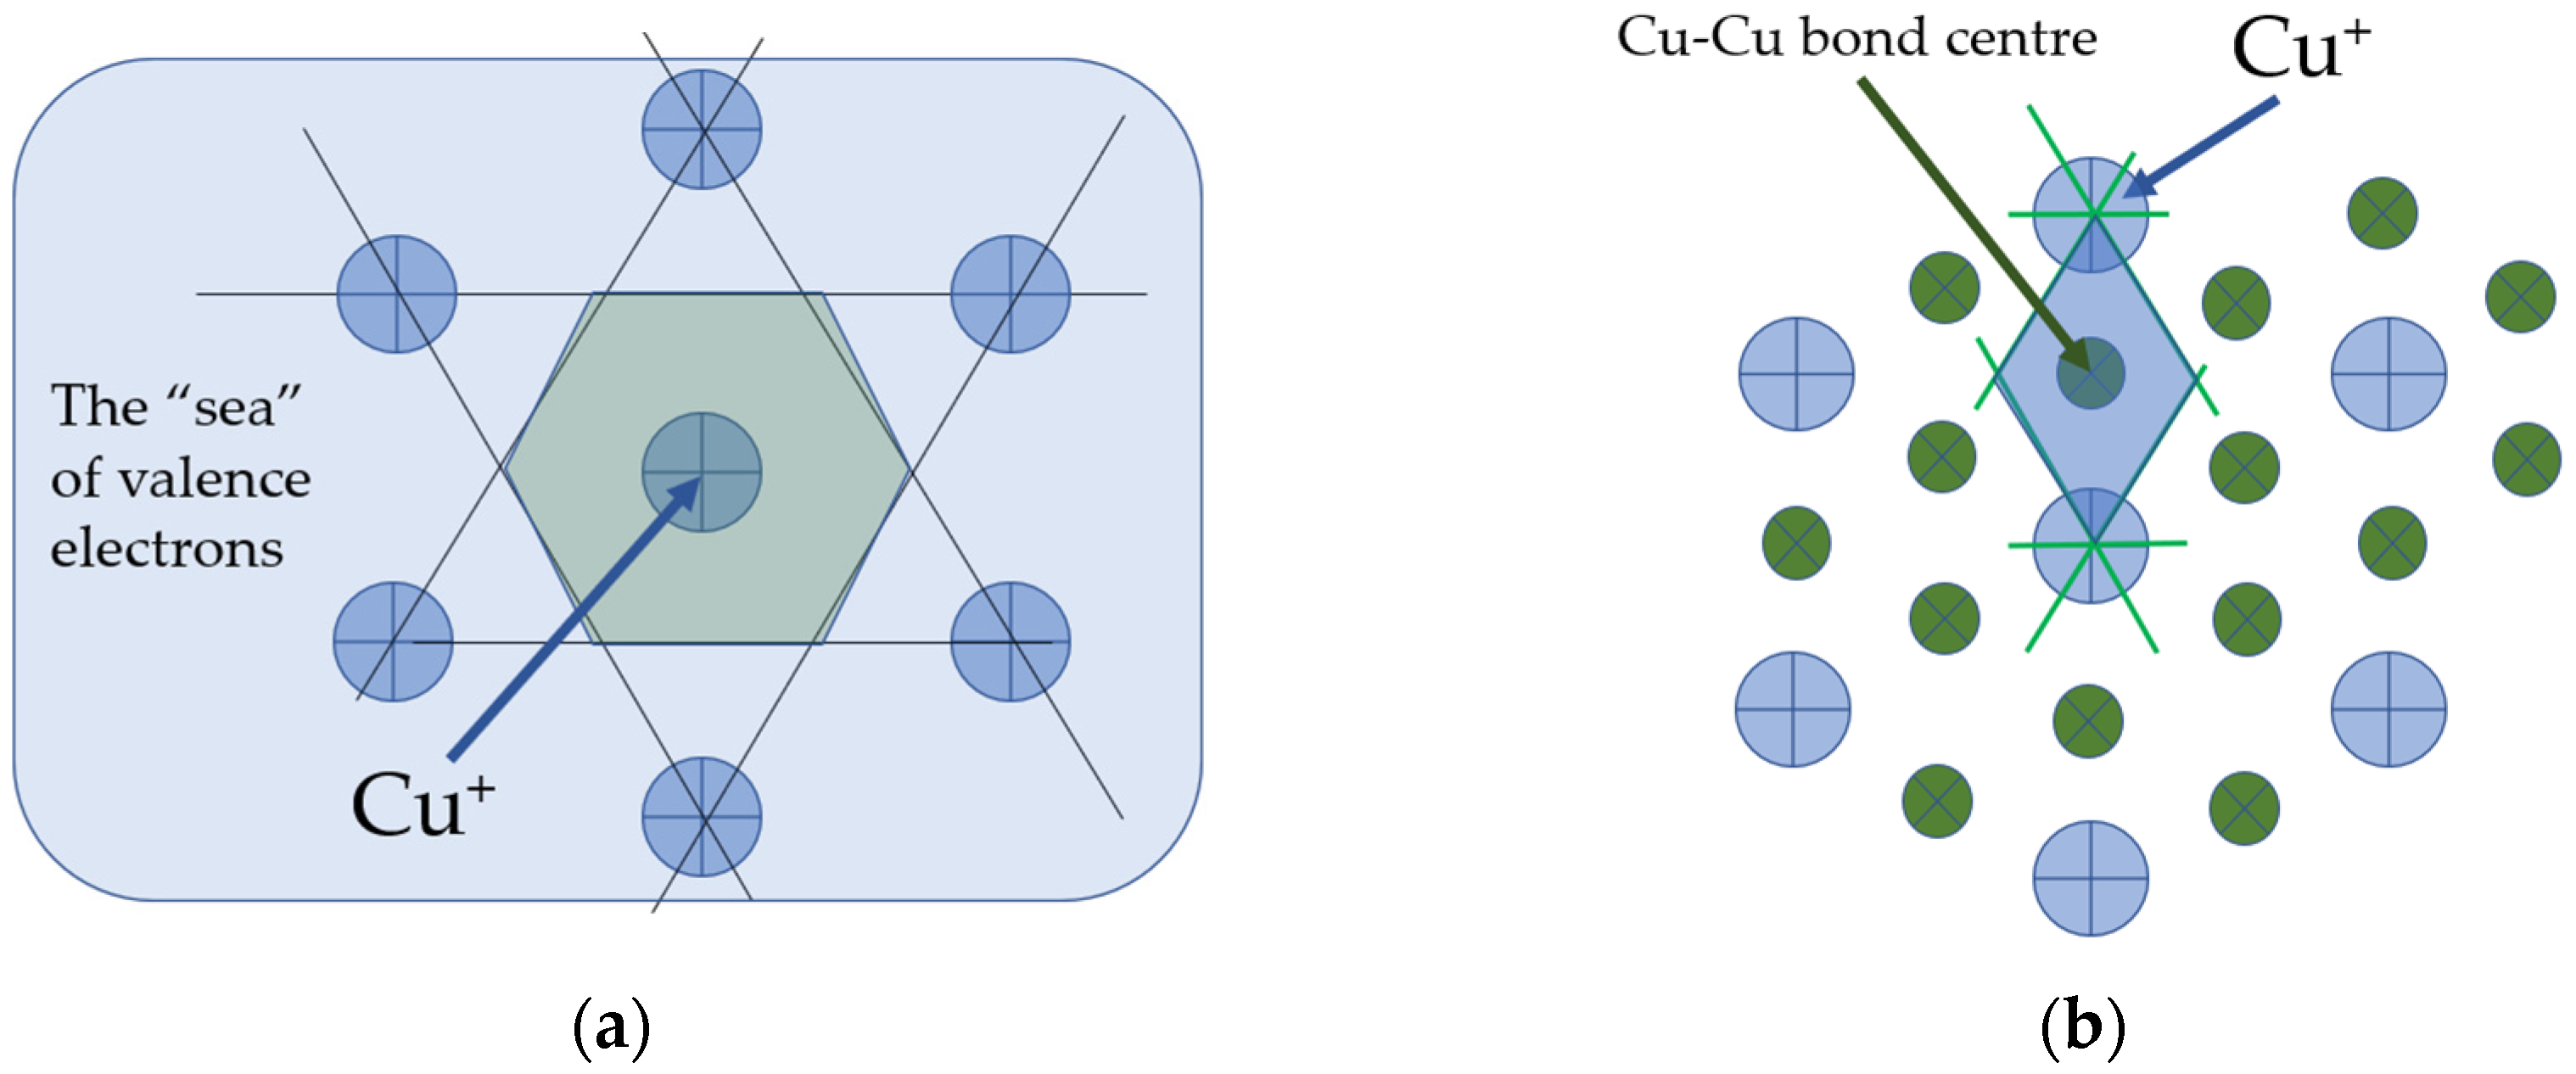
3. Configurons in Amorphous Cu

A powerful way to investigate the structure of materials is to analyse the structure of chemical bonds between atoms which constitute the condensed matter either solid or liquid. The initial fully connected atoms in a solid material may lose their solid-like behaviour on breaking the chemical bonds. Kantor and Webman have proved in 1984 that the rigidity threshold of an elastic percolating network is identical to the percolation threshold [19]. This means that finding the percolation threshold as a function of temperature, we can find the critical temperature when the solid-like behaviour changes to a liquid-like that is for amorphous materials we can find the Tg assigning it to the temperature when the percolation via broken bonds occurs [20]. In addition to that, once the percolation cluster made up of configurons is formed, its structure has a fractal geometry rather than 3D, its Hausdorff–Besicovitch dimension is ≈2.5 instead of 3 [13,14,15,16]. The utilisation of chemical bond concept in metals is not straightforward as for metals bonding is provided by the delocalised valence electrons from the s and p orbitals of the metal which form a common “sea” of electrons that surrounds the positively charged atomic nuclei (Figure 1a).
We follow here the concept of configurons first developed by Angel-Rao [21] based on concepts developed for metallic glasses by Egami et al. [22] who emphasised that local atomic connectivity is changed by gaining or losing a nearest neighbour (topological excitation) and introduced local configurational excitation as the elementary excitation in high temperature liquids [23]. The congruent bond lattice (CBL) replaces the system of N strongly interacting ions by the system of N’ = N(Z/2) weakly interacting chemical bonds where Z is the coordination number (Z = 12 for metallic Cu). Figure 1a,b schematically shows both the almost regular lattice and the corresponding CBL of Cu where we accounted that the [111] plane of face-centred cubic lattice is a hexagonal grid. The Voronoi polyhedrons are constructed by first picking a lattice point, which is the Cu+ ion the case (a) and the centre of Cu-Cu bond in case (b) after which lines are drawn to all nearby lattice points followed by drawing perpendicular planes which in such a way enclose the smallest volume termed also as the Wigner–Seitz primitive cell. The Voronoi polyhedrons are typically approximated by spheres of equal volume characterised by a single parameter–their radii or diameters [16].
At the nil temperature all chemical bonds are intact (unbroken), and the amorphous Cu is a solid-like material: it is a glass. On increasing the temperature some of the chemical bonds are broken forming configurons which at low temperatures are point-like entities such as point defects in solids. Figure 2 shows formation of a configuron in the CBL of amorphous Cu with a notable shifting of the unbound Cu+ and an increased volume of configuron Voronoi polyhedron compared to original bond Voronoi polyhedron.
In such a way we can utilise the configuron concept in metallic systems which can be described as a displacement of an atom out of the first coordination shell with the neighbouring adjustments and has as a microscopic result the shift on one or more atoms from the first coordination shell (Table 1 of [16]). The atomic displacements caused by configuron formation can be revealed analysing the scattering of X-rays or neutrons through pair distribution functions PDF(r), moreover it was shown that variations in the first sharp diffraction minimum (FSDM) of PDF(r) contain the information on structural changes in vitrifying/melting materials at the Tg through the onset of the FSDM temperature variation kinks [18].
The following sections demonstrate the utilisation of configuron concept for amorphous copper and illustrates the methodology of identification of Tg based on temperature behaviour of FDSM. The higher the temperature the more chemical bonds are broken until the critical temperature has been achieved where percolation via broken chemical bonds occurs. Because the rigidity threshold of an elastic percolating network is identical to the percolation threshold [19] the amorphous Cu transform at this temperature from the glass into a liquid, i.e., the glass transition occurs. Further atomic displacements above Tg due to configuron formation will follow a different law because the material has become liquid. Indeed, the condensed phase of configurons strongly changes the behaviour of the material because a new path of facilitated motion of atoms appears. Additional availability for atomic motions is ensured and the material shifts from the solid-like to the gas-like type behaviour [24,25,26,27,28]. The Benigni’s liquid-like B phase in the 2-state model [29] is formed and the state of atoms within the percolation cluster made up of configurons is assimilated to a gas-like type with consequent contributions to the heat capacity of material and its mechanical properties [16,29].

4. Experimental

The vitrification of Cu was simulated on continuous cooling and isothermal annealing via classical molecular dynamic (MD) computer simulation procedure at constant pressure using the software package (LAMMPS) [30]. The simulation was performed at 1 fs time step using the embedded atom potential for Cu taken from Ref. [31] under periodic boundary conditions with stabilised temperature and pressure. The cubic cell size was about 10 nm aiming to let crystallisation to occur. A crystalline cell containing 256,000 atoms was heated to the temperature T = 2500 K at 1 × 10¹⁴ K/s and held for 10 ps obtaining the melt confirmed by the radial distribution function form and by time stabilisation of the materials density. Equilibrium liquid state was obtained at 2500 K in less than 1 ps. Holding liquid for longer times caused no visible changes in the liquid structure and density. To obtain vitreous Cu the melt was cooled down with the rate as high as q = 1 × 10¹³ K/s keeping the accuracy of temperature upon simulation within ±5 K. It is known that at lower cooling rates of 5 × 10¹² K/s and lower the molten Cu started to crystallise [32]. Thermostat and barostat were used to control the temperatures and pressures [33,34,35]. The “OVITO” software package [36] was used to visualise and analyse simulation results while the adaptive common neighbour analysis was used to detect structural changes. The density of Cu as a function of temperature is shown in Figure 3a.
The Tg roughly estimated from the temperature dependence of density of vitreous Cu (Figure 3a) at such high cooling rate (q = 1 × 10¹³ K/s) is approximately 800 K. A more exact determination of Tg is possible using either the empirical Wendt–Abraham criterion [38] which is based on the analysis of the pair distribution functions PDF(r) peak minimum to maximum ratio or using the more sensitive method proposed by authors [18]. Indeed, the structure of condensed matter (crystals, glasses, melts) can be unveiled using the PDF(r) which can be also used to understand the changes that occur in materials on cooling/heating, including the structural modifications on vitrification of melts. It was found that variations in the first sharp diffraction minimum (FSDM) of PDF(r) contains the information on structural changes in vitrifying/melting materials at the Tg. A useful application from this discovery was the method proposed for determining the glass transition temperature which assigns the Tg to the temperature of the onset of the FSDM variation kink [18]. Experimental data were processed using the R-statistic with segmented package: the intersection point of two fitting lines produced by segmented fitting using a computer program R, namely an environment for data analysis and graphics [39] and Akaike criterion [40] for segmented regression [41]. Figure 4 shows the results of utilisation of these criteria for amorphous Cu based on data obtained in this work.
As seen from the inset of Figure 4a, the FDSM (PDFmin) is progressively increased with the temperature change: the higher the T, the higher FDSM. The temperature changes of FDSM are linear with temperature while the rate of growth dPDFmin/dt changes stepwise from a lower value to a higher one at the Tg as observed by Wendt–Abraham who proposed a practical criterion to identify the glass transition temperatures based on data on temperature dependence of Φ ( T ) = ( P D F m i n / P D F m a x ) [38]. Thus, the following equations hold [18,38]:
P D F m i n ( T ) = a g T + b g ,   at   T   <   T g
P D F m i n ( T ) = a l T + b l ,   at   T   >   T g
Φ ( T ) = c g T + d g ,   at   T   <   T g
Φ ( T ) = c l T + d l ,   at   T   >   T g
The parameters of these equations are presented in the Table 1 as found from statistical processing of experimental data.
The Tg based on PDFmin(T) or Φ ( T ) are found accordingly from the Equations (5) and (6):
T g = ( b g b l ) / ( a l a g ) ,  
T g = ( d g d l ) / ( c l c g )  
The Tg of Cu is hence found as high as 794 ± 10 K from the FSDM temperature dependence and 773 ± 12 K from the Wendt–Abraham criterion based on temperature dependence of Φ ( T ) = ( P D F m i n / P D F m a x ) at q = 1 × 10¹³ K/s. Both data are consistent with the rough estimate based on density change with temperature Tg = 800 K (Figure 3a and Figure 4b reveals that the change of the growth rate of FSDM at Tg given by dPDFmin/dT = (al−ag) is 93 ppm which is significantly larger compared with the change of the growth rate of the Wendt–Abraham criterion at Tg given by d Φ ( T ) / dT = (cl−cg) = 72 ppm, therefore the identification method based on FSDM is considerably sharper compared with the Wendt–Abraham criterion which stands in line with previous data for amorphous Ni [18].

5. Discussion

Glass transition phenomena are observed universally. In practice, any liquid can be vitrified (transformed from liquid to a glass) if the cooling rate is enough high to avoid crystallisation. However structural changes that occur on vitrification are almost undetectable despite qualitative differences of characteristics of amorphous materials above and below Tg. This makes difficult treatment of glass transition as a real phase transformation (which can be non-equilibrium). Often the glass transition is considered as just a gradual although considerable change of material viscosity with an arbitrarily defined glass transition temperature at which the equilibrium viscosity of the melt reaches 1012 Pa·s [42]. The definition of a glass as an amorphous material at viscosities above 1012 Pa·s is inconsistent for at least the reasons that (i) the viscosity is a continuous function of temperature in contrast with derivative thermodynamic parameters such as heat capacity, and (ii) the viscosity is not necessarily equal to 1012 Pa·s at Tg [17]. Also, in many marginal glass-formers equilibrium viscosity of 1012 Pa·s (or any other similarly high value) can never be reached owing to competing crystallization process. Experimentally the glass transition is observed as a second order-like phase transformation. Indeed, the material volume and entropy are continuous functions of temperature exhibiting kinks at Tg, and discontinuities are observed only for their derivatives. Namely these characteristics are used in practice to detect where transformation occurs, that is to detect the Tg. Because of universally observed thermodynamic evidence of second order-like phase transformation in amorphous materials the term “calorimetric glass transition” was coined—see Chapter 3.2 of Ref. [43].
The crucial argument in treating the vitrification as a phase transformation of an amorphous materials at Tg is related to the possibility to observe structural changes at the glass transition. Obvious symmetry changes occur at crystallisation with the formation of an ordered (most often periodic, although for quasicrystals not necessarily) anisotropic structure. The structure of glasses is, however, also disordered similarly to that of liquids (though somewhat more ordered on the medium range scale of 0.5–1 nm). This makes almost impossible to distinguish structurally a glass from a melt based on distribution of atoms. Here we show how to utilise data of neutron and/or X-ray diffraction to reveal the structural differences between liquids and glasses. The almost undetectable changes of the structure of amorphous materials at glass transition can be revealed based on the concept of broken chemical bonds (configurons). We emphasise that the configuron percolation theory (CPT) treats transformation of glasses into liquids at glass transition as an effect resulting from percolation via broken chemical bonds (configurons). It is important that MD simulations showed that low atomic density Voronoi polyhedrons percolation clusters are formed in the liquid state made whereas there are no such clusters in the solid (glassy) state [44]. The CPT envisages that structurally melts have a fractal geometry of chemical bonds with broken chemical bonds forming extended (macroscopic) fractals and because of that a liquid-like behaviour, and glasses have a 3D geometry of chemical bonds with point-type broken chemical bonds having a 0D geometry and because of that a solid-like behaviour (Chapter 3.1 in [45]). Figure 5 shows the temperature dependence of amorphous Cu volume on glass transition and melting and related changes of Hausdorff–Besicovitch dimensionalities of configuron phases dimH(configurons).
The interatomic chemical bonds in condensed materials can be broken by fluctuations of temperature, also by high pressure and ionizing radiation. Bond breaking processes inevitably lead to shifts of atoms from their original lattice (which is not necessarily ordered) places. In order to experimentally reveal the presence of configurons which are elementary excitations rather than material entities one can detect the atomic displacements caused by configuron formation. The displacements of atoms from lattice sites can be detected using neutron and/or X-ray diffraction. While the temperature causes bond-breaking processes and the higher the temperature, the more configurons are formed and thus more atoms are displaced out of the first coordination shell. Namely the atoms are shifted to distances corresponding to minima of PDF(r) due to configuron formation [18]. The higher the temperature, the higher is thus the PDFmin. Moreover, on approaching and crossing the Tg, the temperature behaviour of PDFmin will change its character. The change occurs because the topological organisation of chemical bonds (the geometry of chemical bonds) in the liquid state of matter drastically changes from 3D which is characteristic to solid state to the fractal geometry which is characteristic to the liquid state. Thus, the FSDM contains information on structural changes in amorphous materials at the Tg. A method for determining the Tg is hence to assign it to the onset of kink of FSDM and the proposed method is more sensitive than the Wendt–Abraham criterion based on the analysis of diffraction peaks [18,47,48]. It is also notable that the Wendt–Abraham criterion supposed that at Tg the equality holds Φ ( T g ) = 0.15 [38]. This however is not always an exact relationship [49] and one can see from Figure 4a that for the amorphous Cu we get Φ ( T g ) = 0.1 , whilst using the original Wendt–Abraham criterion we obtain a significantly overestimated Tg. We also emphasise that the decrease of the coordination number with the increase of temperature alone cannot explain the glass transition because such changes can be caused by rearrangements of crystalline lattice and the change of FSDM is the crucial parameter to be checked for eventual changes signalling on phase transformations in amorphous materials.

6. Conclusions

In conclusion we have used the connection between atomic shifts which can be detected via X-ray diffraction and formation of configurons which are broken chemical bonds in amorphous materials. We have analysed the temperature behaviour of FSDM (minima of PDF(r) as a function of temperature), identifying the temperature where the dependence exhibits a kink and allocating that temperature to the glass transition temperature, Tg = 794 ± 10 K at the cooling rate of 1 × 10¹³ K/s. It has been found that for amorphous Cu the method based on analysis of FSDM is more sensitive compared with the empirical criterion of Wendt−Abraham.

Author Contributions

Conceptualisation, M.I.O.; methodology, M.I.O.; experimental investigation, D.V.L.-L.; theoretical treatment, M.I.O.; writing—original draft preparation, M.I.O.; writing—review and editing, M.I.O. and D.V.L.-L. All authors have read and agreed to the published version of the manuscript.

Funding

This research received no external funding.

Institutional Review Board Statement

Not applicable.

Informed Consent Statement

Not applicable.

Data Availability Statement

Data supporting the research are within the paper.

Acknowledgments

Authors are grateful to anonymous reviewers whose comments helped to improve the paper. M.I.O. is grateful to Takeshi Egami for the common views on configuron concept expansion to metallic systems.

Conflicts of Interest

The authors declare no conflict of interest.

References

  1. Yen, N.V.; Dung, M.V.; Hung, P.K.; Van, T.B.; Vinh, L.T. Spatial distribution of cations through Voronoi polyhedrons and their exchange between polyhedrons in sodium silicate liquids. J. Non-Cryst. Solids 2021, 566, 120898. [Google Scholar] [CrossRef]
  2. San, L.T.; Yen, N.V.; Thao, N.T.; Hung, P.K.; Noritake, F. Displacing of sodium between Voronoi O-centered polyhedrons in sodium tetrasilicate glass. Eur. Phys. J. B 2021, 94, 241. [Google Scholar] [CrossRef]
  3. Steeb, S.; Warlimont, H. Rapidly Quenched Metals; Elsevier: Amsterdam, The Netherlands, 1985. [Google Scholar]
  4. Furuichi, H.; Ito, E.; Kanno, Y.; Watanabe, S.; Katsura, T.; Fujii, N. Amorphous copper formation and related phenomena at ultrahigh pressure. J. Non-Cryst. Solids 2001, 279, 215–218. [Google Scholar] [CrossRef]
  5. Wang, G.H.; Pan, H.; Ke, F.-J.; Xia, M.-F.; Bai, Y.-L. Study of mechanical properties of amorphous copper with molecular dynamics simulation. Chin. Phys. B 2008, 17, 259. [Google Scholar]
  6. Evteev, A.V.; Kosilov, A.T.; Levchenko, E.V. Atomic mechanisms of pure iron vitrification. J. Exp. Theor. Phys. 2004, 99, 522–529. [Google Scholar] [CrossRef]
  7. Okita, S.; Verestek, W.; Sakane, S.; Takaki, T.; Ohnoe, M.; Shibuta, Y. Molecular dynamics simulations investigating consecutive nucleation, solidification and grain growth in a twelve-million-atom Fe-system. J. Cryst. Growth 2017, 474, 140–145. [Google Scholar] [CrossRef]
  8. Jakse, N.; Pasturel, A. Ab initio molecular dynamics simulations of local structure of supercooled Ni. J. Chem. Phys. 2004, 120, 6124. [Google Scholar] [CrossRef] [PubMed]
  9. Louzguine-Luzgin, D.V.; Belosludov, R.; Saito, M.; Kawazoe, Y.; Inoue, A. Glass-transition behavior of Ni. Calculation, prediction and experiment. J. Appl. Phys. 2008, 104, 123529. [Google Scholar] [CrossRef]
  10. Fang, H.Z.; Hui, X.; Chen, G.L.; Liu, Z.K. Structural evolution of Cu during rapid quenching by ab initio molecular dynamics. Phys. Lett. A 2008, 372, 5831–5837. [Google Scholar] [CrossRef]
  11. Kirova, E.; Norman, G.E.; Pisarev, V. Simulation of the glass transition of a thin aluminum melt layer at ultrafast cooling under isobaric conditions. JETP Lett. 2019, 110, 359–363. [Google Scholar] [CrossRef]
  12. Han, J.J.; Wang, C.P.; Liu, X.J.; Wang, Y.; Liu, Z.-K.; Zhang, T.-Y.; Jiang, J.Z. Abnormal correlation between phase transformation and cooling rate for pure metals. Sci. Rep. 2016, 6, 22391. [Google Scholar] [CrossRef] [Green Version]
  13. Ozhovan, M.I. Topological characteristics of bonds in SiO2 and GeO2 oxide systems upon a glass-liquid transition. J. Exp. Theor. Phys. 2006, 103, 819–829. [Google Scholar] [CrossRef]
  14. Ojovan, M.I.; Lee, W.E. Topologically disordered systems at the glass transition. J. Phys. Condens. Matter 2006, 18, 11507–11520. [Google Scholar] [CrossRef] [Green Version]
  15. Ojovan, M.I. Configurons: Thermodynamic parameters and symmetry changes at glass transition. Entropy 2008, 10, 334–364. [Google Scholar] [CrossRef] [Green Version]
  16. Ojovan, M.I.; Tournier, R.F. On structural rearrangements near the glass transition temperature in amorphous silica. Materials 2021, 14, 5235. [Google Scholar] [CrossRef]
  17. Sanditov, D.S.; Ojovan, M.I.; Darmaev, M.V. Glass transition criterion and plastic deformation of glass. Phys. B Condens. Matter 2020, 582, 411914. [Google Scholar] [CrossRef]
  18. Ojovan, M.I.; Louzguine-Luzgin, D.V. Revealing structural changes at glass transition via radial distribution functions. J. Phys. Chem. B 2020, 124, 3186–3194. [Google Scholar] [CrossRef]
  19. Kantor, Y.; Webman, I. Elastic properties of random percolating systems. Phys. Rev. Lett. 1984, 52, 1891–1894. [Google Scholar] [CrossRef]
  20. Ojovan, M.I. Glass formation in amorphous SiO2 as a percolation phase transition in a system of network defects. J. Exp. Theor. Phys. Lett. 2004, 79, 632–634. [Google Scholar] [CrossRef]
  21. Angell, C.A.; Rao, K.J. Configurational excitations in condensed, and the “bond lattice” model for the liquid-glass transition. J. Chem. Phys. 1972, 57, 470–481. [Google Scholar] [CrossRef]
  22. Levashov, V.A.; Morris, J.R.; Egami, T. The origin of viscosity as seen through atomic level stress correlation function. J. Chem. Phys. 2013, 138, 044507. [Google Scholar] [CrossRef]
  23. Iwashita, T.; Egami, T. Elementary Excitations and Crossover Phenomenon in Liquids. Phys. Rev. Lett. 2012, 108, 196001. [Google Scholar] [CrossRef] [Green Version]
  24. Frenkel, J. Kinetic Theory of Liquids; Oxford University Press: Oxford, UK, 1946. [Google Scholar]
  25. Bolmatov, D.; Brazhkin, V.V.; Trachenko, K. The phonon theory of liquid thermodynamics. Sci. Rep. 2012, 2, 421. [Google Scholar] [CrossRef] [PubMed]
  26. Brazhkin, V.; Trachenko, K. What separates a liquid from a gas? Phys. Today 2012, 65, 68–69. [Google Scholar] [CrossRef] [Green Version]
  27. Trachenko, K.; Brazhkin, V.V. Collective modes and thermodynamics of the liquid state. Rep. Prog. Phys. 2016, 79, 016502. [Google Scholar] [CrossRef]
  28. Trachenko, K. Lagrangian formulation and symmetrical description of liquid dynamics. Phys. Rev. E 2017, 96, 062134. [Google Scholar] [CrossRef] [Green Version]
  29. Benigni, P. CALPHAD modeling of the glass transition for a pure substance, coupling thermodynamics and relaxation kinetics. Calphad 2021, 72, 102238. [Google Scholar] [CrossRef]
  30. Plimpton, S.J. Fast parallel algorithms for short-range molecular dynamics. J. Comp. Phys. 1995, 117, 1. [Google Scholar] [CrossRef] [Green Version]
  31. Mendelev, M.I.; Kramer, M.J.; Becker, C.A.; Asta, M. Analysis of semi-empirical interatomic potentials appropriate for simulation of crystalline and liquid Al and Cu. Phil. Mag. 2008, 88, 1723–1750. [Google Scholar] [CrossRef]
  32. Bazlov, A.I.; Louzguine-Luzguin, D.V. Crystallization of FCC and BCC liquid metals studied by molecular dynamics simulation. Metals 2020, 10, 1532. [Google Scholar]
  33. Nose, S. A unified formulation of the constant temperature molecular dynamics methods. J. Chem. Phys. 1984, 81, 511. [Google Scholar] [CrossRef] [Green Version]
  34. Hoover, W.G. Canonical dynamics, Equilibrium phase-space distributions. Phys. Rev. A 1985, 31, 1965. [Google Scholar] [CrossRef] [PubMed] [Green Version]
  35. Berendsen, H.J.C.; Postma, J.P.M.; van Gunsteren, W.F.; DiNola, A.; Haak, J.R. Molecular dynamics with coupling to an external bath. J. Chem. Phys. 1984, 81, 3684–3690. [Google Scholar] [CrossRef] [Green Version]
  36. Stukowski, A. Visualization and analysis of atomistic simulation data with OVITO—the Open Visualization Tool. Model. Simul. Mater. Sci. Eng. 2010, 18, 015012. [Google Scholar] [CrossRef]
  37. Copper and Its Compounds. Database. Available online: http://www.chem.msu.su/rus/tsiv/Cu/ivtan0000.html (accessed on 20 January 2022).
  38. Wendt, H.H.; Abraham, F.F. Empirical criterion for the glass transition region based on Monte Carlo simulations. Phys. Rev. Lett. 1978, 41, 1244–1246. [Google Scholar] [CrossRef]
  39. The R Project for Statistical Computing. Available online: https://www.r-project.org (accessed on 4 February 2022).
  40. Akaike, H. A new look at the statistical model identification. IEEE Trans. Autom. Control 1974, 19, 716–723. [Google Scholar] [CrossRef]
  41. Muggeo, V.M.R. Interval estimation for the breakpoint in segmented regression: A smoothed score-based approach. Aust. N. Z. J. Stat. 2017, 59, 311–332. [Google Scholar] [CrossRef]
  42. Zheng, Q.; Mauro, J.C. Viscosity of glass-forming systems. J. Am. Ceram. Soc. 2017, 100, 6–25. [Google Scholar] [CrossRef]
  43. Zheng, Q.; Zhang, Y.; Montazerian, M.; Gulbiten, O.; Mauro, J.C.; Zanotto, E.D.; Yue, Y. Understanding glass through differential scanning calorimetry. Chem. Rev. 2019, 119, 7848–7939. [Google Scholar] [CrossRef]
  44. Medvedev, N.N.; Geider, A.; Brostow, W. Distinguishing liquids from amorphous solids: Percolation analysis on the Voronoi network. J. Chem. Phys. 1990, 93, 8337–8342. [Google Scholar] [CrossRef]
  45. Richet, P.; Conradt, R.; Takada, A.; Dyon, J. Encyclopedia of Glass Science, Technology, History, and Culture; Wiley: Hoboken, NJ, USA, 2021; pp. 249–259. [Google Scholar]
  46. Louzguine-Luzgin, D.V.; Inoue, A. An extended criterion for estimation of glass-forming ability of metals. J. Mater. Res. 2007, 22, 1378–1383. [Google Scholar] [CrossRef]
  47. Louzguine-Luzgin, D.V. Vitrification and devitrification processes in metallic glasses. J. Alloys Compd. 2014, 586, S2–S8. [Google Scholar] [CrossRef]
  48. Louzguine-Luzgin, D.V.; Georgarakis, K.; Andrieux, J.; Hennet, L.; Morishita, T.; Nishio, K.; Belosludov, R.V. An atomistic study of the structural changes in a Zr–Cu–Ni–Al glass-forming liquid on vitrification monitored in-situ by X-ray diffraction and molecular dynamics simulation. Intermetallics 2020, 122, 106795. [Google Scholar] [CrossRef]
  49. Ojovan, M.I. The Modified Random Network (MRN) Model within the Configuron Percolation Theory (CPT) of Glass Transition. Ceramics 2021, 4, 121–134. [Google Scholar] [CrossRef]
Figure 1. (a) The atomic lattice; (b) the corresponding congruent bond lattice (CBL) of Cu. Shadowed areas correspond to Cu-centred (a) and bond-centred (b) Voronoi polyhedrons.
Materials 15 01313 g001
Figure 2. Schematic of a configuron shown by its Voronoi polyhedron shadowed in red colour in amorphous Cu. Formation of configuron is linked to the displacement of Cu+ from the first coordination shell [16,18] and local atomic connectivity change by losing a nearest neighbour [23].
Materials 15 01313 g002
Figure 3. (a) Density changes on heating and cooling of crystalline and vitreous Cu respectively where Tm is the melting temperature (1358 K) and Tg is the glass transition temperature obtained at the given cooling rate q = 1 × 10¹³ K/s. (b) Thermodynamic functions of Cu as function of temperature demonstrating characteristic changes at Tg and Tm. There is no change at Tg for Cp(T) because the data presented are for crystalline Cu taken from the Reference [37] and the change is seen only at Tm. Data of current work are given in the blue colour.
Materials 15 01313 g003
Figure 4. (a) The values of pair distribution function first minimum PDFmin of Cu following the method proposed in [18] and ratios of PDFmin/PDFmax after Wendt–Abraham criterion [38] as a function of temperature where the inset shows the definitions of parameters used with PDF(r) given for three temperatures T = 2500, 1400, and 300 K respectively. (b) The prominent changes at the Cu glass transition temperature Tg = 794 ± 10 K of FSDM (I) and Hausdorff–Besicovitch dimension of configurons phase dimH(configurons) (II).
Materials 15 01313 g004
Figure 5. A sketch of the temperature dependence of the specific volumes of glass (T < Tg), and both supercooled (Tg < T < Tm) and stable melts (T > Tm). For amorphous copper we have found that Tg = 794 ± 10 K at q = 1 × 10¹³ K/s, and the melting temperature is known as Tm = 1358 K. The slope of lines is schematically exaggerated while the linear thermal expansion coefficient is 49.5 × 10⁻⁶ K−1 for of the Cu glassy phase and 800 × 10−6 K−1 for the Cu melt phase [46].
Materials 15 01313 g005
Table 1. The parameters of linear dependences of PDFmin(T) and PDFmin(T)/PDFmax(T).
agbgcgdgalblcldg
0.00016350.20803420.00007570.03940810.00025680.13393280.0001478−0.0163428
Publisher’s Note: MDPI stays neutral with regard to jurisdictional claims in published maps and institutional affiliations.

