Article

Effect of Temperature on Ultrasonic Nonlinear Parameters of Carbonated Concrete

1
College of Civil Aviation, Nanjing University of Aeronautics and Astronautics, Nanjing 210016, China
2
Eastern Airports, Nanjing 210016, China
*
Author to whom correspondence should be addressed.
Materials 2022, 15(24), 8797; https://doi.org/10.3390/ma15248797
Submission received: 10 October 2022 / Revised: 2 December 2022 / Accepted: 6 December 2022 / Published: 9 December 2022
(This article belongs to the Topic Advances in Non-Destructive Testing Methods)

Abstract

:
In order to explore the monitoring technique of concrete carbonation in various temperatures, longitudinal ultrasonic nonlinear parameters of carbonated concrete are measured by using an embedded composite piezoelectric transducer (ECPT) and a surface-mounted transducer. The effect of temperature from −20 C to 40 C with a temperature interval of 5 C and water–cement ratio on the measurements of ultrasonic parameters for carbonated concrete is investigated. The ultrasonic transmission detection method and the second harmonic generation (SHG) technique for longitudinal waves are used in the study. Results of the experiment demonstrate that ECPT is effective in the monitoring of the changes in ultrasonic parameters of carbonated concrete. At the temperature ranging from 15 C to 40 C, the increasing temperature slightly increases the relative nonlinear parameters of carbonated concrete. It decreases significantly that the relative nonlinear parameters of carbonated concrete measured at 0 C compared with that at 10 C. The configuration in this measurement is also appropriate for the assessment of carbonated concrete during carbonation time in low-temperature environments (below 0 C). In the same carbonation time, the relative nonlinear parameters also increase slightly when the temperature is at −20 C to 0 C, but it does not change too much. Furthermore, there is a more significant variation of the nonlinear parameters in the same carbonation time for the specimens with a high water–cement ratio than that with a low one.

1. Introduction

Ultrasonic measurement as non-destructive testing technology has been widely used to determine the characterization of concrete structures for a long time. Nonlinear resonance ultrasonic spectroscopy (NRUS) technology has been used in the testing of progressive damage occurring in concrete, such as alkali–silica reaction [1], thermal damage [2], and delayed ettringite formation in concrete [3]. These progressive changes in concrete increase the material nonlinearity, resulting in a shift of the resonance frequency and amplitude in concrete. During concrete carbonation, the material nonlinearity is also changed by the effects of the carbonation product on the porosity and microcracks in concrete. Bouchaala et al. [4], reported that resonant ultrasonic nonlinear parameters have the feasibility of measuring concrete carbonation. Eiras et al. [5] used resonance ultrasonic spectroscopy technology to study the effect of concrete carbonation on the linear and nonlinear dynamic properties of cement-based materials. The linear and nonlinear dynamic properties can be used to deem material against carbonation in laboratory tests, whereas concrete has inherent nonlinearity due to its material composition. The nonlinear response of the concrete to the incident wave distorts the waveform when a single-frequency ultrasonic wave is transmitted into the concrete. Then, the higher harmonic waves will be generated in the transmitted wave. Kim et al. [6,7] investigated the feasibility of the second harmonic generation (SHG) technology of Rayleigh surface wave to characterize the carbonation of concrete. The amplitude of the active acoustic source of SHG technology is constant, while the percussive force of NURS needs to be control.
At present, health inspection of concrete structures is usually performed by manually carrying external ultrasonic probes. However, the use of large external probes requires extensive work preparation, which not only hinders the use of this technique for monitoring but also greatly limits the measurement area of concrete structures [8]. In contrast, embedding low-cost piezoelectric transducers in concrete structures allows for a more flexible configuration of the measurement network on the one hand, and long-term stable health measurements of the structure on the other. Such kinds of transducers have been successfully used for the monitoring of concrete hydration by deducing the evolution of Young’s modulus based on the flight time of the acoustic wave [9,10,11,12], the evolution of the concrete compressive strength at an early age [10,13], concrete cracking [8,14,15,16,17,18], water seepage [19], and mechanical properties of concrete as well as the acoustoelastic effect in compression [20,21,22,23], applying piezoelectric lead zirconate titanate (PZT) patches to the rebar by monitoring the conductance changes of the piezoelectric patches to study the effect of concrete carbonation on rebar corrosion [24,25]. In the current research of embedded transducers, it is found that cement-based and marble-based piezoelectric composite sensors have the feature of diminishing the distortion of signal and benefiting the energy transmission efficiency [26,27]. However, these large size transducers are not suitable for detecting P waves at close distances due to the carbonation of concrete developing from the surface. Qin et al. [12] and Chen et al. [28] provided two ideas for small size transducers in specimens with specific sizes. The signal transmitted by these transducers at an operating state with a high frequency and high energy carries less sensor nonlinearity than cement-based or marble-based transducers, whereas the influence of boundary reflection [6,29,30] on the signal should be considered in both time domain analysis and frequency domain analysis when the wave is propagating in small-size concrete. Otherwise, the parameters obtained from a small-size concrete are not suitable for the characterization of the large one due to the distance of boundary reflection.
In this paper, the ultrasonic transmission detection method was taken with an embedded transducer and a surface-mounted transducer. The embedded composite piezoelectric transducer (ECPT) which was composited with four materials was developed and used to detect the evolution of ultrasonic parameters in carbonated concrete by the SHG [31] technique of ultrasonic longitudinal waves to verify the effect of the concrete water–cement ratio on the relative nonlinear parameters of carbonation. This kind of ECPT had the advantage combined with the transducers used by Qin et al. [12] and Chen et al. [28], such as small size and electromagnetic shielding. Subsequently, the effect of the ambient temperature on the ultrasonic longitudinal detection parameters of carbonated concrete was also studied.

2. Materials and Methods

2.1. Specimens

In this experiment, concrete specimens (CI, CII, CIII) with different water–cement ratios were designed. The coarse aggregate used in the concrete was a continuous grade of natural gravel from 5 mm to 25 mm and the fine aggregate was natural river sand with a fineness modulus of 2.56. Table 1 shows the mixture design of the concrete specimens.
The structure of the embedded composite piezoelectric transducer (ECPT) is shown in Figure 1a. It consisted of a metal shielding layer, an encapsulation layer, a piezoelectric lead zirconate titanate (PZT) patch, and a composite backing layer. The model of the PZT was PSN-33 with a size of ϕ 8 mm × 0.48 mm , which was provided by the Haiying company. Table 2 shows the parameters of PZT, where d 33 is piezoelectric strain constant, C is capacitance, tan δ is dielectric dissipation factor, f t is resonance frequency, and Z r is impedance.
This kind of composite increased the structural strength of the transducer and made it have good waterproofing and working performance. In addition, the ECPT could resist certain electromagnetic wave interference and suppress the interference of some noise to the signal during operation. The ECPT vibrated along the poling direction to generate mechanical waves when connected with the electric field. As shown in Figure 1b, the PZT patch is fastened to the printed circuit film in this transducer. This connection method ensured the working stability of the PZT patch and improved the convenience of the manufacturing process for the embedded composite transducer. The sensitivity of ECPT was verified with the face-to-face secondary calibration method (GB/T 19801-2005/ISO 12714:1999) [32,33,34]. The sensors were placed in the symmetry location to transmit and receive elastic waves from the solid medium surface—whereafter, the sensitivity of the sensor was calculated by the output signals. Figure 2 shows the sensitivity of ECPT.
There were three specimens for each kind of concrete. Each size of the concrete specimen was 100 mm × 100 mm × 100 mm. As shown in Figure 3a, only one ECPT is embedded in the concrete specimen as a transmitter. On the surface in which CO 2 was ingressed, a surface mounted transducer was fixed to obtain the nonlinear parameters of the ultrasonic radial propagation in carbonated concrete. The reason for this arrangement was that the received signal transmitted from inner concrete was experimentally found to be more stable than from the surface. In addition, this configuration could also be used in a large concrete structure. It was assumed that two transducers were embedded in one concrete and their poling direction pointed to the surface in which CO 2 was ingressed, and the reflected P wave would be affected by the S wave [27].
As shown in Figure 3a, Section 1-1 is the plane perpendicular to the bottom surface of the concrete and along the central axis of the ECPT. Section 2-2 is perpendicular to the plane of the ECPT shielding layer on the bottom of the concrete in Figure 3a and the projection of ECPT on this plane is a circle. Figure 3b is Section 1-1 of the concrete in which the transducer is embedded. The central axis of the ECPT is 45 mm from the bottom surface of the specimen in Figure 3a. In addition, the concrete is up to 70 mm away from the surface of the shielding layer of the ECPT. Figure 3c is a Section 2-2 view of the concrete in which the transducer embedded. It can be found from the figure that the closest distance between the central axis of the ECPT and the surface of the concrete is 42 mm.

2.2. Accelerated Carbonation Experiment

Concrete specimens were cured in an environmental chamber with a temperature of 20 ± 3 °C and a relative humidity of 95%. After 28 days of curing, all surfaces of the specimens were sealed with paraffin wax except for the surface which CO 2 ingressed. The concrete specimens were placed in the carbonation chamber for concrete carbonation experiments. In this case, the ambient temperature was 20 C, the CO 2 concentration was 20%, and the relative humidity was 70%. The carbonation depth was measured with phenolphthalein in spare samples after 0, 7, and 21 days of carbonation.

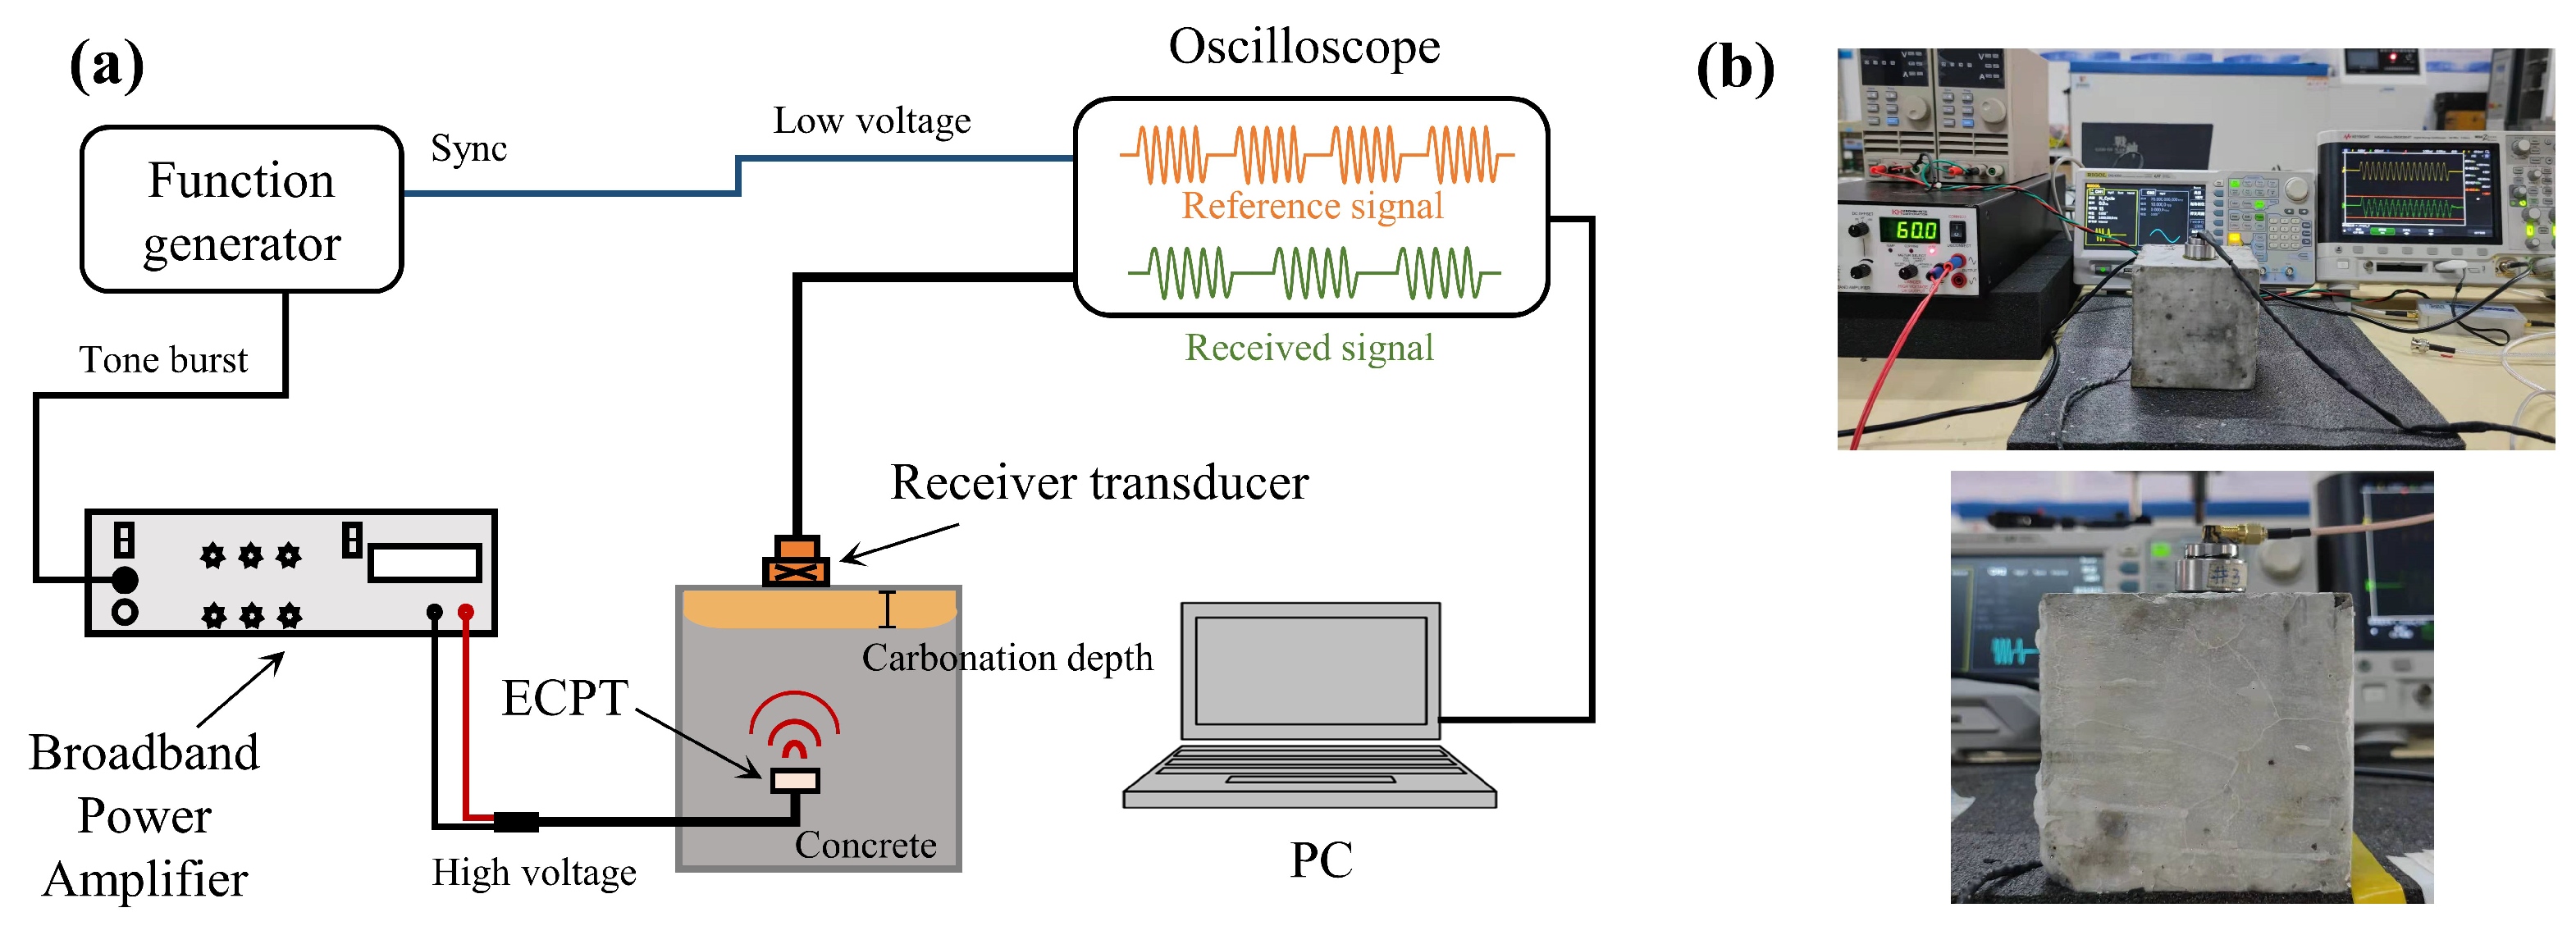
2.3. Testing Methods

The specimens were removed from the carbonation chamber after 3, 7, 14, and 21 days of concrete carbonation, respectively. In order to test the ultrasonic parameters of carbonated concrete under different temperature environments, the concrete was placed in an environment chamber at the temperature from −20 C to 40 C for 24 h with a temperature interval of 5 C, and the relative humidity was controlled at 70%. Figure 4 shows the experimental setup. A function waveform generator (DG 4202) generated 15-cycle, 1 MHz frequency, 10 peak-to-peak voltage sinusoidal waveform signal pulses at a burst interval of 3 ms. Then, the signal was amplified to a peak-to-peak voltage of 120 V by a broadband power amplifier (KROHN-HITE 7602M, Brockton, MA, USA), and the ultrasonic signal was transmitted by the ECPT in the concrete. It should be noted that the receiving transducer fixed to the concrete surface had the same central axis as the ECPT. The oscilloscope (Keysight InfiniiVision DSOX 3014T, Santa Rosa, CA, USA) was connected to the receiving transducer to acquire a time domain signal with a sampling length of 16,000 at a sampling frequency of 625 MSa/s, and the acquisition mode was the average acquisition of 2048 times. At the same time, a sync output line connected the function waveform generator to the oscilloscope to receive the reference waveform. The measurements of per specimen were repeated 10 times. Finally, received signal was subjected to post-processing such as denoising (wavelet transform), interception, windowing, and fast Fourier transform (FFT) by the computer.
The received time domain signal (the blue squares indicate the width of the Hann window) of carbonated concrete acquired by the oscilloscope is shown in Figure 5a. It should be noted that the time for the concrete boundary reflection wave to reach the receiving transducer measured in the experiment was around 28 μ s. However, the pulse time length of the excitation wave was less than the time length required for the arrival of the reflected wave. In order to ensure maximum signal accuracy and avoid the influence of boundary reflection waves on the received time-domain signal, the first ten cycles of the time-domain signal were intercepted for windowing (Hanning) and subjected to FFT processing. The spectrum of the FFT processed signal is shown in Figure 5b, and the fundamental amplitude ( A 1 ) and the second harmonic amplitude ( A 2 ) can be observed from the figure. The products of the carbonation reaction filled the pores in concrete, resulting in an effect on the nonlinear response of concrete. Subsequently, the fundamental amplitude ( A 1 ) and the harmonic amplitude ( A 2 ) of the transmitted wave were changed by this effect. As such, the relative nonlinear parameter ( A 2 / A 1 2 ) could be assessed for the change in carbonated concrete.

3. Results and Discussion

The carbonation depth was measured with phenolphthalein in spare samples after 0, 7, and 21 days of carbonation. Table 3 shows the average carbonation depth (cd). The carbonation depth of concrete with different water cement ratio was different at the same carbonation time.
During the concrete carbonation progress, the existing pores and microcracks were deposited by the carbonation product C a C O 3 [5,35]. The molar volume of carbonated products was higher than that of hydrates, resulting in a decrease in the porosity of concrete and an increase in the density of concrete. These microstructural changes altered the ultrasonic parameters of the concrete. After 3, 7, 14, and 21 days of concrete carbonation, the concrete specimens were removed for ultrasonic measurement at 20 C. It can be observed from Figure 6 that the ultrasonic parameters change with the carbonation time of concrete. As shown in Figure 6b, the fundamental amplitude ( A 1 ) of concrete increases with the concrete carbonation time. Meanwhile, the amplitude of the second harmonic ( A 2 ) shows a decreasing trend in general. Hence, the relative nonlinear parameters ( A 2 / A 1 2 ) of concrete are reduced by the change of the fundamental amplitude ( A 1 ) and the second harmonic amplitude ( A 2 ). The variation trend of relative nonlinear parameters with the carbonation progress measured by the configuration at 20 C in this study is similar to that obtained by the second harmonic generation (SHG) technology of Rayleigh surface wave taken by Kim et al. [6,7]. The relative nonlinear parameters decrease with the carbonation progress. Although the water–cement ratios of CI, CII, and CIII are different, the variation of their ultrasonic parameters of carbonated concrete follows this trend.
After 3, 7, 14, and 21 days of concrete carbonation, specimens were placed in an environment chamber at the temperature from −20 C to 40 C for 24 h with a temperature interval of 5 C, all with a relative humidity of 70%. Figure 7 and Figure 8 show the average fundamental amplitudes and second harmonic amplitudes of the ultrasonic longitudinal wave measured at different ambient temperatures after 14 days of concrete carbonation. The fundamental amplitudes and second harmonic amplitudes of the three kinds of concrete are different at various ambient temperatures. As shown in Figure 7, the fundamental amplitude is also affected by the increasing temperature from −20 C to 40 C. It can be seen that the fundamental amplitude measured at 15 C is the lowest. The fundamental amplitude ( A 1 ) measured at 40 C increased significantly compared with that at 15 C. Then, the fundamental amplitude also rises in the temperature decreasing from 15 C to 0 C. This may be due to the trend of water freezing in concrete pores increasing the acoustic impedance of concrete. The fundamental amplitude ( A 1 ) at −20 C does not change much from that at 0 C. It may be the reason that the water in the concrete pores at 0 C is in the state of a mixture of ice and water. Whereafter, the water in the concrete pores froze into ice at −20 C. As shown in Figure 8, the temperature reduction can not increase the second harmonic amplitudes ( A 2 ). The second harmonic amplitudes ( A 2 ) also rise after temperature increases ranging from 0 C to 40 C. Interestingly, the rising trend of the second harmonic amplitudes ( A 2 ) is greater when the temperature ranges from 0 C to 10 C than when the temperature ranges from 10 C to 40 C. It can be seen clearly that the second harmonic amplitudes ( A 2 ) of the three kinds of specimens decrease quickly with the temperature reduction. The amplitudes of the second harmonic decrease slightly at a temperature between −20 C and 0 C. Significantly, the amplitude of the second harmonic at low-temperature decreases by nearly 80% compared with that at 10 C.
It can be seen from Figure 9, Figure 10, Figure 11 and Figure 12 that the relative nonlinear parameters ( A 2 / A 1 2 ) of carbonated concrete are changed by the influence of temperature during the carbonation time. The relative nonlinear parameters ( A 2 / A 1 2 ) measured at any temperature decrease with carbonation time. The relative nonlinear parameters of carbonated concrete measured at 0 C compared with that at 10 C decrease significantly (around 80 ∼ 90%), whereas the relative nonlinear parameters of carbonated concrete measured at 15 C to 40 C increase slightly. The relative nonlinear parameters also increase slightly when the temperature is at −20 C to 0 C, but it does not change too much. Table 4 shows the measured relative nonlinear parameters in different temperatures at the carbonation day 14.
As shown in Figure 9, Figure 10, Figure 11 and Figure 12, the values of the relative nonlinear parameters are more minor at 0 C than at 10 C, whereas the measured nonlinear parameters for the three concrete specimens change obviously with carbonation time in low-temperature environments as shown in Figure 13 and Figure 14. In the same carbonation environment, the carbonation rate of concrete with high water–cement ratios is faster than that with low water–cement ratios [36]. The data in Table 3 follow this trend and can also be reflected from the changes of the relative nonlinear parameters in Figure 13 and Figure 14. In addition, the variational degree of nonlinear parameter is greater for CI ( w / c = 0.57) than for CII ( w / c = 0.52) and CIII ( w / c = 0.47). It means that the detection method in this study is suitable for the assessment of carbonated concrete in low-temperature environments as well.

4. Conclusions

In this paper, the longitudinal nonlinear ultrasonic parameters of carbonated concrete were detected using an embedded composite piezoelectric transducer (ECPT) as the transmitter, and the effect of temperature on the nonlinear parameters of carbonated concrete is investigated. Conclusions are drawn from the experimental results as follows:
  • Though only one ECPT was embedded in the concrete specimen as a transmitter, the nonlinear parameters of the ultrasonic radial propagation in carbonated concrete could also be obtained by the surface-mounted transducer fixed on the surface in which CO 2 was ingressed. This configuration can detect concrete carbonation with a monitoring network for a long time without damage when the surface-mounted transducer is permanently fixed on the structural surface.
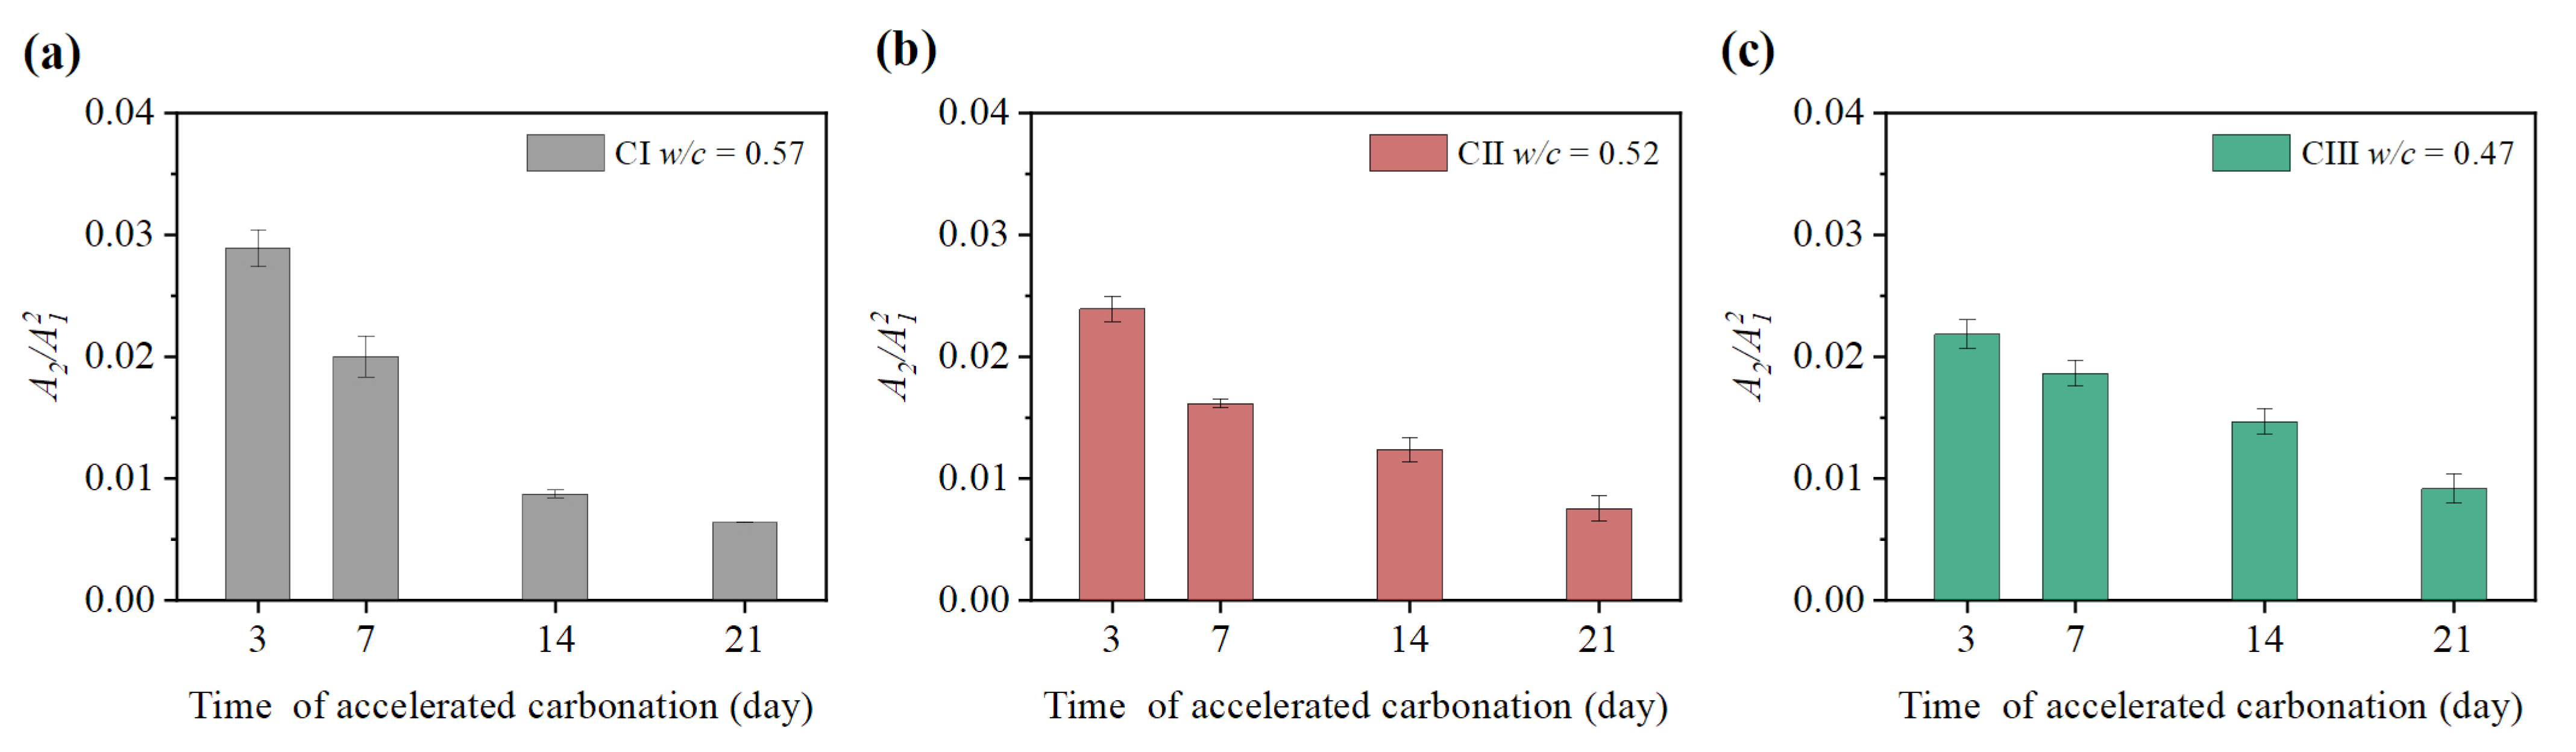
  • The relative nonlinear parameter of carbonated concrete can be affected by the water–cement ratio of the concrete. There is a more significant variation of the nonlinear parameters in the same carbonation time for the specimens with a high water–cement ratio than that with a low one. It indicates that the change of relative nonlinear parameters is closely related to the concrete carbonation depth.
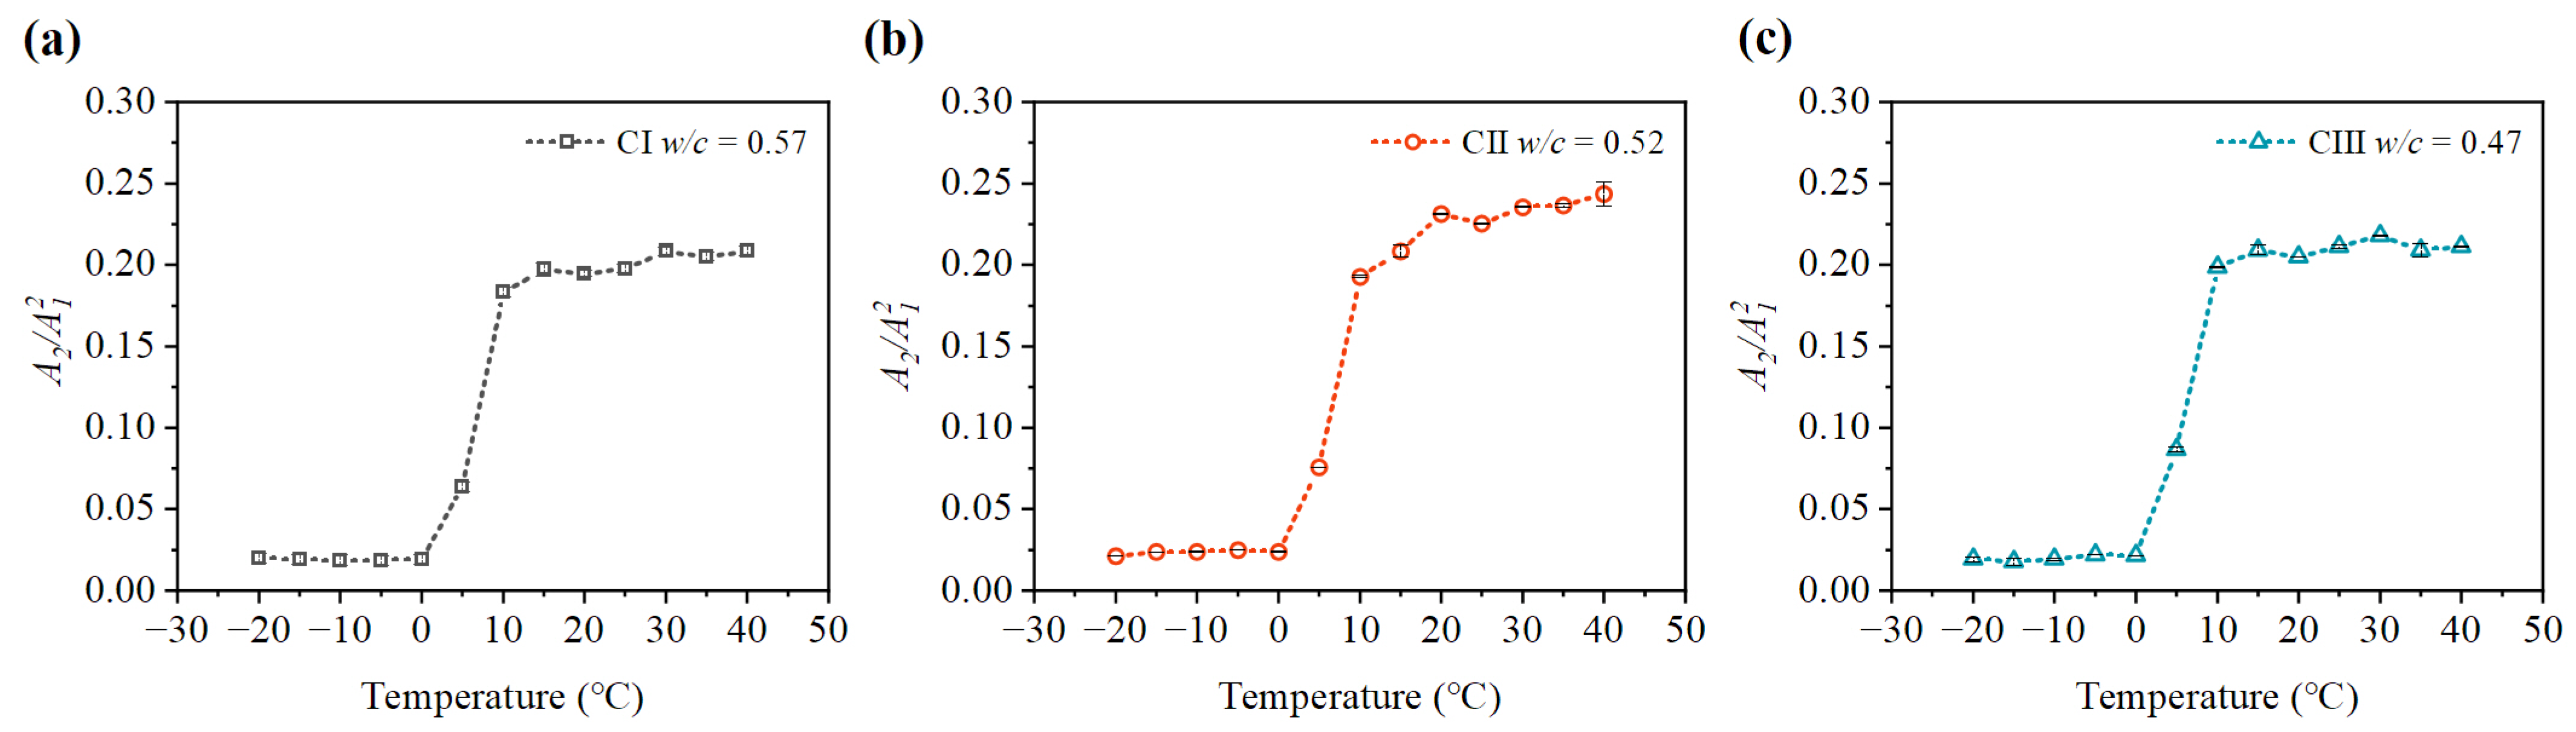
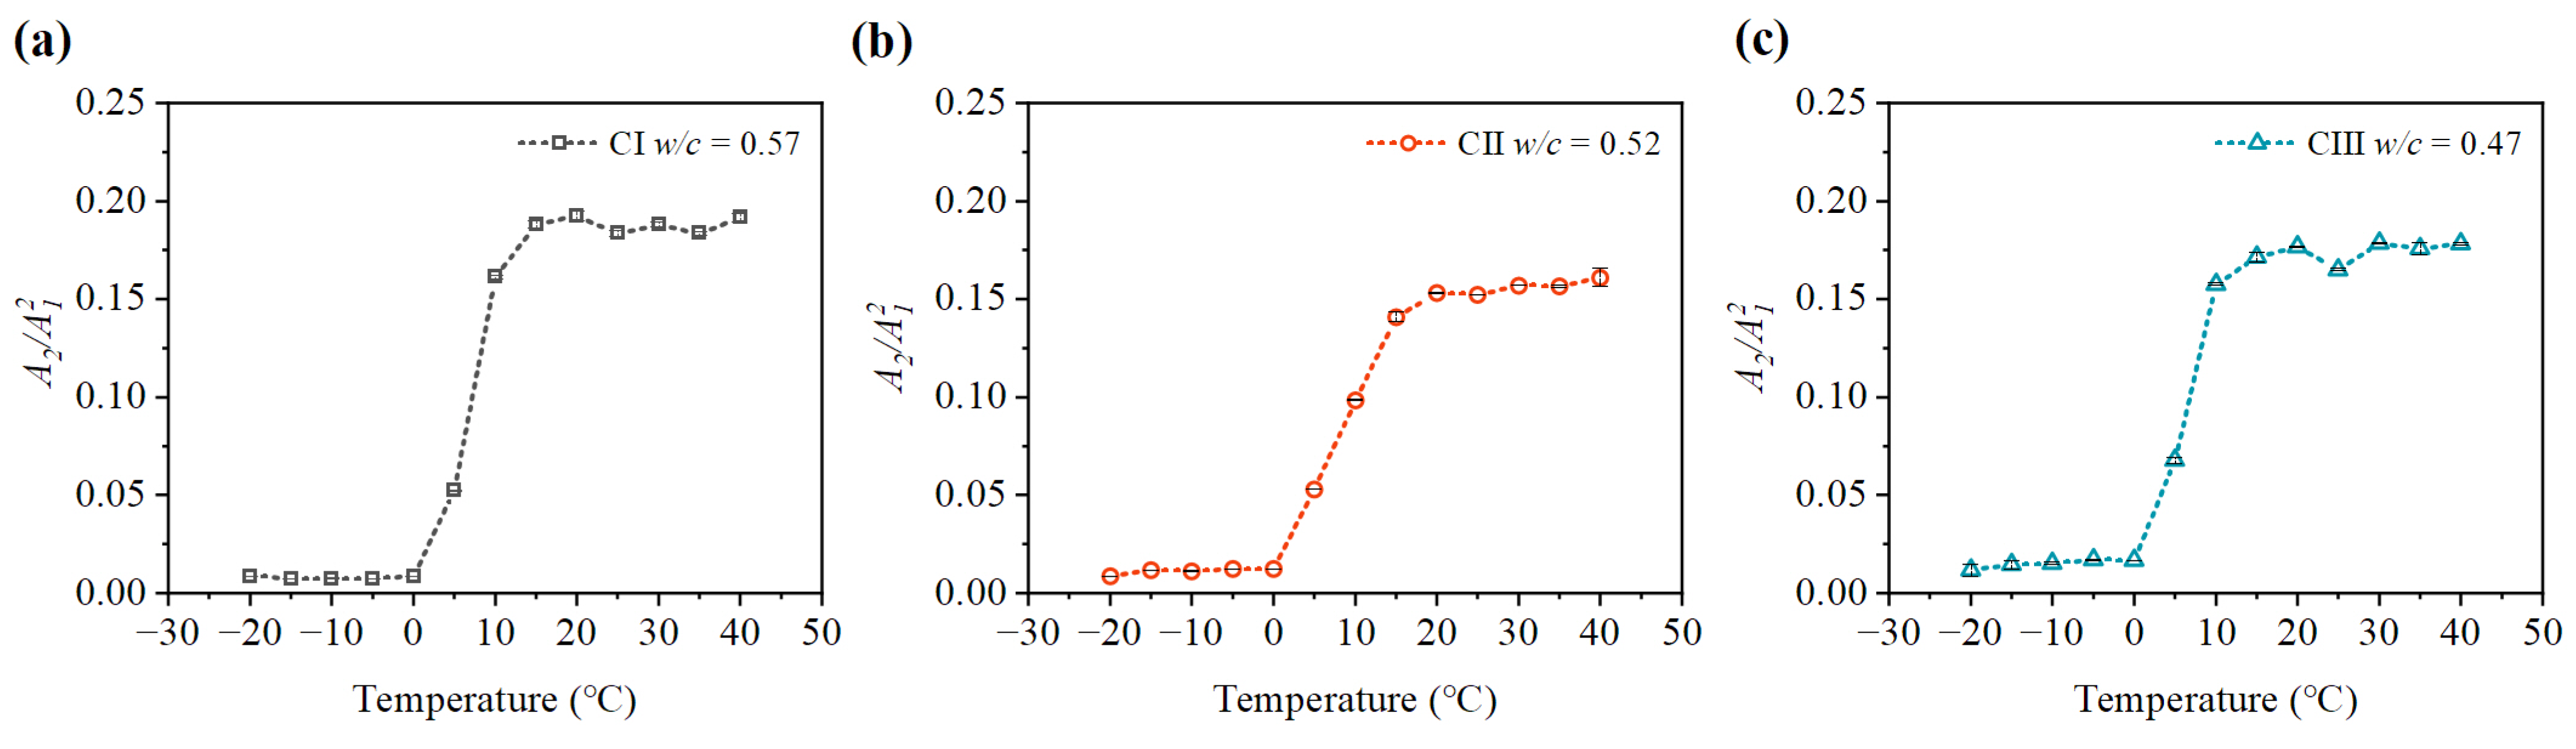
  • At the same ambient relative humidity (RH = 0.7), the fundamental amplitudes ( A 1 ) and the second harmonic amplitudes ( A 2 ) are increased by the increasing temperature from 15 C to 40 C, and the relative nonlinear parameters ( A 2 / A 1 2 ) between the two temperatures are also increased slightly. The fundamental amplitude of carbonated concrete at temperatures below 15 C increases dramatically, while the second harmonic amplitude decreases sharply below 0 C compared with that at 10 C (fell around 80%). The relative nonlinear parameters of carbonated concrete measured at 0 C compared with that at 10 C decreases significantly (around 80∼90%). The relative nonlinear parameters also increase slightly when the temperature is at −20 C to 0 C, but it does not change too much. As such, the relative nonlinear parameters in low temperatures below 0 C are much smaller than at temperatures above 10 C. It may be related to the water condensation in the concrete. In addition, the detection method in this study is also appropriate for the measurement of carbonated concrete in low-temperature environments, since the measured nonlinear parameters for the three concrete specimens change obviously with carbonation time.
  • Considering the effect of temperature variations on the relative parameters of carbonated concrete, temperature compensation should be performed for the relative nonlinear parameters when continuously monitoring the concrete carbonation process.
It can be seen from the results that the relative nonlinear parameters change significantly at the temperature from 0 C to 10 C. The variation of the relative nonlinear parameter in this temperature interval needs to be studied further. Moreover, future studies could investigate the quantitative association between the relative nonlinear parameters and concrete carbonation depth for different kinds of concrete. In addition, the other factors in the measurements for carbonated concrete nonlinear parameters will be investigated in more detail.

Author Contributions

Conceptualization, J.Z., J.W., X.C. and R.Z.; methodology, J.Z. and J.W.; software, J.Z., X.C. and R.Z.; writing—original draft preparation, J.Z. and J.W.; writing—review and editing, J.Z., J.W., X.C. and R.Z. All authors have read and agreed to the published version of the manuscript.

Funding

This research received no external funding.

Institutional Review Board Statement

Not applicable.

Informed Consent Statement

Not applicable.

Data Availability Statement

Not applicable.

Conflicts of Interest

The authors declare no conflict of interest.

References

  1. Chen, J.; Jayapalan, A.R.; Kim, J. Rapid evaluation of alkali–silica reactivity of aggregates using a nonlinear resonance spectroscopy technique. Cem. Concr. Res. 2010, 40, 914–923. [Google Scholar] [CrossRef]
  2. Payan, C.; Garnier, V.; Moysan, J.; Johnson, P.A. Applying nonlinear resonant ultrasound spectroscopy to improving thermal damage assessment in concrete. J. Acoust. Soc. Am. 2007, 121, EL125–EL130. [Google Scholar] [CrossRef] [PubMed] [Green Version]
  3. Florian, O.B.; Jesús, N.E.; Vincent, G.; Cédric, P.; Narintsoa, R.; Benoît, D.; Christophe, M. Linear and nonlinear resonant ultrasonic techniques applied to assess delayed ettringite formation on concrete samples. Constr. Build. Mater. 2021, 275, 121545. [Google Scholar] [CrossRef]
  4. Bouchaala, F.; Payan, C.; Garnier, V. Carbonation assessment in concrete by nonlinear ultrasound. Cem. Concr. Res. 2011, 41, 557–559. [Google Scholar] [CrossRef]
  5. Eiras, J.; Kundu, T.; Popovics, J. Effect of carbonation on the linear and nonlinear dynamic properties of cement-based materials. Opt. Eng. 2015, 55, 011004. [Google Scholar] [CrossRef] [Green Version]
  6. Kim, G.; Kim, J.; Kurtis, E. Quantitative evaluation of carbonation in concrete using nonlinear ultrasound. Mater. Struct. 2016, 49, 399–409. [Google Scholar] [CrossRef] [Green Version]
  7. Kim, G.; In, C.; Kurtis, E. Nondestructive detection and characterization of carbonation in concrete. AIP Conf. Proc. 2014, 1581, 805–813. [Google Scholar] [CrossRef]
  8. Dumoulin, C.; Karaiskos, G.; Deraemaeker, A. 8—Monitoring of crack propagation in reinforced concrete beams using embedded piezoelectric transducers. In Acoustic Emission and Related Non-Destructive Evaluation Techniques in the Fracture Mechanics of Concrete; Ohtsu, M., Ed.; Woodhead Publishing: Oxford, UK, 2015; pp. 161–175. [Google Scholar] [CrossRef]
  9. Kong, Q.; Hou, S.; Ji, Q. Very early age concrete hydration characterization monitoring using piezoceramic based smart aggregates. Smart Mater. Struct. 2013, 22, 085025. [Google Scholar] [CrossRef]
  10. Annamdas, V.; Yang, Y.; Soh, C. Impedance based concrete monitoring using embedded PZT sensors. Int. J. Civ. Struct. Eng. 2010, 1, 414–424. [Google Scholar] [CrossRef]
  11. Deraemaeker, A.; Dumoulin, C. Embedding ultrasonic transducers in concrete: A lifelong monitoring technology. Constr. Build. Mater. 2019, 194, 42–50. [Google Scholar] [CrossRef] [Green Version]
  12. Qin, L.; Liao, Z. Monitoring of cement hydration using embedded piezoelectric transducers. Smart Mater. Struct. 2008, 17, 055005. [Google Scholar] [CrossRef]
  13. Gu, H.; Song, G.; Dhonde, H. Concrete early-age strength monitoring using embedded piezoelectric transducers. Smart Mater. Struct. 2007, 15, 1837–1845. [Google Scholar] [CrossRef] [Green Version]
  14. Wang, D.S.; Zhu, H.P. Monitoring of the strength gain of concrete using embedded PZT impedance transducer. Constr. Build. Mater. 2011, 25, 3703–3708. [Google Scholar] [CrossRef]
  15. Song, G.; Gu, H.; Mo, Y. Concrete structural health monitoring using embedded piezoceramic transducers. Smart Mater. Struct. 2007, 16, 959–968. [Google Scholar] [CrossRef] [Green Version]
  16. Kocherla, A.; Duddi, M.; Subramaniam, K.V.L. Embedded PZT sensors for monitoring formation and crack opening in concrete structures. Measurement 2021, 182, 109698. [Google Scholar] [CrossRef]
  17. Zhao, X.; Li, H.; Du, D. Concrete structure monitoring based on built-in piezoelectric ceramic transducers. Proc. SPIE 2008, 6932, 693208. [Google Scholar] [CrossRef]
  18. Zhao, G.Q.; Zhang, D.; Zhang, L. Detection of Defects in Reinforced Concrete Structures Using Ultrasonic Nondestructive Evaluation with Piezoceramic Transducers and the Time Reversal Method. Sensors 2018, 18, 4176. [Google Scholar] [CrossRef] [Green Version]
  19. Zou, D.; Liu, T.; Huang, Y. Feasibility of water seepage monitoring in concrete with embedded smart aggregates by P-wave travel time measurement. Smart Mater. Struct. 2014, 23, 067003. [Google Scholar] [CrossRef]
  20. Li, Z.; Qin, L.; Huang, S. Embedded piezo-transducer in concrete for property diagnosis. J. Mater. Civ. Eng. 2009, 21, 085025. [Google Scholar] [CrossRef]
  21. Liu, T.; Zou, D.; Du, C. Influence of axial loads on the health monitoring of concrete structures using embedded piezoelectric transducers. Smart Mater. Struct. 2017, 16, 202–214. [Google Scholar] [CrossRef]
  22. Liao, W.; Wang, J.; Song, G. Structural health monitoring of concrete columns subjected to seismic excitations using piezoceramic-based sensors. Smart Mater. Struct. 2011, 20, 125015. [Google Scholar] [CrossRef]
  23. Kaur, N.; Bhalla, S. Combined Energy Harvesting and Structural Health Monitoring Potential of Embedded Piezo-Concrete Vibration Sensors. J. Energy Eng. 2014, 141, D4014001. [Google Scholar] [CrossRef]
  24. Talakokula, V.; Bhalla, S.; Ball, R.J. Diagnosis of carbonation induced corrosion initiation and progression in reinforced concrete structures using piezo-impedance transducers. Sens. Actuators A 2016, 242, 79–91. [Google Scholar] [CrossRef] [Green Version]
  25. Chen, Y.Z.; Xue, X.W. Advances in the Structural Health Monitoring of Bridges Using Piezoelectric Transducers. Sensors 2018, 18, 4312. [Google Scholar] [CrossRef] [PubMed] [Green Version]
  26. Zhang, H.; Li, J.; Kang, F. Real-time monitoring of humidity inside concrete structures utilizing embedded smart aggregates. Constr. Build. Mater. 2022, 331, 127317. [Google Scholar] [CrossRef]
  27. Lim, Y.Y.; Smith, S.T.; Soh, C.K. Wave propagation based monitoring of concrete curing using piezoelectric materials: Review and path forward. NDT E Int. 2018, 99, 50–63. [Google Scholar] [CrossRef]
  28. Chen, J.; Yang, C.; Wang, Q.; Xu, N.; Zhang, T. Nonlinear Ultrasonic Second Harmonic Assessment of Concrete Defects Based on Embedded Piezoelectric Sensors. Res. Nondestruct. Eval. 2020, 4, 254–270. [Google Scholar] [CrossRef]
  29. Zhou, S.; Shul, Y. Nonlinear reflection of bulk acoustic waves at an interface. J. Appl. Phys. 1992, 72, 5070. [Google Scholar] [CrossRef]
  30. Bender, F.A.; Kim, J.Y.; Jacobes, L.J.; Qu, J. The generation of second harmonic waves in an isotropic solid with quadratic nonlinearity under the presence of a stress-free boundary. Wave Motion 2013, 50, 146–161. [Google Scholar] [CrossRef]
  31. Jhang, K.Y. Nonlinear Ultrasonic Techniques for Non-destructive Assessment of Micro Damage in Material: A Review. Int. J. Precis. Eng. Manuf. 2009, 10, 123–135. [Google Scholar] [CrossRef]
  32. GB/T 19801-2005/ISO 12714:1999; Non-Destructive Testing—Secondary Calibration of Acoustic Emission Testing Transducer. Chinese Standard: Beijing, China, 2005.
  33. Ono, K. Calibration Methods of Acoustic Emission Sensors. Materials 2016, 9, 508. [Google Scholar] [CrossRef] [Green Version]
  34. Xiao, D.; Zhang, Z.; Ren, H.; Yang, B.; Pan, Q.; Xu, C. Calibration Principle for Acoustic Emission Sensor Sensitivity. In Advances in Acoustic Emission Technology; Springer: Berlin/Heidelberg, Germany, 2015; pp. 33–45. [Google Scholar]
  35. Chang, J.J.; Yeih, W.; Huang, R. Mechanical properties of carbonated concrete. Opt. Eng. 2003, 26, 513–522. [Google Scholar] [CrossRef]
  36. Venkat Rao, N.; Meena, T. A review on carbonation study in concrete. IOP Conf. Ser. Mater. Sci. Eng. 2017, 263, 032011. [Google Scholar] [CrossRef]
Figure 1. ECPT: (a) structure of ECPT; (b) the finished product of ECPT.
Materials 15 08797 g001
Figure 2. Response curves for ECPT.
Materials 15 08797 g002
Figure 3. Arrangement of the embedded composite piezoelectric ultrasonic transducer: (a) partial cutaway perspective view of the specimen; (b) Section 1-1; (c) Section 2-2.
Materials 15 08797 g003
Figure 4. Experimental device: (a) connection of experimental instruments; (b) the photos of the experimental device.
Materials 15 08797 g004
Figure 5. Time signal and spectrum for measurement: (a) received time domain signal; (b) spectrum signal after FFT ( A 1 : 1 MHz, A 2 : 2 MHz).
Materials 15 08797 g005
Figure 6. Variation of ultrasonic average parameters with carbonation time: (a) fundamental amplitude A 1 ; (b) second harmonic amplitude A 2 ; (c) nonlinear parameter A 2 / A 1 2 .
Materials 15 08797 g006
Figure 7. Variation of fundamental amplitude A 1 at different temperatures: (a) fundamental amplitude A 1 of CI; (b) fundamental amplitude A 1 of CII; (c) fundamental amplitude A 1 of CIII.
Materials 15 08797 g007
Figure 8. Variation of second harmonic amplitude A 2 at different temperatures. (a) second harmonic amplitude A 2 of CI; (b) second harmonic amplitude A 2 of CII; (c) second harmonic amplitude A 2 of CIII.
Materials 15 08797 g008
Figure 9. Variation of nonlinear parameter A 2 / A 1 2 at different temperatures (day 3): (a) nonlinear parameter A 2 / A 1 2 of CI; (b) nonlinear parameter A 2 / A 1 2 of CII; (c) nonlinear parameter A 2 / A 1 2 of CIII.
Materials 15 08797 g009
Figure 10. Variation of nonlinear parameter A 2 / A 1 2 at different temperatures (day 7): (a) nonlinear parameter A 2 / A 1 2 of CI; (b) nonlinear parameter A 2 / A 1 2 of CII; (c) nonlinear parameter A 2 / A 1 2 of CIII.
Materials 15 08797 g010
Figure 11. Variation of nonlinear parameter A 2 / A 1 2 at different temperatures (day 14): (a) nonlinear parameter A 2 / A 1 2 of CI; (b) nonlinear parameter A 2 / A 1 2 of CII; (c) nonlinear parameter A 2 / A 1 2 of CIII.
Materials 15 08797 g011
Figure 12. Variation of nonlinear parameter A 2 / A 1 2 at different temperatures (day 21): (a) nonlinear parameter A 2 / A 1 2 of CI; (b) nonlinear parameter A 2 / A 1 2 of CII; (c) nonlinear parameter A 2 / A 1 2 of CIII.
Materials 15 08797 g012
Figure 13. Variation of nonlinear parameter A 2 / A 1 2 at 0 C: (a) nonlinear parameter A 2 / A 1 2 of CI; (b) nonlinear parameter A 2 / A 1 2 of CII; (c) nonlinear parameter A 2 / A 1 2 of CIII.
Materials 15 08797 g013
Figure 14. Variation of nonlinear parameter A 2 / A 1 2 at −20 C: (a) nonlinear parameter A 2 / A 1 2 of CI; (b) nonlinear parameter A 2 / A 1 2 of CII; (c) nonlinear parameter A 2 / A 1 2 of CIII.
Materials 15 08797 g014
Table 1. Mixture ratio of the concrete specimen.
CategoryCICIICIII
OPC ( kg / m 3 )342375415
Fine aggregate ( kg / m 3 )708695680
Coarse aggregate ( kg / m 3 )115511351110
Water ( kg / m 3 )195195195
Table 2. The parameters of PZT.
Model d 33 ( pC · N 1 )C ( pF ) tan δ (%) f t ( MHz ) Z r ( Ω )
PSN-3337711671.774.035.45
Table 3. The average carbonation depth.
0 Day–cd (mm)7 Day–cd (mm)21 Day–cd (mm)
CI w / c = 0.570.516.4111.83
CII w / c = 0.520.325.179.51
CIII w / c = 0.470.113.657.12
Table 4. The measured average relative nonlinear parameters.
Temperature ( C) −20−15−10−50510152025303540
CI w / c = 0.570.008670.008420.007520.008430.009510.052160.160680.187430.191720.182880.187330.182840.19091
CII w / c = 0.520.010520.011690.011280.011350.012360.052880.09840.140730.153040.152150.156990.156590.16099
CIII w / c = 0.470.013620.014530.015120.015870.015640.067610.157550.171390.176610.164950.178590.175630.17809
Publisher’s Note: MDPI stays neutral with regard to jurisdictional claims in published maps and institutional affiliations.

