
Application of the Computed Tomography Method for the Evaluation of Porosity of Autoclaved Materials


Abstract
:1. Introduction
- (1)
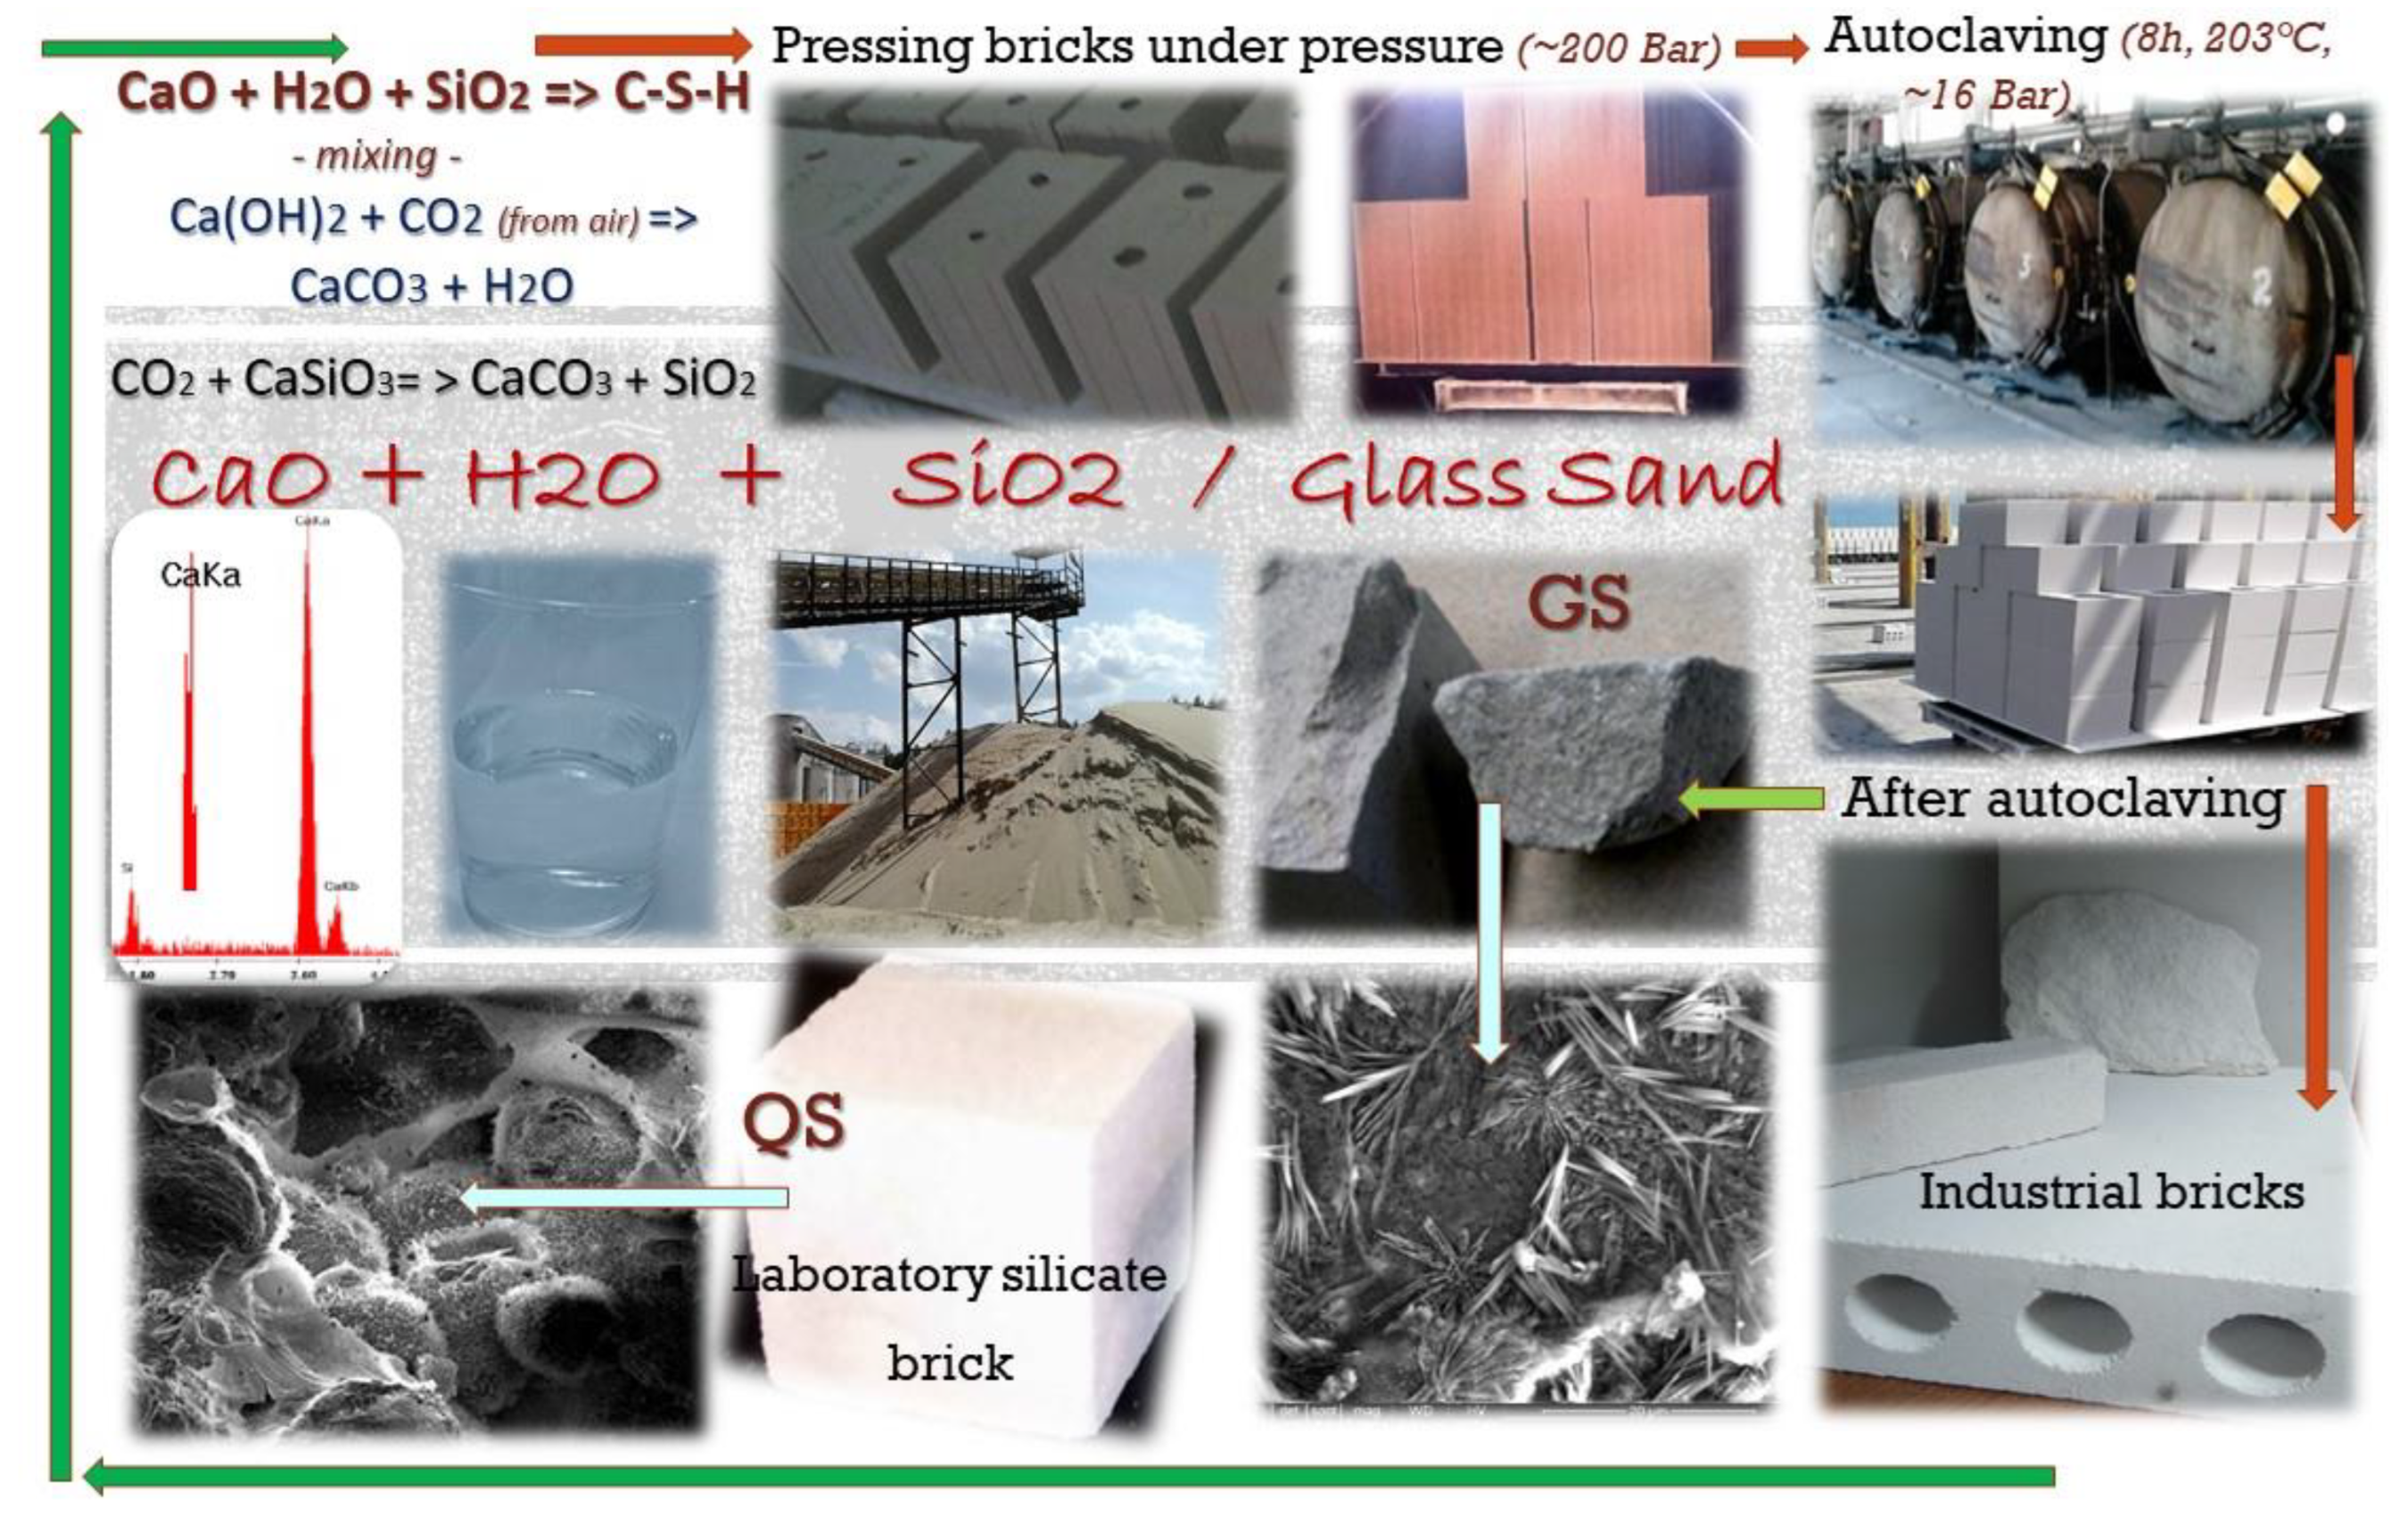
- The production process of silicate bricks takes a maximum of 8 h, after which we obtain a brick with a strength of 15–20 MPa, from which buildings of up to five floors can be made. This type of bricks is a natural building material intended for the construction and partition walls with a heat transfer coefficient (U) in the range of 0.46–0.72 W (m2·K) [22], which is related to their high density and good sound insulation (1600–2000 kg/m3) [23]. Such time is obtained due to the use of autoclaves and hydrothermal conditions (elevated pressure + temperature of 203 °C). Cellular concrete is produced in a similar way, but the temperature limit is set to 100 °C;
- (2)
- The difference in the microstructure of the materials produced, i.e., the structure of the concrete, by about 70%, consists of the amorphous C-S-H phase, capable of crystallization, while the structure of silicate bricks consists of 90% (by mass) tobermorite crystalline phase (crystallization of the C-S-H phase into tobermorite at elevated temperatures in traditional silicate bricks) and/or gyrolite or natrolite (crystallization of the C-S-H phase toward natrolite or gyrolite in silicate bricks modified with glass sand associated with elevated the Na2O content). Thus, in terms of thermodynamic considerations, silicate bricks are more stable and resistant to weather conditions (e.g., fluctuating temperature, especially in the period of negative and high temperatures). The C-S-H phase is metastable and retains its properties up to temperatures of 25–30 °C. The analysis of the pore content in concrete is also important since it is believed that the formed pores can serve as an effective protection against the harmful effects of frost [24,25]. If the total air content in the concrete is between 4% and 7%, the average distance to the nearest air quantity values (spacing factor) L is below 0.20 mm or 0.22 mm, the specific surface area of the pore system is in the range of 16–24 mm−1 and the minimum air content in the pores is smaller than 0.3 mm (A300) by at least 1.5%. The basic method of examining the concrete’s structure is a qualitative image analysis of it, followed by computer image analysis, leading to quantitative results [26,27,28,29].
Sustainable Construction in the Context of Ecology and Economy
- (1)
- Green economy contributing to solving social problems in a sustainable manner, including, in particular, poverty eradication;
- (2)
- Institutionalization of global cooperation for sustainable development, which is to lead to a greater harmonization and effectiveness of these activities [33]. Participants focused on seven priority areas for the international community, namely workplaces, energy, sustainable urban development, food security and sustainable agriculture, water, protection of the oceans and response to natural disasters. In the official international discourse, there were issues related to green economy, social reporting and the product life cycle [37], so that it could be eventually reused (recycling). An example of such a material is glass cullet or silicate aggregate (aggregate after demolition of buildings made of silicate bricks and used as a road foundation).
2. Materials and Research Methods
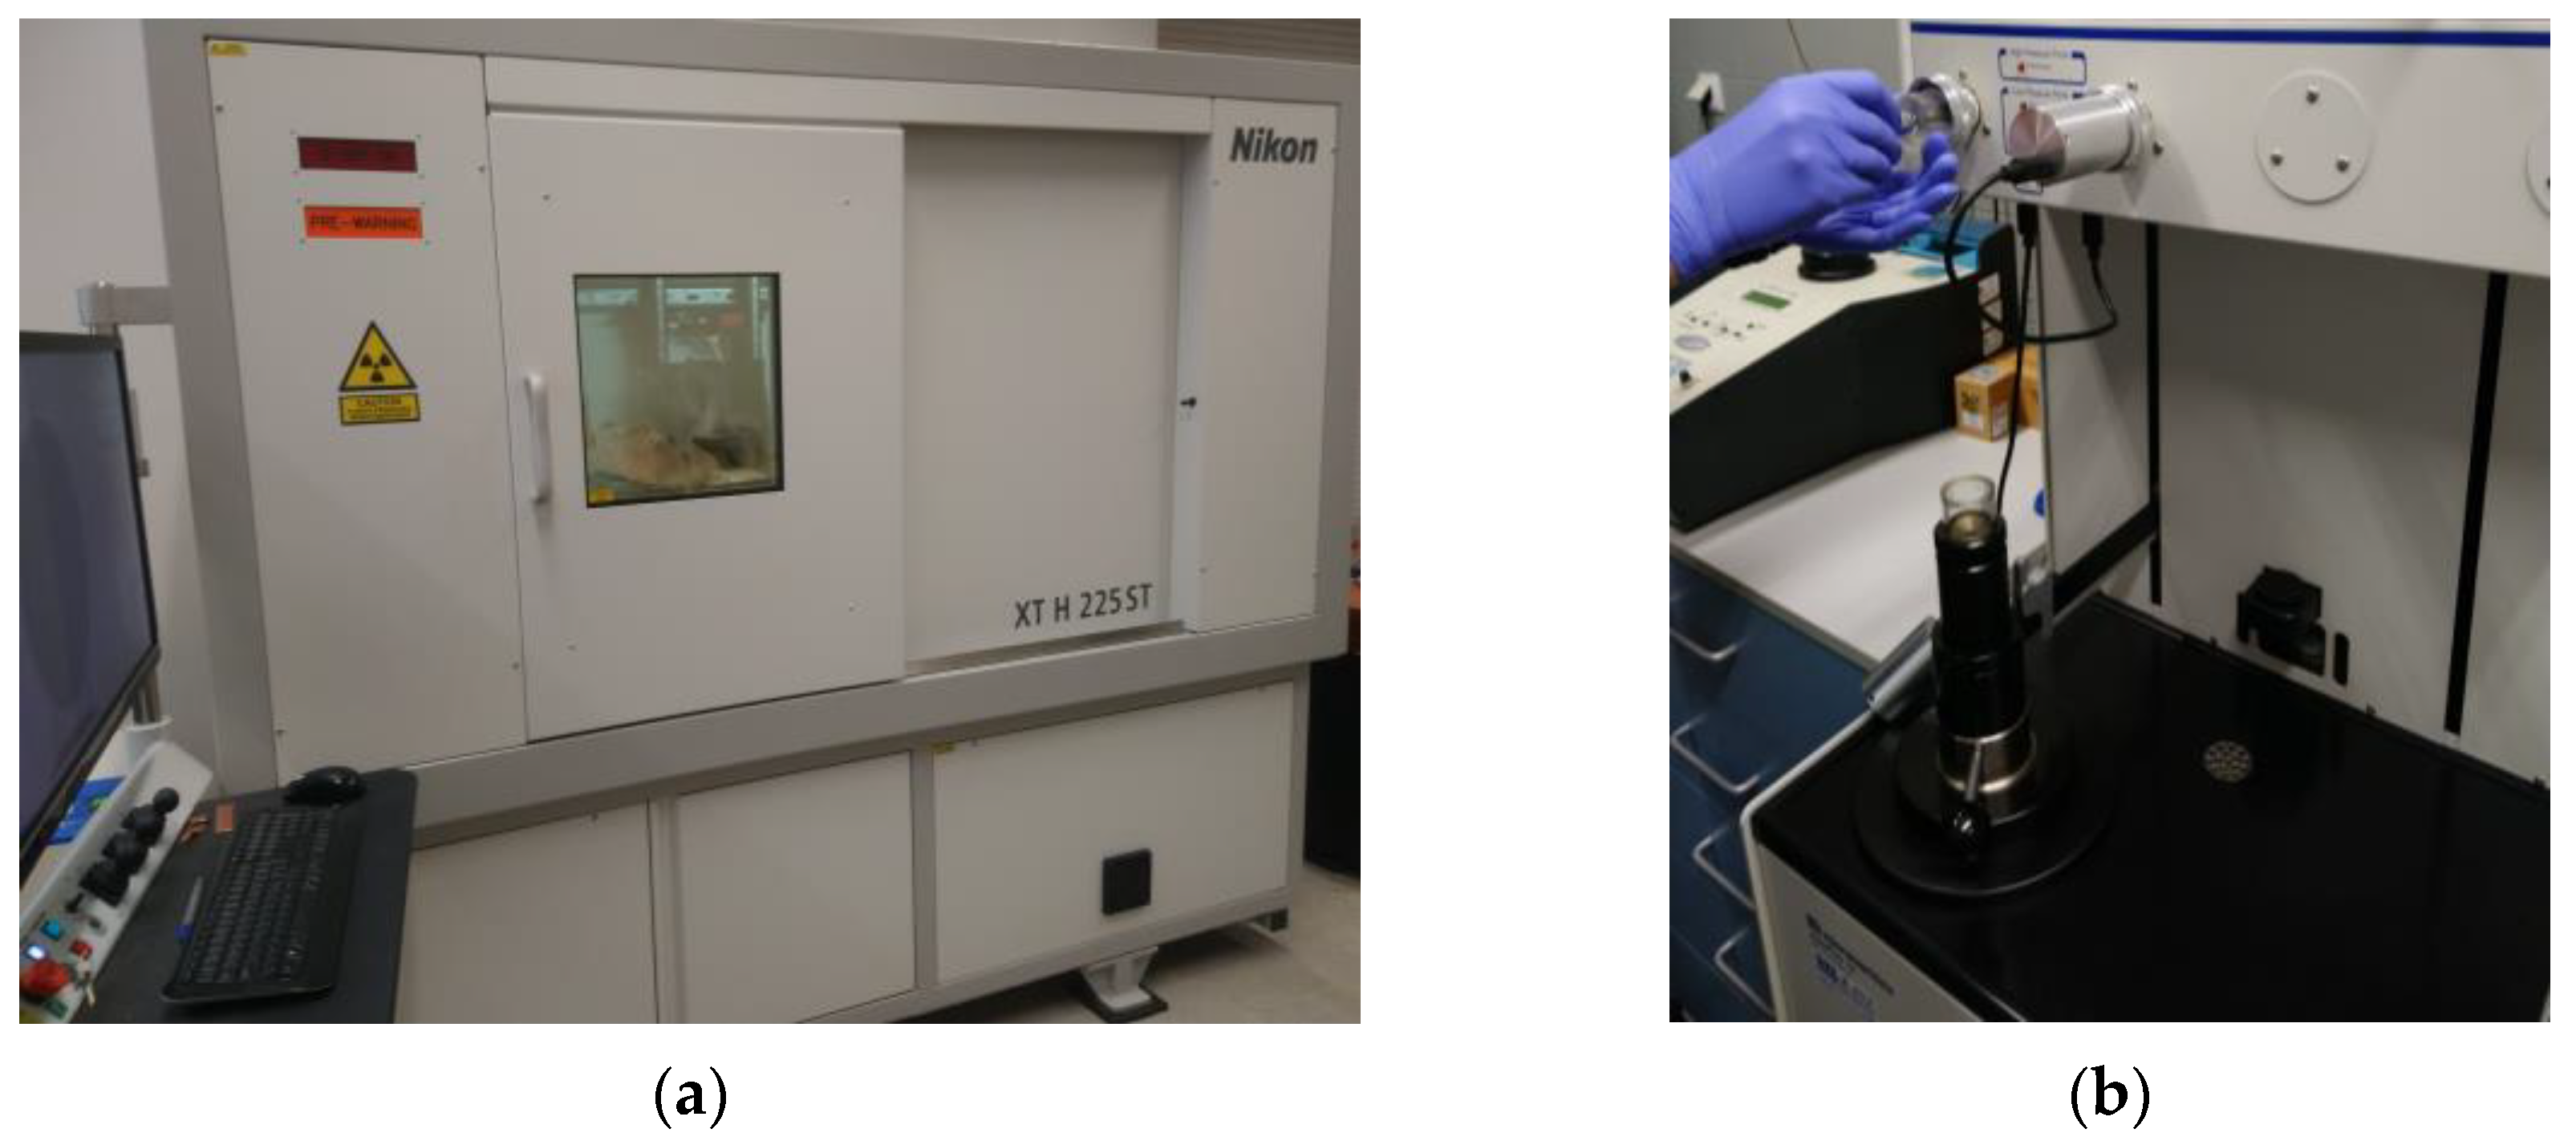
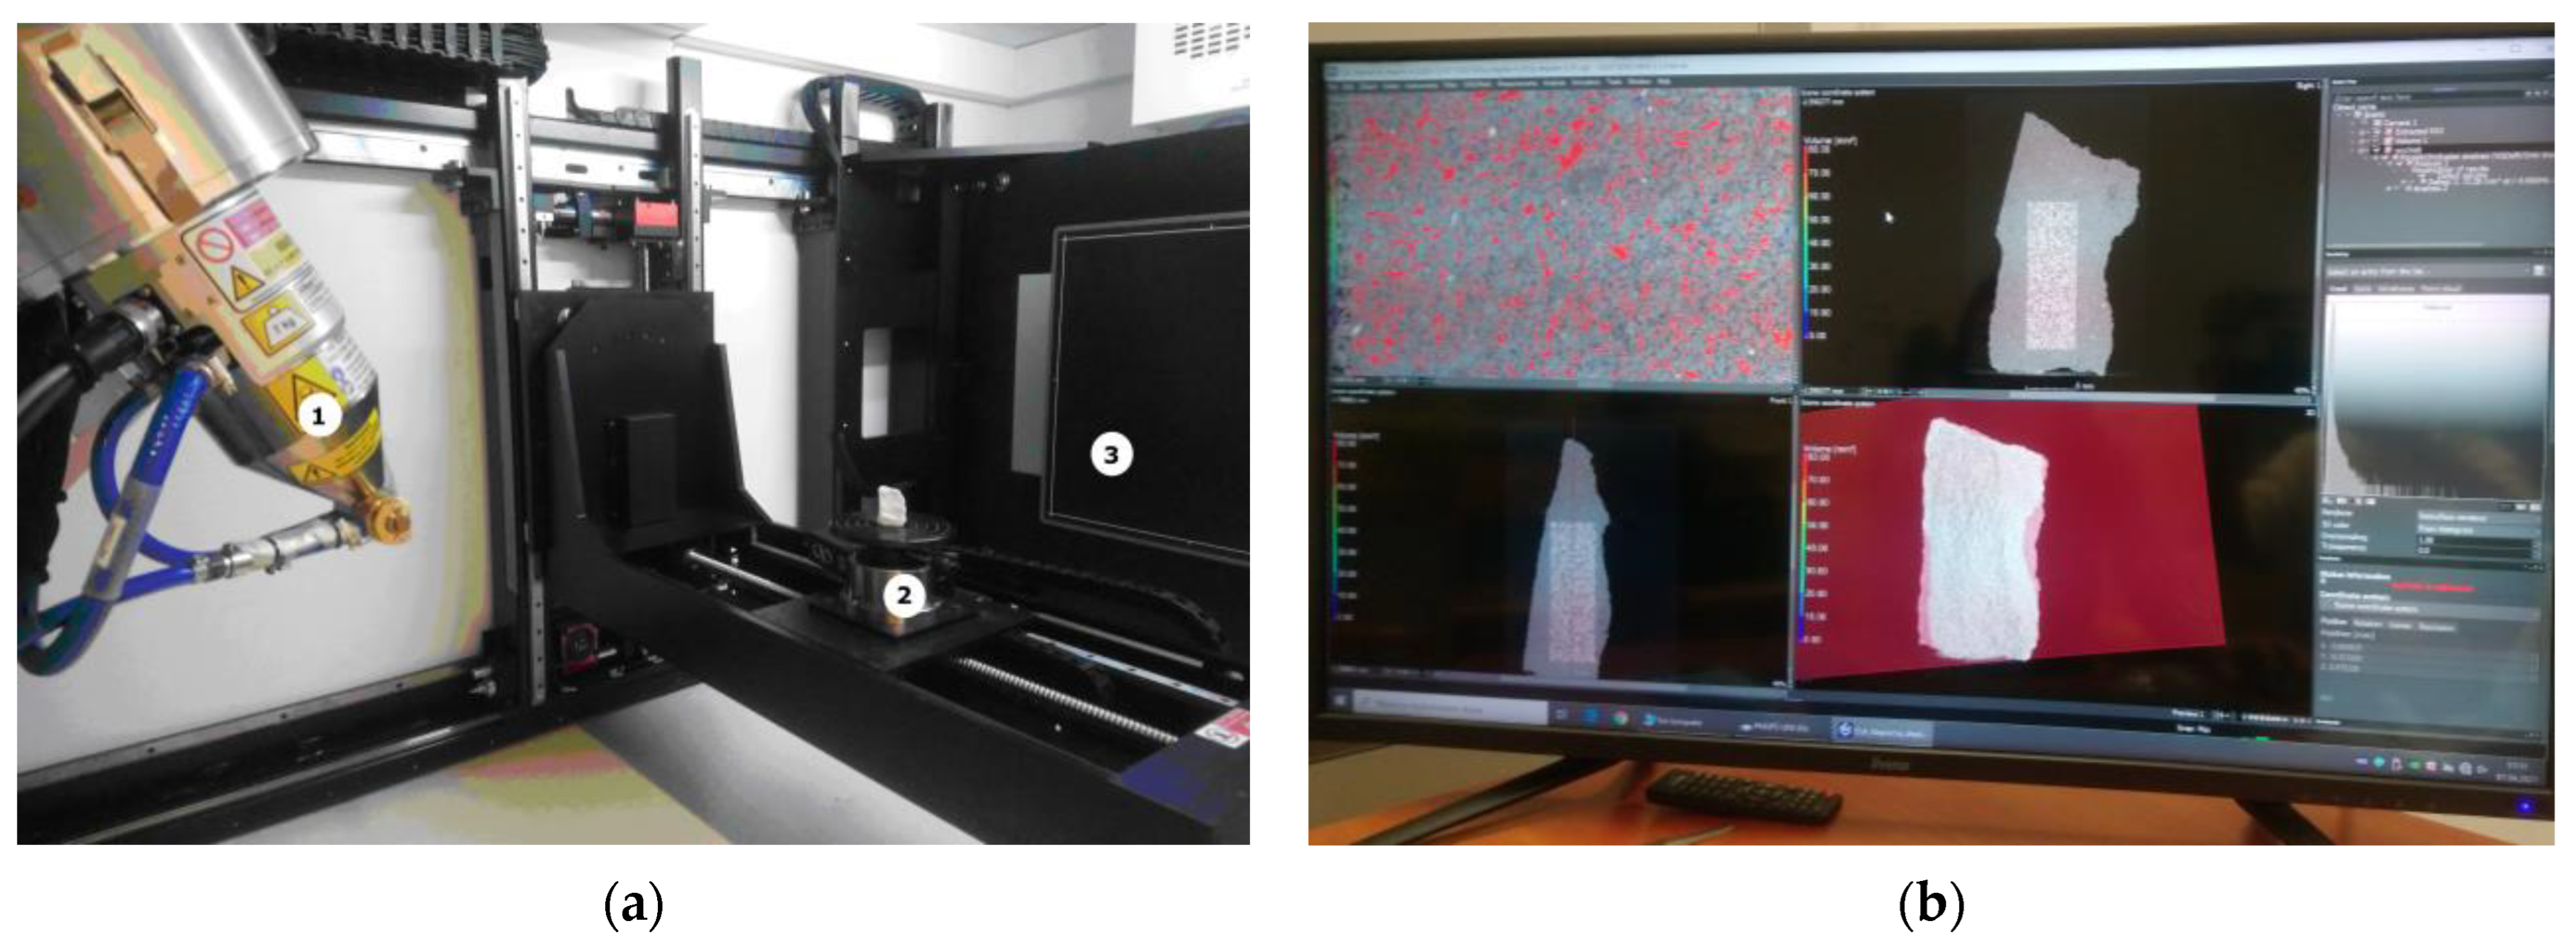
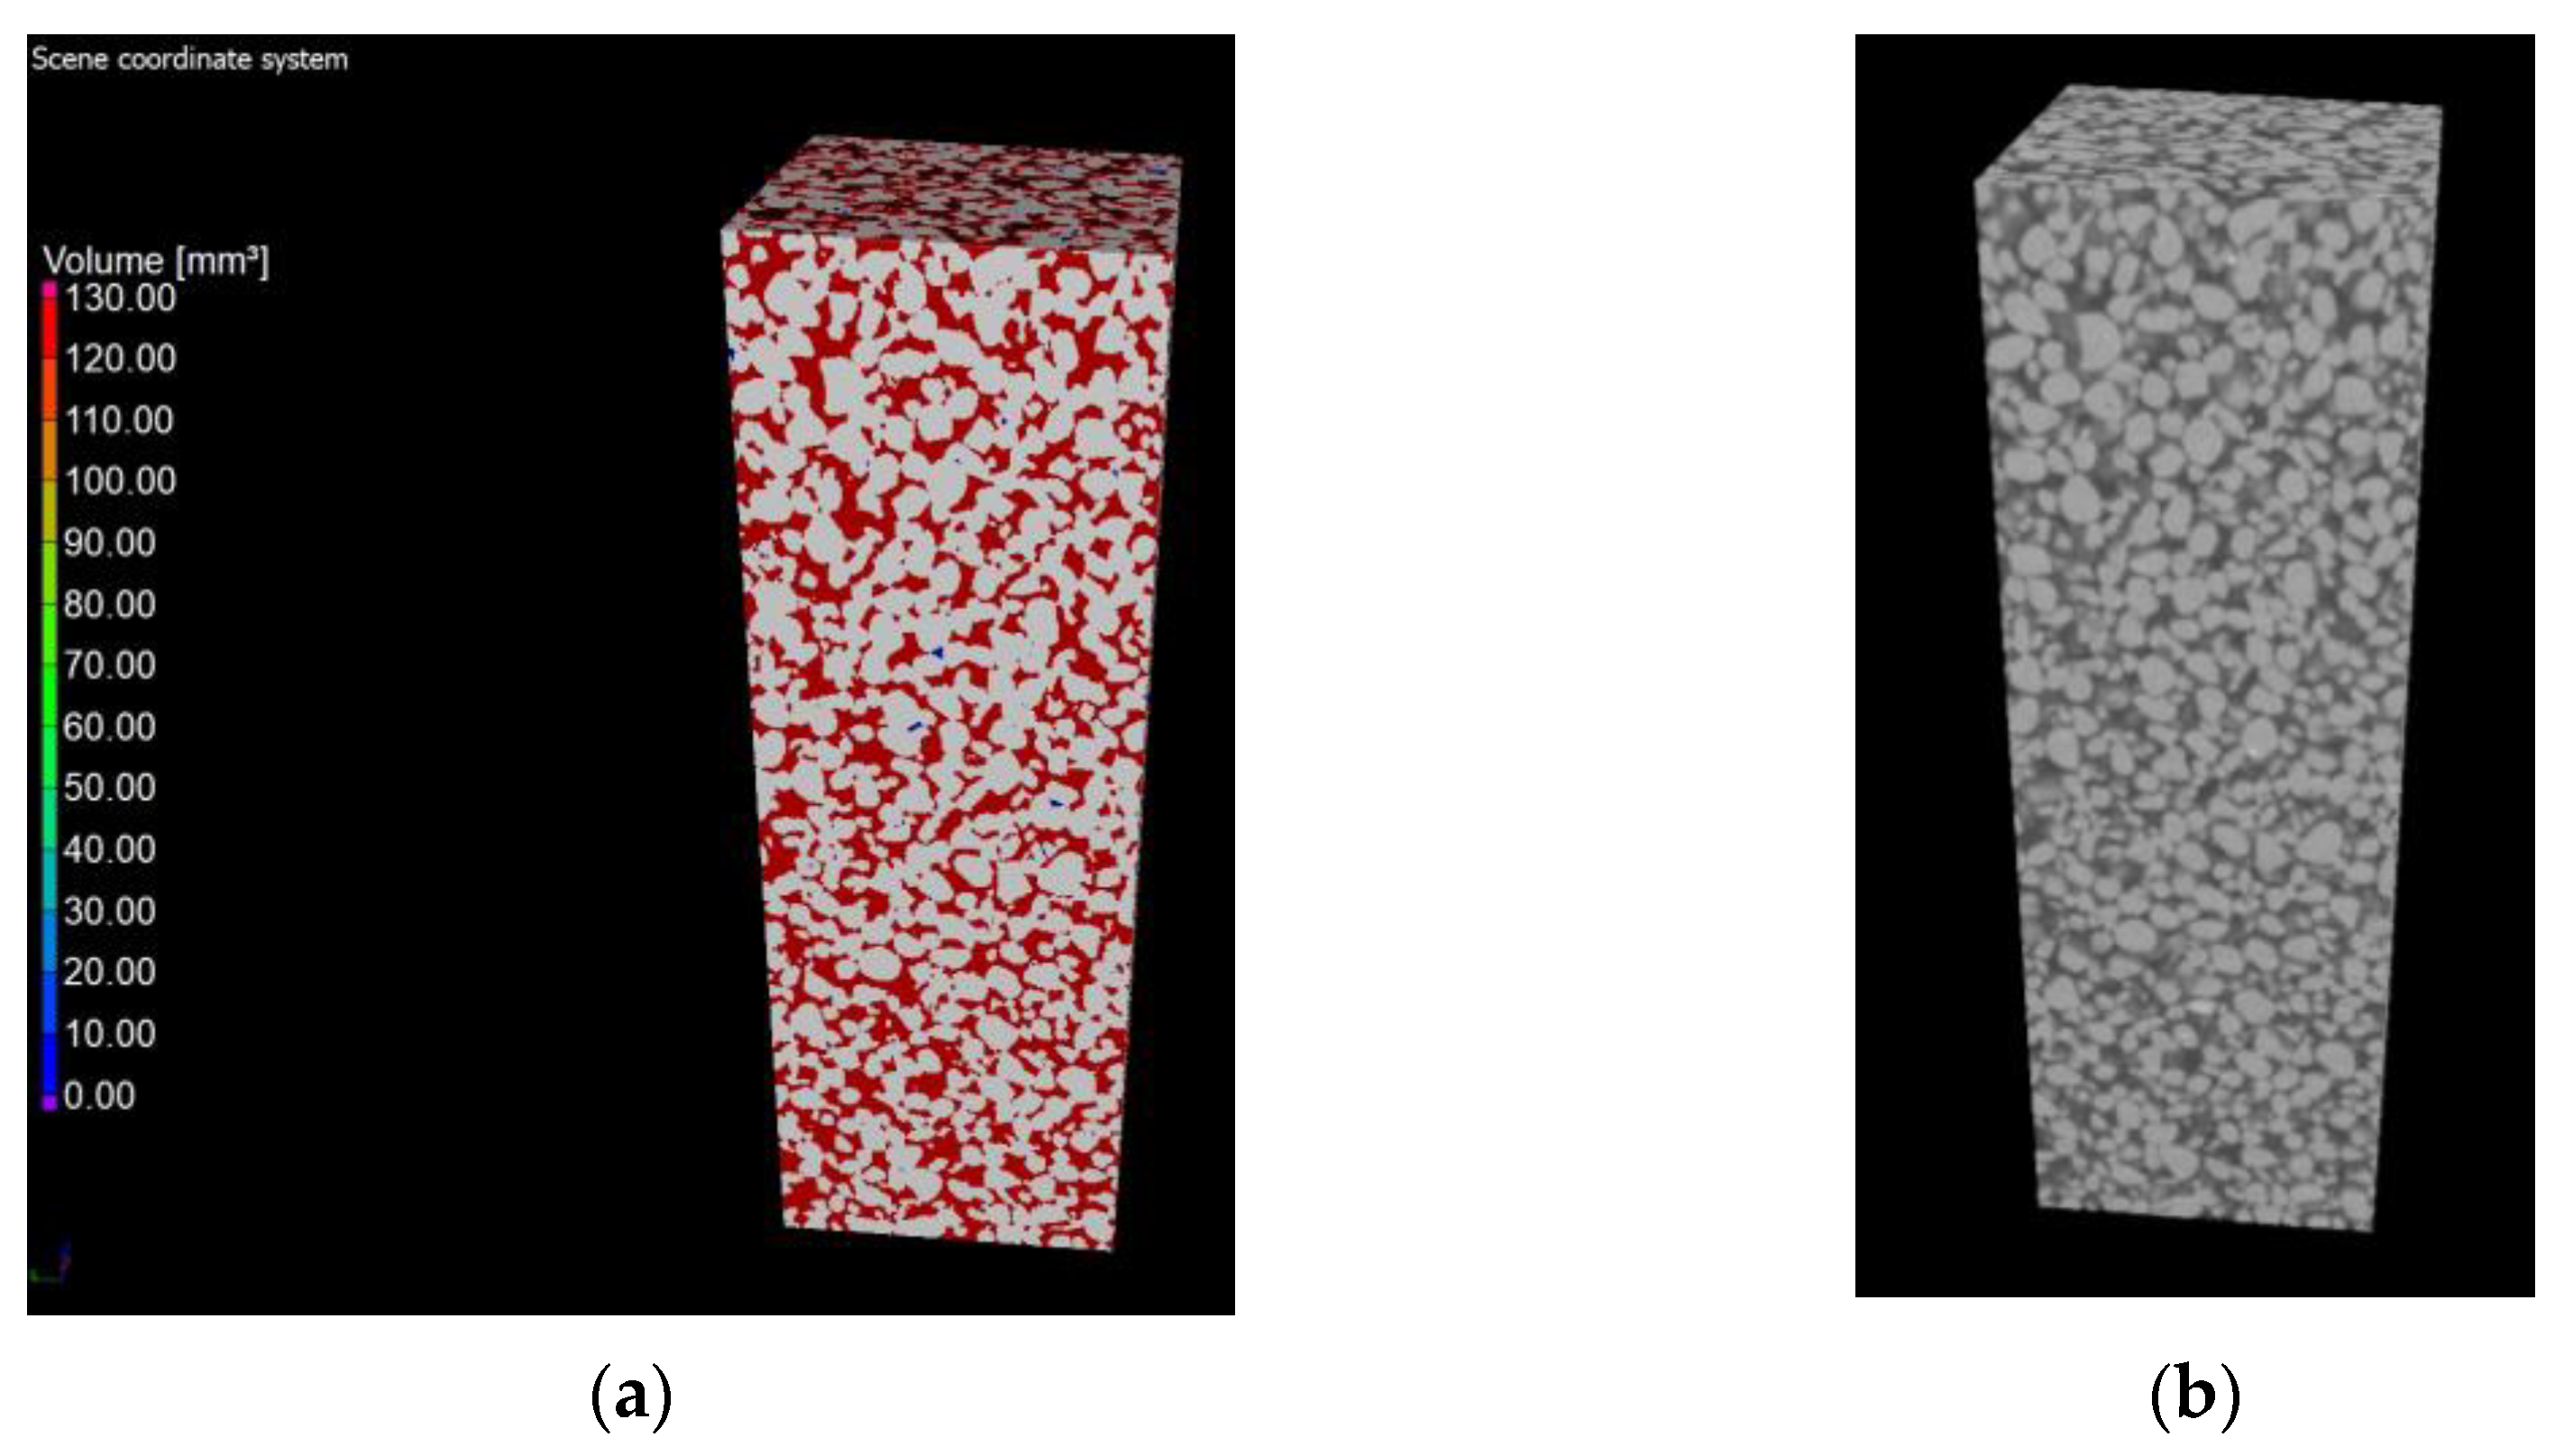
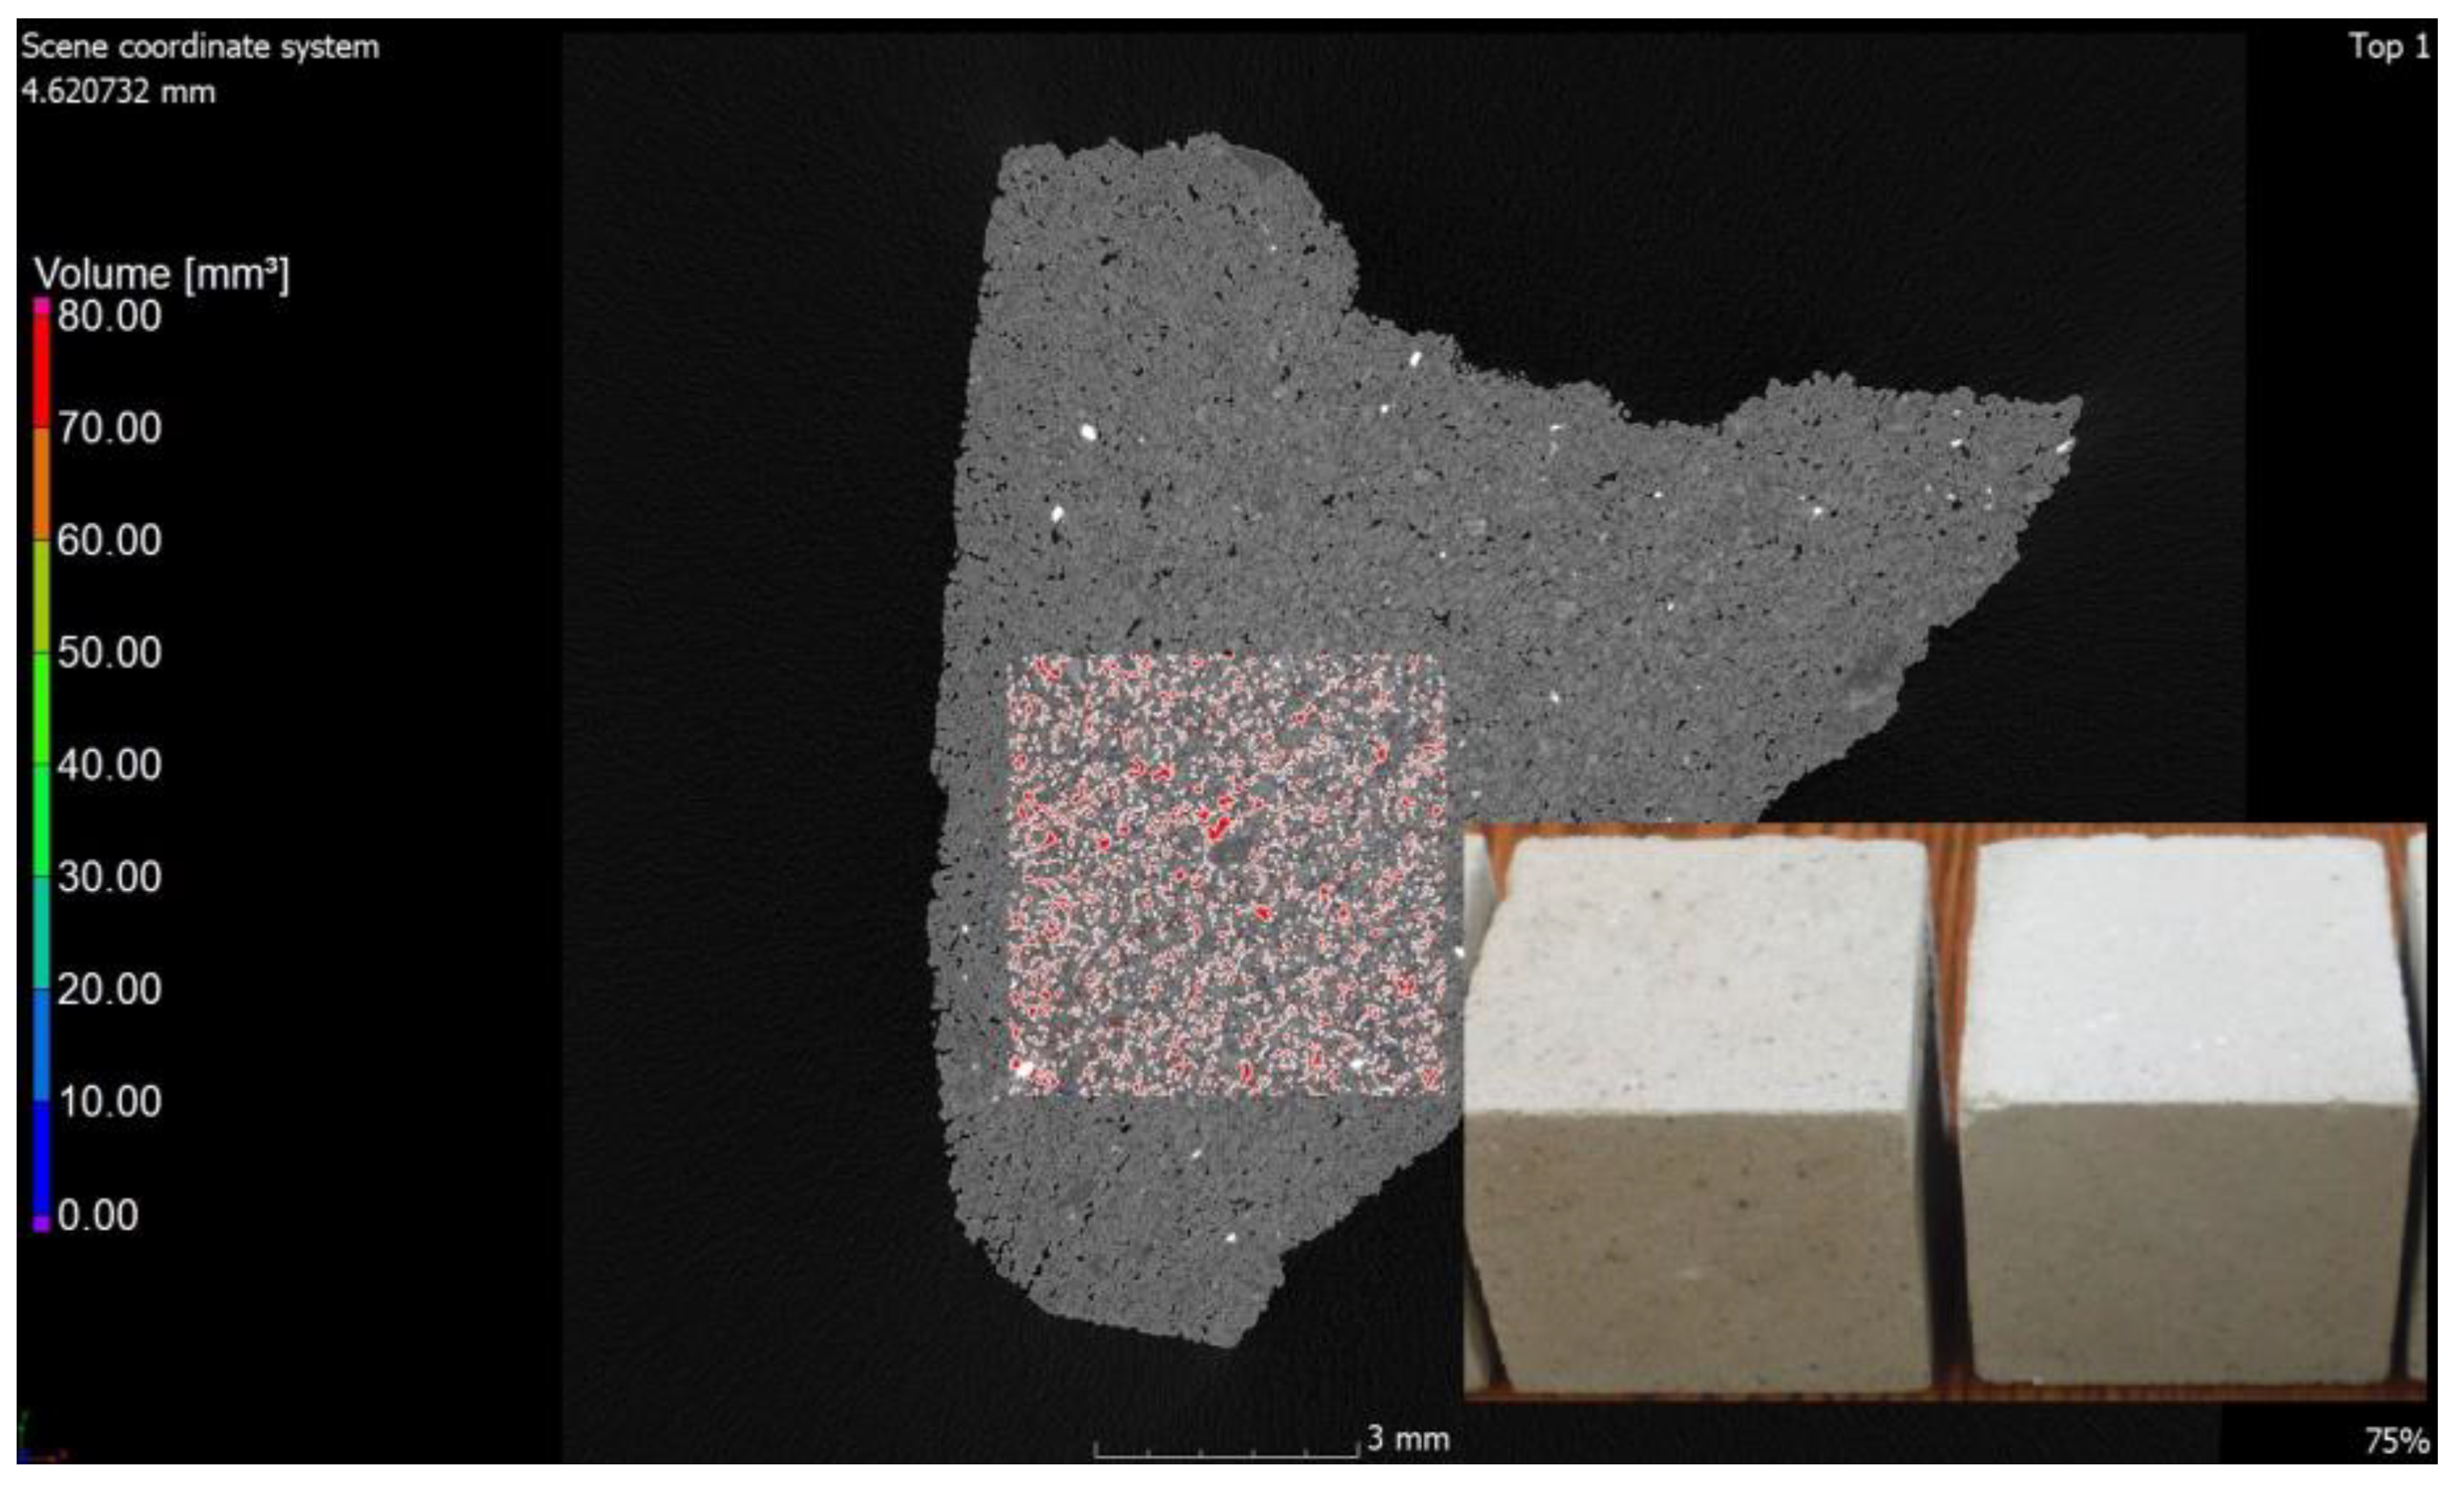
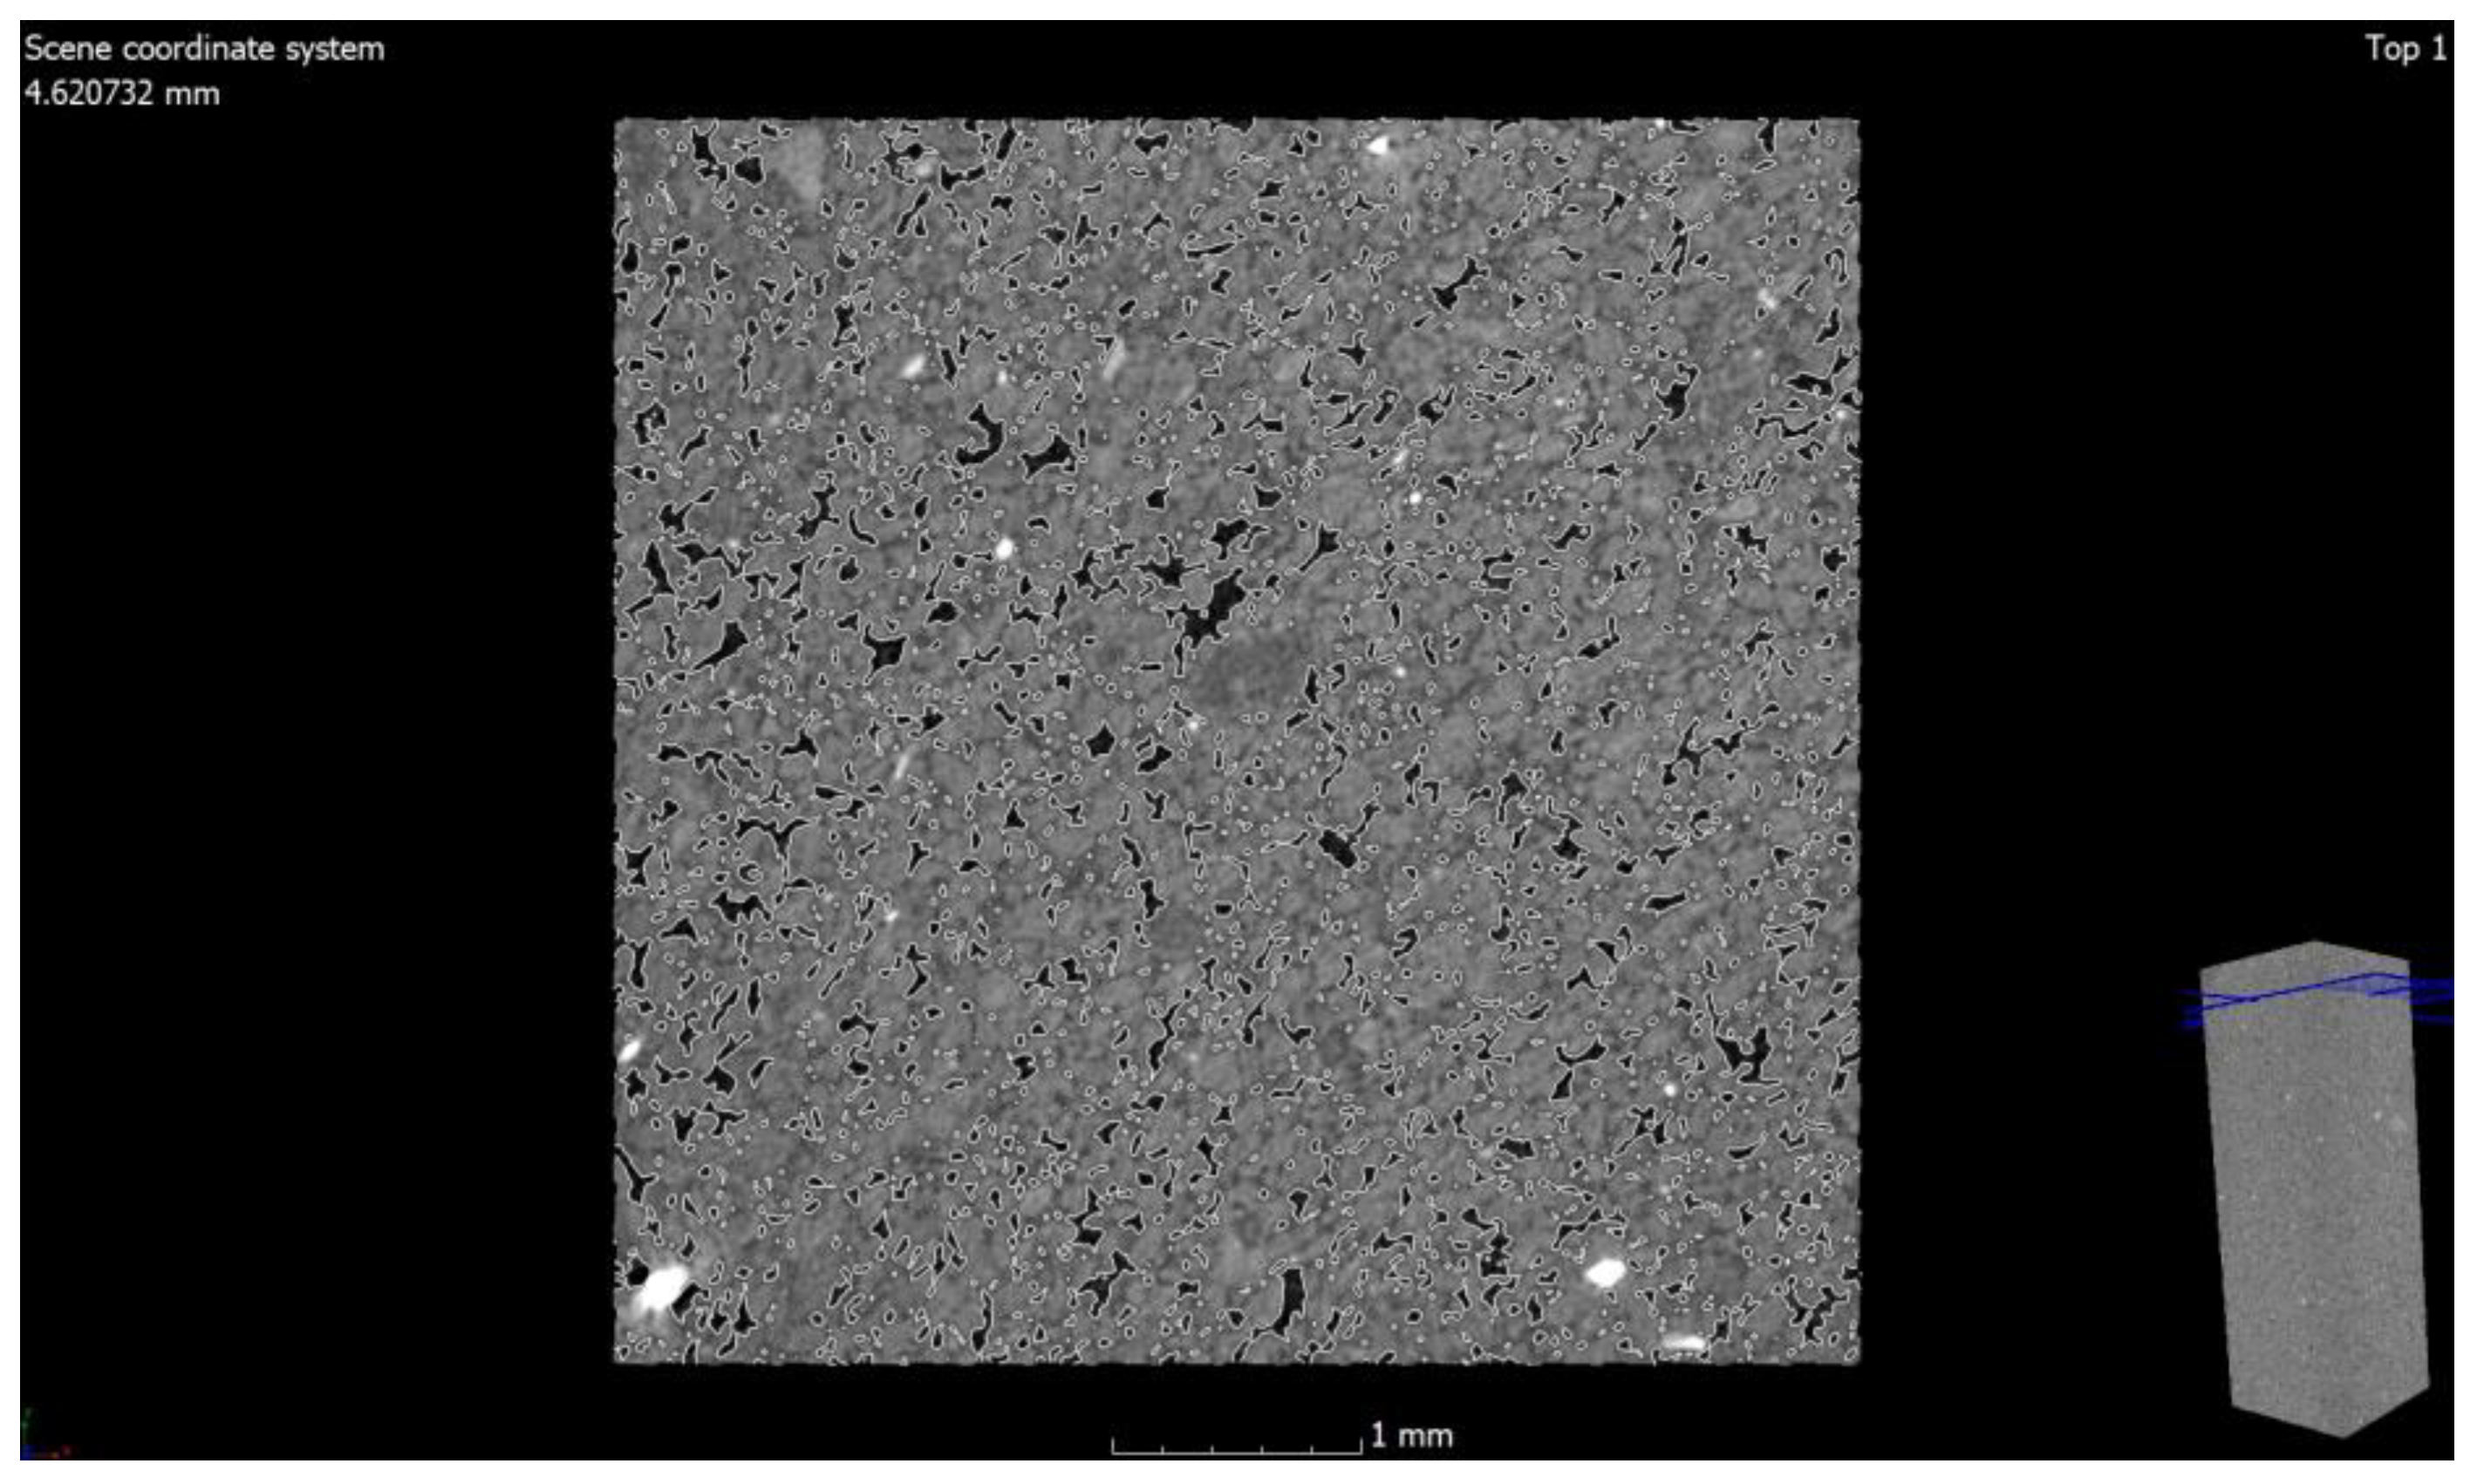
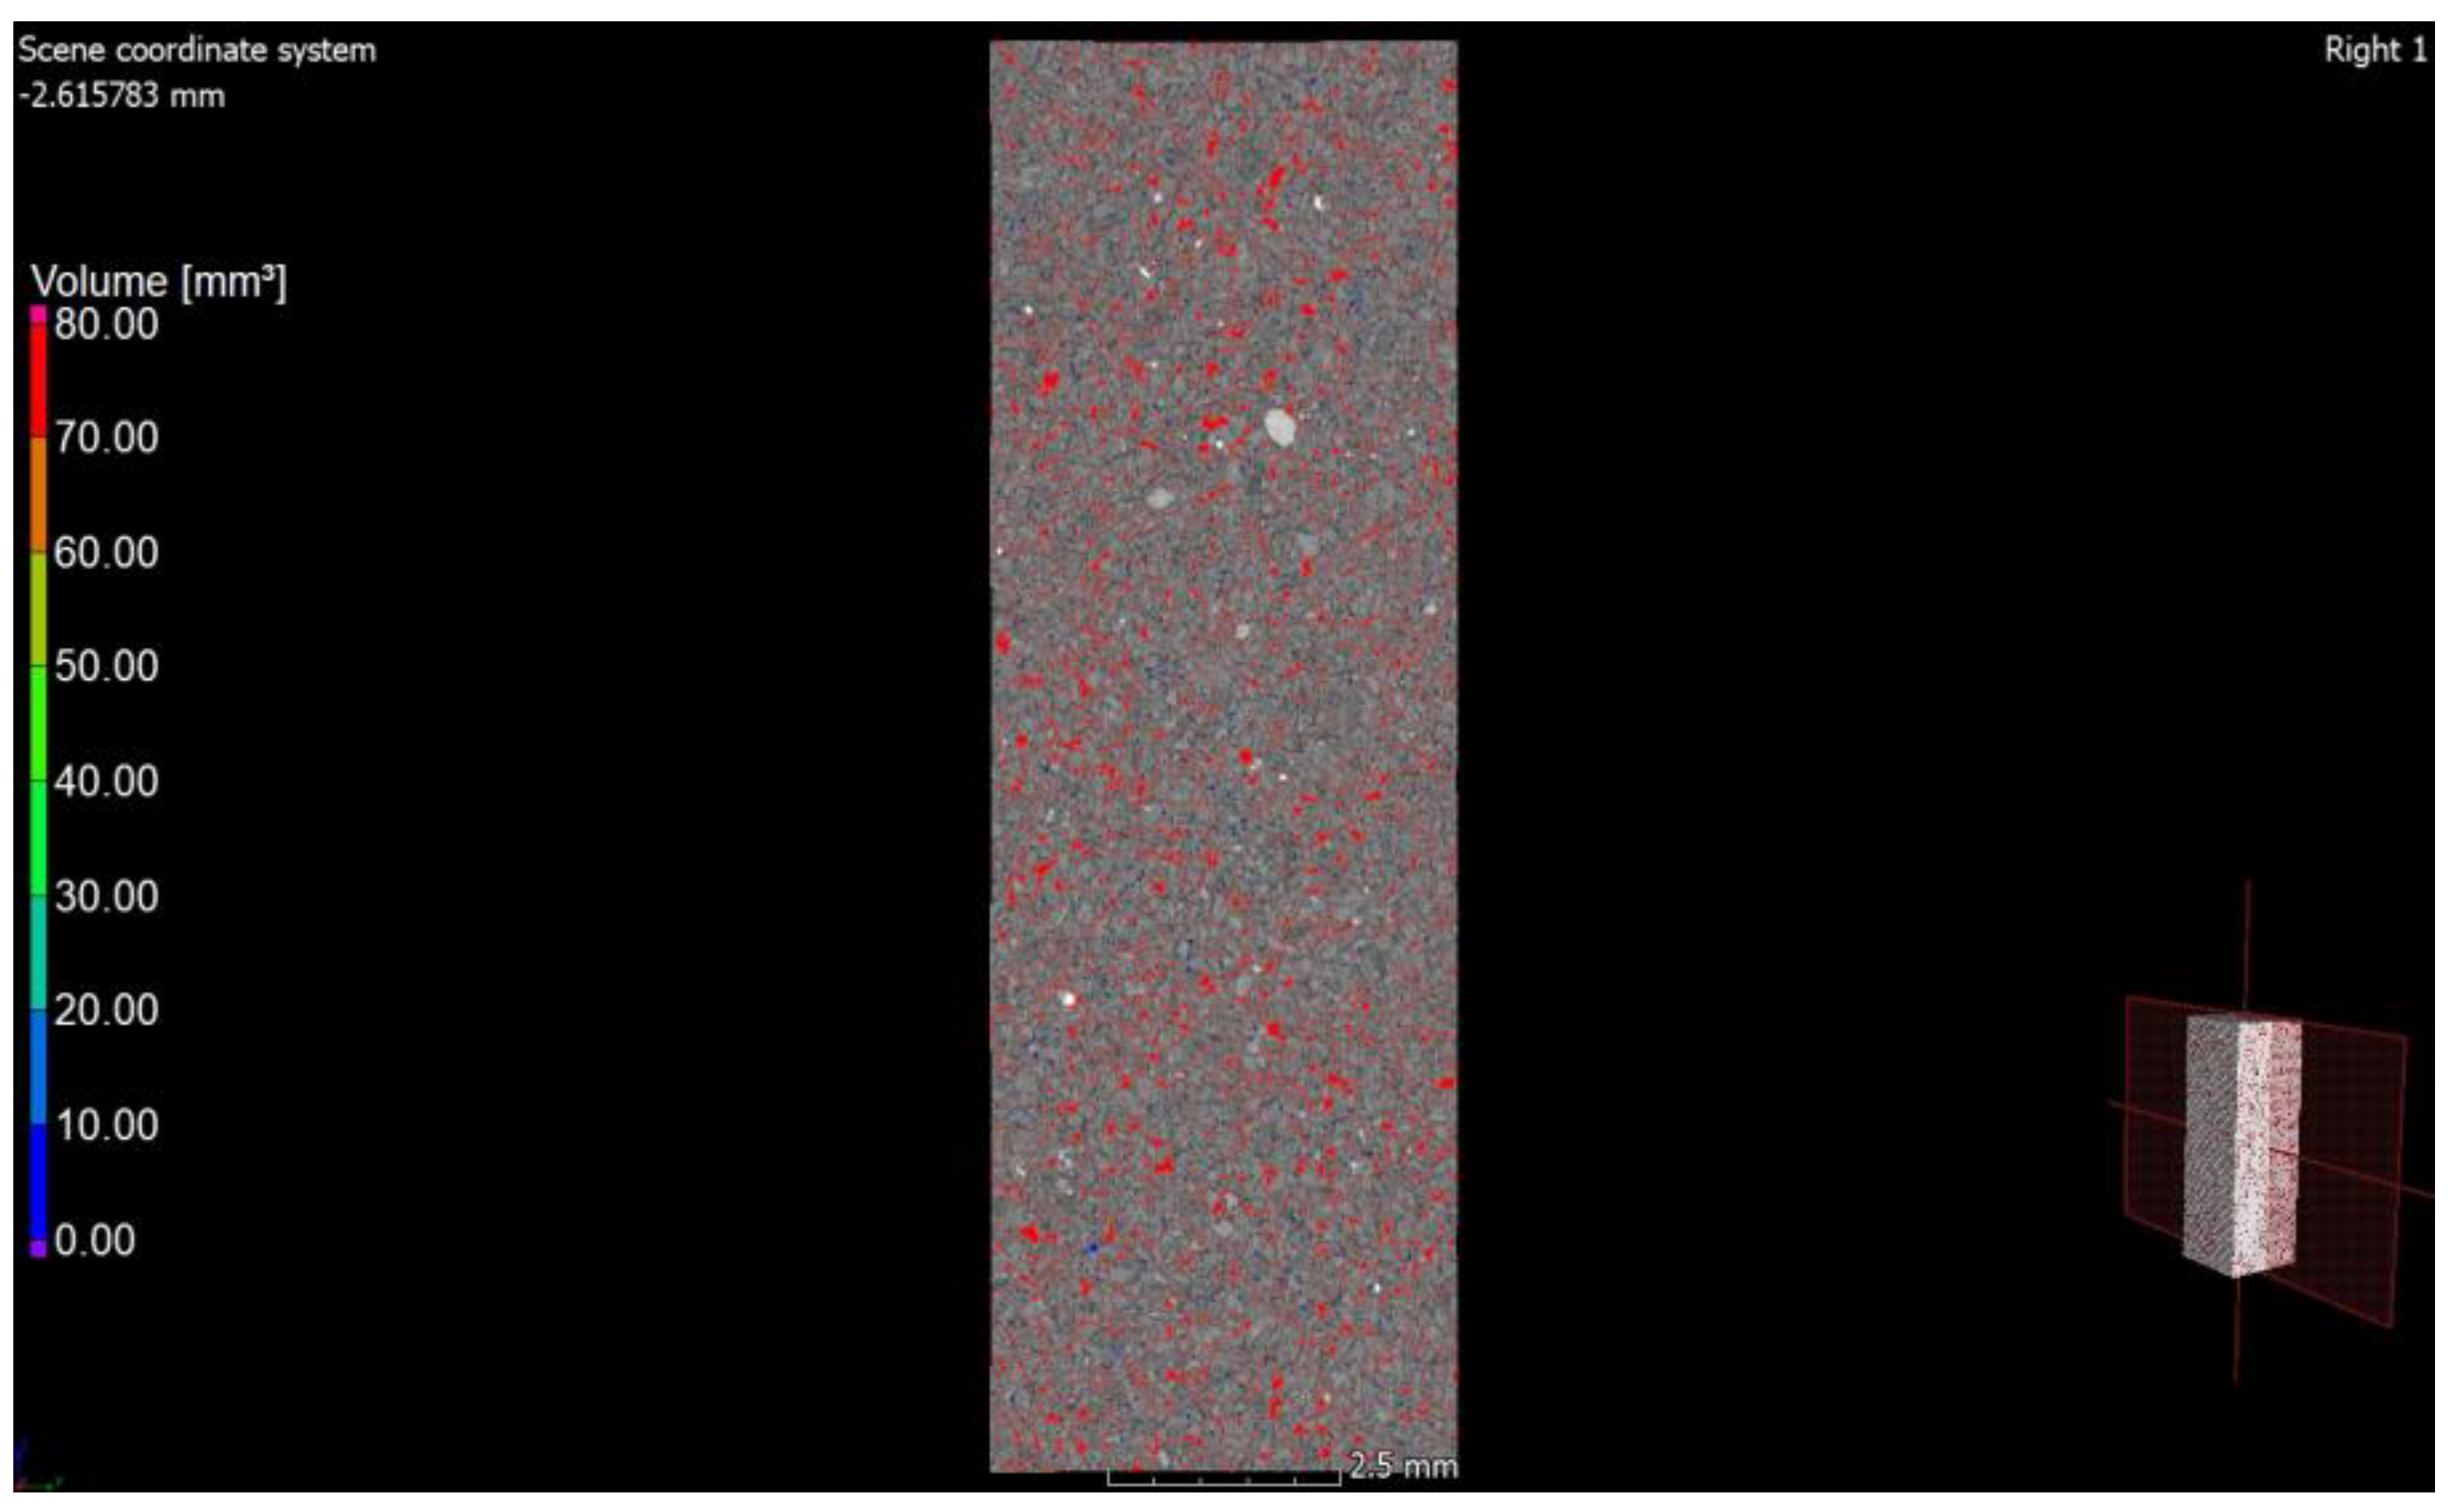
2.1. Computed Tomography
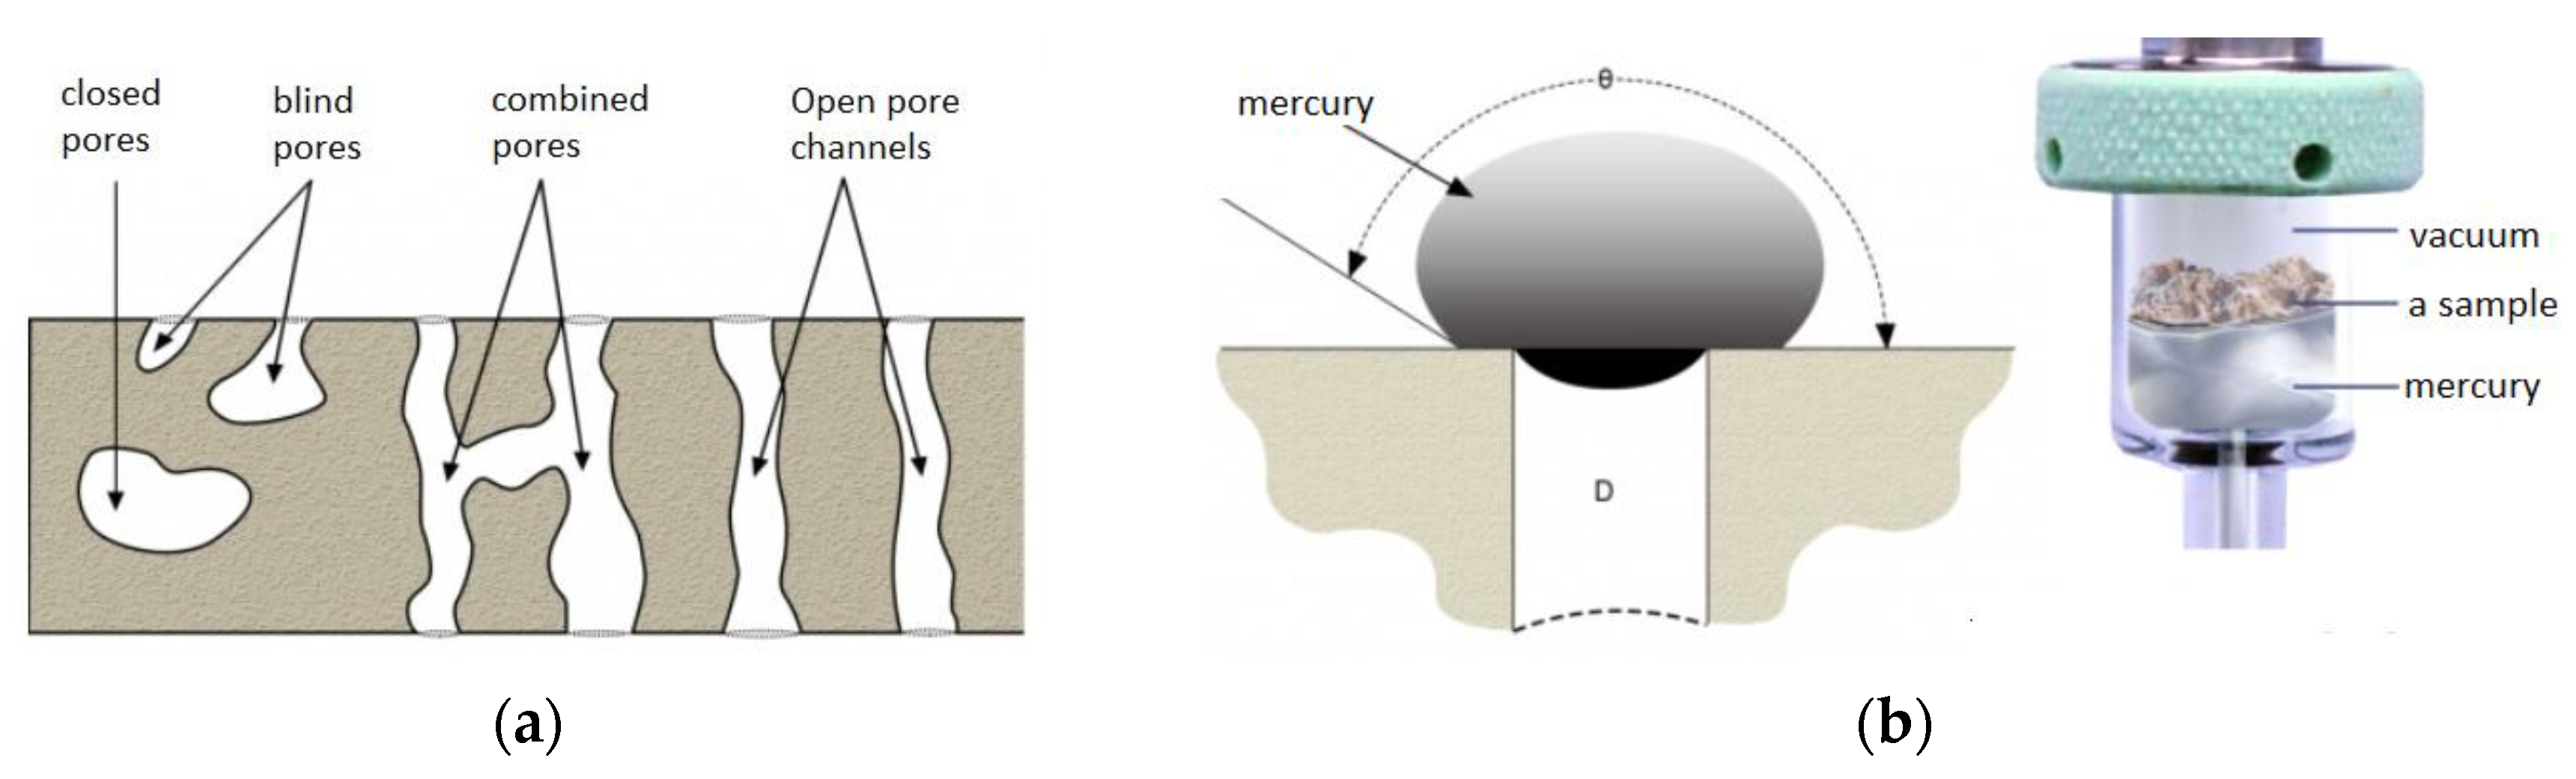
2.2. Mercury Porosimetry
3. Results
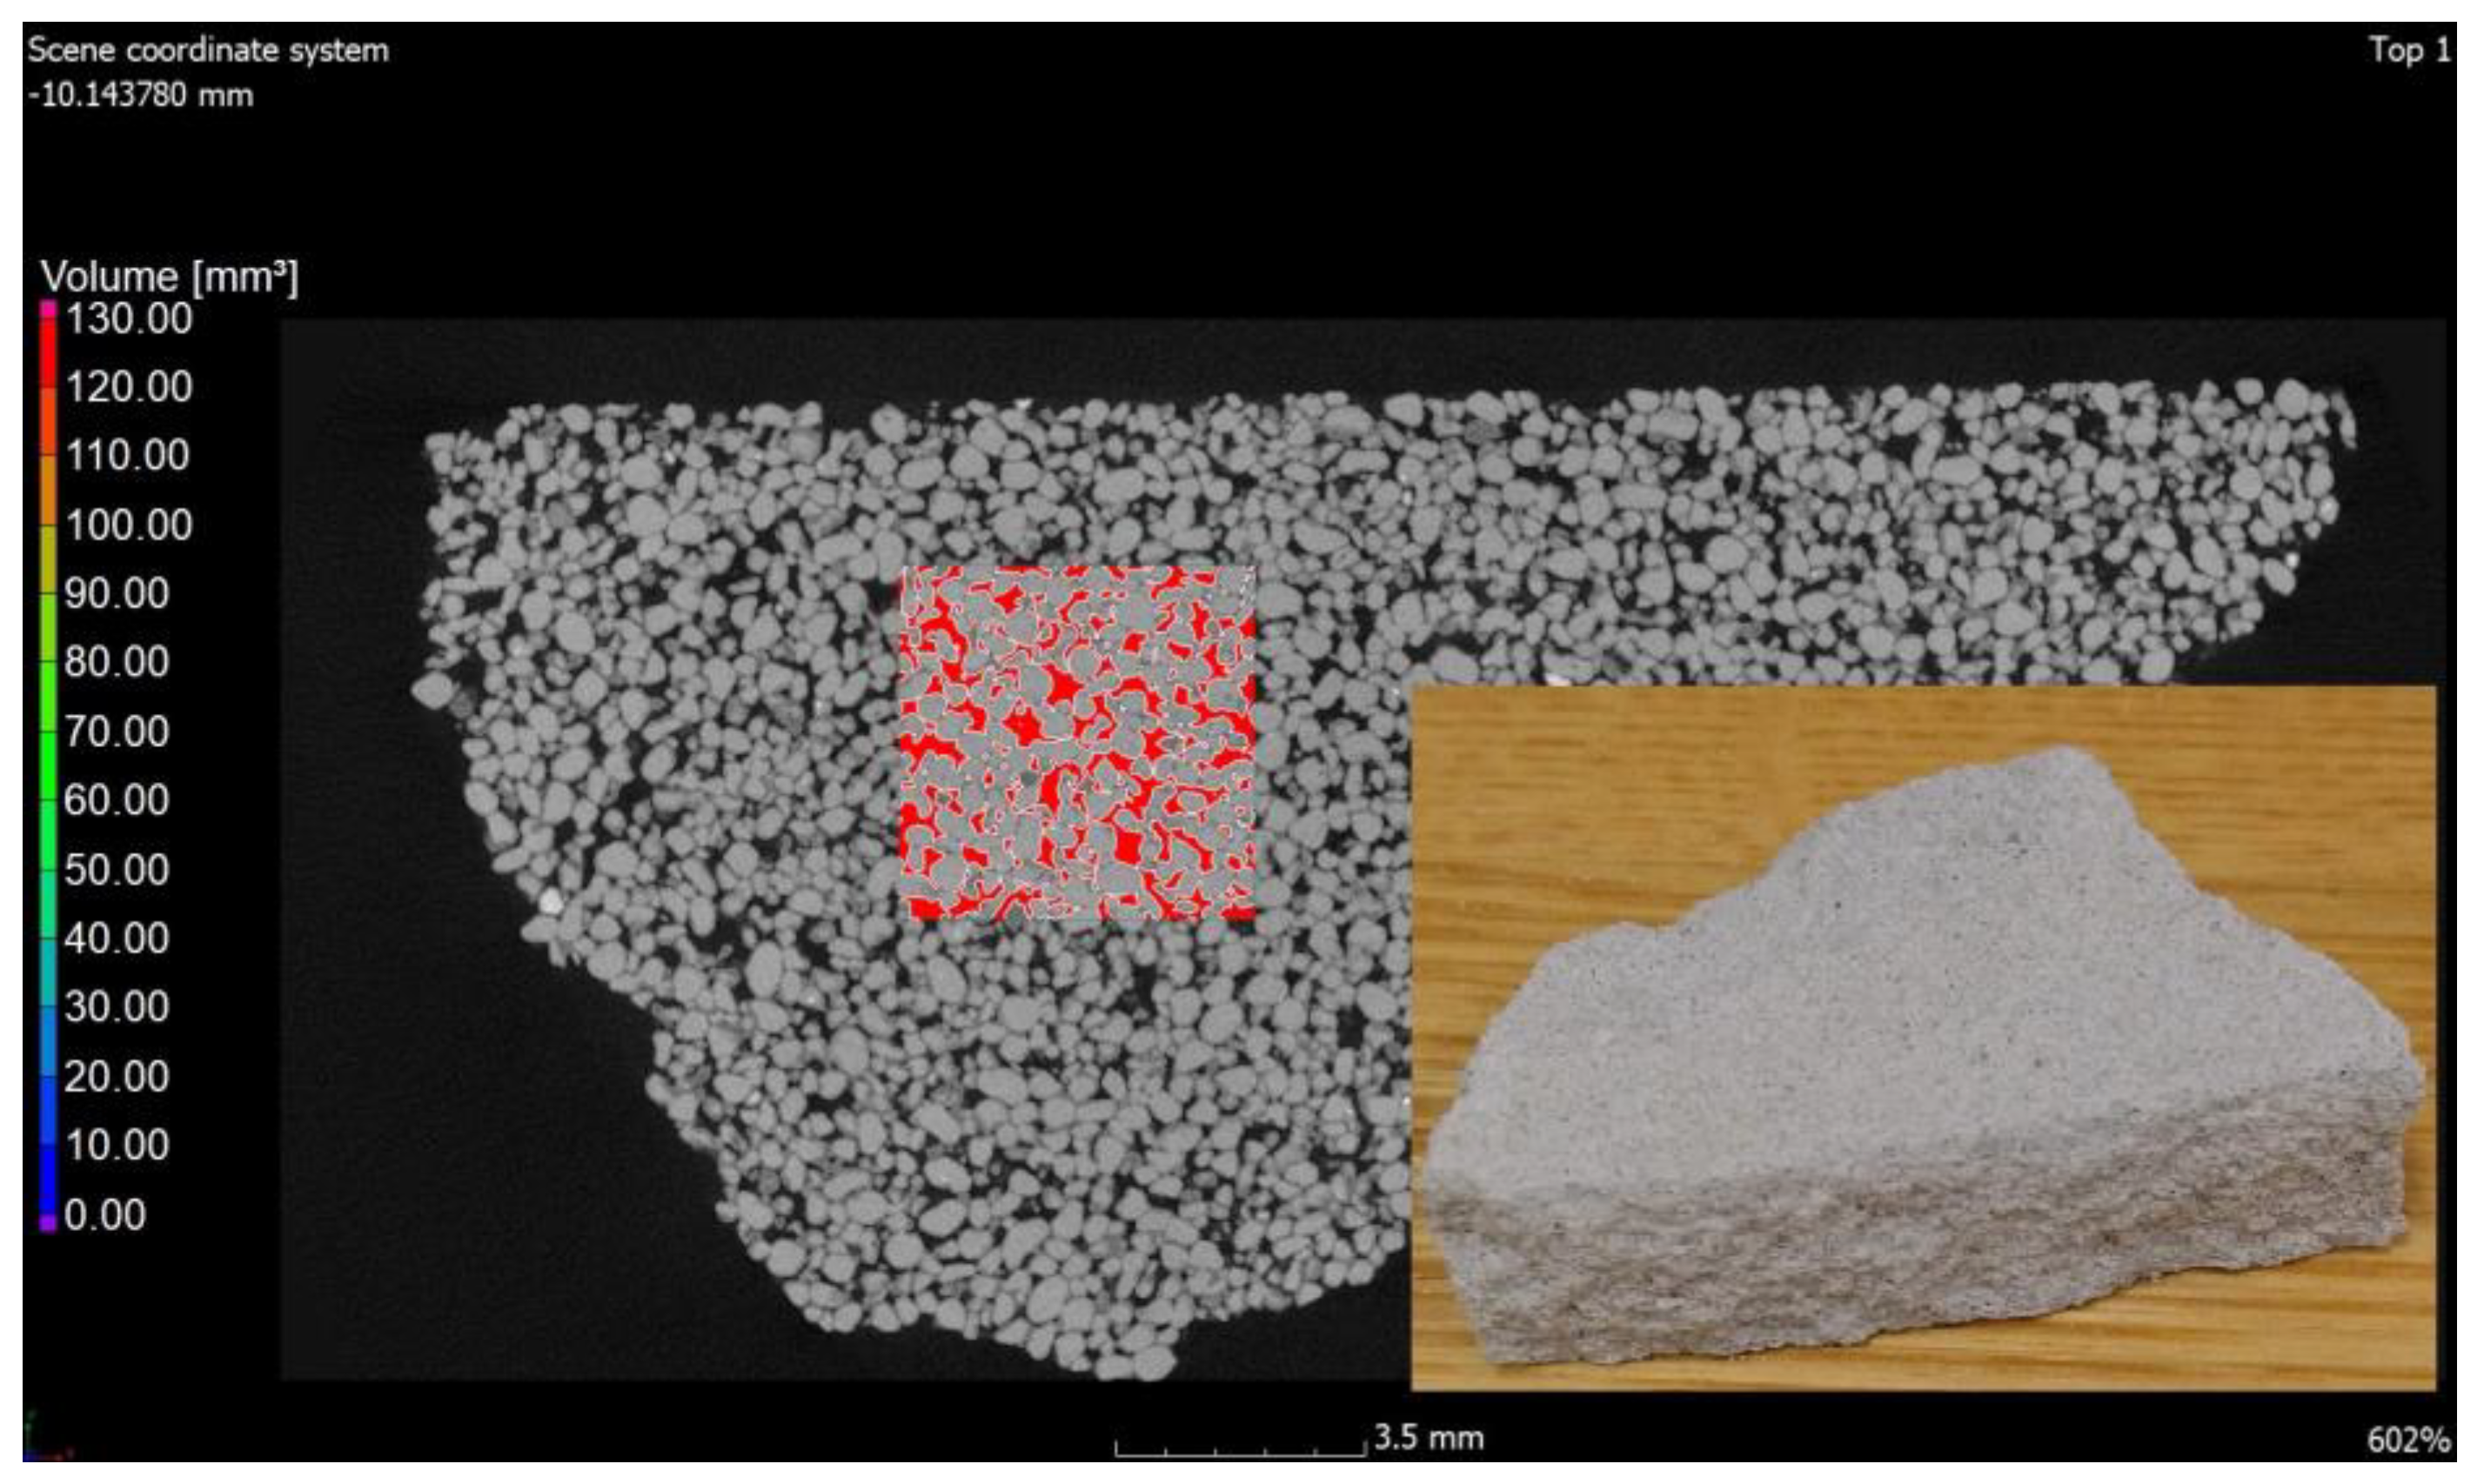
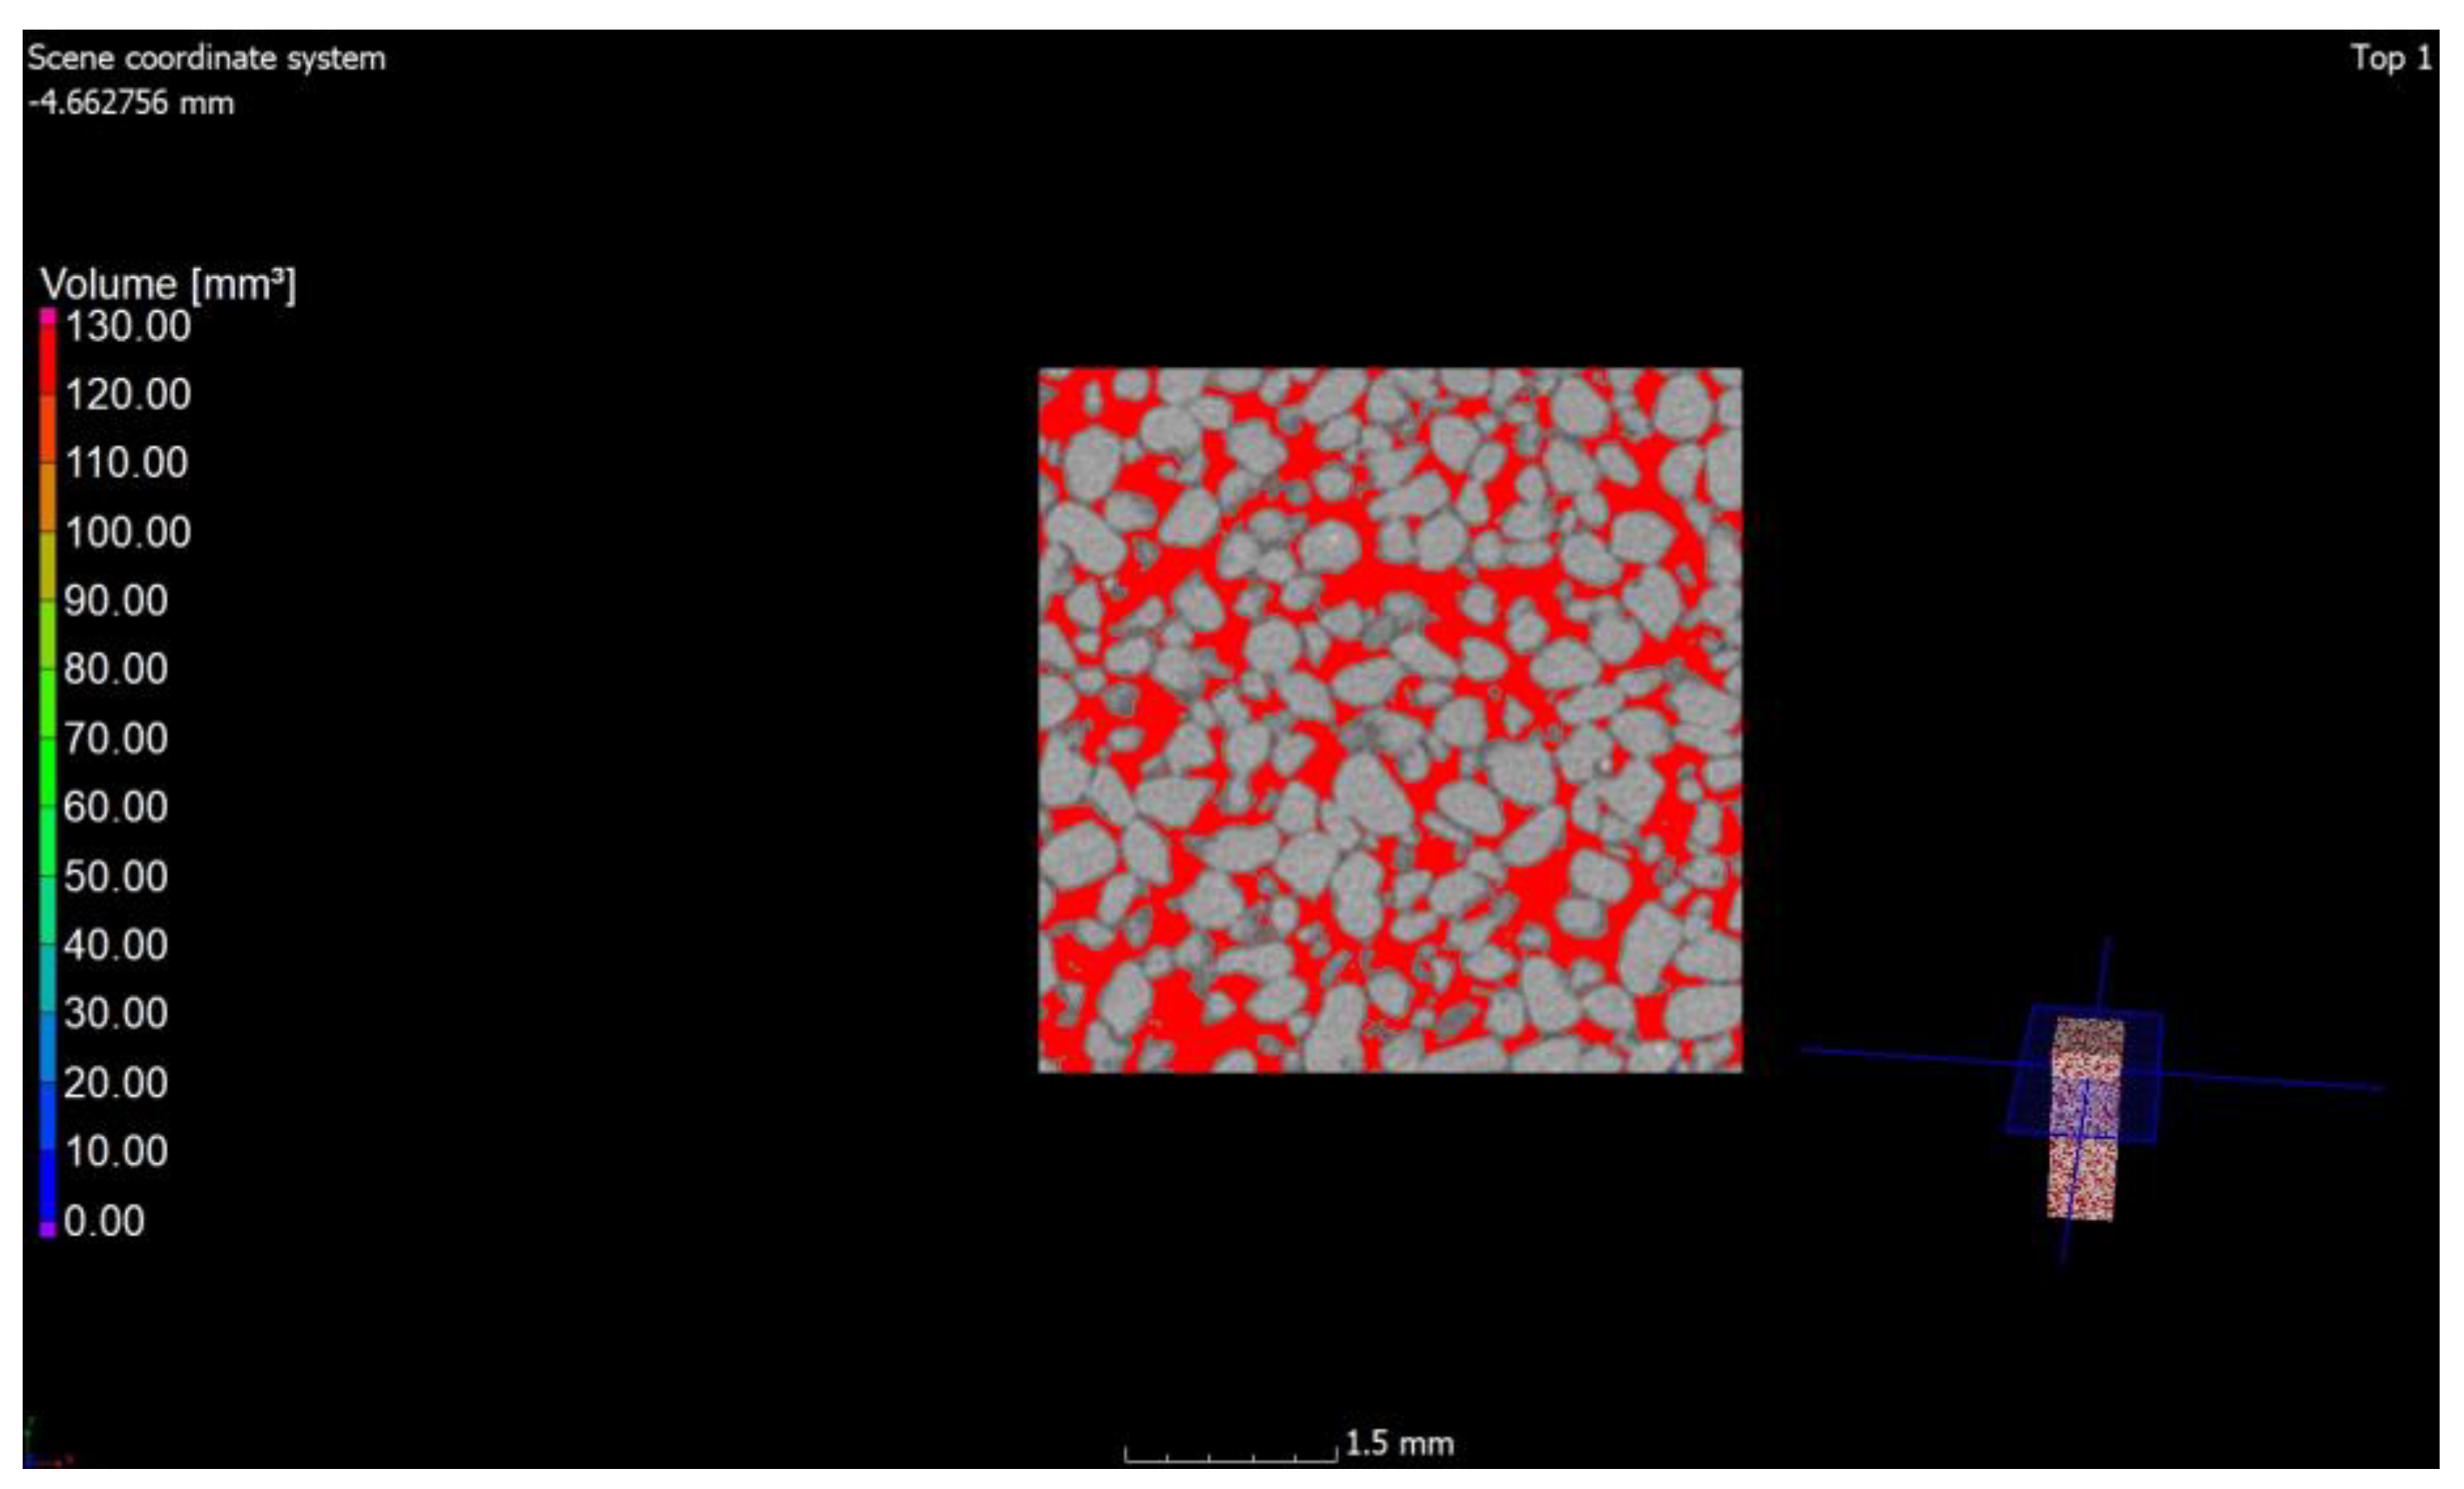
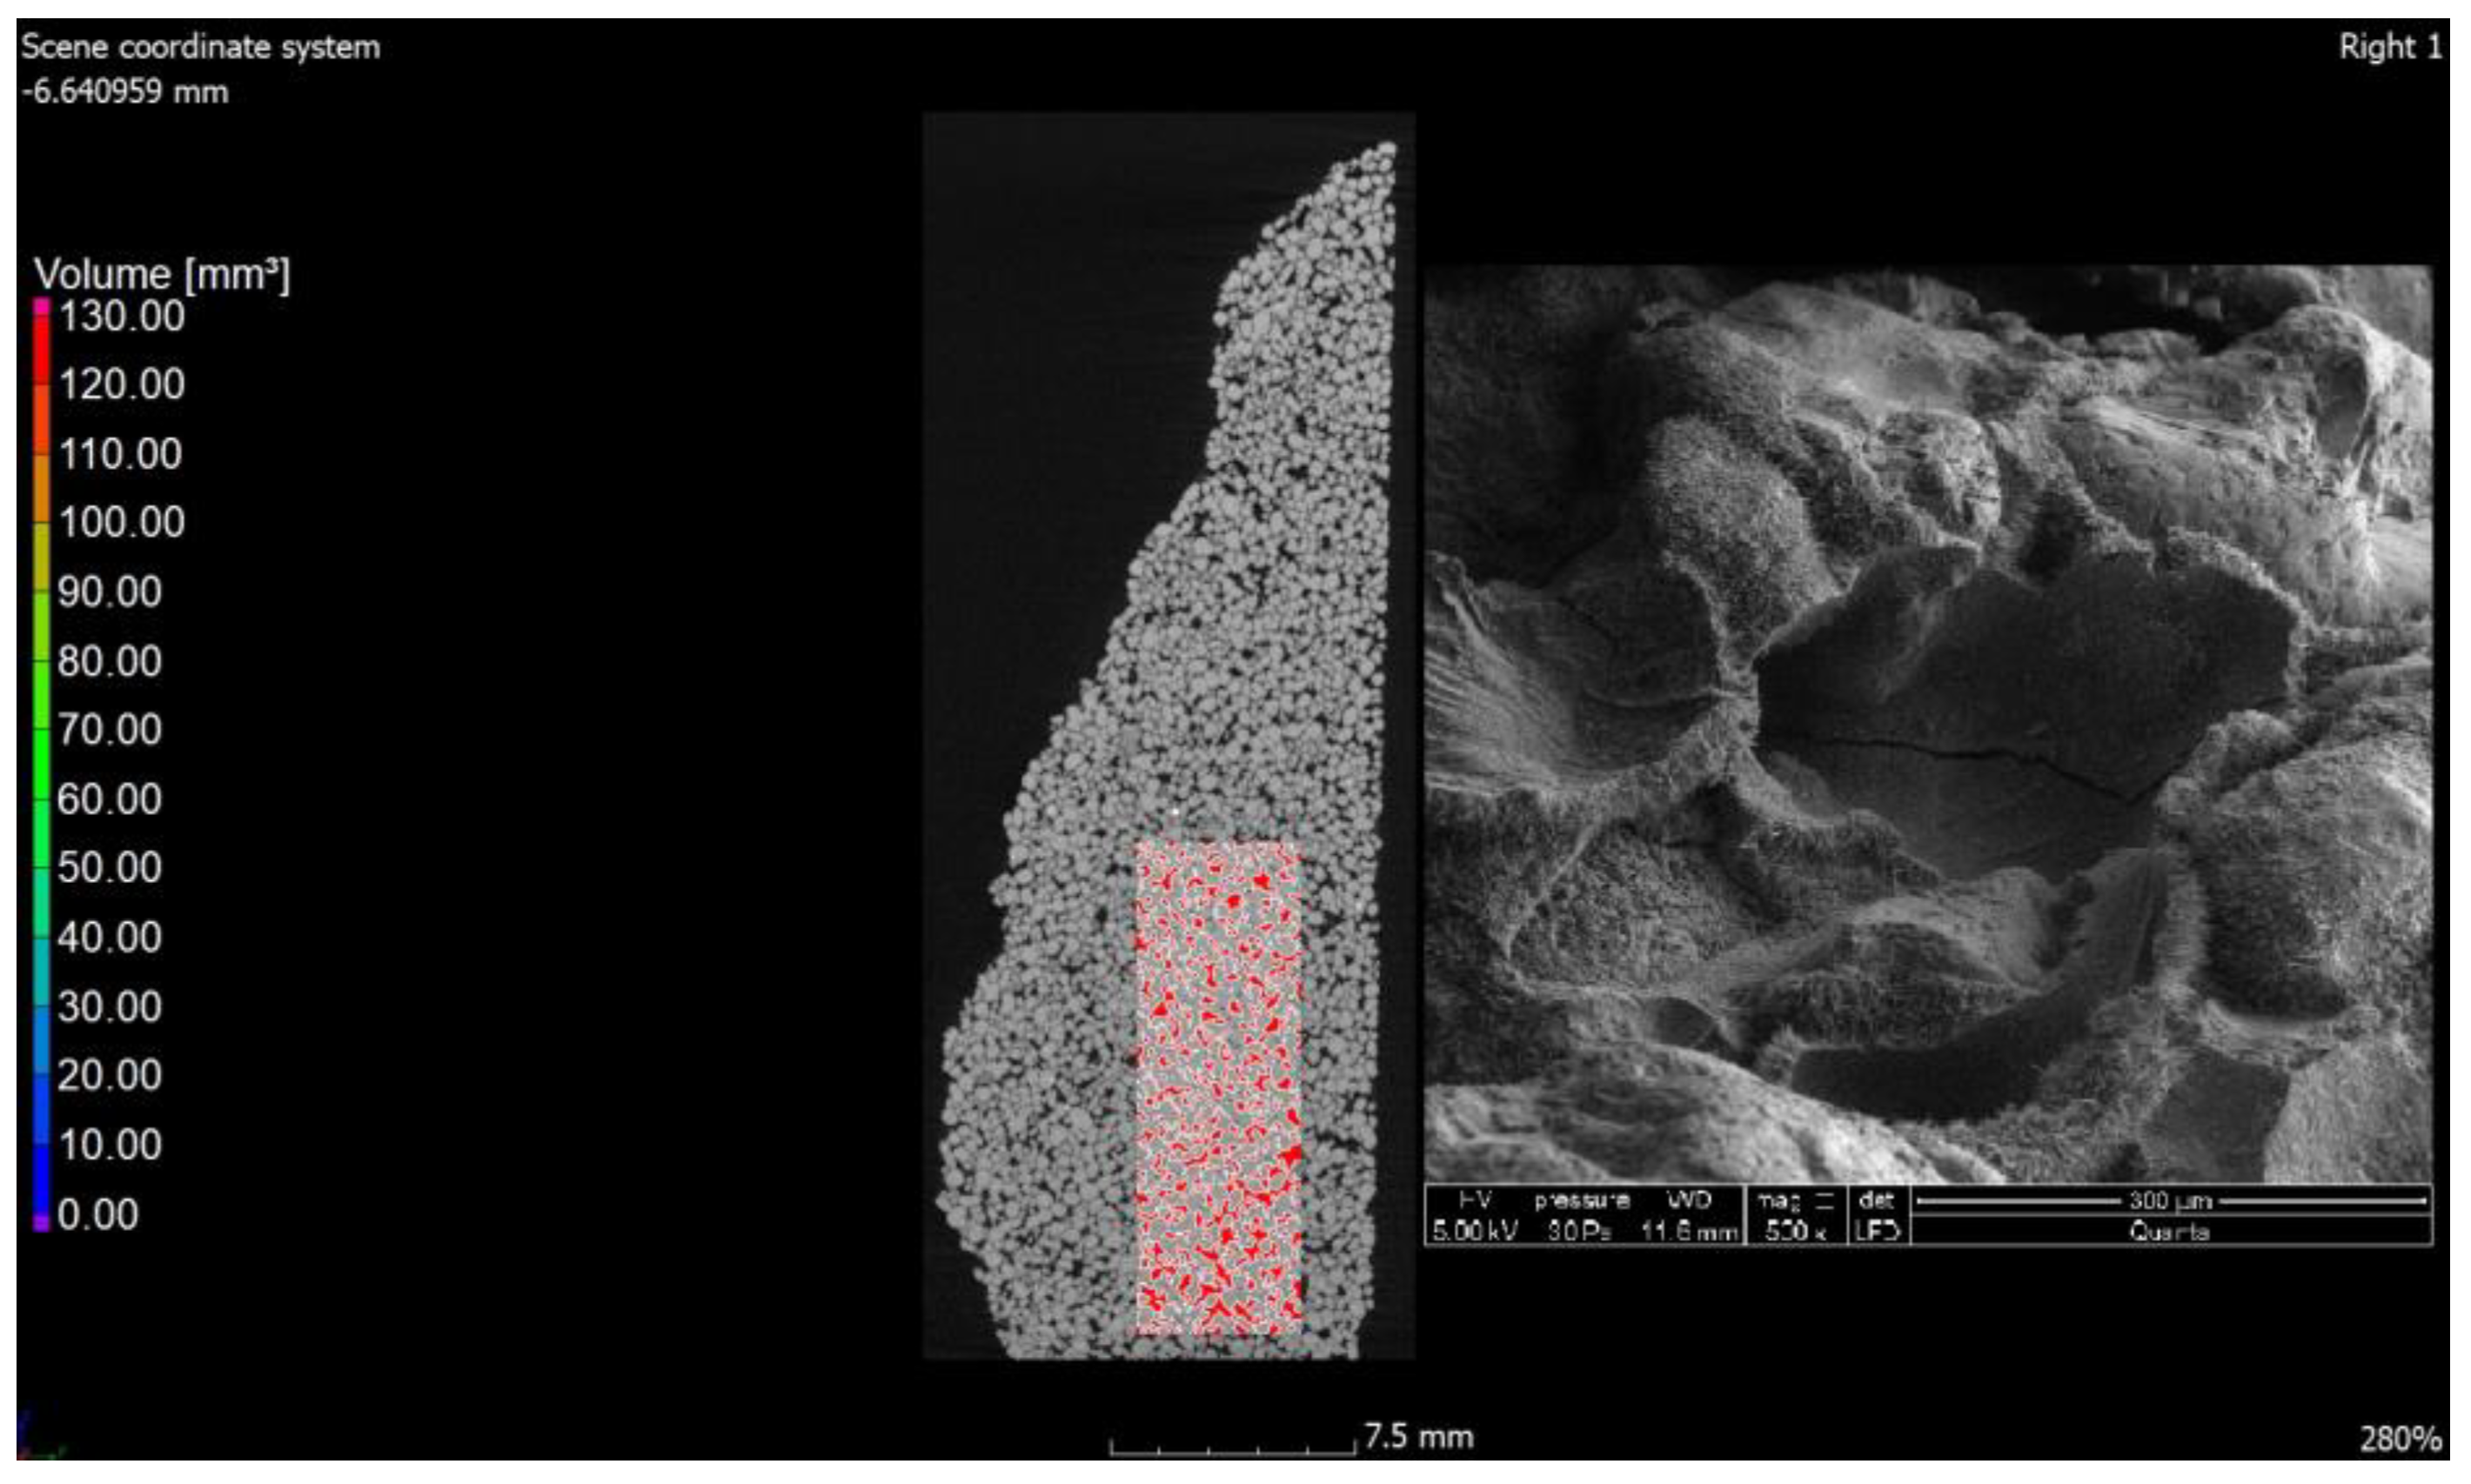
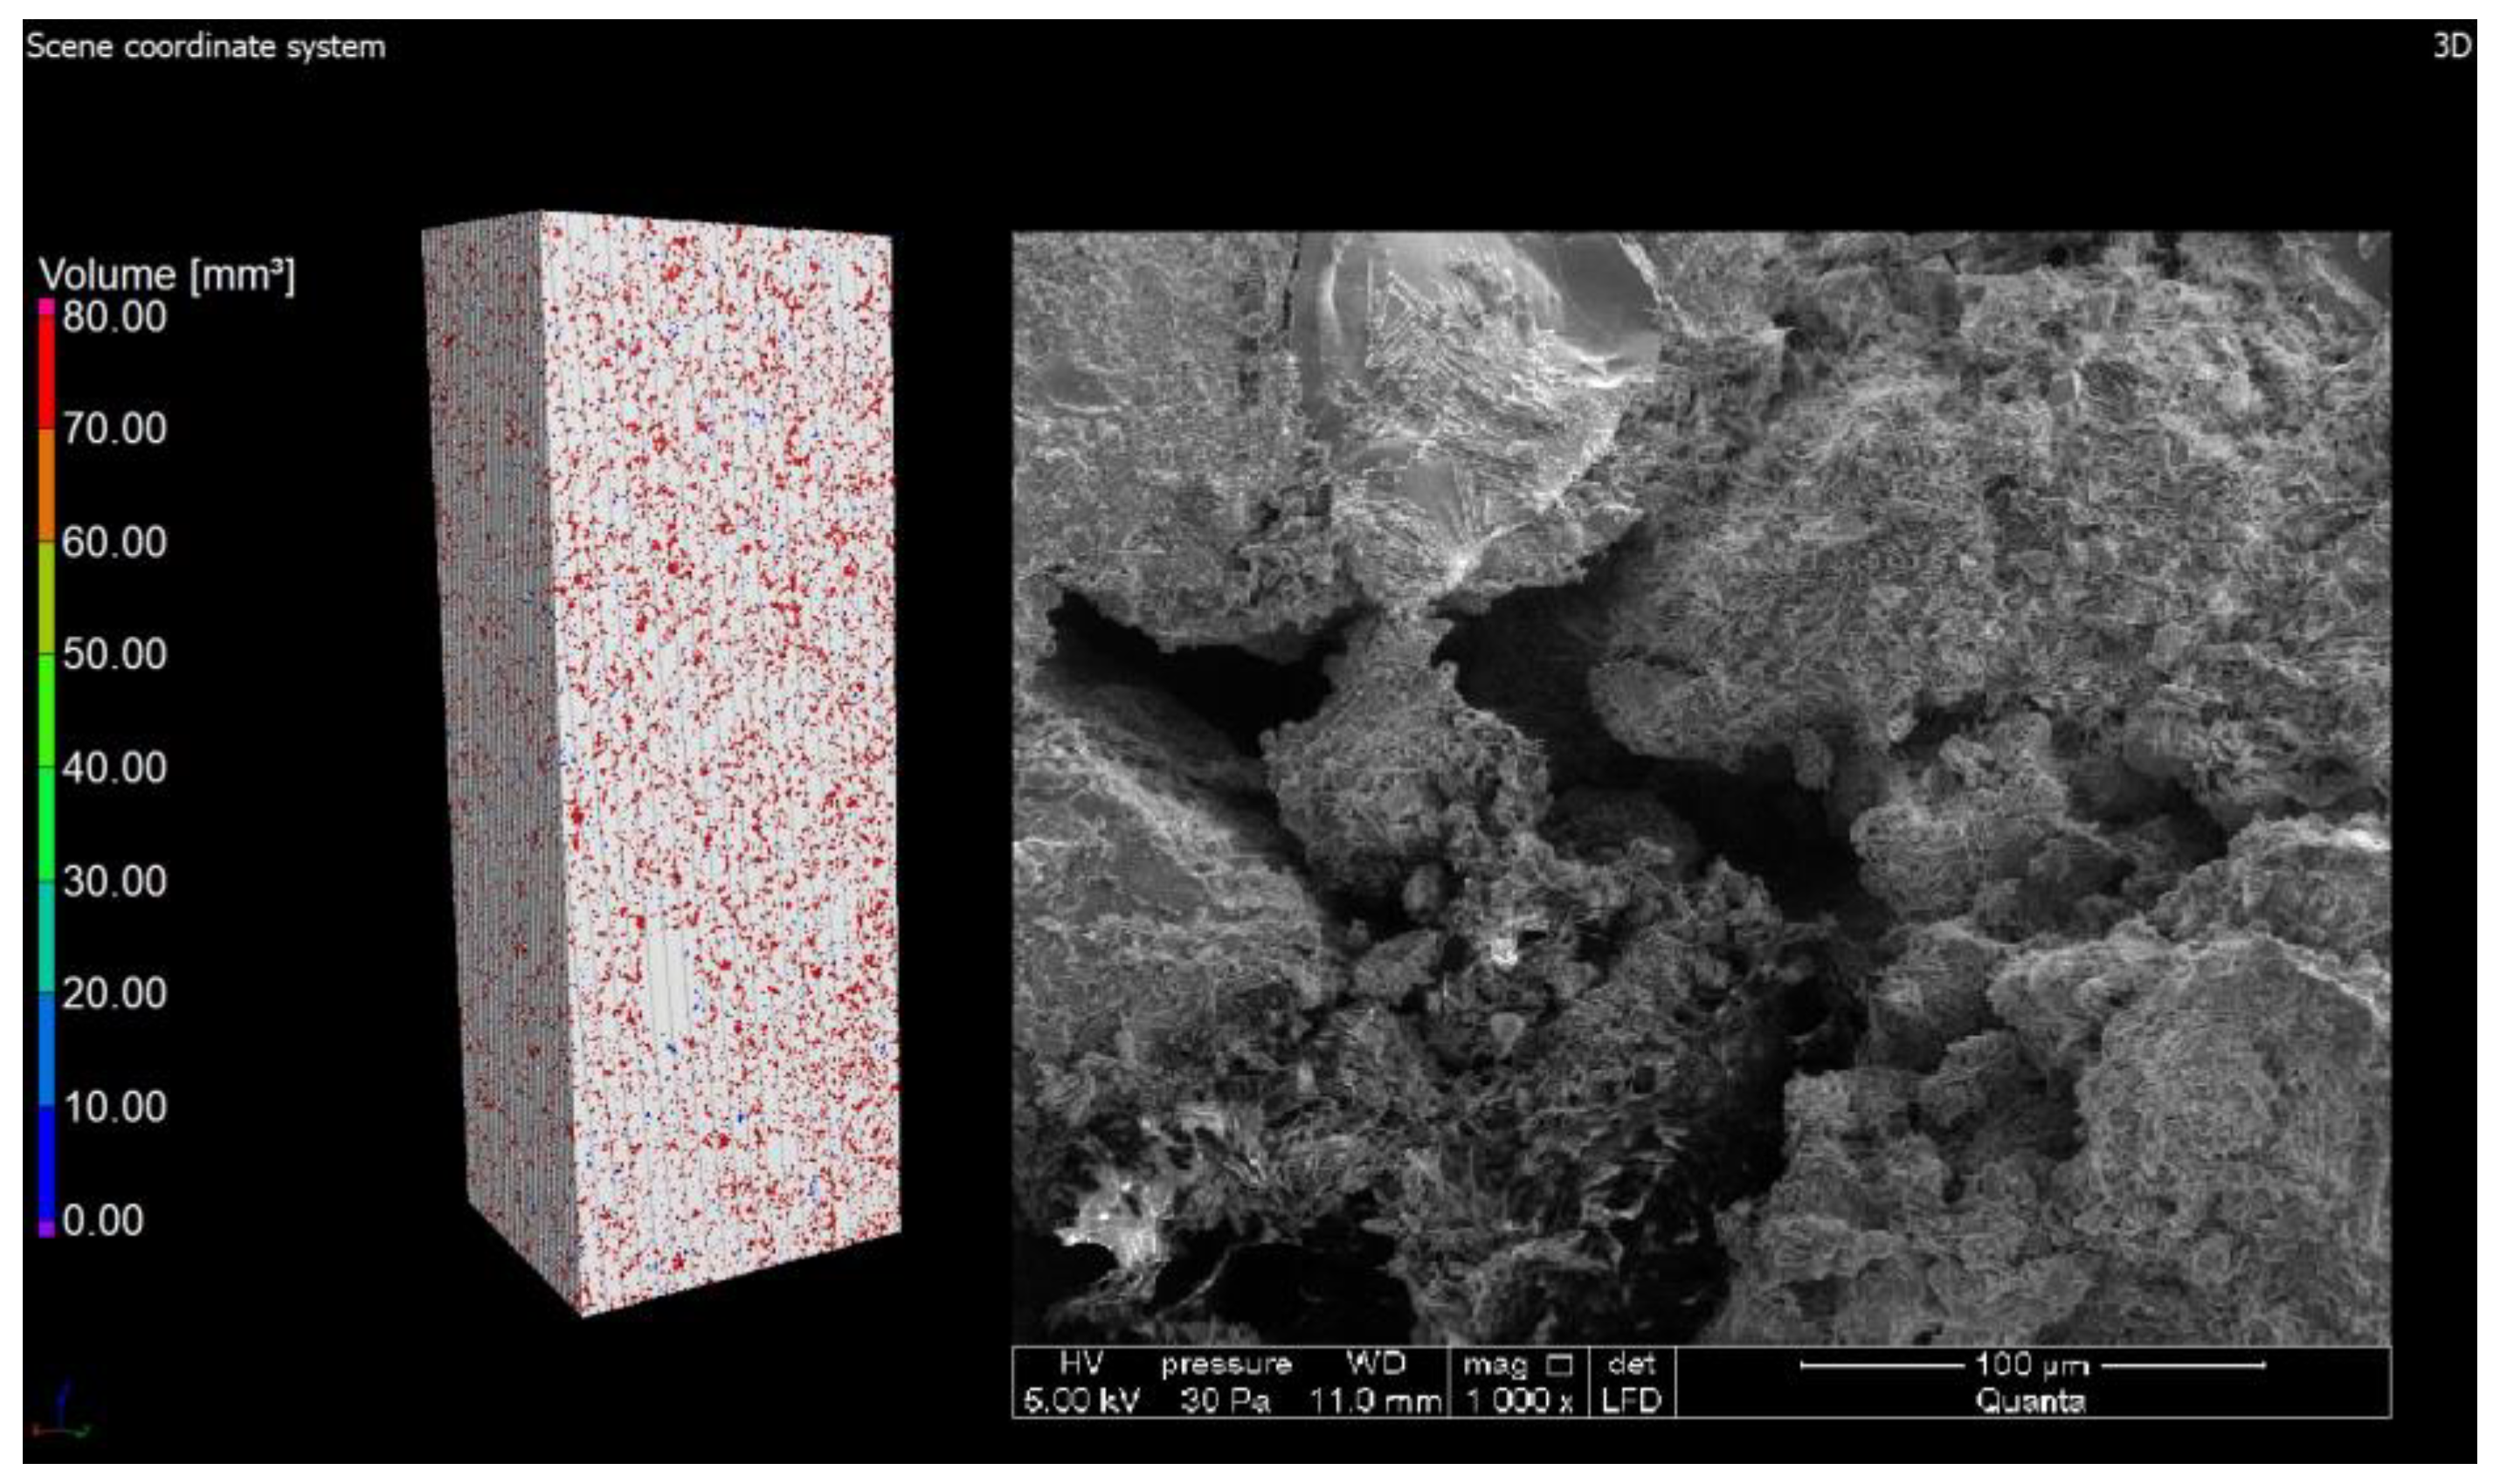
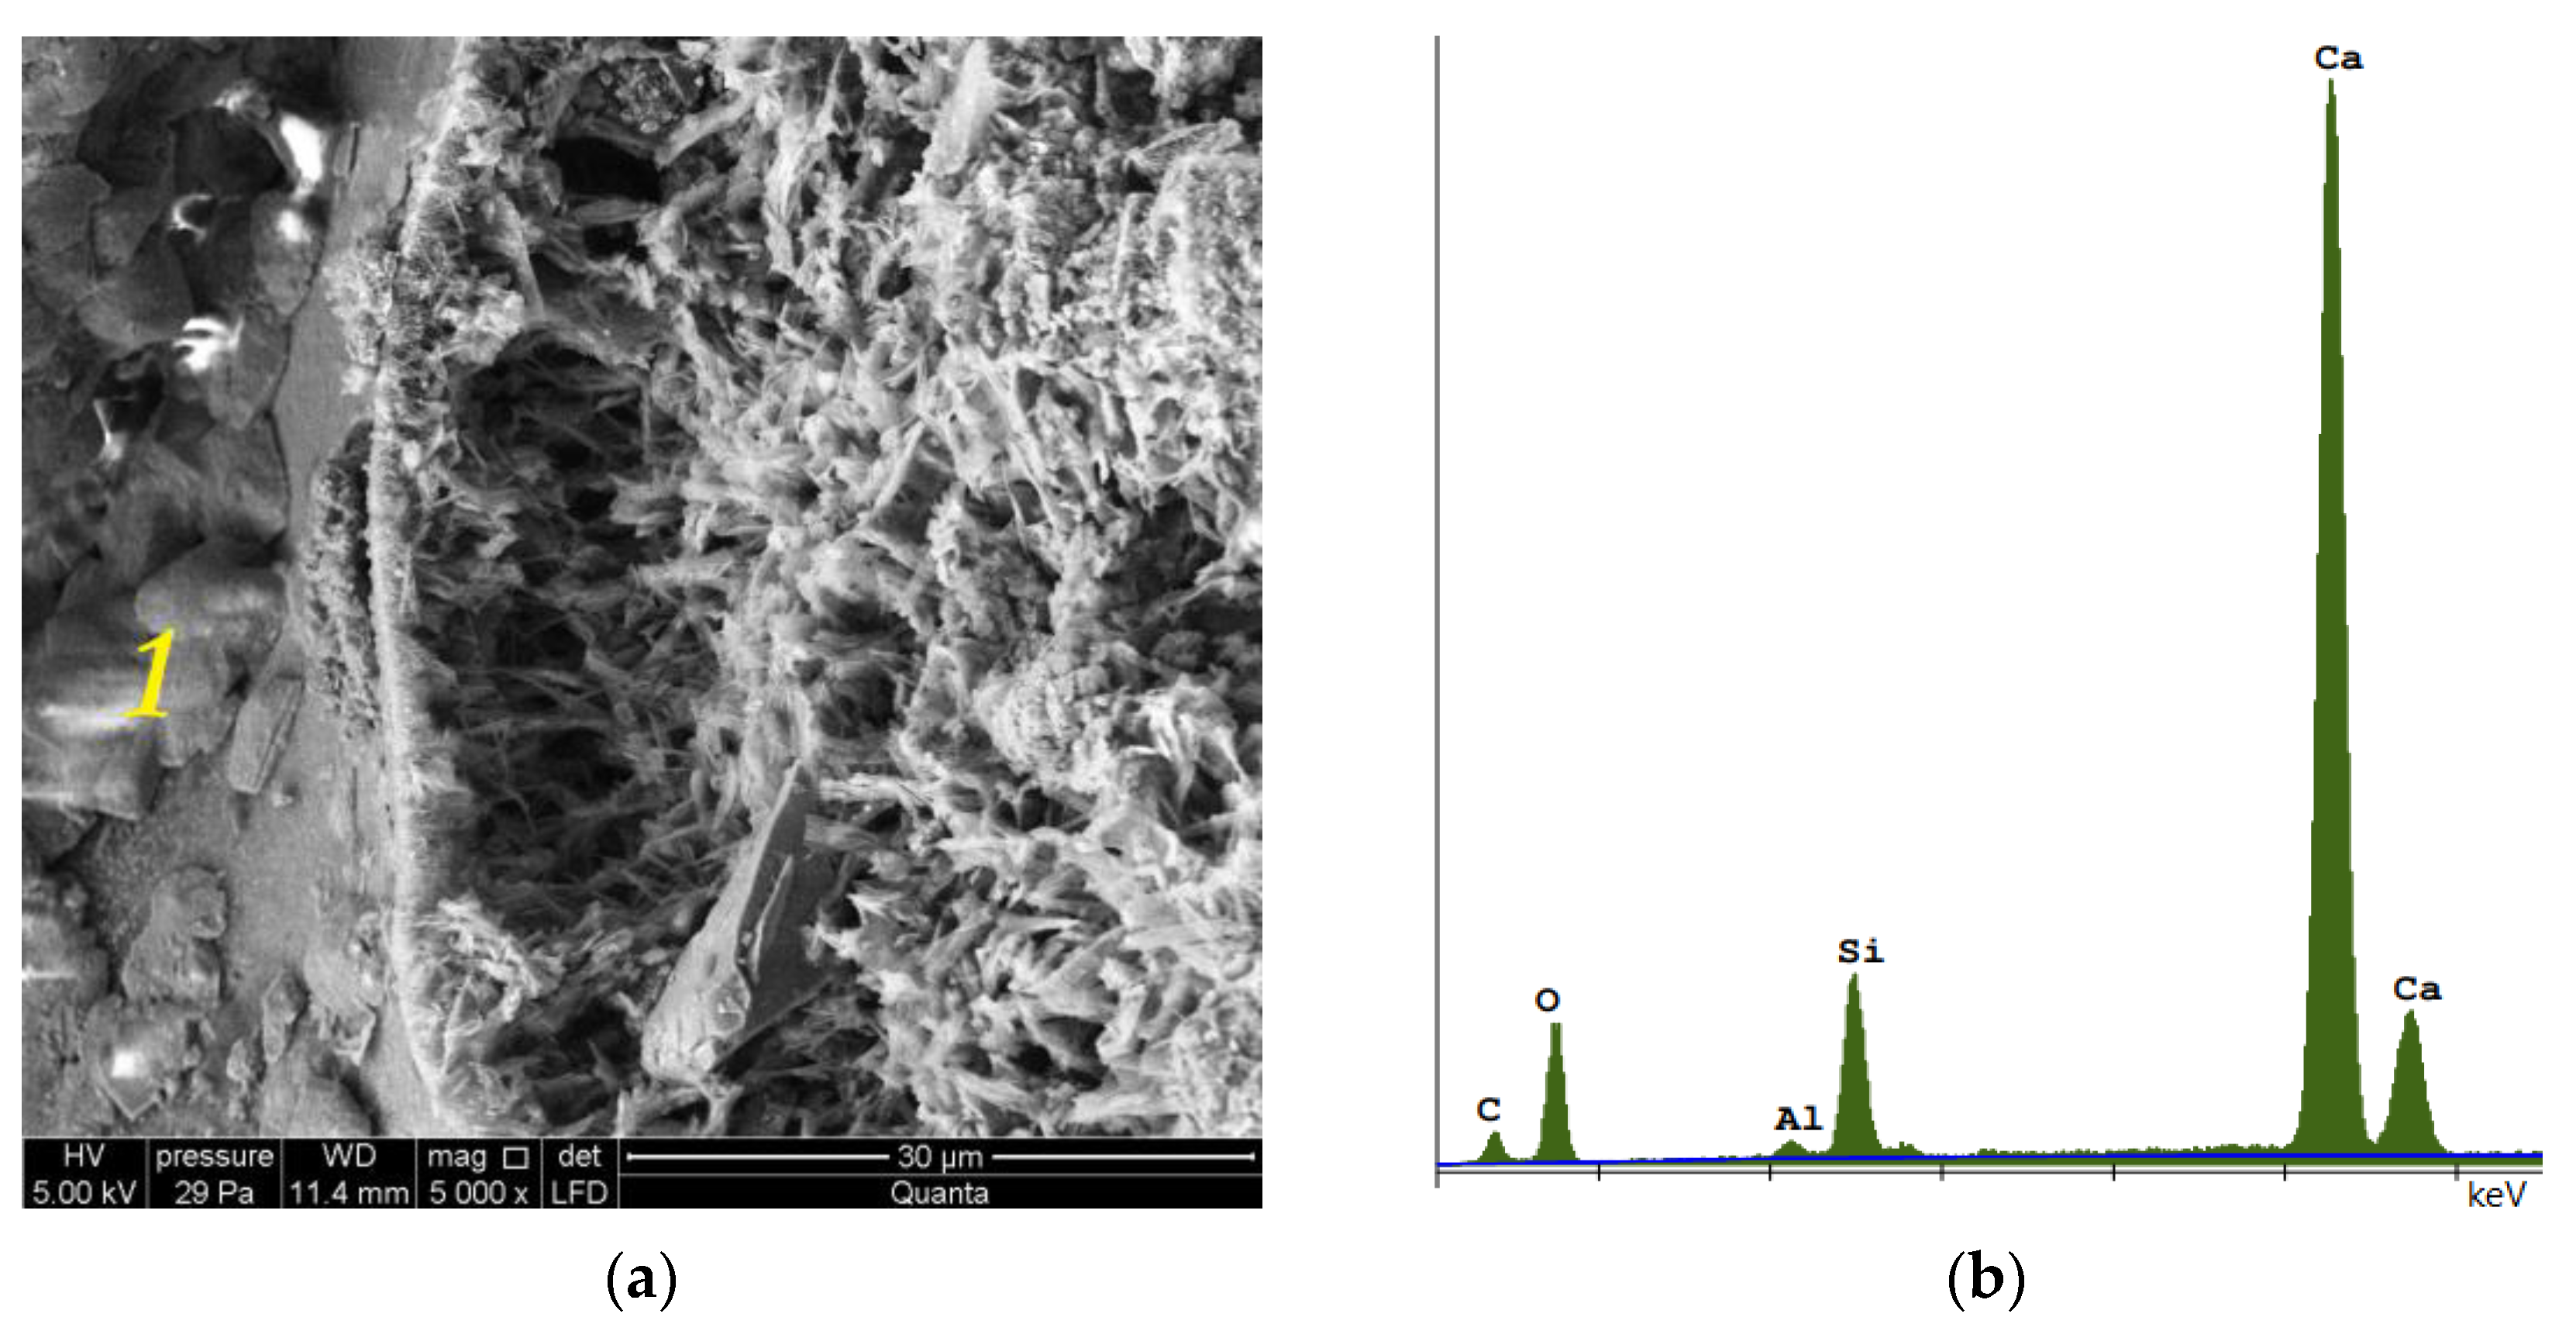
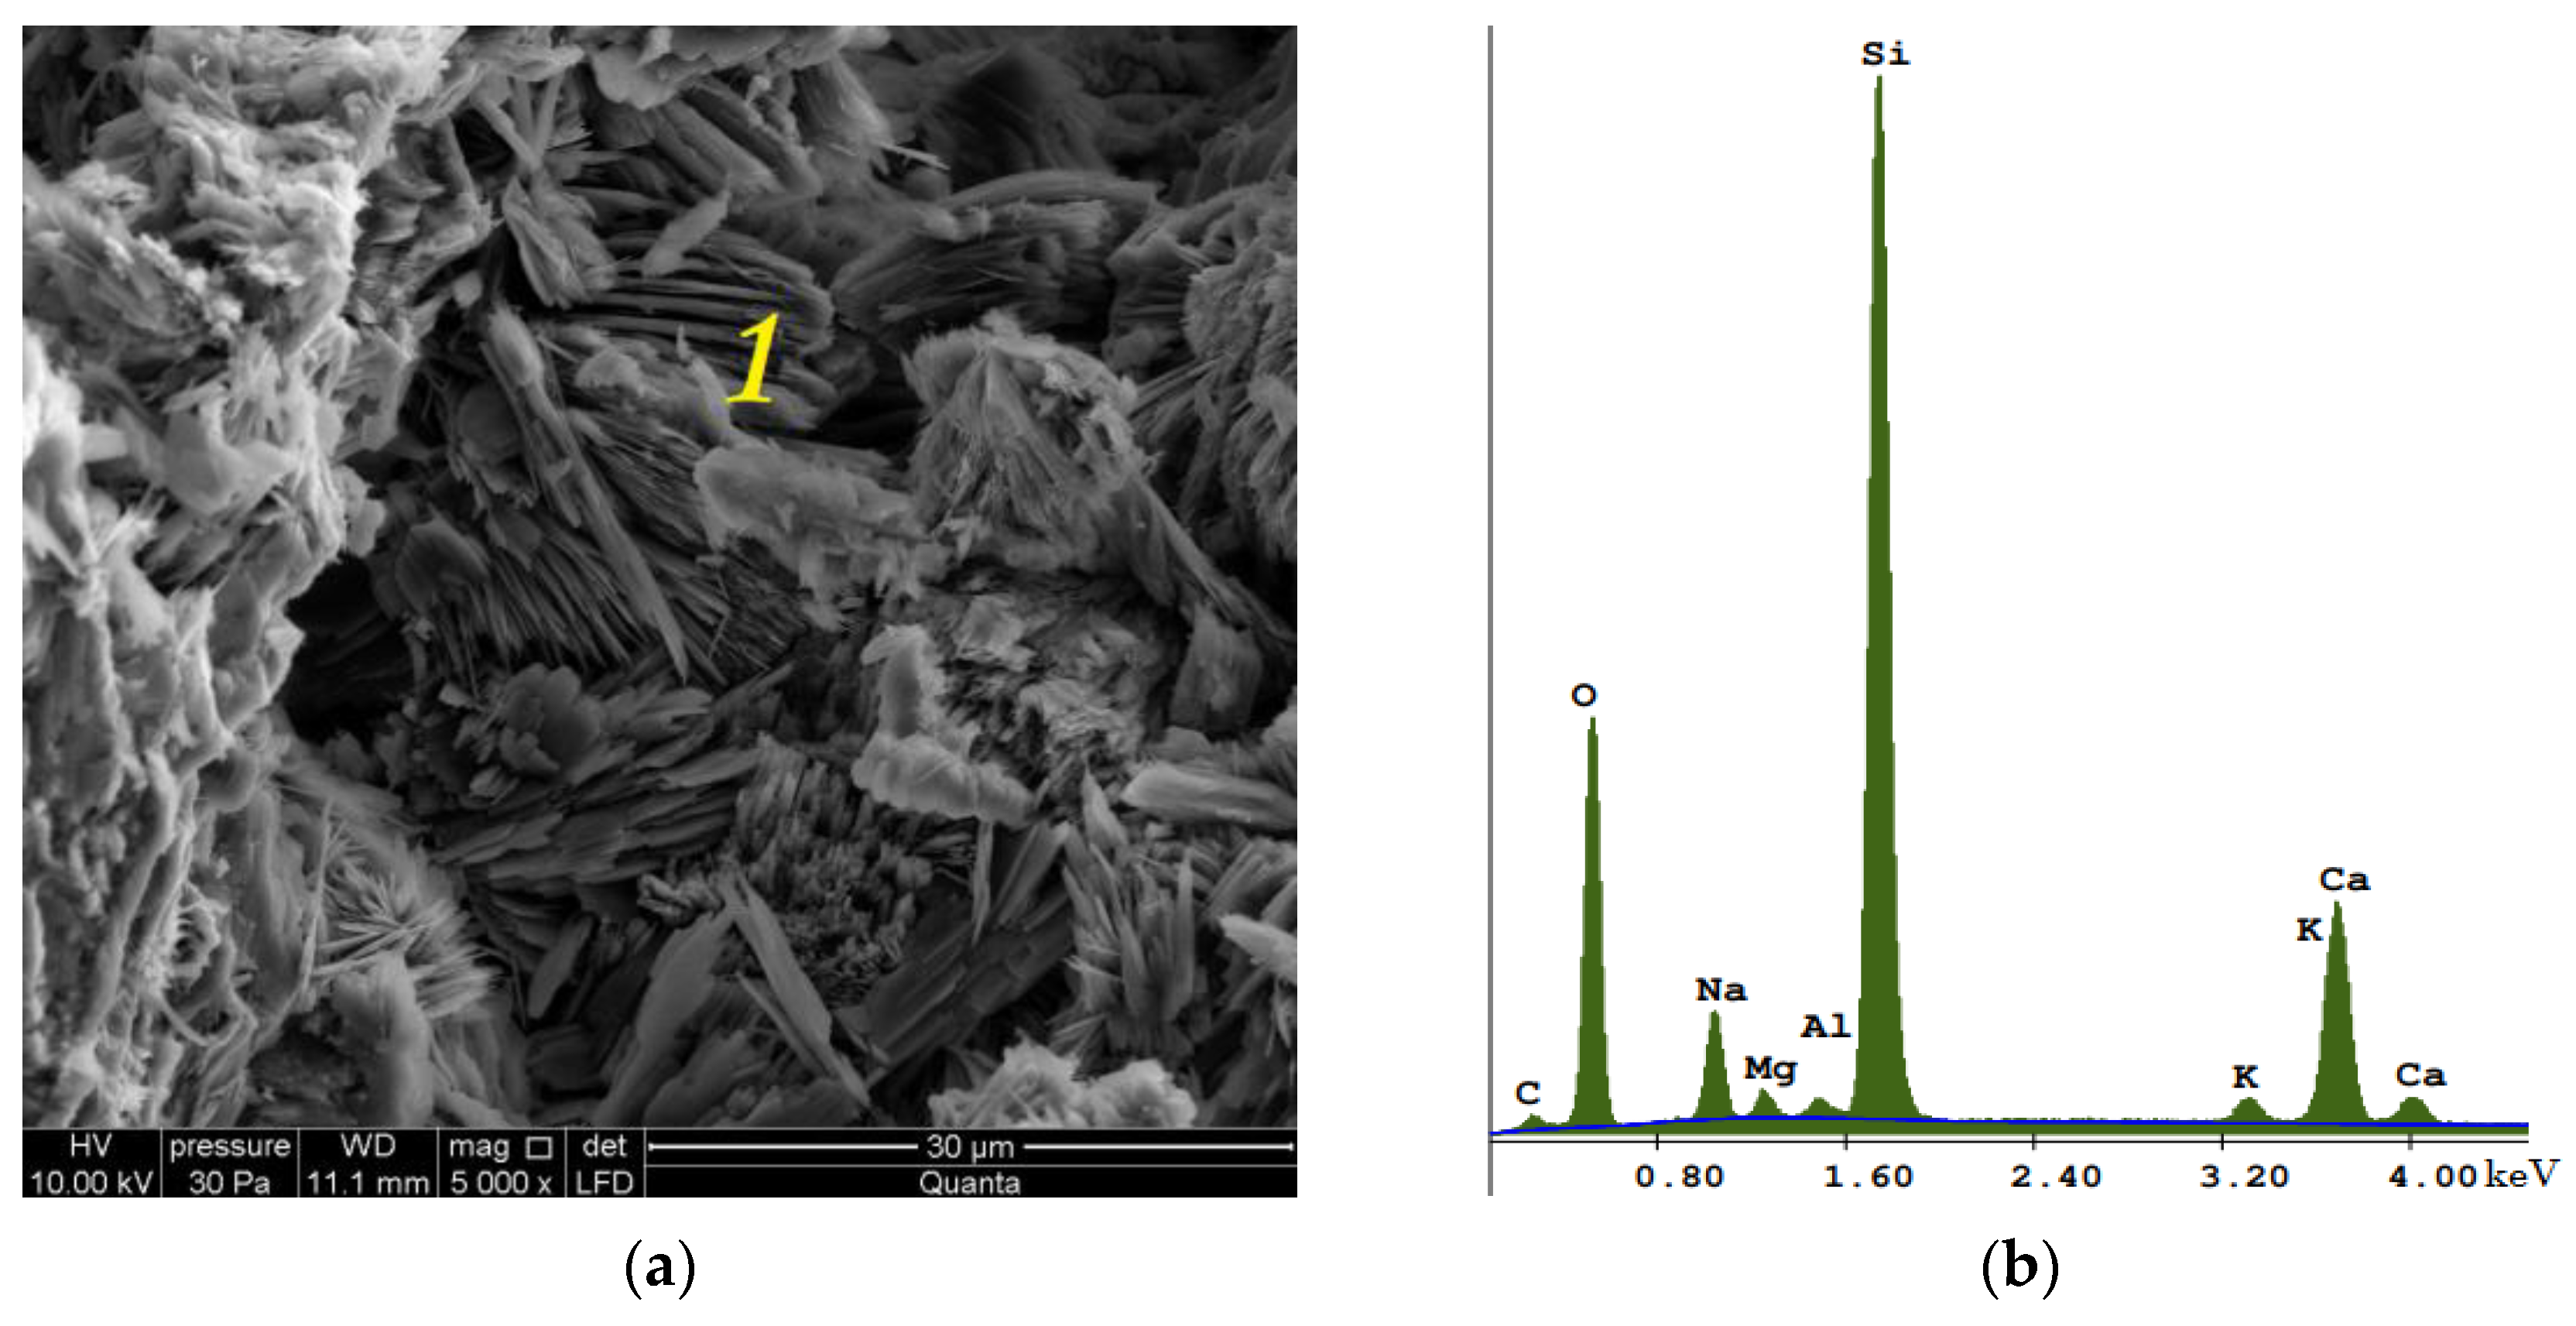
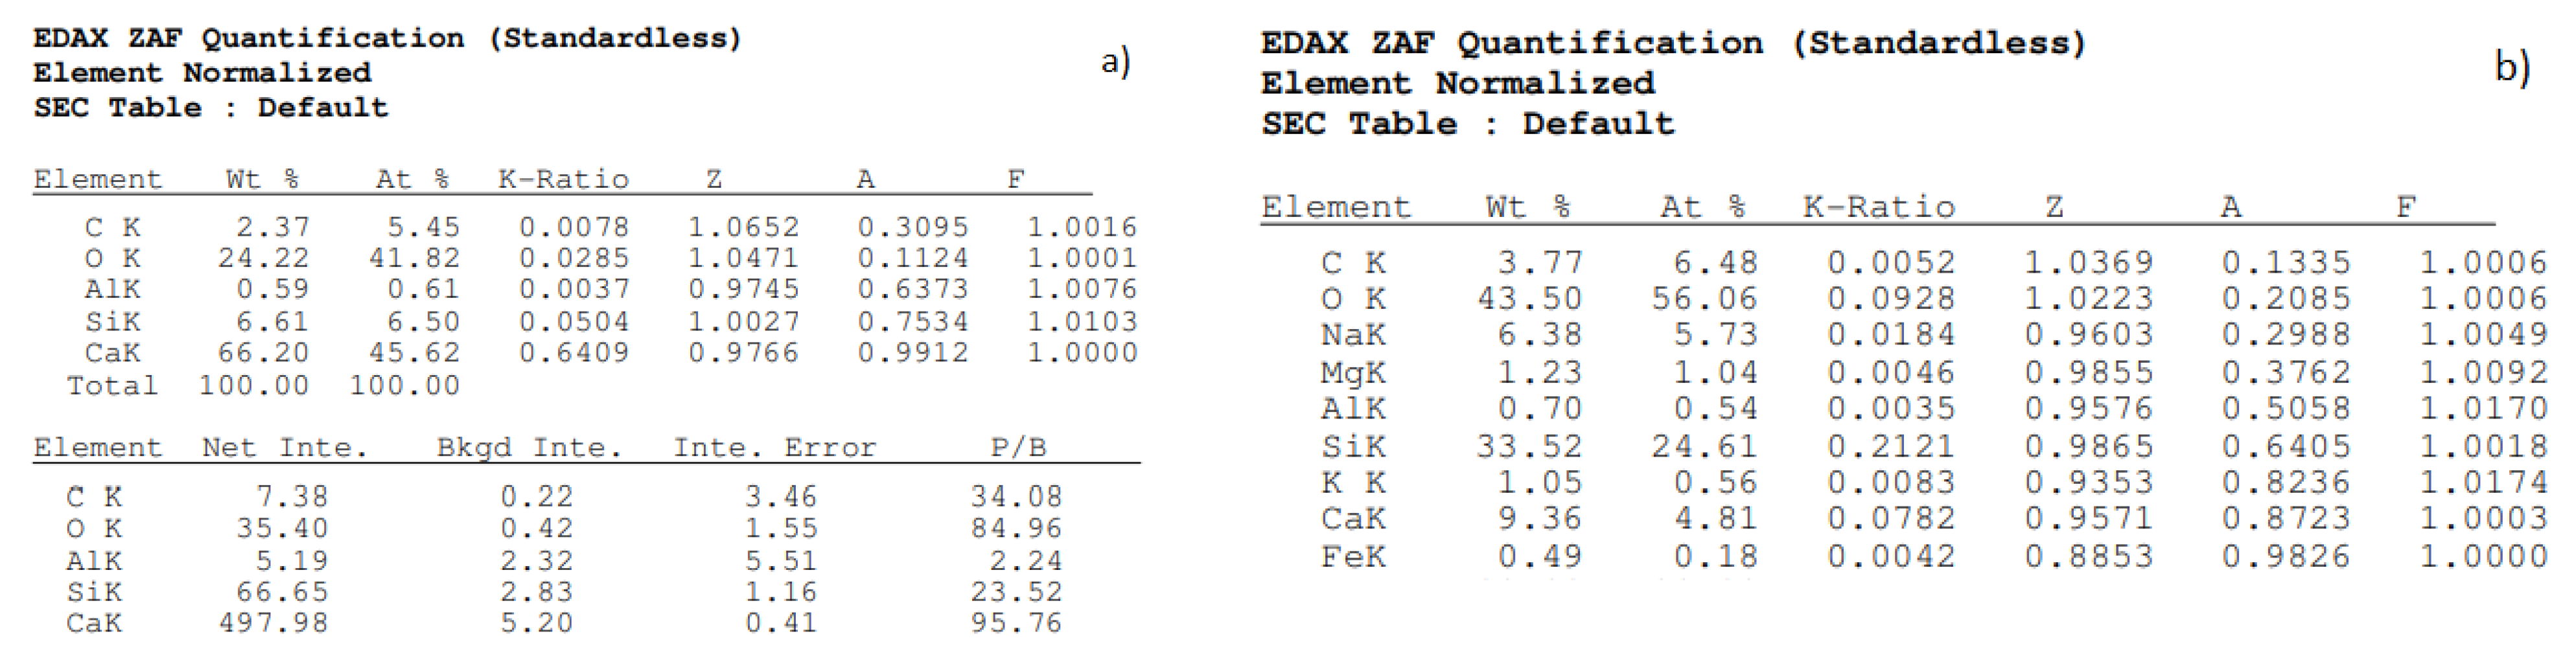
3.1. CT Tomography and SEM
3.2. Mercury Porosimetry
4. Discussion
5. Conclusions
Author Contributions
Funding
Institutional Review Board Statement
Informed Consent Statement
Conflicts of Interest
Abbreviations
| QS | Quartz sand |
| GS | Glass sand |
| U | Heat transfer coefficient (W/(m2·K)) |
| CT | Computed tomography |
| SEM | Scanning electron microscope |
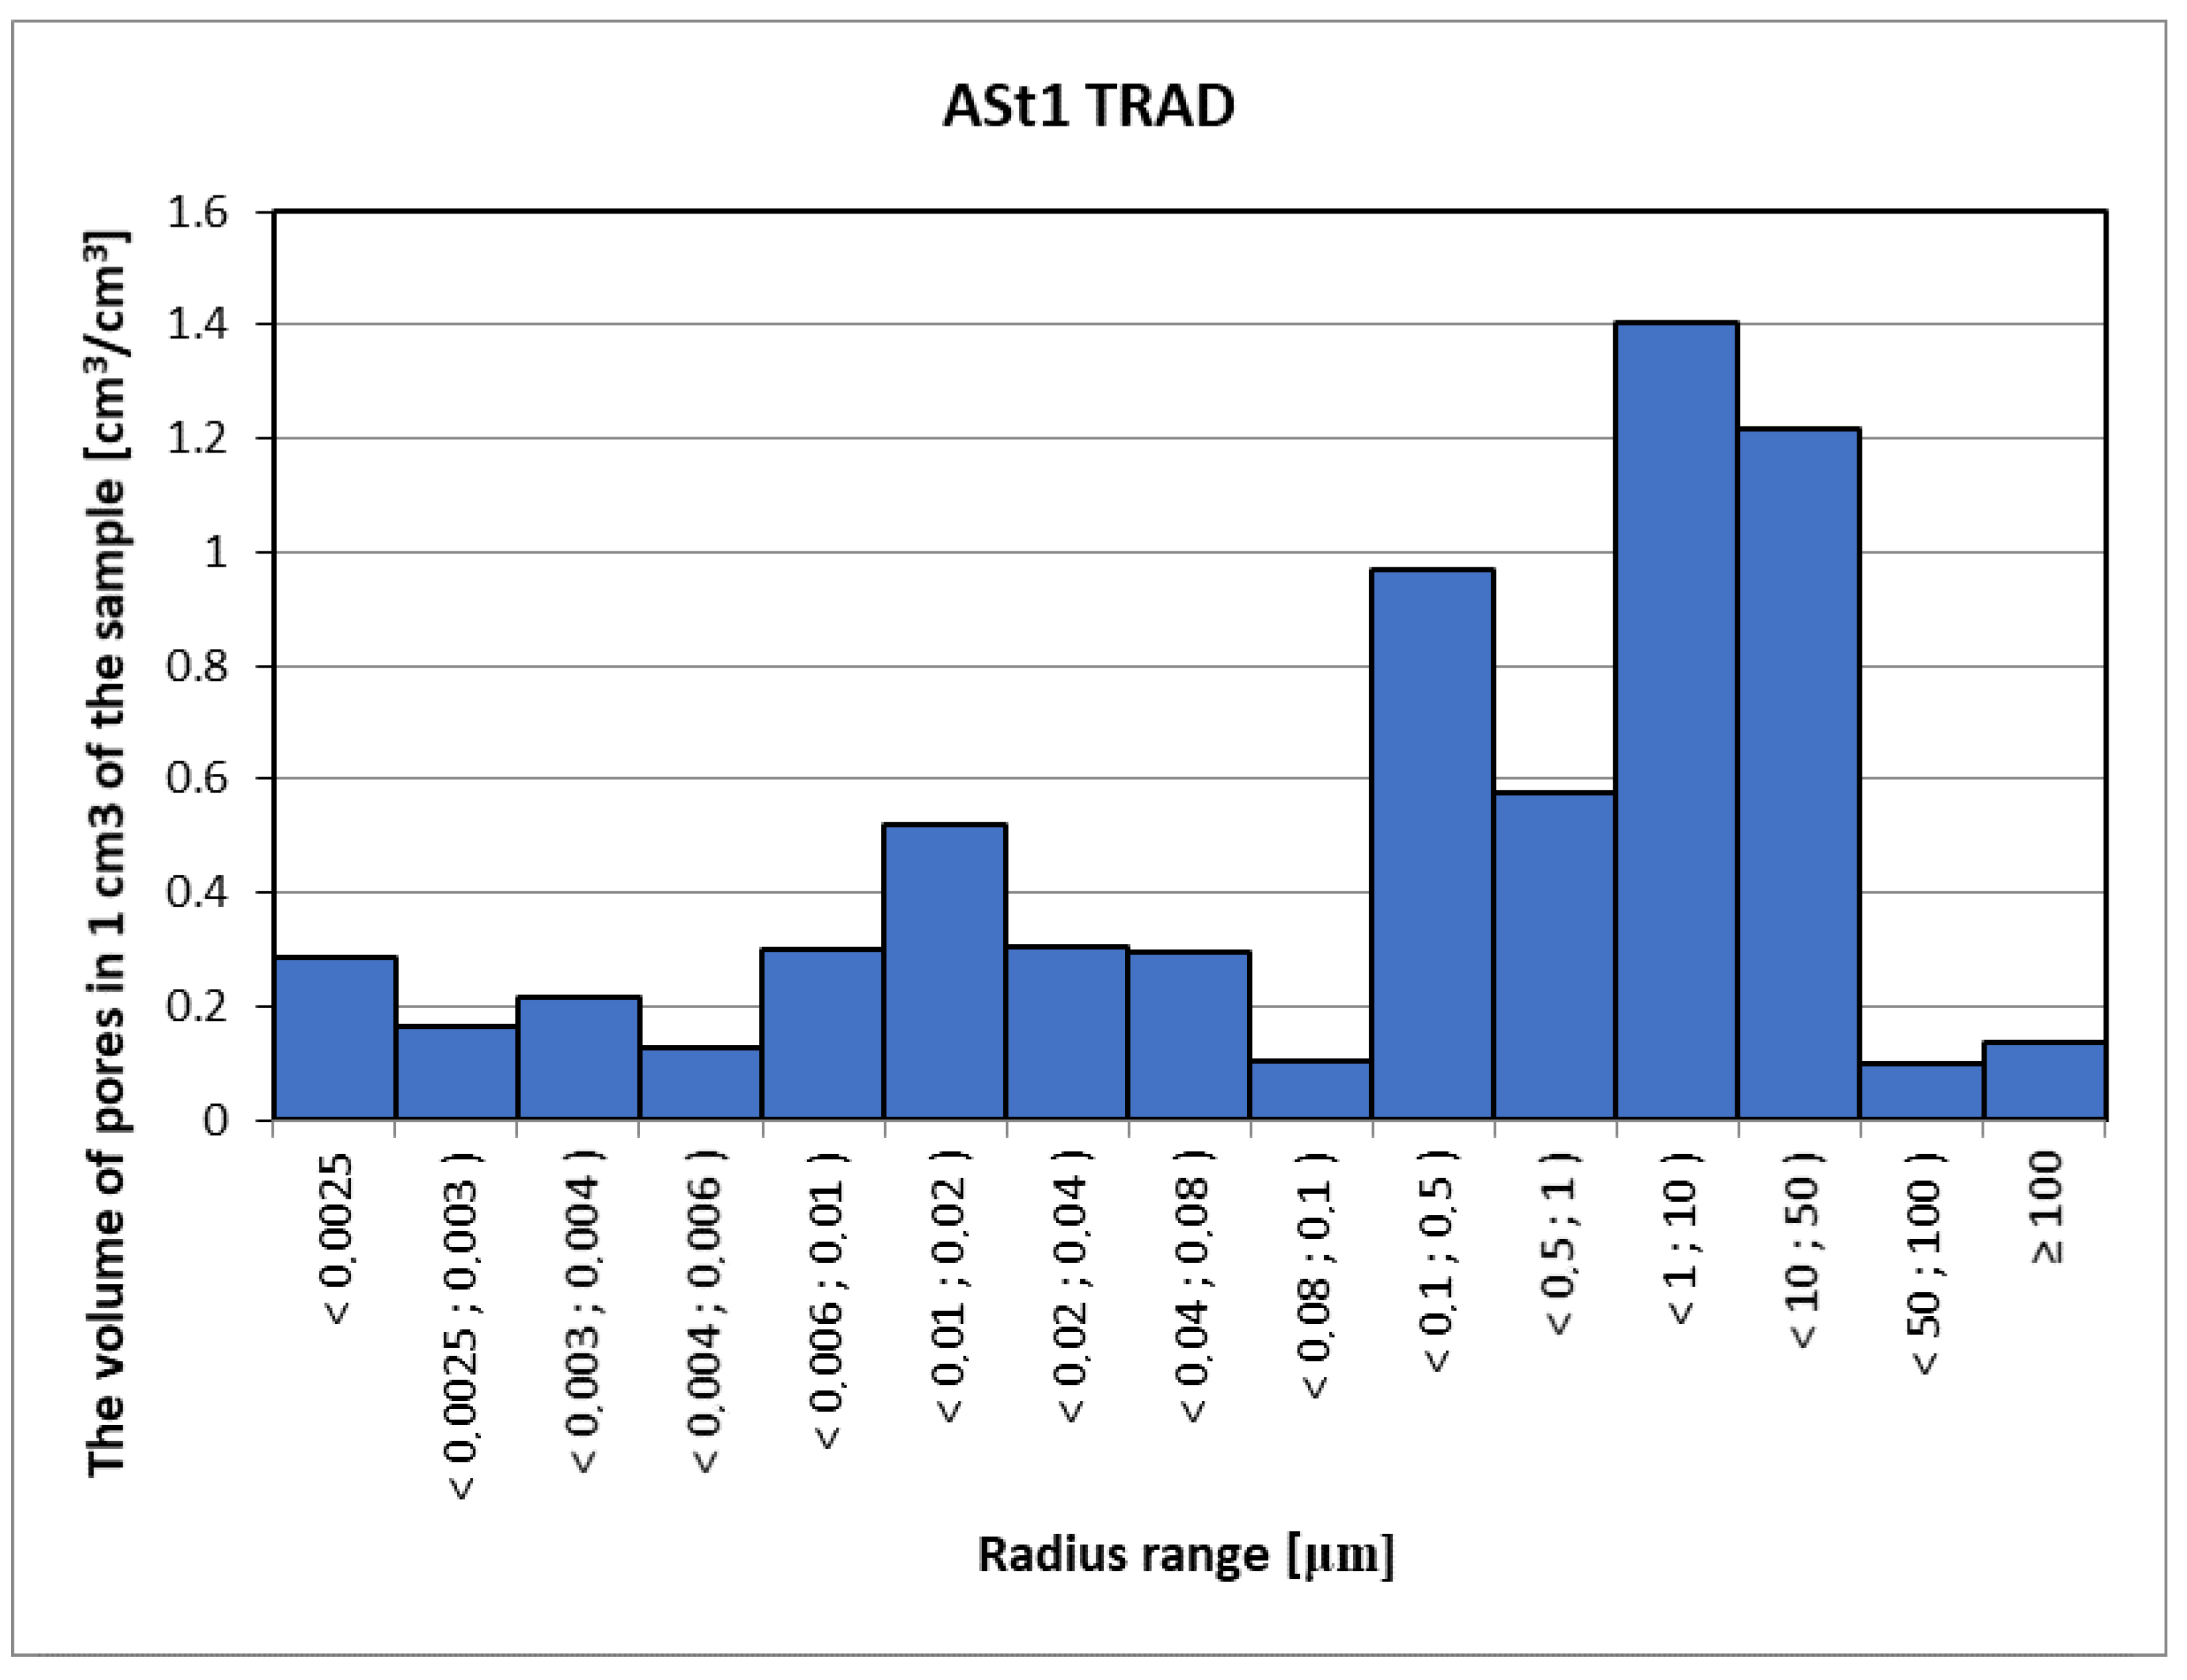
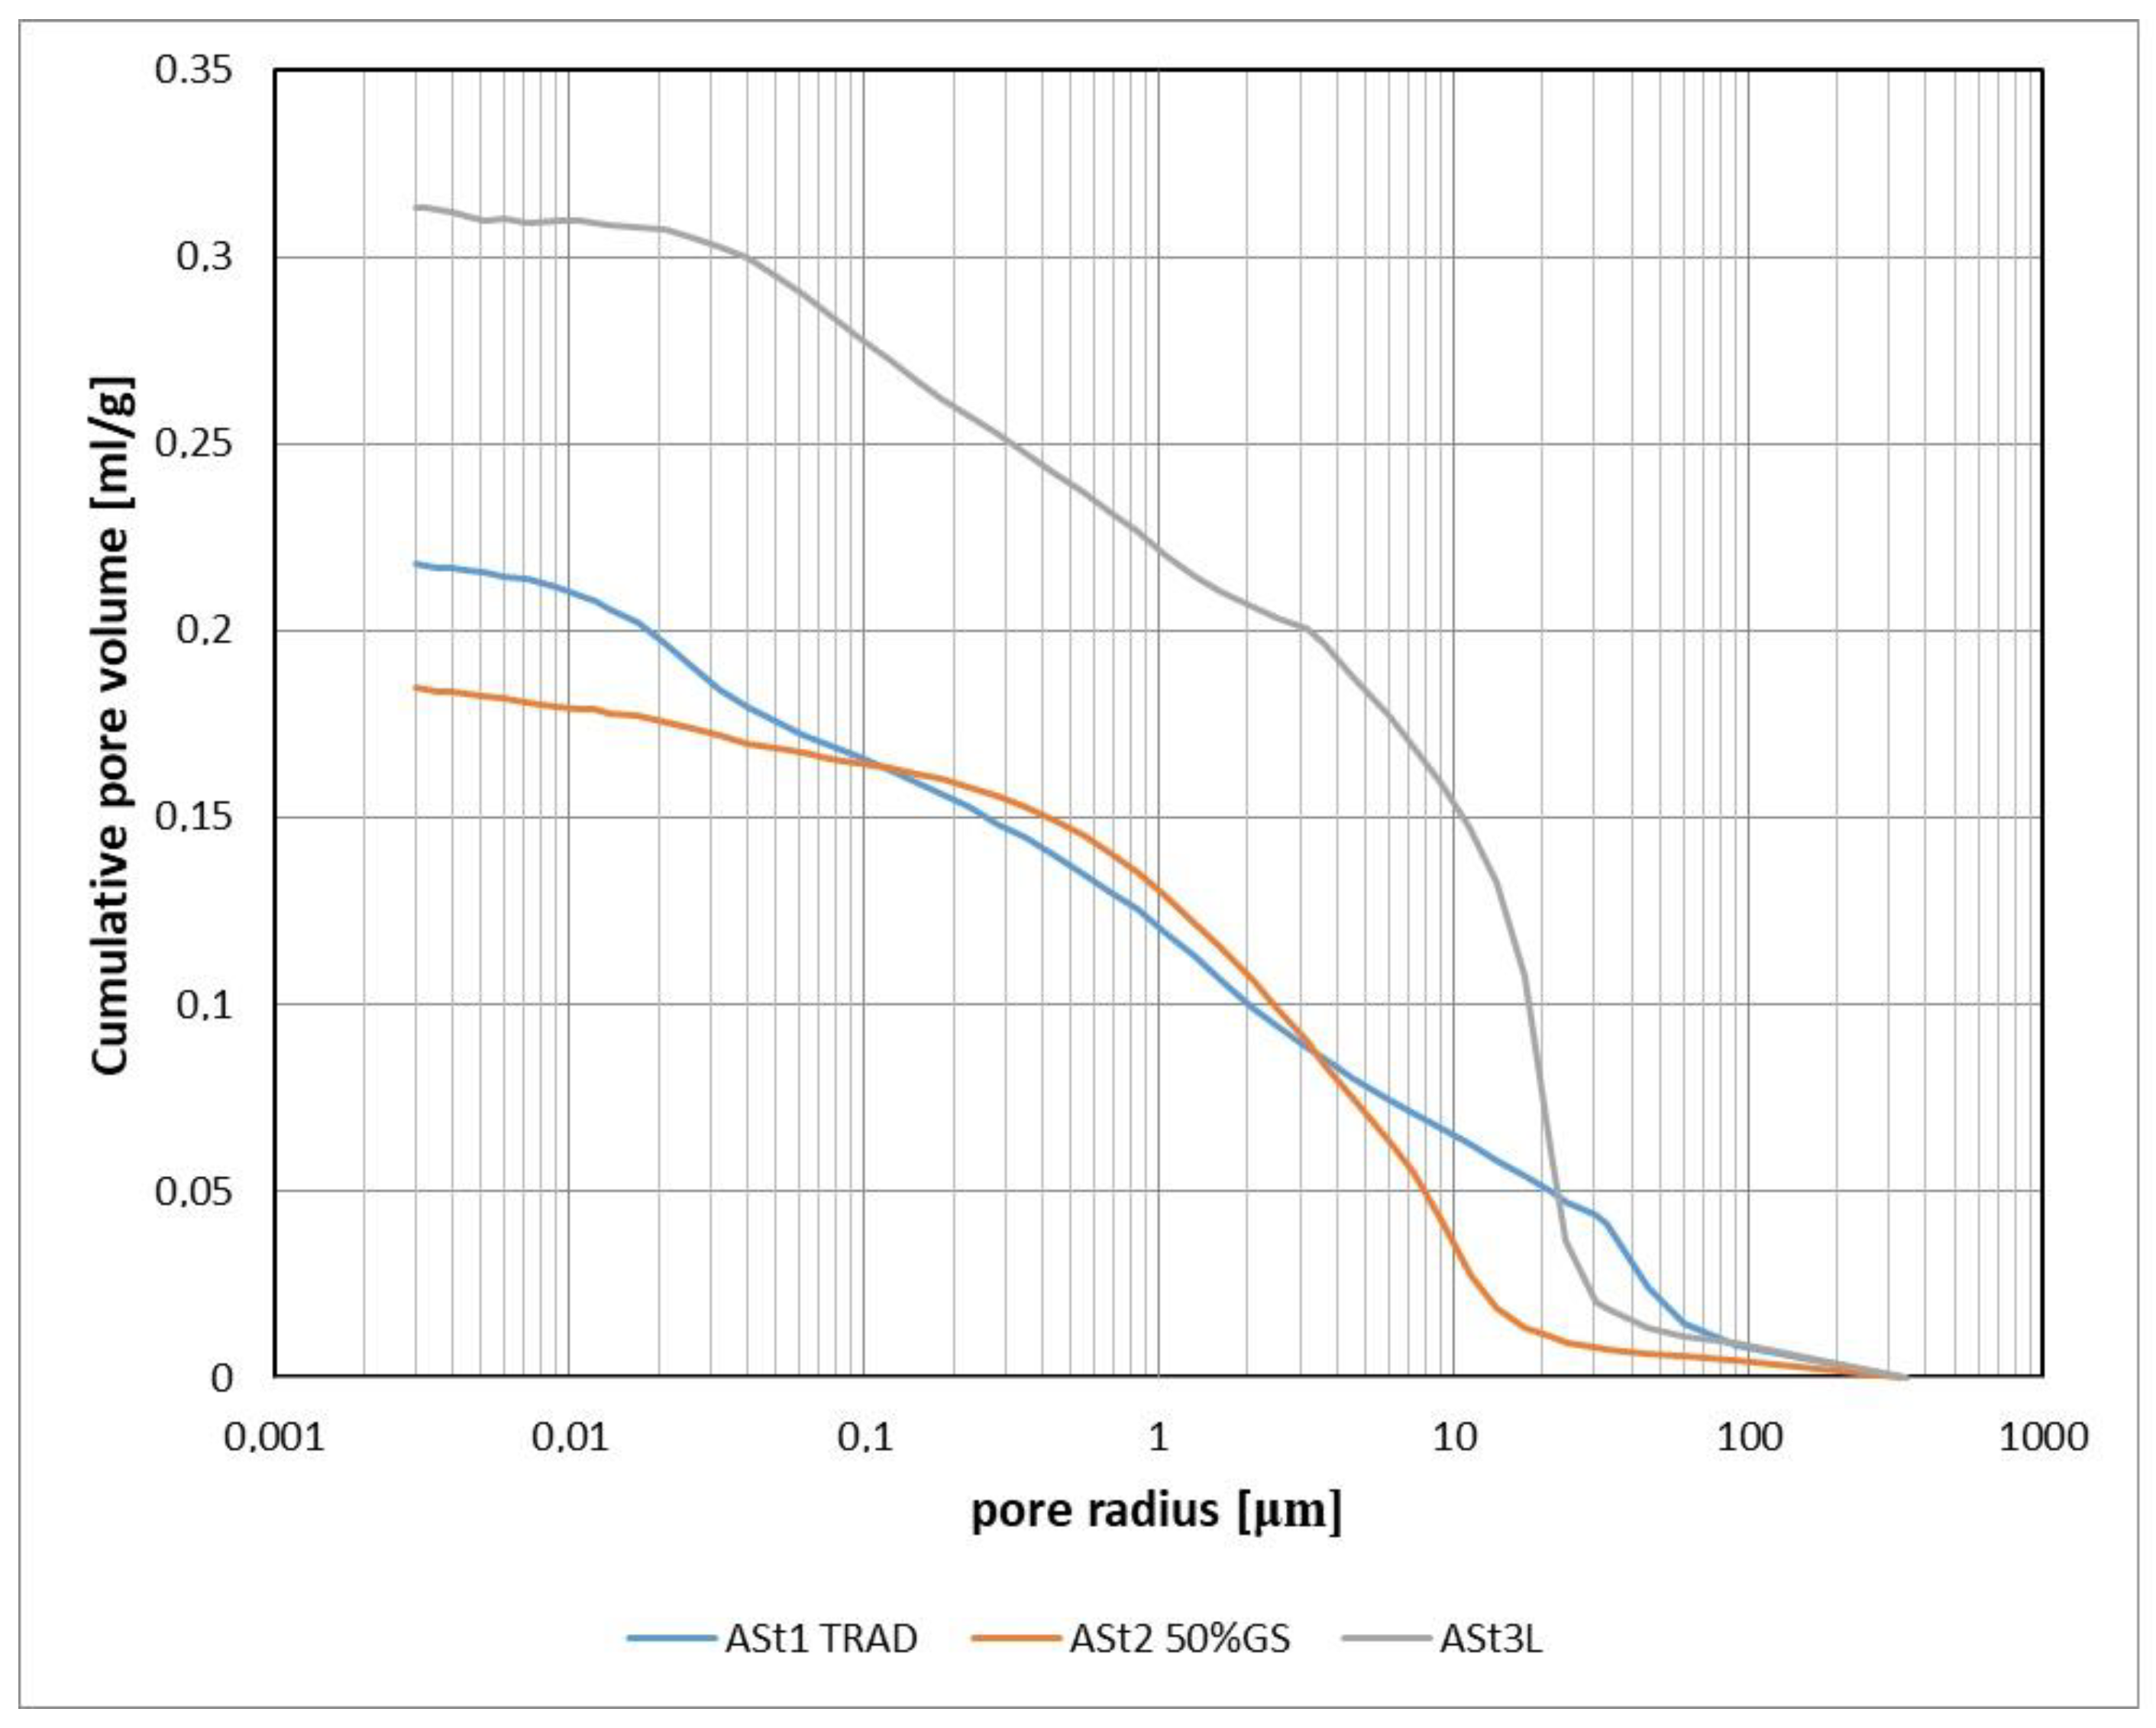
| ASt1 TRAD | Traditional (reference) silicate brick (lime-sand, 90% quartz sand) |
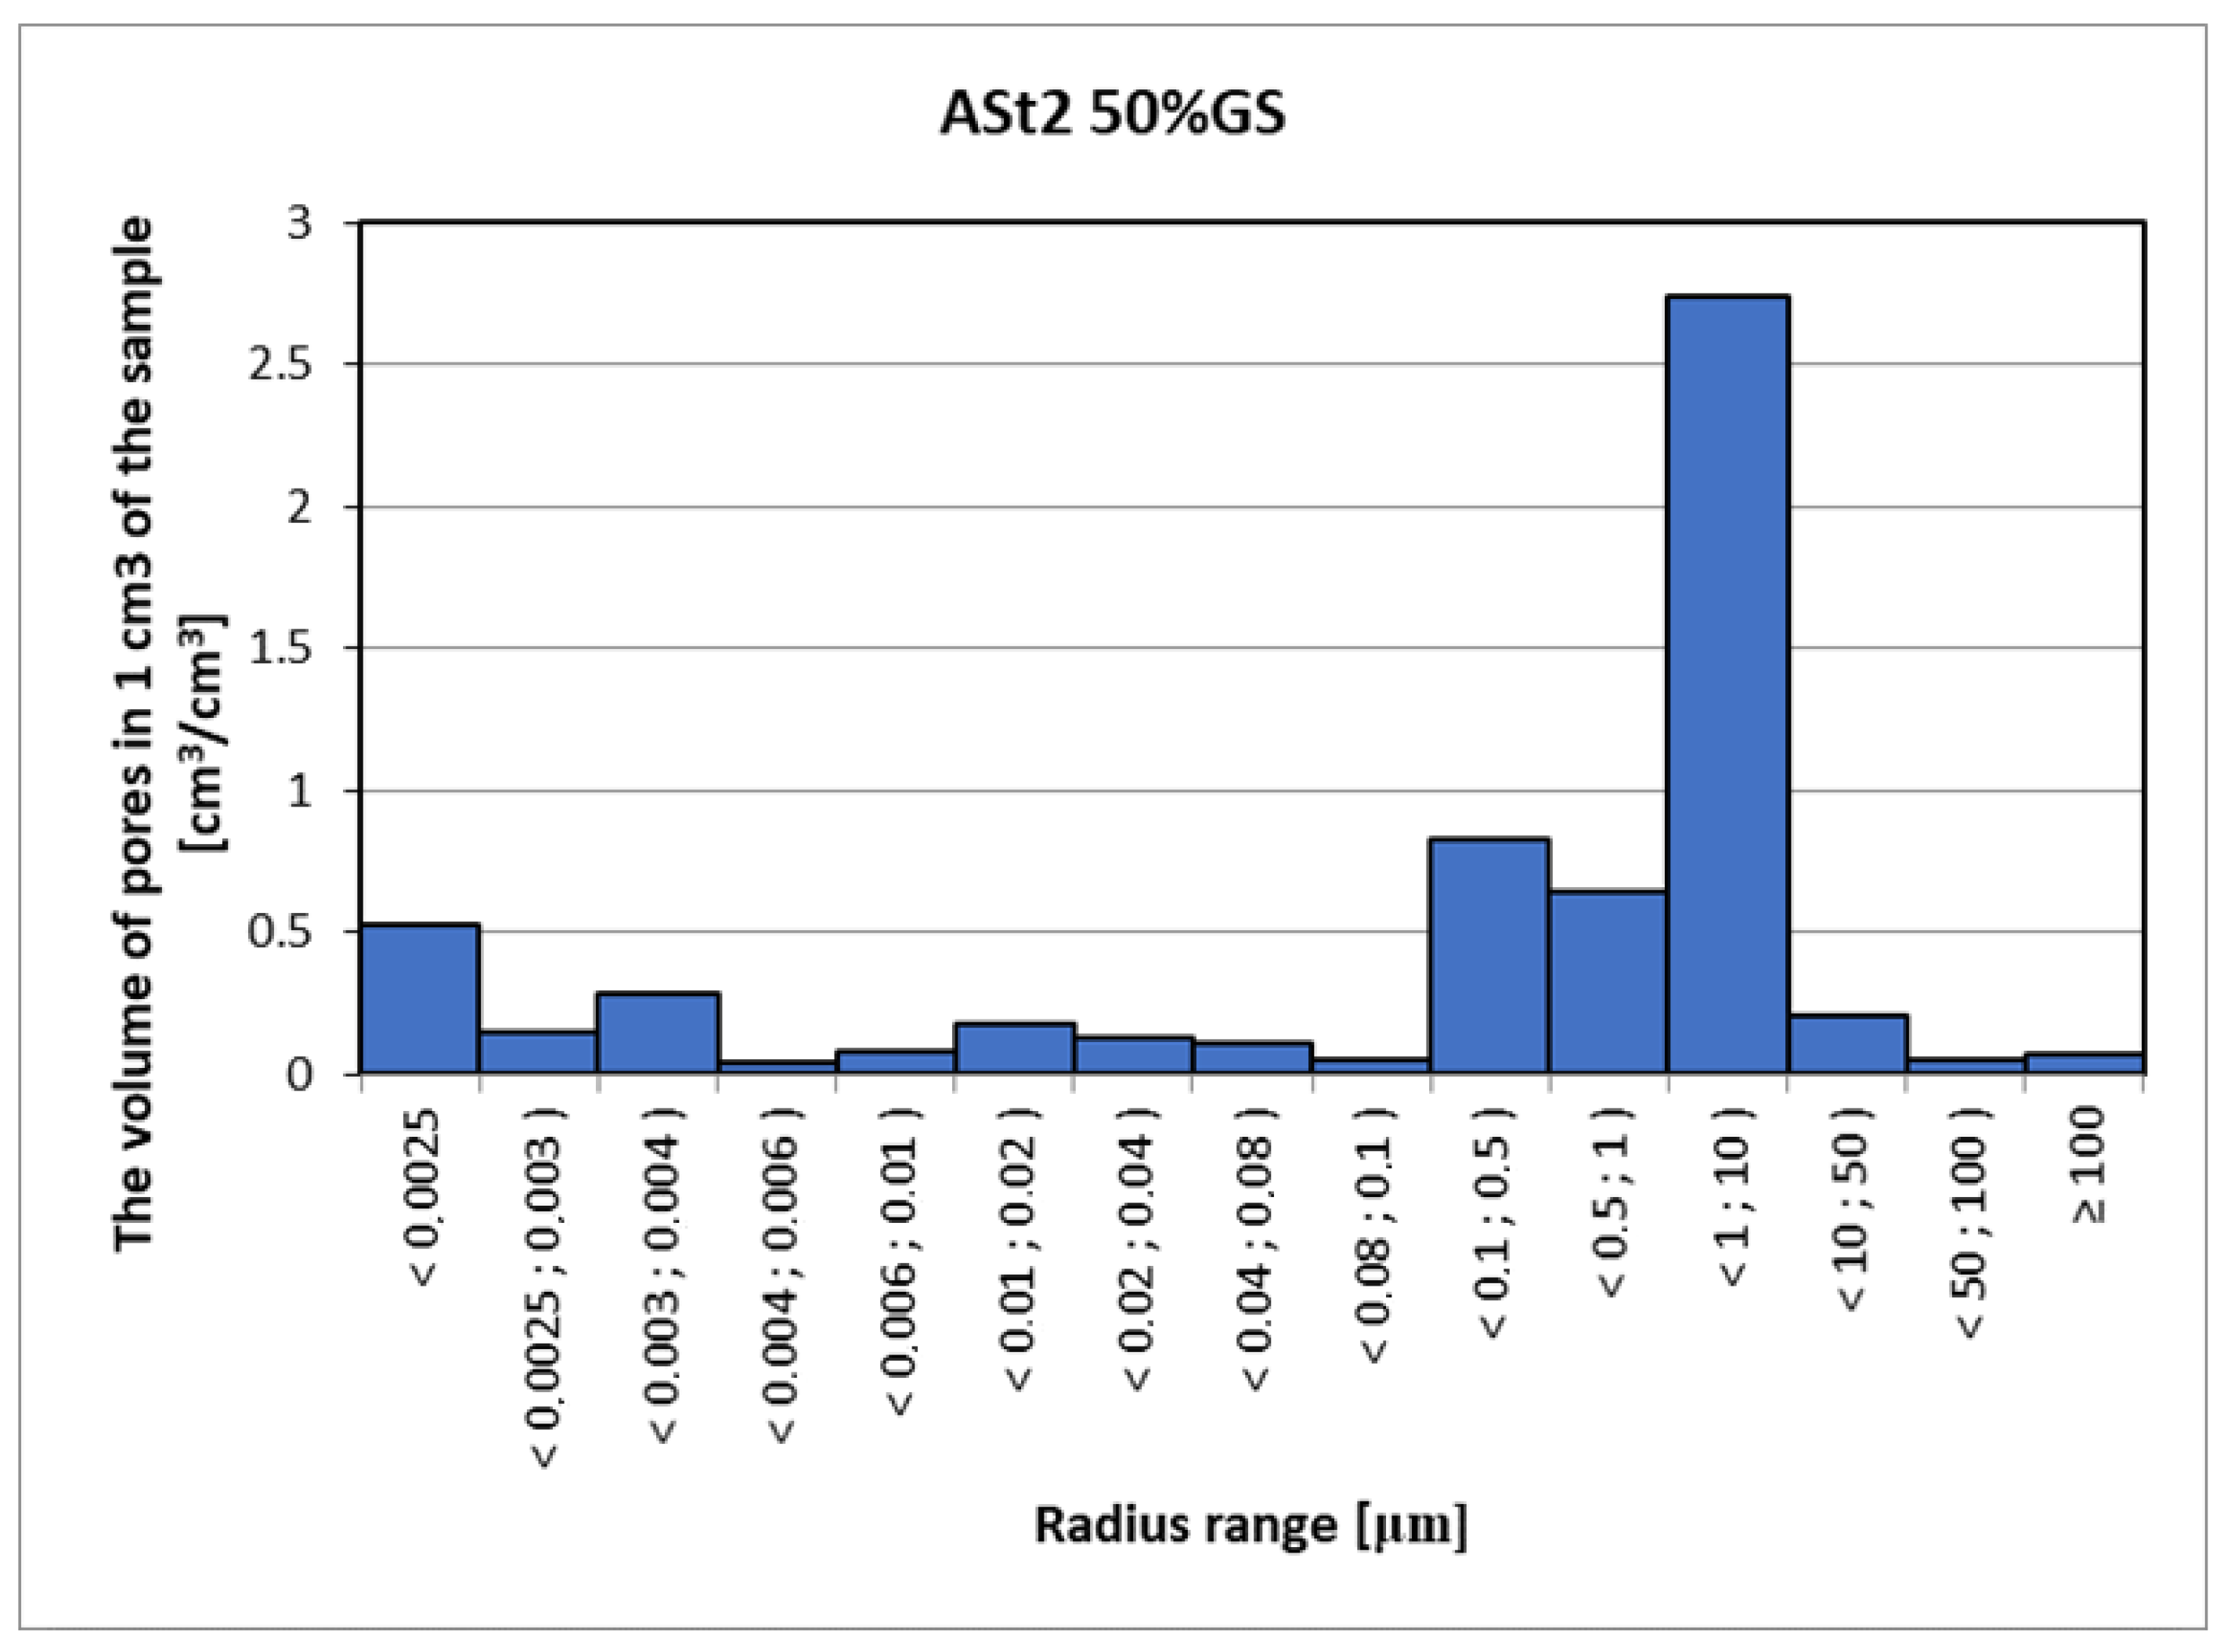
| ASt2 50%GS | Silicate brick with 50% glass sand and 50% quartz sand in relation to the sand volume in the raw material mass (90% SiO2) |
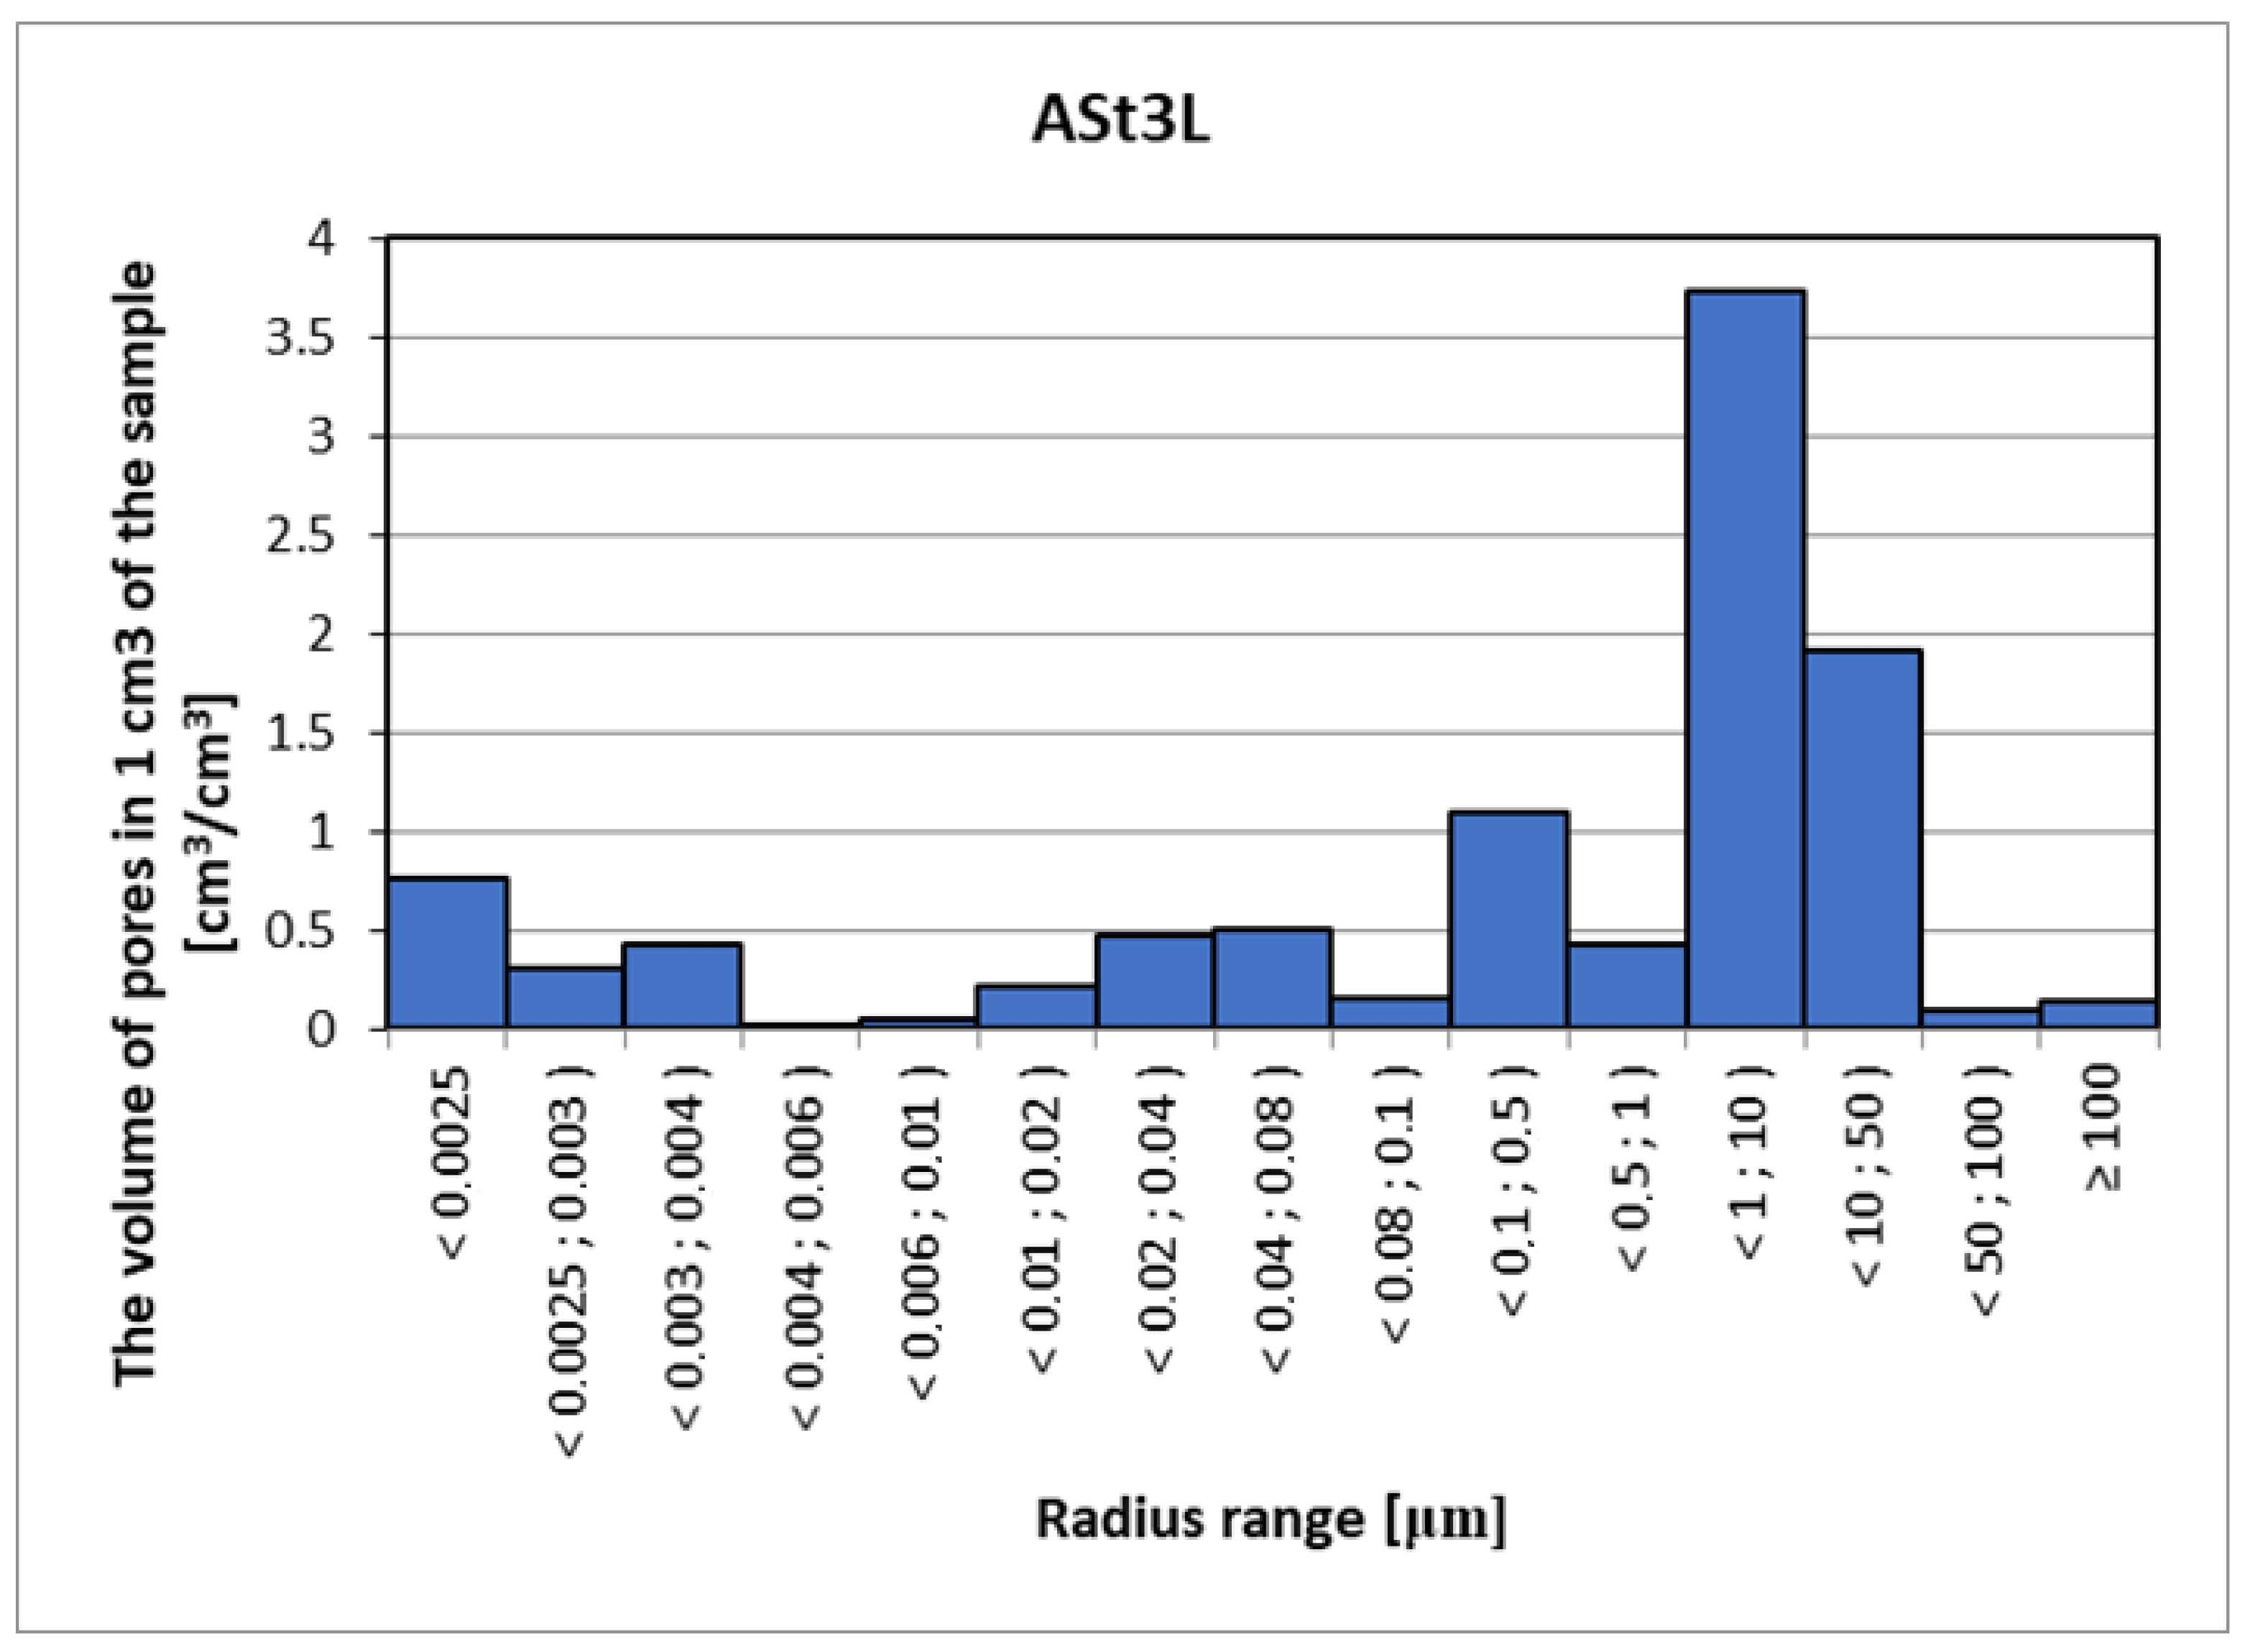
| AST3L | 90% glass sand (complete elimination of quartz sand) |
References
- Stepien, A.; Potrzeszcz-Sut, B.; Prentice, D.P.; Oey, T.; Balonis, M. The Role of Glass Compounds in Autoclaved Bricks. Buildings 2020, 10, 41. [Google Scholar] [CrossRef] [Green Version]
- Stepien, A.; Leśniak, M.; Sitarz, M. A Sustainable Autoclaved Material Made of Glass Sand. Buildings 2019, 9, 232. [Google Scholar] [CrossRef] [Green Version]
- Stepien, A. Analysis of Porous Structure in Autoclaved Materials Modified by Glass Sand. Crystals 2021, 11, 408. [Google Scholar] [CrossRef]
- Perumal, P.; Luukkonen, T.; Sreenivasan, H.; Kinnunen, P.; Illikainen, M. Porous alkali-activated materials. New Mater. Civ. Eng. 2020, 529–563. [Google Scholar] [CrossRef]
- Rutkowska, G.; Kijanka, P. Comparative analysis of selected technical features of solid bricks on examples of single-family houses Analiza porównawcza wybranych cech technicznych cegieł pełnych na przykładach budynków jednorodzinnych. ACTA Archit. 2010, 9, 35–44. [Google Scholar]
- Sobolewski, M. Influence of the Porosity on the Thermal Conductivity of the Sand Aerated Concrete; Materiały Budowlane (Eng. Materials Building): Warsaw, Poland, 2018; ISSN 0137-2971. e-ISSN 2449-951X; Available online: https://www.materialybudowlane.info.pl/images/ABK/2018/1_s32-34.pdf (accessed on 28 September 2022).
- Available online: https://hoffmanowska.pl/tag/historia-cegly (accessed on 8 September 2022).
- Misiewicz, L. The market of building materials for erecting walls in Poland in 2011, Rynek materiałów budowlanych do wznoszenia ścian w Polsce w 2011r. Mater. Bud. 2012, 476, 2–3. [Google Scholar]
- Lothenbach, B.; Kulik, D.A.; Matschei, T.; MBalonis Baquerizo, L.; Dilnesa, B.; Miron, G.D.; Myers, R.J. Cemdata18: A chemical thermodynamic database for hydrated Portland cements and alkali-activated materials. Pergamon Cem. Concr. Res. 2019, 115, 472–506. [Google Scholar] [CrossRef] [Green Version]
- Balonis, M.; Glasser, F.P. The density of cement phases. Cem. Concr. Res. 2009, 39, 733–739. [Google Scholar] [CrossRef]
- Kumar, A.; Oey, T.; Falzone, G.; Huang, J.; Bauchy, M.; Balonis, M.; Neithalath, N.; Bullard, J.; Sant, G. The filler effect: The influence of filler content and type on the hydration rate of tricalcium silicate. J. Am. Ceram. Soc. 2017, 100, 3316–3328. [Google Scholar] [CrossRef]
- Jasińska, I. Effect of foam glass granules fillers modification of lime-sand products on their microstructure. Open Eng. 2019, 9, 299–306. [Google Scholar] [CrossRef] [Green Version]
- Jasińska, I.; Dachowski, R.; Jaworska-Wędzińska, M. Thermal Conductivity of Sand-Lime Products Modified with Foam Glass Granulate. Materials 2021, 14, 5678. [Google Scholar] [CrossRef] [PubMed]
- Vance, K.; Kumar, A.; Sant, G.; Neithalath, N. The rheological properties of ternary binders containing Portland cement, limestone, and metakaolin or fly ash. Cem. Concr. Res. 2013, 52, 196–207. [Google Scholar] [CrossRef]
- Taylor, H.F.W. The Chemistry of Cements; Academic Press: London, UK, 1964. [Google Scholar]
- Haas, M. Optimal autoclaving. In Proceedings of the 4th International Conference on Autoclaved Aerated Concrete, London, UK, 8–9 September 2005. [Google Scholar]
- Hong, S.-Y.; Glasser, F.P. Phase relations in the CaO-SiO2-H2O system to 200 °C at saturated steam pressure. Cem. Conc. Res. 2004, 34, 1529–1534. [Google Scholar] [CrossRef]
- Scherer, G.W.; Hopper, R.W.; Uhlmann, D.R. Crystallization Behavior and Glass Formation of Selected Lunar Compo-sitions. In Proceedings of the Third Lunar Science Conference, Houston, TX, USA, 10–13 January 1972; Suppl. 3, Geochimica et Cosmochimica Acta. MIT Press: Cambridge, MA, USA, 1972; Volume 3, pp. 2627–2637. [Google Scholar]
- Nonat, A. The structure and stoichiometry of C-S-H. Cem. Concr. Res. 2004, 34, 1521–1528. [Google Scholar] [CrossRef]
- Metzner, R.; Eggert, A.; van Dusschoten, D.; Pflugfelder, D.; Gerth, S.; Schurr, U.; Uhlmann, N.; Jahnke, S. Direct comparison of MRI and X-ray CT technologies for 3D imaging of root systems in soil: Potential and challenges for root trait quantification. Plant Methods 2015, 11, 17. [Google Scholar] [CrossRef] [PubMed]
- Erdem, S.; Hanbay, S. X-Ray Computed Tomography Technique in Civil Engineering. In Micro-Computed Tomography (Micro-CT) in Medicine and Engineering; Springer: Cham, Switzerland, 2020. [Google Scholar] [CrossRef]
- Available online: https://ozeprojekt.pl/standard-wt-2021-wymagania/ (accessed on 8 September 2022).
- Available online: https://hotscripts.pl/budownctwo/silikaty-i-beton-komorkowy-a-wspolczynnik-przenikania-ciepla-dla-scian (accessed on 7 September 2022).
- Scherer, G.W. Relaxation in Glass and Composites; Wiley: New York, NY, USA, 1986; reprinted by Krieger, Malabar, FL, USA, 1992; Volume 331. [Google Scholar]
- Scherer, G.W.; Vergano, P.J.; Uhlmann, D.R. A Study of Quartz Melting. Phys. Chem. Glasses 1970, 11, 53–58. [Google Scholar]
- Kowalska, D.; Jóźwiak-Niedźwiedzka, D.; Chalimoniuk, M.; Dąbrowski, M. Application of Computed Tomography ct to Evaluate the Airentrainment in Concrete. Conference CONCRETE DAYS 2014. Available online: https://www.dnibetonu.com/wp-content/pdfs/2014/Kowalska_Jozwiak-Niedzwiedzka_Chalimoniuk_Dabrowski.pdf (accessed on 3 October 2022).
- Habeeb, H. Saleh, Richard Livingston The Use of X-Ray Computed Tomography (CT) Techniques to Study the Internal Structures of Concrete. 2nd MENDT Proc. 2004, 9, 1–6. Available online: https://www.ndt.net/article/mendt03/saleh/saleh.htm (accessed on 2 October 2022).
- PN-EN 480-11:2008; Admixtures for Concrete, Mortar and Grout. Test Methods Part 11: Determination Characteristics of Air Pores in Hardened Concrete. Polski Komitet Normalizacyjny: Warsaw, Poland, 2008.
- ASTM C457/C457M-12; Standard Test Method for Microscopical Determination of Parameters of the Air-Void System in Hardened Concrete. ASTM Compass: West Conshohocken, PA, USA, 2017.
- Available online: https://www.csis.org/analysis/geopolitics-oil-and-inflation (accessed on 8 September 2022).
- Caldara, D.; Conlisk, S.; Iacoviello, M.; Penn, M. The Effect of the War in Ukraine on Global Activity and Inflation; FEDS Notes; Board of Governors of the Federal reserve System: Washington, DC, USA, 2022. Available online: https://www.federalreserve.gov/econres/notes/feds-notes/the-effect-of-the-war-in-ukraine-on-global-activity-and-inflation-20220527.html (accessed on 3 October 2022).
- Available online: https://biznes.interia.pl/nieruchomosci/news-ceny-materialow-budowlanych-czy-jest-szansa-na-powrot-do-nor,nId,6214081 (accessed on 7 September 2022).
- Mehdipour, I.; Falzone, G.; Callagon La Plante, E.; Simonetti, D.; Neithalath, N.; Sant, G. How Microstructure and Pore Moisture Affect Strength Gain in Portlandite-Enriched Composites That Mineralize CO2. Ind. Eng. Chem. Res. 2019, 54, 8908–8918. [Google Scholar] [CrossRef]
- Available online: https://smoglab.pl/poziom-co2-w-atmosferze-przekroczyl-415-ppm-po-raz-pierwszy-od-narodzin-ludzkosci/ (accessed on 8 September 2022).
- Available online: https://cembureau.eu/library/reports/2050-carbon-neutrality-roadmap (accessed on 12 May 2022).
- Alawadhi, E.M. The design, properties, and performance of concrete masonry blocks with phase change materials. In Eco-Efficient Masonry Bricks and Blocks; Elsevier: Amsterdam, The Netherlands, 2015; Available online: https://www.sciencedirect.com/topics/engineering/thermal-insulation-material (accessed on 3 October 2022).
- Available online: https://odpowiedzialnybiznes.pl/publikacje/szczyt-ziemi-rio20-przyszlosc-jakiej-chcemy/ (accessed on 12 May 2022).
- Available online: https://www.muratorplus.pl/technika/izolacje/wspolczynnik-przenikania-ciepla-od-czego-zalezy-wspolczynnik-u-przegrod-budowlanych-aa-iTn4-bLg6-hCpS.htm (accessed on 8 March 2022).
- Available online: https://www.instalacjebudowlane.pl/10838-33-68-standard-wt-2021--wymagania-warunki-techniczne.html (accessed on 10 March 2022).
- PN-EN 772-13; Methods of test for masonry units - Part 13: Determination of net and gross dry density of masonry units (except for natural stone). European Committee for Standardization (CEN): Brussels, Belgium, 2001.
- PN-EN 1996-2; Eurokod 6—Projektowanie konstrukcji murowych -- Część 2: Wymagania projektowe, dobór materiałów i wykonanie murów. European Committee for Standardization (CEN): Brussels, Belgium, 1996.
- PN-EN 771-2; Wymagania dotyczące elementów murowych—Część 2: Elementy murowe silikatowe. European Committee for Standardization (CEN): Brussels, Belgium, 2015.
- PN-EN 1936; Natural Stone Test Methods-Determination of Real Density And Apparent Density, and of Total and Open Porosity. European Committee for Standardization (CEN): Brussels, Belgium, 2010.
- PN-EN 993-1:2019-01; Test Methods for Compact Molded Refractory Products-Part 1: Determination of Apparent Density, Open and Total Porosity. European Committee for Standardization (CEN): Brussels, Belgium, 2019.
- Available online: https://muratordom.pl/budowa/sciany-murowane/silikaty-zdrowy-i-mocny-material-do-murowania-scian-aa-kdLb-XtBW-HVB2.html (accessed on 1 March 2022).
- Łaskawiec, K.; Gębarowski, P. The impact of reduction time autoclaving on properties of aerated concreto. Dni Betonu 2016. Available online: https://www.dnibetonu.com/wp-content/pdfs/2016/laskawiec_gebarowski.pdf (accessed on 14 October 2022).
- Stepien, A.; Dachowski, R.; Piotrowski, Z.J. Insulated Autoclaved Cellular Concretes and Improvement of Their Mechanical and Hydrothermal Properties. In The Monograph: Thermal Insulation and Radiation Control Technologies for Buildings; Kosny, J., Yarbrough, D.W., Eds.; Springer: Berlin/Heidelberg, Germany, 2022; pp. 393–419. Available online: https://link.springer.com/book/10.1007/978-3-030-98693-3 (accessed on 19 September 2022).
- Available online: http://marcinmk.ukw.edu.pl/oferta.html (accessed on 2 October 2022).
- Kremieniewski, M.; Rzepka, M. Korelacja Parametrów Charakteryzujących Strukturę Porową Kamieni Cementowych Badanych za Pomocą Porozymetrii Rtęciowej oraz Mikrotomografii Komputerowej; NAFTA-GAZ, ROK LXXII, Nr 12; Instytut Nafty i Gazu–Państwowy Instytut Badawczy: Krakow, Poland, 2016. [Google Scholar] [CrossRef]
- Available online: https://kse.agh.edu.pl/laboratorium-porozymetryczne (accessed on 2 October 2022).
- Hołownia, D.; Kwiatkowska, I.; Hupka, J. An investigation on wetting of porous Materials. Physicochem. Probl. Miner. Process. 2008, 42, 251–262. [Google Scholar]
- Dang-Vu T., J. HUPKA Characterization of porous materials by capillary rise method. Physicochem. Probl. Miner. Process. 2005, 39, 47–65. [Google Scholar]
- Janeczek, J.; Kozłowski, K.; Żaba, J. We Collect Minerals and Rocks/ Zbieramy Minerały i Skały; Wydawnictwo Geologiczne: Warszawa, Poland, 1991. [Google Scholar]


Publisher’s Note: MDPI stays neutral with regard to jurisdictional claims in published maps and institutional affiliations. |
© 2022 by the authors. Licensee MDPI, Basel, Switzerland. This article is an open access article distributed under the terms and conditions of the Creative Commons Attribution (CC BY) license (https://creativecommons.org/licenses/by/4.0/).
Share and Cite
Stepien, A.; Durlej, M.; Skowera, K. Application of the Computed Tomography Method for the Evaluation of Porosity of Autoclaved Materials. Materials 2022, 15, 8472. https://doi.org/10.3390/ma15238472
Stepien A, Durlej M, Skowera K. Application of the Computed Tomography Method for the Evaluation of Porosity of Autoclaved Materials. Materials. 2022; 15(23):8472. https://doi.org/10.3390/ma15238472
Chicago/Turabian StyleStepien, Anna, Małgorzata Durlej, and Karol Skowera. 2022. "Application of the Computed Tomography Method for the Evaluation of Porosity of Autoclaved Materials" Materials 15, no. 23: 8472. https://doi.org/10.3390/ma15238472