Article

Integration of Rice Husk Ash as Supplementary Cementitious Material in the Production of Sustainable High-Strength Concrete

by
Noor Md. Sadiqul Hasan
1,
Md. Habibur Rahman Sobuz
2,*,
Md. Munir Hayet Khan
3,*,
Nusrat Jahan Mim
2,
Md. Montaseer Meraz
2,
Shuvo Dip Datta
2,
Md. Jewel Rana
2,
Ayan Saha
2,
Abu Sayed Mohammad Akid
4,
Md. Tanjid Mehedi
2,
Moustafa Houda
5 and
Norsuzailina Mohamed Sutan
6
1
Department of Civil Engineering, College of Engineering and Technology, International University of Business Agriculture and Technology, Dhaka 1230, Bangladesh
2
Department of Building Engineering and Construction Management, Khulna University of Engineering and Technology, Khulna 9203, Bangladesh
3
Faculty of Engineering & Quantity Surveying, INTI International University (INTI-IU), Persiaran Perdana BBN, Putra Nilai, Nilai 71800, Negeri Sembilan, Malaysia
4
Graduate Research Assistant, Civil Engineering, Arkansas State University, Jonesboro, AR 72467, USA
5
College of Engineering and Technology, American University of the Middle East, Egaila 54200, Kuwait
6
Department of Civil Engineering, University Malaysia Sarawak, Kota Samarahan 94300, Sarawak, Malaysia
*
Authors to whom correspondence should be addressed.
Materials 2022, 15(22), 8171; https://doi.org/10.3390/ma15228171
Submission received: 1 August 2022 / Revised: 30 August 2022 / Accepted: 5 September 2022 / Published: 17 November 2022
(This article belongs to the Special Issue Advances in Sustainable Construction and Building Materials)

Abstract

:
The incorporation of waste materials generated in many industries has been actively advocated for in the construction industry, since they have the capacity to lessen the pollution on dumpsites, mitigate environmental resource consumption, and establish a sustainable environment. This research has been conducted to determine the influence of different rice husk ash (RHA) concentrations on the fresh and mechanical properties of high-strength concrete. RHA was employed to partially replace the cement at 5%, 10%, 15%, and 20% by weight. Fresh properties, such as slump, compacting factor, density, and surface absorption, were determined. In contrast, its mechanical properties, such as compressive strength, splitting tensile strength and flexural strength, were assessed after 7, 28, and 60 days. In addition, the microstructural evaluation, initial surface absorption test, = environmental impact, and cost–benefit analysis were evaluated. The results show that the incorporation of RHA reduces the workability of fresh mixes, while enhancing their compressive, splitting, and flexural strength up to 7.16%, 7.03%, and 3.82%, respectively. Moreover, incorporating 10% of RHA provides the highest compressive strength, splitting tensile, and flexural strength, with an improved initial surface absorption and microstructural evaluation and greater eco-strength efficiencies. Finally, a relatively lower CO2-eq (equivalent to kg CO2) per MPa for RHA concrete indicates the significant positive impact due to the reduced Global Warming Potential (GWP). Thus, the current findings demonstrated that RHA can be used in the concrete industry as a possible revenue source for developing sustainable concretes with high performance.

1. Introduction

Concrete has been primarily recognized as the most frequently utilized construction material for several decades. Concrete production requires a lot of raw materials, which leads to a significant amount of energy consumption and pollution of nature [1]. Cement is one of the fundamental ingredients required in concrete construction, but its manufacturing leads to high CO2 emissions, which pollute the atmosphere [2]. The generation of one ton of cement is anticipated to emit approximately one ton of CO2, with 5–7% of worldwide carbon emissions resulting in environmental deterioration [3,4]. Furthermore, cement manufacturing consumes a great deal of energy, making it incompatible for long-term development [5]. To overcome such ecological and financial concerns, changes and enhancements to the current manufacturing technologies of concrete are necessary.
The concept has prompted concrete science and engineering researchers to look into and explore supplemental waste components that could be employed as alternatives for different elements in concrete manufacturing [6,7,8,9]. Waste disposal is another serious ecological challenge [3]. The use of waste products such as agricultural and industrial residues in concrete manufacturing lowers the ecological damage of inappropriate dumping, including the mounds of these wastes loaded in or discarded on fertile land. Since a variety of agricultural and industrial residues have characteristics that are acceptable for concrete manufacturing, a detailed examination of their possible use in making concrete offers significant potential to improve resource efficiency. Agricultural as well as other wastes such as palm oil fuel ash [10], sugarcane bagasse ash [11], oyster shell [12,13], sawdust [14,15], groundnut shell [16,17], coconut shell [18,19], tobacco waste [20,21], and so many more have been demonstrated to efficiently perform as a partial substitute inside the concrete mass, expanding the concrete properties satisfactorily.
Rice is a significant agricultural commodity in Asia [22,23]. Its production has increased significantly in the last decade, with worldwide paddy output expected to reach 760 million tons in 2017 [24]. Furthermore, as the global population is projected to continue expanding through 2050, rice production is likely to increase further [25]. Rice husk is a residue produced during the processing of rice that contributes roughly 20%–23% of the overall grain weights [22,23], implying that over 150 million tons are generated yearly. Unfortunately, around 83% of this amount is just thrown away as waste [25] that damages water, soil, and the overall environment [22,26,27]. Rice husk ash is a widespread agricultural waste that is a component leftover from the rice husk’s ignition process, which has received extensive attention from several studies [28,29]. The ash is frequently dumped in water bodies and landfills, endangering nature. Consequently, it constitutes a safety risk and significantly damages the environment. That is why various sectors are paying more attention to the adequate treatment and application of RHA.
Rice husk contains a high concentration of SiO2, making it ideal for usage as a pozzolan material [30]. Pozzolans are siliceous (sometimes siliceous and aluminous) substances with no or little cementing characteristics on their own. To generate cementitious compounds, they can interact with calcium hydroxide chemically at room temperature, in the company of moisture, in a finely dispersed form [31]. Rice husk can be burned at a temperature below 700 °C to obtain a decent-quality RHA, [32] which can be utilized as an additional cementing material or as a filler in paint and rubber [22,23]. This form of RHA contains a high silica concentration and has a minimal loss on ignition (LOI). RHA is a pozzolanic substance with a high reactivity that has already been effectively utilized in concrete as a substitution for cement [33,34,35] and silica fume [36,37], without sacrificing durability or strength properties.
The favorable benefits of RHA on concrete’s mechanical performance and longevity have been extensively studied [36,38,39,40]. Ganesan et al. [41] discovered that cement incorporating up to 30% RHA could be manufactured, without compromising the porosity or the strength. They also found that cement with 30% RHA showed approximately 35%, 28%, and 75% reduction in the concrete’s permeability, chloride diffusion, and chloride permeation, respectively. The interaction of RHA with Ca(OH)2 during the hydration phase of concrete led to the formation of additional C-S-H gel, which considerably increases the strength and durability characteristics. Ge et al. [42] considered the combined classification models that combine optimization techniques, such as particle swarm optimization, which provide a new level of understanding of the characteristics. Yu et al. [43] observed that the amorphous silica of RHA interacts with Ca(OH)2 for generating a specific type of C-S-H gel (Cal.5SiO3.5.×H2O) at a temperature of about 40 °C, with the contact of moisture. According to Bouzoubaâ and Fournier [44], substituting 7.5% to 12.5% RHA with ordinary Portland cement massively enhanced the concrete’s resistance to chloride-ion penetration. Similarly, mahmud et al. [45] calculated that by combining RHA and superplasticizer, high-strength concrete (HSC) of 80 MPa compressive strength could be formed at 14 days. RHA improved the compressive strength by approximately 40% over the age of 56 days, according to Nehdi et al. [46], and was more preferable than silica fume. It was stated that about 30% RHA with cement not only improved the strength properties and corrosion resistance but also decreased the permeability and chloride penetration [47]. Giaccio et al. [48] found that the RHA particles lessen the porosity of concrete, particularly at the weakest zones of the material—the interfaces between cement paste and aggregates. In addition, they ensure practical usage of agricultural residues and minimize the amount of energy consumed in cement manufacture.
The investigation was directed to reinforce a link between the two research topics, namely the incorporation of waste products in concrete and the demonstration of their relevance. Furthermore, RHA is not frequently employed throughout the Malaysian building industry. The fundamental goal of the study is to evaluate the behavior and performance of high-strength concrete incorporating RHA at various proportions ranging from 0% to 20%, as well as to promote the utilization of waste materials for a sustainable future. Various fresh properties including slump, compacting factor, density, compressive strength, splitting tensile strength, and flexural strength were all evaluated, and the strength properties were compared with conventional HSC. Furthermore, an environmental impact assessment of the produced HSC was investigated.

Significance of This Study

With growing environmental consciousness at all levels of society, the pollution and health hazards specifically associated with the concrete, cement, and clay brick industries are coming under intense scrutiny from environmentalists and governments. A significant amount of RHA is generated in Malaysia, which imposes tremendous environmental challenge. Even worse, the high population growth and shortage of waste-disposal sites in Malaysia pose a challenge to deal with this kind of toxic waste. They pose environmental problems such as air pollution and the leaching of hazardous and toxic chemicals (arsenic, beryllium, boron, cadmium, chromium, chromium (VI), cobalt, lead, manganese, mercury, molybdenum, selenium, strontium, thallium, and vanadium, along with dioxins, polycyclic aromatic hydrocarbon compounds, etc.) when dumped in landfills, quarries, rivers, and oceans. Consequently, air and water pollution have been inextricably linked to environmental problems and climate change. This study was conducted to maximize the application of RHA, which may help to reduce the environmental challenge, and to find a cost-effective sustainable solution for producing high-strength concrete.

2. Materials and Methods

Ordinary Portland cement (OPC) was collected from local vendors and considered the prime binder material for the concrete mixes that corresponded to the standard BS EN 196-1:2016 [49]. The cement was Type I OPC, fulfilling the requirements of every aspect. Along with OPC, rice husk ash (RHA) is employed as a subsidiary cementitious agent in quantities ranging from 0% to 20%. The chemical composition of the binders (ordinary Portland cement and RHA) utilized in the investigation is shown in Table 1. Chemical composition was done by X-ray fluorescence (XRF) to find the percentages of chemical constituents.
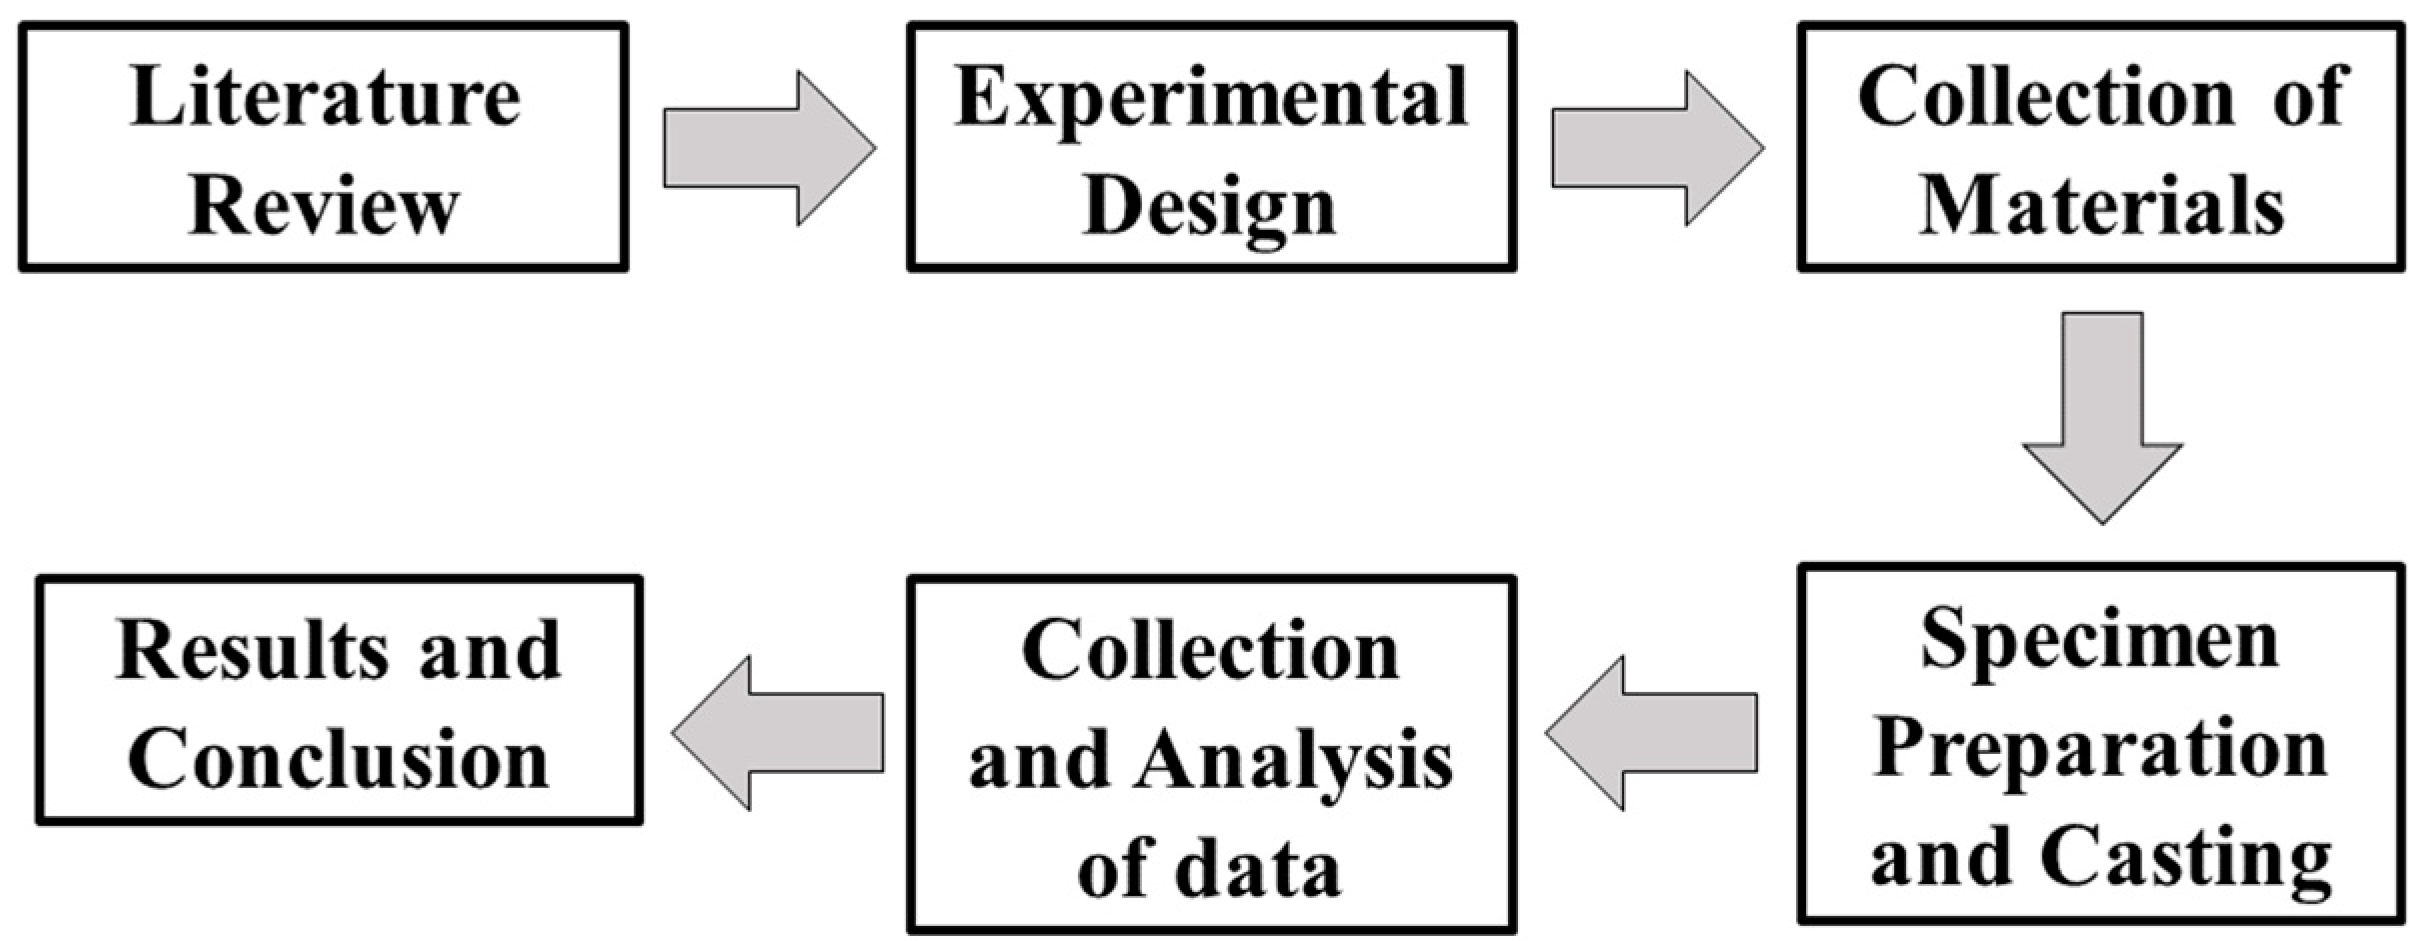
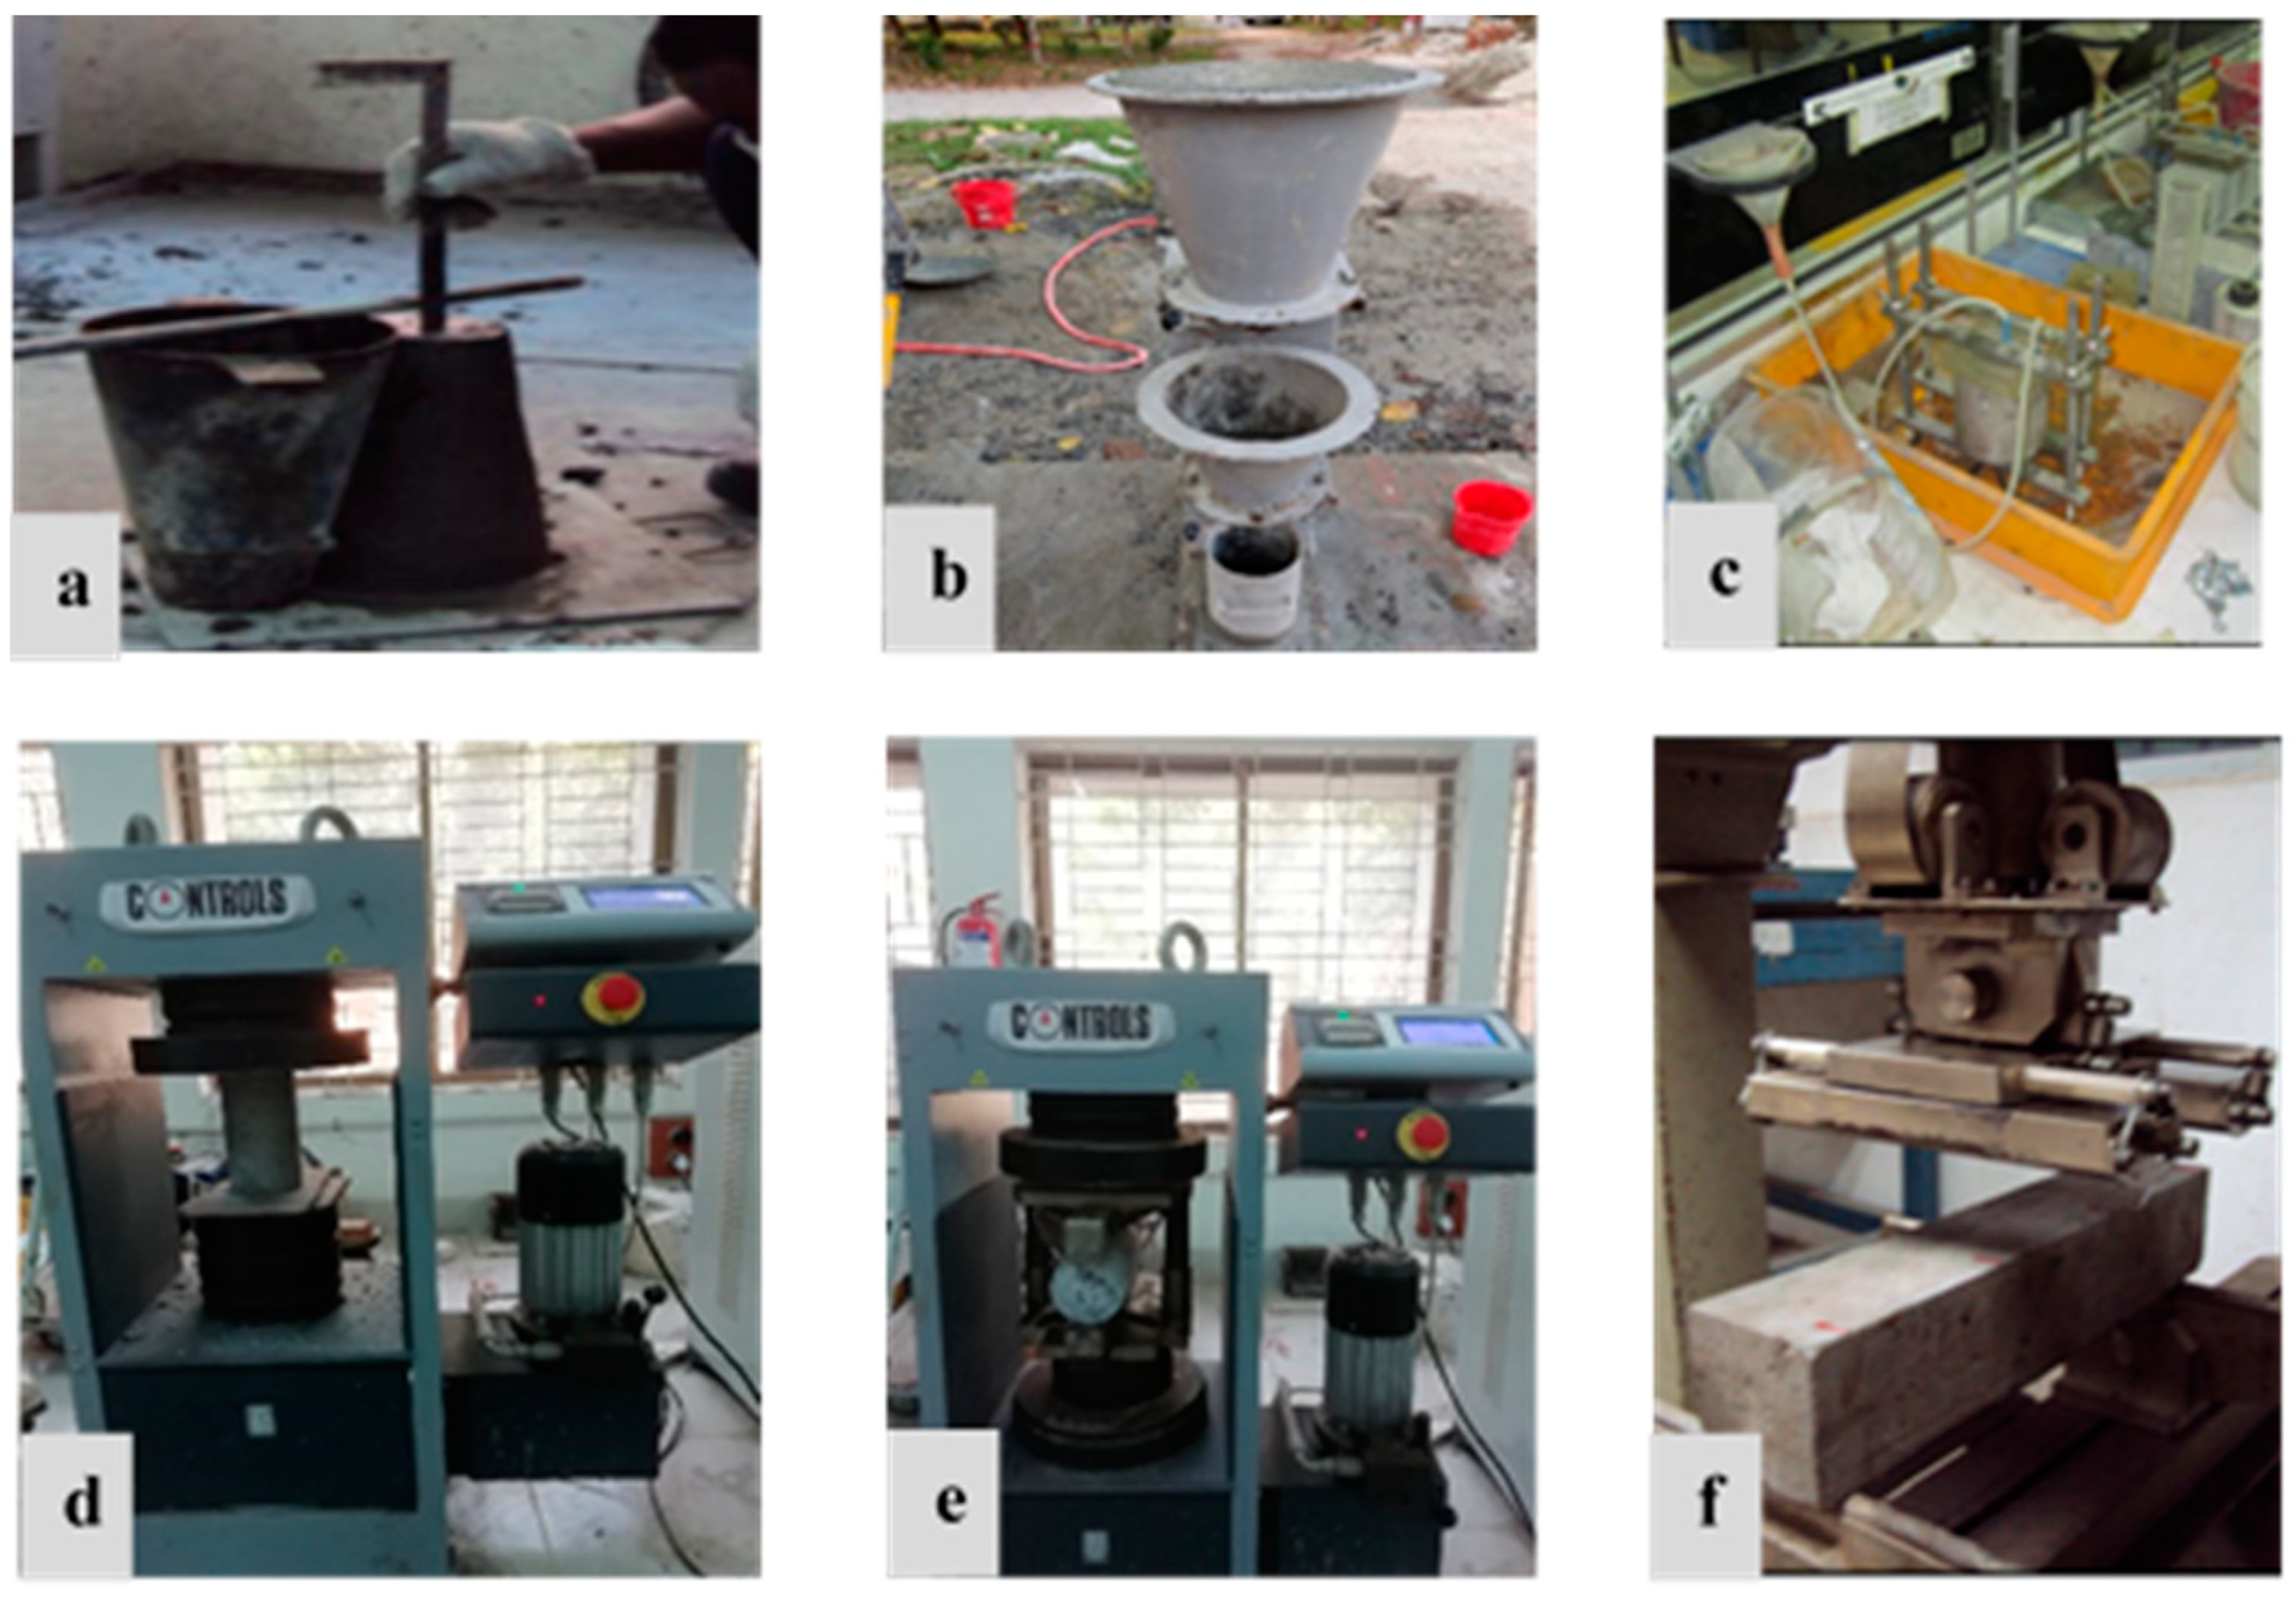
This study’s experimental procedure includes the evaluation of fresh properties, mechanical properties, microstructural properties, environmental impact, and cost–benefit assessment. So, the sequential works are represented in this study, as shown in Figure 1.
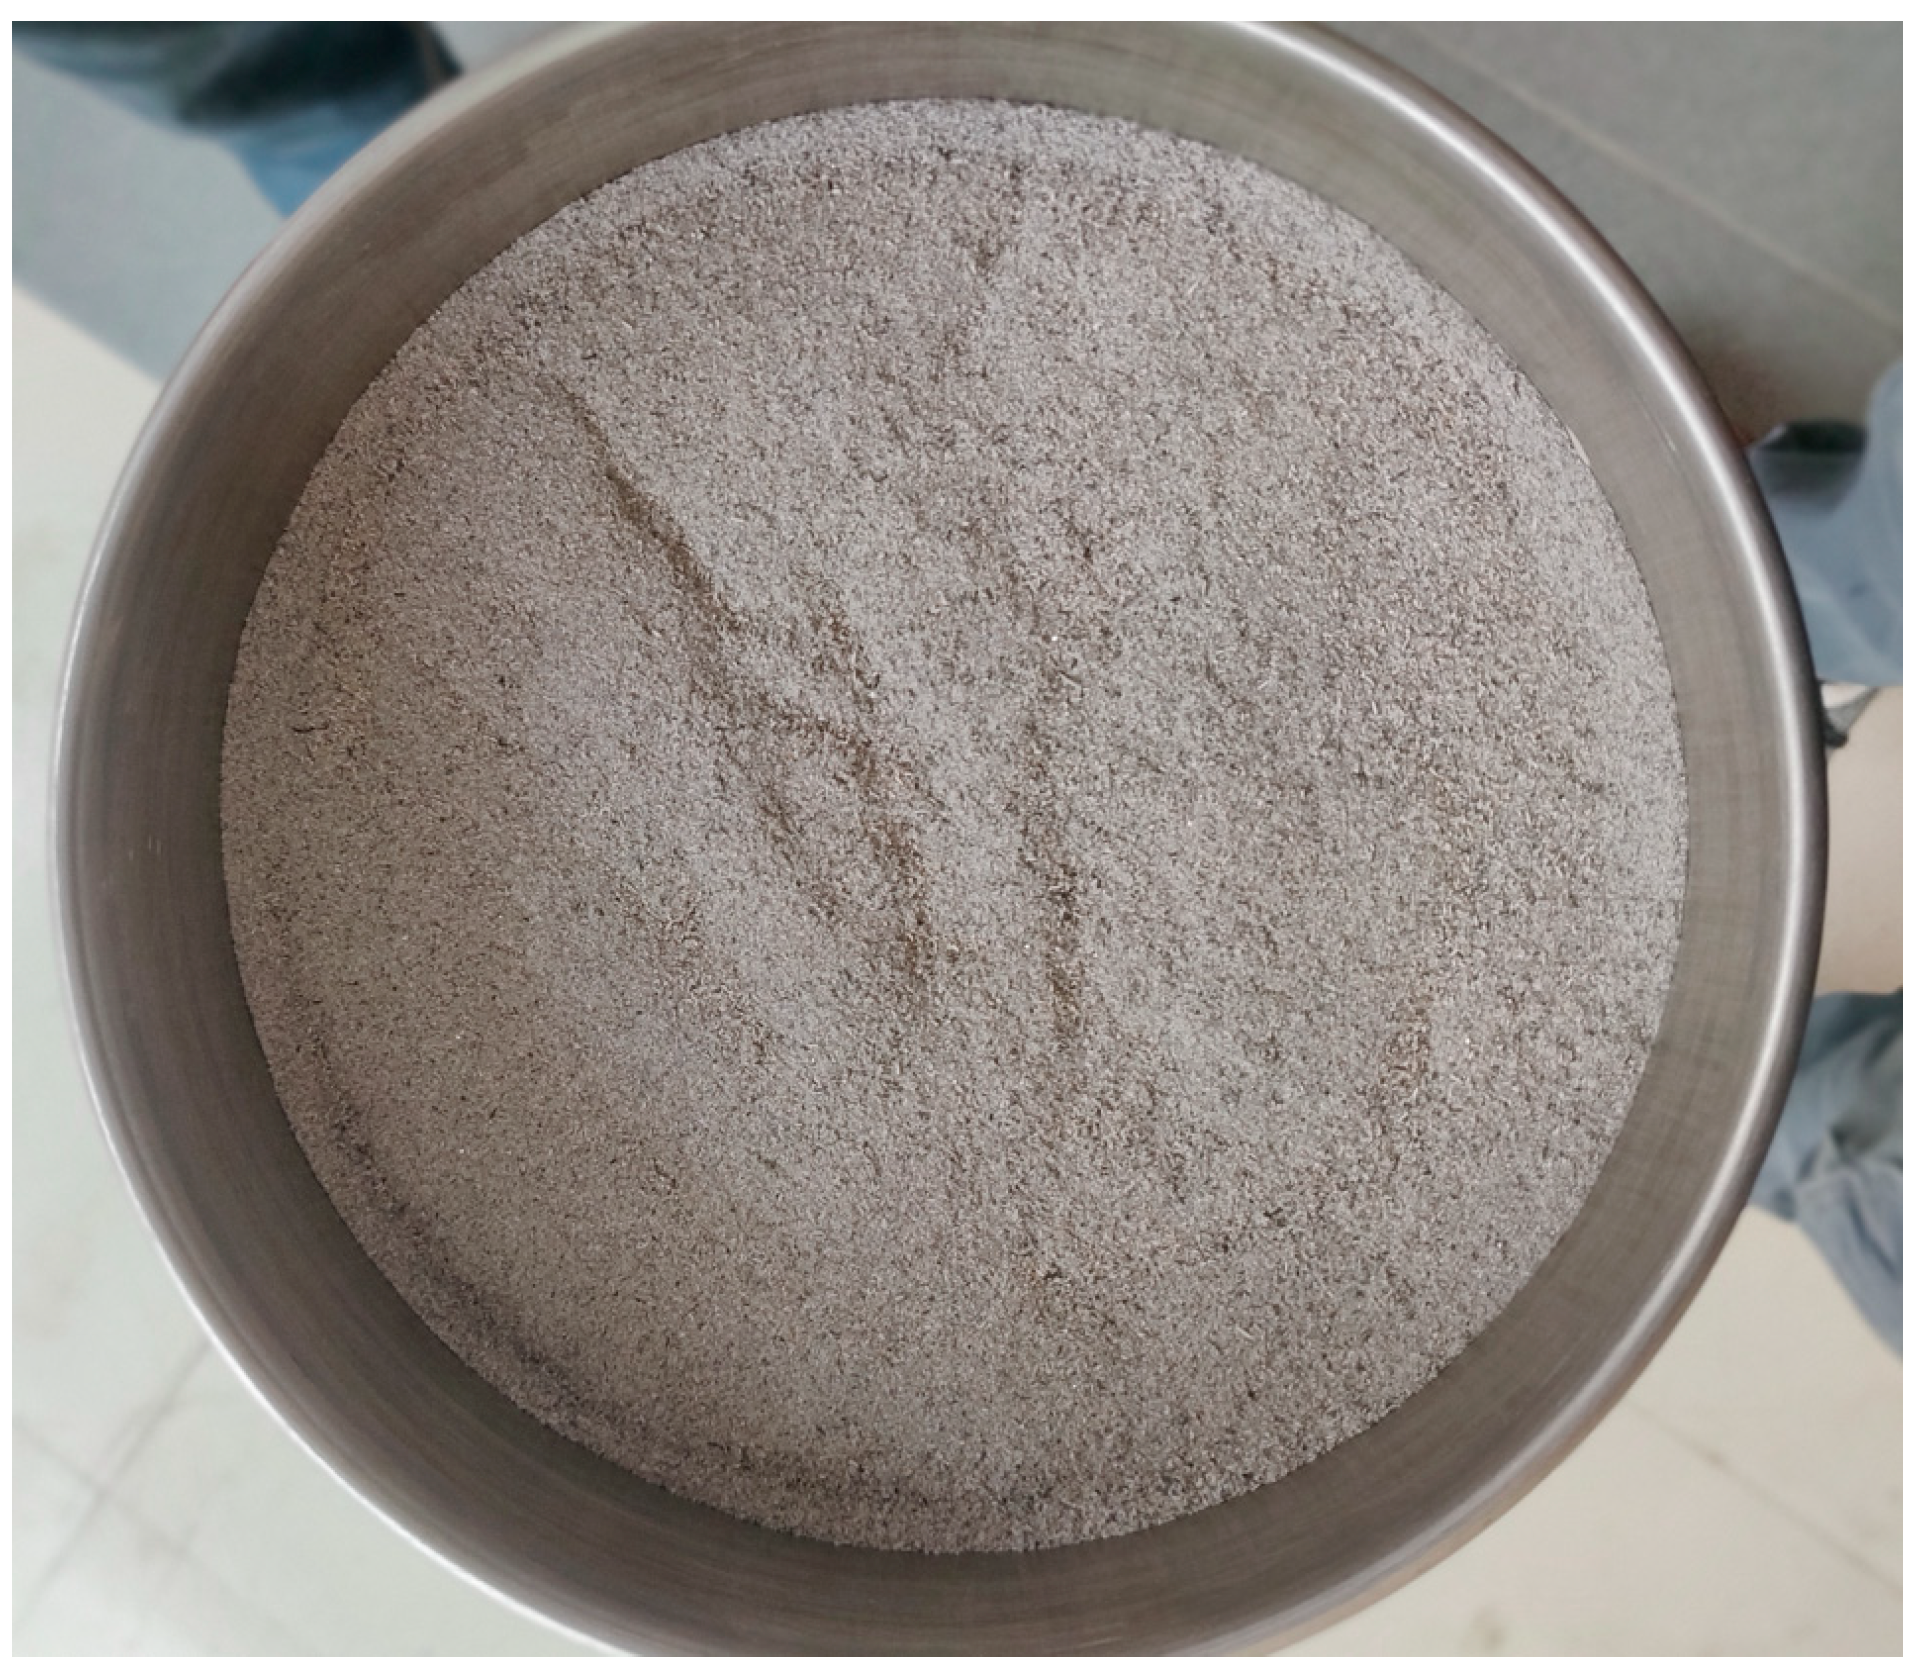
Rice husk was gathered from a mill located in Kuala Selangor, Malaysia, and incinerated inside a ferrocement furnace at the University of Malaya to generate RHA. After about an hour of keeping the flame beneath the furnace, the husk began to smolder itself for around 24 h. Then, the ash was kept for settling within the furnace for the next 24 h, before being extracted and pulverized with a Los Angeles machine. The specimen of rice husk ash utilized in this research is illustrated in Figure 2.
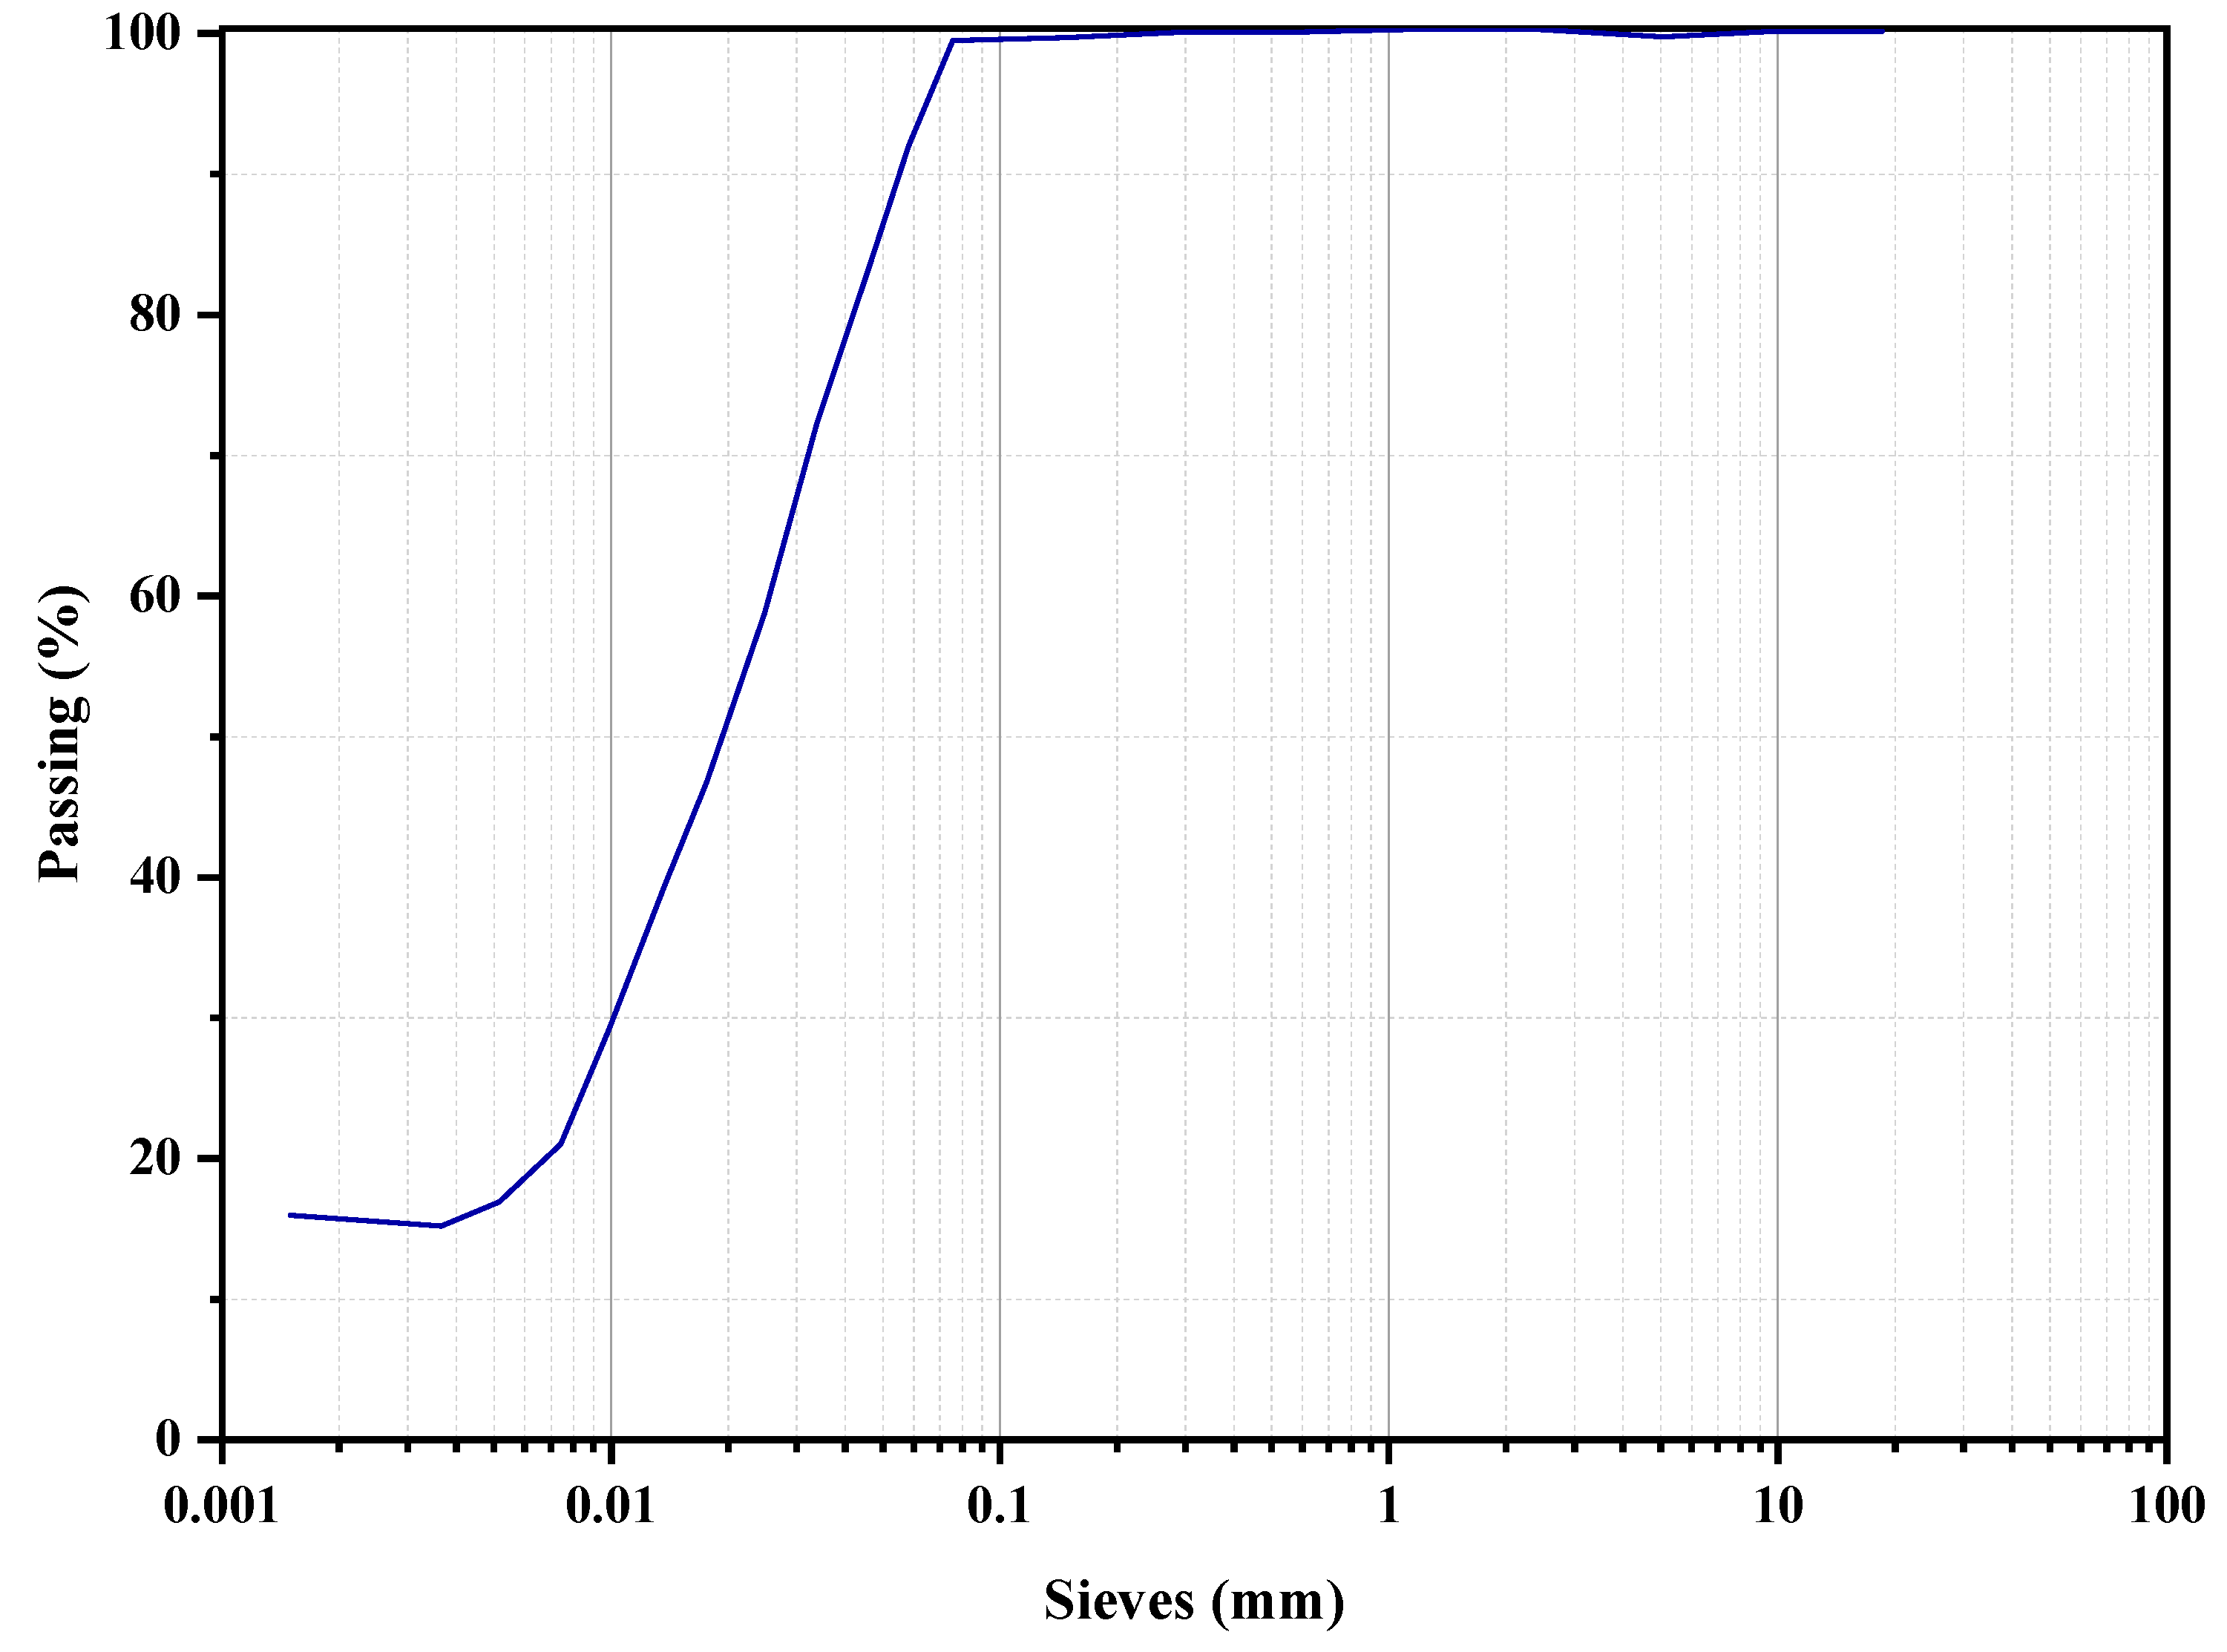
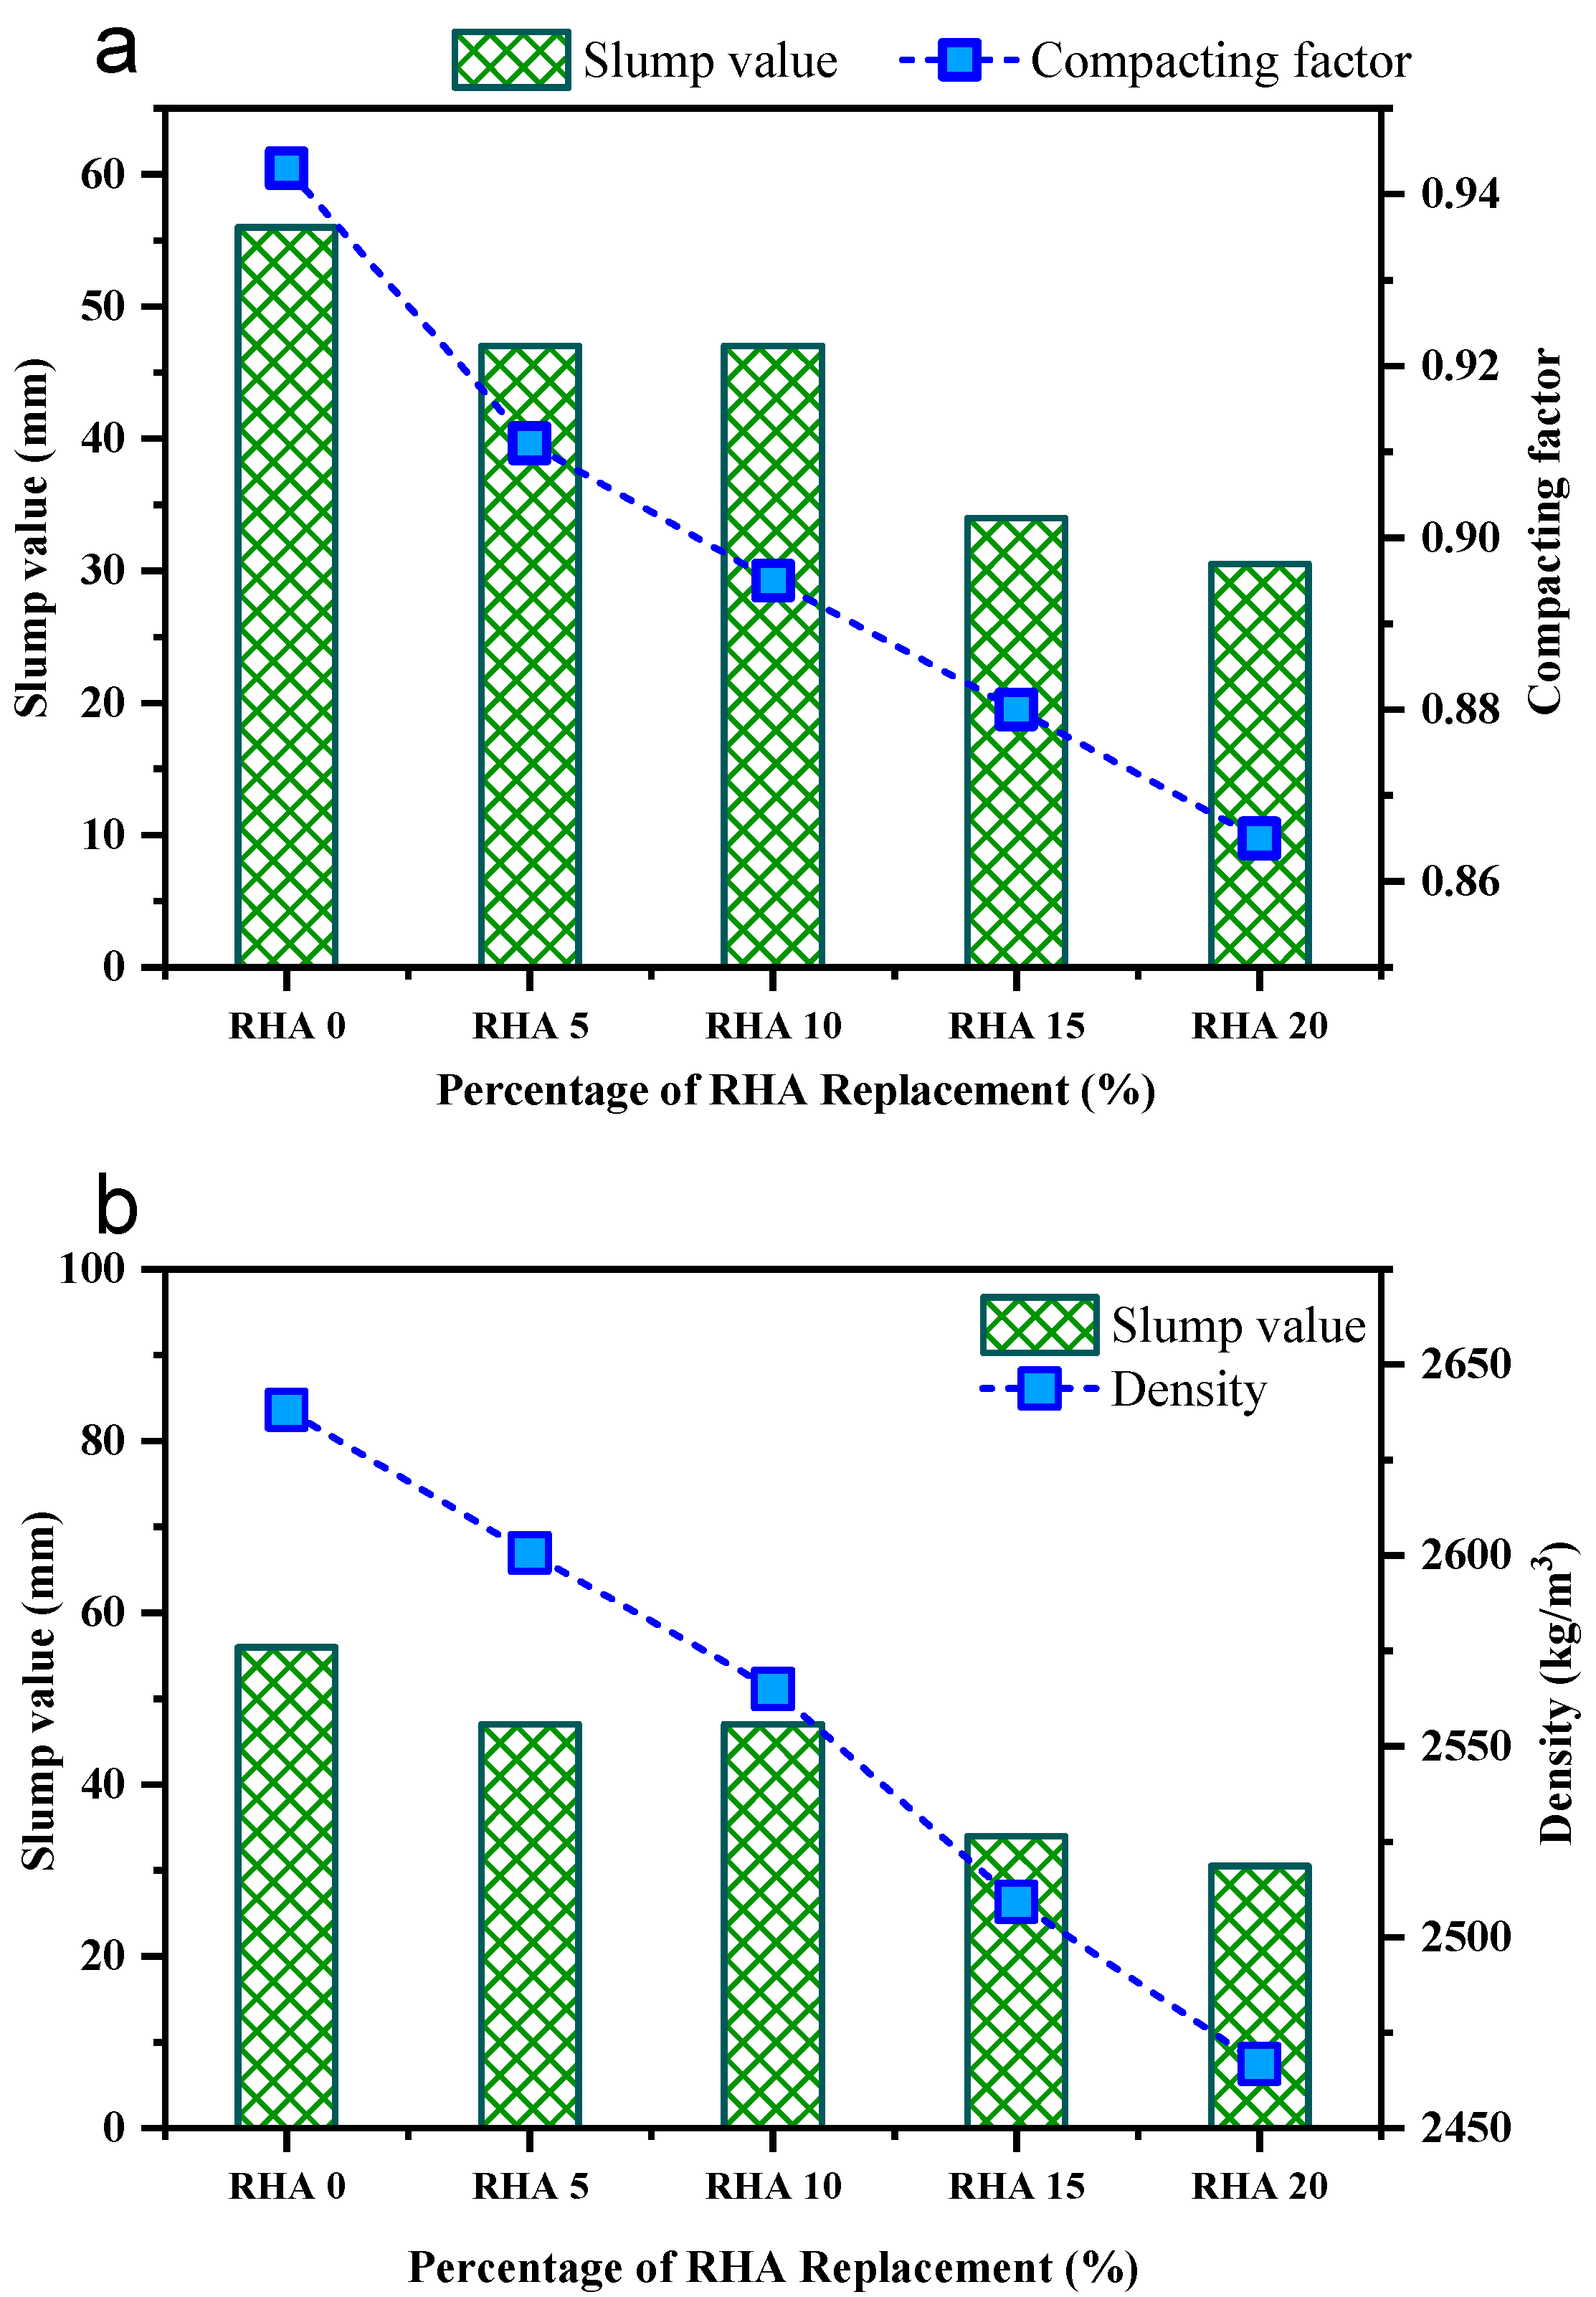
Physical properties also can be understood by the particle-size distribution curve. The distribution curve of RHA is shown in Figure 3, considering the unit as the micro-meter. Values for the particle distribution curve re taken from the hydrometer test analysis. The result ranges from 1.0 µm to around 60 µm.
This investigation used crushed aggregates from the quarry as coarse aggregate (CA), collected from local suppliers with a nominal size of 20 mm, complying with BS 812-103.1:1985 [50]. The fineness modulus was found to be 5.94. The physical properties of coarse aggregates are highlighted in Table 2. In contrast, the fine aggregate was obtained from the local market and air-dried to achieve the saturated surface dry status to maintain the water–cement ratio. The characteristics of fine aggregate are also represented in the below table. These properties were determined per ASTM C29, ASTM C127, ASTM C128, and ASTM C136 [51,52,53,54].
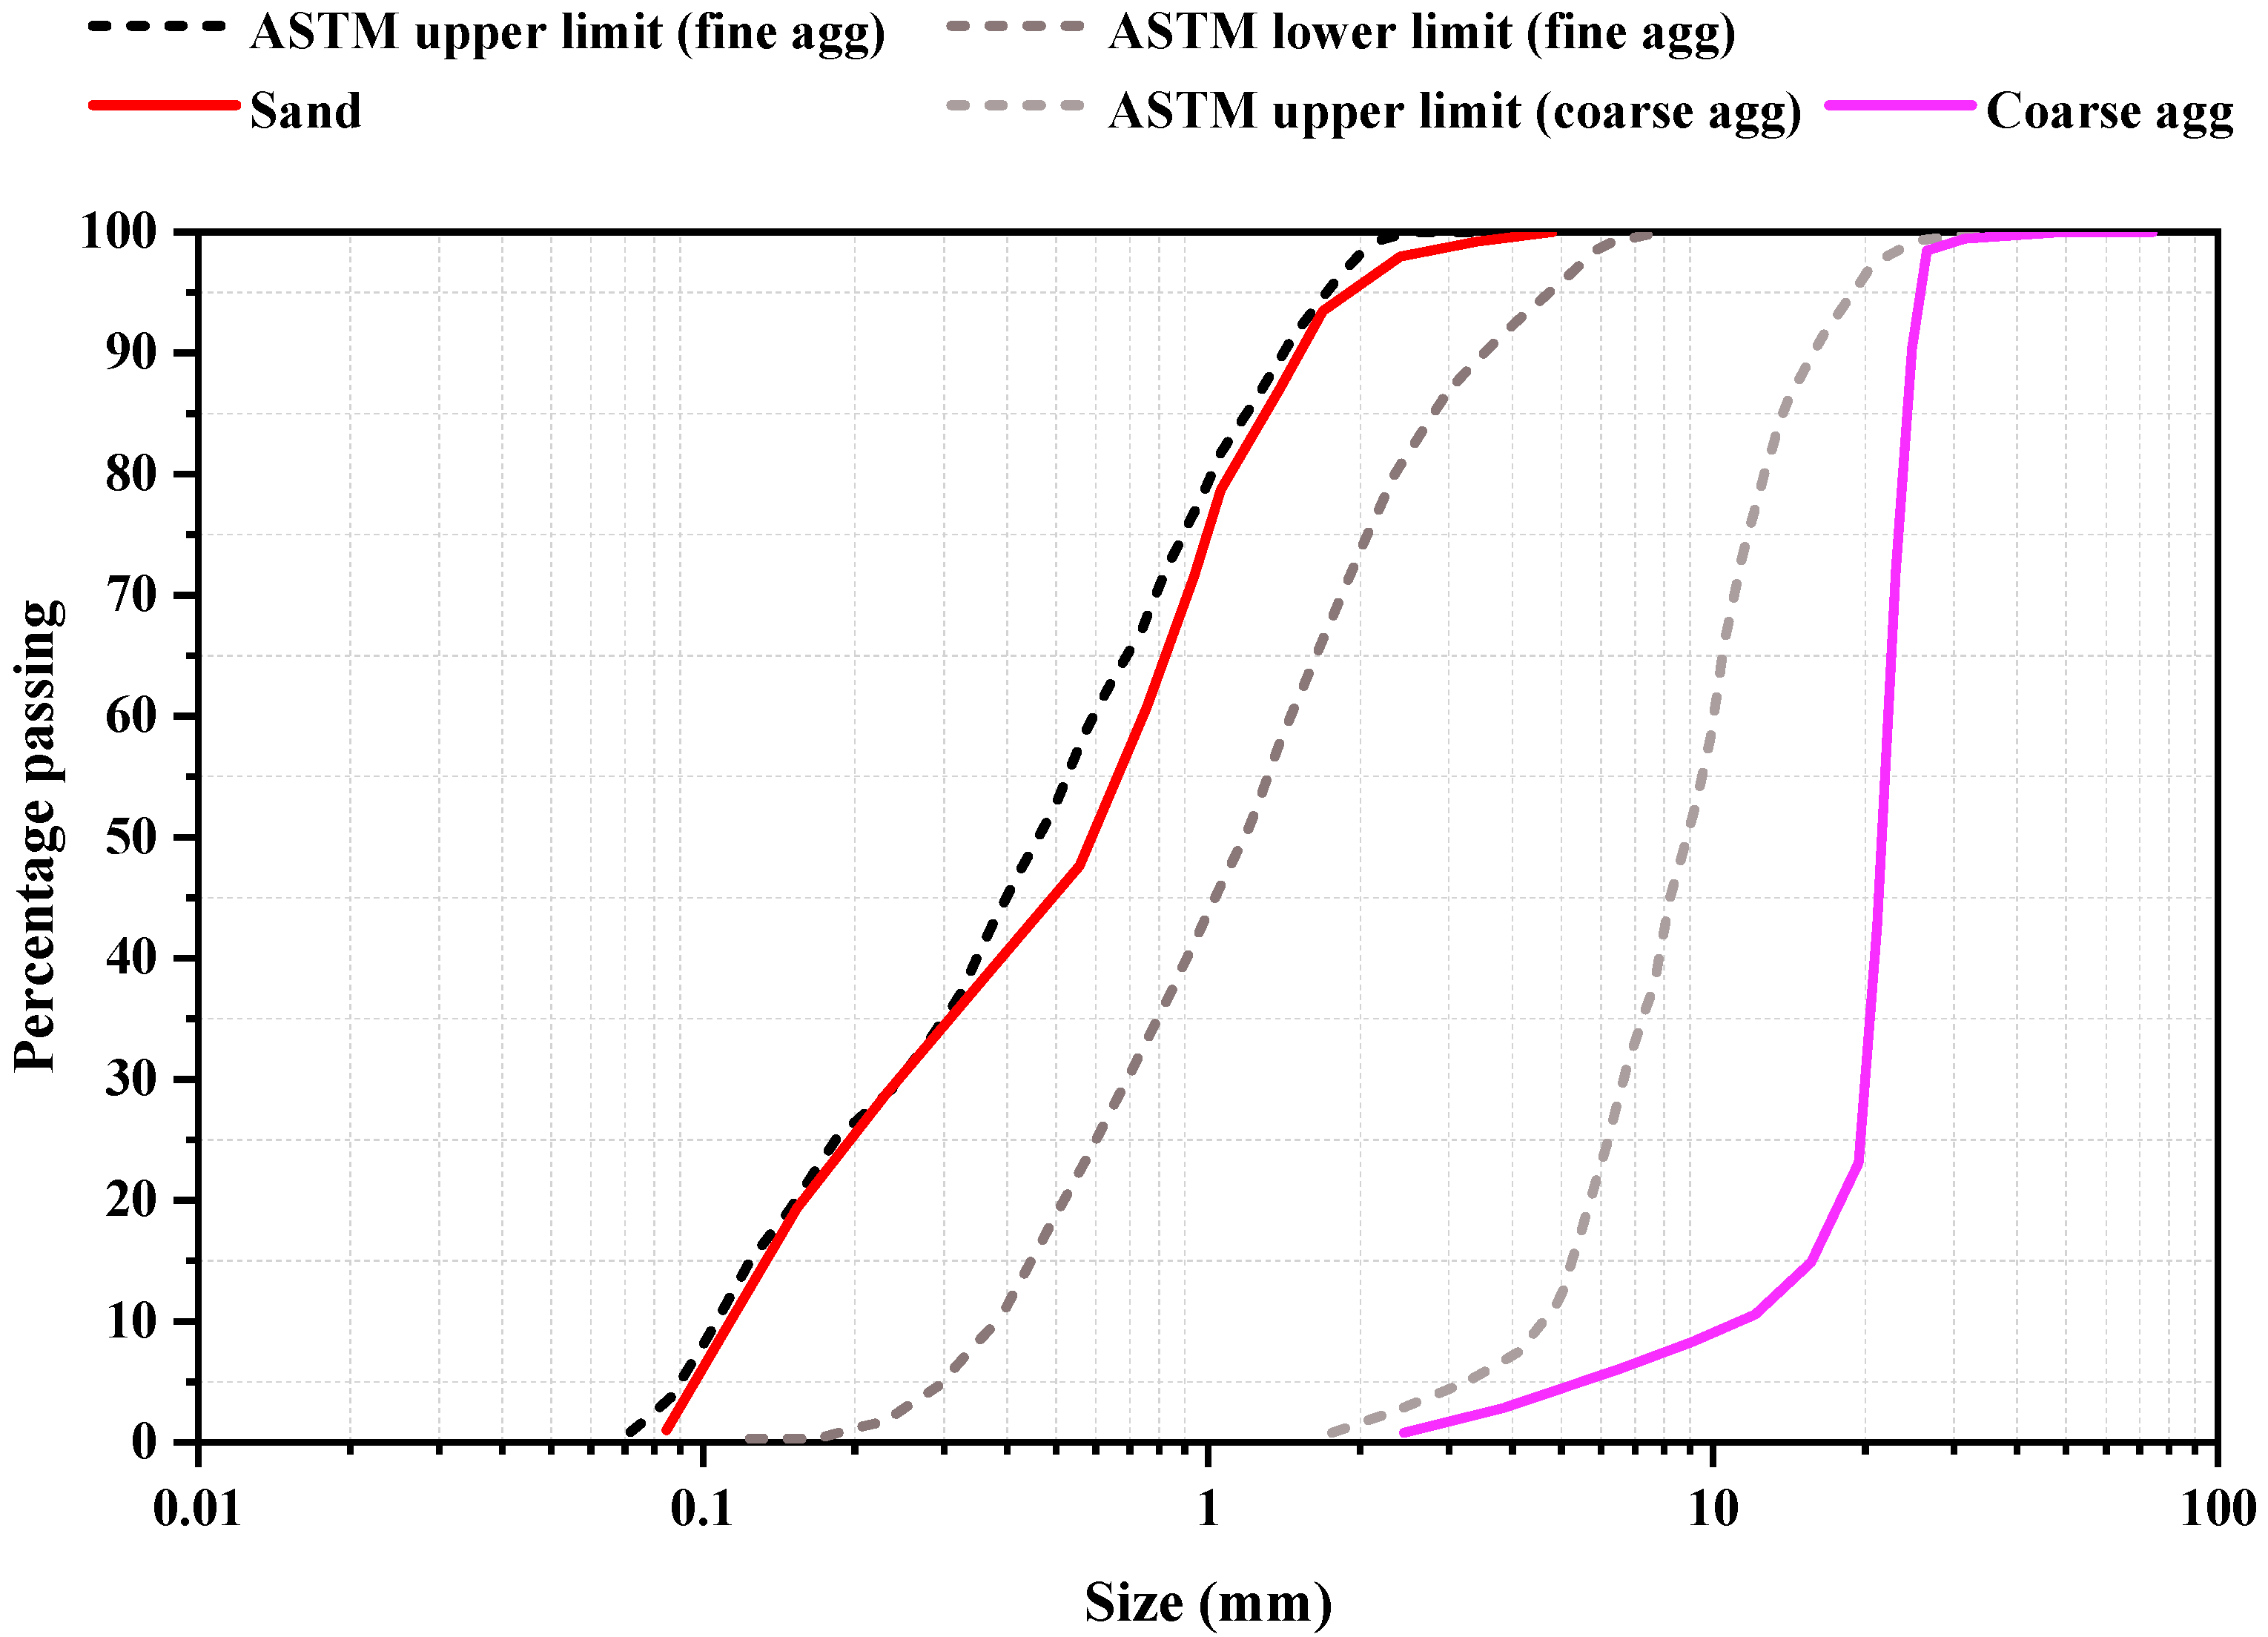
Figure 4 depicts the gradation curve of coarse and fine aggregate derived from the sieve analysis, complying with ASTM C33 [55]. The graph also represents the comparison of used materials with the standard ASTM lower and upper limit for coarse and fine aggregates. As a high-range water-reducing admixture, R1000 superplasticizer was utilized that is dark brown, chloride-free sulfonated naphthalene formaldehyde, which can dissolve in water and is 40% solid content with 1.2 specific gravity. Potable water was used to make all of the concrete combinations.

3. Experimental Program

3.1. Mix Proportioning for the Specimens

This experimental investigation was done for five concrete mixes prepared by altering the water–binder ratio and superplasticizer concentrations. The water–binder ratio and the superplasticizer remained constant at 0.35 for all concrete mixes, which are about 0.5% of the cement on a weight basis. Five mixtures of the concrete were generated in the laboratory to conduct this research. The initial mix was termed the reference (control) mix, as it was prepared with a conventional mix design and without any RHA, and was designated as RHA0 for this investigation. The remaining four mixes had the cement substituted by 5%, 10%, 15%, and 20% RHA and were termed RHA5, RHA10, RHA15, and RHA20, respectively. The concrete mixtures with various rice husk ash percentages are demonstrated in Table 3.

3.2. Preparing Specimens and Curing

All concrete mixes were designed with a water–binder ratio of 0.275. A 0.5% weight-based addition of superplasticizer was made to the cement. According to ASTM C685M-17 [56], the concrete specimens were prepared by mixing all materials in the correct proportions. Free-fall mixing machines with fixed drums were used in this case. The specimens were prepared and cured in accordance with ASTM C192M-19 [57] mixing procedures.
The compressive strength tests were carried out on a cube specimen of 100 mm × 100 mm × 100 mm, whereas the splitting tensile strength tests were performed on a cylindrical specimen, with a diameter of 100 mm and a height of 200 mm. The flexural strength was determined utilizing 100 mm × 100 mm × 500 mm prisms prepared in the lab. The concrete in the molds was temped in three stages, while casting to achieve optimal compaction and void elimination. Before demolding, all samples were allowed to stand for 24 h to ensure they were sufficiently hardened. The samples were removed from the molds and labeled for accurate recordkeeping after 24 h. Then, all the specimens emerged in curing tanks completely at 27 ± 2 °C ambient temperatures for 7, 28, and 56 days.

3.3. Testing Methods

The slump test was performed for the reference and other mixtures employing the ASTM C-143 [58] standard, to assess the effect of RHA on concrete workability. In addition, the compacting factor test was performed in compliance with BS EN 12350-4:2009 [59], to further comprehend the workability of concrete mixtures. In this investigation, the density of the concrete mix was evaluated per BS EN 12390-7:2009 [60]. In contrast, the initial surface absorption test was utilized for determining the surface absorption of the concrete integrating various levels of RHA, according to BS 1881-208:199 [61]. The compressive strength was evaluated at 7, 28, and 60 days by employing a 100 mm × 100 mm × 100 mm cube, in conformance with the BS EN 12390-3:2009 standard [60]. The splitting tensile strength test was carried out on 100 mm × 200 mm cylinders, in compliance with BS 1881-117:1983 [62], whereas BS EN 12390-5:2019 [63] was adopted for assessing the flexural strength of concrete, via a simple prism of 100 mm × 100 mm × 500 mm in size, employing third-point flexural loading at 7, 28, and 56 days. Figure 5 shows all testing setups considering the fresh tests; hardened tests in the laboratory maintain the mentioned standard configurations.

4. Results and Discussion

4.1. Fresh Properties

4.1.1. Slump and Compacting Factors

Figure 6a provides a graphical illustration of the compacting factors and slump values of all concrete mixes. According to the results, the slump value tended to decline for the rising concentration of RHA in the concrete mix. The slump of the reference mix with 0% RHA was determined to be around 56 mm, whereas the slump of RHA5 was reported to be 47 mm, which is 9 mm smaller than the reference mix. Furthermore, for 10%, 15%, and 20% RHA-incorporating concrete, the slump values were around 39.5 mm to 34 mm, 30.5 mm to 16.5 mm, and 22 mm to and 25.5 mm, respectively, lower than the RHA0 concrete mix.
The compacting factor test of concrete mixture, equivalent to the slump test, exhibits a downward tendency when the proportion of RHA increases, as shown in Figure 6a. The value of the compacting factor for the reference mix RHA0 was about 0.943, whereas for the RHA5, RHA10, RHA15, and RHA20 mixes, it was about 0.911, 0.895, 0.88, and 0.865, respectfully. The equivalent slump values for the RHA-incorporated mixes were altered from 56 mm to 30.5 mm, based on the compacting factor of the concrete, as previously described. Furthermore, compared to the reference mix, the mixes incorporating 5%, 10%, 15%, and 20% RHA experienced a decline in compaction factor of 3.39%, 5.09%, 6.68% and 8.27%, respectively.

4.1.2. Fresh Density

The relation between the density and slump value of the concrete mixtures is depicted in Figure 6b. It can be seen that when the quantity of RHA was raised, the concrete density declined progressively. The density of these concrete mixtures was evaluated in the spectrum of roughly 2638 to 2467 kg/m3, with associated slump ranging from 56 to 30.5 mm. The density of the control sample was about 2638.125 kg/m3, whereas the 5%, 10%, 15%, and 20% RHA concrete mixes had densities of 2600.63 kg/m3, 2565 kg/m3, 2509.38 kg/m3, and 2466.875 kg/m3, respectively, exhibiting 1.42%, 2.77%, 4.88%, and 6.49% reduction compared to the RHA0 mix. These findings are consistent with the investigation of Dong et al. [64] and Ephraim et al. [65]. They found that when the proportion of rice husk ash increases, the density declines. Habeeb and Mahmud [66] investigated the mechanical behavior of rice husk ash concrete and discovered a gradual decline in density, ranging from 2347 to 2253 kg/m3. The reason behind the reduction is the reduced specific gravity of RHA. It is substantially lower than cement, leading to a decrease in mass per unit volume of the concrete mixes.

4.2. Mechanical Properties

4.2.1. Compressive Strength

Table 4 presents the compressive strength for all concrete mixes with various proportions of rice husk ash with reference to mean compressive strength, coefficient of variation (COV), standard deviation, standard error, and 95% confidence interval within 7, 28, and 56 days. It is observed from the table that the compressive strength varied from 13.23 to 22.92 MPa, 19.25 to 27.98 MPa, and 22.92 to 36.93 MPa on the 7th, 28th, and 56th days, respectively. Concrete’s standard deviation varied from 0.15 to 1.33, along with a coefficient of variation from 0.32% to 2.08% and a standard error of 0.09 to 0.77. At seven days, RHA20 possessed the minimum compressive strength of 41.476 MPa, including a 95% confidence interval of 40.87 MPa to 42.08 MPa, whereas RHA10 showed the maximum compressive strength of 47.04 MPa, including a 95% confidence interval of 46.89 MPa to 47.19 MPa. Similar results were found at 28 and 56 days, when the RHA20 had the minimum compressive strength of 61.50 MPa and 63.77 MPa, respectively, and RHA10 showed the best results of 68.92 MPa and 71.85 MPa, respectively.
Figure 7 illustrates the compressive strength of the test specimens incorporating a different proportion of RHA. Concrete’s compressive strength increased as the proportion of RHA climbed up to 10% RHA, and after that it dropped with the increment of RHA. Among all concrete mixtures, the RHA10 mix obtained the highest compressive strength, which was 47.04 MPa, 68.92 MPa, and 71.85 MPa for 7, 28, and 56 days, respectively.
Several researchers have suggested that the increase in compressive strength could be due to various factors, such as RHA’s microfilling ability and pozzolanic activity. Moreover, RHA is highly reactive; it reacts with calcium hydroxide (a byproduct of cement hydration) and produces additional C-S-H. The additional C-S-H reduces the porosity of concrete by filling the capillary pores, thus improving the concrete microstructure in the bulk paste matrix and transition zone, leading to increased compressive strength.
A decrease in compressive strength was observed with mixes containing more than 10% of RHA. Various researchers also reported such a trend in strength. Kannan et al. [67] reported that the compressive strength of SCC blended with 15% RHA was higher than that of normal SCC. As per the findings of Chopra et al. [68], the compressive strength increases with increases in the percentage of RHA up to 15% replacement; after that, the strength starts to decrease. The reason behind this could be that the amount of silica available in the hydrated blended cement matrix was probably too high, and the amount of the produced C-H was most likely insufficient to react with all the available silica. As a result, some amount of silica was left without any chemical reaction [68]. Another reason could be that due to the replacement of cement with RHA, water demand is increased, adversely affecting the concrete’s strength [69,70].
Figure 8 illustrates the change (%) in strength properties for a different proportion of the RHA incorporation mix than the reference mix. According to findings, RHA5 and RHA10 increase the concrete’s compressive strength, whereas succeeding RHA mixtures possess lower strength than the reference mixture RHA0. The RHA10 concrete mix maintained the most significant improvement of 2.25%, 6.01%, and 7.16% at 7, 28, and 56 days, respectively, whereas the RHA20 concrete mix showed approximately 9.83%, 5.39%, and 4.88% of compressive strength reduction at 7, 28 and 56 days, respectively, in comparison with the reference mix RHA0. Similar findings was obtained by Alex et al. [26], who claimed that the 10% RHA inclusion leads to a significant compressive strength rising with respect to the reference mix.

4.2.2. Splitting Tensile Strength

Table 5 summarizes the splitting tensile strength for concrete mixes with various proportions of rice husk ash, with reference to mean tensile strength, coefficient of variation (COV), standard deviation, standard error, and 95% confidence interval within 7, 28, and 56 days. The result demonstrates that the outcomes of splitting tensile strength fluctuated from 4.19 MPa to 4.71 MPa, 6.19 MPa to 6.79 MPa, and 6.39 MPa to 7.16 MPa on the 7th, 28th, and 56th day, respectively. Concrete’s standard deviation varied from 0.01 to 0.56, along with a coefficient of variation differing from 0.15% to 1.33% and a standard error of 0.01 to 0.03. At 7 days, RHA20 showed the minimum result, of about 4.19 MPa including a 95% confidence interval of 4.15 to 4.23 MPa, whereas RHA10 had the greatest tensile strength of 4.71 MPa, including a 95% confidence interval of 4.69 to 4.74 MPa. Similar results were found at 28 and 56 days, when RHA20 possessed the minimum results of 6.19 MPa and 6.38 MPa, respectively, while RHA10 depicted the maximum results of 6.79 MPa and 7.16 MPa, respectively.
Figure 9 shows a graphical representation of splitting tensile strength for the concrete mixtures with increasing RHA concentrations at 7, 28, and 56 days. It is observed that when the proportion of RHA in the mix proportion grew up to 10%, the splitting tensile strength climbed, and, afterwards, it dropped at an acceptable rate. At 7, 28, and 56 days, the reference mix RHA0 produced splitting tensile strengths of 4.59 MPa, 6.50 MPa, and 6.68 MPa, respectively. The RHA10 mix had the greatest splitting tensile strength of 4.71, 6.79, and 7.16 MPa at 7, 28, and 56 days, respectively.
Compared with the reference concrete, RHA20 possessed a splitting tensile strength of 4.19, 6.19, and 6.37 MPa at 7, 28, and 56 days, respectively, which is comparable to the findings of earlier researchers [40,41,66,71]. They described that the lesser RHA percentages resulted in a greater splitting tensile strength than the reference concrete, whereas greater RHA levels led to reduced strength. The rise in the pozzolanic reaction among the RHA and the cement constituents in the samples provides more tensile strength for concrete. Due to the tiny particles of the RHA, the porous areas inside the concrete turns into a denser matrix. Therefore, the bonding between the aggregates and the cement paste becomes stronger, providing the additional strength required to withstand the tension.
Figure 10 demonstrates the change (%) in splitting tensile strength for the different proportions of the RHA-incorporated mix, compared to the reference concrete RHA0. The outcomes of the tests revealed that RHA5 and RHA10 enhanced the concrete’s splitting tensile strength; nevertheless, consecutive RHA mixtures displayed lower strength than RHA0. Compared with the reference concrete mix, the RHA10 mix had the maximum splitting tensile strength enhancement of 2.45%, 4.52%, and 7.03% at 7, 28, and 56 days, respectively, while the RHA20 mix exhibited approximately 8.92%, 4.81%, and 4.58% of strength reduction at 7, 28, and 56 days, respectively. Saraswathy and Song [47] revealed that the splitting tensile strength improvement continued until 25%, while the maximum percentage enhancement recorded in the concrete containing 15% RHA was about 9.58% at 28 days.

4.2.3. Flexural Strength

The flexural strength for RHA-incorporated concrete mixes regarding mean flexural strength, coefficient of variation (COV), standard deviation, standard error, and 95% confidence interval within 7, 28, and 56 days are depicted in Table 6. The research revealed that when the proportion of the RHA grew to 10%, the concrete’s flexural strength increased and eventually decreased with the RHA percentage increment. The flexural strength changed from 4.87 MPa to 5.33 MPa, 7.69 MPa to 8.15 MPa, and 8.97 MPa to 9.45 MPa on the 7th, 28th, and 56th day, respectively. The standard deviation of the examined sample spanned from 0.01 to 0.31, along with a COV varying from 0.26 % to 5.57% and a standard error of 0.01 to 0.18. At 7 days, the RHA10 showed the optimal flexural strength of around 5.33 MPa, including 95% confidence interval of 5.28 MPa to 5.35 MPa. In contrast, the RHA20 had a minimal flexural strength of 4.87 MPa, including a 95% confidence interval of 4.78 MPa to 4.94 MPa. Analogous outcomes were detected at 28, and 56 days, where the RHA10 possessed the strength of 8.15 MPa, and 9.45 MPa at 7 days, respectively, while the RHA20 had the results of 7.69 MPa and 8.97 MPa, respectively at seven days.
The obtained flexural strength for all the concrete mixes with the varying RHA concentrations at 7, 28, and 56 days is illustrated in Figure 11. The flexure strength was observed to rise when the RHA’s proportion climbed until 10% and eventually declined with the increment of the RHA percentage. Flexural strength exhibits a similar pattern to compressive and splitting tensile strengths. In the reference mix, RHA0 produced the flexural strength of 5.18 MPa, 7.94 MPa, and 9.10 MPa at 7, 28, and 56 days, respectively. Comparing among all other samples, the RHA10 mix was found to exhibit the maximum flexural strength of 5.33, 8.15 and 9.45 MPa at 7, 28 and 56 days, respectfully. Conversely, the RHA20 mix had the minimum flexural strength of 4.87, 7.69, and 8.97 MPa at 7,28, and 56 days. This observation is harmonic with other studies [40,66,72].
Figure 12 shows the % improvement in the flexural strength of the mixtures with respect to the reference mix. The RHA10 possessed the maximum flexural strength and surpassed the reference mix by 2.72%, 2.71% and 3.82% at 7, 28 and 56 days, respectively. Contrarily, the RHA20 concrete mix drifted from the reference mix by 6.09%, 3.02%, and 1.49% at 7, 28, and 56 days, respectively, in terms of flexural strength. The elevated pozzolanic interaction between the binder cement and constituents of RHA in samples and the packing efficiency of the RHA fine particulates might be the key reasons. Furthermore, this study was conducted using a low water/cement ratio of 0.35, which may result in increased flexural strength.

4.3. Initial Surface Absorption of Concrete

Figure 13 and Figure 14 depicts 56- and 91-day initial surface absorption test of the concrete integrating various levels of RHA. It can be seen that when the proportion of RHA substitution increases, the permeability declines. Furthermore, the permeability of RHA decreased as the measurement frequency increased for 10, 30, 60, and 120 min, respectively, owing to the saturation of the gaps throughout the testing period. At 56 days, after 10 min from the commencement of the experiment, the reference RHA0 specimen acquired 0.24 mL/m2 s, which then reduced to 0.19 mL/m2 s after 30 min of measuring. Surface absorption for 10%-RHA replacement fell to 0.16 mL/m2 s at the 10 min mark, then steadily climbed to 0.26 and 0.29 mL/m2 s for concrete with 15% and 20% RHA (Figure 13). On the other hand, the findings of the 91-day surface absorption showed the same decrease as the 56-day absorption. After 10 min of the test, the reference RHA0 samples obtained 0.21 mL/m2 s, which decreased to 0.16 mL/m2.s after 30 min of measurement. In addition, at the 10 min mark, surface absorption for sample RHA10 decreased to 0.13 mL/m2, while for samples RHA15 and RHA20, it rose to 0.24 mL/m2 and 0.26 mL/m2, respectively (Figure 14). Dhir et al. [73] observed identical results in the initial surface absorption of concrete (ISAT) values of concrete samples. This could be because of decreased pores inside the structure, since the pozzolanic material (RHA) fills throughout the blank spaces, lowering the concrete’s permeability. This outcome is consistent with the fact that adding RHA reduced the absorption feature, and this decline improved as the RHA proportion rose [74].

4.4. Characterization of Microstruicture

Microstructural analyses of concrete specimens were done by SEM (scanning electron microscope). The original microstructure and morphology of the hydrate mixes were visible on the crushed sample surfaces. Gold-coated crushed samples were placed on the brass stubs using carbon adhesives. Figure 15 shows the micrographs of (a) RHA0 (control), (b) RHA10, and (c) RHA20 at a 10 µm scale. The first one shows the irregular edges and platelets of cementitious particles, due to the incomplete activation of the superplasticizer. Clearly, some differences are identified between the graphs after using the RHA at various concentrations. Figure 15b describes the porous conditions using RHA. It shows dense microstructures with fewer cracks at an ambient temperature. The 10% replacement of RHA improves the microstructure with spherical shapes of concrete mix by filling pores in the next graph. Another one, incorporated with 20% RHA, develops homogeneous and dense microstructures with very few pores, resulting in good characteristics. Agglomerated states can be seen here, but the flakiness helps the concrete to consider the reduction in sorptivity value. The amount of C-A-S-H gel in the matrix rises with the addition of RHA. RHA produced dense particle packing with refined pore sizes and, as a result, dense microstructure, since it is good in quality. The micro-filler effect of RHA, which stops the pores and lowers mix permeability, causes this decrease in sorptivity value. The other literature considering RHA replacement with microstructural analysis gives satisfying results that justify this current study [75]. The siloxy bridges (Si-O-Si) chains formed by the SiO2 content of RHA decrease the gaps of the C-S-H gel and firmly link the particles, creating the dense microstructure visible in the micrograph. These micrographs support the findings from the preceding section’s analysis of the mechanical strength of the ideal combination.

4.5. Relationships between the Strengths

The interrelationship between the compressive and flexural strength of the concrete incorporating various proportions of RHA for 7, 28, and 56 days is illustrated in Figure 16. The correlation can be used for the flexural strength’s prediction of the concrete mixtures incorporating RHA. Various standards prescribe different alternative formulae to forecast flexural strength by relying on the compressive strength. ACI 363R, ACI 318, CEB-FIP, and AS 3600 [76,77,78,79] standards were employed to determine the flexural strength of concrete, with respect to the different compressive strength formulas.
f f r = 0.60   f c     ( A S   3600 )
f f r = 0.62 f c     ( A C I   318 )
f f r = 0.94 f c     ( A C I   363 R )
f f r = 0.46   ( f c ) 2 / 3   ( C E B F I P )
where ffr = flexural strength (MPa), fc = compressive strength (MPa).
According to the relationship graph, the ACI 363R formula and the CEB-FIP formula are probably the best predictors of flexural strength among the other codes of standardized formulas for RHA-based concrete. Contrarily, AS 3600 showed the most significant deviation from the experimentally anticipated flexural strengths and significantly undervalued the flexural strength. The 0.96 coefficients of determination (R2) demonstrate a good linear correlation between the compressive and flexural strengths for various durations at 7, 28, and 56 days. The preferred formula for representing the relation between the compressive and flexural strength is as follows:
f f r = 0.6461   f c + 4.803
Likewise, Figure 17 highlights the correlation between the splitting tensile strength and compressive strength of the concrete mixes incorporating RHA. The forecast can be used in the finite element analysis to construct the RHA-based structural elements. This could improve materials and mix proportions without the need for expensive costs, long processing times, or bulky equipment. To forecast the splitting tensile strength depending on the compressive strength, ACI 363R, ACI 318, CEB-FIP, and AS 3600 [76,77,78,79] suggest Formulas (6)–(9), respectively.
f s t = 0.4   f c     ( A S   3600 )
f s t = 0.56 f c     ( A C I   318 )
f s t = 0.59 f c   ( A C I   363 R )
f s t = 0.3   ( f c ) 2 / 3   ( C E B F I P )
where fst = splitting tensile strength (MPa) and f’c = compressive strength (MPa).
It can be seen that amongst all the standards, the estimated values of ACI 363R showed the nearest value compared to the experimental ones, whereas AS 3600 showed the most prominent variation within the experimental results. A strong correlation was determined between compressive and splitting tensile strengths, with the coefficient of determination R2 = 0.99, indicating that 99% of the average tensile strength can be clarified through that linear correlation, while the residual 1% remains unexplained. In this investigation, the following formula can be advised for expressing the relationship between the splitting tensile and compressive strengths of RHA-incorporated concrete.
f s t = 0.0976   f c + 0.145

5. Environmental Impact and Cost–Benefit Assessment

Cement production accounts for around 10% of worldwide CO2 emissions [80,81,82]. Due to the activities involved in preparing raw materials, concrete, the world’s most widely used building material, has a substantial carbon footprint. Since OPC is the primary binding material of concrete, it is responsible for between 75% and 90% of the total CO2 emissions [82] produced by concrete. The awareness of Global Warming Potential (kgCO2-eq/kg material) has enabled the development of alternative binders to reduce concrete’s reliance on OPC as its primary binder.
Although using SCMs will undoubtedly lower the overall embodied CO2 emissions of concrete, the embodied CO2 emissions of different waste materials will vary. Regarding the present investigation, RHA was partially utilized as a binder to replace OPC. To highlight the impact of RHA on the overall embedded CO2 emissions of HSC, this study estimates the total CO2 emissions, by considering the equivalent CO2 releases for each material. These numbers were extracted from relevant research studies and are presented in Table 7.
The embodied GWP for each mixture was calculated by multiplying the weight of each ingredient required to manufacture one cubic meter of concrete by the embodied CO2 of each material and then adding the results. As seen in Figure 18, the OPC has the highest CO2 content compared to other materials. OPC is responsible for roughly 89.10% of the total CO2 emissions for the control mix (RHA0). This was significantly reduced by substituting 20% OPC with RHA (RHA20). For the RHA20 mix, the CO2 contribution of OPC input decreased from 492 to 393.6 kg-CO2/m3. In addition, RHA5, RHA10, RHA15, and RHA20 reduced 4.31%, 8.63%, 12.95%, and 17.27% of the CO2 emissions, respectively.
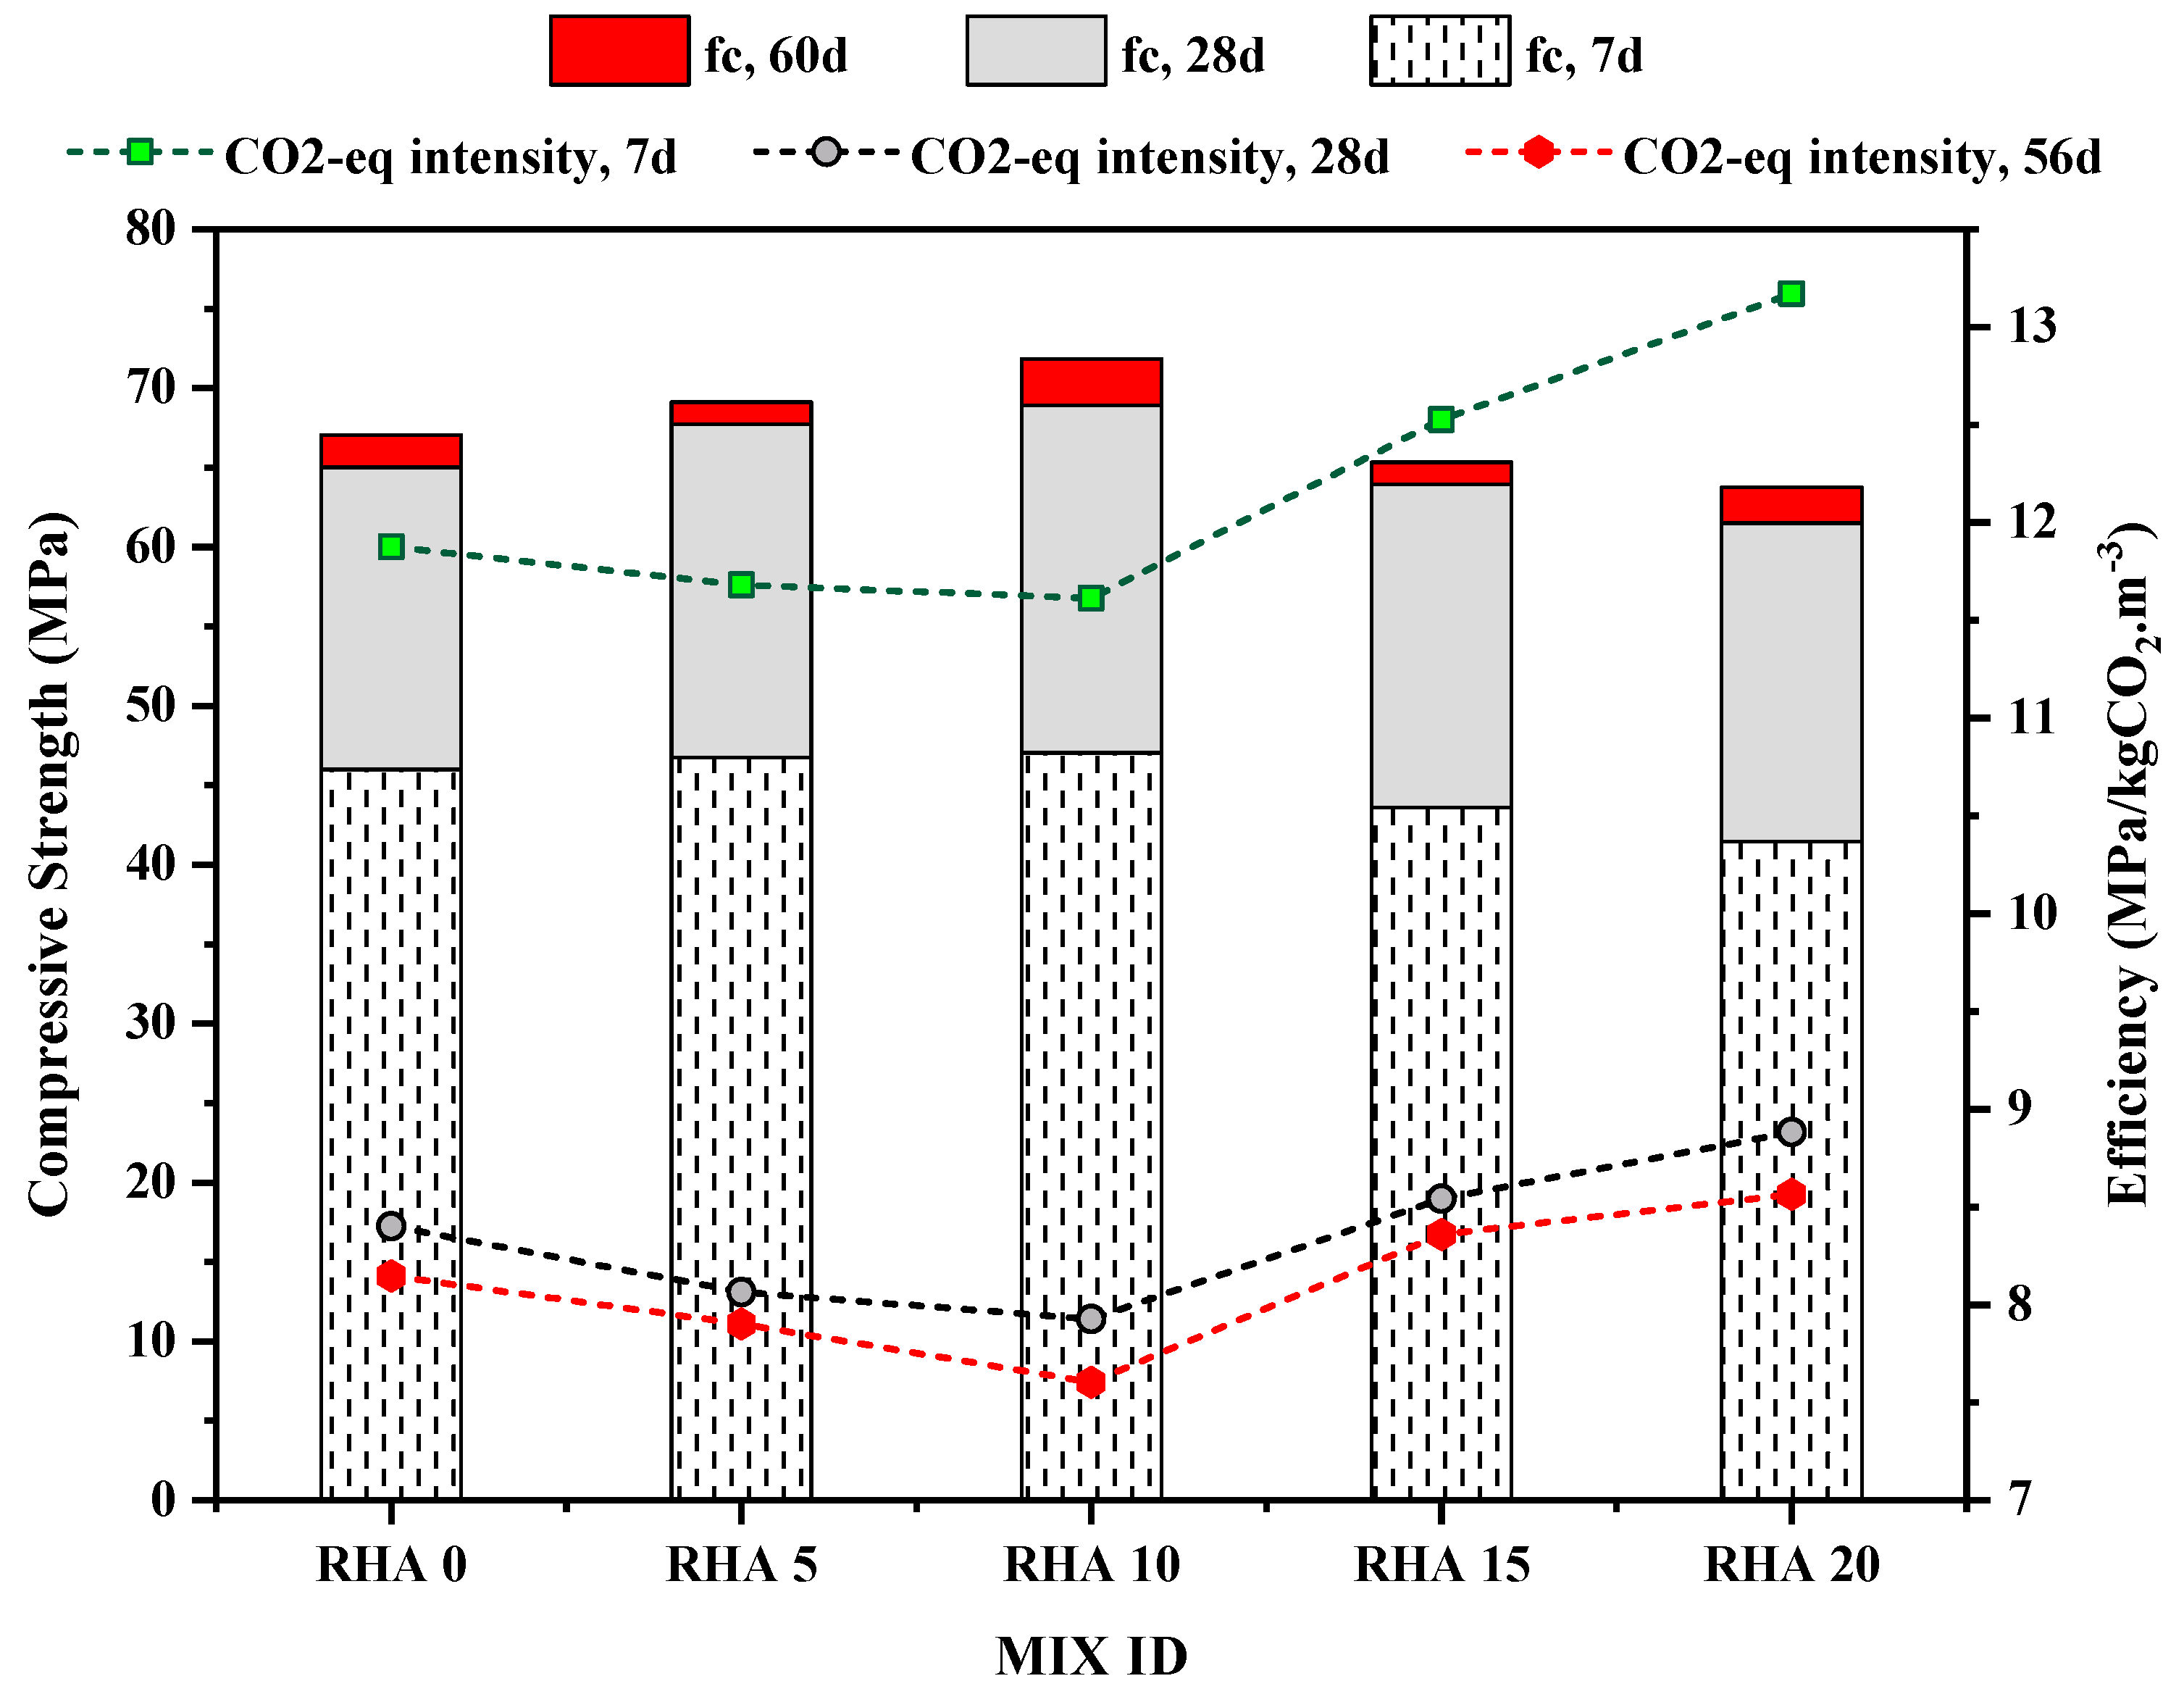
The eco-strength efficiency of concrete is another metric that may be applied to the environmental impact assessment for evaluation. Alnahhal et al. [88] used the term eco-strength efficiency, while Damineli et al. [89] referred to it as the CO2 intensity, which can be defined as the quantity of CO2 emissions produced per unit of performance. It was determined using Formula (11)
C i = C O 2 C s
where Ci represents the eco-strength efficiency, which is the intensity of CO2, CO2 represents the embodied carbon dioxide emissions released by the concrete mixes as determined using Table 4, and Cs represents the compressive strength.
The eco-strength efficiency of the various mixes is compared with their compressive strength to facilitate an organized and consistent comparison of the mixes. 
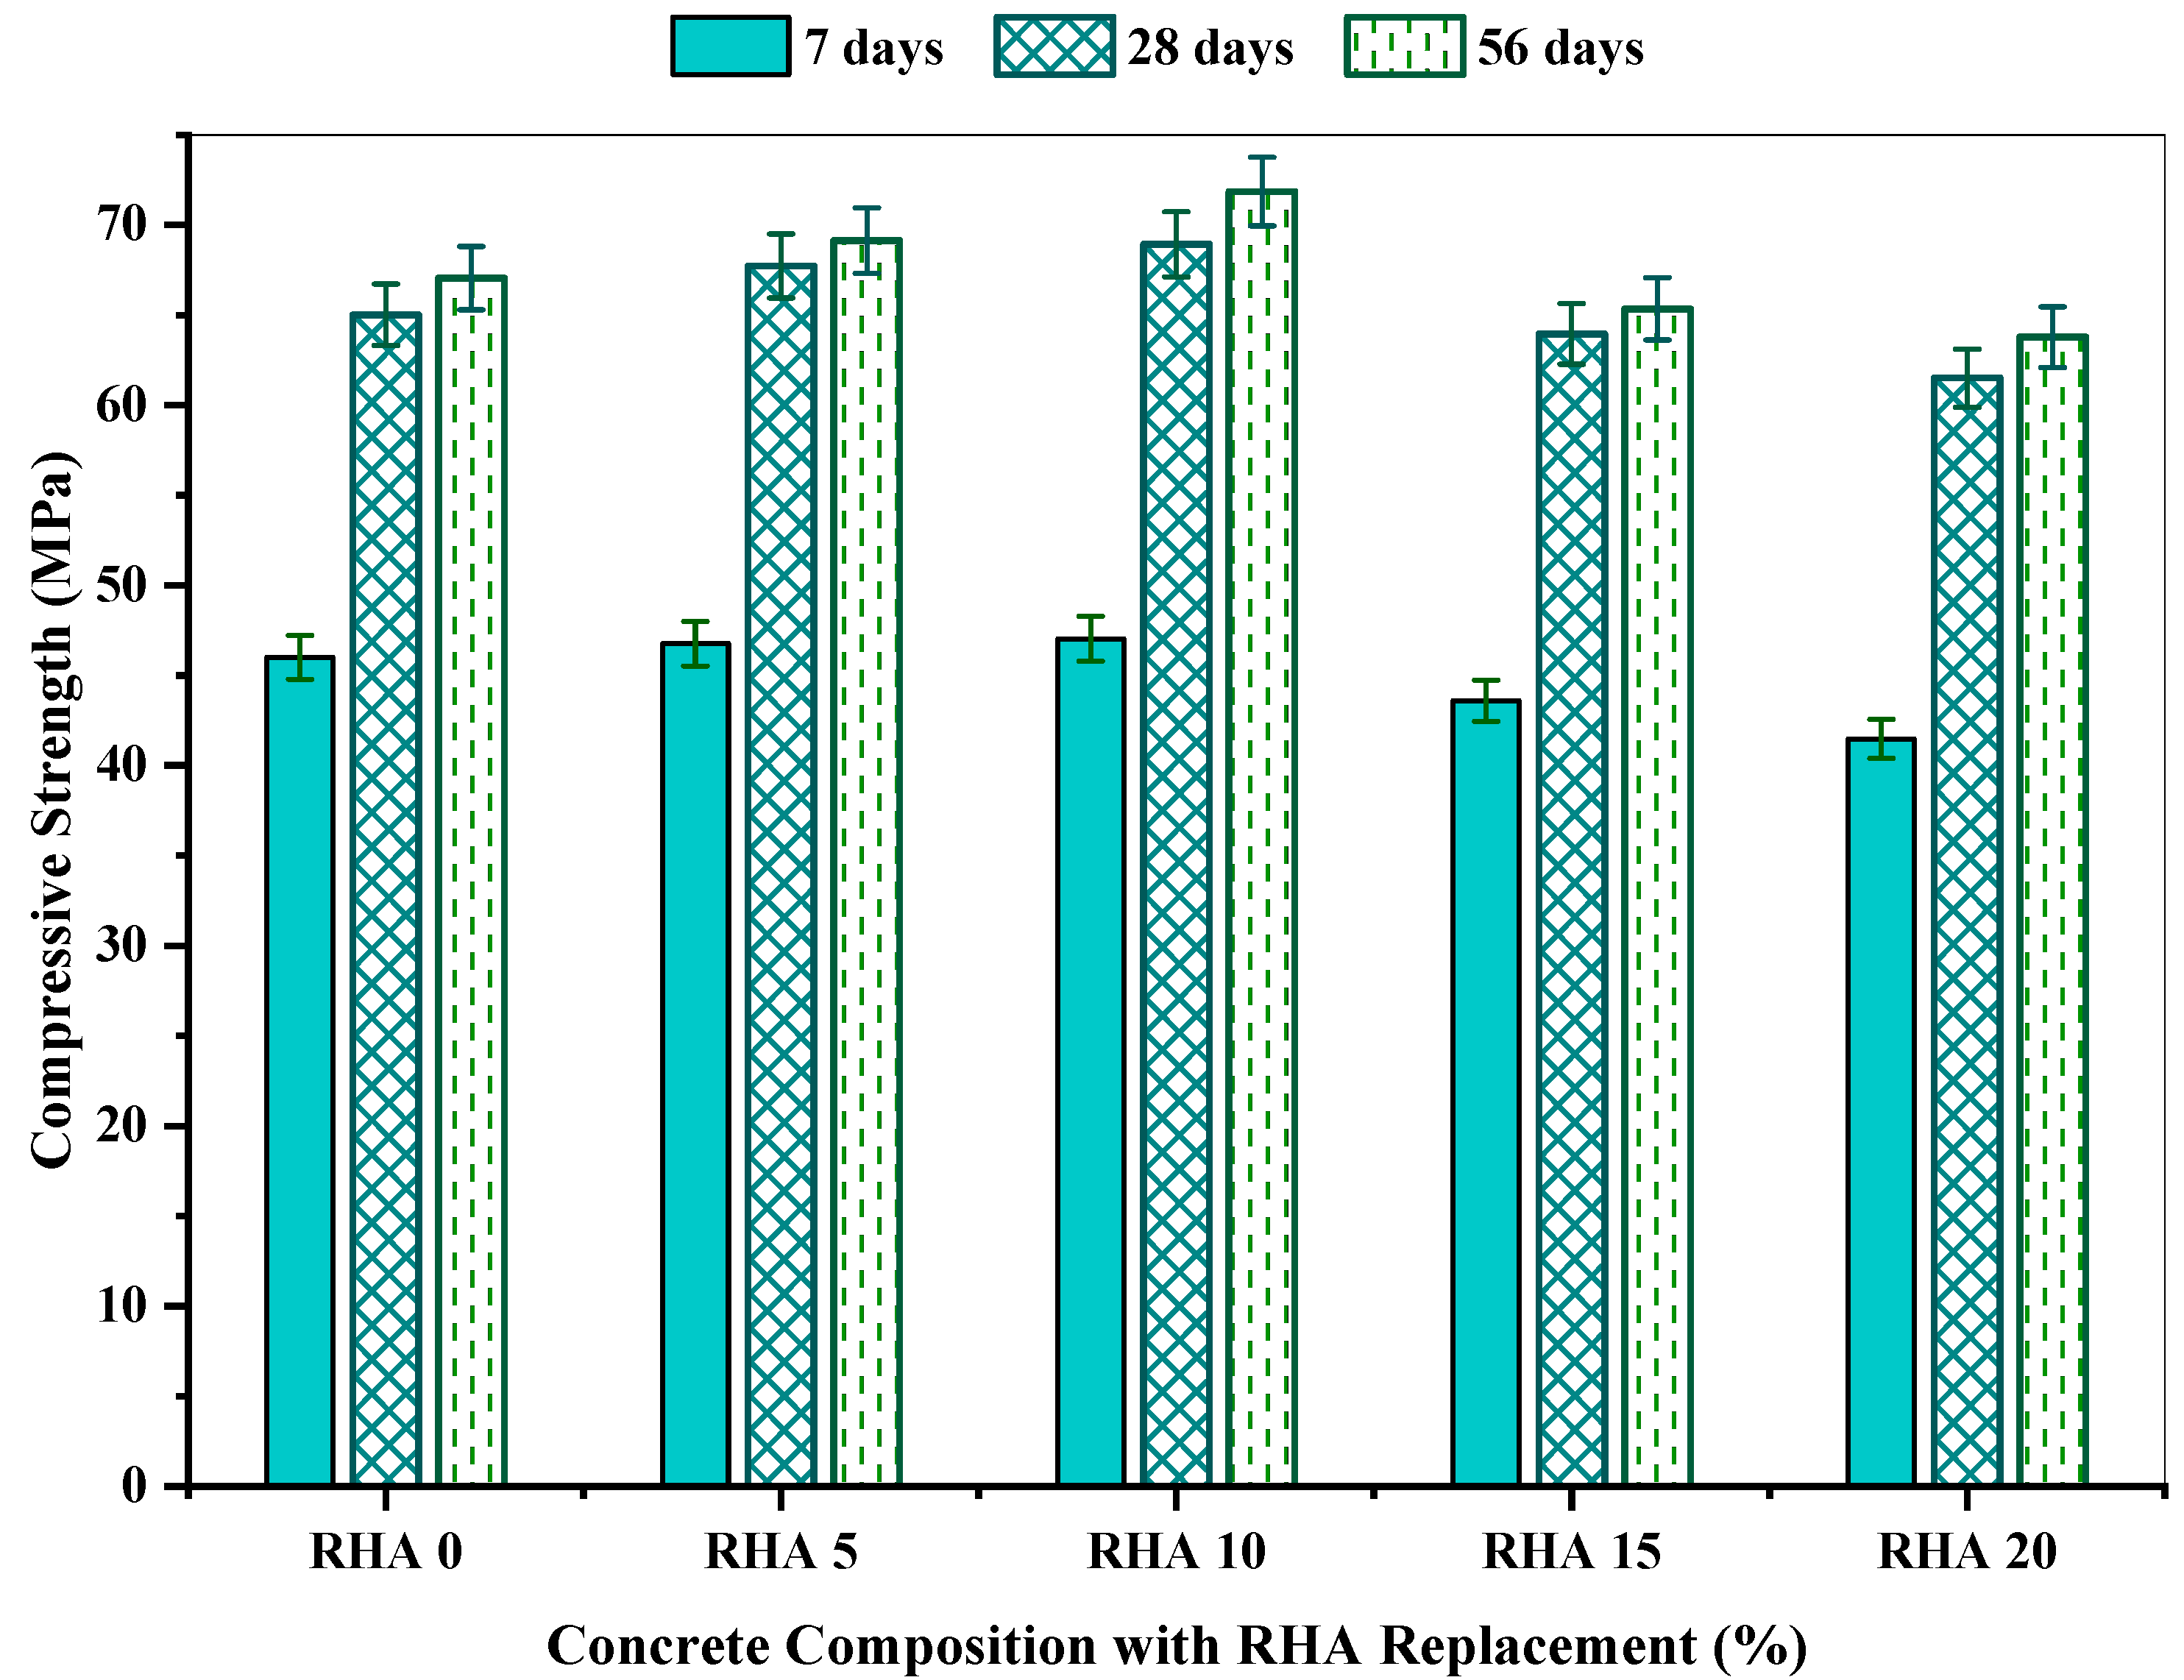
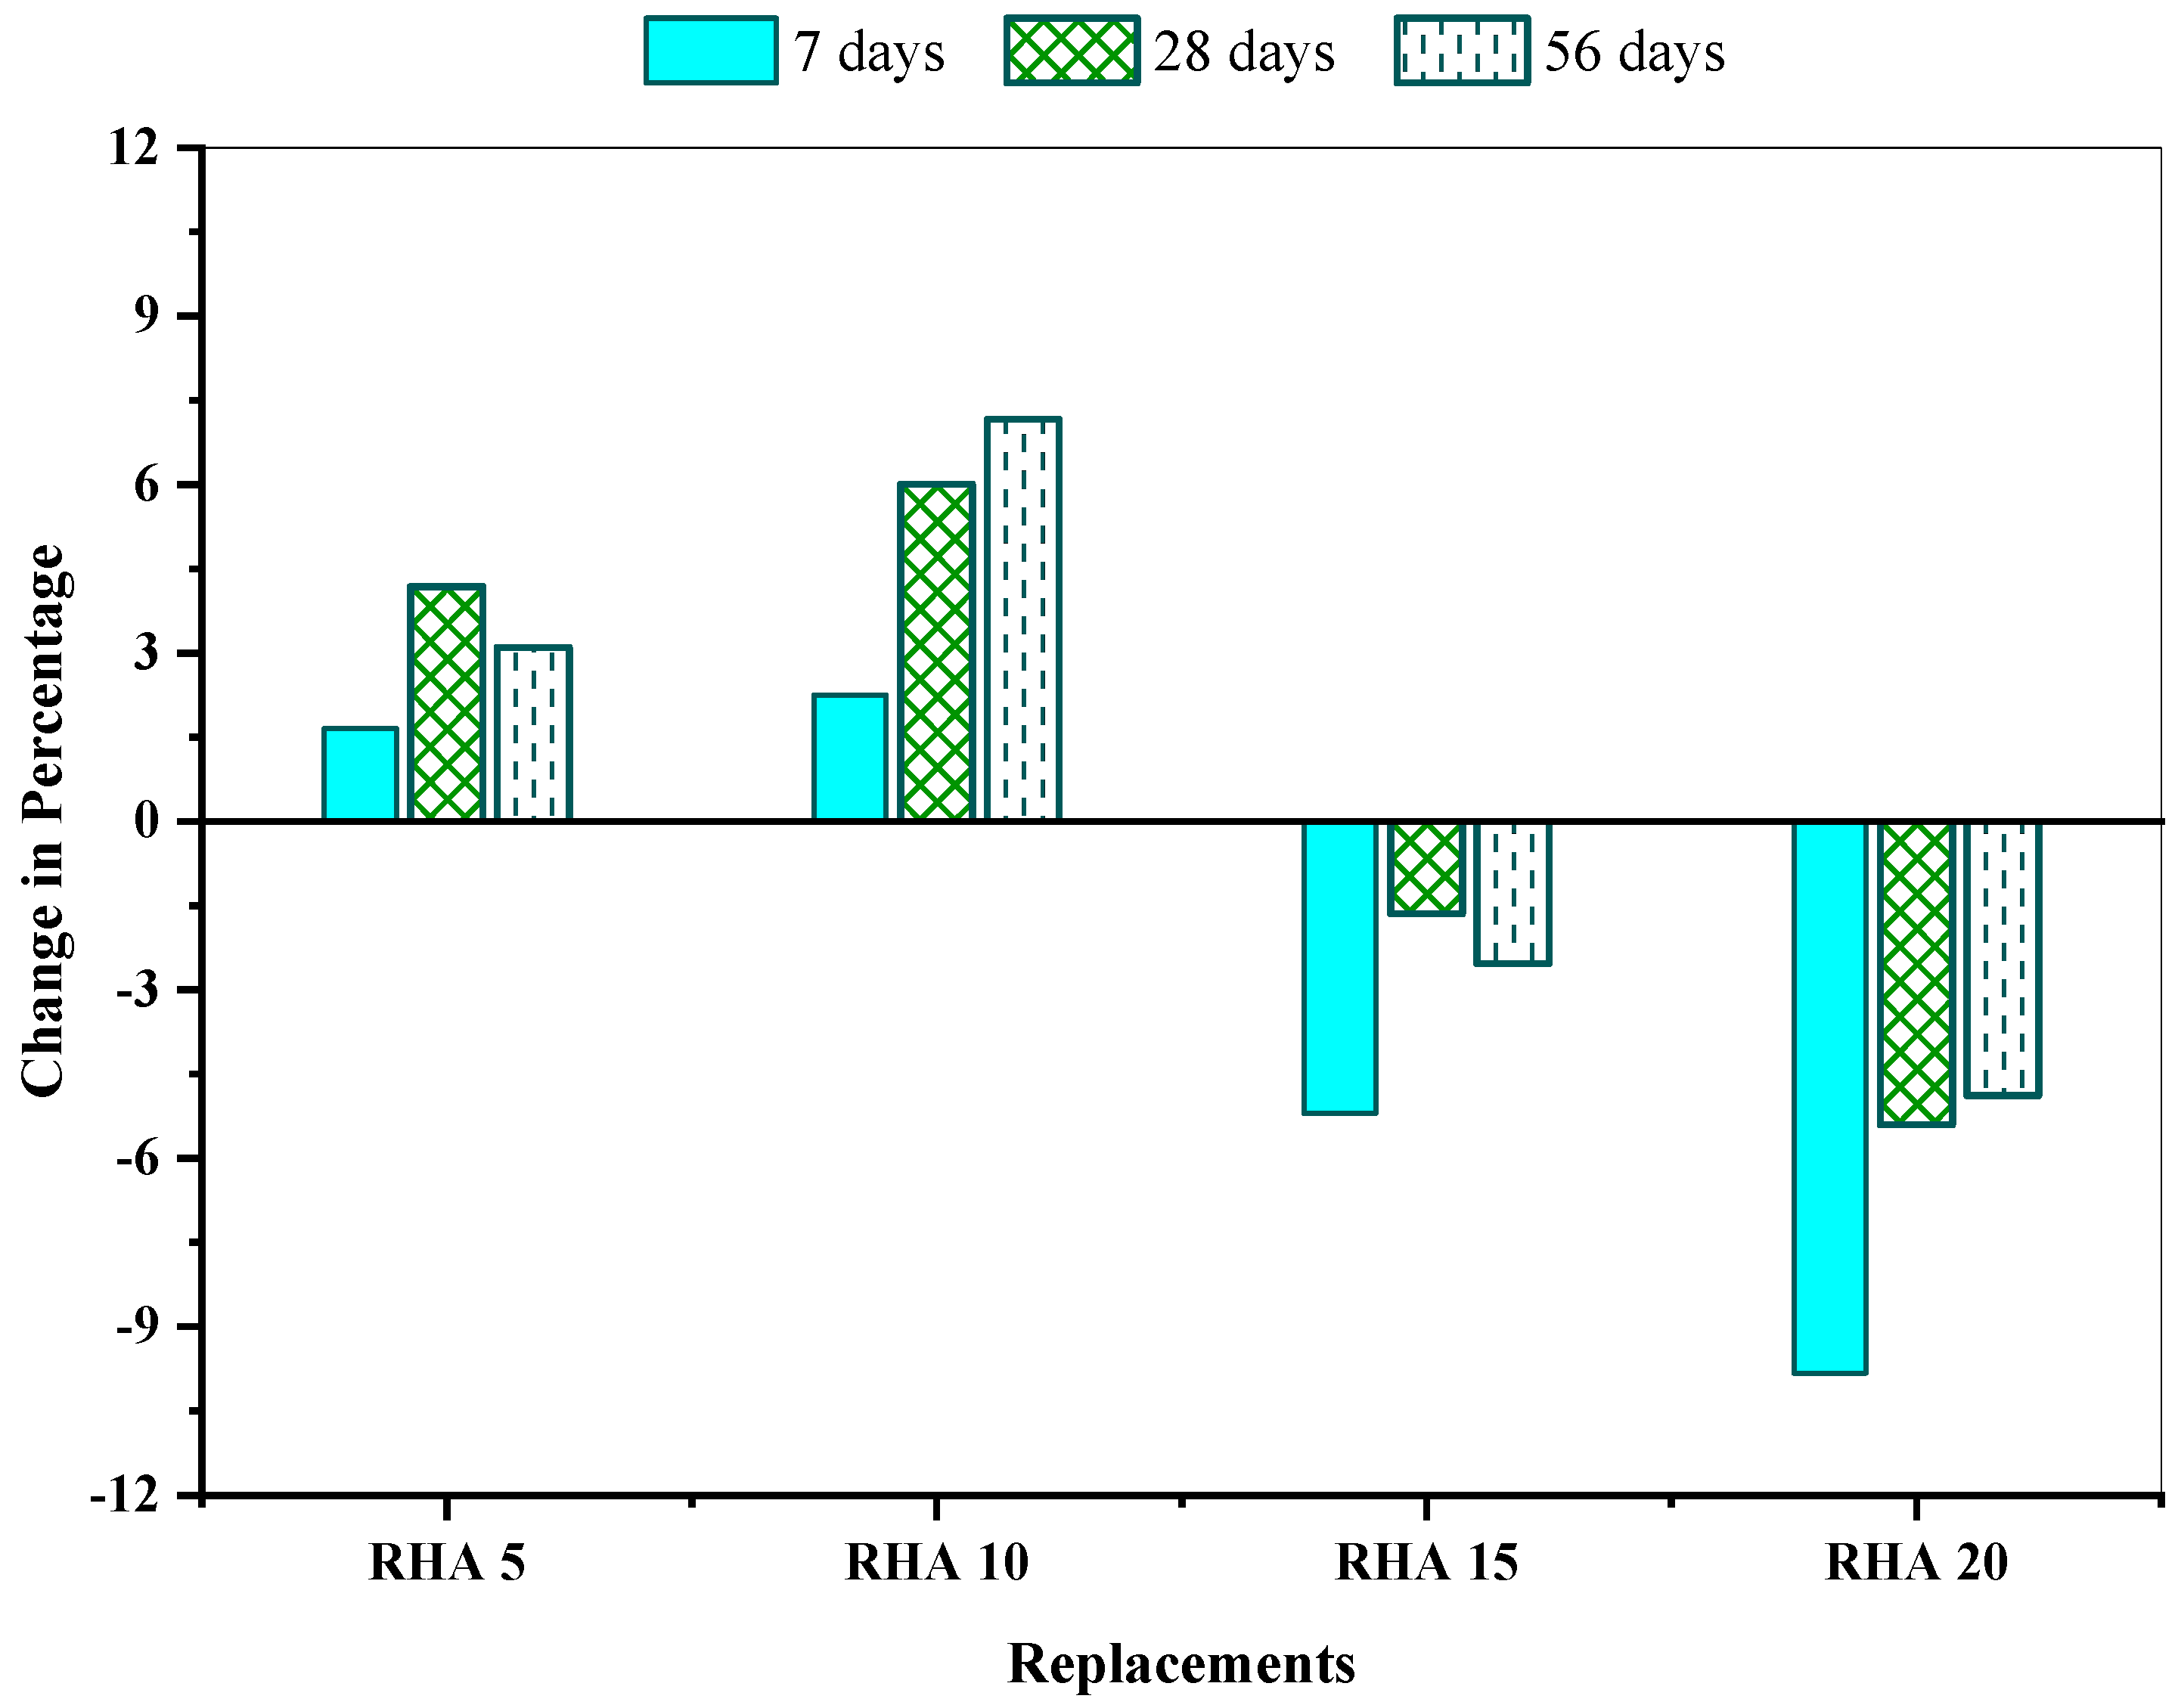
Figure 19 depicts the results of the study. The compressive strength values for 7 days, 28 days, and 60 days are represented by the bar chart from bottom to top, while the CO2 intensity is represented by the line along the secondary axis. The CO2 intensity allows for the evaluation of both the performance and contribution of concrete mixes to Global Warming Potential per their unit strength, which makes it a good predictor of the impact of concrete use (Damineli et al.) [89]. In most cases, the concentration of CO2 rises when there is a greater amount of Portland cement in the concrete mixture. Substituting cement with RHA, CO2 intensity can be reduced for a given strength, particularly at later ages. For instance, lowering the percentage of Portland cement from 100% (RHA0) to 20% (RHA20) resulted in a decrease in the CO2 intensity from 11.89 MPa/kgCO2-eq.m−3 to 8.1 MPa/kgCO2-eq.m−3.
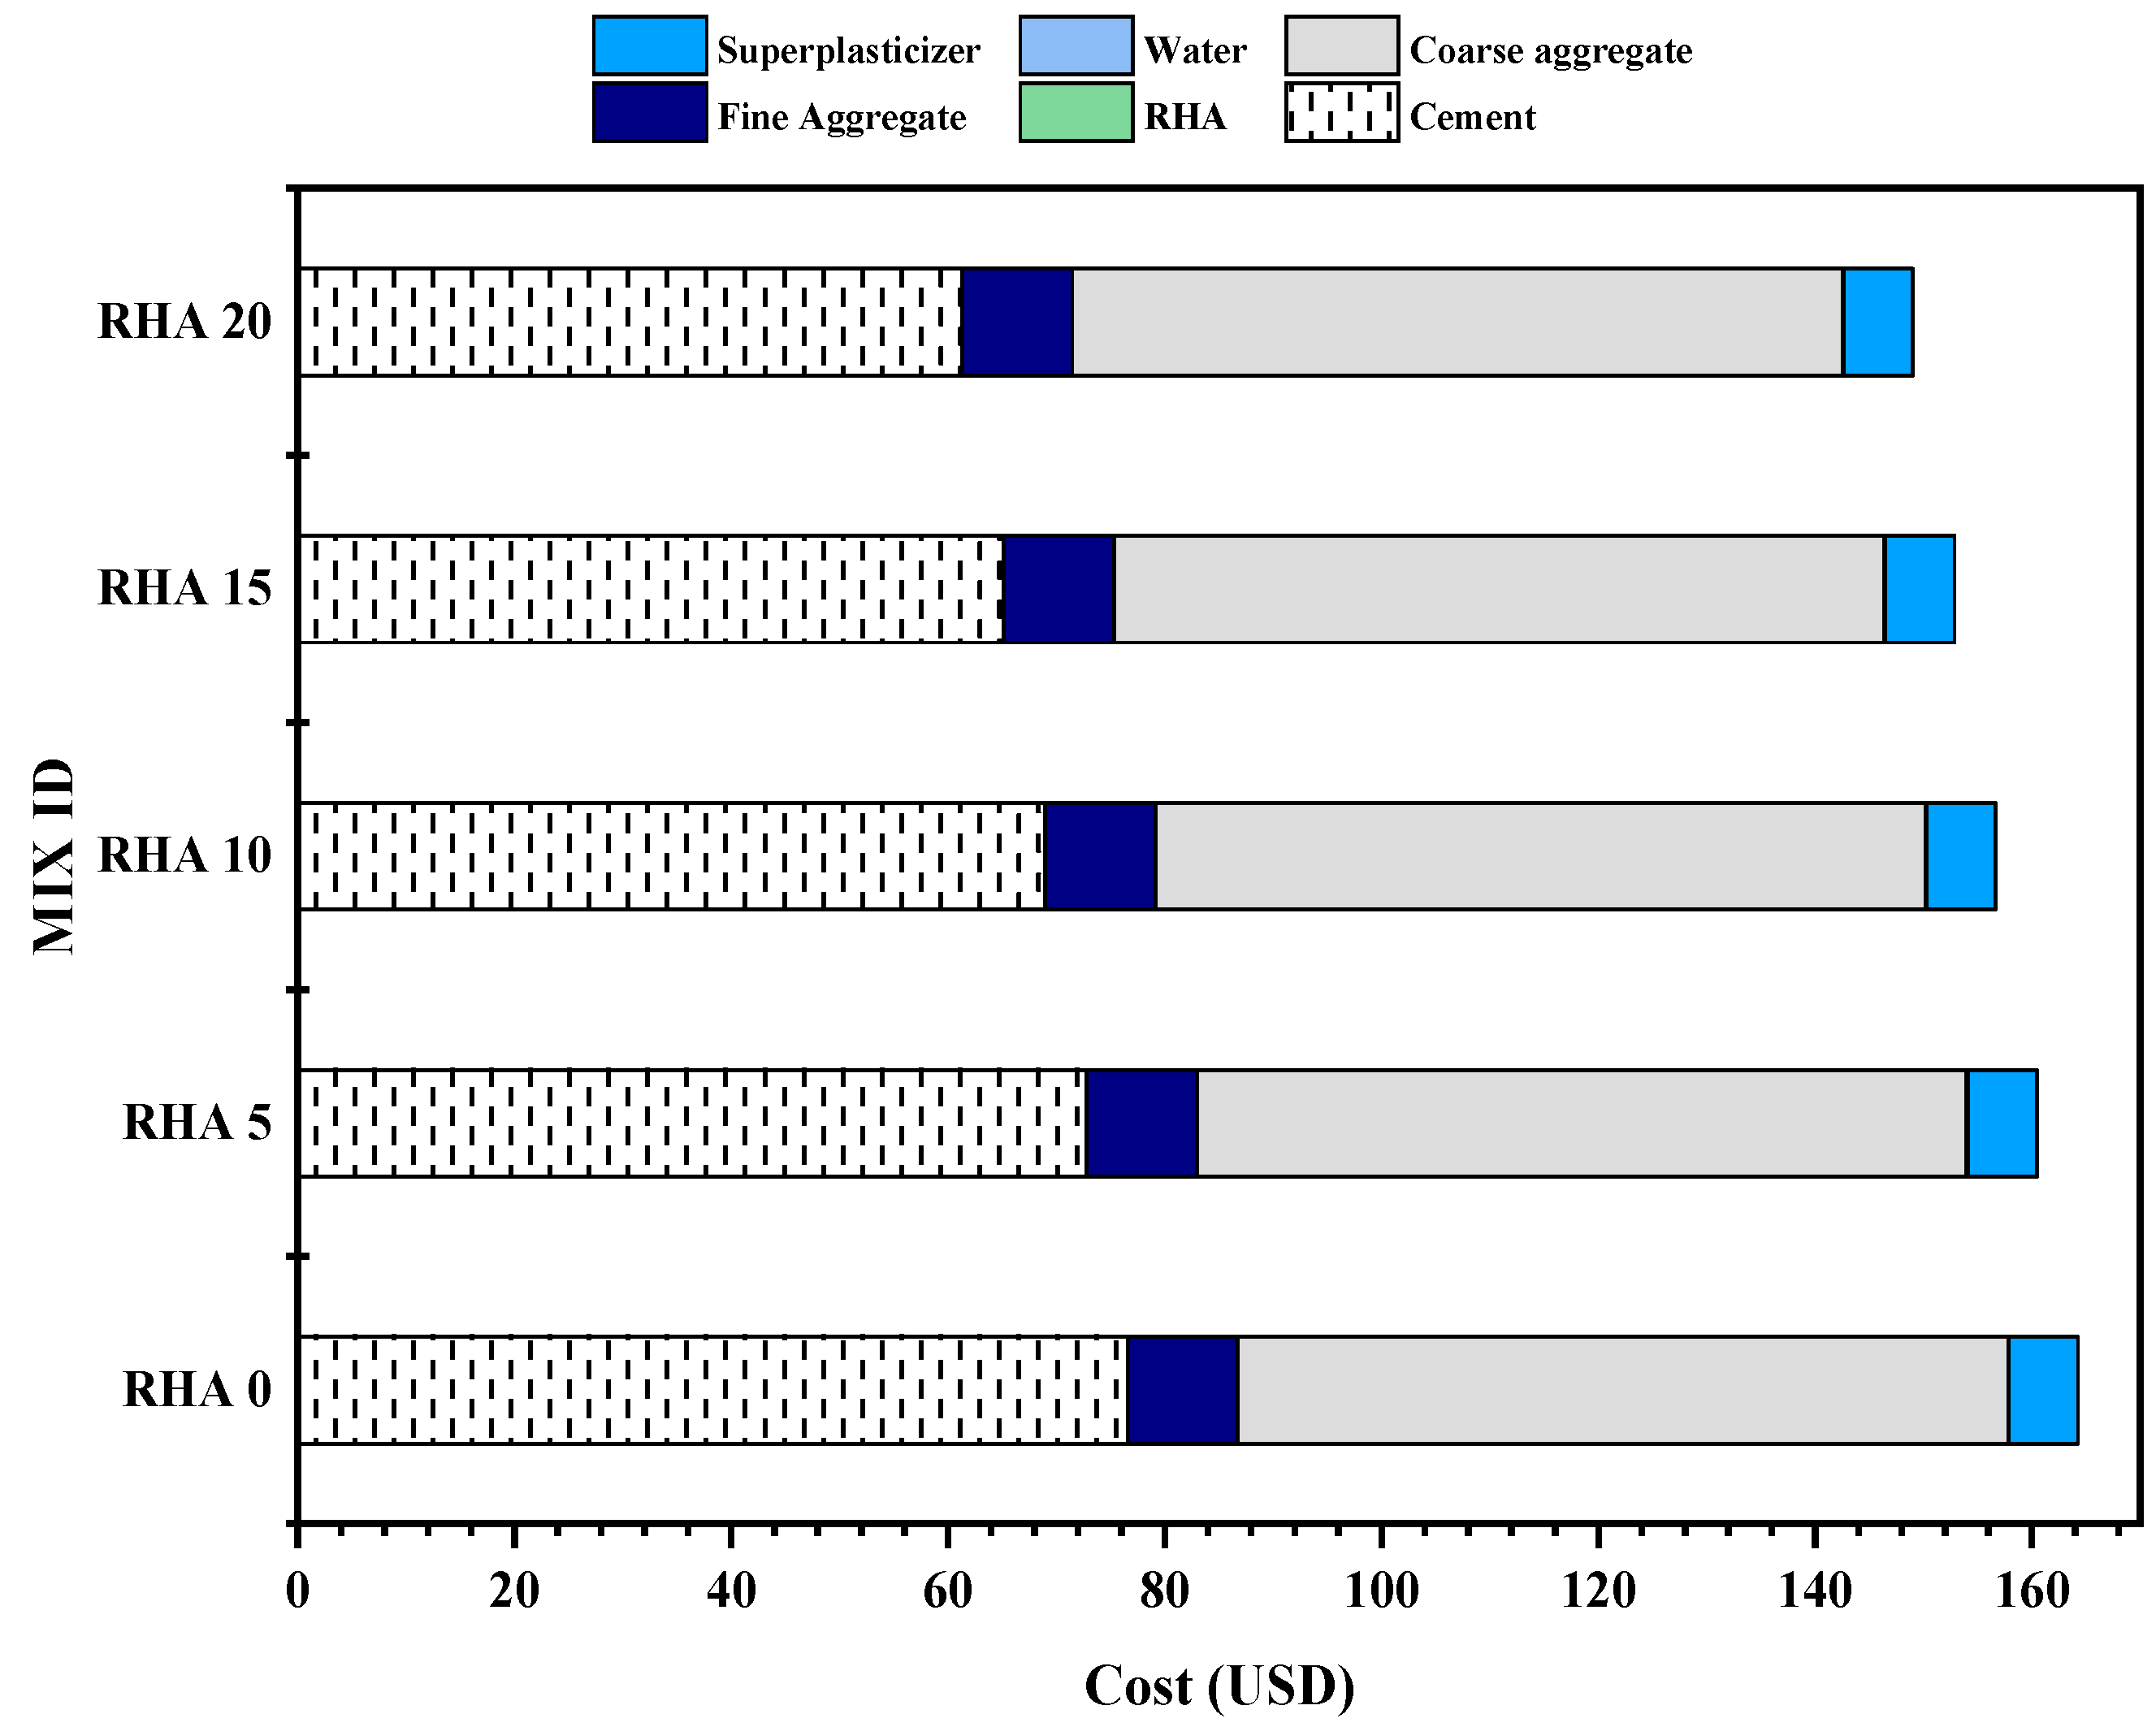
Before adopting any newer or mixed concrete, the construction industry considers the environmental impact assessment and the cost–benefit analysis as two of the most critical factors. The cost–benefit analysis of concrete, which was the subject of this study, was computed for each mix, based on the costs of the individual materials in the area. Table 8 displays, in USD, the cost of one kilogram of each commodity when converted from BDT (1 USD = 93 BDT). The availability of various materials in a given region significantly impacts their respective pricing. Due to this, the price of RHA, a pozzolanic material, is considerably less than the cost of OPC. Figure 20 depicts the cost of each concrete mixture per 1 cubic meter. It can be seen that the RHA0 mix has a price of USD 164.28 per m3 of concrete. The OPC and the superplasticizer are the primary factors that determine the pricing. The RHA20 mix has the lowest overall cost, costing USD 149.02 per m3 of concrete produced. Compared to the control mix, this is approximately 9.28% less expensive.
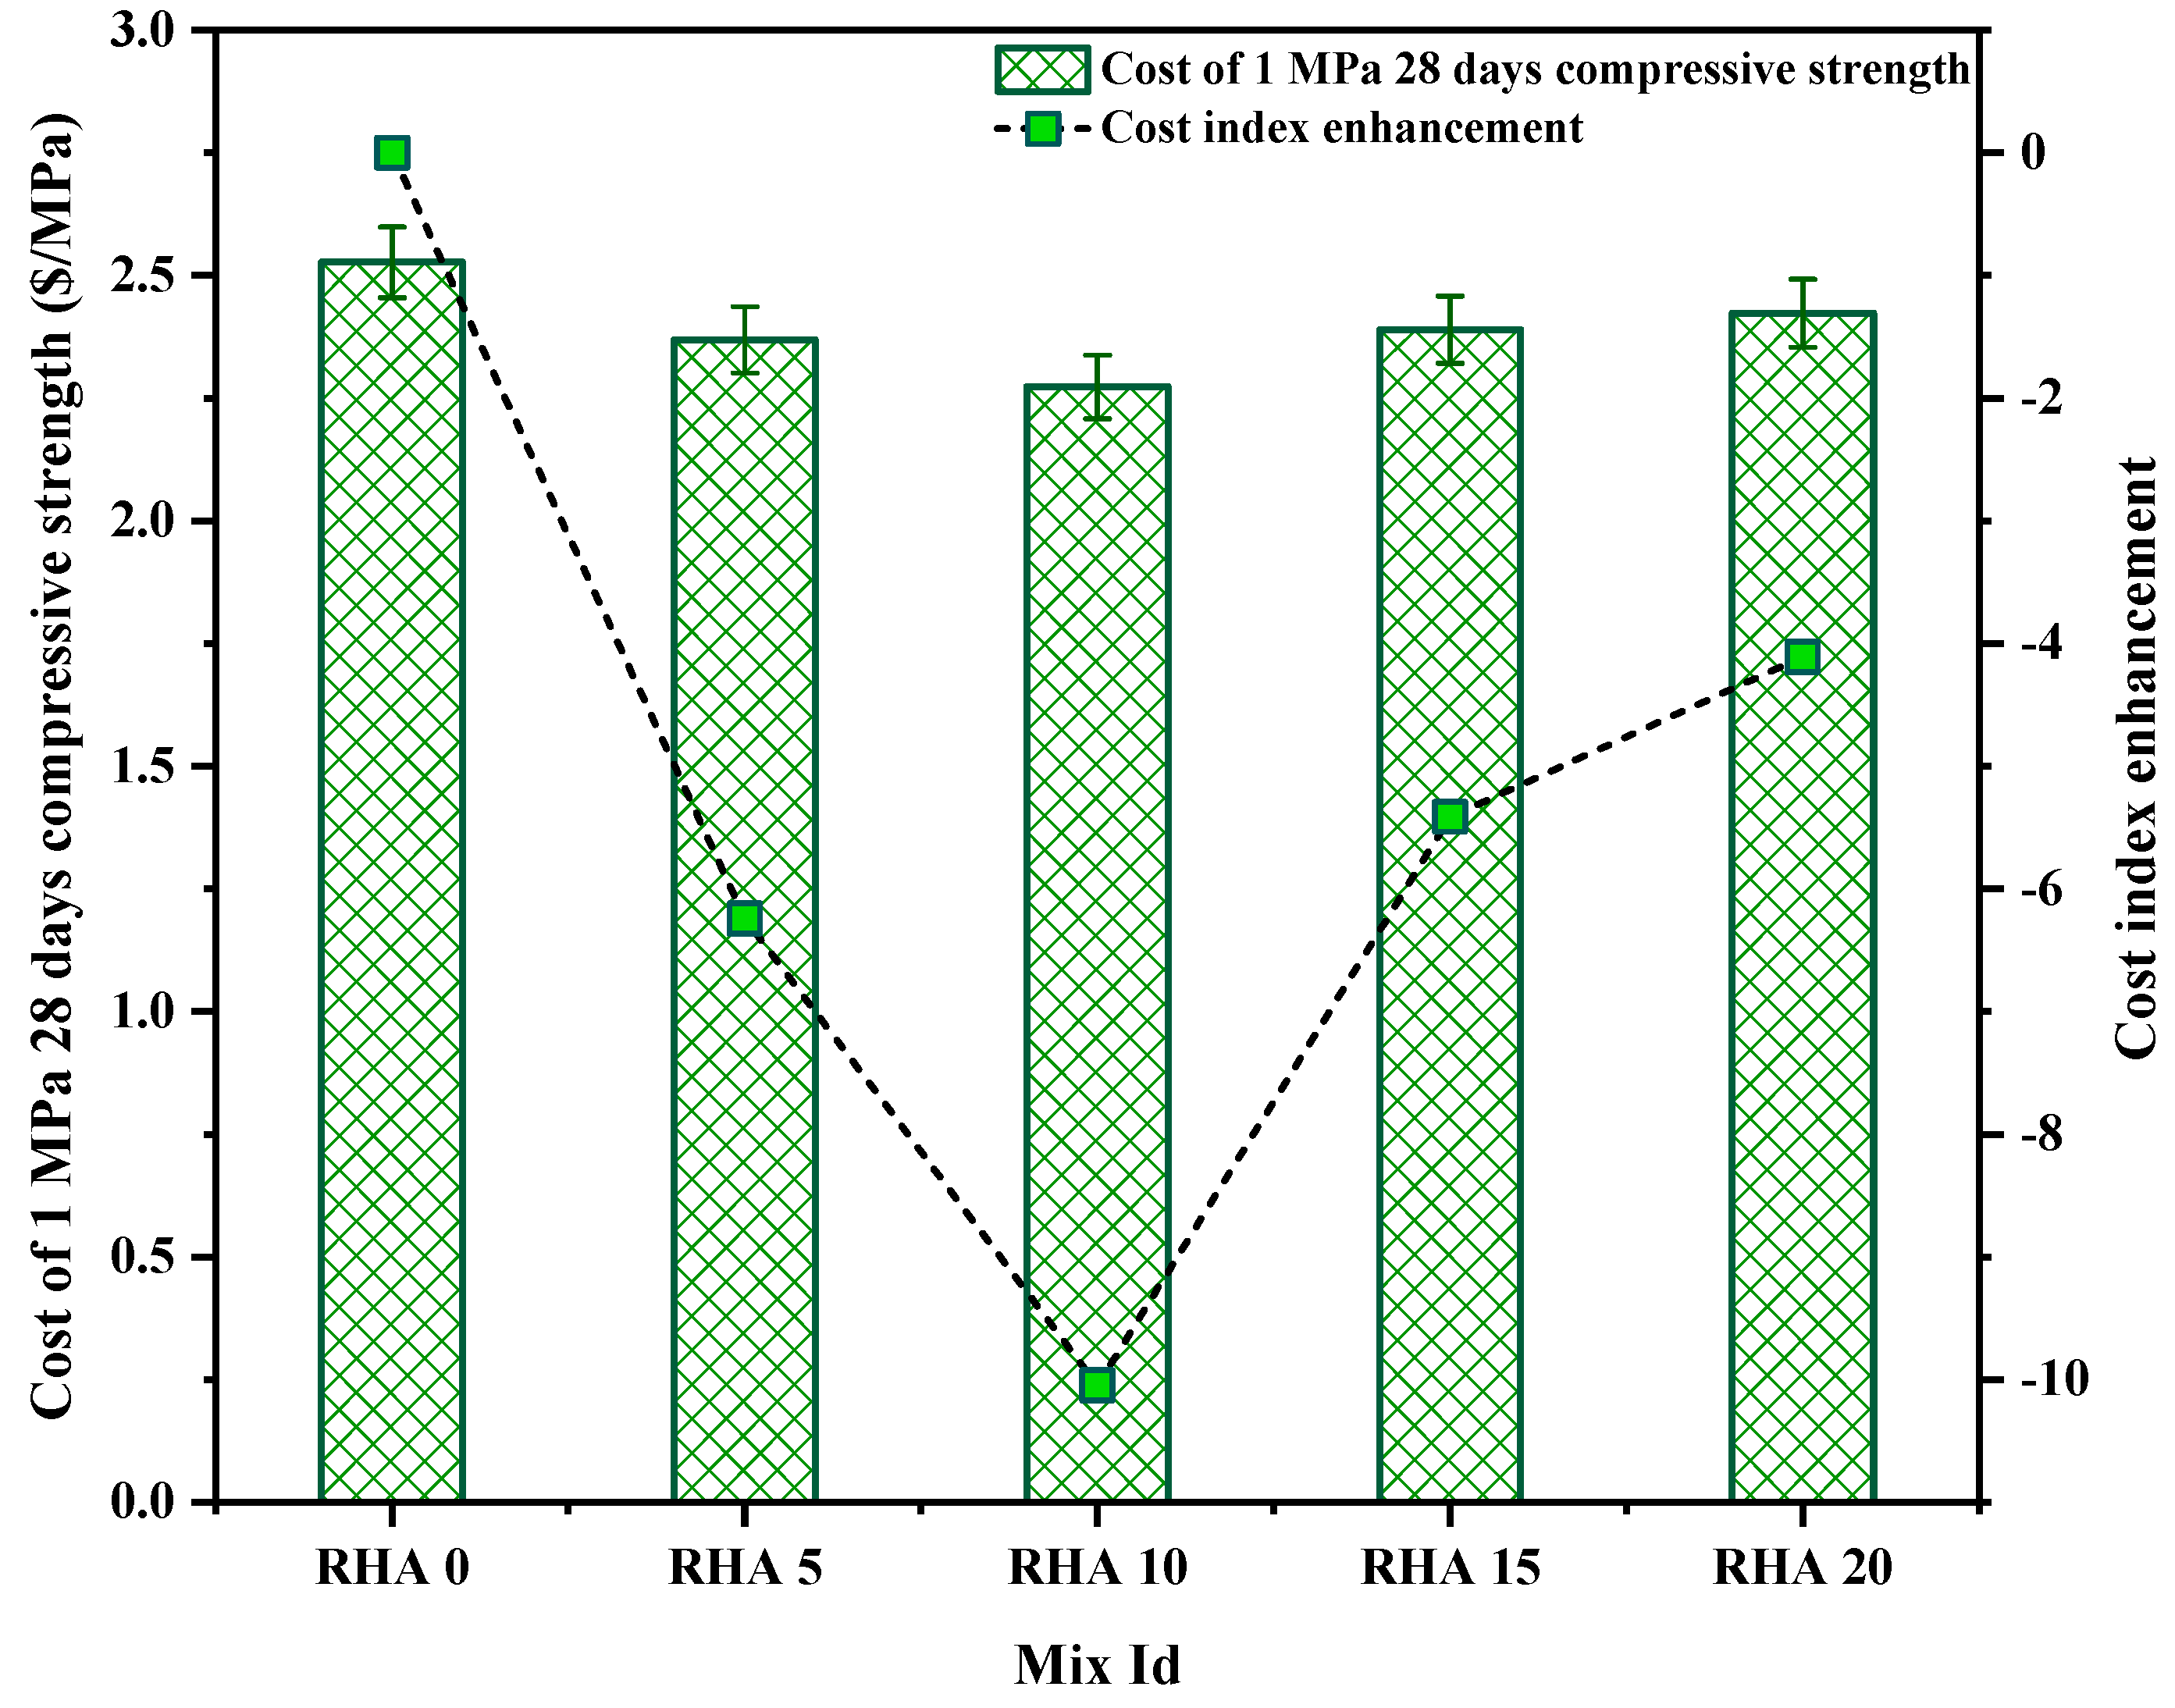
As observed in Figure 21, the overall cost of each mix varies; however, a comprehensive cost–benefit analysis cannot be considered complete without assessing the cost to produce 1 MPa of strength for each mix. Therefore, the cost to produce a 1-MPa compressive strength at 28 days is calculated and shown in Figure 20. The lowest cost of producing 1 MPa was exhibited by the RHA10 mix, at 2.27 USD/MPa, with a reduction of 10.04% compared to the control mix. Moreover, the RHA5, RHA15, and RHA20 mixes depicted the cost index of 2.369, 2.390, and 2.423 USD/MPa, respectively.

6. Conclusions

The awareness of waste management and environmental issues has led to considerable breakthroughs in using waste materials such as rice husk ash. The fundamental purpose is to assess the fresh and mechanical properties of concrete, including RHA as a cement substitute, to determine their feasibility for construction and attempt to preserve natural resources, recycle trash, and make long-lasting concrete. Based on the experimental outcomes, the following significant observations and conclusions can be reached:
  • The concrete mixture containing RHA exhibited poor overall workability due to a low water-to-cement ratio, a constant concentration of SP, and the cellular structure of RHA, which absorbed moisture.
  • As the concentration of RHA was increased, the density of the hardened concrete mixtures decreased; similarly, the ISAT results indicated that the permeability of the concrete decreased as the concentration of RHA increased.
  • The optimum compressive strength was achieved with RHA10, which was the 10% RHA supplementation by the weight of the cement. The reason could be due to the pozzolanic activity and pore refinement of the RHA particles.
  • The addition of 10% RHA to concrete enhanced the splitting tensile strength compared to RHA0 (reference concrete), and the percentage of the splitting tensile strength enhancement ranged from approximately 2.0% to 7.5%. However, a decrease in the tensile strength was observed after 10% RHA incorporation.
  • The flexural strength results were identical to the compressive and tensile strength tests. According to these determinations, concrete incorporating 10% RHA possessed maximum results of 5.3250, 8.1500, and 9.4517 MPa at 7, 28, and 56 days, respectively.
  • The relationship between splitting tensile strength and flexural strength showed a good linear connection with the enhancement of compressive strength. The estimated values of ACI 363R and CEB-FIP were the closest among all standards for both flexural and splitting tensile strength, whereas AS 3600 possessed the highest fluctuation.
  • Microstructural investigation of the specimens presented a mostly irregular and agglomerated state of the concrete. Chemical reactions and micrographs of the RHA-incorporated concrete depicted the microfiller effect. Based on the flakiness of the dense microstructure combination, RHA may achieve the strength in an incremental style up to 10% utilization, demonstrating the optimal consideration.
  • RHA20 depicted the lowest GWP of 452.45 kgCO2-eq/kg material, with a 17.27% reduction than the control mix, whereas the RHA10 mix represented an 8.63% GWP reduction, while achieving 3.28% better compressive strength than the control mix, demonstrating a significant eco-strength efficiency.
  • In terms of cost–benefit analysis, the RHA20 mix had the lowest overall cost, projected to be approximately 9.28% less expensive than the control mix. Although the RHA10 mix showed little cost reduction (only 4.64% than the control mix), it depicted the lowest cost index value of 2.27 USD/MPa, which is almost 11% cheaper than the RHA0 mix.
  • Among all the mix proportions, the 10%-RHA-incorporated concrete produced overall satisfactory performance for its fresh and mechanical characteristics as well as in its environmental impact analysis and cost–benefit analysis. It is feasible to generate high-strength concrete (grade 60) by employing RHA as an additional cementing element, which leads to waste-product mitigation and a sustainable alternative for the construction field.

Author Contributions

Conceptualization: N.M.S.H., M.H.R.S., M.M.M., N.J.M. and M.J.R.; methodology: N.M.S.H., M.H.R.S., M.M.H.K., N.J.M., M.M.M., S.D.D., M.T.M., M.J.R., A.S. and A.S.M.A.; software: N.J.M., M.M.M., S.D.D., M.T.M., M.J.R. and A.S.; validation: N.M.S.H., M.H.R.S., M.M.H.K., A.S.M.A., M.H. and N.M.S.; formal analysis: N.J.M., M.M.M., S.D.D., M.T.M. and M.J.R.; investigation: N.M.S.H., N.J.M., M.M.M., S.D.D., M.J.R., A.S. and M.H.; resources: N.M.S.H., M.H.R.S., M.M.H.K., S.D.D., A.S.M.A., M.H. and N.M.S.; data curation: M.H.R.S., M.M.M., M.J.R. and A.S.; writing—original draft preparation: N.M.S.H., M.H.R.S., N.J.M., M.M.M., S.D.D. and M.J.R.; writing—review and editing: M.H.R.S., M.M.H.K., S.D.D., A.S., A.S.M.A., M.T.M., M.H. and N.M.S.; visualization: N.M.S.H., M.H.R.S., M.J.R., A.S., A.S.M.A., M.H. and N.M.S.; supervision: N.M.S.H. and M.M.H.K.; project administration: N.M.S.H., M.H.R.S., M.M.H.K., S.D.D., M.J.R., A.S. and A.S.M.A.; funding acquisition: N.M.S.H., M.H.R.S., M.M.H.K., M.H. and N.M.S. All authors have read and agreed to the published version of the manuscript.

Funding

This research received no external funding.

Data Availability Statement

Data will be available on appropriate request.

Acknowledgments

The structural properties of concrete were analyzed at the laboratory of Bandar Universiti Terknologi Legenda Malaysia (University of East London Malaysia Branch) and the heavy structures laboratory of the Department of Civil Engineering, Universiti Malaysia Sarawak, 94300 Kota Samarahan, Sarawak, Malaysia. The authors would like to show their gratitude to the technicians, lab attendant, and other associates for the support during the fabrication of the specimens and machine operations. The authors also gratefully appreciate the personnel associated with the BIM Laboratory of the Department of Building Engineering and Construction Management, Khulna University of Engineering and Technology, Khulna, Bangladesh, for providing the facilities for the environmental impact assessment and cost–benefit analysis. The authors would like to show their gratitude to the laboratory assistant and other associates of the BIM laboratory for the support during the sustainability and cost analysis.

Conflicts of Interest

The authors declare no conflict of interest.

References

  1. Raman, S.; Ngo, T.; Mendis, P.; Mahmud, H. High-strength rice husk ash concrete incorporating quarry dust as a partial substitute for sand. Constr. Build. Mater. 2011, 25, 3123–3130. [Google Scholar] [CrossRef]
  2. Datta, S.D.; Rana, J.; Assafi, M.N.; Mim, N.J.; Ahmed, S. Investigation on the generation of construction wastes in Bangladesh. Int. J. Constr. Manag. 2022, 1–10. [Google Scholar] [CrossRef]
  3. Aprianti, E.; Shafigh, P.; Bahri, S.; Farahani, J.N. Supplementary cementitious materials origin from agricultural wastes—A review. Constr. Build. Mater. 2015, 74, 176–187. [Google Scholar] [CrossRef] [Green Version]
  4. Prasittisopin, L.; Trejo, D. Hydration and phase formation of blended cementitious systems incorporating chemically transformed rice husk ash. Cem. Concr. Compos. 2015, 59, 100–106. [Google Scholar] [CrossRef]
  5. Venkatanarayanan, H.K.; Rangaraju, P.R. Effect of grinding of low-carbon rice husk ash on the microstructure and performance properties of blended cement concrete. Cem. Concr. Compos. 2015, 55, 348–363. [Google Scholar] [CrossRef]
  6. Sobuz, H.R.; Datta, S.D.; Akid, A.S.M. Investigating the combined effect of aggregate size and sulphate attack on producing sustainable recycled aggregate concrete. Aust. J. Civ. Eng. 2022, 1–16. [Google Scholar] [CrossRef]
  7. Sobuz, M.H.R.; Datta, S.D.; Rahman, M. Evaluating the Properties of Demolished Aggregate Concrete with Non-destructive Assessment. In Advances in Civil Engineering; Springer: Berlin/Heidelberg, Germany, 2022; pp. 223–233. [Google Scholar] [CrossRef]
  8. Sobuz, H.R.; Datta, S.D.; Akid, A.S.M.; Tam, V.W.; Islam, S.; Rana, J.; Aslani, F.; Yalçınkaya, S.; Sutan, N.M. Evaluating the effects of recycled concrete aggregate size and concentration on properties of high-strength sustainable concrete. J. King Saud Univ. Eng. Sci. 2022, in press. [Google Scholar] [CrossRef]
  9. Nath, A.D.; Hoque, I.; Datta, S.D.; Shahriar, F. Various recycled steel fiber effect on mechanical properties of recycled aggregate concrete. Int. J. Build. Pathol. Adapt. 2021, in press. [Google Scholar] [CrossRef]
  10. Johari, M.M.; Zeyad, A.; Bunnori, N.M.; Ariffin, K. Engineering and transport properties of high-strength green concrete containing high volume of ultrafine palm oil fuel ash. Constr. Build. Mater. 2011, 30, 281–288. [Google Scholar] [CrossRef]
  11. Bahurudeen, A.; Kanraj, D.; Dev, V.G.; Santhanam, M. Performance evaluation of sugarcane bagasse ash blended cement in concrete. Cem. Concr. Compos. 2015, 59, 77–88. [Google Scholar] [CrossRef]
  12. Seo, J.H.; Park, S.M.; Yang, B.J.; Jang, J.G. Calcined Oyster Shell Powder as an Expansive Additive in Cement Mortar. Materials 2019, 12, 1322. [Google Scholar] [CrossRef] [PubMed] [Green Version]
  13. Ubachukwu Obiekwe, A.; Okafor, F.O. Investigation of the Supplementary Cementitious Potentials of Oyster Shell Powder for Eco-Friendly and Low-Cost Concrete. Electron. J. Geotech. Eng. 2019, 24, 1297–1306. [Google Scholar]
  14. Marthong, C. Sawdust Ash (Sda) as Partial Replacement of Cement. Int. J. Eng. Res. Appl. 2012, 2, 1980–1985. [Google Scholar]
  15. Mangi, S.A.; Norwati, J.; Wan Ibrahim, M.H.; Noridah, M.; Samiullah, S. Utilization of Sawdust Ash as Cement Replacement for the Concrete Production: A Review. Eng. Sci. Technol. Int. Res. J. 2017, 1, 11–15. [Google Scholar]
  16. Kimeng Henry, T.; Sani, M.; Ekundayo, O.O.; Frederick, K. Feasibility Study of the Use of Groundnut Shells as Fine Aggregates in Lightweight Concrete Construction. Int. J. Adv. Res. Eng. 2015, 1, 13–16. [Google Scholar] [CrossRef] [Green Version]
  17. Wazumtu, M.; Ogork, E.N. Assessment of Groundnut Shell Ash (Gsa) as Admixture in Cement Paste and Concrete. Int. J. Innov. Sci. Eng. Technol. 2015, 2, 77–86. [Google Scholar]
  18. Kanojia, A.; Jain, S.K. Performance of coconut shell as coarse aggregate in concrete. Constr. Build. Mater. 2017, 140, 150–156. [Google Scholar] [CrossRef]
  19. Kumar, V.P.; Gunasekaran, K.; Shyamala, T. Characterization study on coconut shell concrete with partial replacement of cement by GGBS. J. Build. Eng. 2019, 26, 100830. [Google Scholar] [CrossRef]
  20. Celikten, S.; Canbaz, M. A Study on the Usage of Tobacco Waste Ash as a Mineral Admixture in Concrete Technology. In Proceedings of the International Conference on Engineering Technologies, Konya, Turkey, 7–9 December 2017. [Google Scholar]
  21. Moreno, P.; Fragozo, R.; Vesga, S.; Gonzalez, M.; Hernandez, L.; Gamboa, I.D.; Delgado, J. Tobacco waste ash: A promising supplementary cementitious material. Int. J. Energy Environ. Eng. 2018, 9, 499–504. [Google Scholar] [CrossRef] [Green Version]
  22. Cheah, W.-K.; Ooi, C.-H.; Yeoh, F.-Y. Rice husk and rice husk ash reutilization into nanoporous materials for adsorptive biomedical applications: A review. Open Mater. Sci. 2016, 3, 27–38. [Google Scholar] [CrossRef] [Green Version]
  23. Prasara, A.J.; Gheewala, S.H. Sustainable utilization of rice husk ash from power plants: A review. J. Clean. Prod. 2017, 167, 1020–1028. [Google Scholar] [CrossRef]
  24. Kang, S.-H.; Hong, S.-G.; Moon, J. The use of rice husk ash as reactive filler in ultra-high performance concrete. Cem. Concr. Res. 2018, 115, 389–400. [Google Scholar] [CrossRef]
  25. Menya, E.; Olupot, P.; Storz, H.; Lubwama, M.; Kiros, Y. Production and performance of activated carbon from rice husks for removal of natural organic matter from water: A review. Chem. Eng. Res. Des. 2018, 129, 271–296. [Google Scholar] [CrossRef]
  26. Alex, J.; Dhanalakshmi, J.; Ambedkar, B. Experimental investigation on rice husk ash as cement replacement on concrete production. Constr. Build. Mater. 2016, 127, 353–362. [Google Scholar] [CrossRef]
  27. Sookkumnerd, C.; Ito, N.; Kito, K. Financial viabilities of husk-fueled steam engines as an energy-saving technology in Thai rice mills. Appl. Energy 2005, 82, 64–80. [Google Scholar] [CrossRef]
  28. Pode, R. Potential applications of rice husk ash waste from rice husk biomass power plant. Renew. Sustain. Energy Rev. 2016, 53, 1468–1485. [Google Scholar] [CrossRef]
  29. Zareei, S.A.; Ameri, F.; Dorostkar, F.; Ahmadi, M. Rice husk ash as a partial replacement of cement in high strength concrete containing micro silica: Evaluating durability and mechanical properties. Case Stud. Constr. Mater. 2017, 7, 73–81. [Google Scholar] [CrossRef]
  30. Jauberthie, R.; Rendell, F.; Tamba, S.; Cisse, I. Origin of the pozzolanic effect of rice husks. Constr. Build. Mater. 2000, 14, 419–423. [Google Scholar] [CrossRef]
  31. Thomas, B.S. Green concrete partially comprised of rice husk ash as a supplementary cementitious material—A comprehensive review. Renew. Sustain. Energy Rev. 2018, 82, 3913–3923. [Google Scholar] [CrossRef]
  32. Chindaprasirt, P.; Homwuttiwong, S.; Jaturapitakkul, C. Strength and water permeability of concrete containing palm oil fuel ash and rice husk–bark ash. Constr. Build. Mater. 2007, 21, 1492–1499. [Google Scholar] [CrossRef]
  33. Xu, J.; Chen, Z.; Xue, J.; Chen, Y.; Liu, Z. A review of experimental results of steel reinforced recycled aggregate concrete members and structures in China (2010–2016). Proc. Eng. 2017, 210, 109–119. [Google Scholar] [CrossRef]
  34. Zain, M.; Islam, M.; Mahmud, F.; Jamil, M. Production of rice husk ash for use in concrete as a supplementary cementitious material. Constr. Build. Mater. 2011, 25, 798–805. [Google Scholar] [CrossRef]
  35. Nair, D.G.; Fraaij, A.; Klaassen, A.A.; Kentgens, A. A structural investigation relating to the pozzolanic activity of rice husk ashes. Cem. Concr. Res. 2008, 38, 861–869. [Google Scholar] [CrossRef]
  36. Zhang, M.; Lastra, R.; Malhotra, V. Rice-husk ash paste and concrete: Some aspects of hydration and the microstructure of the interfacial zone between the aggregate and paste. Cem. Concr. Res. 1996, 26, 963–977. [Google Scholar] [CrossRef]
  37. Huang, H.; Gao, X.; Wang, H.; Ye, H. Influence of rice husk ash on strength and permeability of ultra-high performance concrete. Constr. Build. Mater. 2017, 149, 621–628. [Google Scholar] [CrossRef]
  38. Zhang, M.-H.; Malhotra, V.M. High-Performance Concrete Incorporating Rice Husk Ash as a Supplementary Cementing Material. ACI Mater. J. 1996, 93, 629–636. [Google Scholar]
  39. Salas, A.; Delvasto, S.; de Gutierrez, R.M.; Lange, D. Comparison of two processes for treating rice husk ash for use in high performance concrete. Cem. Concr. Res. 2009, 39, 773–778. [Google Scholar] [CrossRef]
  40. Bin Mahmud, H.; Malik, M.F.A.; Kahar, R.A.; Zain, M.F.M.; Raman, S.N. Mechanical Properties and Durability of Normal and Water Reduced High Strength Grade 60 Concrete Containing Rice Husk Ash. J. Adv. Concr. Technol. 2009, 7, 21–30. [Google Scholar] [CrossRef] [Green Version]
  41. Ganesan, K.; Rajagopal, K.; Thangavel, K. Rice husk ash blended cement: Assessment of optimal level of replacement for strength and permeability properties of concrete. Constr. Build. Mater. 2008, 22, 1675–1683. [Google Scholar] [CrossRef]
  42. Ge, D.-M.; Zhao, L.-C.; Esmaeili-Falak, M. Estimation of rapid chloride permeability of SCC using hyperparameters optimized random forest models. J. Sustain. Cem. Mater. 2022, 24, 1–19. [Google Scholar] [CrossRef]
  43. Yu, Q.; Sawayama, K.; Sugita, S.; Shoya, M.; Isojima, Y. The reaction between rice husk ash and Ca(OH)2 solution and the nature of its product. Cem. Concr. Res. 1999, 29, 37–43. [Google Scholar] [CrossRef]
  44. Bouzoubaâ, N.; Fournier, B. Concrete Incorporating Rice-Husk Ash: Compressive Strength and Chloride-Ion Penetrability. Mater. Technol. Lab. 2001, 121, 81–92. [Google Scholar]
  45. Mahmud, H.B.; Chia, B.S.; Hamid, N.B.A.A. Rice Husk Ash–an Alternative Material in Producing High Strength Concrete. In Proceedings of the International Conference on Engineering Materials, Ottawa, ON, Canada, 30 September 1997. [Google Scholar]
  46. Nehdi, M.; Duquette, J.; El Damatty, A. Performance of rice husk ash produced using a new technology as a mineral admixture in concrete. Cem. Concr. Res. 2003, 33, 1203–1210. [Google Scholar] [CrossRef]
  47. Saraswathy, V.; Song, H.-W. Corrosion performance of rice husk ash blended concrete. Constr. Build. Mater. 2007, 21, 1779–1784. [Google Scholar] [CrossRef]
  48. Giaccio, G.; de Sensale, G.R.; Zerbino, R. Failure mechanism of normal and high-strength concrete with rice-husk ash. Cem. Concr. Compos. 2007, 29, 566–574. [Google Scholar] [CrossRef]
  49. BS-EN-196-1; Methods of Testing Cement. Determination of Strength. European Standards: Pilsen, Czech Republic, 2016.
  50. BS-EN-812-103.1:1985; Testing Aggregates. Method for Determination of Particle Size Distribution. Sieve Tests. European Standards: Pilsen, Czech Republic, 1985.
  51. ASTM-C29/C29M-17a; Standard Test Method for Bulk Density (‘‘Unit Weight”) and Voids in Aggregate. ASTM International: West Conshohocken, PA, USA, 2017.
  52. ASTM-C127-15; Standard Test Method for Relative Density (Specific Gravity) and Absorption of Coarse Aggregate. ASTM International: West Conshohocken, PA, USA, 2015.
  53. ASTM-C128-15; Standard Test Method for Relative Density (Specific Gravity) and Absorption of Fine Aggregate. ASTM International: West Conshohocken, PA, USA, 2015.
  54. ASTM-C136/C136M-19; Standard Test Method for Sieve Analysis of Fine and Coarse Aggregates. ASTM International: West Conshohocken, PA, USA, 2019.
  55. ASTM-C33/C33M-18; Standard Specification for Concrete Aggregates. ASTM International: West Conshohocken, PA, USA, 2018.
  56. ASTM-C685/C685M-17; Standard Specification for Concrete Made by Volumetric Batching and Continuous Mixing. ASTM International: West Conshohocken, PA, USA, 2019.
  57. ASTM-C192/C192M-19; Standard Practice for Making and Curing Concrete Test Specimens in the Laboratory. ASTM International: West Conshohocken, PA, USA, 2019.
  58. ASTM-C143/C143M-09; Standard Test Method for Slump of Hydraulic-Cement Concrete. ASTM International: West Conshohocken, PA, USA, 2009.
  59. BS-EN-12350-4:2009; Testing Fresh Concrete: Part 4 Degree of Compactability. European Standards: Pilsen, Czech Republic, 2009.
  60. BS-EN-12390-7:2009; Testing Hardened Concrete–Part 7: Density of Hardened Concrete. European Standards: Pilsen, Czech Republic, 2009.
  61. BS. Testing Hardened Concrete–Initial Surface Absorption Test; BSI: London, UK, 1996. [Google Scholar]
  62. BSI-1881-117:1983; Testing Concrete: Method for Determination of Tensile Splitting Strength: British Standards Institution. European Standards: Pilsen, Czech Republic, 1983.
  63. BS-EN-12390-5:2009; Testing Hardened Concrete–Part 5: Flexural Strength of Test Specimens. BSI: London, UK, 2009.
  64. Van Dong, D.; Huu, P.D.; Lan, N.N. Effect of Rice Husk Ash on Properties of High Strength Concrete. In Proceedings of the 3rd ACF International Conference-ACF/VCA, Ho Chi Minh, Vietnam, 11–13 November 2008. [Google Scholar]
  65. Ephraim Maurice, E.; Akeke, G.A.; Ukpata, J.O. Compressive Strength of Concrete with Rice Husk Ash as Partial Replacement of Ordinary Portland Cement. Sch. J. Eng. Res. 2012, 1, 32–36. [Google Scholar]
  66. Habeeb, G.A.; Bin Mahmud, H. Study on properties of rice husk ash and its use as cement replacement material. Mater. Res. 2010, 13, 185–190. [Google Scholar] [CrossRef]
  67. Kannan, V.; Ganesan, K. Chloride and chemical resistance of self compacting concrete containing rice husk ash and metakaolin. Constr. Build. Mater. 2014, 51, 225–234. [Google Scholar] [CrossRef]
  68. Chopra, D.; Siddique, R. Strength, permeability and microstructure of self-compacting concrete containing rice husk ash. Biosyst. Eng. 2015, 30, 72–80. [Google Scholar] [CrossRef]
  69. Kunchariyakun, K.; Asavapisit, S.; Sombatsompop, K. Properties of autoclaved aerated concrete incorporating rice husk ash as partial replacement for fine aggregate. Cem. Concr. Compos. 2015, 55, 11–16. [Google Scholar] [CrossRef]
  70. Ali, T.; Saand, A.; Bangwar, D.; Buller, A.; Ahmed, Z. Mechanical and Durability Properties of Aerated Concrete Incorporating Rice Husk Ash (RHA) as Partial Replacement of Cement. Crystals 2021, 11, 604. [Google Scholar] [CrossRef]
  71. De Sensale, G.R. Strength Development of Concrete with Rice-Husk Ash. Cem. Concr. Compos. 2006, 28, 158–160. [Google Scholar] [CrossRef]
  72. Alvarez, M. Marine Durability Characteristics of Rice Husk Ash-Modified Reinforced Concrete. In Proceedings of the 4th LACCEI International Latin American and Caribbean Conference for Engineering and Technology (LACCET’06), Breaking Frontiers and Barriers in Engineering: Education, Research and Practice, Mayaguez, Puerto Rico, 21–23 June 2006. [Google Scholar]
  73. Dhir, R.K.; Hewlett, P.C.; Chan, Y.N. Near-surface characteristics of concrete: Abrasion resistance. Mater. Struct. 1991, 24, 122–128. [Google Scholar] [CrossRef]
  74. Speare, P.R.S.; Eleftheriou, K.; Siludom, S. Durability of Concrete Containing Rice Husk Ash as an Additive. In Exploiting Wastes in Concrete; Thomas Telford Publishing: London, UK, 1999; pp. 283–290. [Google Scholar]
  75. Patel, Y.J.; Shah, N. Enhancement of the properties of Ground Granulated Blast Furnace Slag based Self Compacting Geopolymer Concrete by incorporating Rice Husk Ash. Constr. Build. Mater. 2018, 171, 654–662. [Google Scholar] [CrossRef]
  76. ACI-318; Building Code Requirements for Structural Concrete (Aci 318-99) and Commentary (318r-99). American Concrete Institute: Farmington Hills, MI, USA, 1999.
  77. ACI-363; State-of-the Art Report on High Strength Concrete (Aci 363r-92). American Concrete Institute: Farmington Hills, MI, USA, 1992.
  78. Béton, CE-Id, and CEB-FIP Model Code. In Ceb-Fip Model Code 1990: Design Code 1900; Thomas Telford: London, UK, 1990.
  79. AS 3600—2009; Concrete Structures. Standards Association of Australia: Sydney, Australia, 2009.
  80. Zhang, Y.J.; Li, S.; Wang, Y.C.; Xu, D.L. Microstructural and strength evolutions of geopolymer composite reinforced by resin exposed to elevated temperature. J. Non-Cryst. Solids 2012, 358, 620–624. [Google Scholar] [CrossRef]
  81. Suhendro, B. Toward Green Concrete for Better Sustainable Environment. Procedia Eng. 2014, 95, 305–320. [Google Scholar] [CrossRef]
  82. Kumar, R.; Shafiq, N.; Kumar, A.; Jhatial, A.A. Investigating embodied carbon, mechanical properties, and durability of high-performance concrete using ternary and quaternary blends of metakaolin, nano-silica, and fly ash. Environ. Sci. Pollut. Res. 2021, 28, 49074–49088. [Google Scholar] [CrossRef]
  83. Flower, D.J.M.; Sanjayan, J.G. Green House Gas Emissions Due to Concrete Manufacture. Int. J. Life Cycle Assess. 2007, 12, 282–288. [Google Scholar] [CrossRef]
  84. Quispe, I.; Rodrigo, N.; Ramzy, K. Life Cycle Assessment of Rice Husk as an Energy Source. A Peruvian Case Study. J. Clean. Prod. 2019, 209, 1235–1244. [Google Scholar] [CrossRef]
  85. Turner, L.K.; Collins, F.G. Carbon dioxide equivalent (CO2-e) emissions: A comparison between geopolymer and OPC cement concrete. Constr. Build. Mater. 2013, 43, 125–130. [Google Scholar] [CrossRef]
  86. Yang, K.-H.; Song, J.-K.; Song, K.-I. Assessment of CO2 reduction of alkali-activated concrete. J. Clean. Prod. 2013, 39, 265–272. [Google Scholar] [CrossRef]
  87. Long, G.; Gao, Y.; Xie, Y. Designing more sustainable and greener self-compacting concrete. Constr. Build. Mater. 2015, 84, 301–306. [Google Scholar] [CrossRef]
  88. Alnahhal, M.F.; Alengaram, U.J.; Jumaat, M.Z.; Abutaha, F.; Alqedra, M.A.; Nayaka, R.R. Assessment on engineering properties and CO2 emissions of recycled aggregate concrete incorporating waste products as supplements to Portland cement. J. Clean. Prod. 2018, 203, 822–835. [Google Scholar] [CrossRef]
  89. Damineli, B.L.; Kemeid, F.M.; Aguiar, P.S.; John, V.M. Measuring the eco-efficiency of cement use. Cem. Concr. Compos. 2010, 32, 555–562. [Google Scholar] [CrossRef]
Figure 1. Schematic flowchart.
Materials 15 08171 g001
Figure 2. Sample of rice husk ash.
Materials 15 08171 g002
Figure 3. Particle size distribution of RHA.
Materials 15 08171 g003
Figure 4. Gradation curve of coarse aggregates and fine aggregates.
Materials 15 08171 g004
Figure 5. Testing setups: (a) slump test, (b) compaction test, (c) initial surface absorption test, (d) compressive strength test, (e) splitting tensile strength test, and (f) flexural strength test.
Materials 15 08171 g005
Figure 6. (a) Slump values and compacting factor (b) variations of slump value and density, with respect to the incorporation of different percentages of RHA.
Materials 15 08171 g006
Figure 7. Compressive strength of concrete mixes incorporating RHA at 7, 28, and 56 days.
Materials 15 08171 g007
Figure 8. Compressive strength change (%) of the concrete mixes, in comparison to reference concrete.
Materials 15 08171 g008
Figure 9. Splitting tensile strength of concrete incorporating RHA at 7, 28, and 56 days.
Materials 15 08171 g009
Figure 10. Splitting tensile strength change (%) of the concrete mixes in comparison with reference concrete.
Materials 15 08171 g010
Figure 11. Flexural strength of the concrete incorporating RHA at 7, 28 and 56 days.
Materials 15 08171 g011
Figure 12. Flexural strength change (%) of the concrete mixes in comparison with the reference concrete.
Materials 15 08171 g012
Figure 13. ISAT results, after 56 days, of concrete incorporating different percentages of RHA.
Materials 15 08171 g013
Figure 14. ISAT results, after 91 days, of concrete incorporating different percentages of RHA.
Materials 15 08171 g014
Figure 15. SEM micrographs of concrete with cementitious replacements at 10 µm: (a) RHA0 (control), (b) RHA10, and (c) RHA20.
Materials 15 08171 g015
Figure 16. Relationship between the compressive strength and flexural strength of RHA-incorporated concrete mixes.
Materials 15 08171 g016
Figure 17. Relationship between the compressive and splitting tensile strengths of RHA-incorporated concrete mixes.
Materials 15 08171 g017
Figure 18. Total CO2 emission and GWP enhancement percentage.
Materials 15 08171 g018
Figure 19. Eco-strength efficiency with respect to compressive strength.
Materials 15 08171 g019
Figure 20. Cost analysis of 1 m3 of concrete mixes.
Materials 15 08171 g020
Figure 21. Cost index of the mixes.
Materials 15 08171 g021
Table 1. Chemical constituents (%) of RHA and OPC.
OxideSiO2Al2O3Fe2O3CaOMgOSO3LOINa2OK2O
OPC18.85.84.163.51.922.41.241.2052.76
RHA75.242.182.242.422.280.1212.990.861.72
Table 2. Physical characteristics of aggregates.
Aggregate TypeFineness ModulusUnit Weight (kg/m3)Void (%)Moisture Content (%)Water Absorption (%)Specific Gravity
DrySSDApparent
Coarse5.94168437.901.781.142.712.852.88
Fine2.65153832.232.341.672.452.562.59
Table 3. Details of mix proportions of concrete.
Mix IDPercentage of Replacement (%)BinderFine Aggregate (kg/m3)Coarse Aggregate (kg/m3)Water (kg/m3)SP (kg/m3)
Cement (kg/m3)RHA (kg/m3)
RHA00% (plain concrete)600-47711131653
RHA55%5703047711131653
RHA1010%5406047711131653
RHA1515%5109047711131653
RHA2020%48012047711131653
Table 4. Summary of the compressive strength test outcomes.
MixDaysMean Strength (MPa)Standard DeviationCOVStandard Error95% Confidence Interval
Lower RangeUpper Range
RHA0746.000.640.010.3745.4046.66
2865.010.300.000.1764.8165.36
5667.050.470.010.2766.5367.46
RHA5746.760.370.010.2146.3547.05
2867.730.580.010.3367.1068.24
5669.130.530.010.3168.5869.63
RHA10747.040.150.000.0946.8947.20
2868.920.390.010.2268.5269.29
5671.850.570.010.3371.2472.37
RHA15743.610.460.010.2743.1644.09
2863.950.280.000.1663.6964.24
5665.350.630.010.3664.7766.02
RHA20741.480.600.010.3540.8742.08
2861.500.380.010.2261.1361.88
5663.771.330.020.7762.2664.74
Table 5. Summary of the splitting tensile strength test outcomes.
MixDaysMean Strength (MPa)Standard DeviationCOV Standard Error95% Confidence Interval
Lower RangeUpper Range
RHA074.600.020.000.014.584.61
286.500.040.010.026.476.55
566.680.040.010.036.646.73
RHA574.670.040.010.034.634.72
286.640.010.000.016.636.65
566.900.020.000.016.886.93
RHA1074.710.020.010.014.694.74
286.790.010.000.016.786.80
567.160.030.000.027.137.18
RHA1574.390.030.010.024.364.41
286.400.020.000.016.386.42
566.520.010.000.016.516.54
RHA2074.190.060.010.034.154.23
286.190.040.010.036.166.24
566.370.050.010.036.316.42
Table 6. Summary of the flexure strength test outcomes.
MixDaysMean Strength (MPa)Standard DeviationCOV Standard Error95% Confidence Interval
Lower RangeUpper Range
RHA075.180.170.030.095.055.38
287.940.320.040.187.738.30
569.100.250.030.158.819.28
RHA575.230.010.000.015.235.25
288.060.190.020.117.858.23
569.290.120.010.079.209.43
RHA1075.330.040.010.035.285.36
288.150.090.010.058.108.25
569.450.260.030.159.239.74
RHA1574.960.280.060.164.705.25
287.810.290.040.177.558.12
568.980.240.030.148.789.25
RHA2074.870.080.020.054.784.94
287.700.060.010.037.647.75
568.970.270.030.158.819.28
Table 7. CO2 emissions data for concrete.
MaterialsEmission (kg-CO2/kg)Reference
OPC0.821[83]
RHA0.157[84]
Sand0.0139[85]
Stone Chips0.0409[85]
Water0.000196[86]
Superplasticizer0.720[87]
Table 8. Local prices of the materials.
MaterialsCementRHASandStone ChipsWaterSuperplasticizer
Cost (USD/kg)0.141180.000590.023530.070590.000592.35294
Publisher’s Note: MDPI stays neutral with regard to jurisdictional claims in published maps and institutional affiliations.

