
Electrostatic Analysis of Bioactivity of Ti-6Al-4V Hydrophilic Surface with Laser Textured Micro-Square Convexes

Abstract
:1. Introduction
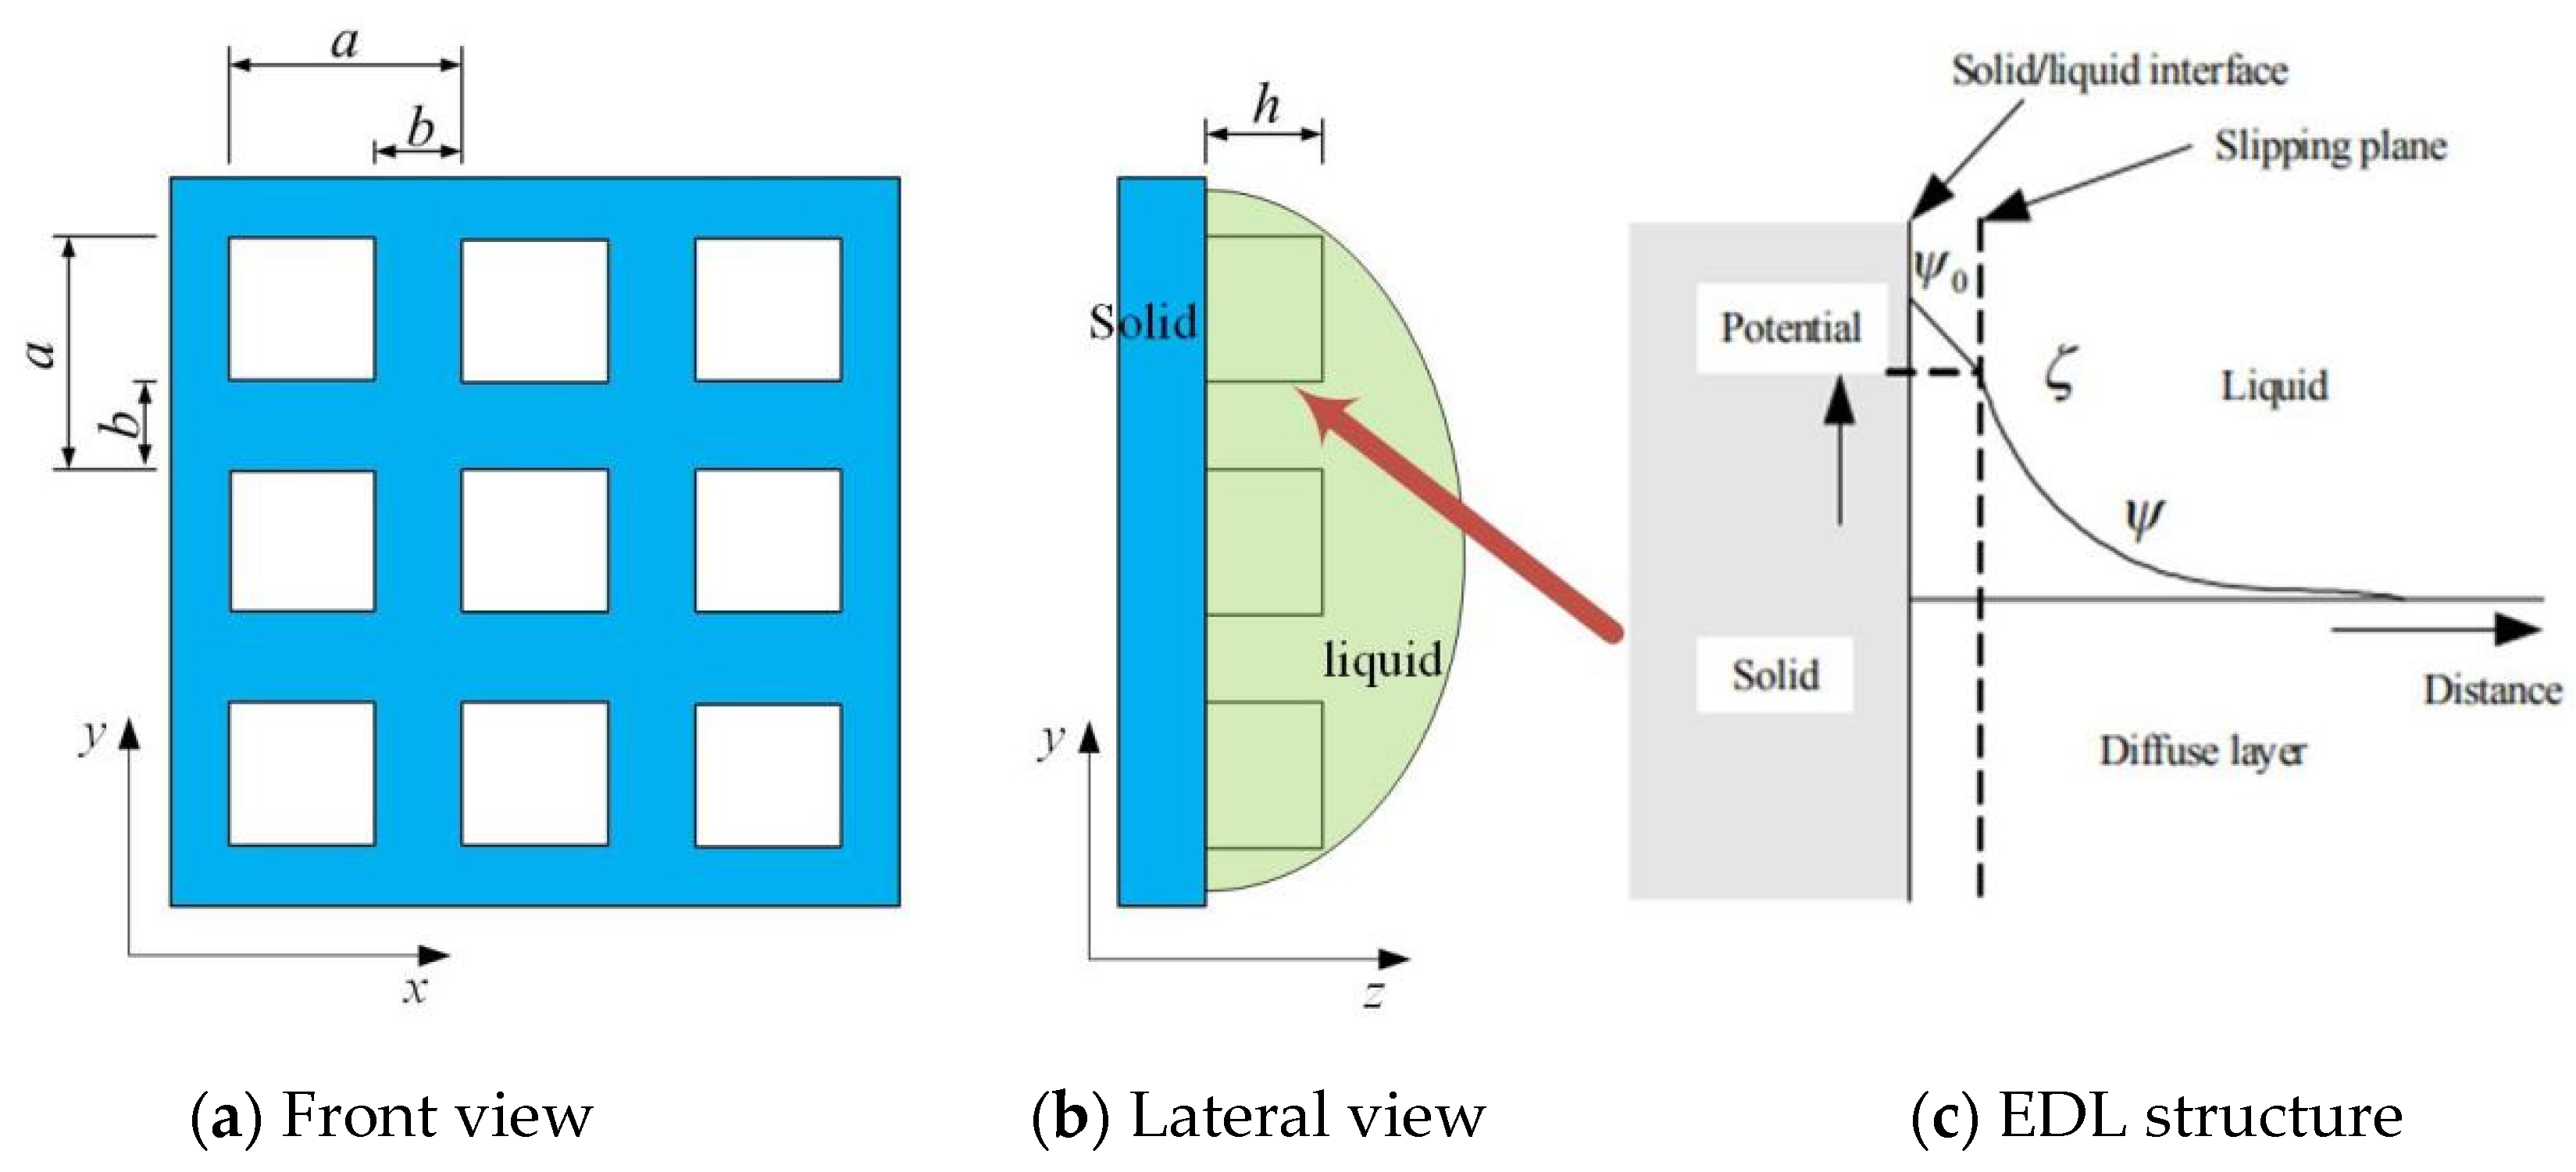
2. Electrostatic Analysis Model
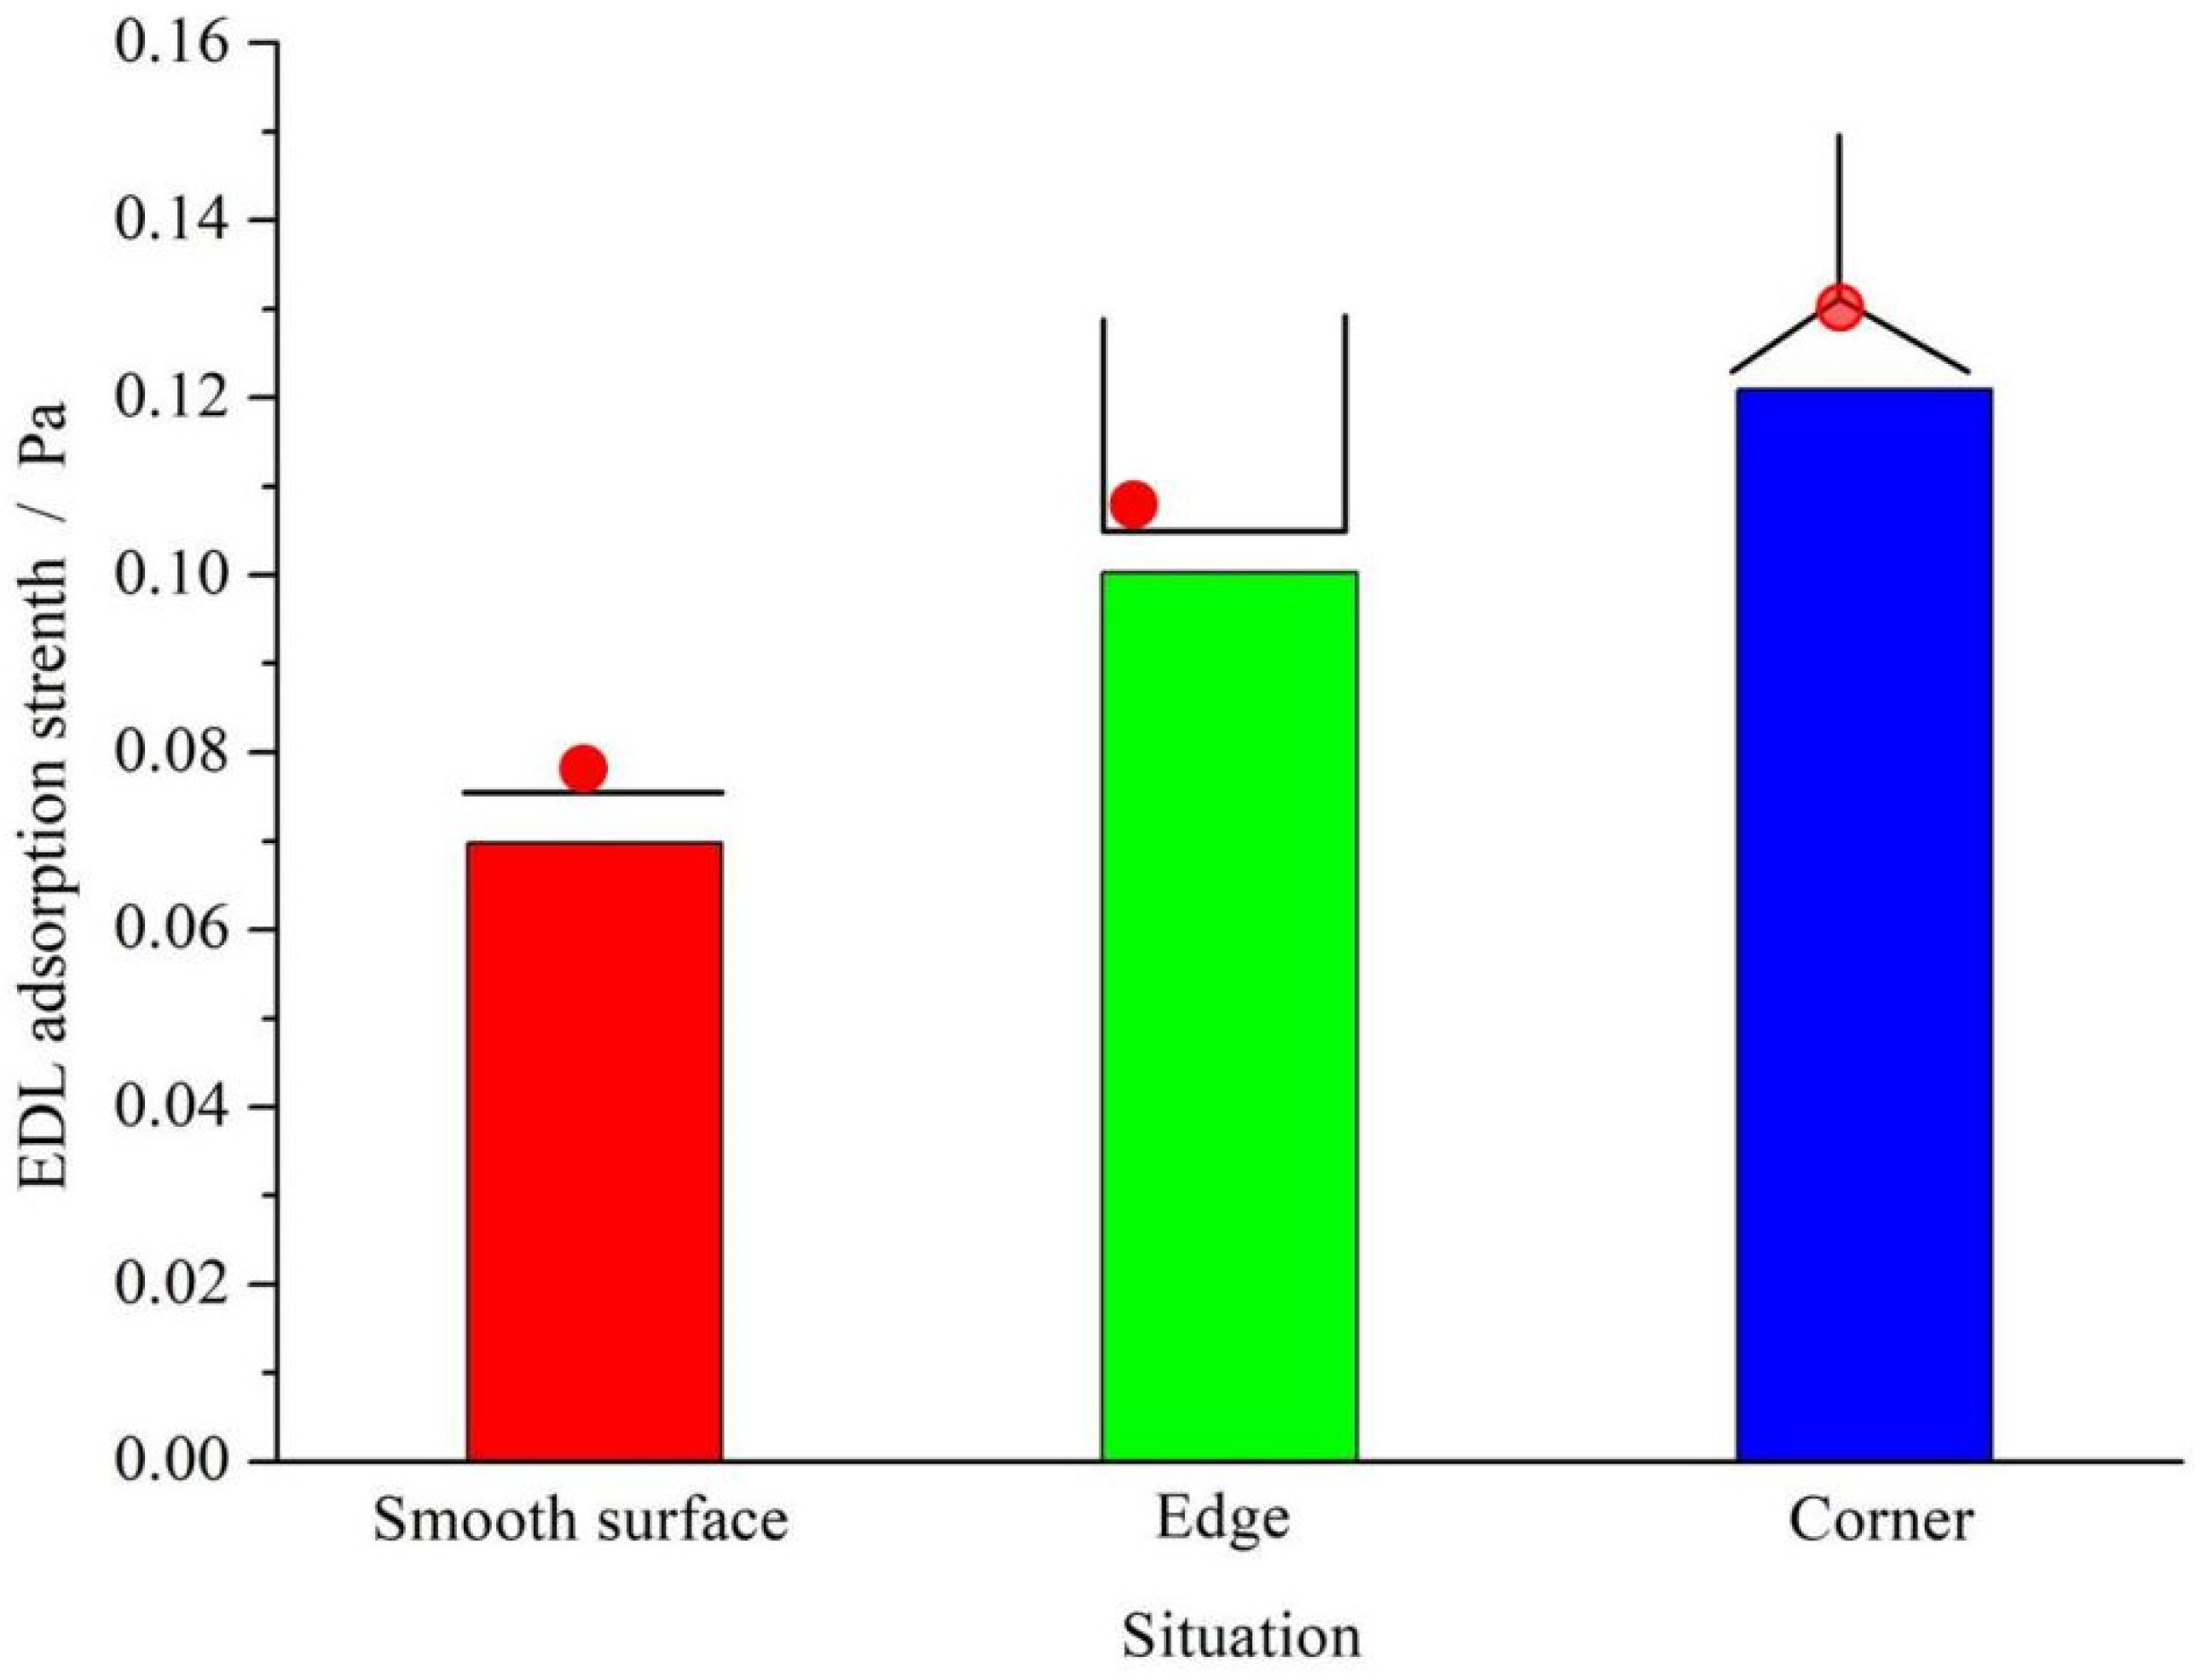
2.1. EDL Adsorption Force
2.2. EDL Surface Tension
3. Experimental Section
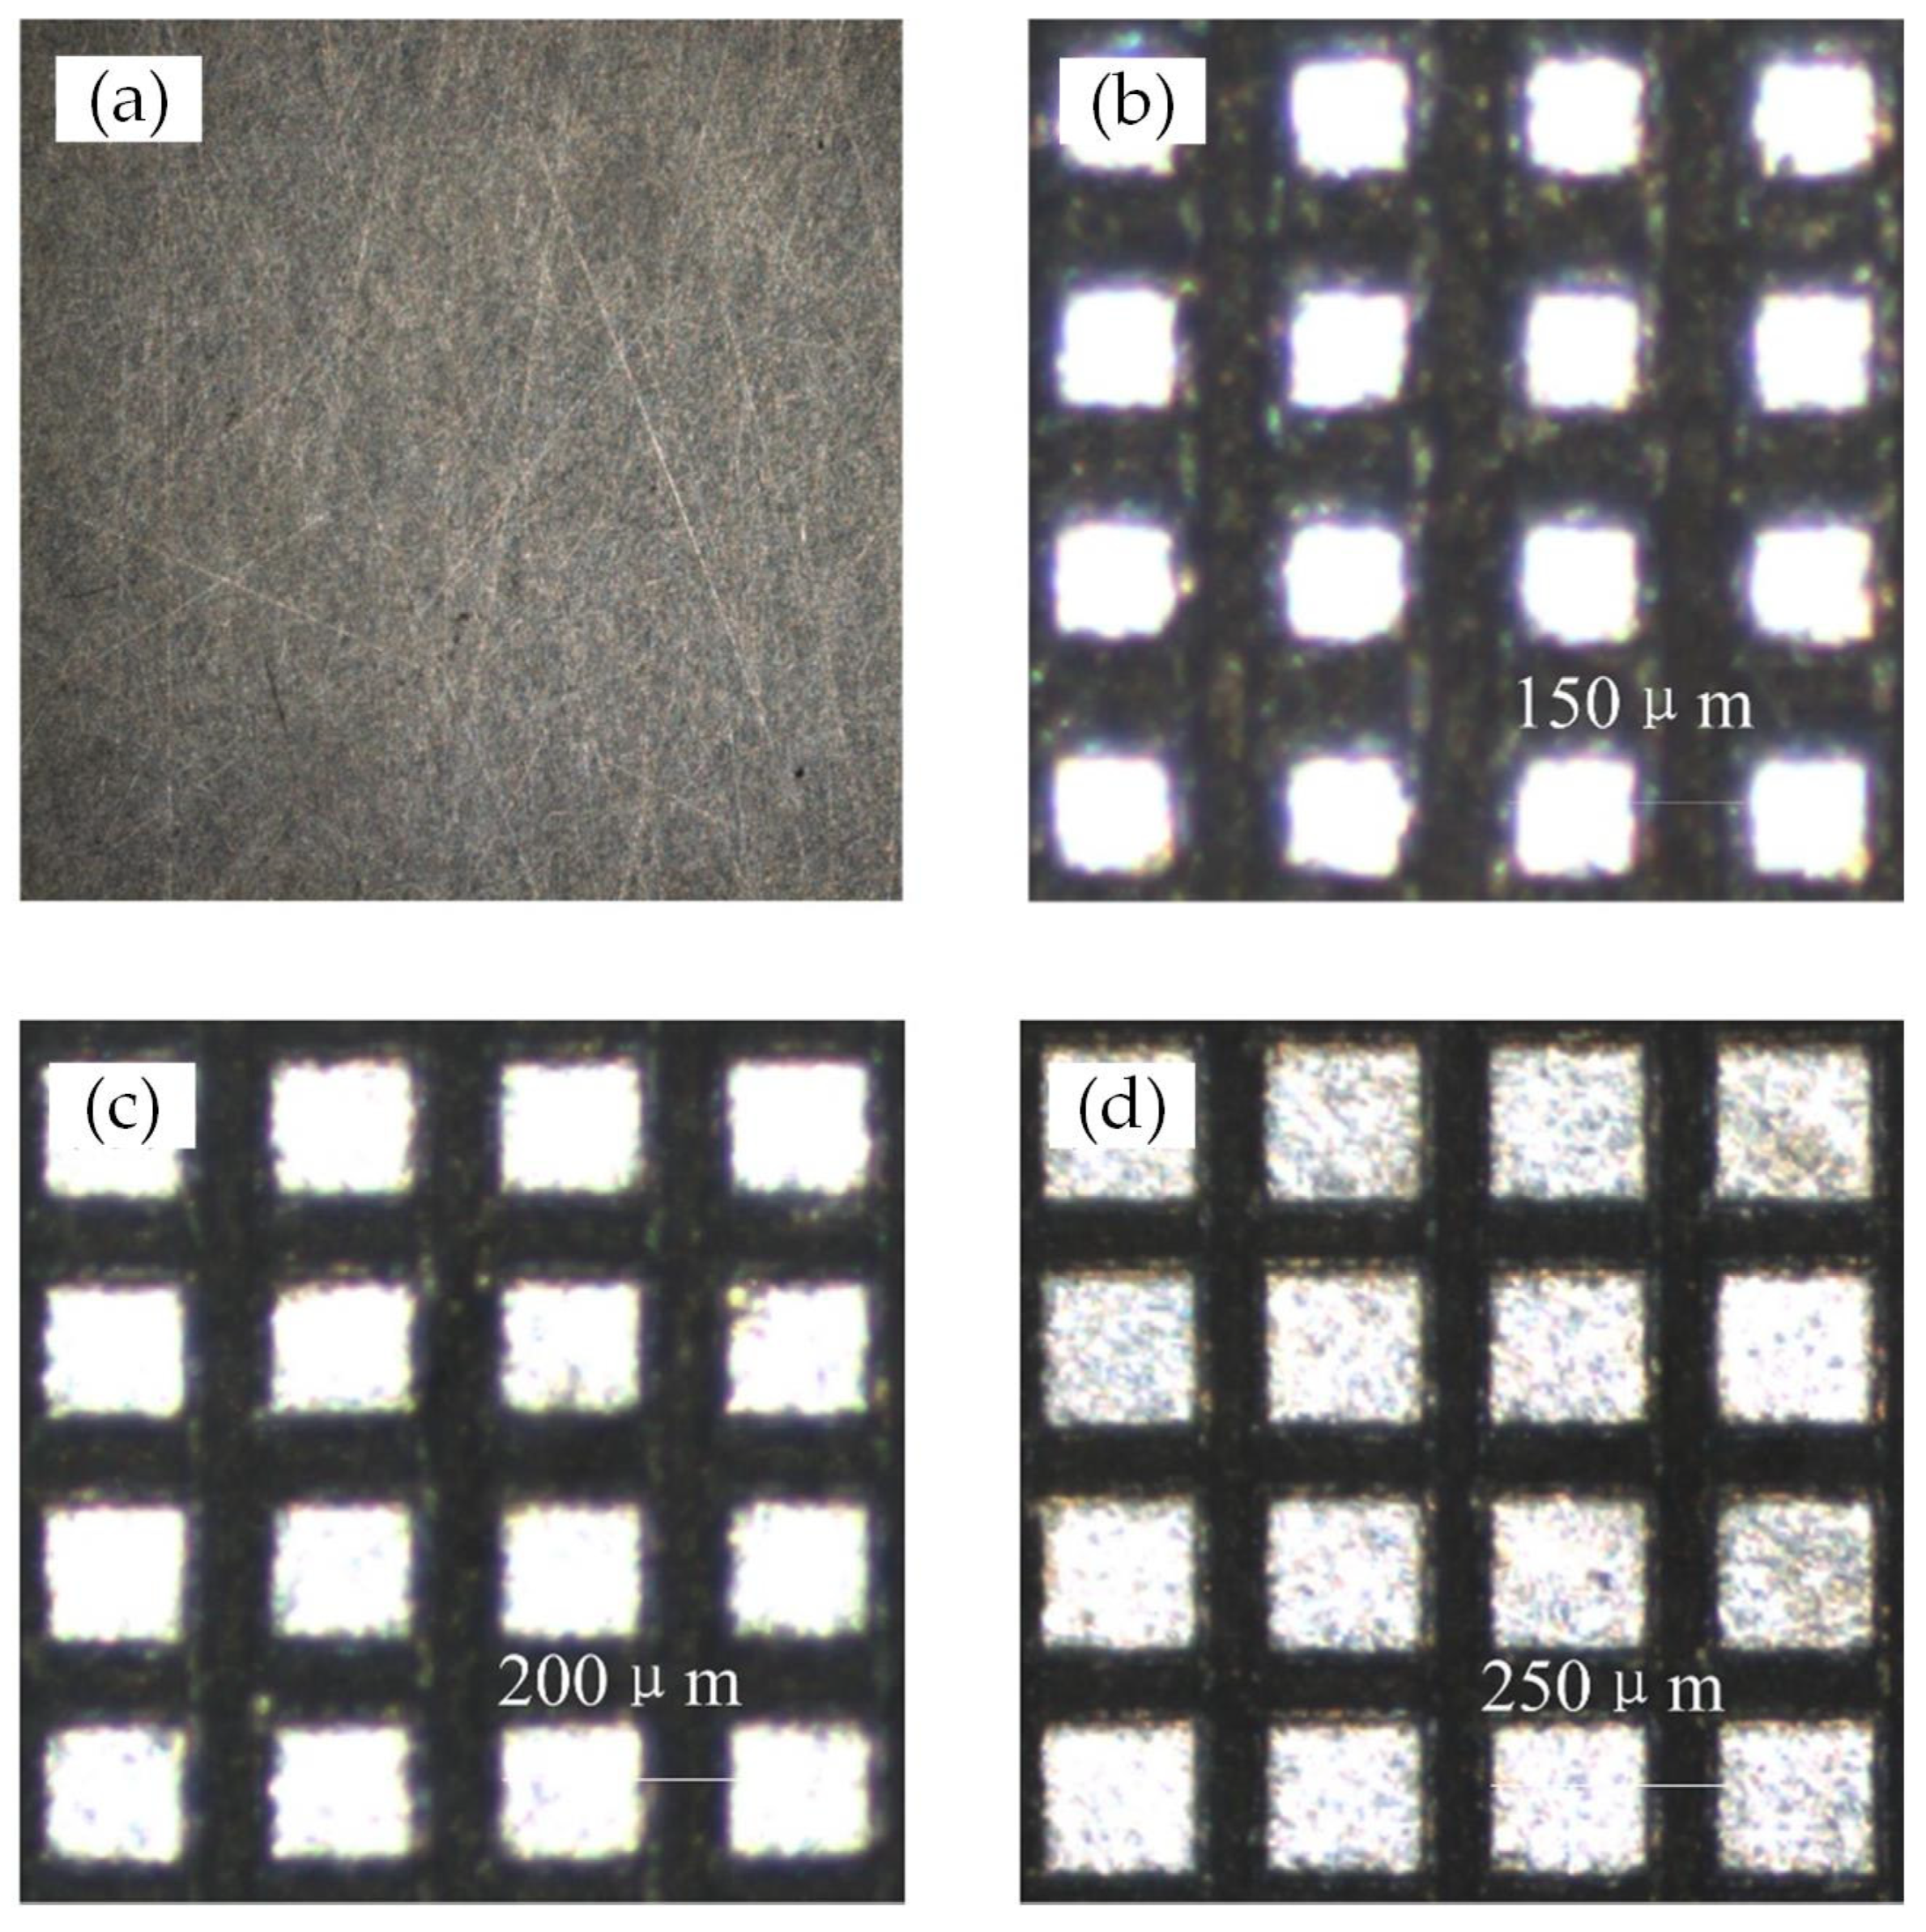
3.1. Preparation of Textured Samples
3.2. Bioactivity of Ti-6Al-4V (Laser-Treated) Surface Assay
3.2.1. Materials
3.2.2. Cell Culture
3.2.3. Field Emission Scanning Electron Microscopy (SEM) Analysis Sample Preparation
3.2.4. Fluorescence Staining Experiment
4. Results and Discussion
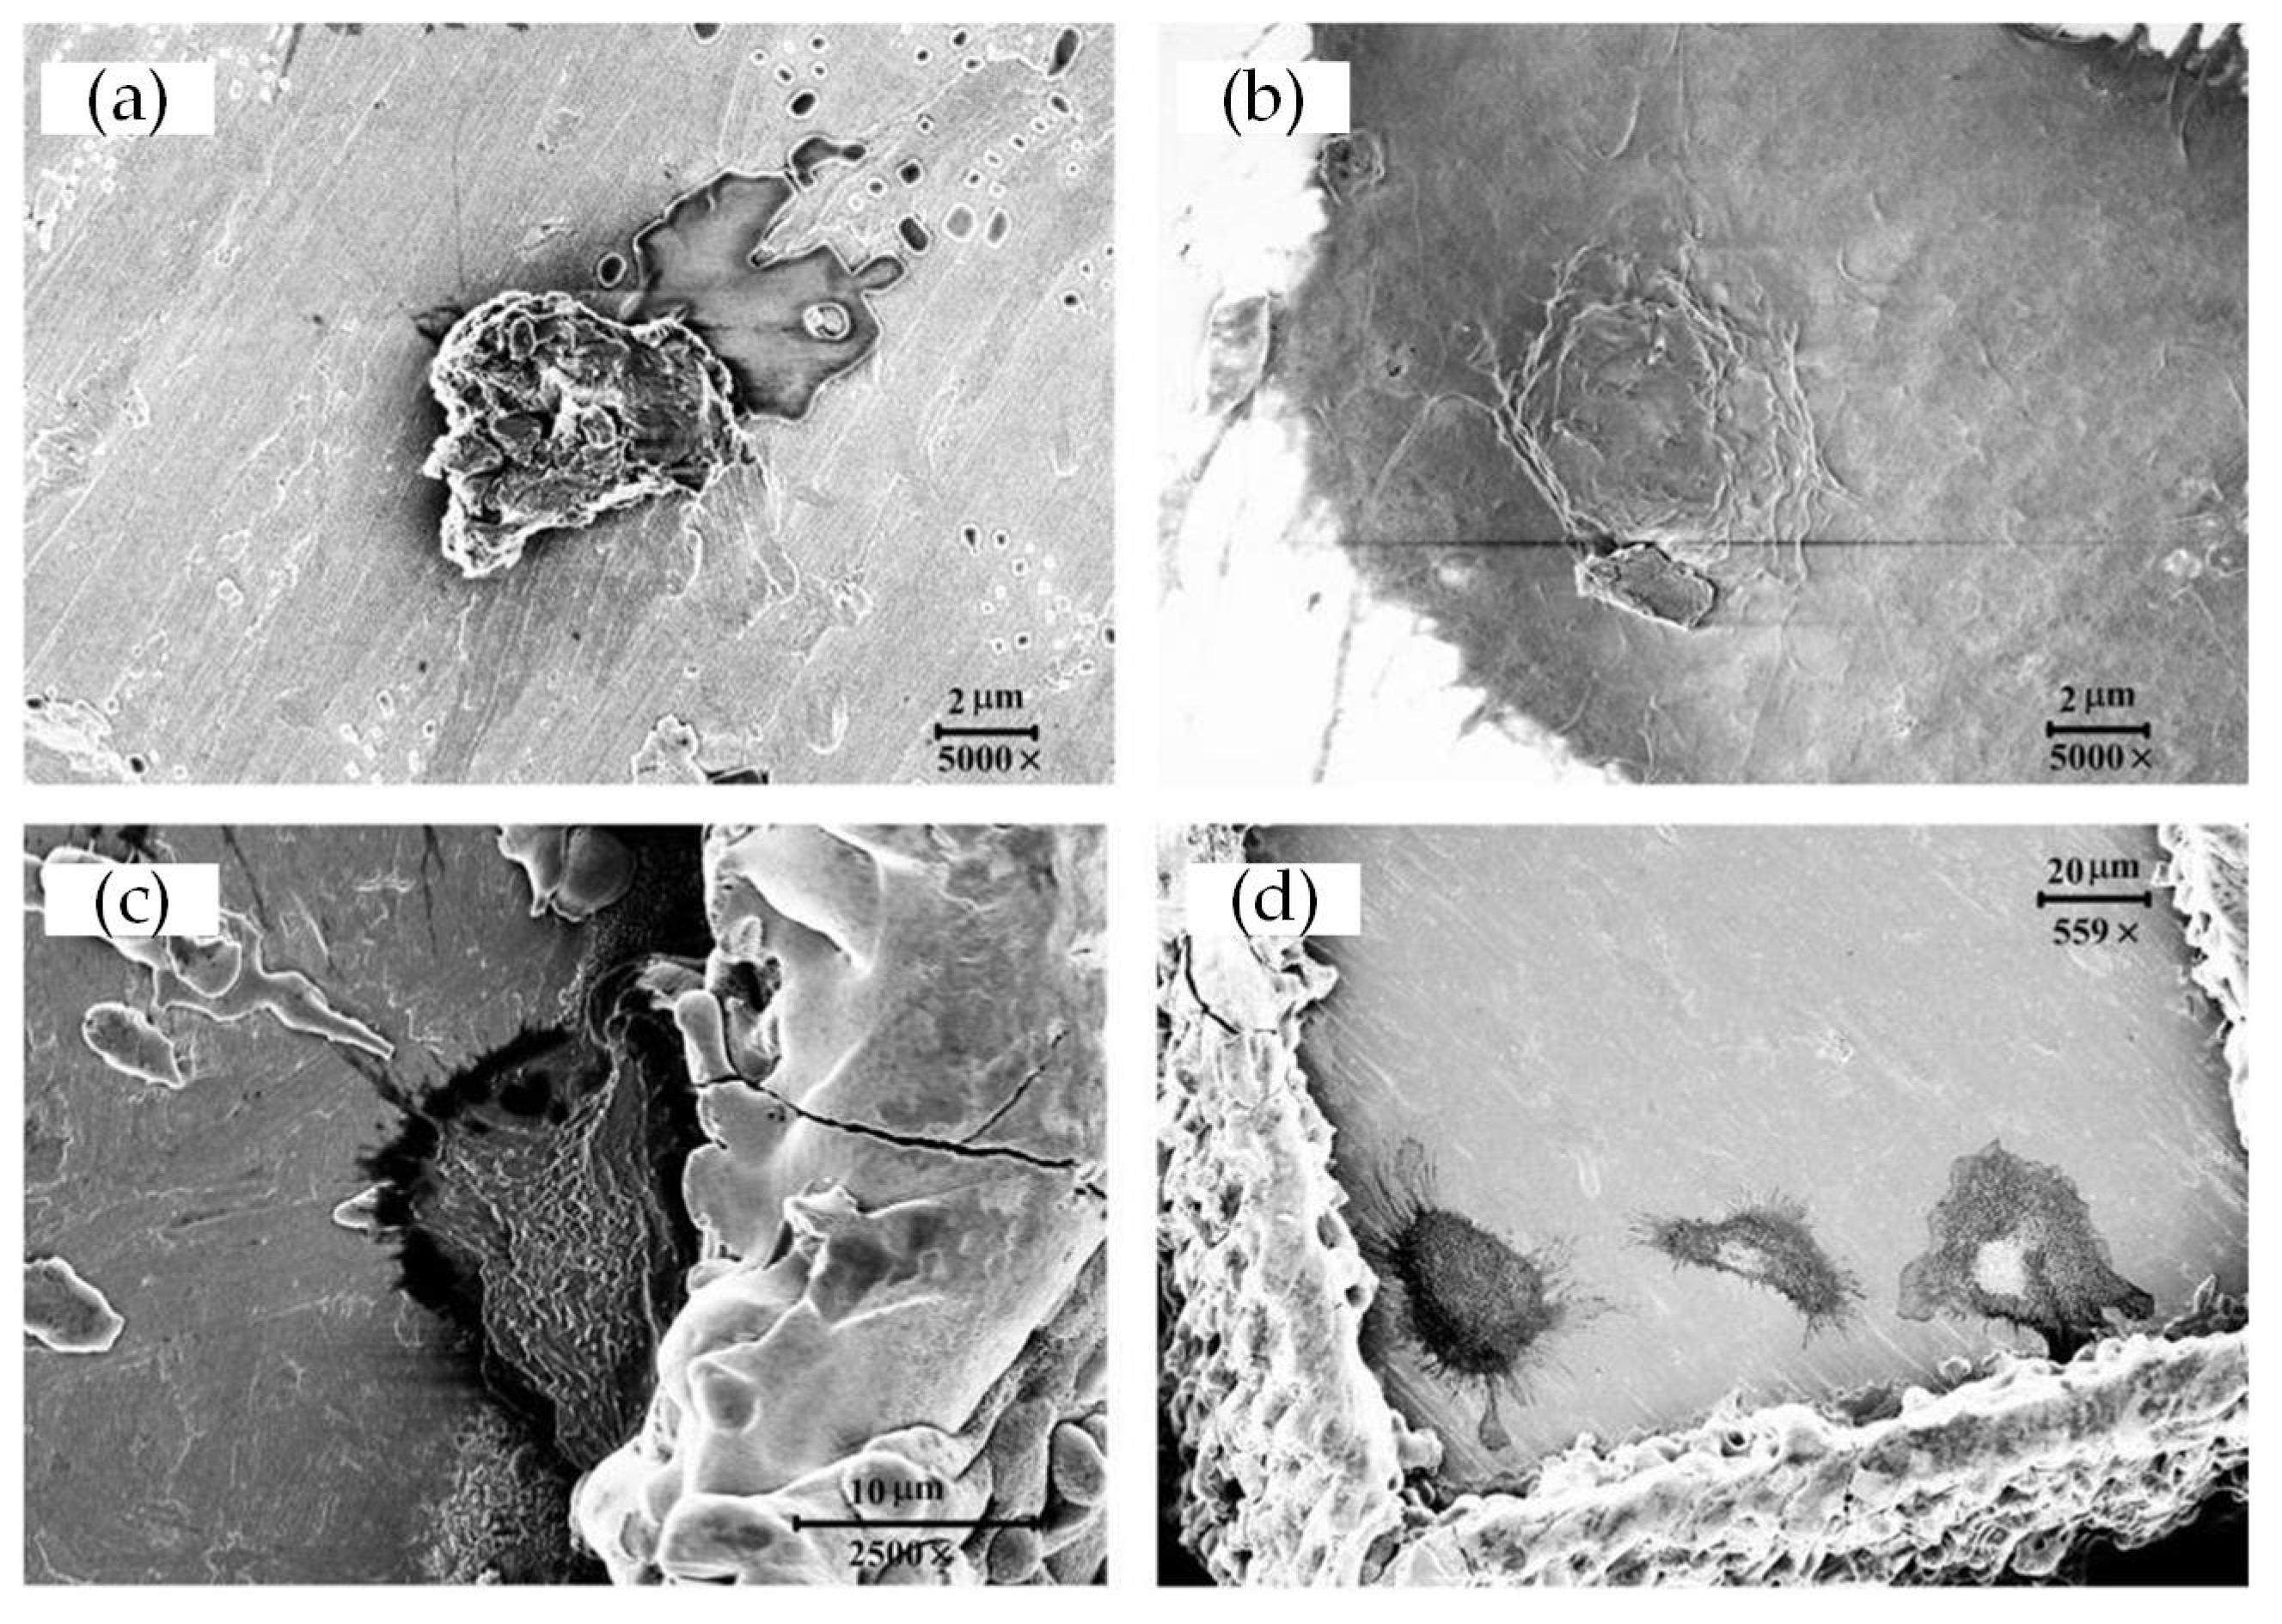
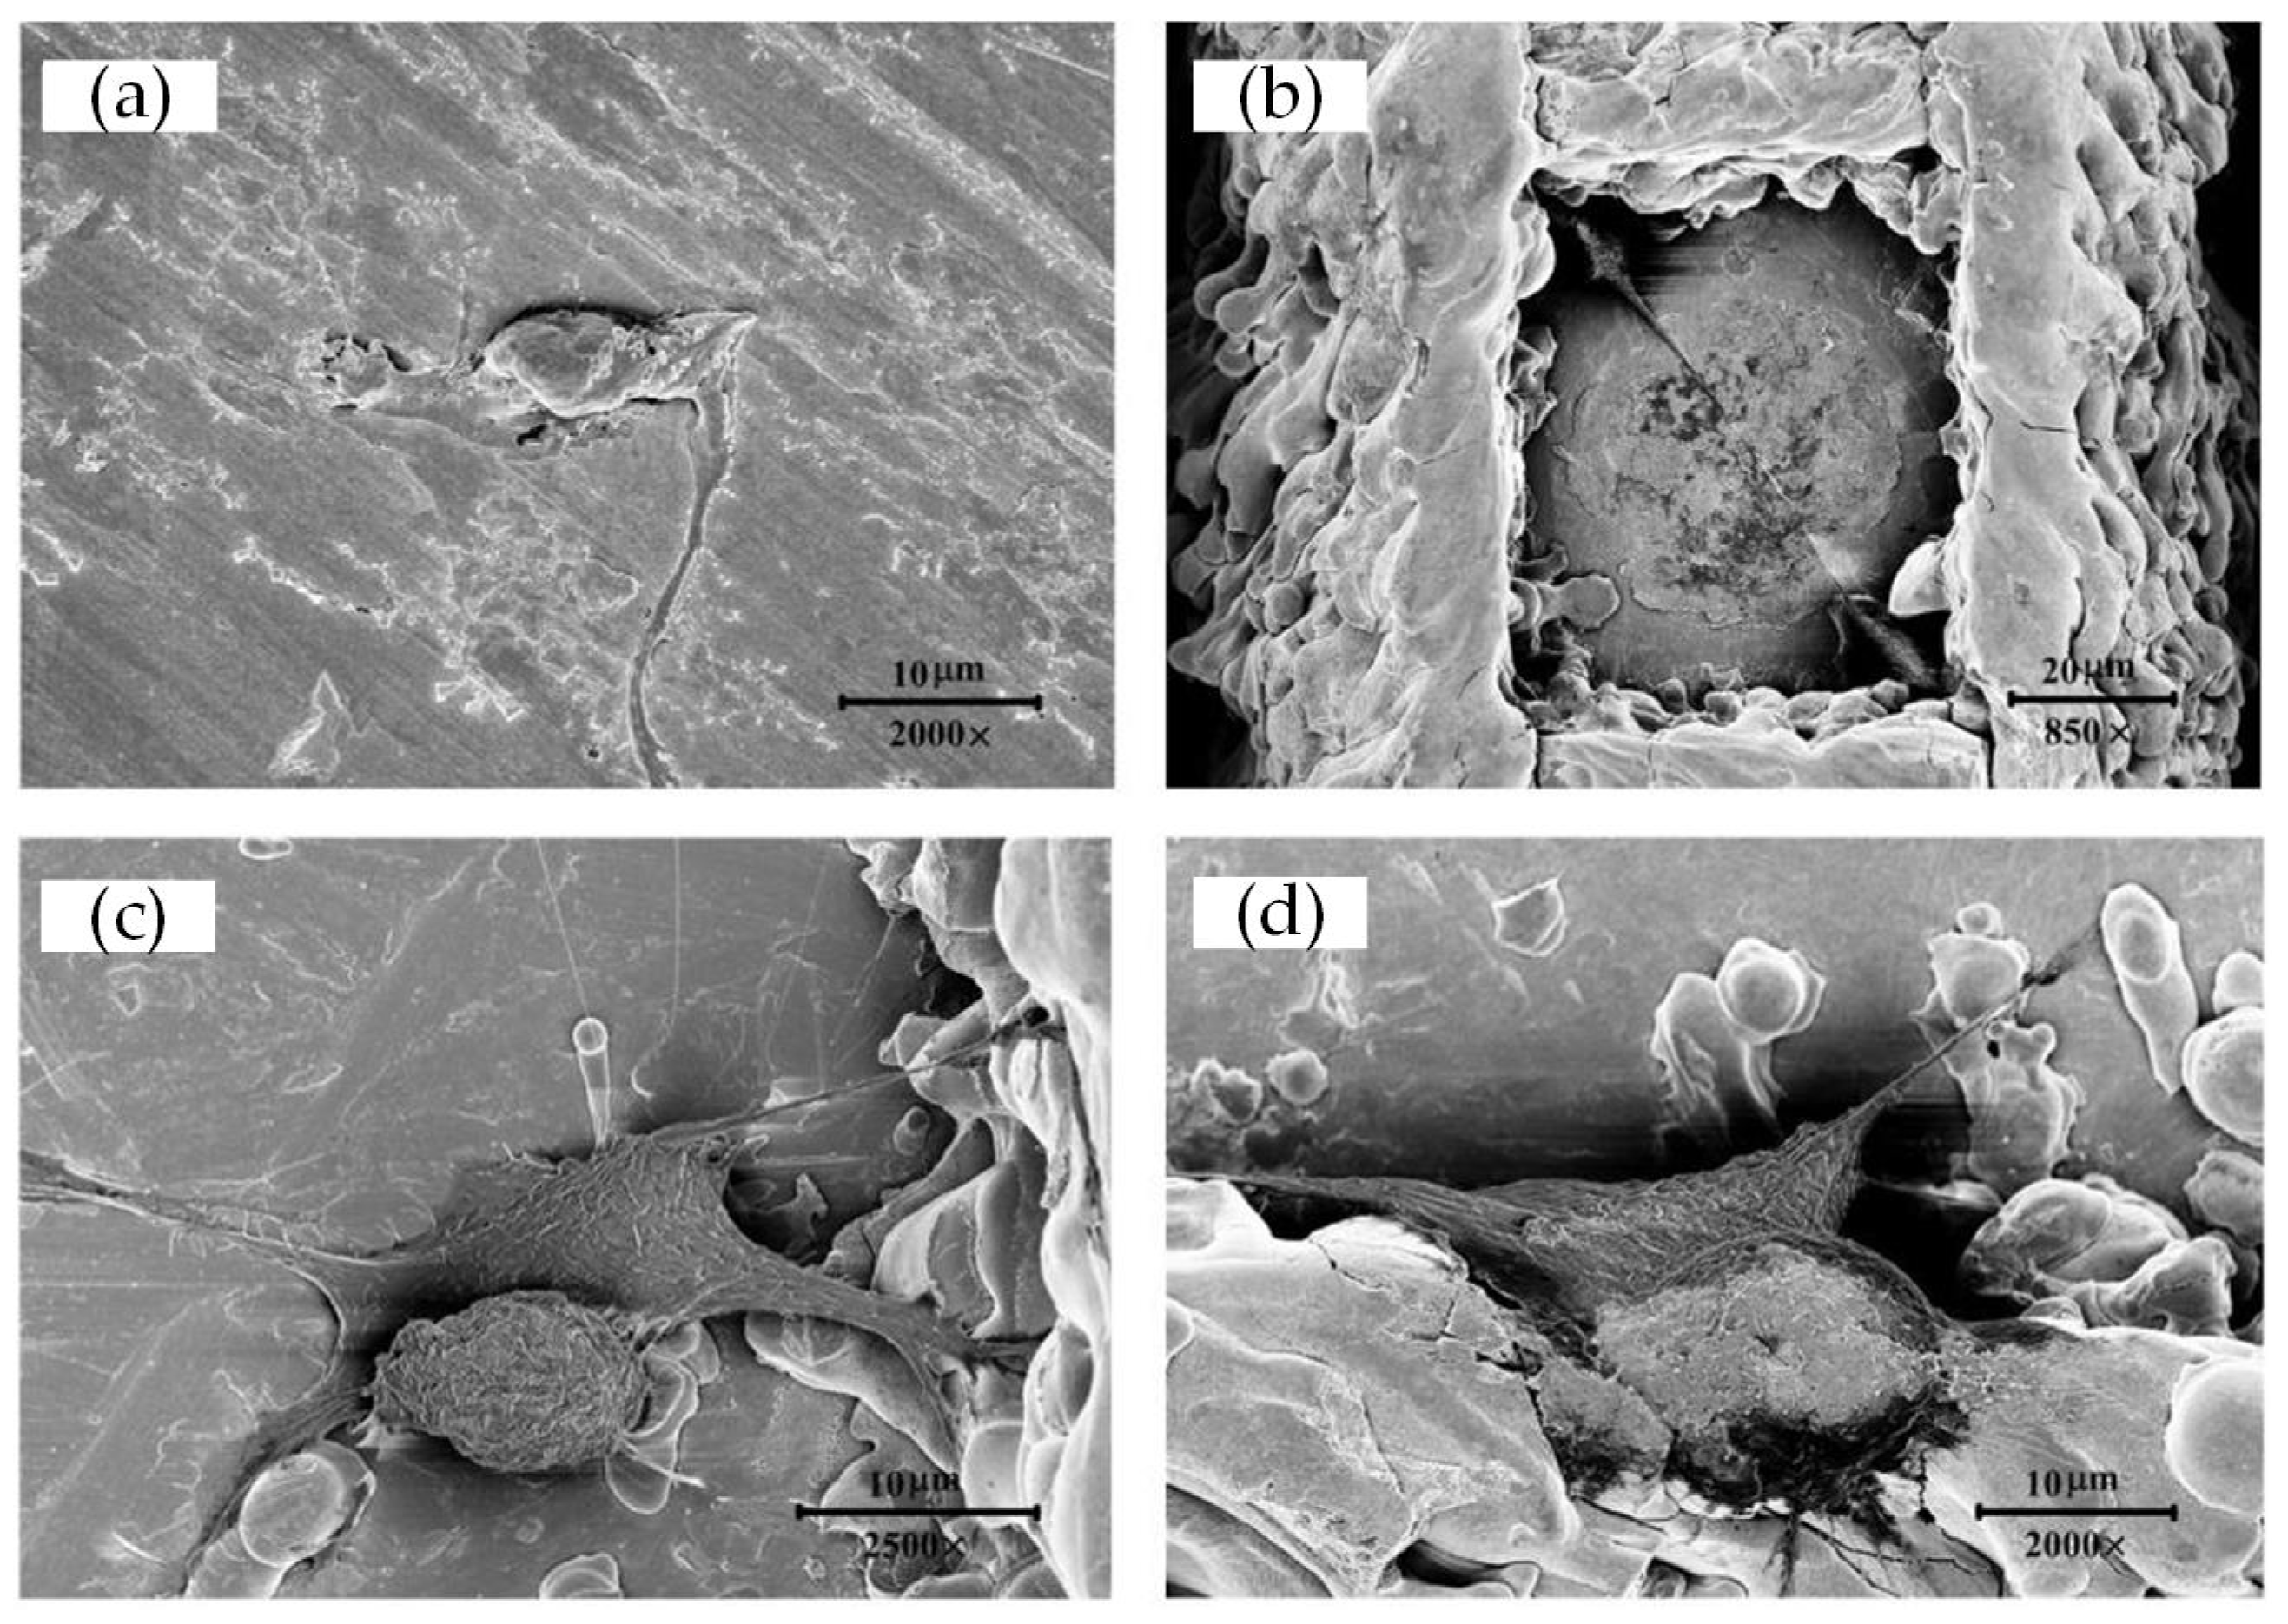
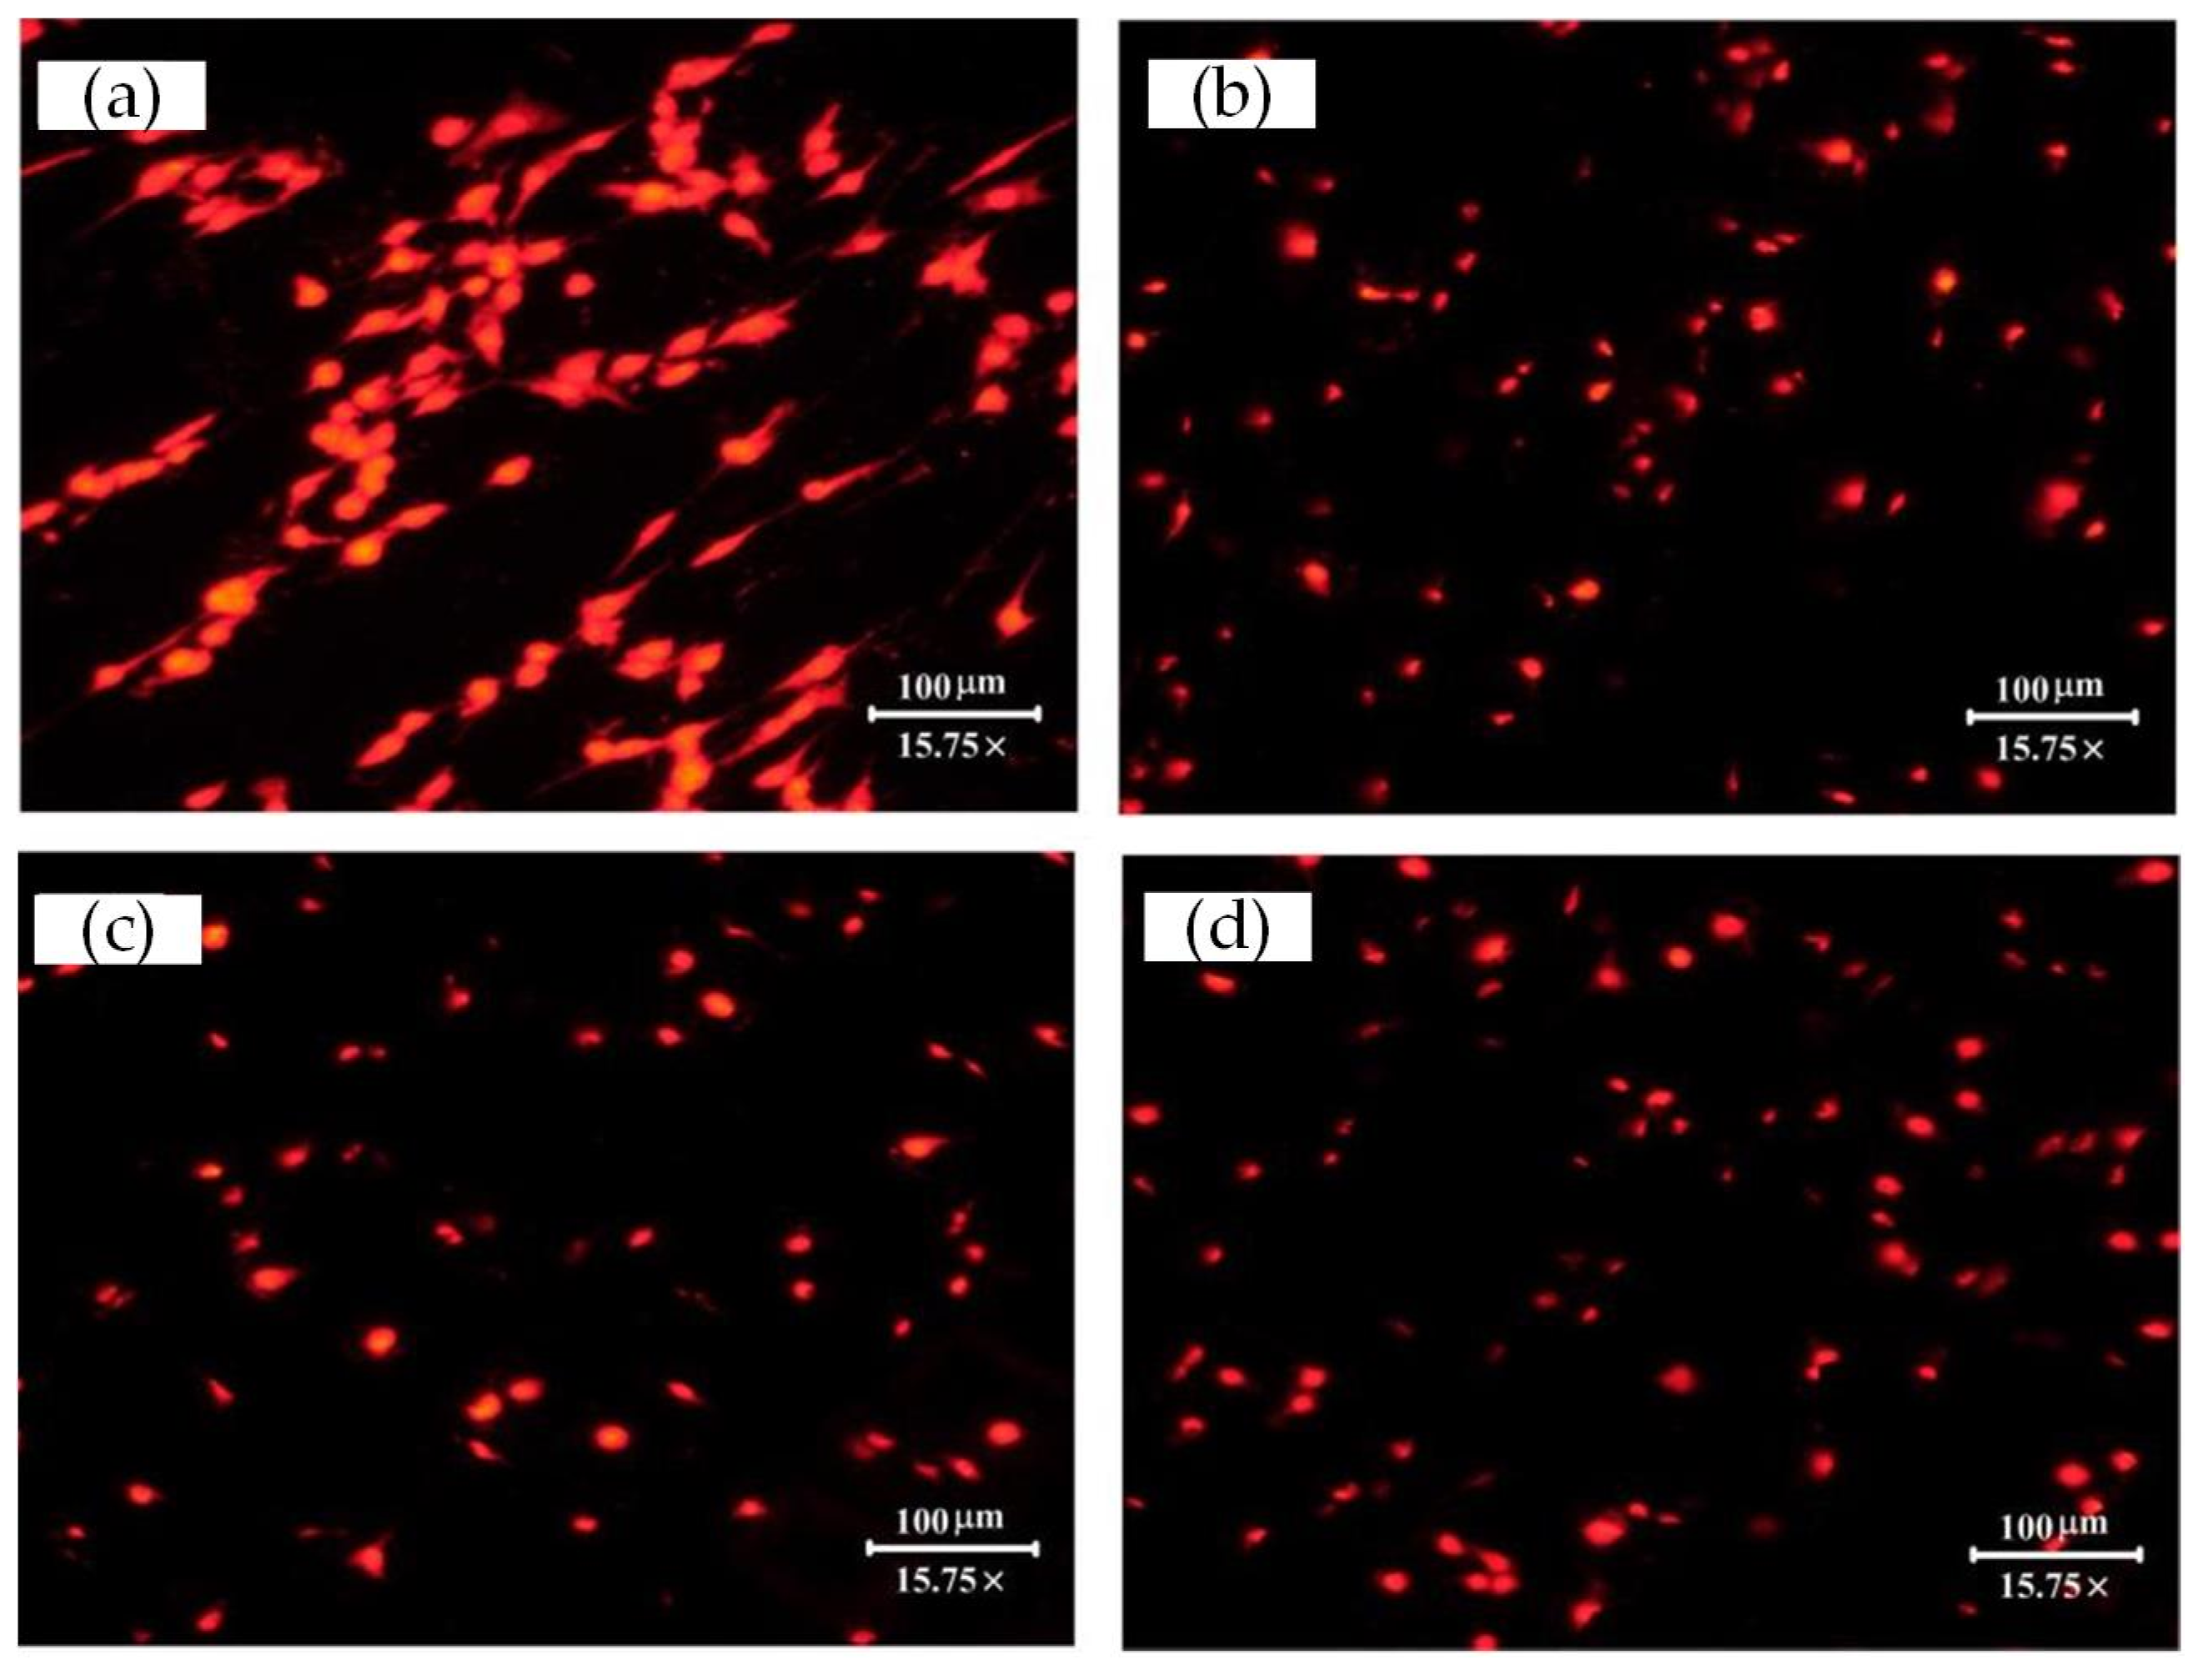
4.1. Cellular Morphology Analysis
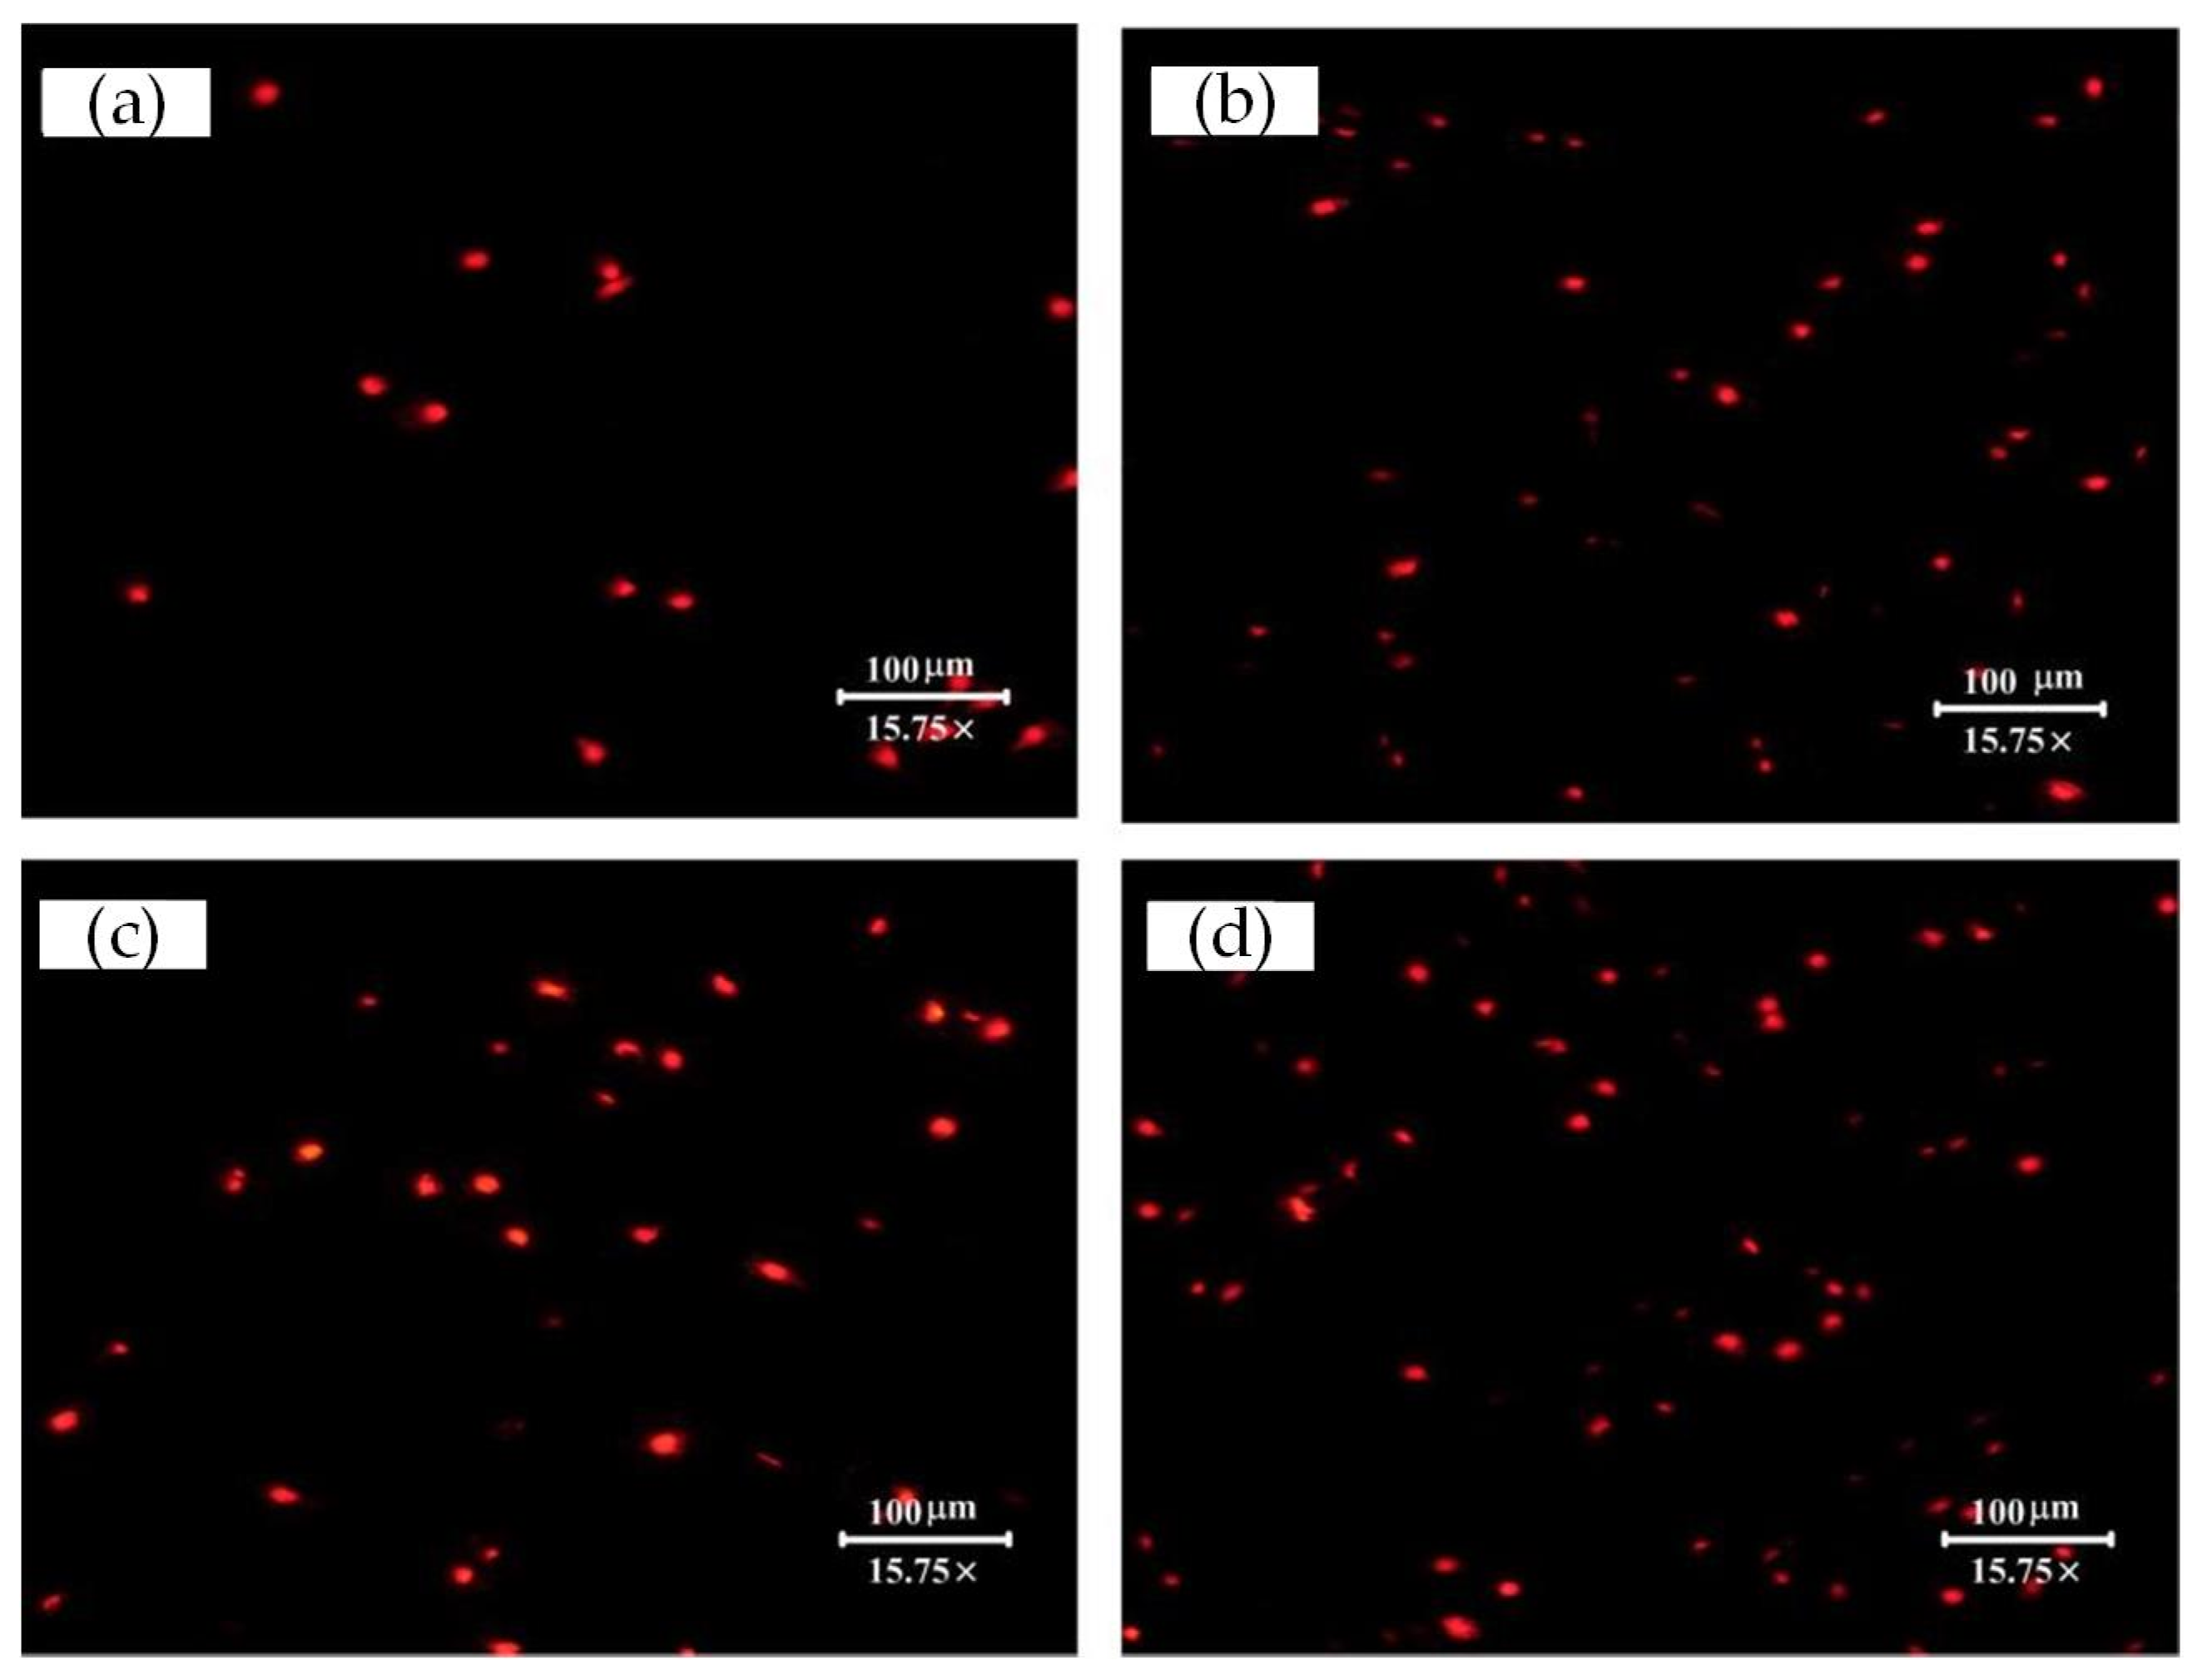
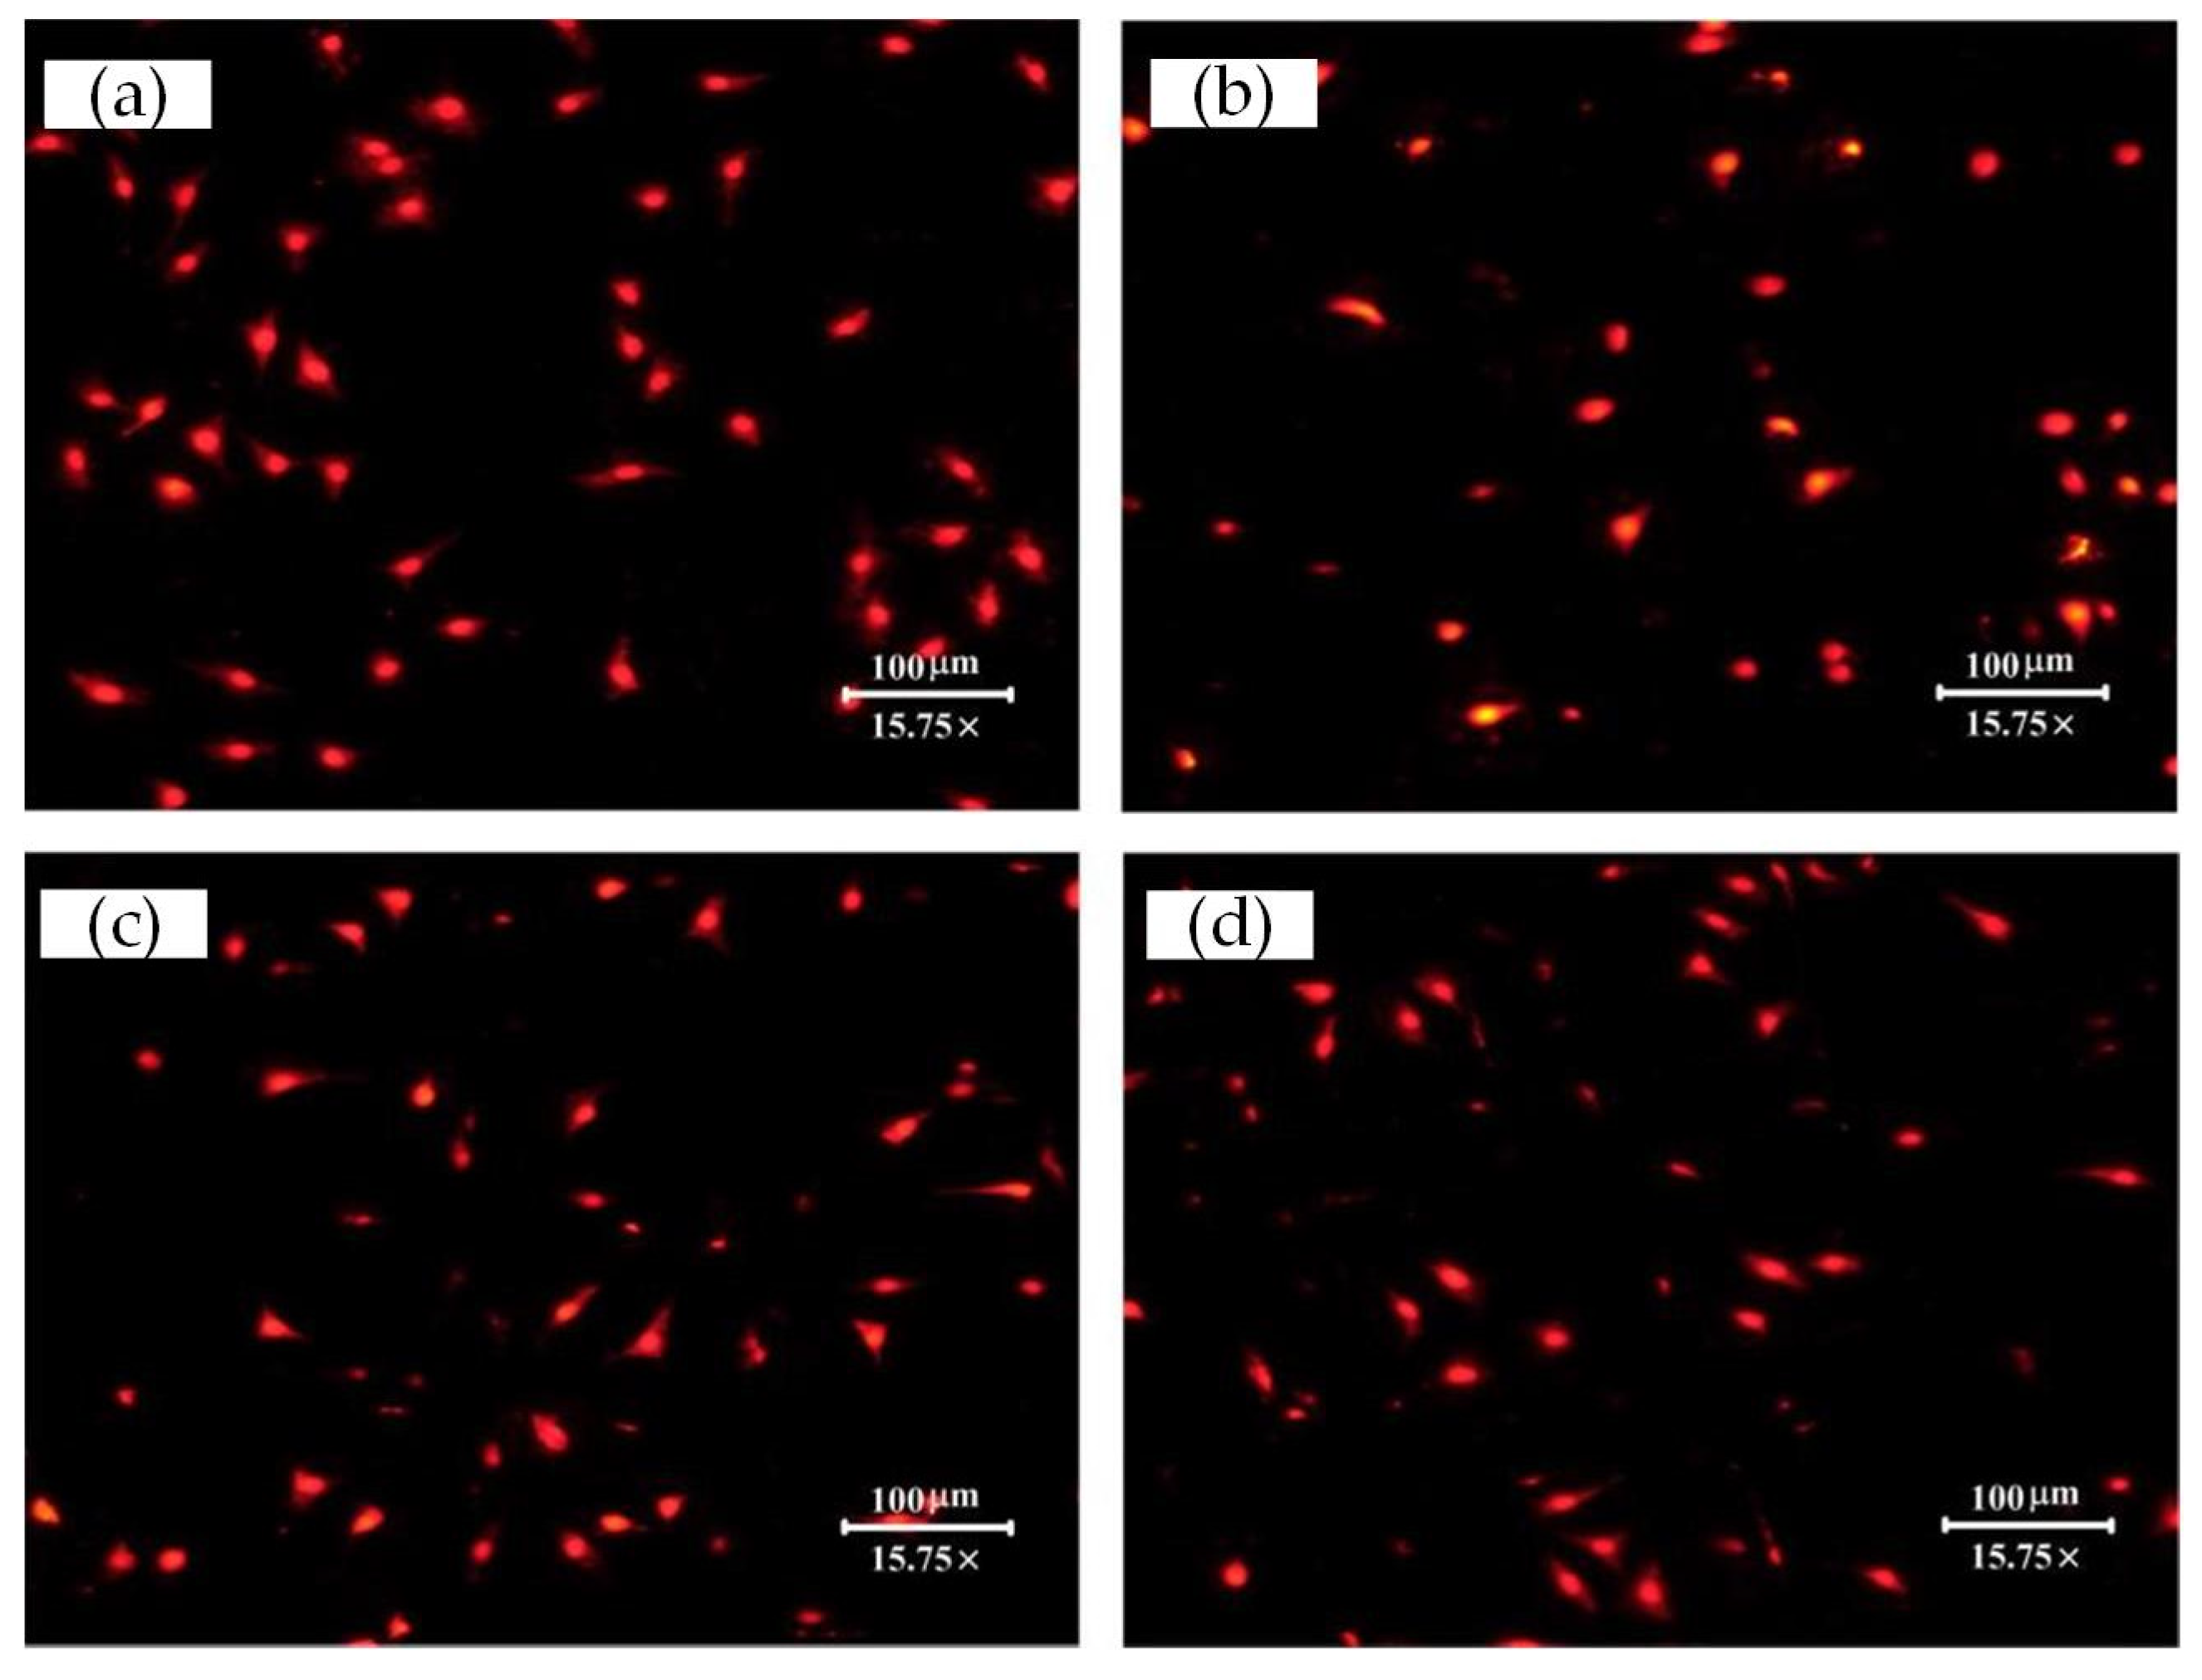
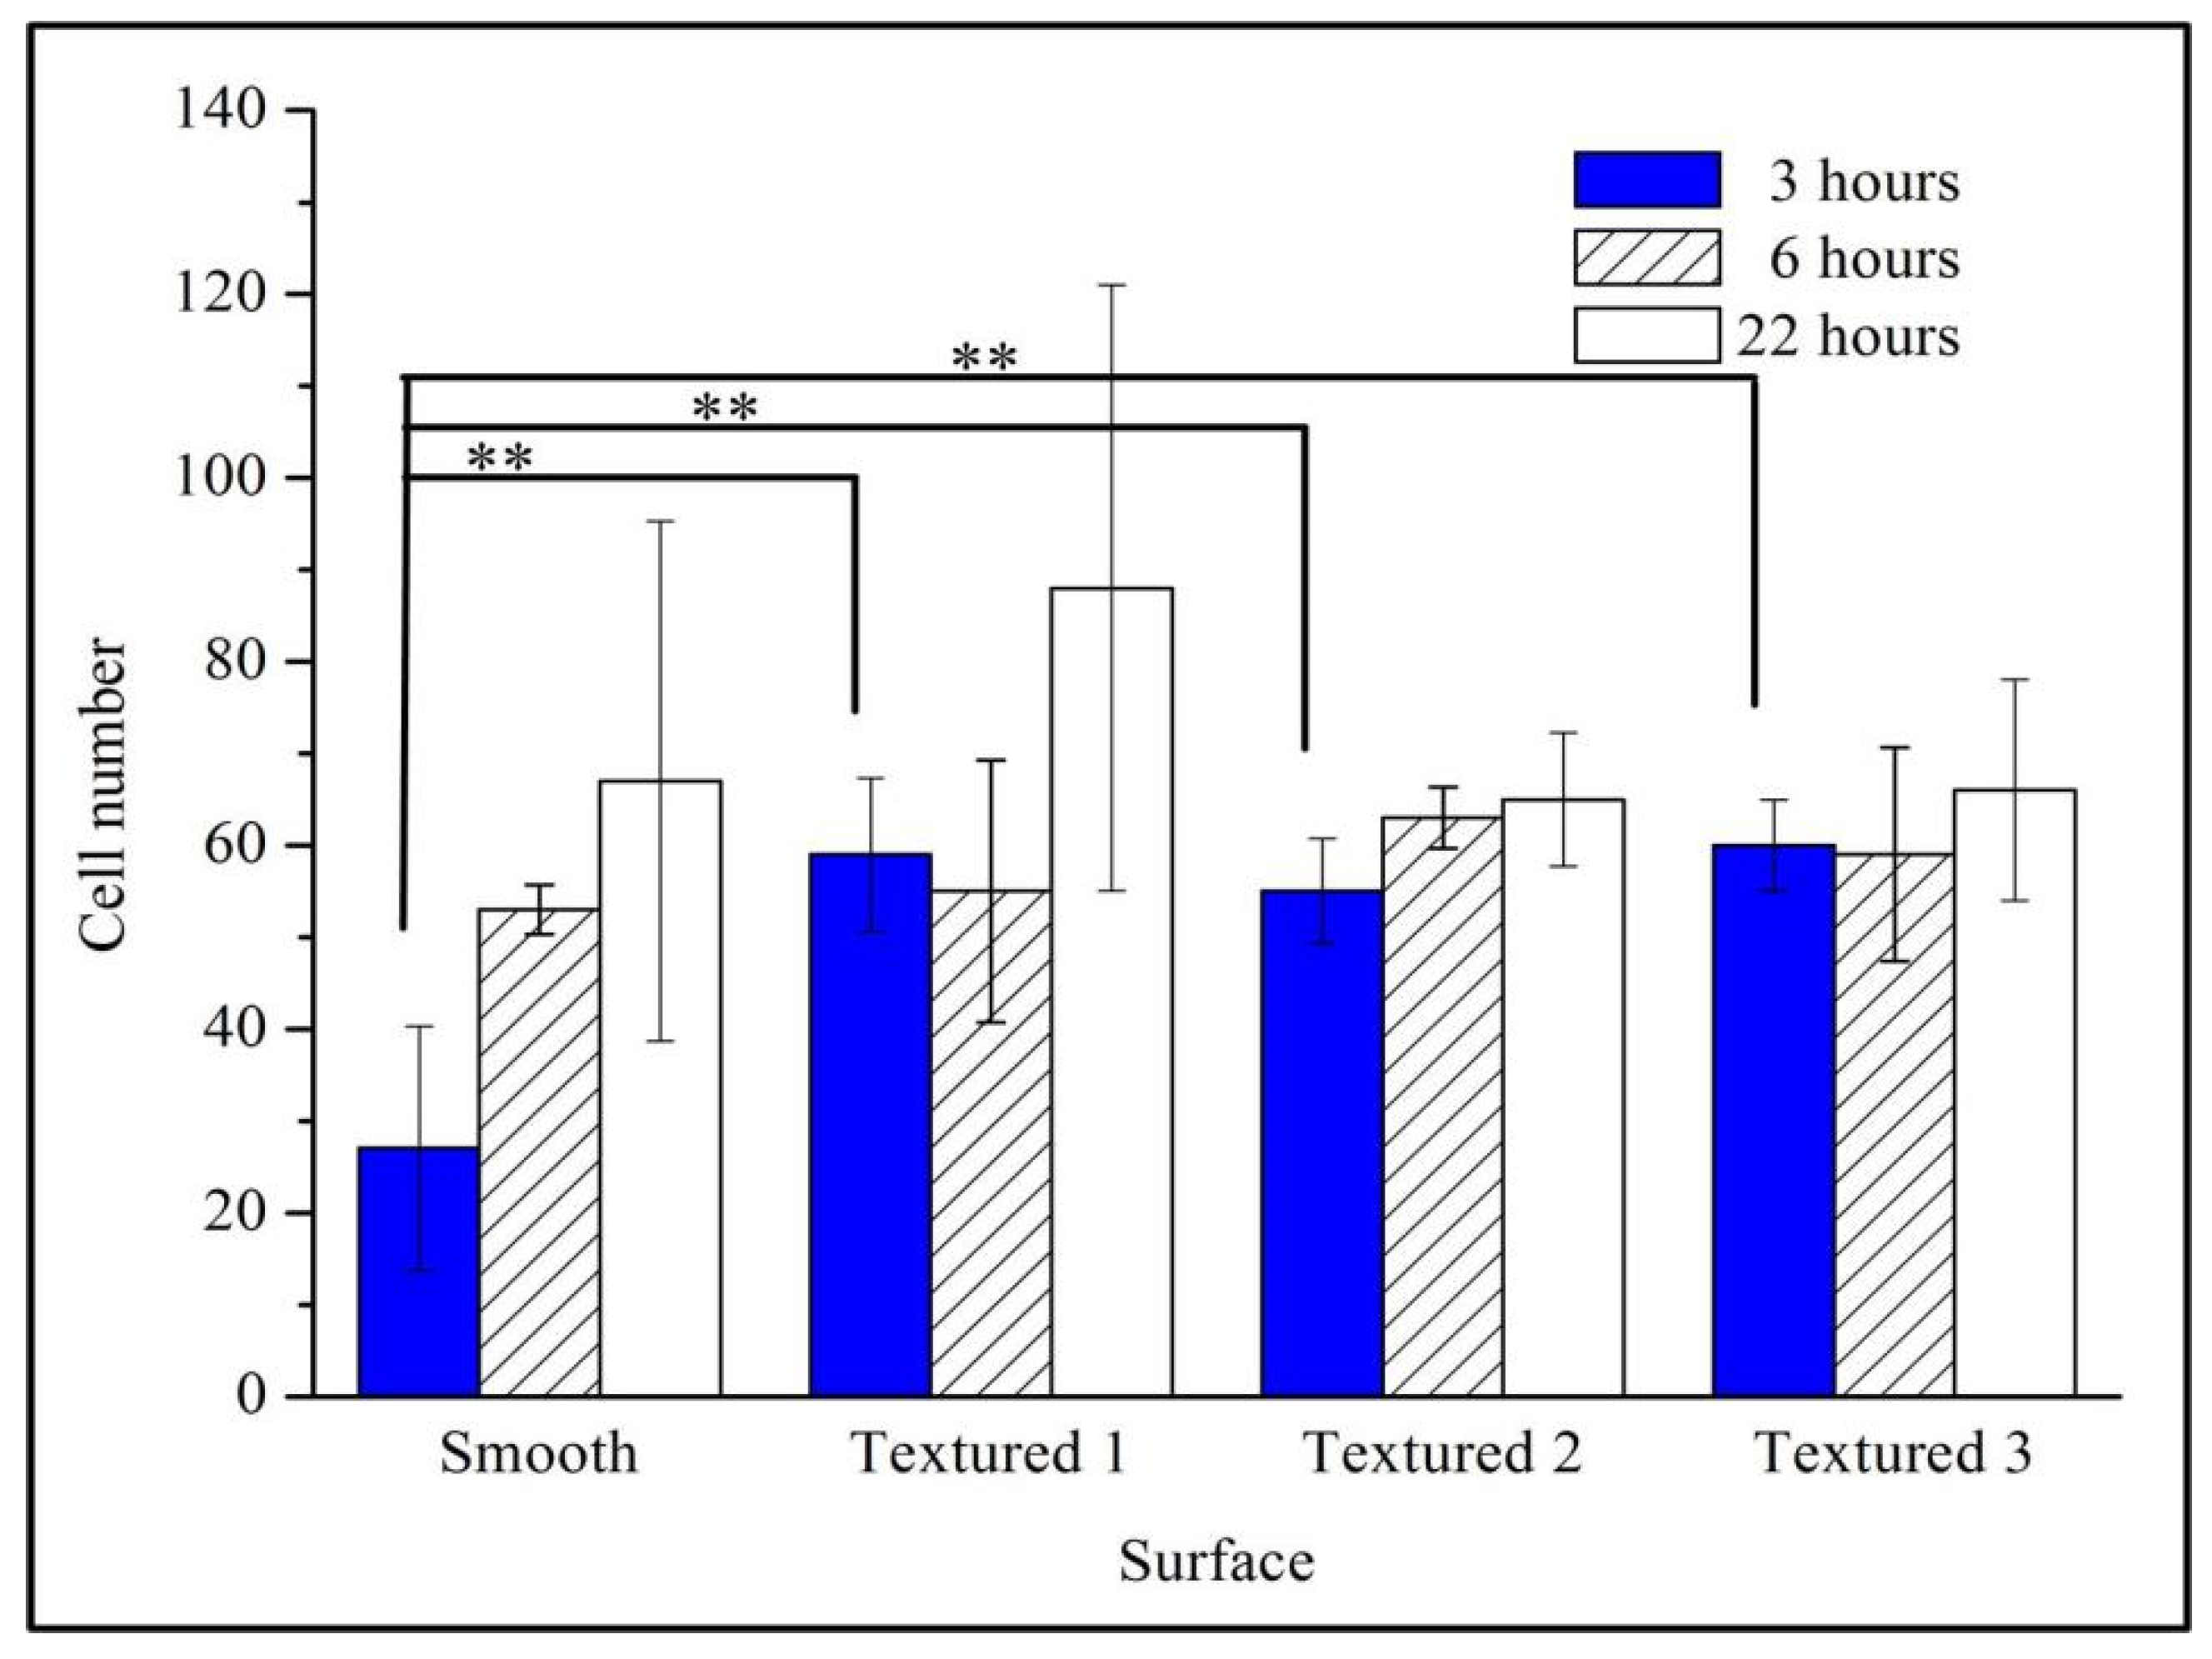
4.2. Initial Cell Attachment and Viability
4.3. Difference Analysis
5. Conclusions
Author Contributions
Funding
Institutional Review Board Statement
Informed Consent Statement
Data Availability Statement
Conflicts of Interest
References
- Fukumoto, S.; Tsubakino, H.; Inoue, S.; Liu, L.; Terasawa, M.; Mitamura, T. Surface modification of titanium by nitrogen ion implantation. Mater. Sci. Eng. A 1999, 263, 205–209. [Google Scholar] [CrossRef]
- Wang, C.; Hu, H.; Li, Z.; Shen, Y.; Xu, Y.; Zhang, G.; Zeng, X.; Deng, J.; Zhao, S.; Ren, T.; et al. Enhanced Osseointegration of Titanium Alloy Implants with Laser Microgrooved Surfaces and Graphene Oxide Coating. ACS Appl. Mater. Interfaces 2019, 11, 39470–39483. [Google Scholar] [CrossRef] [PubMed]
- Ren, B.; Wan, Y.; Wang, G.; Liu, Z.; Huang, Y.; Wang, H. Morphologically modified surface with hierarchical micro-/nano-structures for enhanced bioactivity of titanium implants. J. Mater. Sci. 2018, 53, 12679–12691. [Google Scholar] [CrossRef]
- Ferraris, S.; Bobbio, A.; Miola, M.; Spriano, S. Micro- and nano-textured, hydrophilic and bioactive titanium dental implants. Surf. Coat. Technol. 2015, 276, 374–383. [Google Scholar] [CrossRef]
- Manivasagam, G.; Dhinasekaran, D.; Rajamanickam, A. Biomedical Implants: Corrosion and its Prevention—A Review. Recent Patents Corros. Sci. 2010, 2, 40–54. [Google Scholar] [CrossRef] [Green Version]
- Zhao, G.; Raines, A.; Wieland, M.; Schwartz, Z.; Boyan, B. Requirement for both micron- and submicron scale structure for synergistic responses of osteoblasts to substrate surface energy and topography. Biomaterials 2007, 28, 2821–2829. [Google Scholar] [CrossRef] [Green Version]
- Kurella, A.; Dahotre, N.B. Review paper: Surface Modification for Bioimplants: The Role of Laser Surface Engineering. J. Biomater. Appl. 2005, 20, 5–50. [Google Scholar] [CrossRef]
- Mücklich, F.; Lasagni, A.; Daniel, C. Laser Interference Metallurgy—Using interference as a tool for micro/nano structuring. Int. J. Mater. Res. 2006, 97, 1337–1344. [Google Scholar] [CrossRef]
- Zhao, Z.; Wan, Y.; Yu, M.; Wang, H.; Cai, Y.; Liu, C.; Zhang, D. Biocompability evaluation of micro textures coated with zinc oxide on Ti-6Al-4V treated by nanosecond laser. Surf. Coat. Technol. 2021, 422, 127453. [Google Scholar] [CrossRef]
- Soboyejo, W.O.; Nemetski, B.; Allameh, S.; Marcantonio, N.; Mercer, C.; Ricci, J. Interactions between MC3T3-E1 cells and textured Ti6Al4V surfaces. J. Biomed. Mater. Res. 2002, 62, 56–72. [Google Scholar] [CrossRef]
- Anselme, K.; Linez, P.; Bigerelle, M.; Le Maguer, D.; Le Maguer, A.; Hardouin, P.; Hildebrand, H.F.; Iost, A.; Leroy, J.M. The relative influence of the topography and chemistry of TiAl6V4 surfaces on osteoblastic cell behavior. Biomaterials 2000, 21, 1567–1577. [Google Scholar] [CrossRef]
- Riccci, J.L.; Alexander, H. Laser microtexturing of implant surfaces for enhanced tissue integration. Key Eng. Mater. 2001, 198–199, 179–202. [Google Scholar] [CrossRef]
- Ulerich, J.P.; Ionescu, L.C.; Chen, J.; Soboyejo, W.O.; Arnold, C.B. Modifications of Ti-6Al-4V surfaces by direct-write laser machining of linear grooves. Int. Soc. Opt. Eng. 2007, 6458, 645819. [Google Scholar]
- Kumari, R.; Scharnweber, T.; Pfleging, W.; Besser, H.; Majumdar, J.D. Laser surface textured titanium alloy (Ti-6Al-4V)—Part II-Studies on bio-compatibility. Appl. Surf. Sci. 2015, 357, 750–758. [Google Scholar] [CrossRef]
- Behera, R.; Das, A.; Hasan, A.; Pamu, D.; Pandey, L.; Sankar, M. Deposition of biphasic calcium phosphate film on laser surface textured Ti–6Al–4V and its effect on different biological properties for orthopedic applications. J. Alloys Compd. 2020, 842, 155683. [Google Scholar] [CrossRef]
- Pratap, T.; Patra, K. Mechanical micro-texturing of Ti-6Al-4V surfaces for improved wettability and bio-tribological performances. Surf. Coat. Technol. 2018, 340, 71–81. [Google Scholar] [CrossRef]
- Kitahara, A.; Watanabe, A. Electrical Phenomena at Interfaces; Peking University Press: Beijing, China, 1992. [Google Scholar]
- Hiemenz, P.C. Principles of Colloid and Surface Chemistry; Peking University Press: Beijing, China, 1986. [Google Scholar]
- Guo, Y.J. Experimental Techniques of Protein Electrophoresis; Science Press: Beijing, China, 1999. [Google Scholar]
- Li, D.Q. Electro-Viscous Effects on Pressure-Driven Liquid Flow in Microchannles. Colloids Surf. A Physicochem. Eng. Aspects 2001, 195, 35–57. [Google Scholar] [CrossRef]
- Paillat, T.; Moreau, E.; Touchard, G. Space charge density at the wall in the case of heptane flowing through an insulating pipe. J. Electrost. 2001, 53, 171–182. [Google Scholar] [CrossRef]
- Bai, S.; Huang, P.; Meng, Y.; Wen, S. Modeling and analysis of interfacial electro-kinetic effects on thin film lubrication. Tribol. Int. 2006, 39, 1405–1412. [Google Scholar] [CrossRef]
- Tandon, B.; Magaz, A.; Balint, R.; Blaker, J.J.; Cartmell, S.H. Electroactive biomaterials: Vehicles for controlled delivery of therapeutic agents for drug delivery and tissue regeneration. Adv. Drug Deliv. Rev. 2018, 129, 148–168. [Google Scholar] [CrossRef] [Green Version]
- Pietak, A.; Levin, M. Bioelectrical control of positional information in development and regeneration: A review of conceptual and computational advances. Prog. Biophys. Mol. Biol. 2018, 137, 52–68. [Google Scholar] [CrossRef] [PubMed]
- Liu, Z.G.; Dong, L.Q.; Cheng, K.; Luo, Z.; Weng, W. Charge injection based electrical stimulation on polypyrrole planar electrodes to regulate cellular osteogenic difffferentiation. RSC Adv. 2018, 8, 18470. [Google Scholar] [CrossRef] [PubMed] [Green Version]
- Tang, B.; Zhuang, J.; Wang, L.; Zhang, B.; Lin, S.; Jia, F.; Dong, L.; Wang, Q.; Cheng, K.; Weng, W.-J. Harnessing Cell Dynamic Responses on Magnetoelectric Nanocomposite Films to Promote Osteogenic Differentiation. ACS Appl. Mater. Interfaces 2018, 10, 7841–7851. [Google Scholar] [CrossRef]
- McLaughlin, K.A.; Levin, M. Bioelectric signaling in regeneration: Mechanisms of ionic controls of growth and form. Dev. Biol. 2017, 433, 177–189. [Google Scholar] [CrossRef] [PubMed]
- Zhang, K.; Xing, J.; Chen, J.; Wang, Z.; Zhai, J.; Yao, T.; Tan, G.; Qi, S.; Chen, D.; Yu, P.; et al. A spatially varying charge model for regulating site-selective protein adsorption and cell behaviors. Biomater. Sci. 2018, 7, 876–888. [Google Scholar] [CrossRef] [PubMed]
- Wang, R.; Bai, S. Effect of droplet size on wetting behavior on laser textured SiC surface. Appl. Surf. Sci. 2015, 353, 564–567. [Google Scholar] [CrossRef]
- Wang, R.; Bai, S. Influence of laser geometric morphology type on SiC surface wettability. Sci. China Technol. Sci. 2016, 59, 592–596. [Google Scholar] [CrossRef]
- Zhang, B.; Umehara, N. Hydrodynamic lubrication theory considering electric double layer for very thin water film lubrication of ceramics. JSME Int. J. Ser. C 1998, 41, 285–290. [Google Scholar]
- Wang, R.; Bai, S. Wettability of laser micro-circle-dimpled SiC surfaces. Appl. Surf. Sci. 2015, 346, 107–110. [Google Scholar] [CrossRef]
- Bai, S.; Wang, R.; Li, M. Wettability control of laser textured SiC surfaces using additive elements. Ceram. Int. 2015, 41, 5644–5647. [Google Scholar] [CrossRef]


| Morphology | Serial Number | a/μm | b/μm | h/μm |
|---|---|---|---|---|
| Smooth surface | Smooth | / | ||
| Micro-square-convex surface | Texture 1 | 110 | 40 | 5 |
| Texture 2 | 160 | 40 | 5 | |
| Texture 3 | 210 | 40 | 5 | |
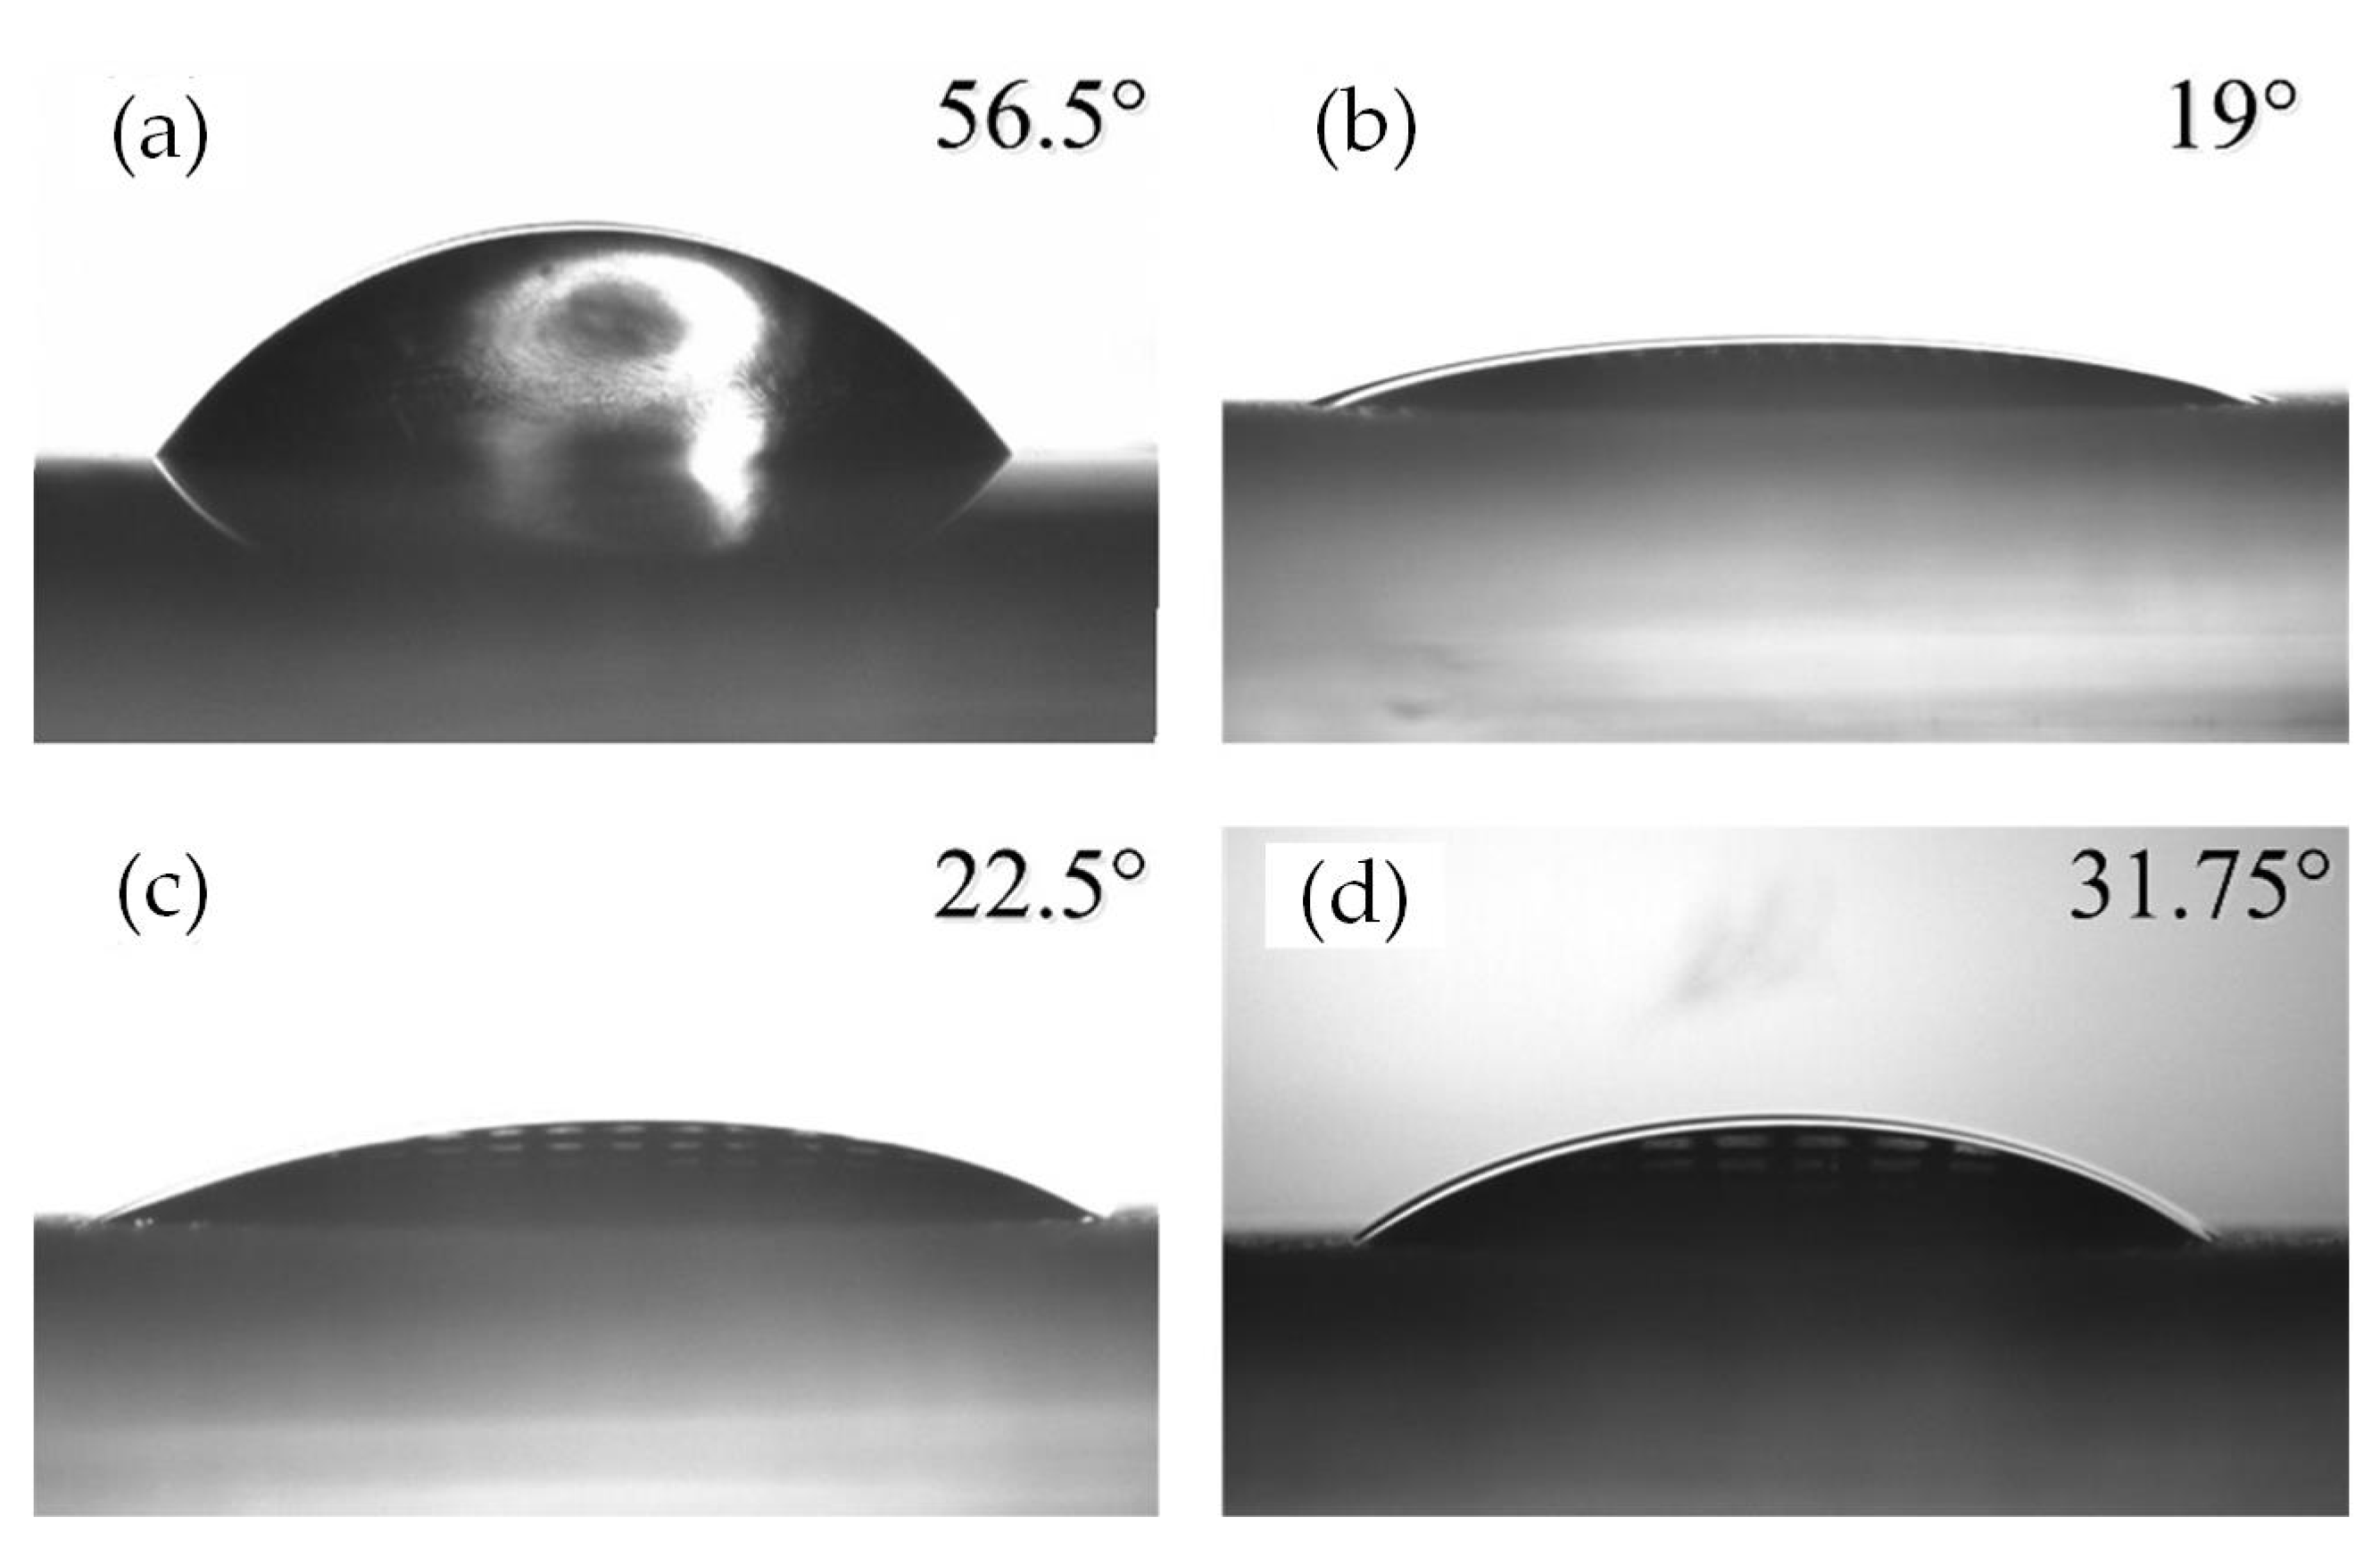
| Serial Number | z /mV | γedl,0 /N/m | γedl,h /N/m | CA Experimental Value θ/° | CA Theoretical Value θ/° |
|---|---|---|---|---|---|
| Smooth | 9.26 | 0.0697 | / | 56.5 | / |
| Texture 1 | 0.015 | 19 | 14.1 | ||
| Texture 2 | 22.5 | 32.0 | |||
| Texture 3 | 31.75 | 37.2 |
Publisher’s Note: MDPI stays neutral with regard to jurisdictional claims in published maps and institutional affiliations. |
© 2022 by the authors. Licensee MDPI, Basel, Switzerland. This article is an open access article distributed under the terms and conditions of the Creative Commons Attribution (CC BY) license (https://creativecommons.org/licenses/by/4.0/).
Share and Cite
Li, S.; Jin, Y.; Bai, S.; Yang, J. Electrostatic Analysis of Bioactivity of Ti-6Al-4V Hydrophilic Surface with Laser Textured Micro-Square Convexes. Materials 2022, 15, 7942. https://doi.org/10.3390/ma15227942
Li S, Jin Y, Bai S, Yang J. Electrostatic Analysis of Bioactivity of Ti-6Al-4V Hydrophilic Surface with Laser Textured Micro-Square Convexes. Materials. 2022; 15(22):7942. https://doi.org/10.3390/ma15227942
Chicago/Turabian StyleLi, Si, Yangyang Jin, Shaoxian Bai, and Jing Yang. 2022. "Electrostatic Analysis of Bioactivity of Ti-6Al-4V Hydrophilic Surface with Laser Textured Micro-Square Convexes" Materials 15, no. 22: 7942. https://doi.org/10.3390/ma15227942