
Proposition for Determining the Residual Strength of Fiber-Reinforced Cement Composite

Abstract
:1. Introduction
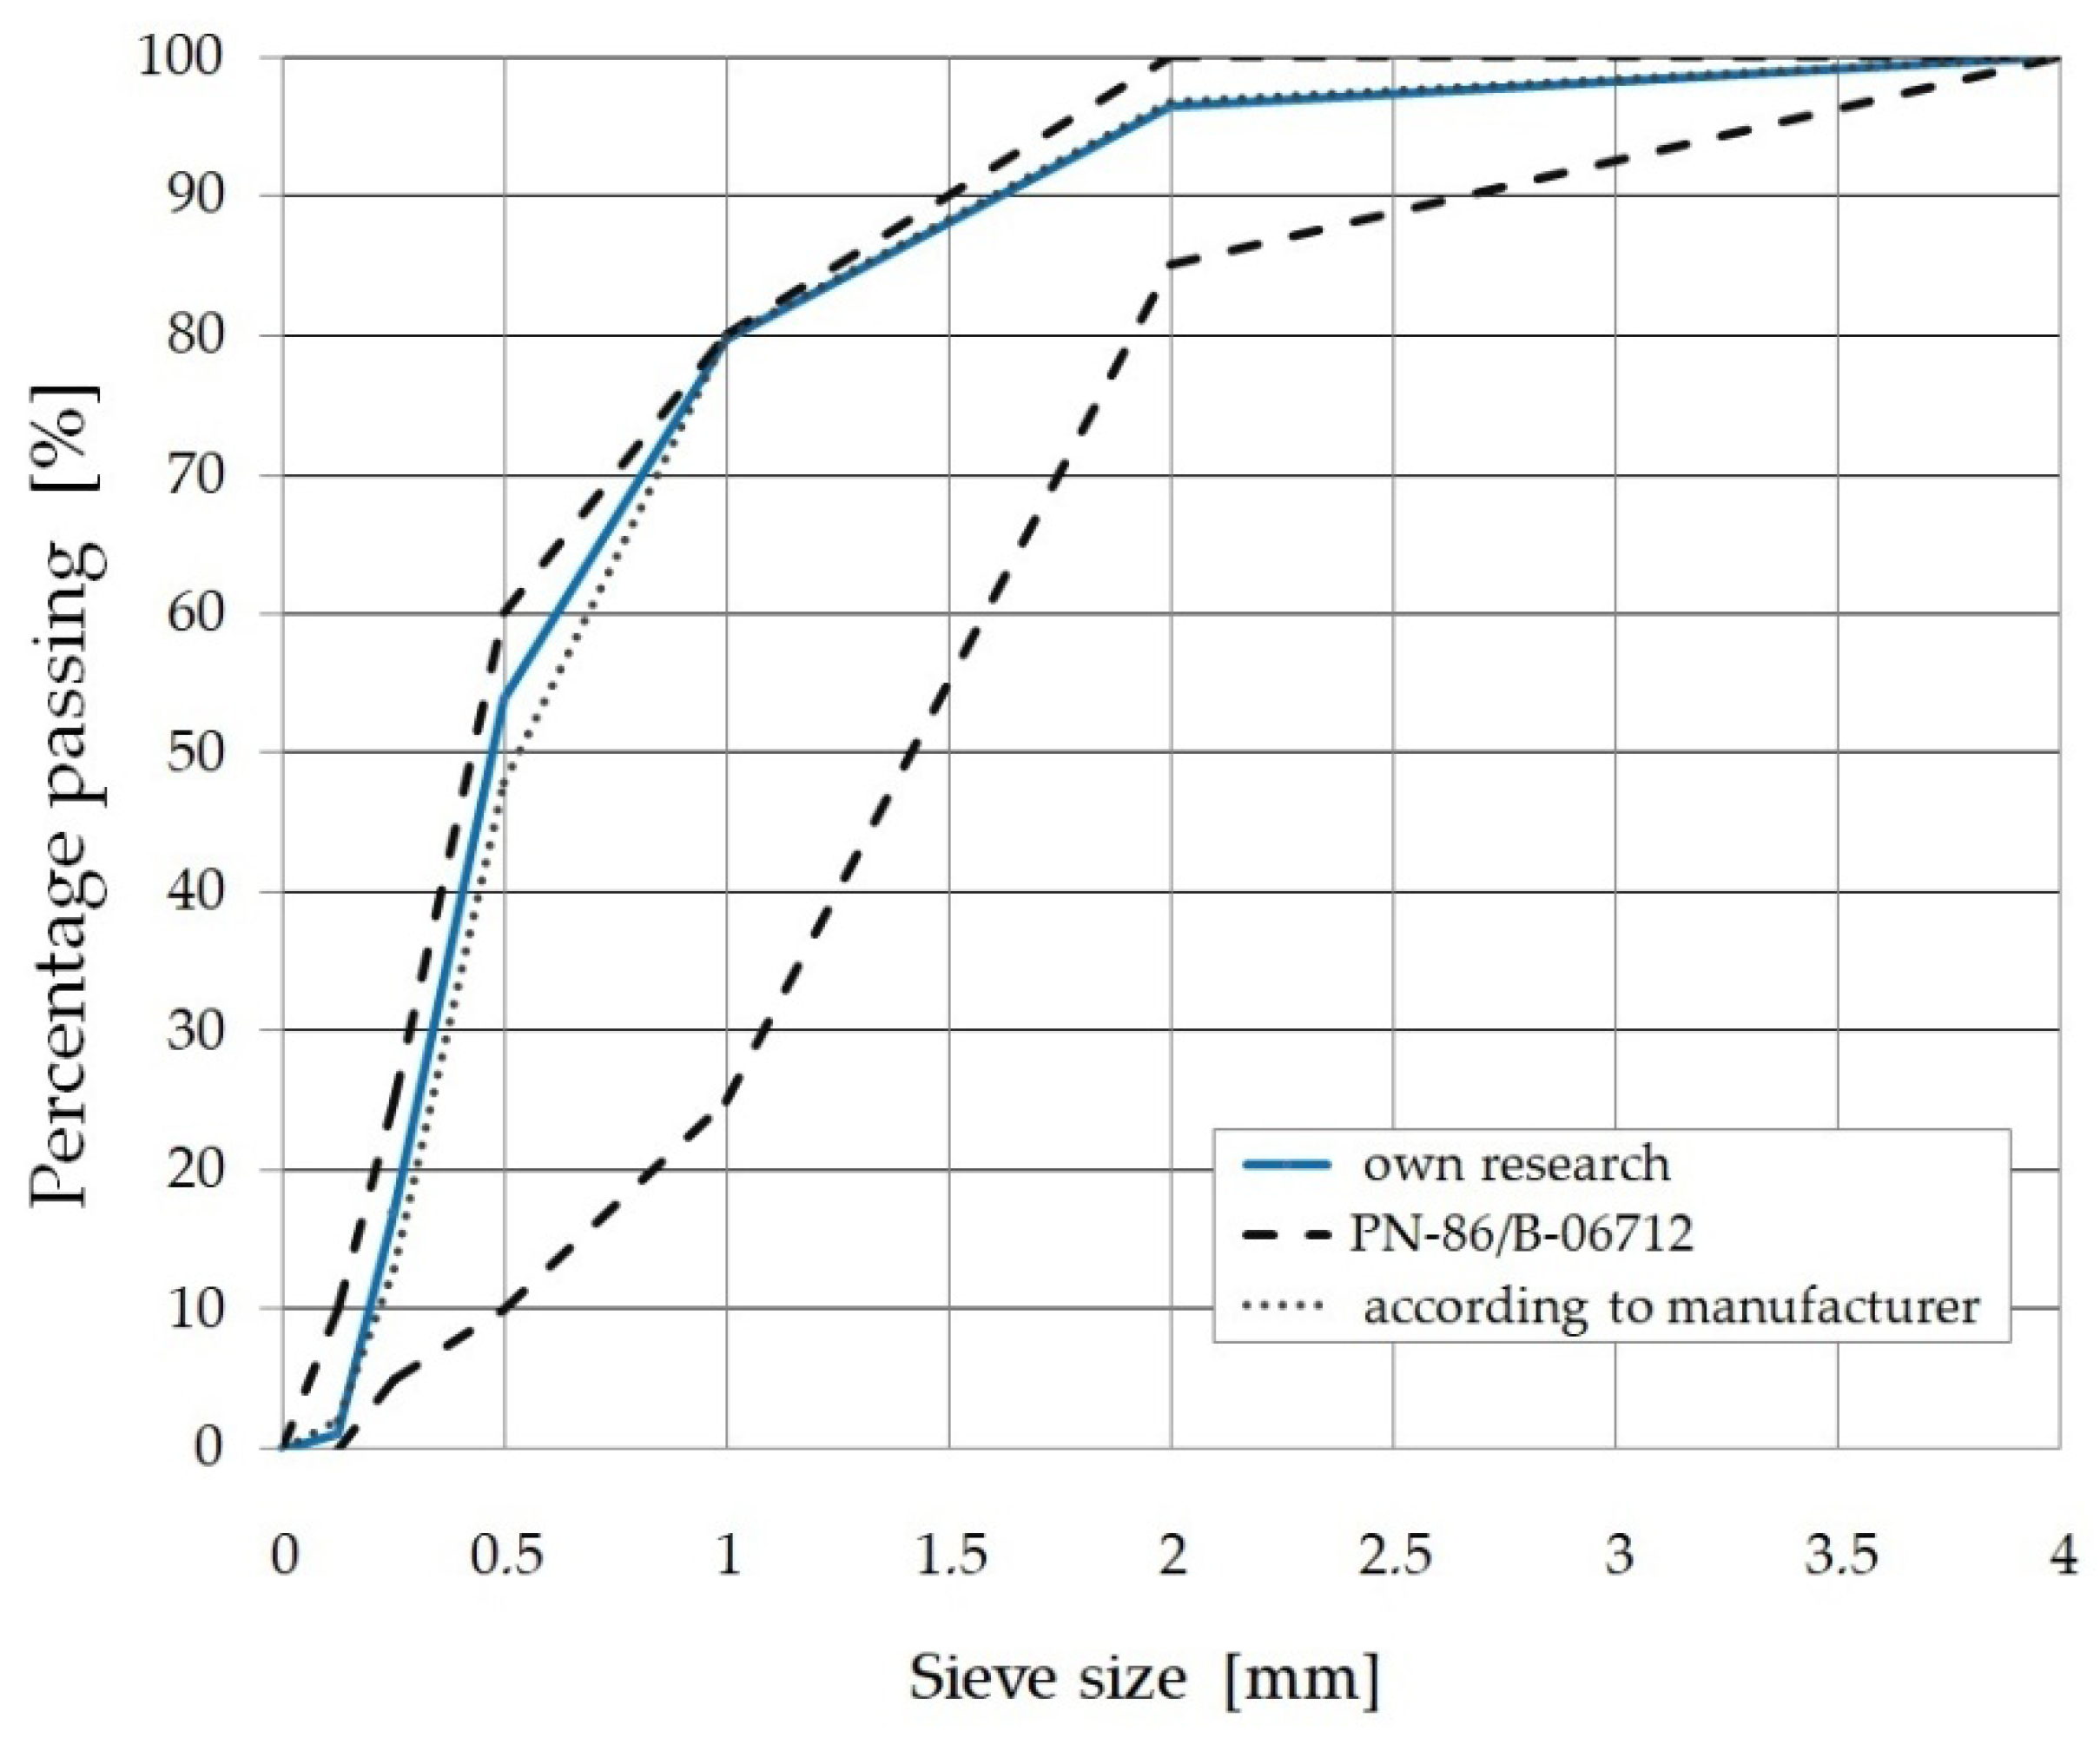
2. Test Materials
- -
- aggregate + cement + silica dust—2 min.
- -
- aggregate + cement + silica dust + water and plasticizer—4 min.
- -
- aggregate + cement + silica dust + water and plasticizer + steel fibers—4 min.
3. Methodology of Research and Test Elements
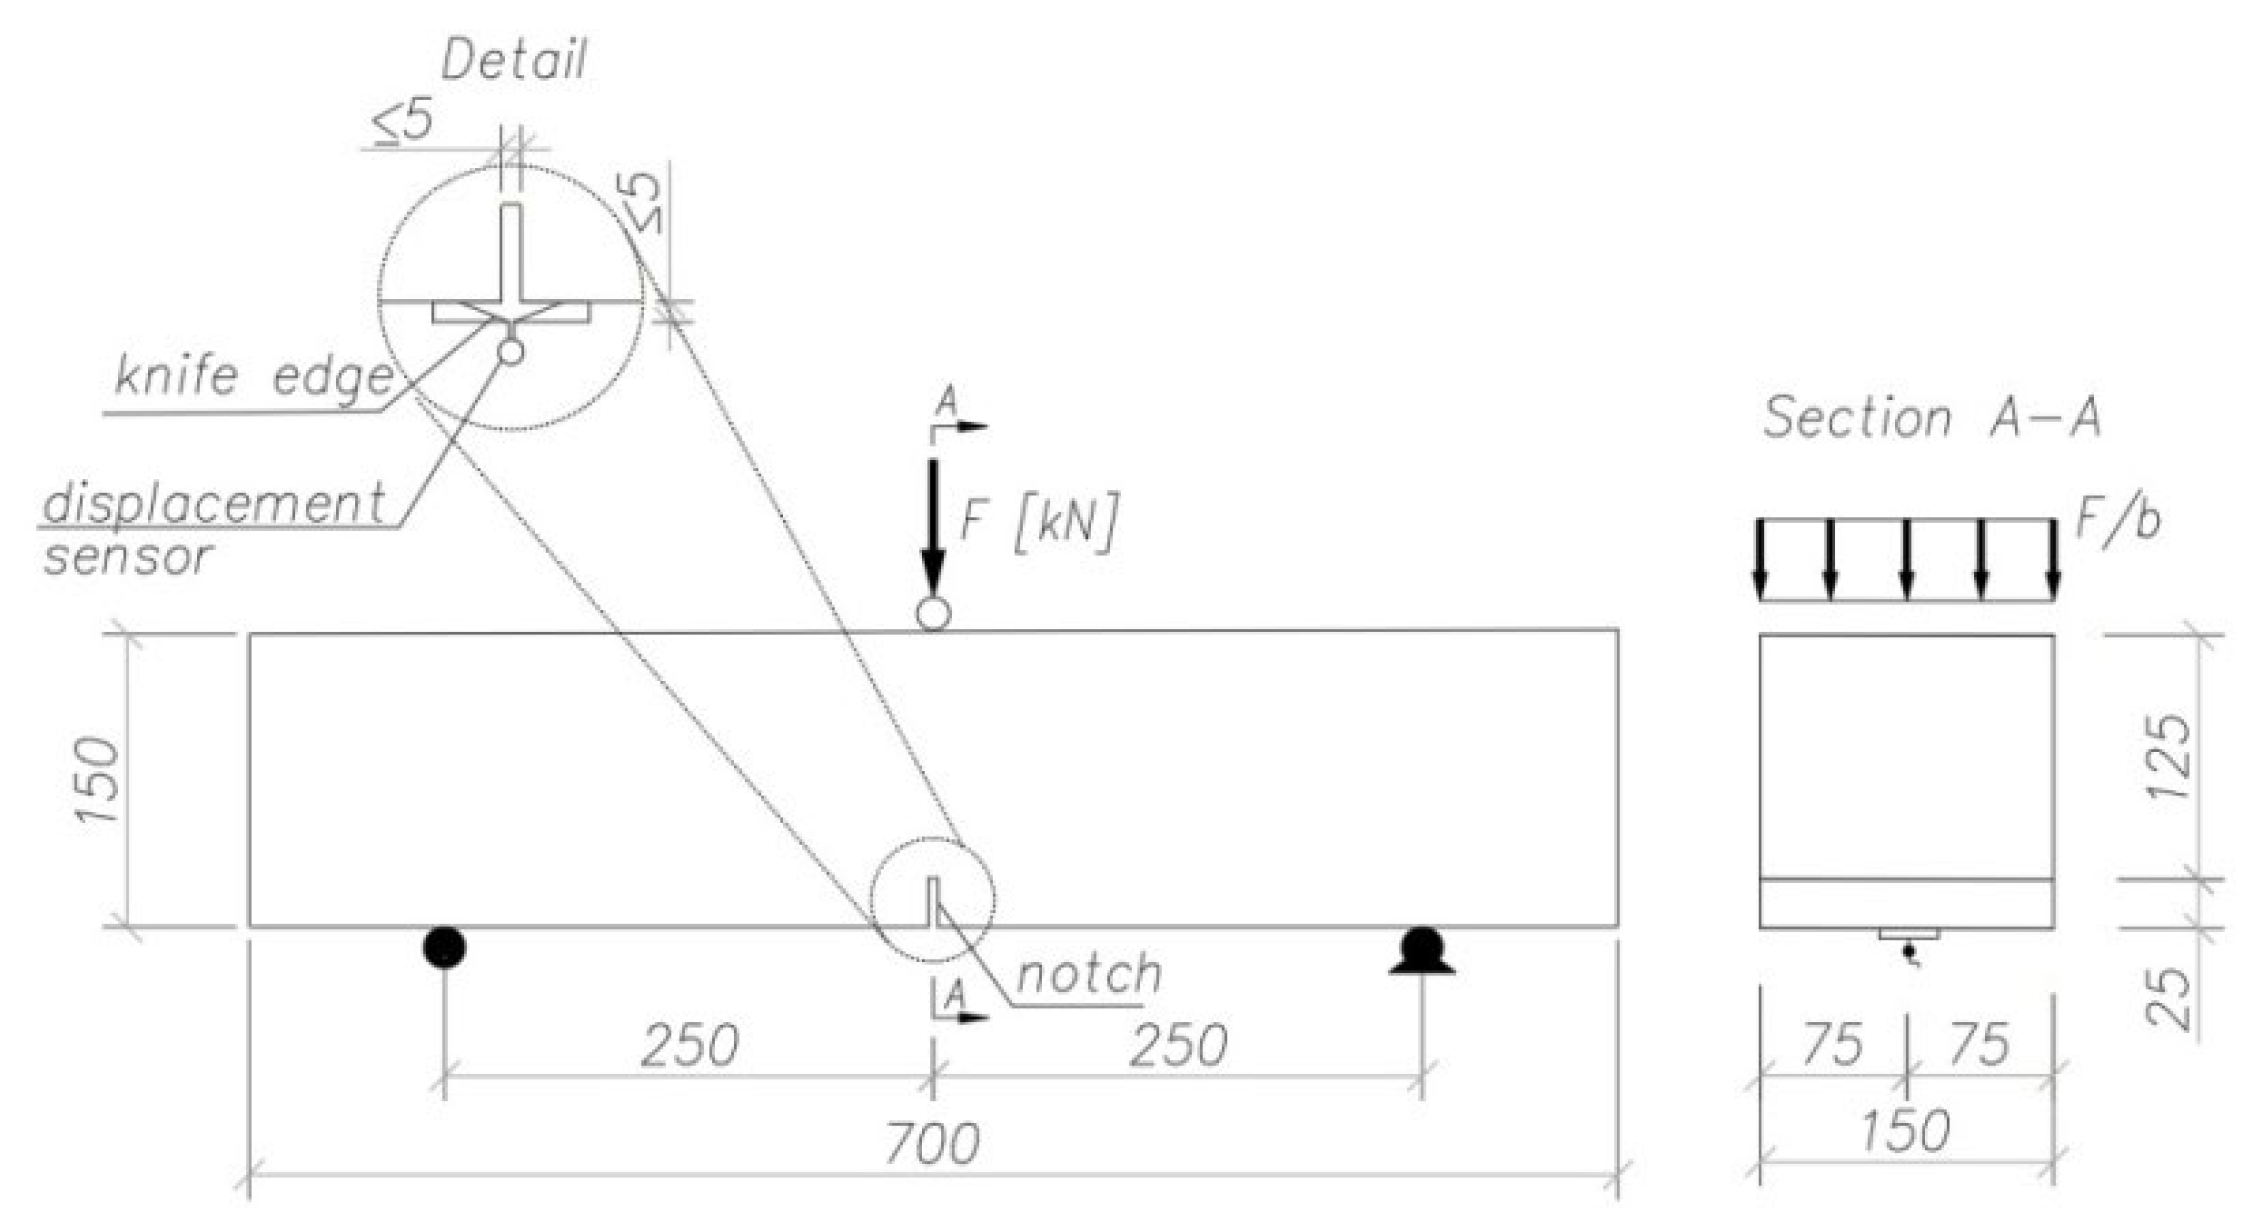
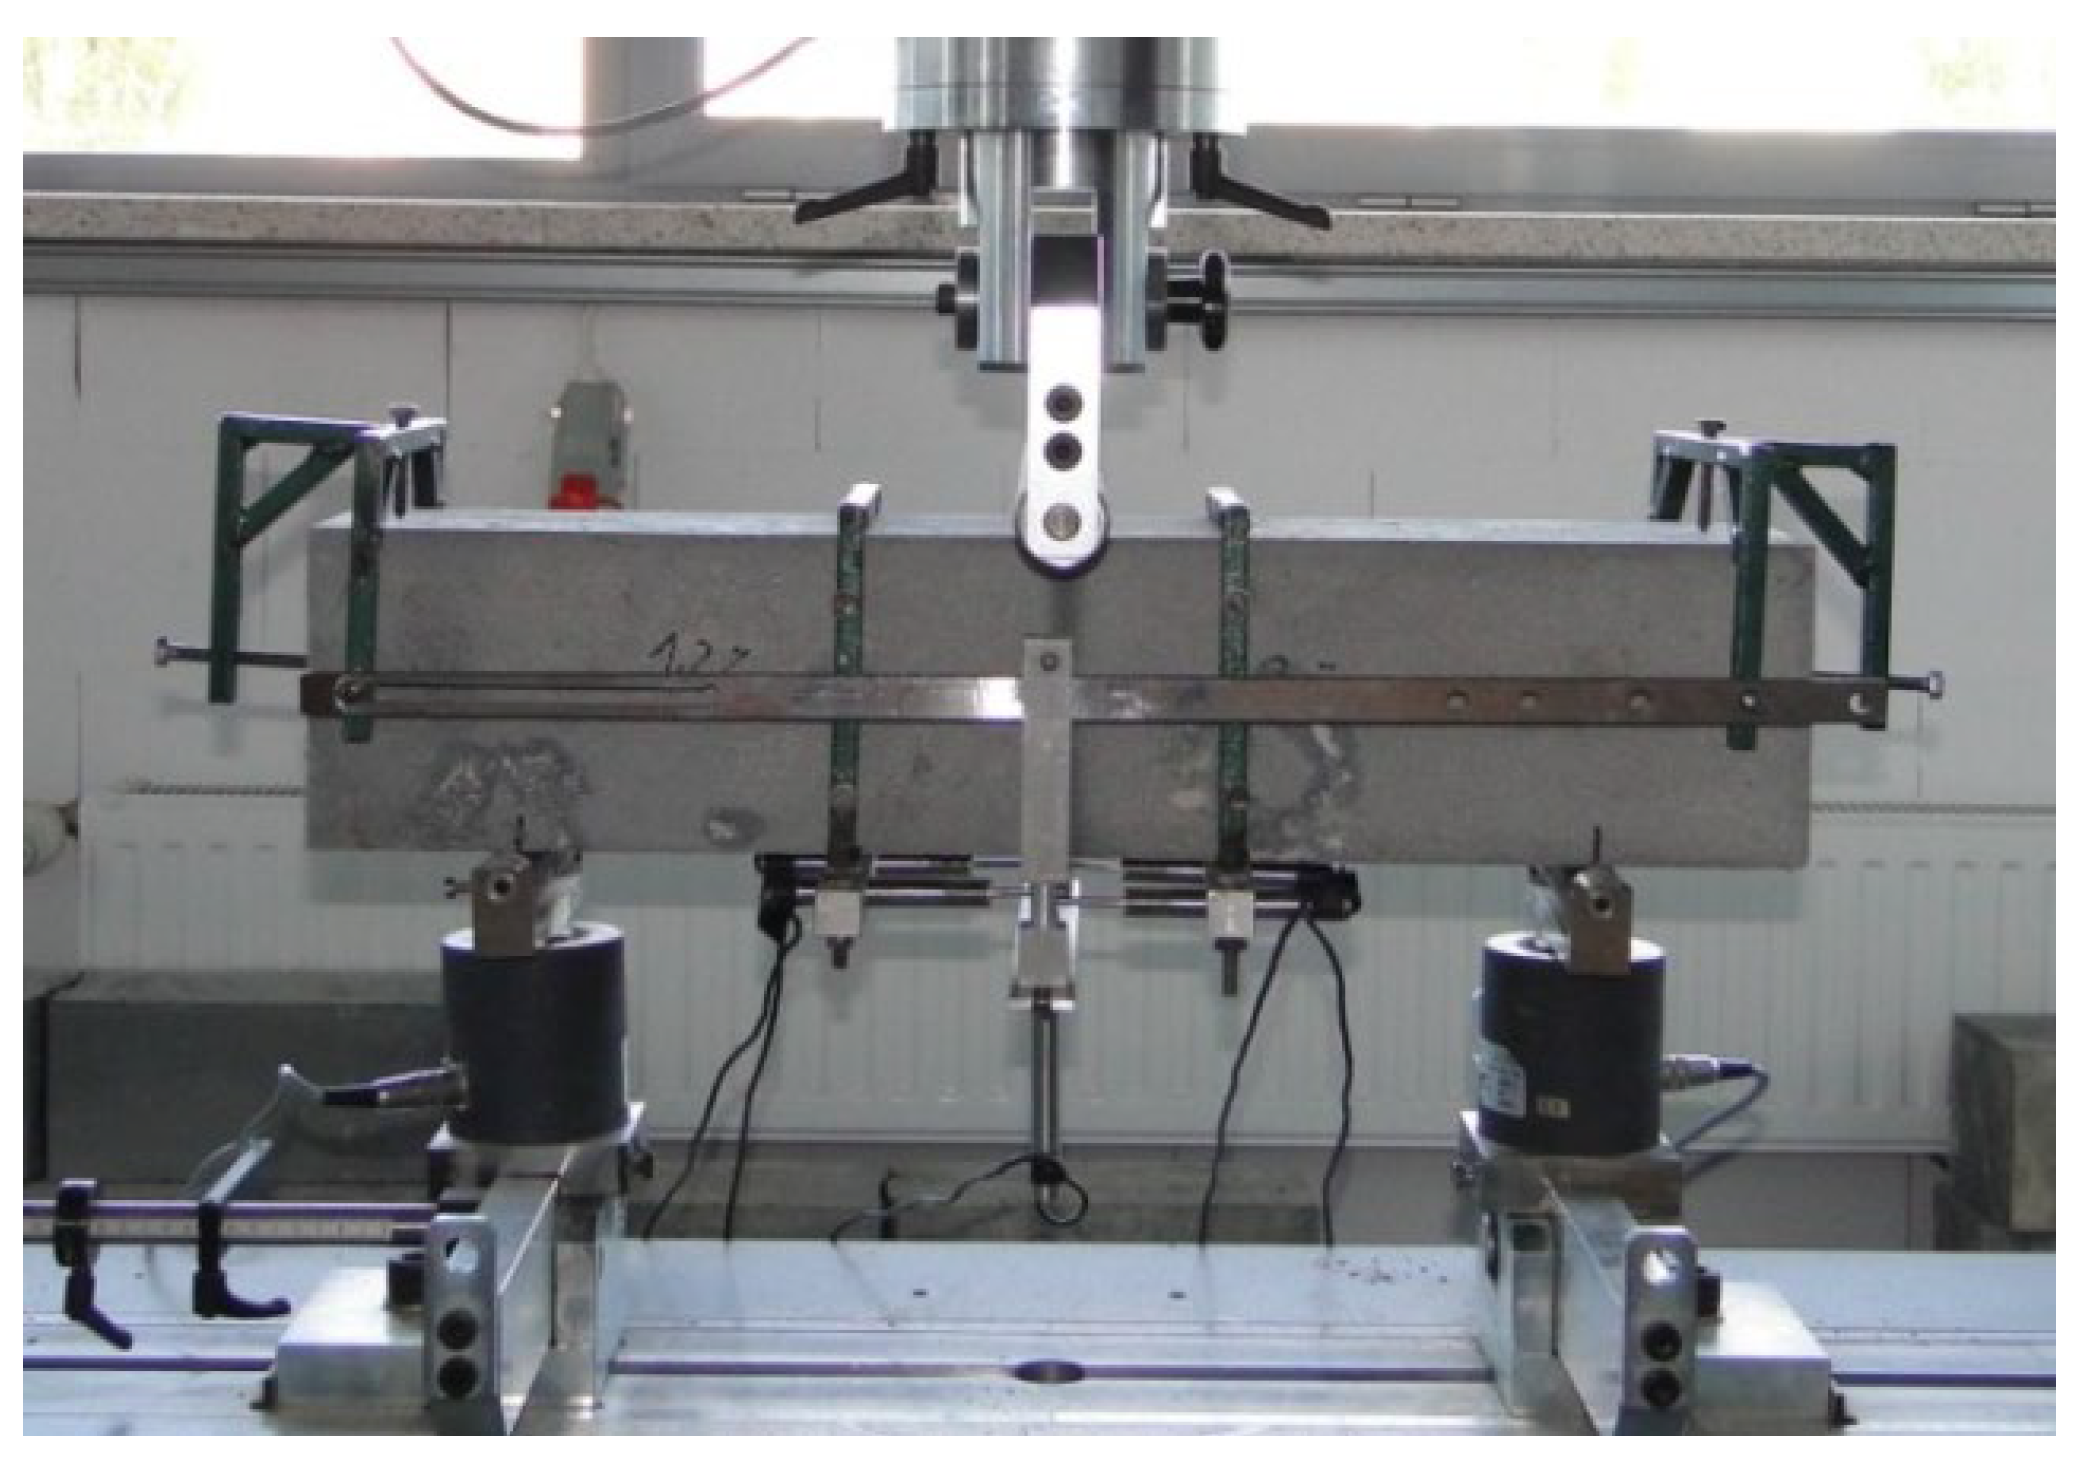
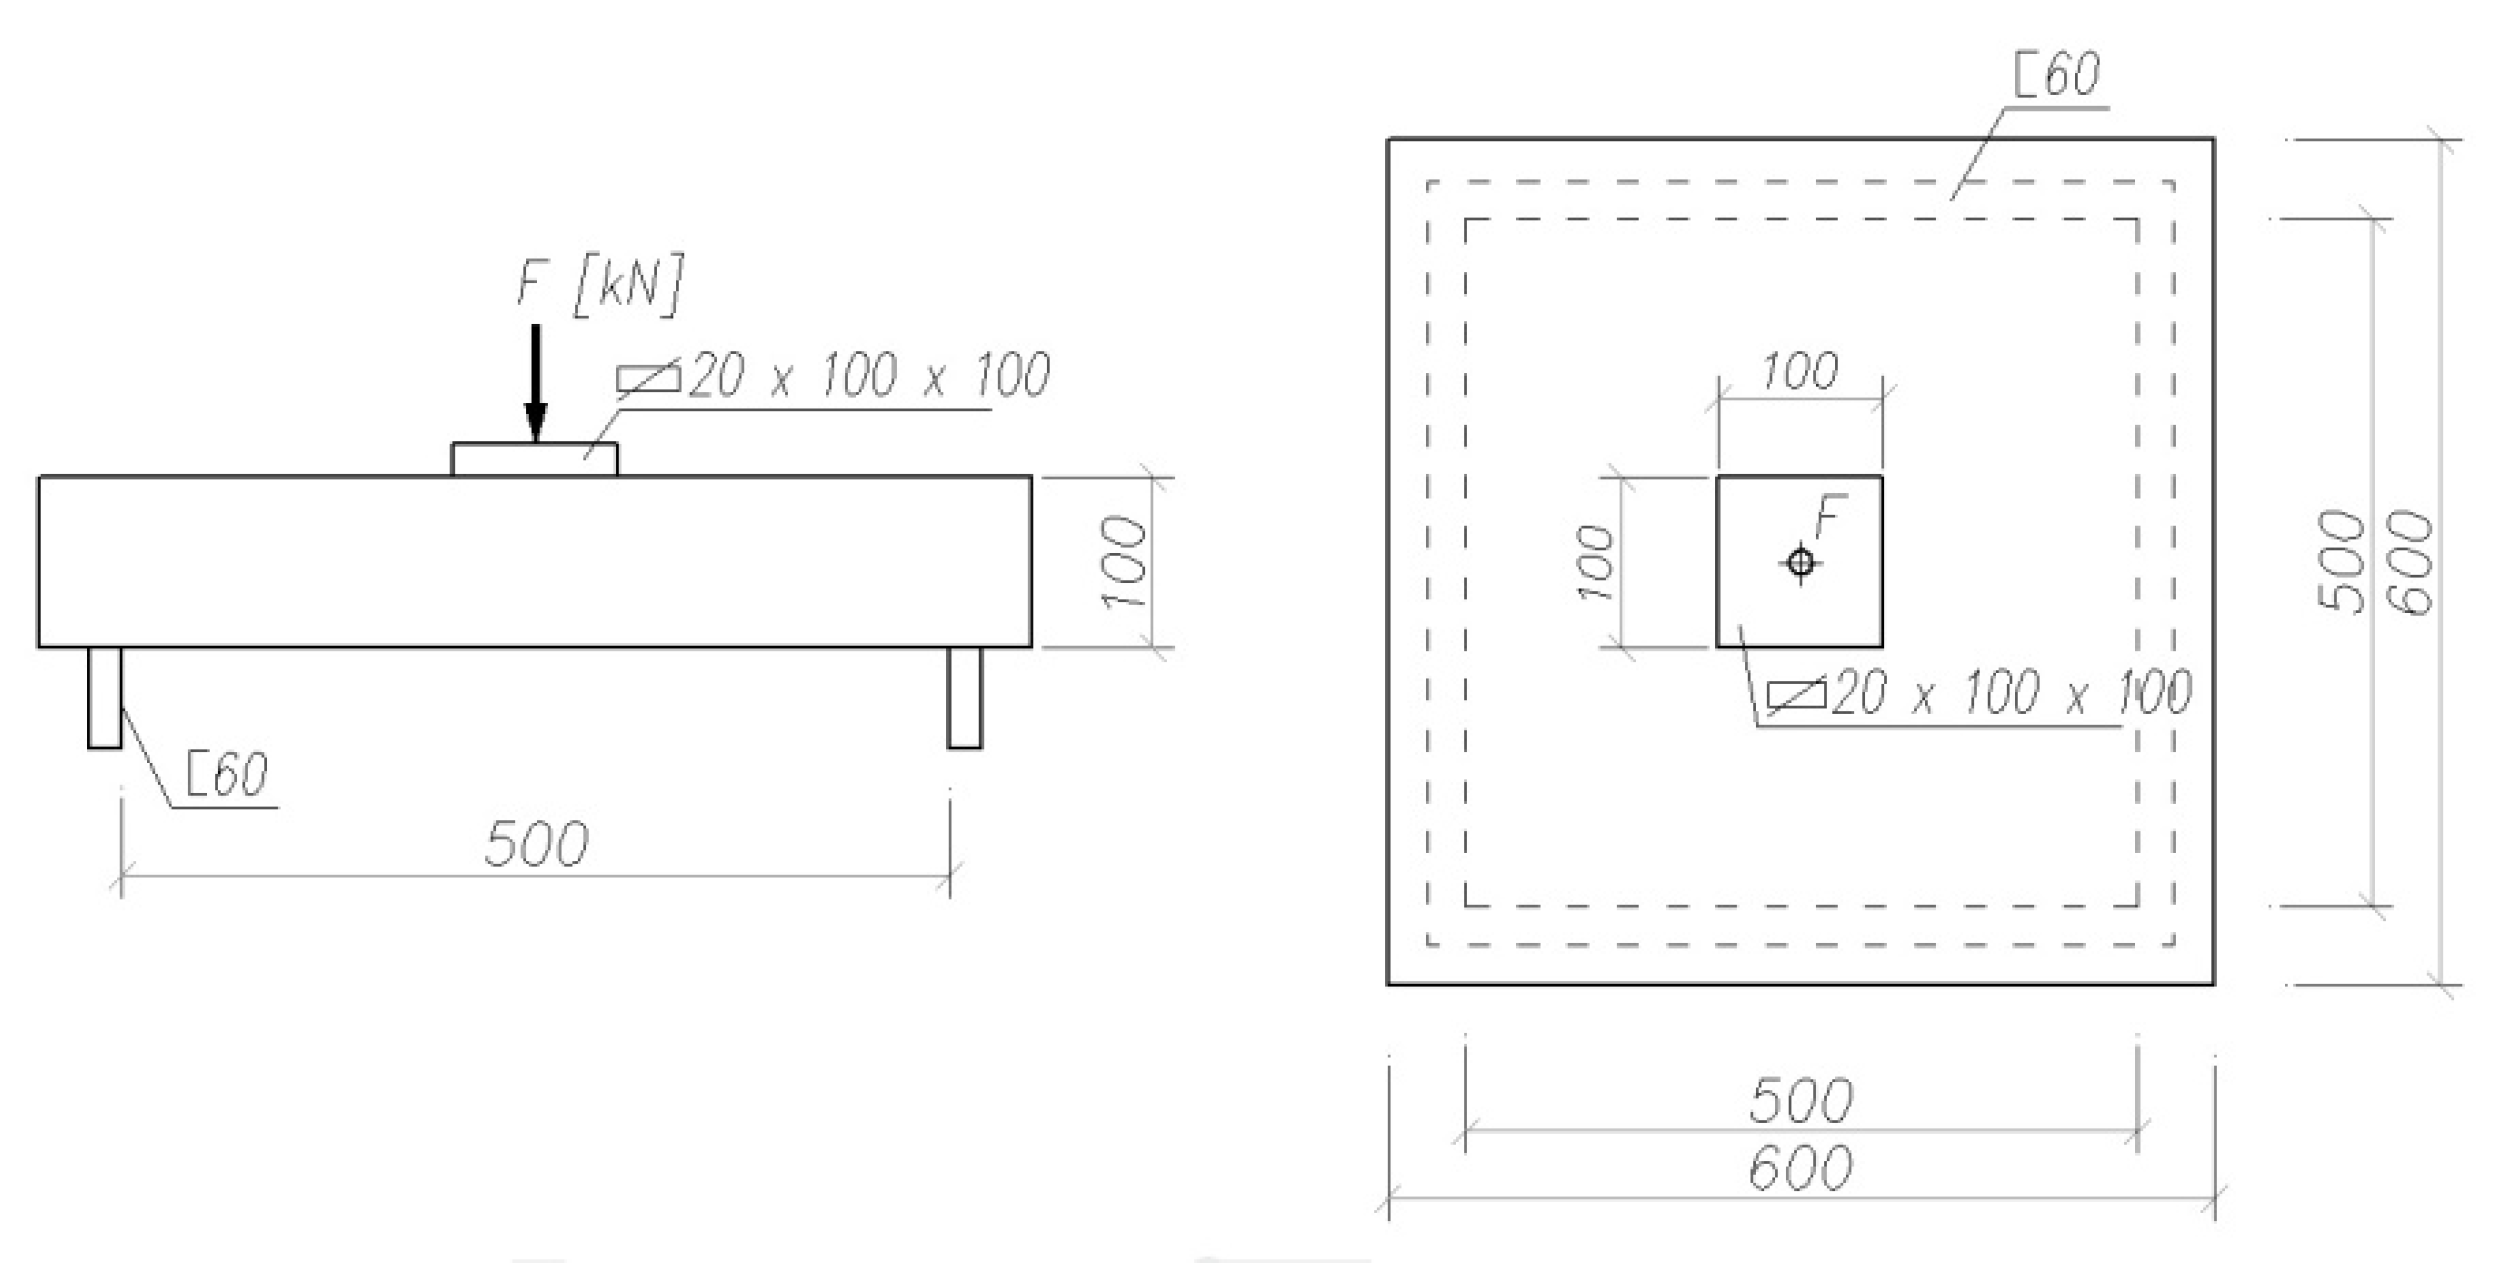
3.1. Beam Elements
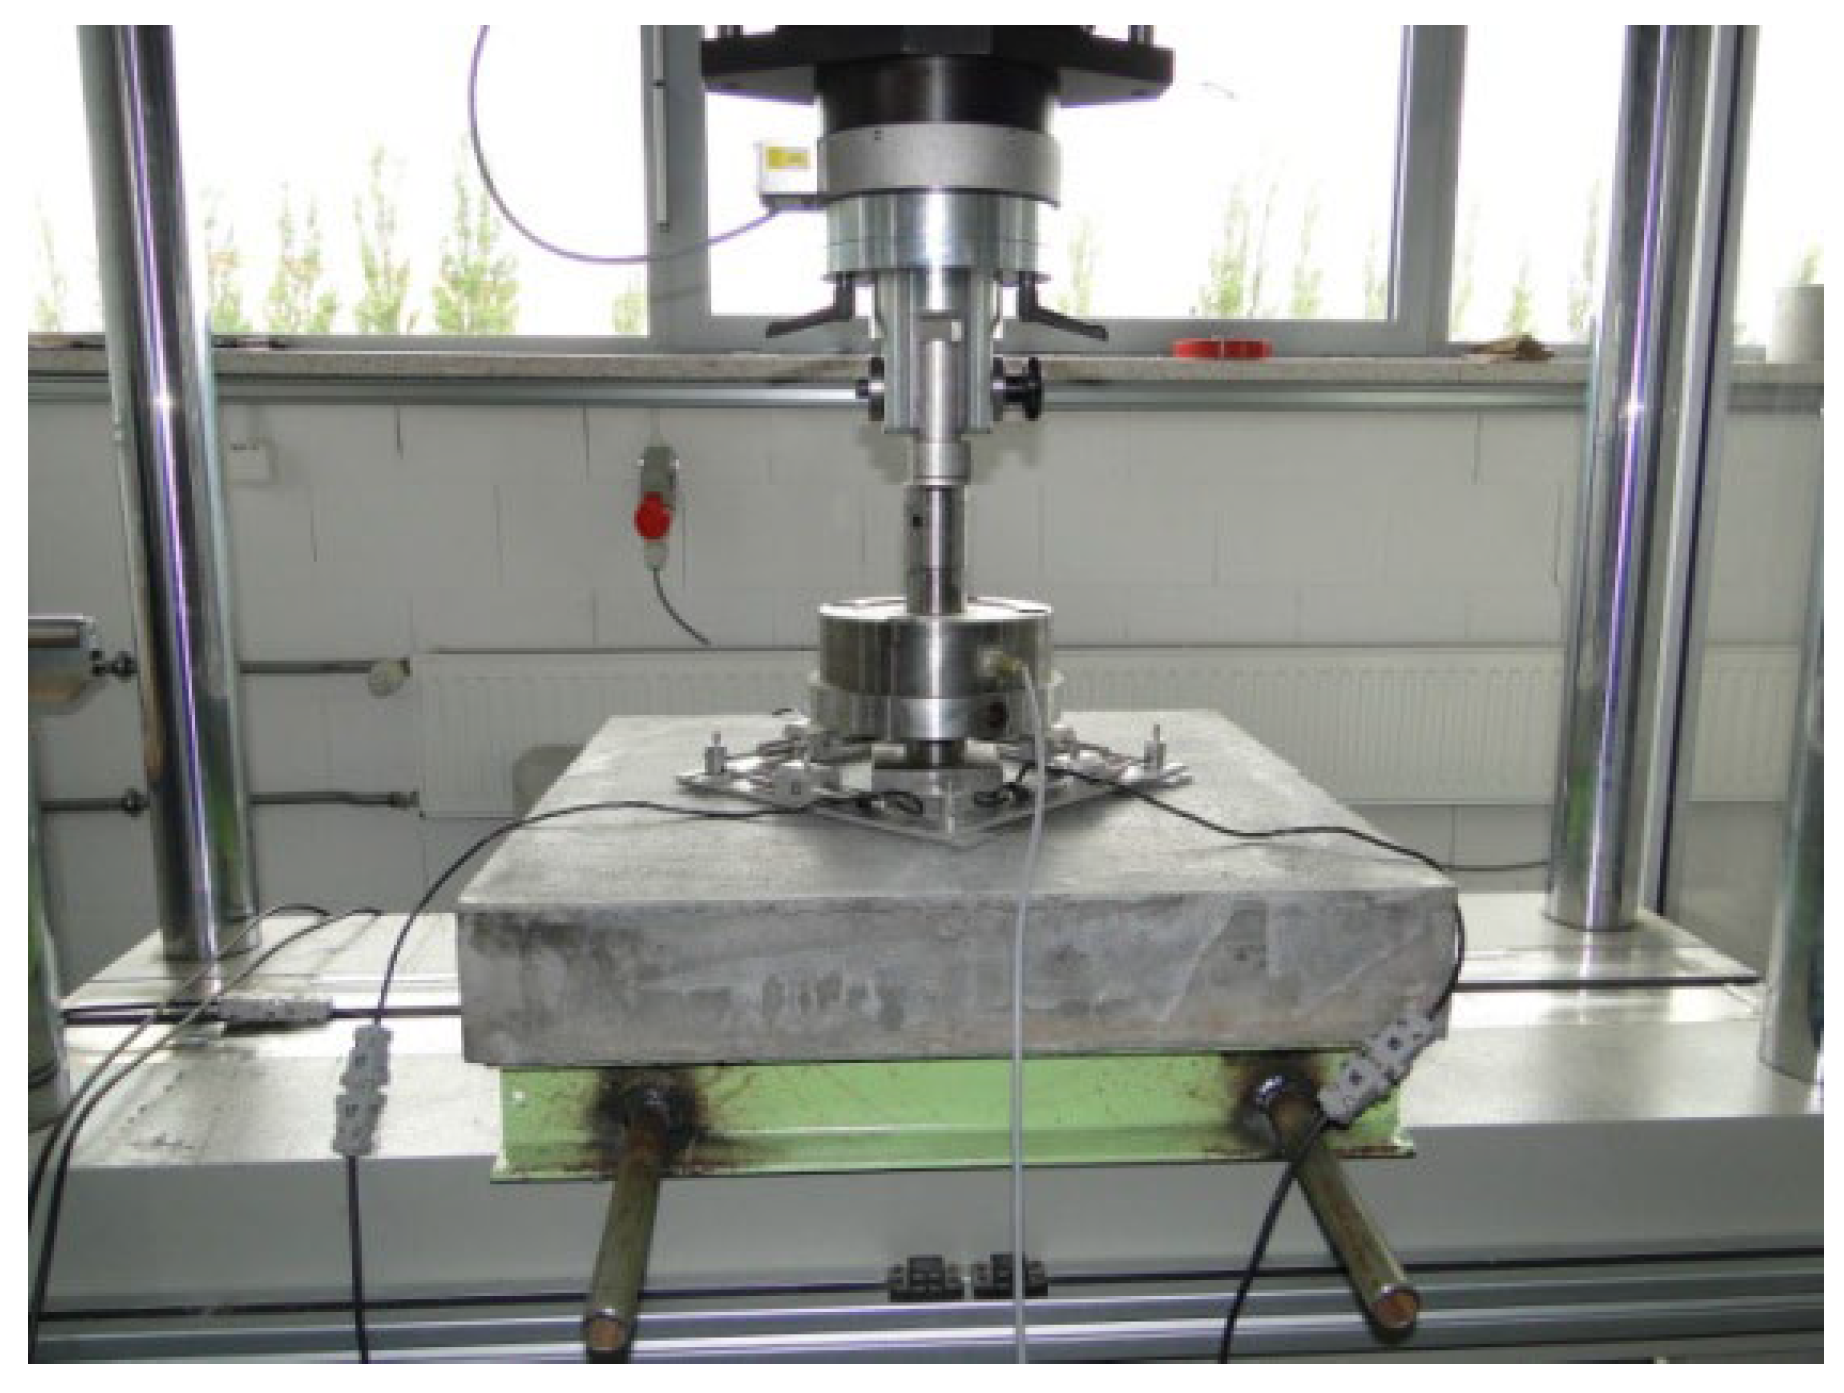
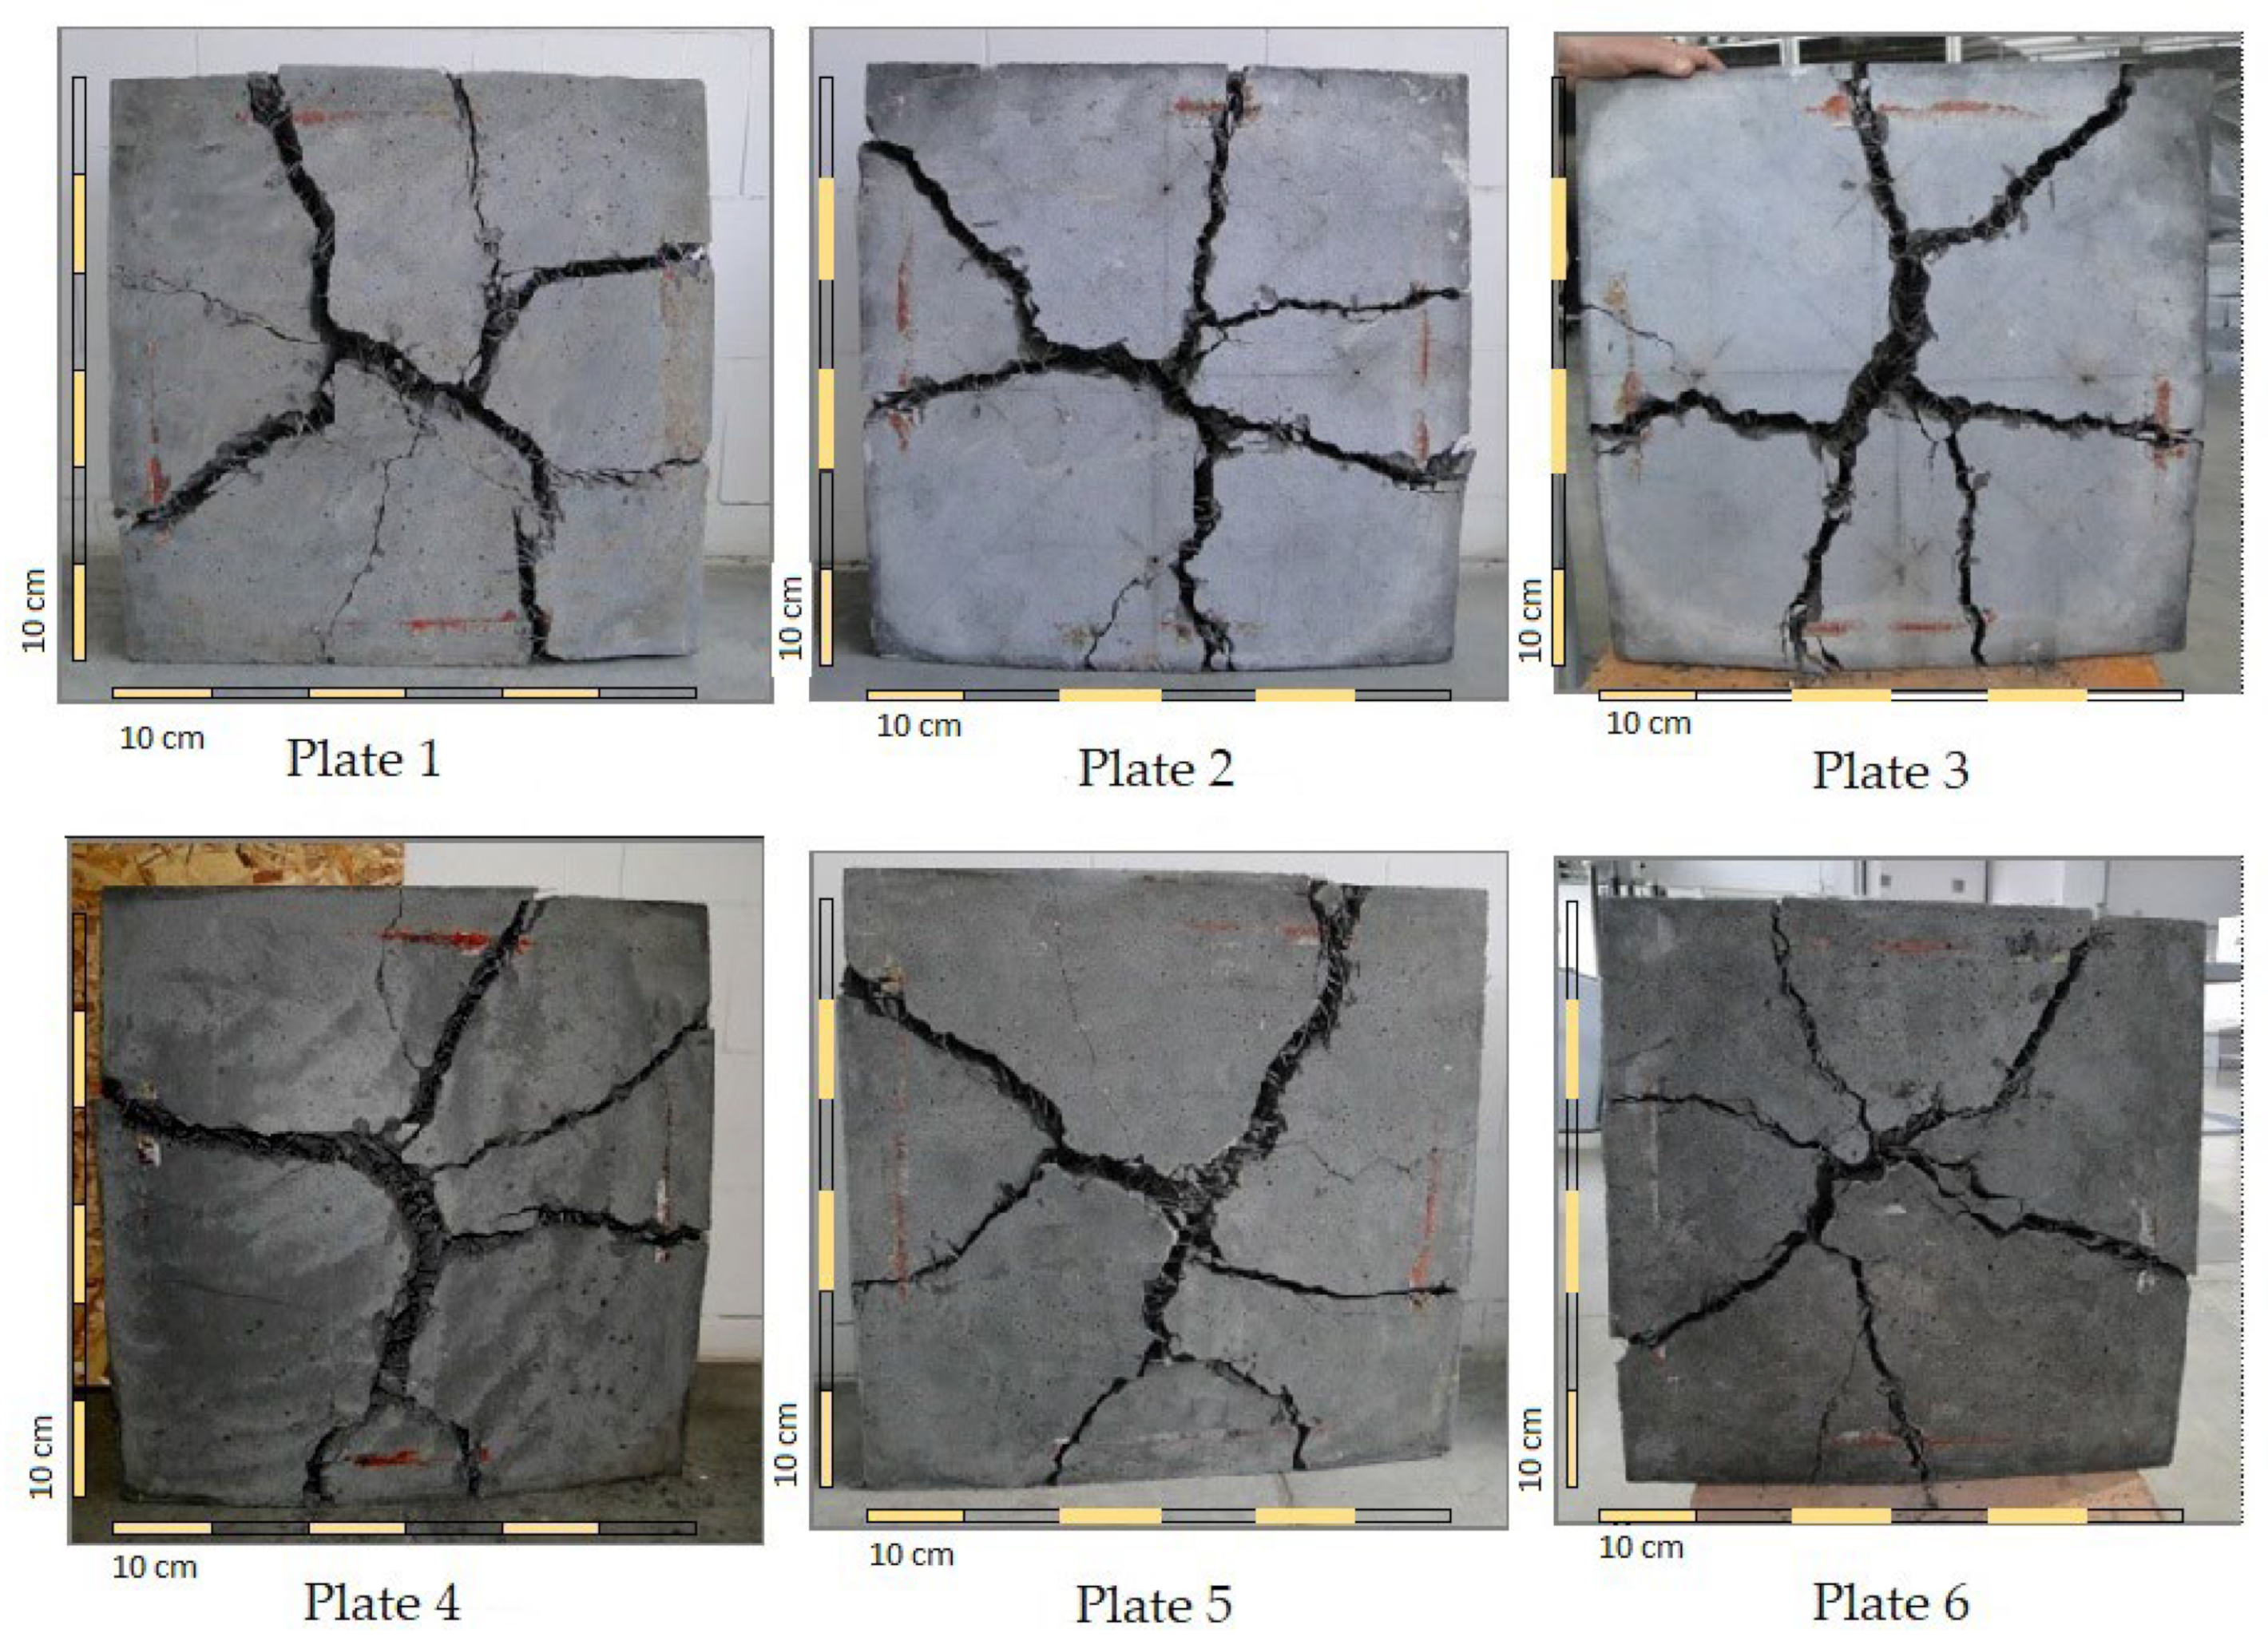
3.2. Plate Elements
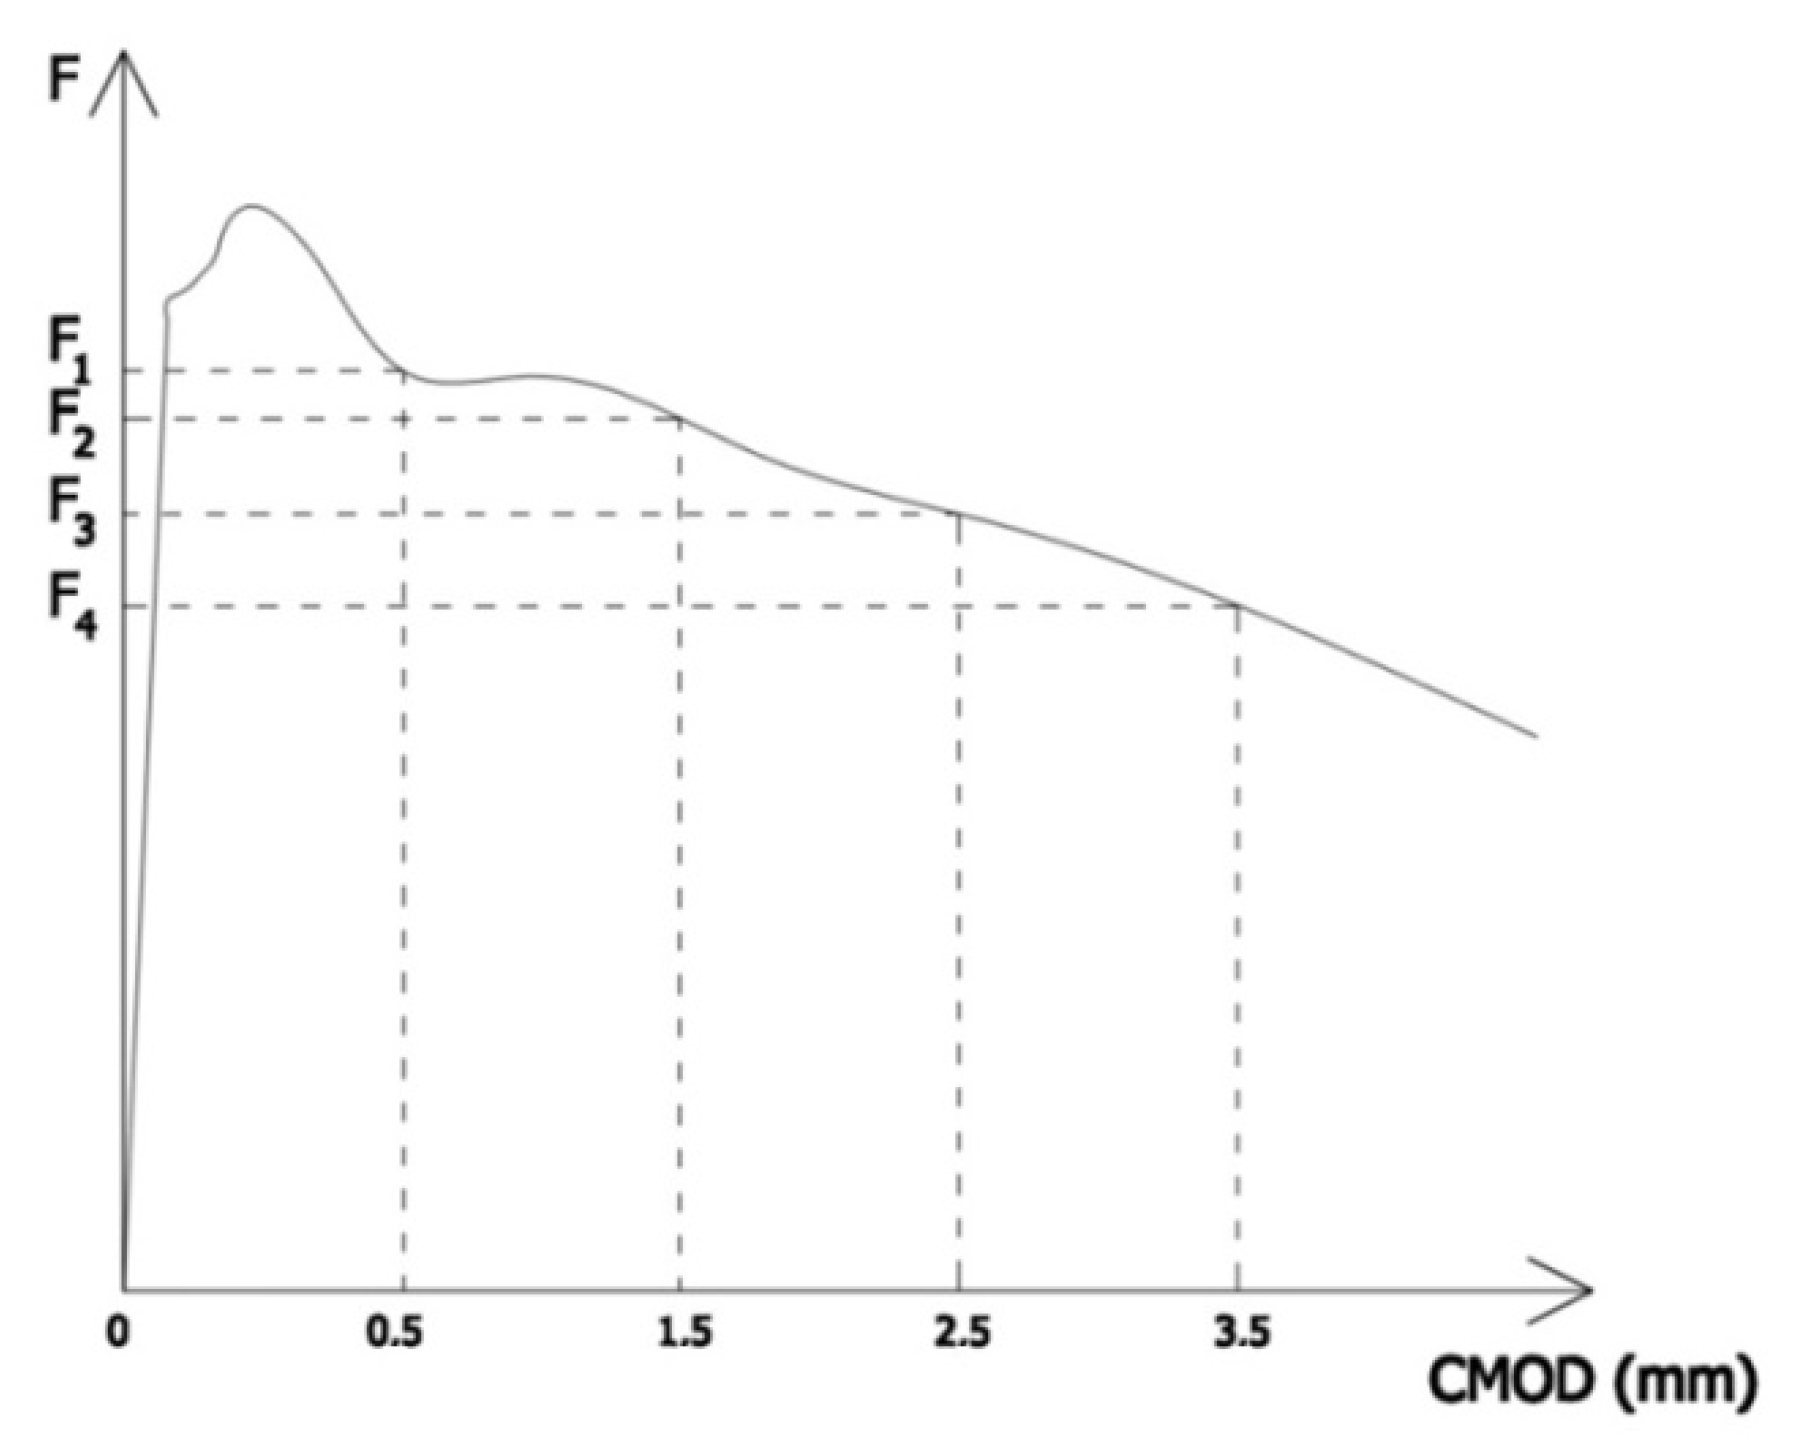
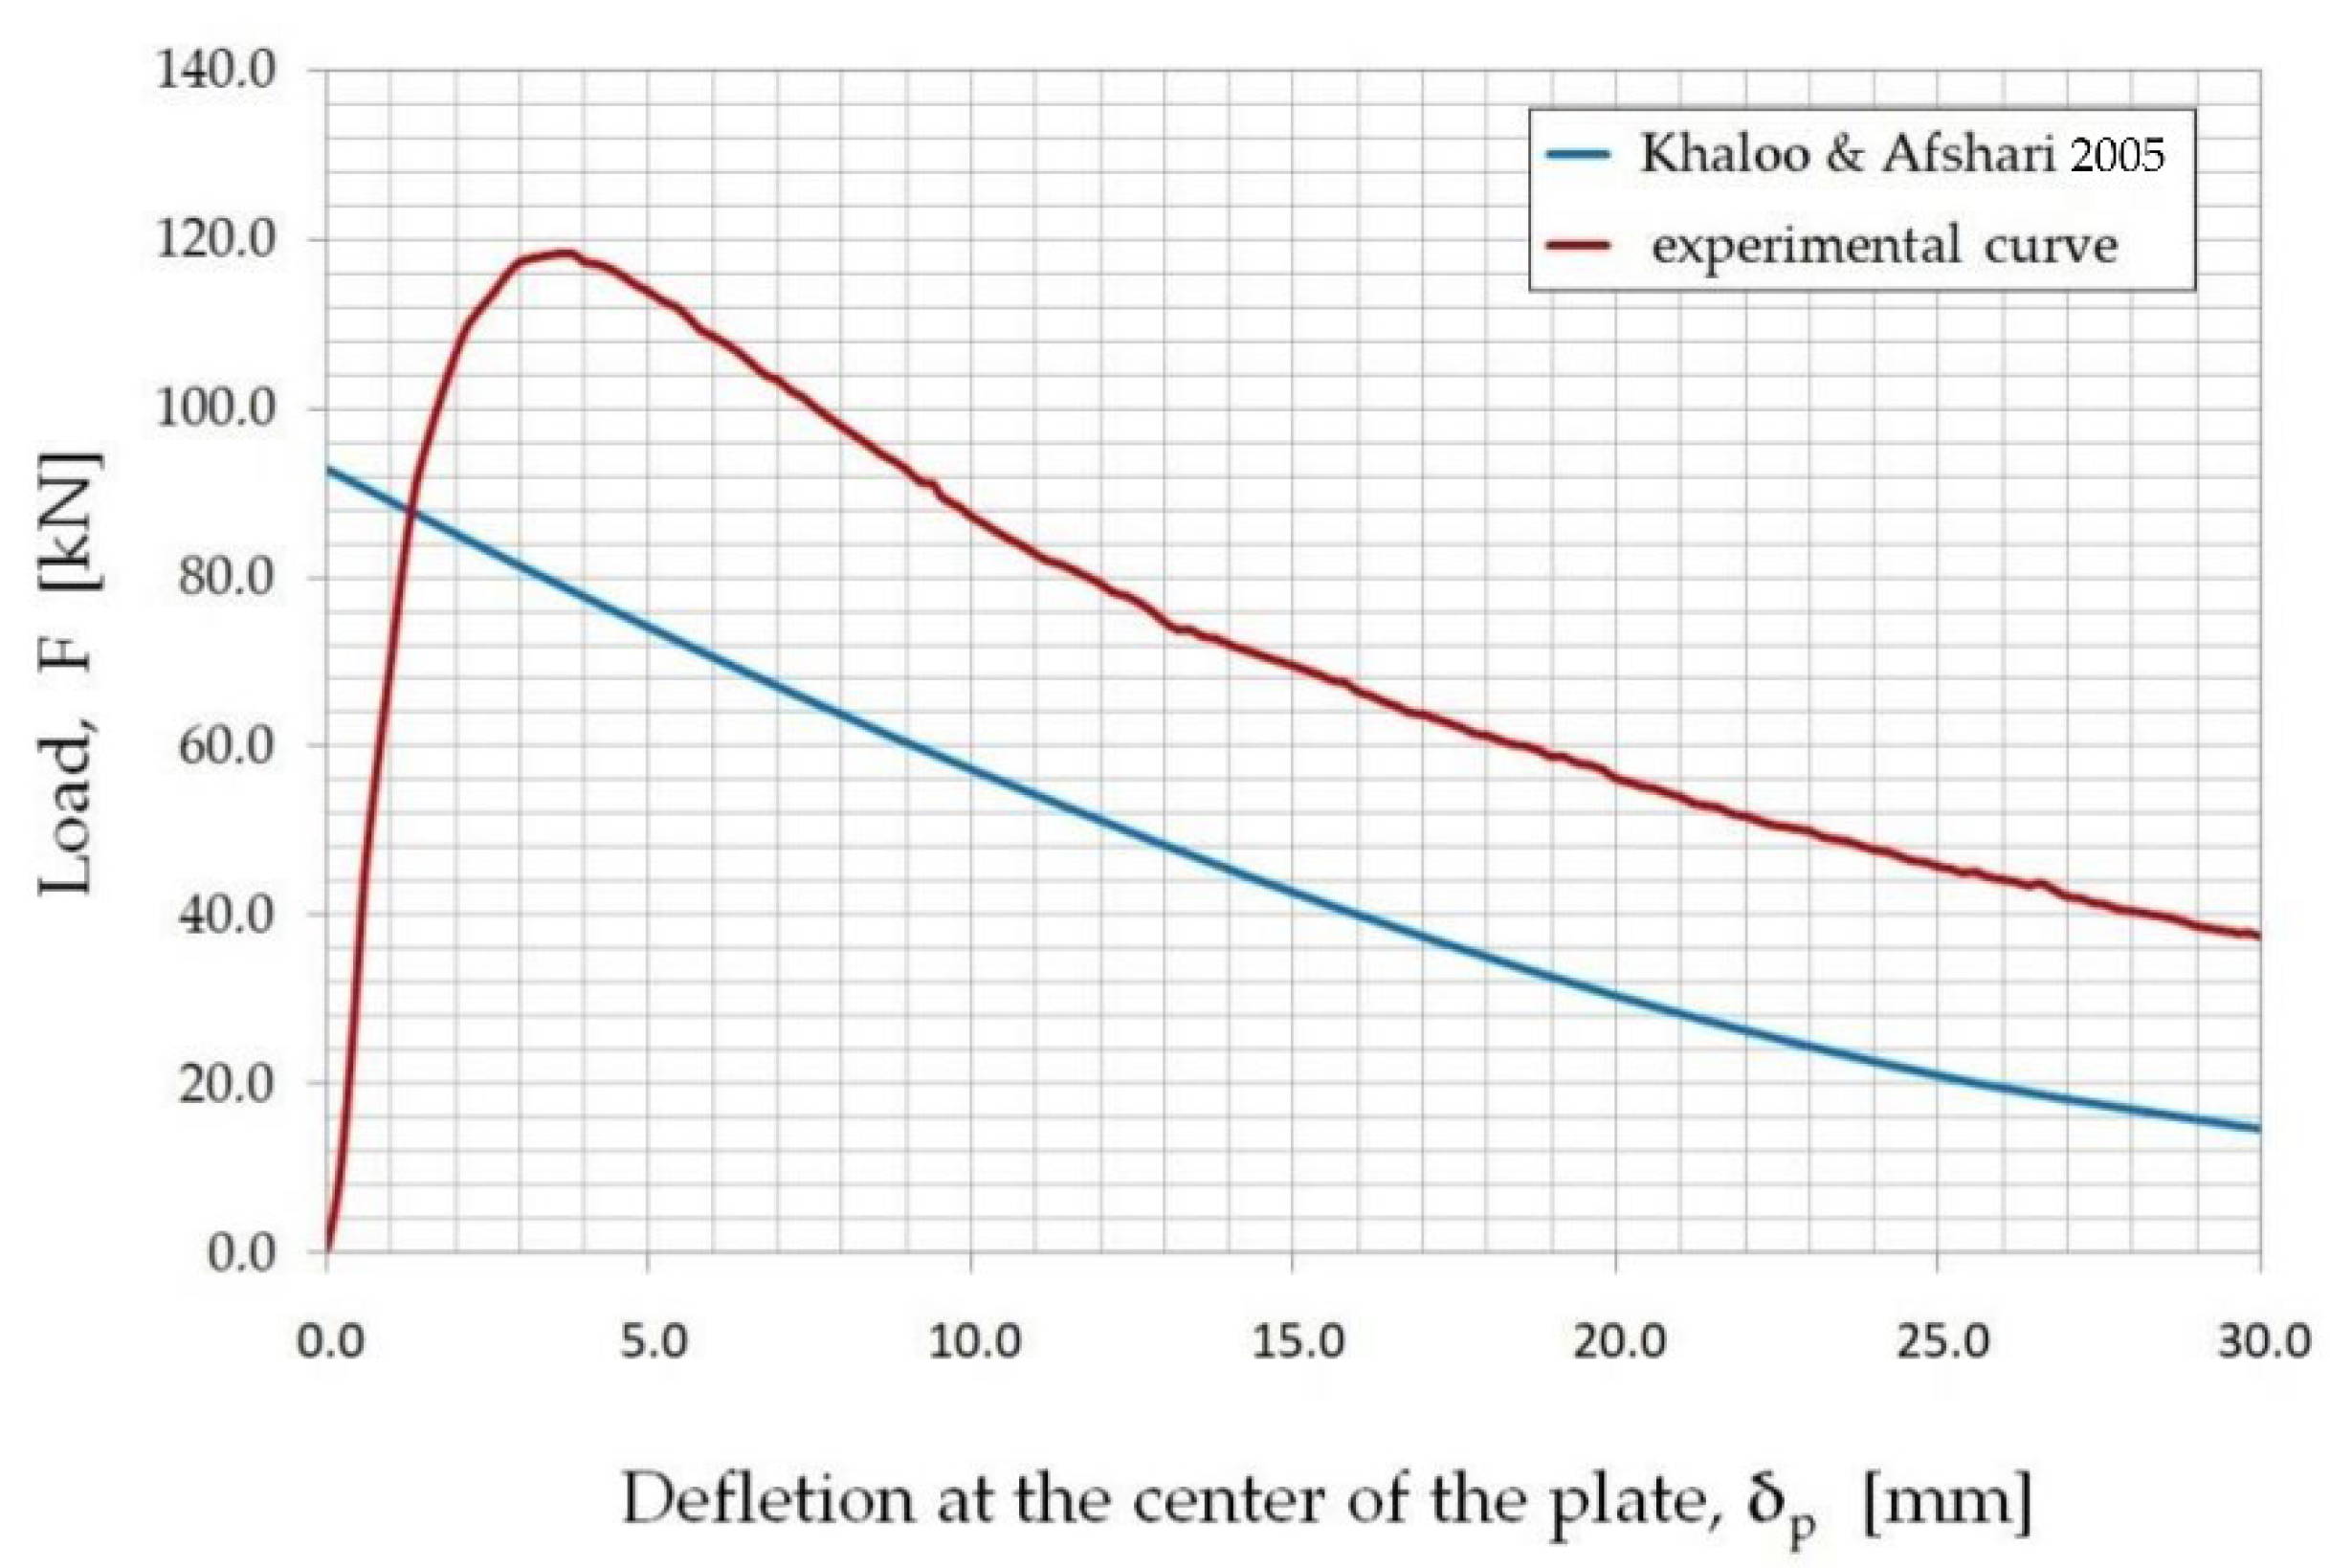
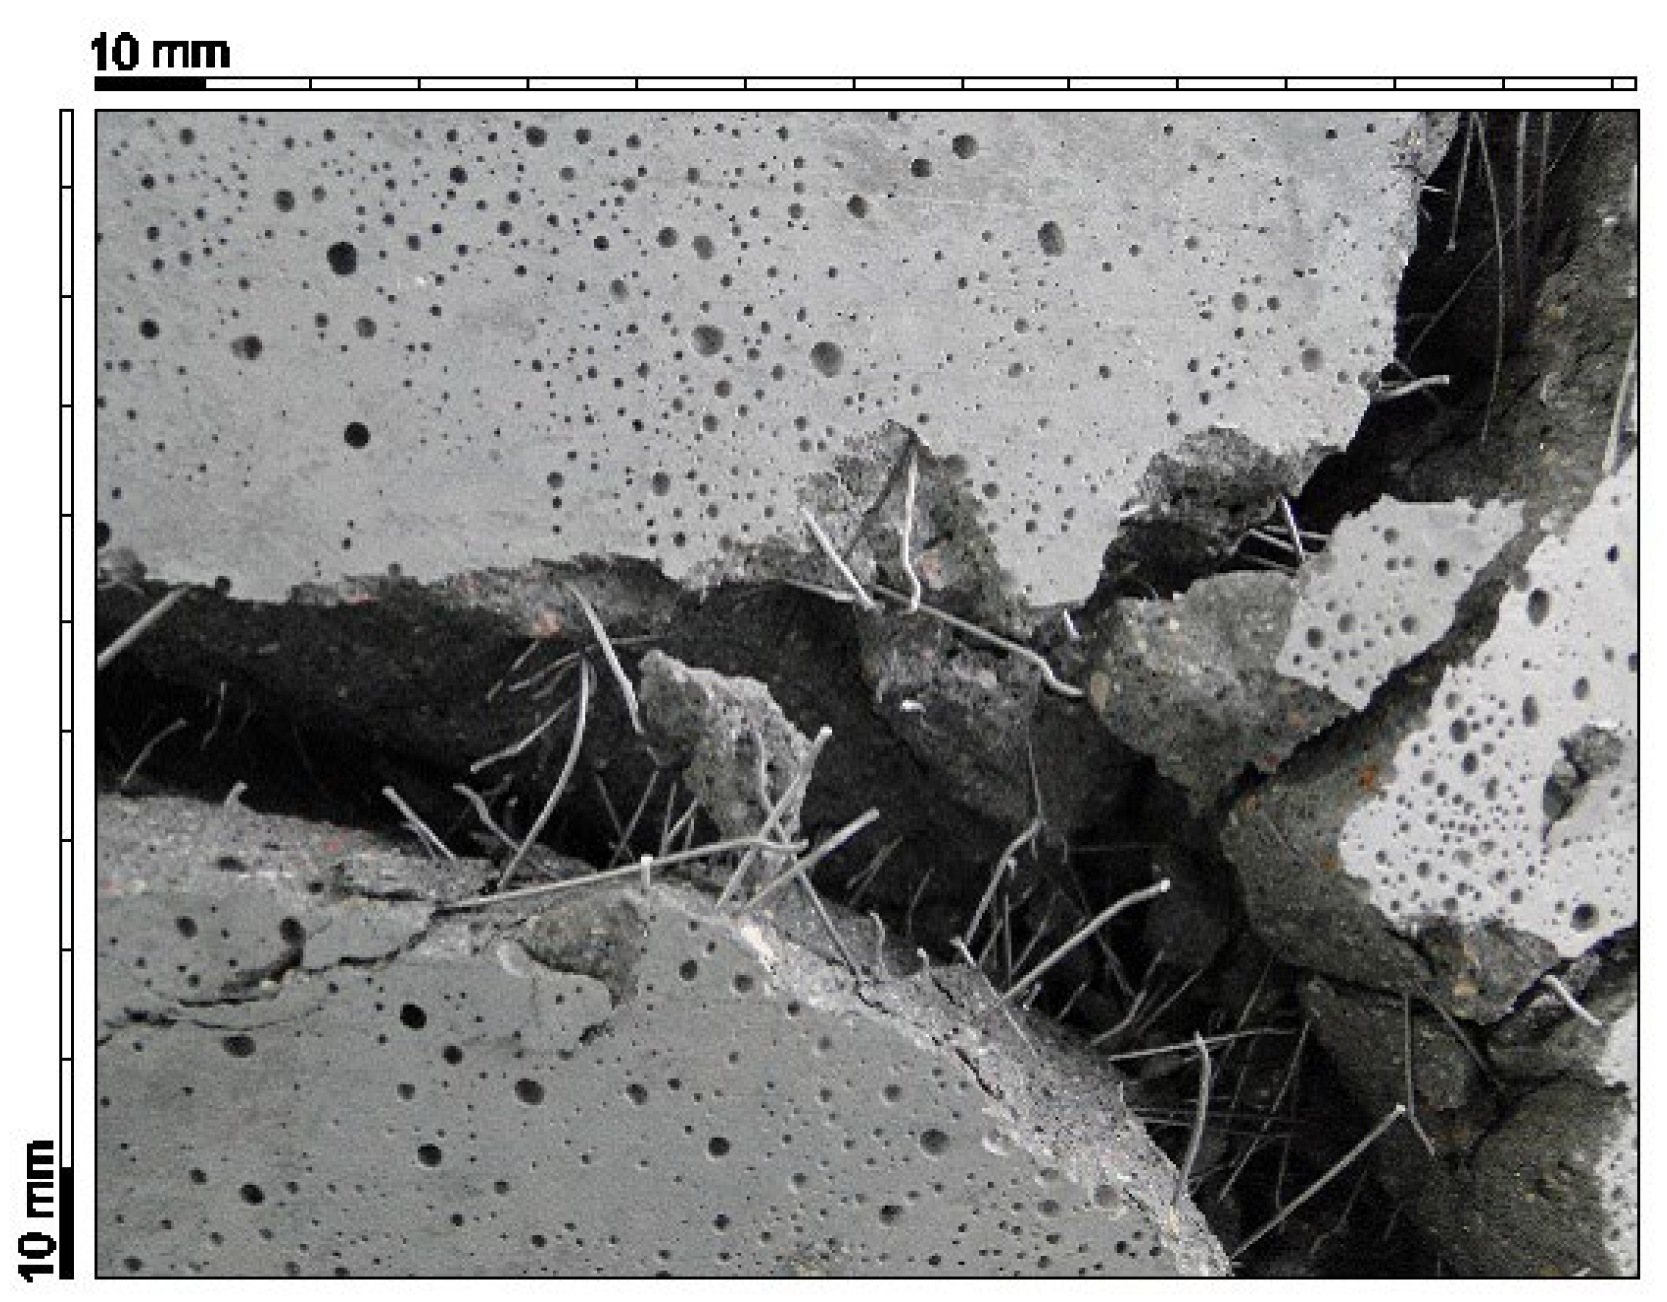
4. Test Results and Their Analysis
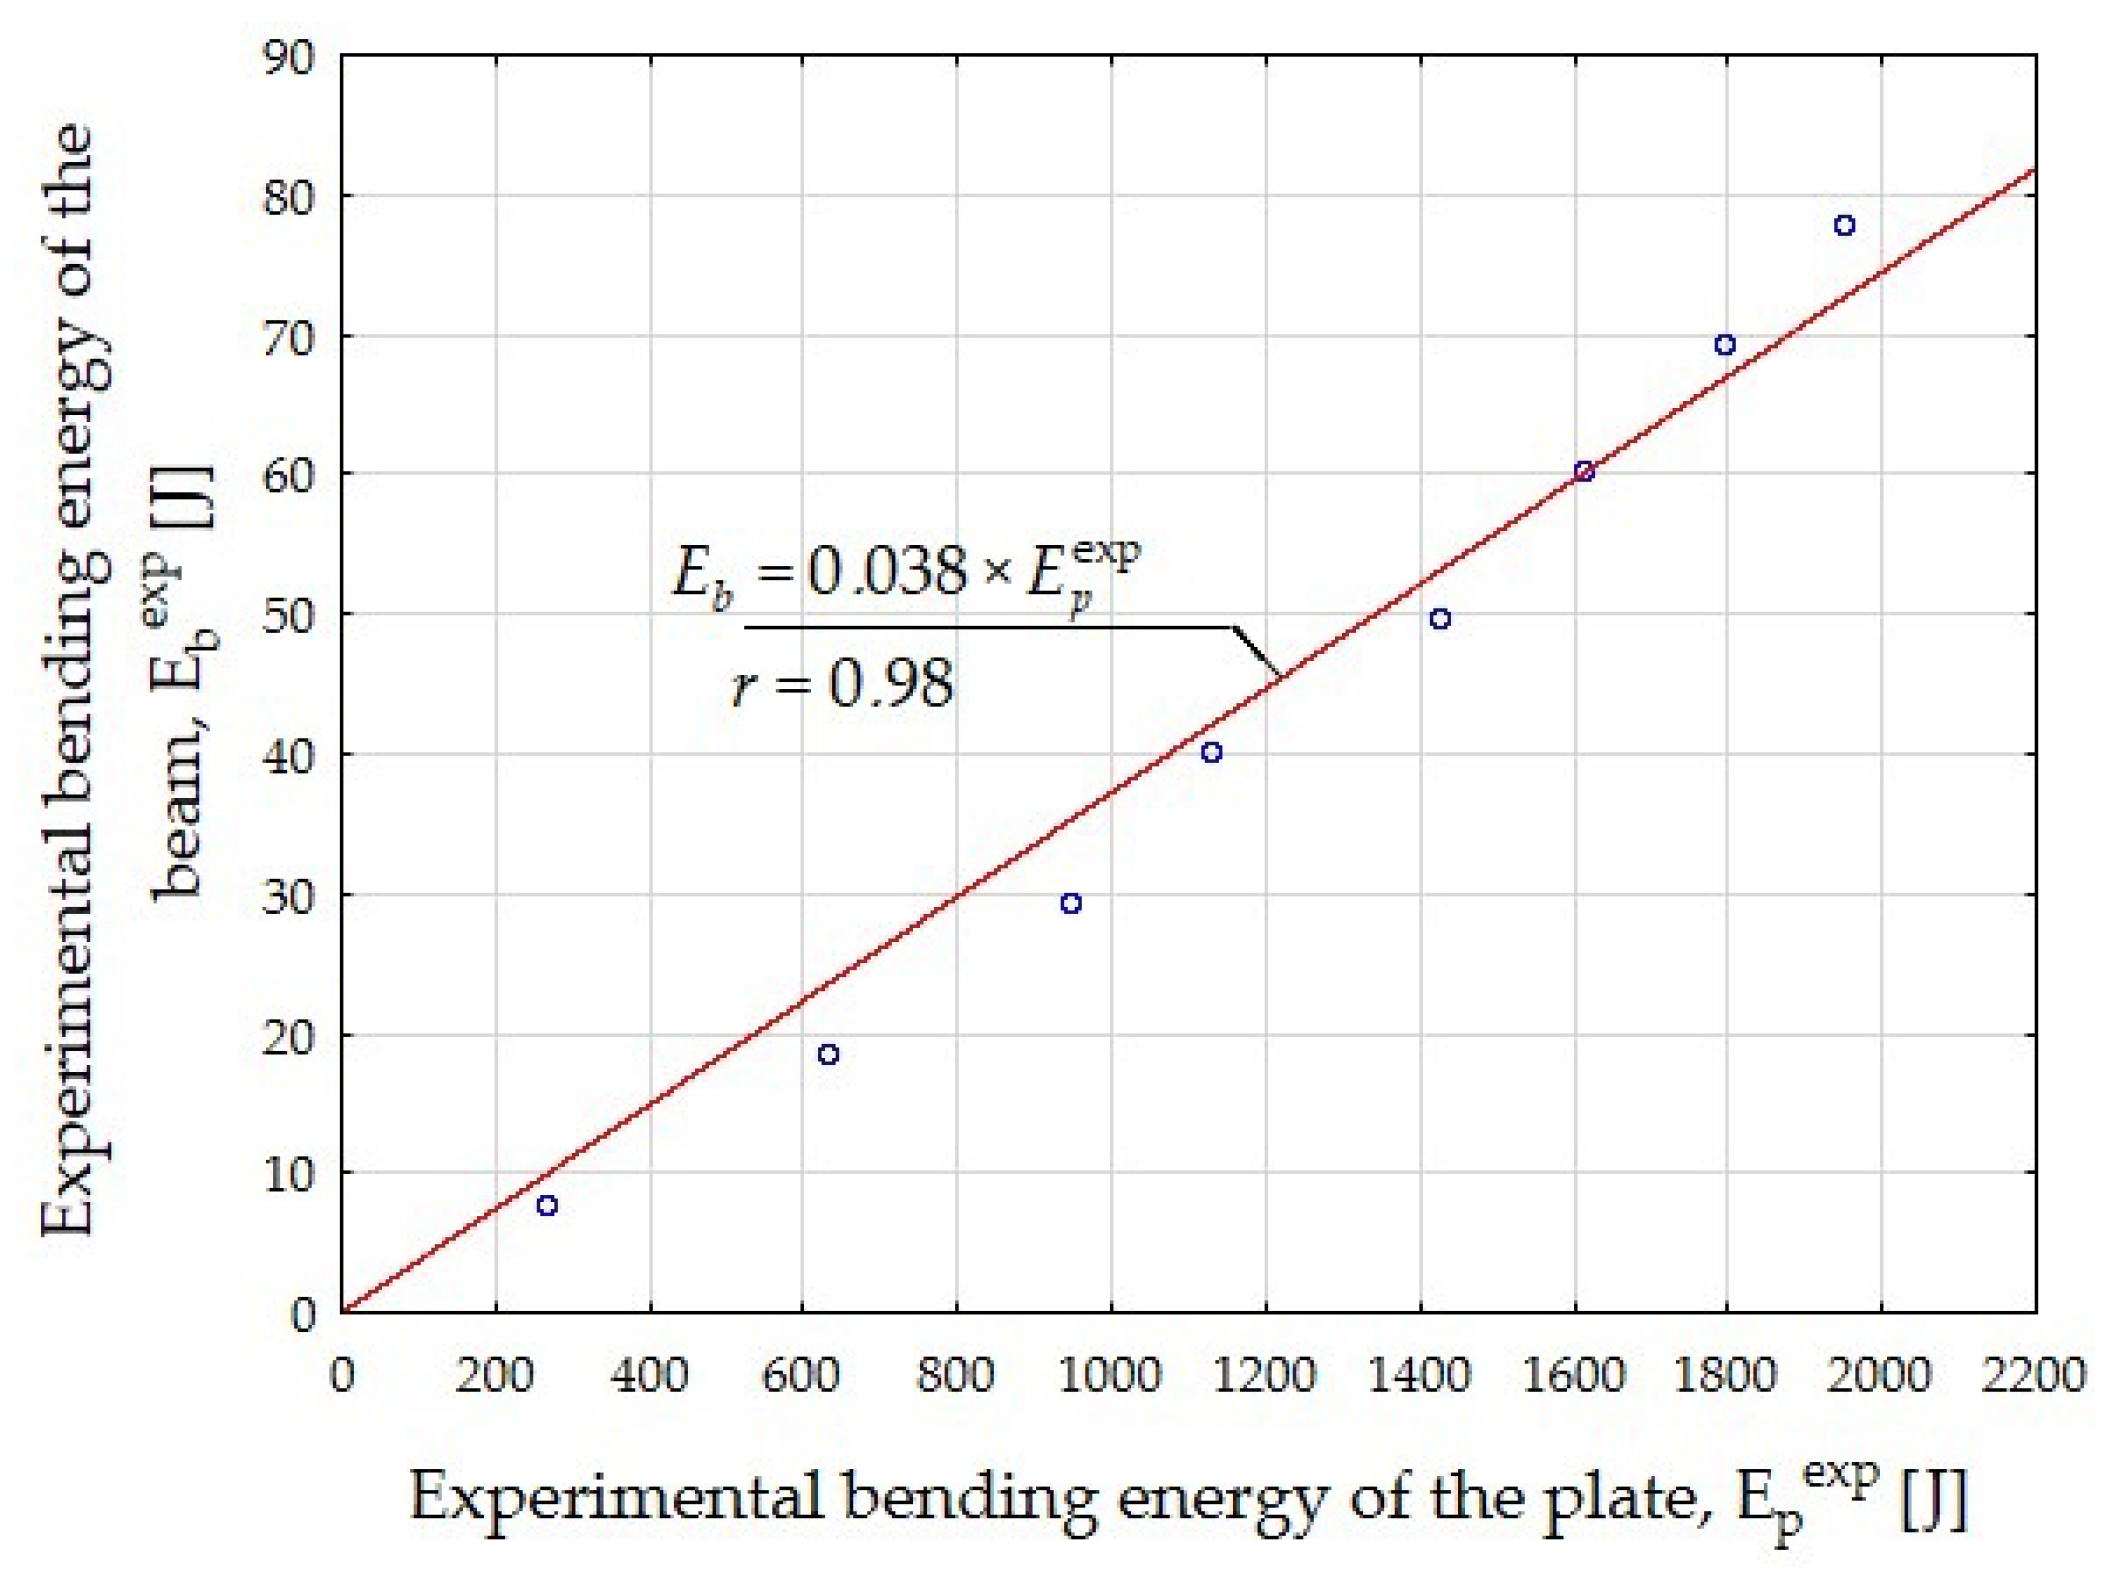
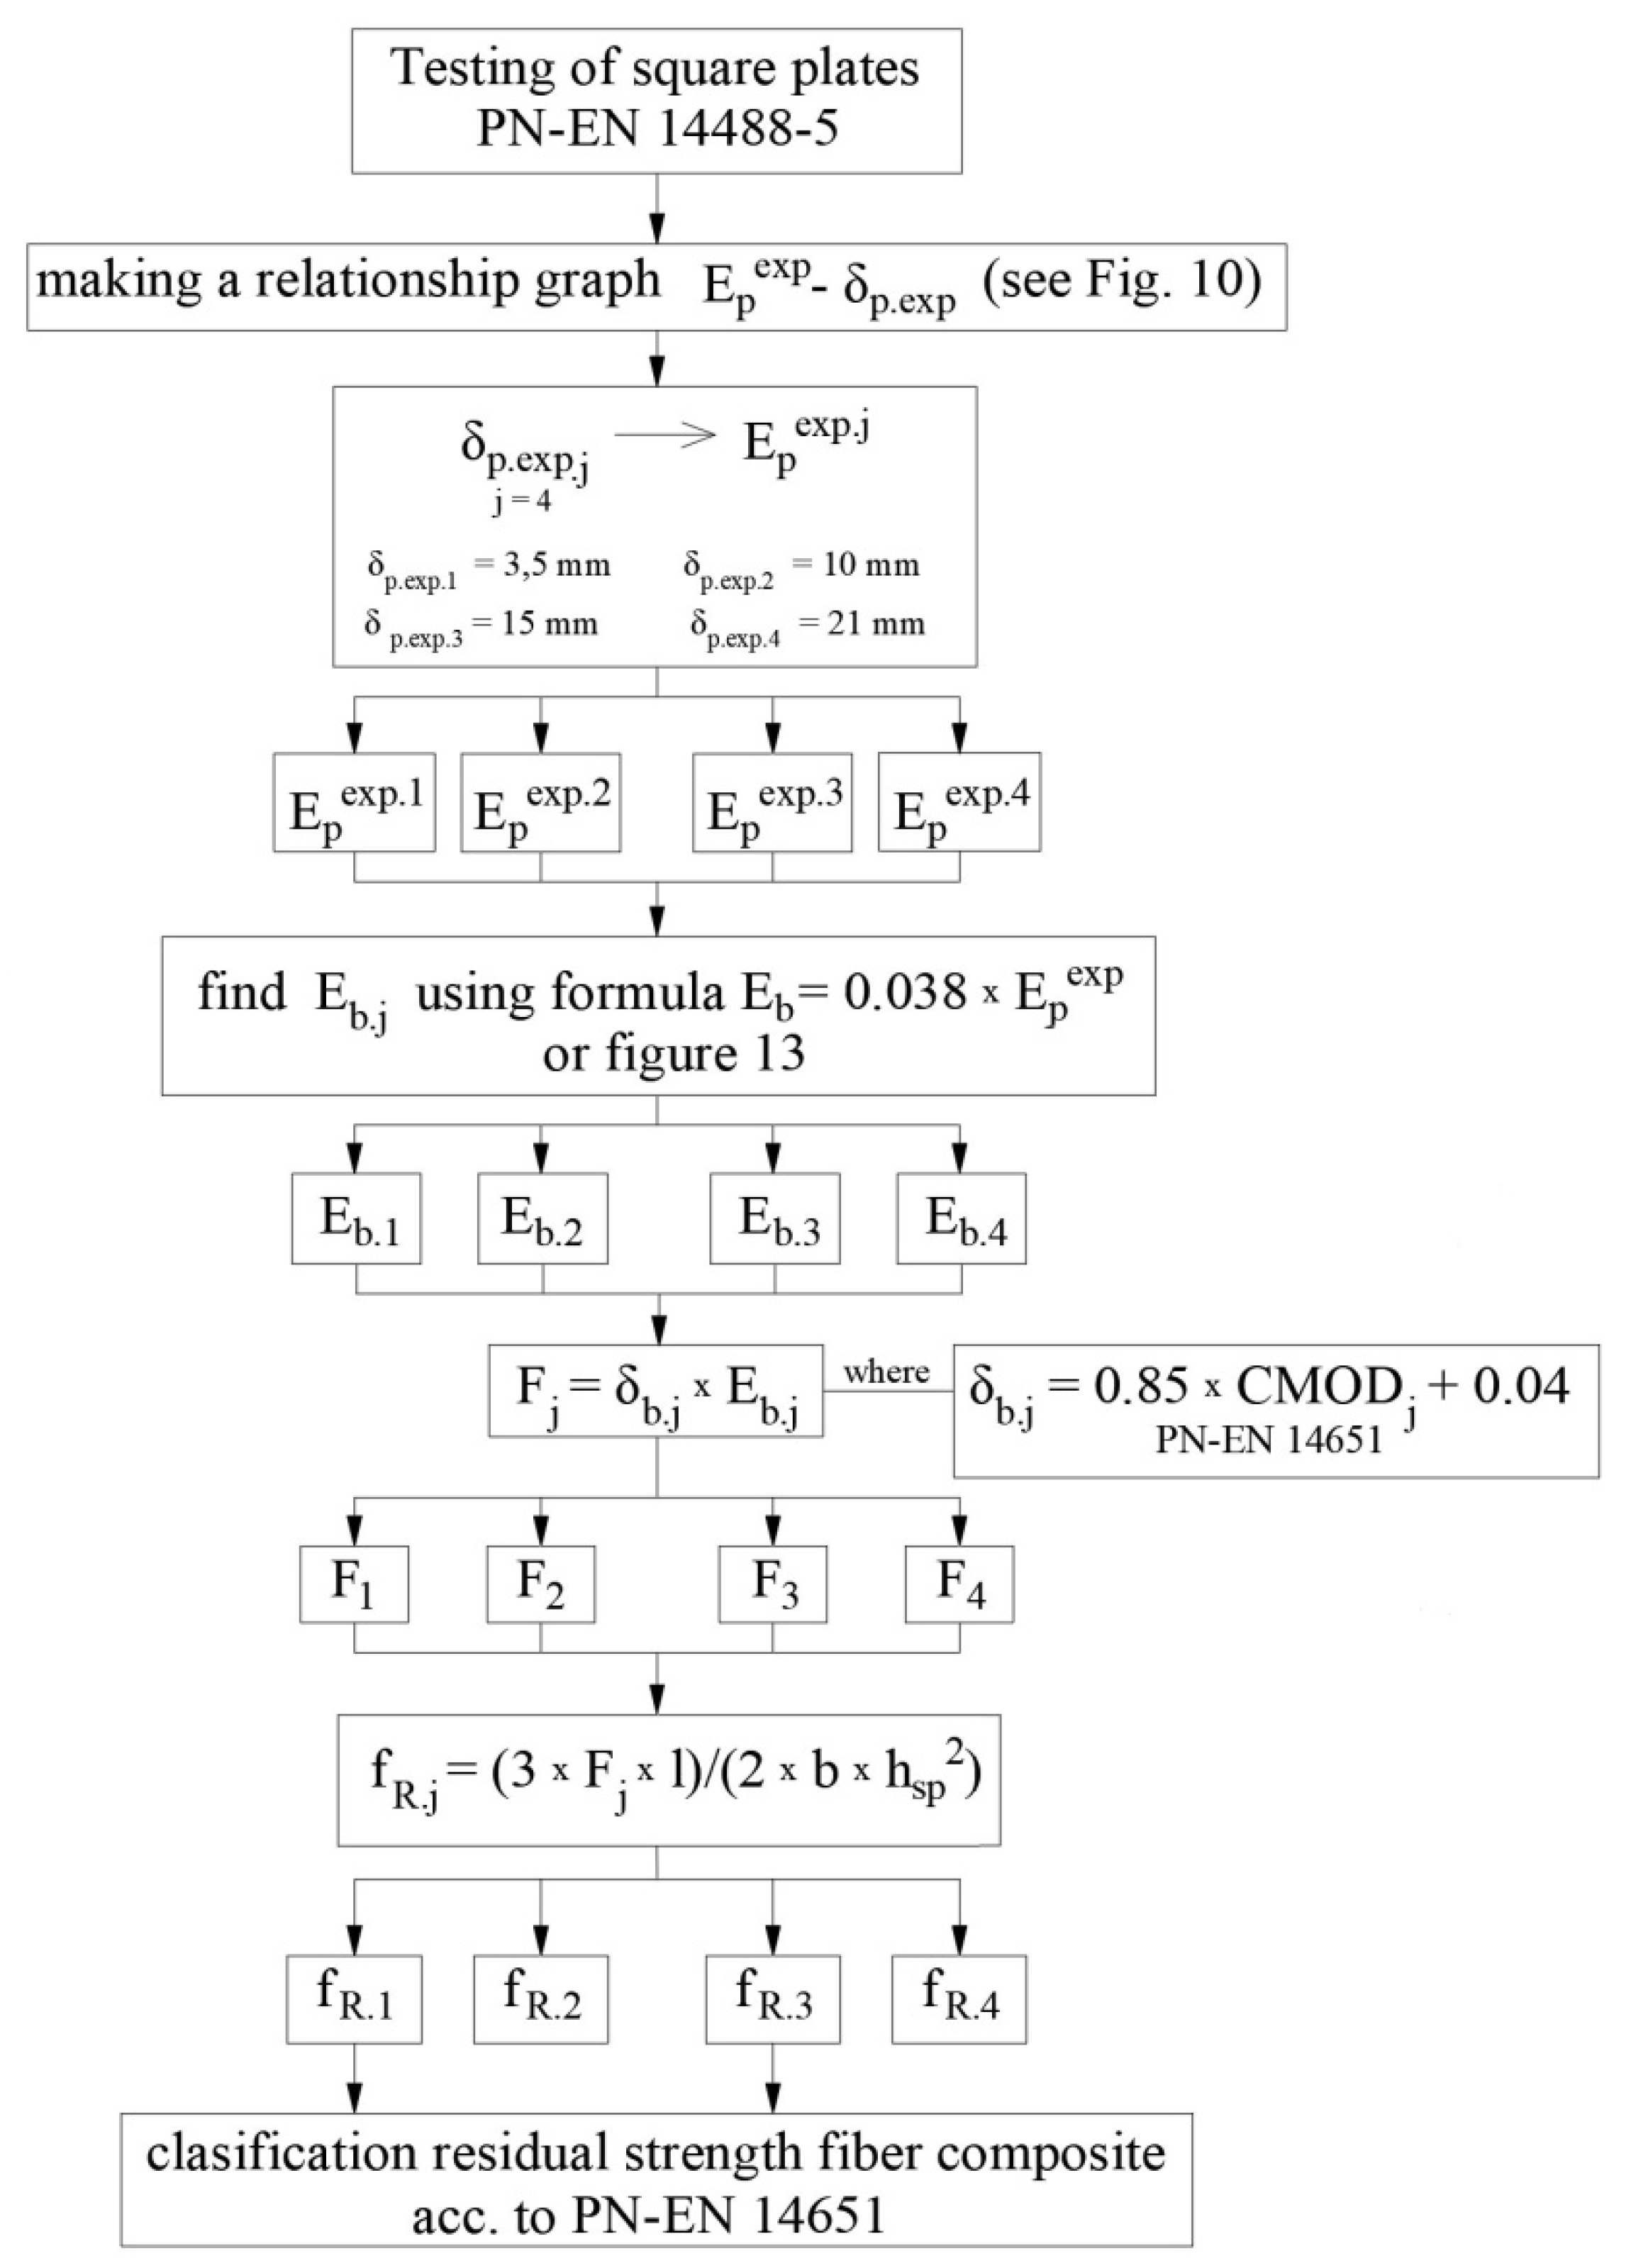
5. Proposition for Determining the Residual Strengths
6. Conclusions
Author Contributions
Funding
Institutional Review Board Statement
Informed Consent Statement
Data Availability Statement
Conflicts of Interest
Nomenclature
| CMOD | crack mouth opening displacement |
| SFRWSC | steel fiber-reinforced waste sand concrete |
| F | load |
| E | bending energy |
| Ep | theoretical bending energy of the plate |
| Eb | theoretical bending energy of the beam |
| Epexp | experimental bending energy of the plate |
| Ebexp | experimental bending energy of the beam |
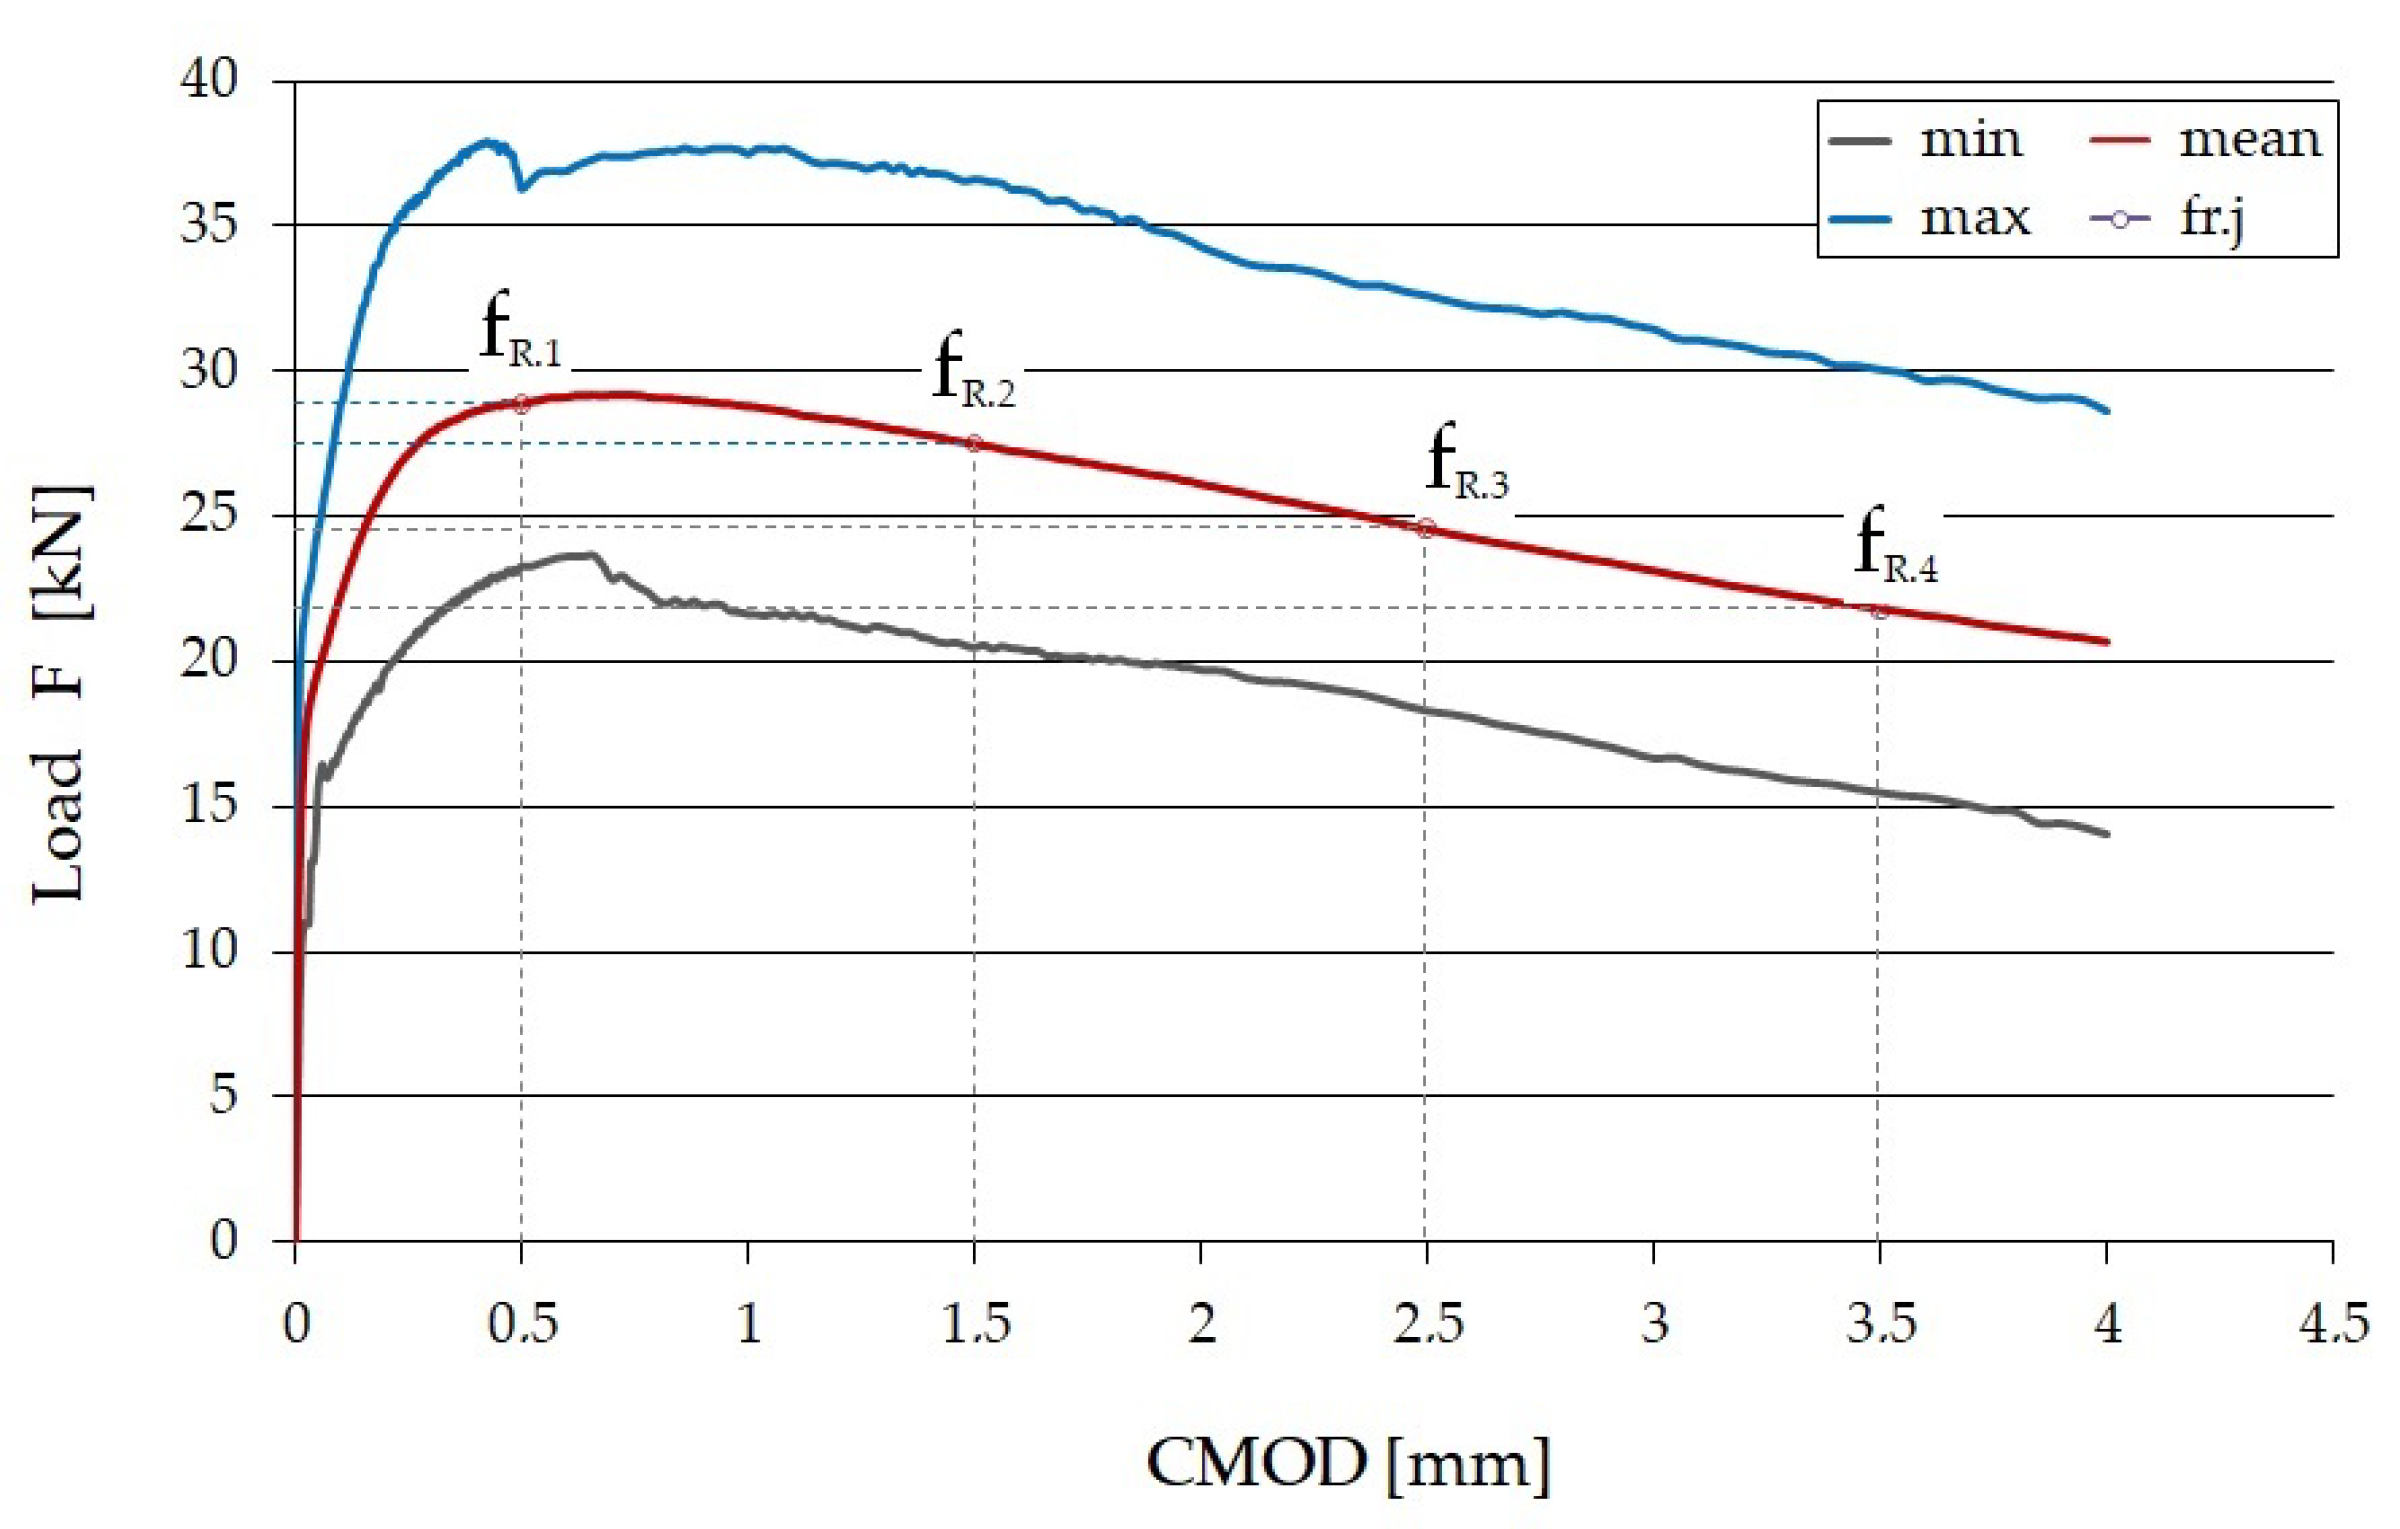
| fR.1fR.2fR.3fR.4 | residual strength determined in accordance with relevant standard for CMOD = 0.5 mm, 1.5 mm, 3.5 mm, and 3.5 mm |
| hsp | distance between the tip of the notch and the test specimen in the mid-span section |
| l | length of span |
| b | width of the beam |
| δ | deflection |
| δb | theoretical deflection at the center of the beam |
| δp | theoretical deflection at the center of the plate |
| δb.exp | experimental deflection at the center of the beam |
| δp.exp | experimental deflection at the center of the plate |
| s | standard deviation |
| coefficient of variation |
References
- Mohajerani, A.; Hui, S.-Q.; Mirzababaei, M.; Arulrajah, A.; Horpibulsuk, S.; Kadir, A.A.; Rahman, M.T.; Maghool, F. Amazing types, properties, and applications of fibers in construction materials. Materials 2019, 12, 2513. [Google Scholar] [CrossRef] [PubMed] [Green Version]
- Tiberti, G.; Germano, F.; Mudadu, A.; Plizzari, G.A. An overview of the flexural post–cracking behavior of steel fiber reinforced concrete. Struct. Concr. 2017, 19, 695–718. [Google Scholar] [CrossRef]
- Elsaigh, W.A.; Kearsley, E.P.; Robberts, J.M. Modeling the behavior of steel-fiber reinforced concrete ground slabs. II: Development of slab model. J. Transp. Eng. 2011, 137, 889–896. [Google Scholar] [CrossRef] [Green Version]
- Ju, Y.; Liu, J.; Liu, H.; Tian, K.; Ge, Z. On the thermal spalling mechanism of reactive powder concrete exposed to high temperature: Numerical and experimental studies. Int. J. Heat Mass Transf. 2016, 98, 493–507. [Google Scholar] [CrossRef]
- Bragov, A.M.; Petrov, Y.V.; Karihaloo, B.L.; Konstantinov, A.Y.; Lamzin, D.A.; Lomunov, A.K.; Smirnov, I.V. Dynamic strengths and toughness of an ultra-high performance fibre reinforced concrete. Eng. Fract. Mech. 2013, 110, 477–488. [Google Scholar] [CrossRef]
- Paul, S.C.; van Zijl, G.P.A.G.; Šavija, B. Effect of fibers on durability of concrete: A practical review. Materials 2020, 13, 4562. [Google Scholar] [CrossRef]
- Sustersic, J.; Mali, E.; Urvancic, S. Erosion-abrasion resistance of steel fiber-reinforced concrete. In Proceedings of the Second International Conference, Montreal, QC, Canada, 4–9 August 1991; pp. 729–743. [Google Scholar]
- Atis, C.D.; Karahan, O. Properties of steel fiber reinforced fly ash concrete. Constr. Build. Mater. 2009, 23, 392–399. [Google Scholar] [CrossRef]
- Mangat, P.S.; Azari, M.M. Shrinkage of steel fiber reinforced cement composites. Mater. Struct. 1988, 21, 163–171. [Google Scholar] [CrossRef]
- Buratti, N.; Ferracuti, B.; Savoia, M. Concrete crack reduction in tunnel linings by steel fibre–reinforced concretes. Constr. Build. Mater. 2013, 44, 249–259. [Google Scholar] [CrossRef]
- Kuczma, M.; Demby, M. Modelling and simulation of HPFRC structural elements. In Proceedings of the 89th GAMM Annual Meeting, Munich, Germany, 19–23 March 2018. [Google Scholar]
- Xu, B.W.; Shi, H.S. Correlations among mechanical properties of steel fiber reinforced concrete. Constr. Build. Mater. 2009, 23, 3468–3474. [Google Scholar] [CrossRef]
- Yoo, D.Y.; Banthia, N. Experimental and numerical analysis of the flexural response of amorphous metallic fiber reinforced concrete. Mater. Struct. 2017, 50, 1–14. [Google Scholar] [CrossRef]
- Marcalikova, Z.; Cajka, R.; Bilek, V.; Bujdos, D.; Sucharda, O. Determination of Mechanical Characteristics for Fiber-Reinforced Concrete with Straight and Hooked Fibers. Crystals 2020, 10, 545. [Google Scholar] [CrossRef]
- Pająk, M.; Krystek, M.; Zakrzewski, M.; Domski, J. Laboratory Investigation and Numerical Modelling of Concrete Reinforced with Recycled Steel Fibers. Materials 2021, 14, 1828. [Google Scholar] [CrossRef]
- Michels, J.; Waldmann, D.; Maas, S.; Zürbes, A. Steel fibers as only reinforcement for flat slab construction–experimental investigation and design. Constr. Build. Mater. 2012, 26, 145–155. [Google Scholar] [CrossRef]
- Sorelli, L.G.; Meda, A.; Plizzari, A. Steel fiber concrete slabs on ground: A structural matter ACI. Struct. J. 2006, 103, 551–558. [Google Scholar]
- Belletti, B.; Cerioni, R.; Meda, A.; Plizzari, G. Design aspects on steel fiber reinforced concrete pavements. J. Mater. Civ. Eng. 2008, 20, 599–607. [Google Scholar] [CrossRef]
- De la Fuente, A.; Pujadas, P.; Blanco, A.; Aguado, A. Experiences in Barcelona withthe use offibres in segmental linings. Tunn. Undergr. Space Technol. 2012, 27, 60–71. [Google Scholar] [CrossRef] [Green Version]
- Mashimo, H.; Isago, N.; Kitani, T. Numerical approach for design of tunnel concrete lining considering effect of fiber reinforcements. Tunn. Undergr. Space Technol. 2004, 19, 454–455. [Google Scholar]
- Tiberti, G.; Plizzari, G.A.; Walraven, J.C.; Blom, C.B.M. Concrete tunnel segments with combined traditional and fibre reinforcement. In Tailor Made Concrete Structures—New Solutions for Our Society; Fib Symposium: Amsterdam, The Netherlands, 2008; pp. 605–610. [Google Scholar]
- Tiberti, G.; Minelli, F.; Plizzari, G. Reinforcement optimization of fiber reinforced concrete linings for conventional tunnels. Compos. B Eng. 2014, 58, 199–207. [Google Scholar] [CrossRef]
- Brandt, A.M. Fibre reinforced cement-based (FRC) composites after over 40 years of development in building and civil engineering. Compos. Struct. 2008, 86, 3–9. [Google Scholar] [CrossRef]
- Nataraja, M.C.; Dhang, N.; Gupta, A.P. Toughness characterization of steel fiber-reinforced concrete by JSCE approach. Cem. Concr. Res. 2000, 30, 593–597. [Google Scholar] [CrossRef]
- Giaccio, G.; Tobes, J.M.; Zerbino, R. Use of small beams to obtain design parameters of fibre reinforced concrete. Cem. Concr. Comp. 2008, 30, 297–306. [Google Scholar] [CrossRef]
- Parmentier, B.; Vandewalle, L.; van Rickstal, F. Evaluation of scatter of the postpeak behaviour of fibre reinforced concrete in bending: A step towards reliability. In Proceedings of the 7th RILEM International Symposium on Fibre Reinforced Concrete—Design and Applications, Chennai, India, 17–19 September 2008. [Google Scholar]
- Abrishambaf, A.; Barros, J.A.O.; Cunha, V.M.C.F. Tensile stress–crack width law for steel fibre reinforced self-compacting concrete obtained from indirect (splitting) tensile tests. Cem. Concr. Compos. 2015, 57, 153–165. [Google Scholar] [CrossRef] [Green Version]
- Vandewalle, L.; Nemegeer, D.; Balázs, G.L.; Barr, B.; Partos, P.; Banthia, N.; Brandt, A.M.; Criswell, M.; Denarie, F.; di Prisco, M.; et al. RILEM TC 162-TDF. Test and design methods for steel fibre reinforced concrete. Uni-axial tension test for steel fibre reinforced concrete. Mater. Struct. 2001, 34, 3–6. [Google Scholar]
- Sitek, M.; Adamczewski, G.; Szyszko, M.; Migacz, B.; Tutka, P.; Natorff, M. Numerical Simulations of a Wedge Splitting Test for High-Strength Concrete. Procedia Eng. 2014, 91, 99–104. [Google Scholar] [CrossRef] [Green Version]
- PN-EN 14651: 2005 + A1:2007; Test Method for Metallic Fibered Concrete—Measuring the Flexural Tensile Strength (Limit or Proportionality (LOP), Residual). Committee for Standardization: Warsaw, Poland, 2008.
- Model Code 2010. In Final Draft, Fib Bulletin 66, v. 2, 2012; Comité Euro-International du Béton—Fédération International e de la Précontrainte: Paris, France, 2010.
- ASTM C 1018; Standard Test Method for Flexural Toughness and First-Crack Strength of Fiber-Reinforced Concrete (Using Beam with Third-Point Loading). ASTM: West Conshohocken, PA, USA, 1997.
- JCI Standards for Test Methods of Fiber Reinforced Concrete. In Method of Test for Flexural Strength and Flexural Toughness of Fiber Reinforced Concrete; (Standard SF4); Japan Concrete Institute: Tokyo, Japan, 1983; pp. 45–51.
- Standard C-1550; Standard Test Method for Flexural Toughness of Fiber Reinforced Concrete (Using a Centrally Loaded Round Panel). American Society for Testing and Materials: West Conshohocken, PA, USA, 2020.
- PN-EN 14488-5:2008; Testing Sprayed Concrete—Part 5: Determination of Energy Absorption Capacity of Fibre Reinforced Slab Specimens. Committee for Standardization: Warsaw, Poland, 2008.
- Vandewalle, L.; Nemegeer, D.; Balázs, G.L.; Barr, B.; Barros, J.A.O.; Bartos, P.; Banthia, N.; Criswell, M.; Denarie, E.; di Prisco, M.; et al. RILEM TC 162-TDF. Test and design methods for steel fibre reinforced concrete, σ-ε design method. Mater. Struct. 2003, 36, 560–567. [Google Scholar]
- Głodkowska, W. Waste Sand Fiber Composite: Models of Description of Properties and Application. Annu. Set Environ. Prot. 2018, 20, 291. [Google Scholar]
- Pająk, M.; Ponikiewski, T. Flexural behavior of self-compacting concrete reinforced with different types of steel fibers. Constr. Build. Mater. 2013, 47, 397–408. [Google Scholar] [CrossRef]
- Yoo, D.Y.; Lee, J.H.; Yoon, Y.S. Effect of fiber content on mechanical and fracture properties of ultra high performance fiber reinforced cementitious composites. Compos. Struct. 2013, 106, 742–753. [Google Scholar] [CrossRef]
- Lee, J.H. Influence of concrete strength combined with fiber content in the residual flexural strengths of fiber reinforced concrete. Compos. Struct. 2017, 168, 216–225. [Google Scholar] [CrossRef]
- Zamanzadeh, Z.; Laurenco, L.; Barros, J. Recycled steel fiber reinforced concrete failing in bending and in shear. Constr. Build. Mater. 2015, 85, 195–207. [Google Scholar] [CrossRef] [Green Version]
- Buratti, N.; Mazzotti, C.; Savoia, M. Post-cracking behaviour of steel and macro synthetic fiber-reinforced concretes. Constr. Build. Mater. 2011, 25, 2713–2722. [Google Scholar] [CrossRef]
- Choi, W.-C.; Jung, K.-Y.; Jang, S.-J.; Yun, H.-D. The Influence of Steel Fiber Tensile Strengths and Aspect Ratios on the Fracture Properties of High-Strength Concrete. Materials 2019, 12, 2105. [Google Scholar] [CrossRef] [Green Version]
- Centonze, G.; Leone, M.; Aiello, M.A. Steel fibers from waste tires as reinforcement in concrete: A mechanical characterization. Constr. Build. Mater. 2012, 36, 46–57. [Google Scholar] [CrossRef]
- Soetens, T.; Matthys, S. Different methods to model the post-cracking behaviour of hooked-end steel fibre reinforced concrete. Constr. Build. Mater. 2014, 30, 458–471. [Google Scholar] [CrossRef]
- Pająk, M. Concrete Reinforced with Various Amounts of Steel Fibers Reclaimed from End-of-Life Tires. In Proceedings of the MATEC Web of Conferences 2019, Krynica, Poland, September 2018; Volume 262. [Google Scholar]
- He, S.; Yang, E.-H. Non-normal distribution of residual flexural strengths of steel fiber reinforced concretes and its impacts on design and conformity assessment. Cem. Concr. Comp. 2021, 123, 104207. [Google Scholar] [CrossRef]
- Głodkowska, W.; Ziarkiewicz, M.; Lehmann, M. Aplication for residual strength to analysis shear area of beams made of fiber reinforced based on waste sand. Mater. Bud. 2017, 5, 91–93. [Google Scholar]
- Głodkowska, W.; Ziarkiewicz, M.; Lehmann, M. Residual strength of fibre composite based on waste sand. Mater. Bud. 2015, 5, 75–77. [Google Scholar]
- Lehmann, M.; Głodkowska, W. Shear Capacity and Behaviour of Bending Reinforced Concrete Beams Made of Steel Fibre-Reinforced Waste Sand Concrete. Materials 2021, 14, 2996. [Google Scholar] [CrossRef]
- Głodkowska, W.; Kobaka, J. Modelling of properties and distribution of steel fibres within a fine aggregate concrete. Constr. Build. Mater. 2013, 44, 645–653. [Google Scholar] [CrossRef]
- Głodkowska, W.; Laskowska-Bury, J. Waste sands as a valuable aggregates to produce fibre-composites. Annu. Set Environ. Prot. 2015, 17, 507–525. [Google Scholar]
- Domski, J.; Głodkowska, W. Selected Mechanical Properties Analysis of Composites Made on the Basis Fine Waste Aggregate. Annu. Set Environ. Prot. 2017, 19, 81–95. [Google Scholar]
- Domski, J.; Zakrzewski, M. Deflection of steel fiber reinforced concrete beams based on waste sand. Materials 2020, 13, 392. [Google Scholar] [CrossRef] [PubMed] [Green Version]
- PN-EN 12620+A1:2010; Aggregates for Concrete. Polish Committee for Standardization: Warsaw, Poland, 2010.
- Ahmaruzzaman, M. A review on the utilization of Ely Ash. Prog. Energy Combust. Sci. 2010, 36, 327–363. [Google Scholar] [CrossRef]
- Śliwiński, J.; Łagosz, A.; Małolepszy, J.; Tracz, T. Utilization of fly-ash from fluidized bed boilers as a mineral additive for concretes. In Proceedings of the Dni Betonu Conference, Kraków, Poland, 13–15 October 2008. [Google Scholar]
- PN-EN 12350-3:2019-07; Testing Fresh Concrete. Part 3: Vebe Test. Polish Committee for Standardization: Warsaw, Poland, 2019.
- Głodkowska, W.; Kobaka, J. Estimating the properties of a fine aggregate fibre reinforced cementitious composite using non-destructive methods. J. Civ. Eng. Manag. 2018, 8, 630–637. [Google Scholar] [CrossRef]
- Głodkowska, W.; Lehmann, M. Shear Capacity and Residual Strengths of Steel Fibre Reinforced Waste Sand Concrete (SFRWSC). Annu. Set Environ. Prot. 2019, 21, 1405–1426. [Google Scholar]
- Glinicki, M.A.; Litorowicz, A.; Zieliński, M. Interpretation of the test sof resistance of FRC to cracking in bending. In Proceedings of the Scientific Conference KILiW PAN i KN PZITB, Krynica, Poland, 16–21 September 2001. (Polish Standard). [Google Scholar]
- Glinicki, M.A. Ocena i projektowanie fibrobetonów na podstawie wytrzymałości równoważnej. Drogiimosty 2002, 3, 5–36. [Google Scholar]
- Minelli, F.; Plizzari, G.A. Fiber reinforced concrete characterization through round panel test—Part I: Experimental study. Fract. Mech. Concr. Concr. Struct. 2010, 7, 1451–1460. [Google Scholar]
- Khaloo, A.R.; Afshari, M. Flexural behaviour of small steel fibre reinforced concrete slabs. Cem. Concr. Comp. 2005, 27, 141–149. [Google Scholar] [CrossRef]
- Farjadmand, M.; Safi, M. Optimized Energy Based Design of Tunnel Lining with Macro Synthetic Fiber Composites. J. Appl. Phys. Math. 2012, 2, 117–122. [Google Scholar] [CrossRef]
- PN-EN 14487-1: 2007; Sprayed Concrete—Part 1: Definitions, Specifications and Conformity. Committee for Standardization: Warsaw, Poland, 2007.
- Laskowska-Bury, J. Selected Physico-Mechanical Properties Fiber Reinforced Composite Produced on Waste Aggregate. Ph.D. Thesis, Koszalin University, Koszalin, Poland, May 2017. [Google Scholar]
- Fischer, U.; Potrykus, J.; Smalec, Z.; Wnuczak, E.; Heinzler, M.; Näher, F.; Paetzold, H.; Gomeringer, R.; Kilgus, S.; Oesterle, S. Poradnik Mechanika. Warszawa. 2008.


| Statistical Parameters | fR.1 | fR.2 | fR.3 | fR.4 | fLOP |
|---|---|---|---|---|---|
| CMOD (mm) | |||||
| 0.5 | 1.5 | 2.5 | 3.5 | ||
| Mean value (MPa) | 9.27 | 8.80 | 7.87 | 6.98 | 6.34 |
| Standard deviation: s (MPa) | 1.20 | 1.29 | 1.25 | 1.16 | 0.67 |
| Coefficient of Variation: v (%) | 13 | 15 | 15 | 17 | 11 |
| Minimal value (MPa) | 7.30 | 6.68 | 5.82 | 5.07 | 5.24 |
| Confidence interval (MPa) | 8.82 ÷ 9.74 | 8.30 ÷ 9.28 | 7.39 ÷ 8.34 | 6.53 ÷ 7.42 | 6.09 ÷ 6.60 |
| fR.3/fR.1 | 0.79 | ||||
| fR.1/fLOP | 1.39 | ||||
| Classification of fiber composite according to fib Model Code 2010 [30]: 7b | |||||
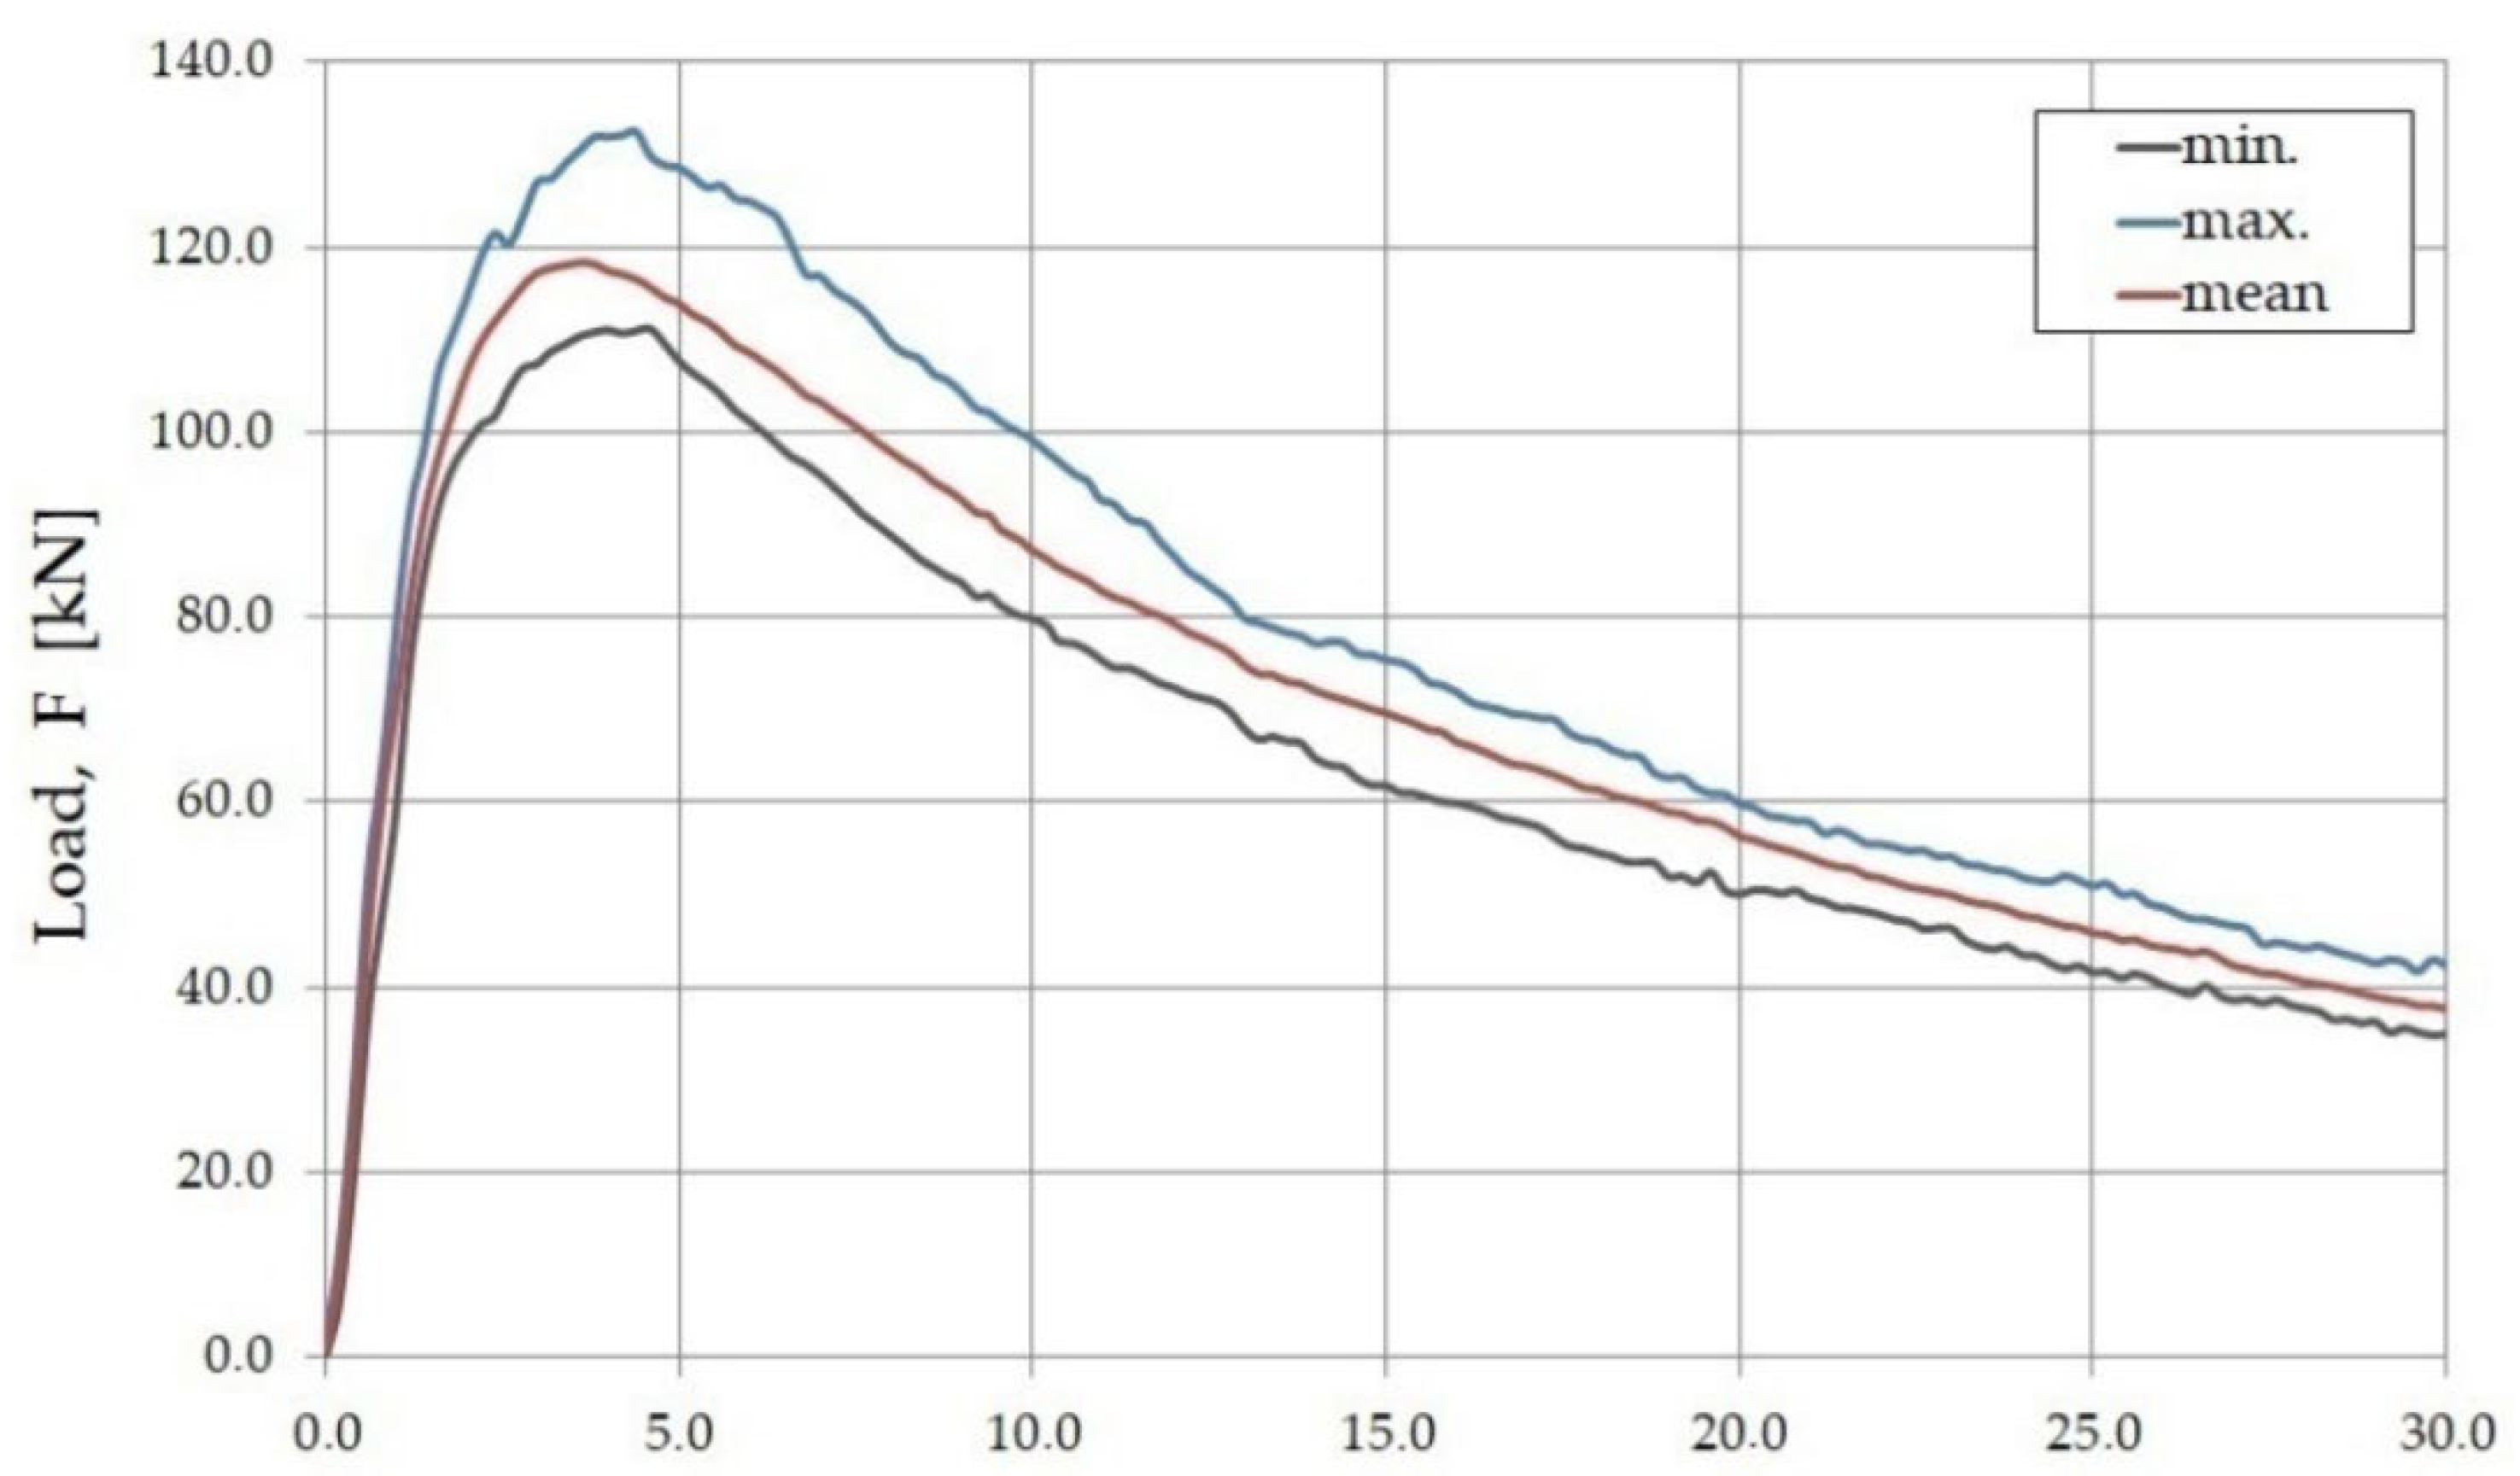
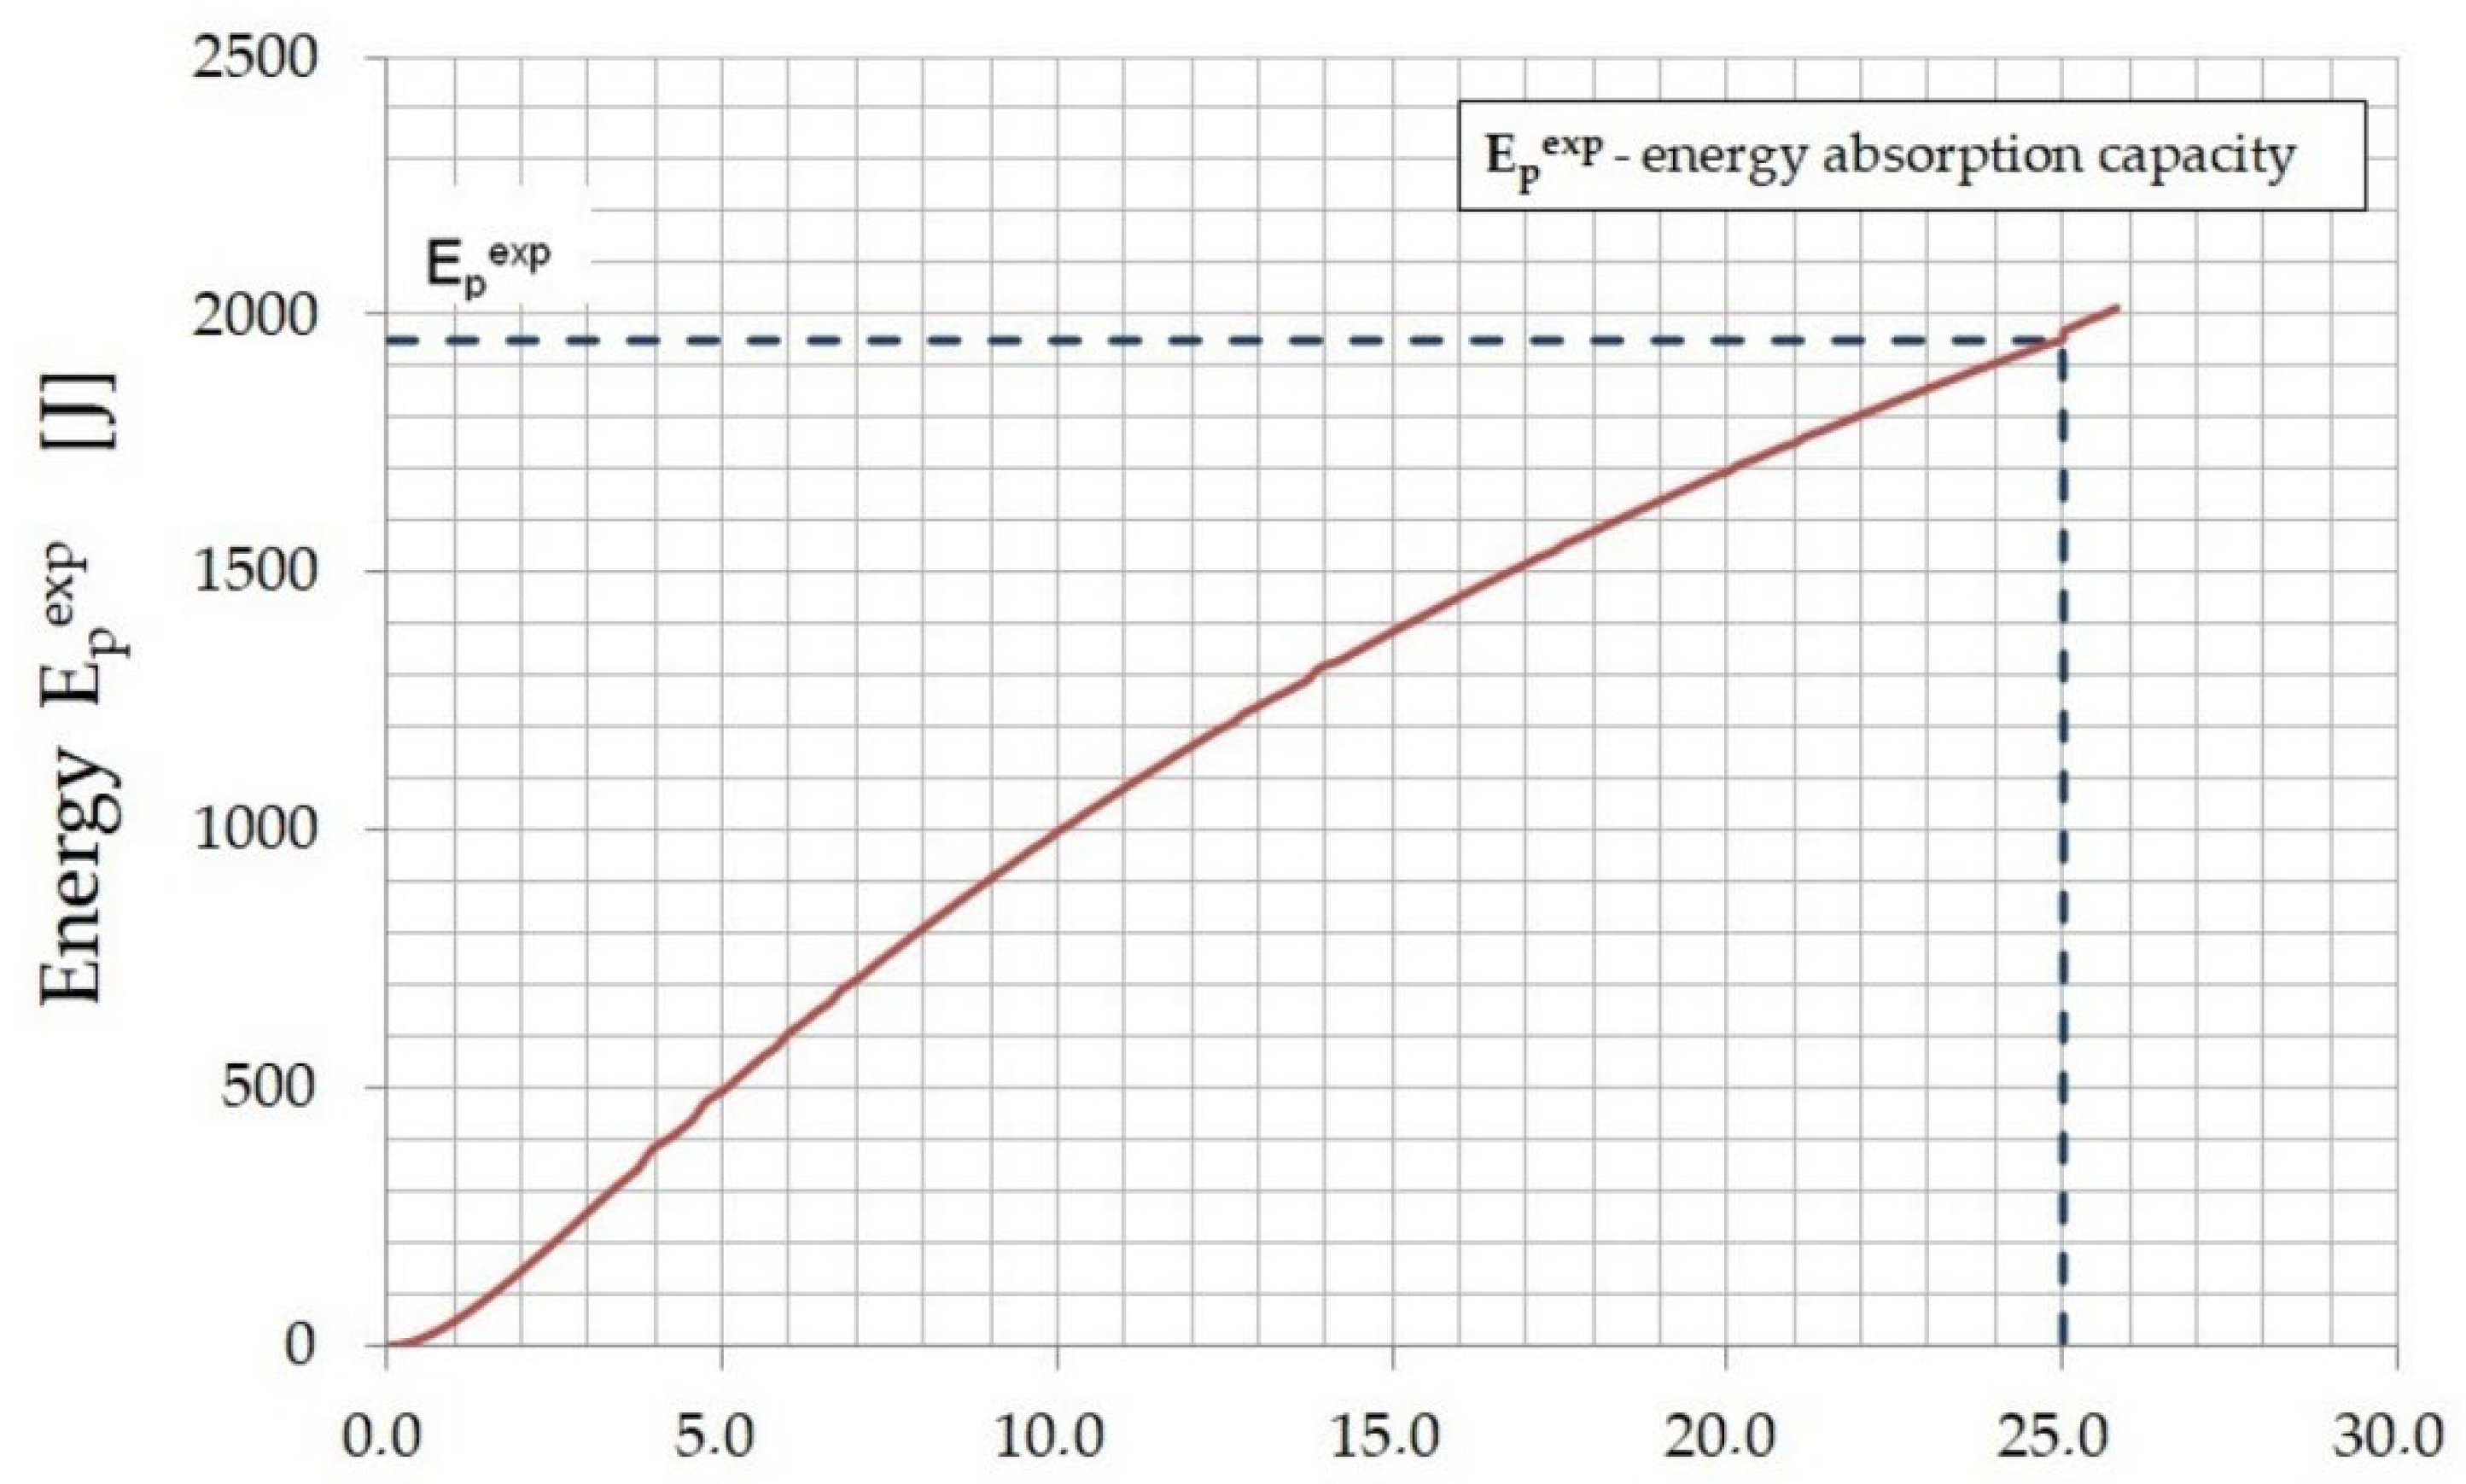
| Specimen | Maximum Load: Fmax (kN) | for Fmax (mm) | Energy E for Fmax (J) | Energy Absorption Capacity Epexp (J) |
|---|---|---|---|---|
| P1 | 111.1 | 4.4 | 450 | 2084 |
| P2 | 121.4 | 3.0 | 280 | 1822 |
| P3 | 116.2 | 3.6 | 330 | 1924 |
| P4 | 132.6 | 4.4 | 470 | 2102 |
| P5 | 119.4 | 3.4 | 310 | 1818 |
| P6 | 116.3 | 3.8 | 340 | 1923 |
| Mean value | 119.5 | 3.77 | 360 | 1945 |
| Statistical Parameters | Energy Absorption Capacity Epexp |
|---|---|
| Mean value (J) | 1945 |
| Standard deviation, s (J) | 113 |
| Coefficient of variation, v (%) | 6 |
| Minimal value (J) | 1818 |
| Confidence interval (J) | 1815 ÷ 2075 |
| CMOD (mm) | Deflection (mm) | Experimental Deflection (mm) | Energy Absorption Capacity (J) |
|---|---|---|---|
| δb = 0.85 · CMOD + 0.04 [30] | δb.exp | Ebexp | |
| 0.5 | 0.46 | 0.48 | 11.3 |
| 1.5 | 1.31 | 1.34 | 35.6 |
| 2.5 | 2.16 | 2.17 | 58.3 |
| 3.5 | 3.00 | 2.99 | 72.4 |
| 1 | 2 | 3 | 4 | 5 | 6 | |
|---|---|---|---|---|---|---|
| Deflection δp (mm) | Plate Bending Energy (J) | Beam Bending Energy (J) | Beam Deflection δb (mm)/CMOD (mm) | Load Fj (kN) | Residual Flexural Tensile Strengths (MPa) | |
| Epexp | Eb | Ebexp | ||||
| 3.5 | 343.6 | 13.1 | 11.3 | 0.46/0.5 | 27.8 | fR.1 = 8.89 |
| 10 | 977.4 | 37.1 | 35.6 | 1.31/1.5 | 28.1 | fR.2 = 9.00 |
| 15 | 1384.4 | 52.6 | 58.3 | 2.16/2.5 | 24.2 | fR.3 = 7.76 |
| 21 | 1762.8 | 67.5 | 72.4 | 3.02/3.5 | 22.4 | fR.4 = 7.16 |
| Vf(%) | Residual Flexural Tensile Strength (MPa) | Values Obtained in Own Research and According to [49] | Values Obtained on the Basis of Calculations According to Own Procedure | |||||
|---|---|---|---|---|---|---|---|---|
| Mean Value (MPa) | Standard Deviation: s (MPa) | Coefficient of Variation: v (%) | Confidence Interval (MPa) | Mean Value (MPa) | Standard Deviation: s (MPa) | Coefficient of Variation: v (%) | ||
| 1.2 | fR.1 | 9.27 | 1.2 | 13 | 8.82 ÷ 9.74 | 8.89 | 0.5 | 5 |
| fR.2 | 8.80 | 1.29 | 15 | 8.30 ÷ 9.28 | 9.00 | 0.1 | 1 | |
| fR.3 | 7.87 | 1.25 | 15 | 7.39 ÷ 8.34 | 7.76 | 0.4 | 5 | |
| fR.4 | 6.98 | 1.16 | 17 | 6.53 ÷ 7.42 | 7.16 | 0.5 | 6 | |
| 0.9 [49] | fR.1 | 7.08 | 1.2 | 16 | 6.16 ÷ 8.00 | 7.11 | 0.5 | 8 |
| fR.2 | 6.96 | 0.94 | 13 | 6.24 ÷ 7.68 | 7.68 | 0.1 | 1 | |
| fR.3 | 6.37 | 0.95 | 14 | 5.65 ÷ 7.10 | 6.70 | 0.2 | 3 | |
| fR.4 | 5.72 | 0.86 | 14 | 5.06 ÷ 6.37 | 6.17 | 0.2 | 4 | |
| 0.5 [49] | fR.1 | 4.51 | 0.56 | 12 | 4.07 ÷ 4.96 | 4.64 | 0.3 | 7 |
| fR.2 | 4.72 | 0.58 | 12 | 4.26 ÷ 5.17 | 5.15 | 0.2 | 4 | |
| fR.3 | 4.61 | 0.48 | 10 | 4.24 ÷ 4.99 | 4.67 | 0.2 | 5 | |
| fR.4 | 4.38 | 0.50 | 11 | 3.99 ÷ 4.77 | 4.29 | 0.3 | 6 | |
Publisher’s Note: MDPI stays neutral with regard to jurisdictional claims in published maps and institutional affiliations. |
© 2022 by the authors. Licensee MDPI, Basel, Switzerland. This article is an open access article distributed under the terms and conditions of the Creative Commons Attribution (CC BY) license (https://creativecommons.org/licenses/by/4.0/).
Share and Cite
Głodkowska, W.; Laskowska-Bury, J. Proposition for Determining the Residual Strength of Fiber-Reinforced Cement Composite. Materials 2022, 15, 7546. https://doi.org/10.3390/ma15217546
Głodkowska W, Laskowska-Bury J. Proposition for Determining the Residual Strength of Fiber-Reinforced Cement Composite. Materials. 2022; 15(21):7546. https://doi.org/10.3390/ma15217546
Chicago/Turabian StyleGłodkowska, Wiesława, and Joanna Laskowska-Bury. 2022. "Proposition for Determining the Residual Strength of Fiber-Reinforced Cement Composite" Materials 15, no. 21: 7546. https://doi.org/10.3390/ma15217546