
Non-Destructive Methods and Numerical Analysis Used for Monitoring and Analysis of Fibre Concrete Deformations


Abstract
:1. Introduction
1.1. Characteristics of Concrete Reinforced with Short, Evenly Distributed Steel Fibres
1.2. Methods Used in Monitoring and Evaluation of Deformation of Concrete Reinforced with Evenly Distributed Fibres
1.2.1. Acoustic Emission Method
1.2.2. Finite Element Method (FEM)
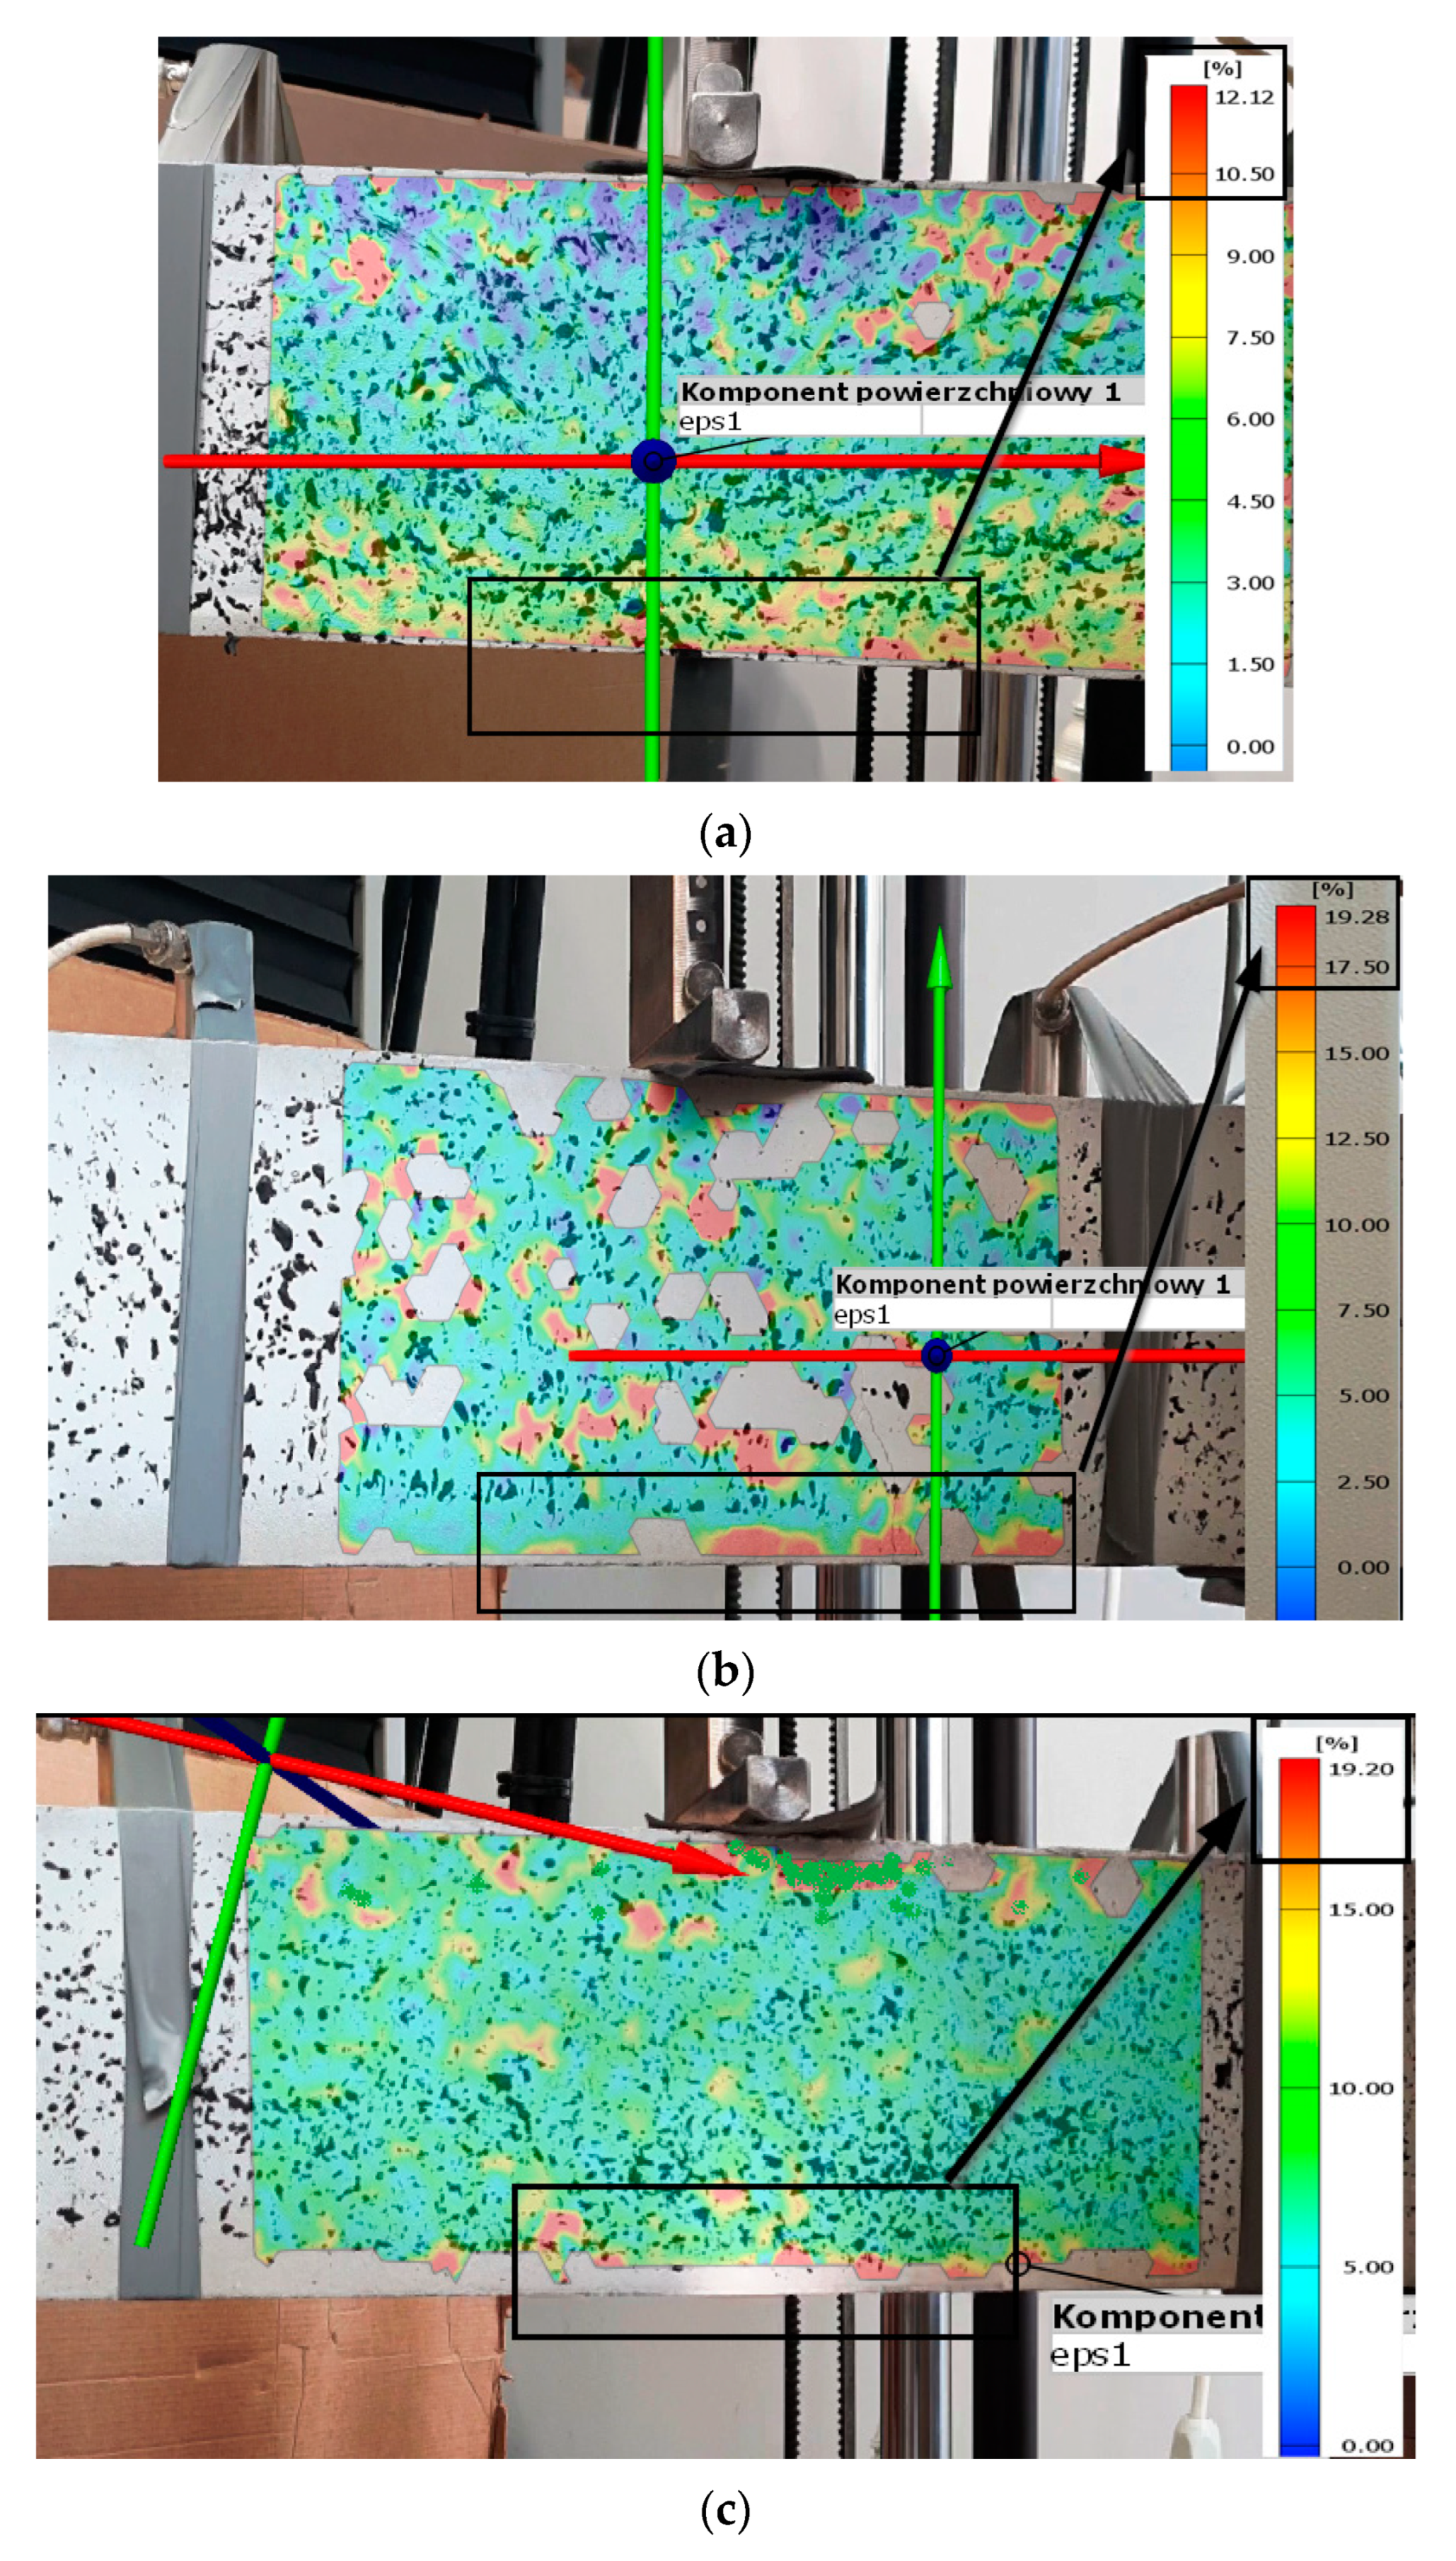
1.2.3. Digital Image Correlation System
2. Materials and Methods
2.1. Materials
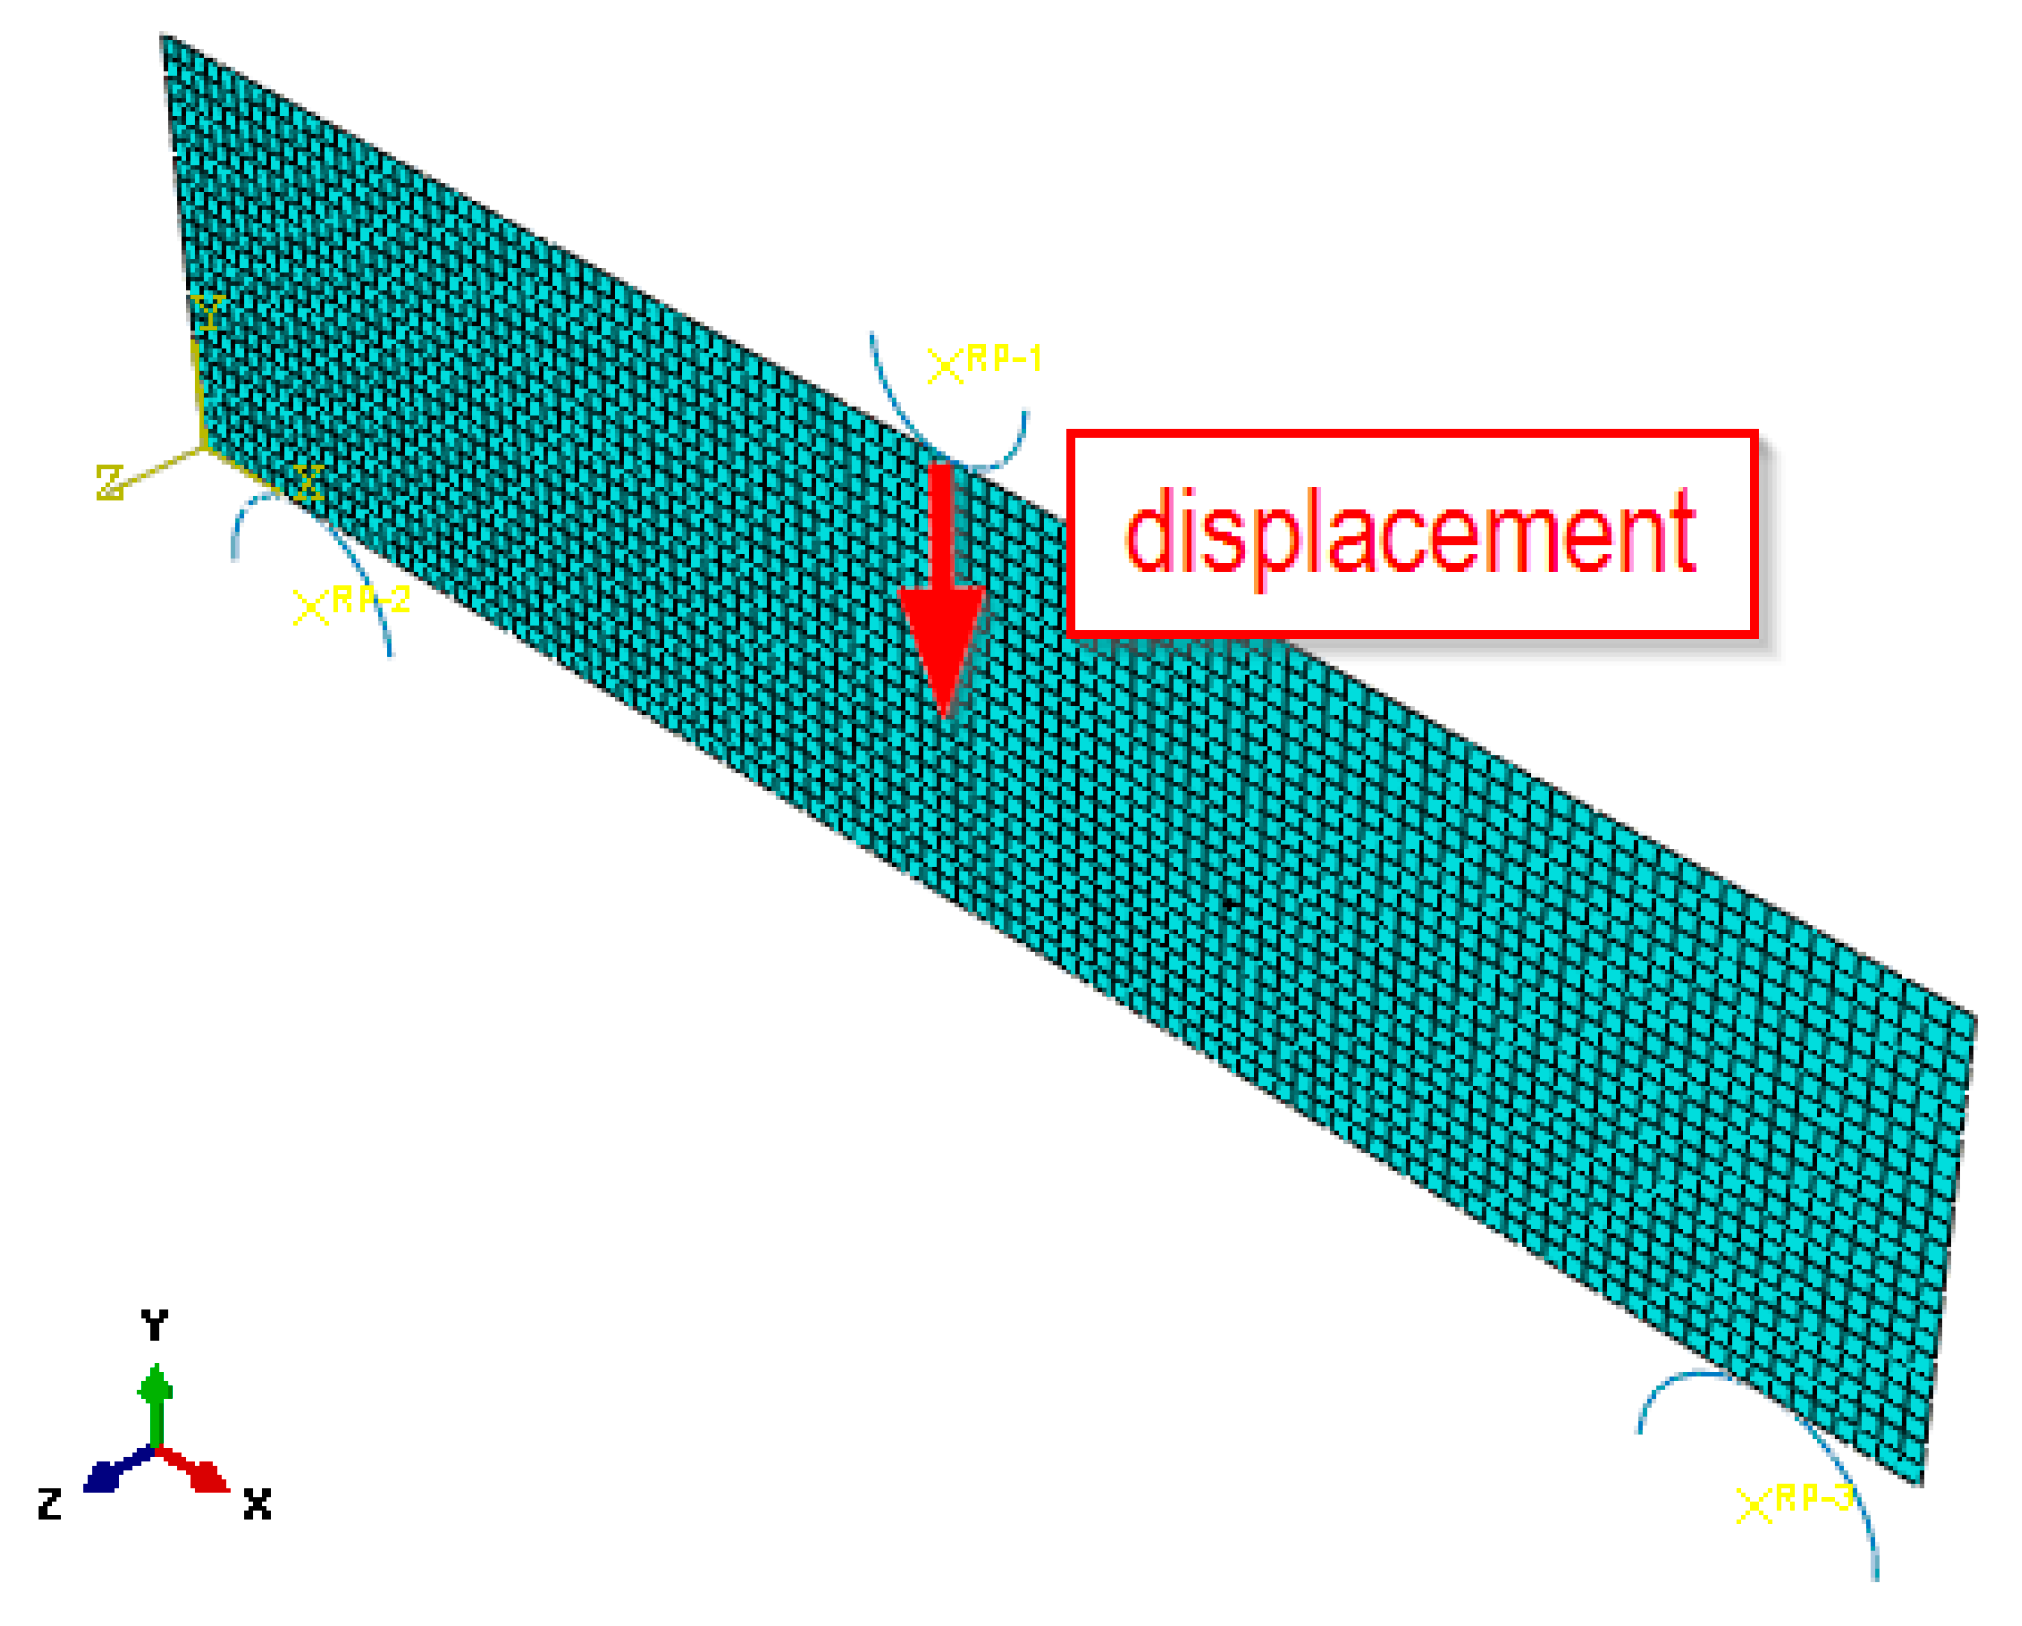
2.2. Methods
3. Results and Discussion
3.1. Strength Tests Results
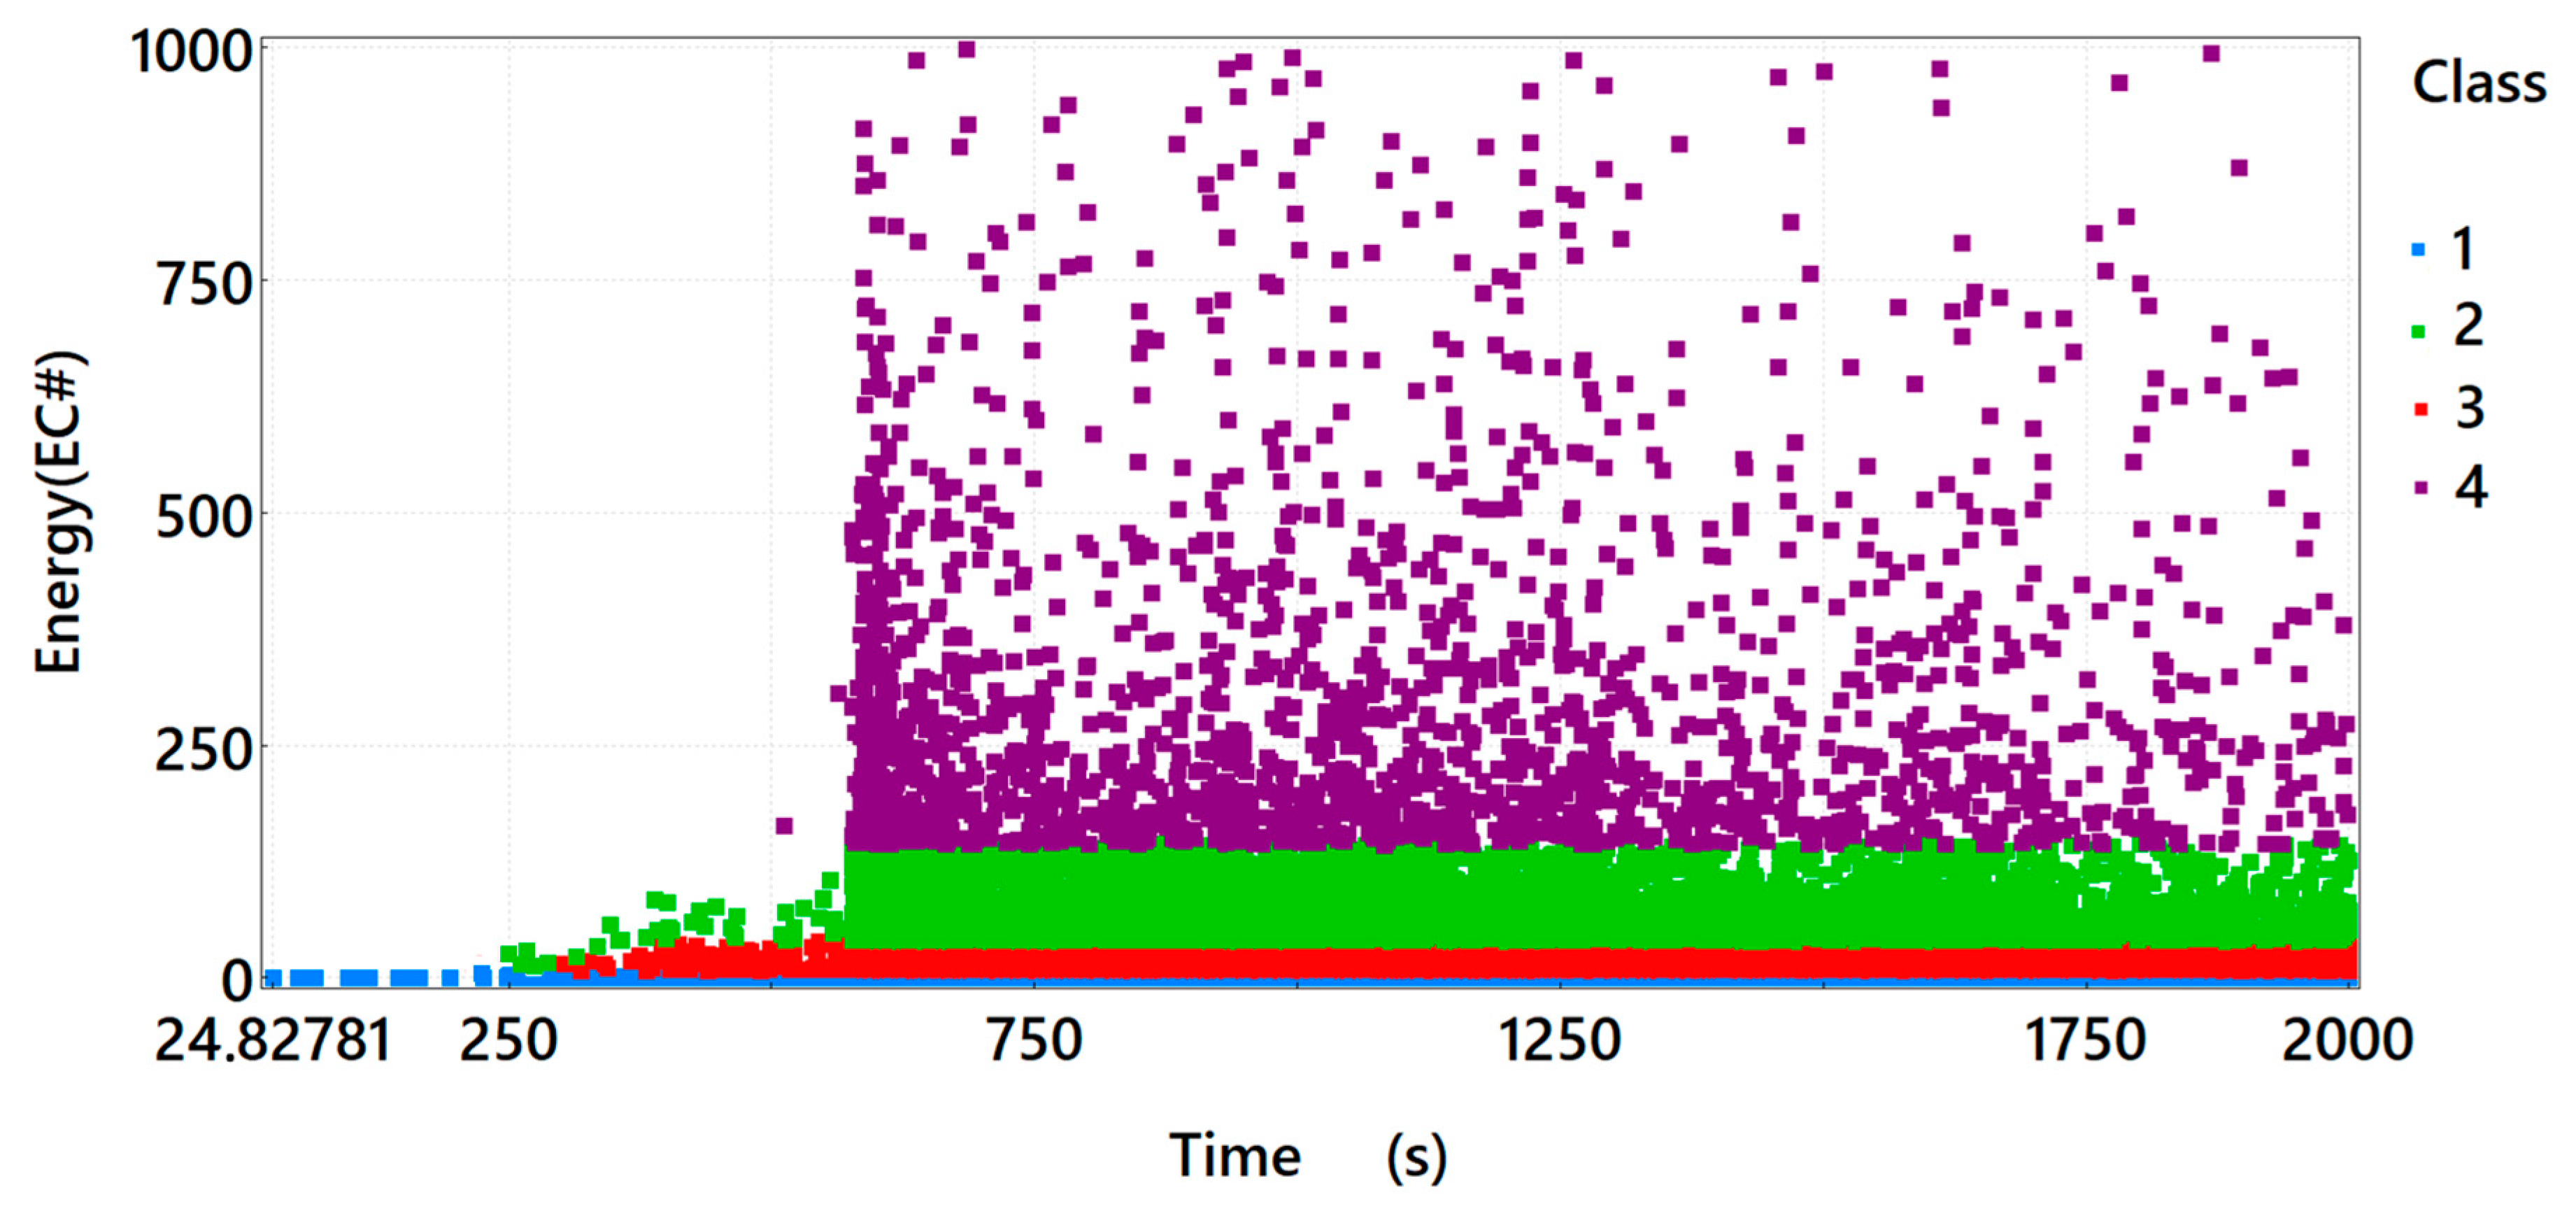
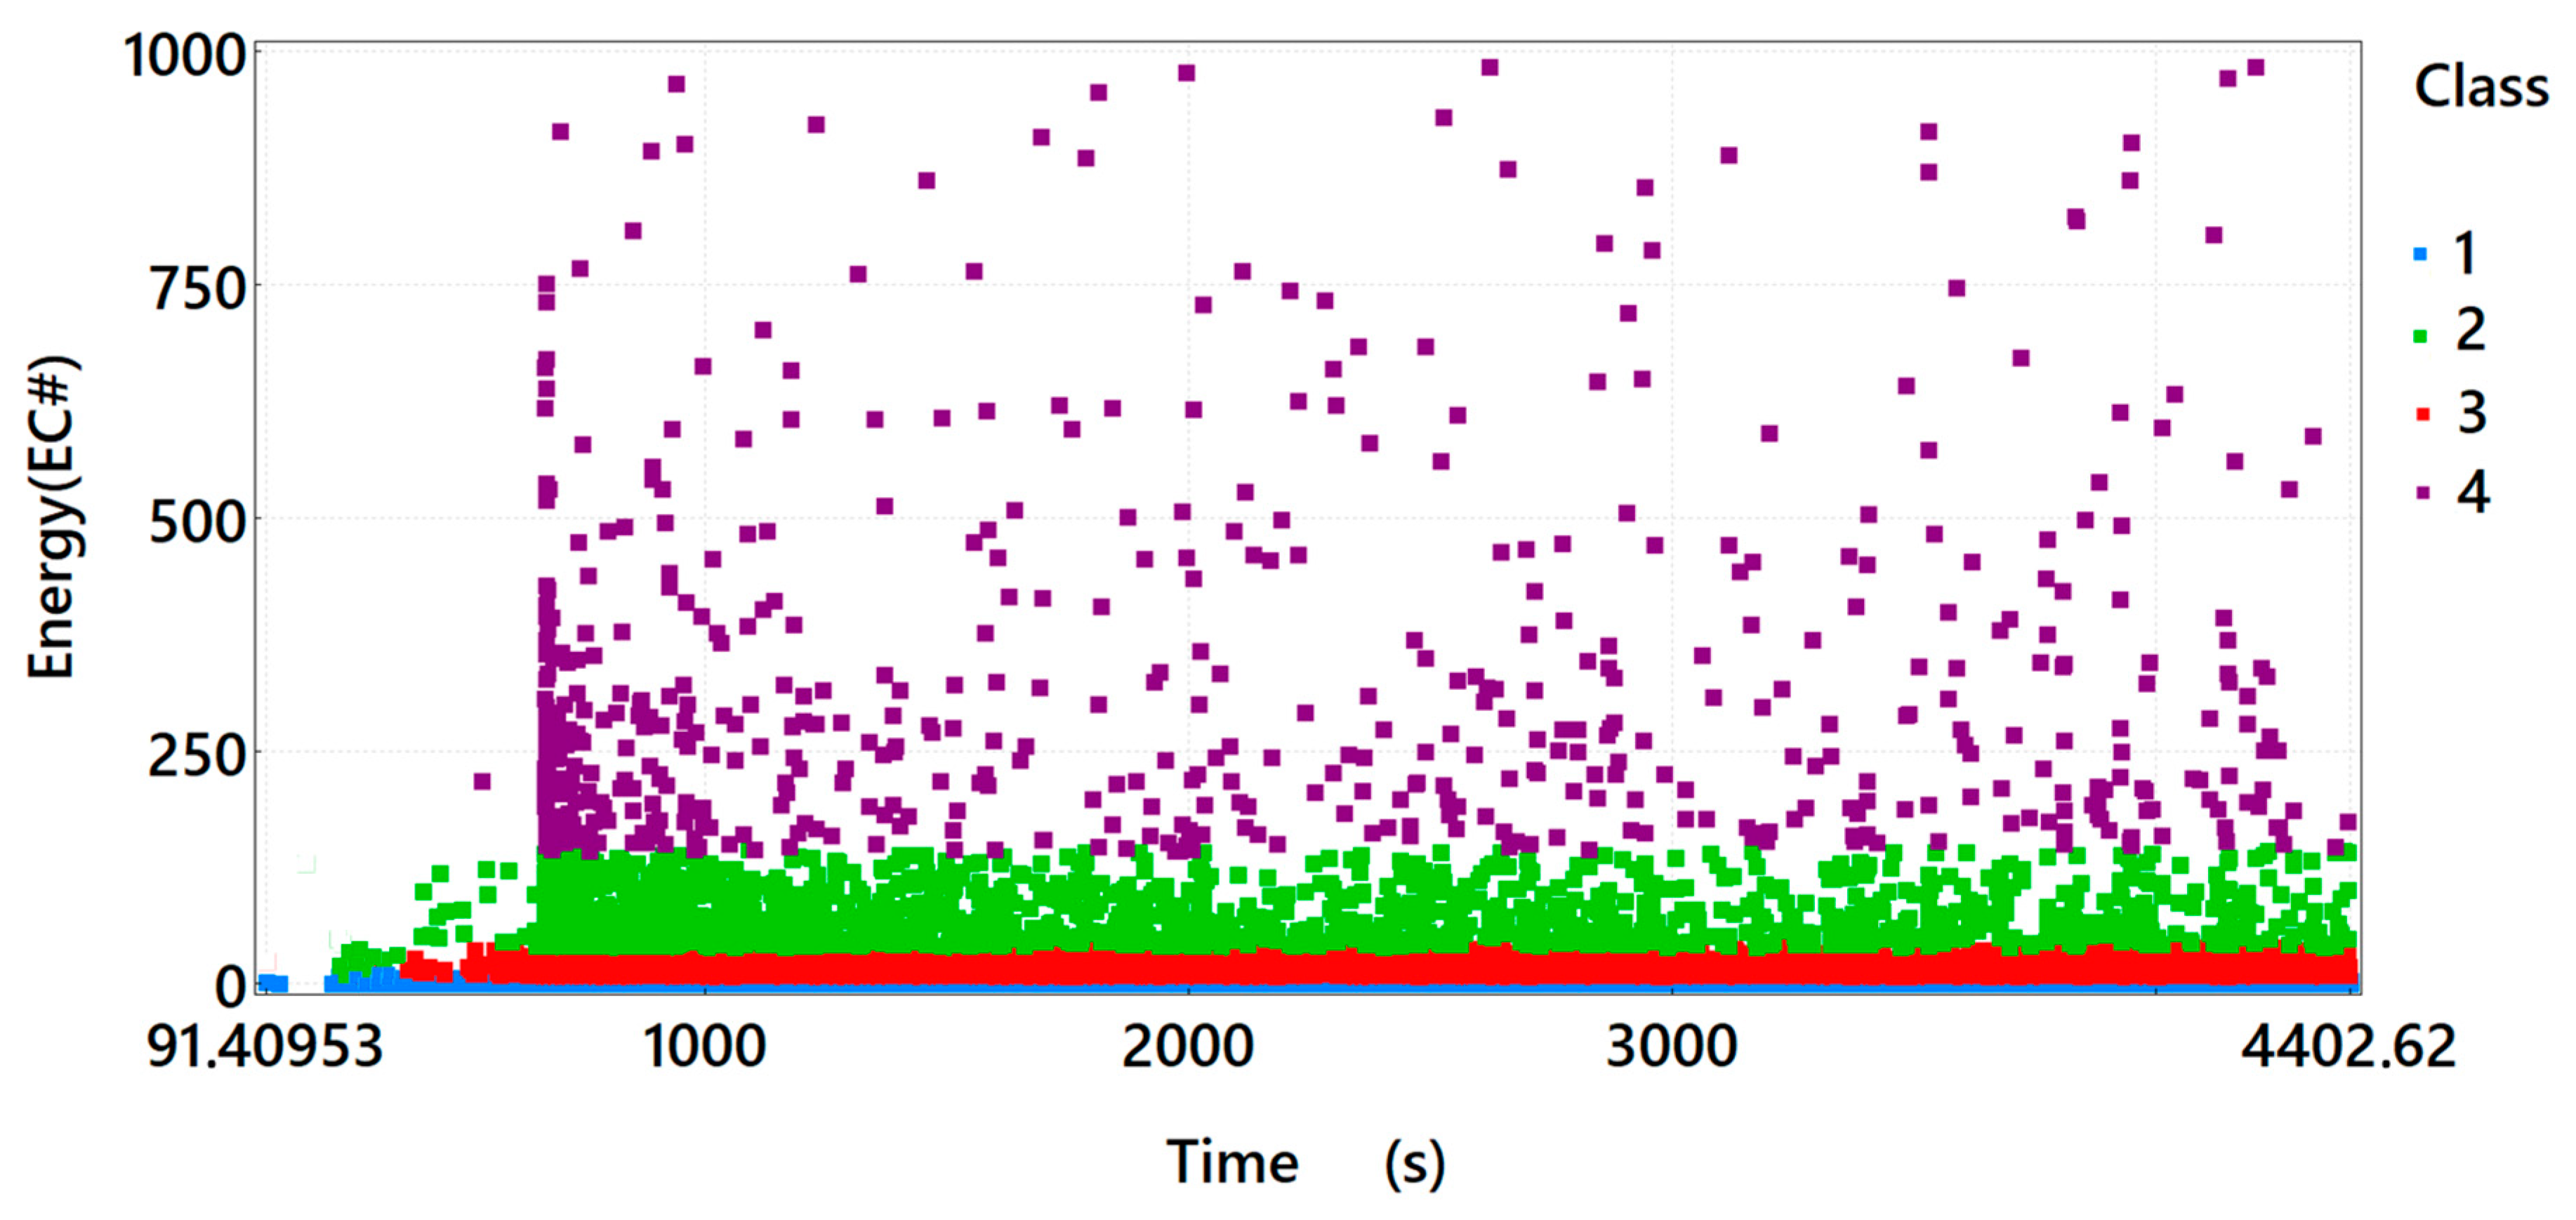
3.2. The Results of Research That Involved Monitoring of Fibre Concrete with the Use of the Acoustic Emission Method
- Duration;
- Rise time;
- Decay time;
- RMS;
- Counts;
- Counts to peak;
- Amplitude;
- Energy;
- Average frequency;
- Reverberation frequency;
- Initiation frequency;
- Absolute energy;
- Signal strength;
- Average Signal Level (ASL).
- Class 1 (blue)—microcrack initiation;
- Class 2 (green)—crack formation and propagation;
- Class 3 (red)—crack development, concrete crushing;
- Class 4 (purple)—plastic deformation, material failure.
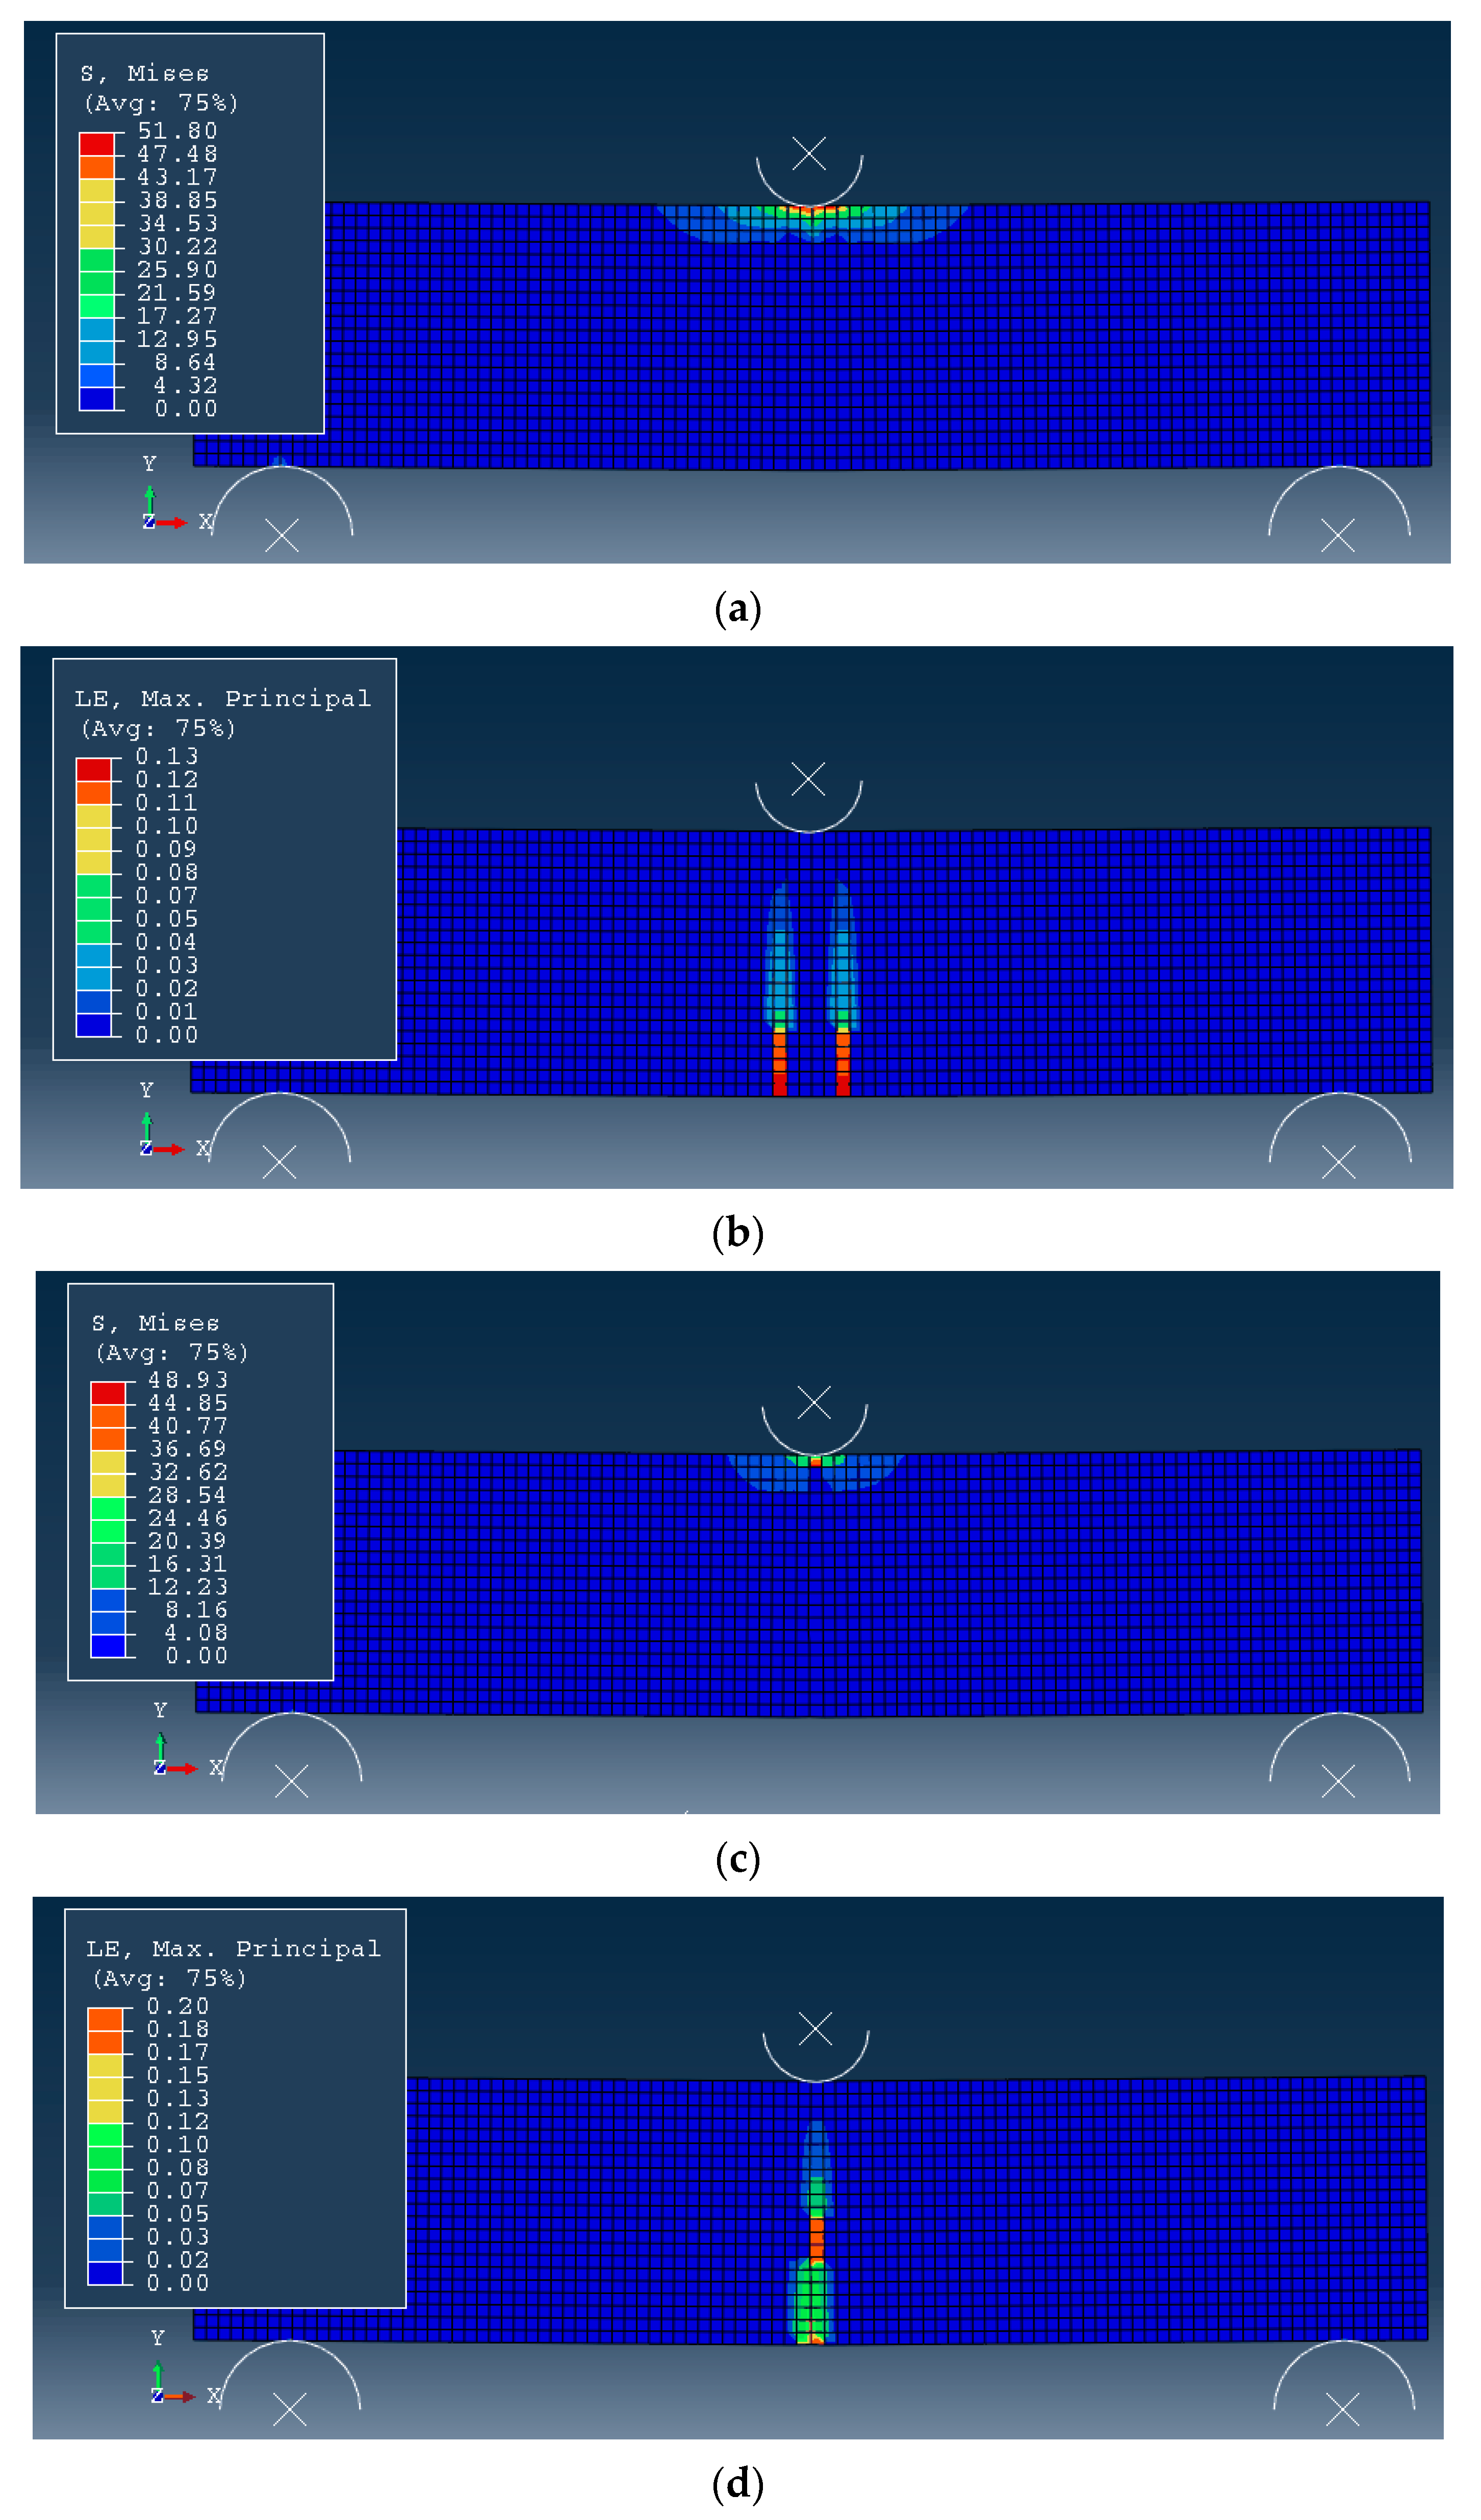
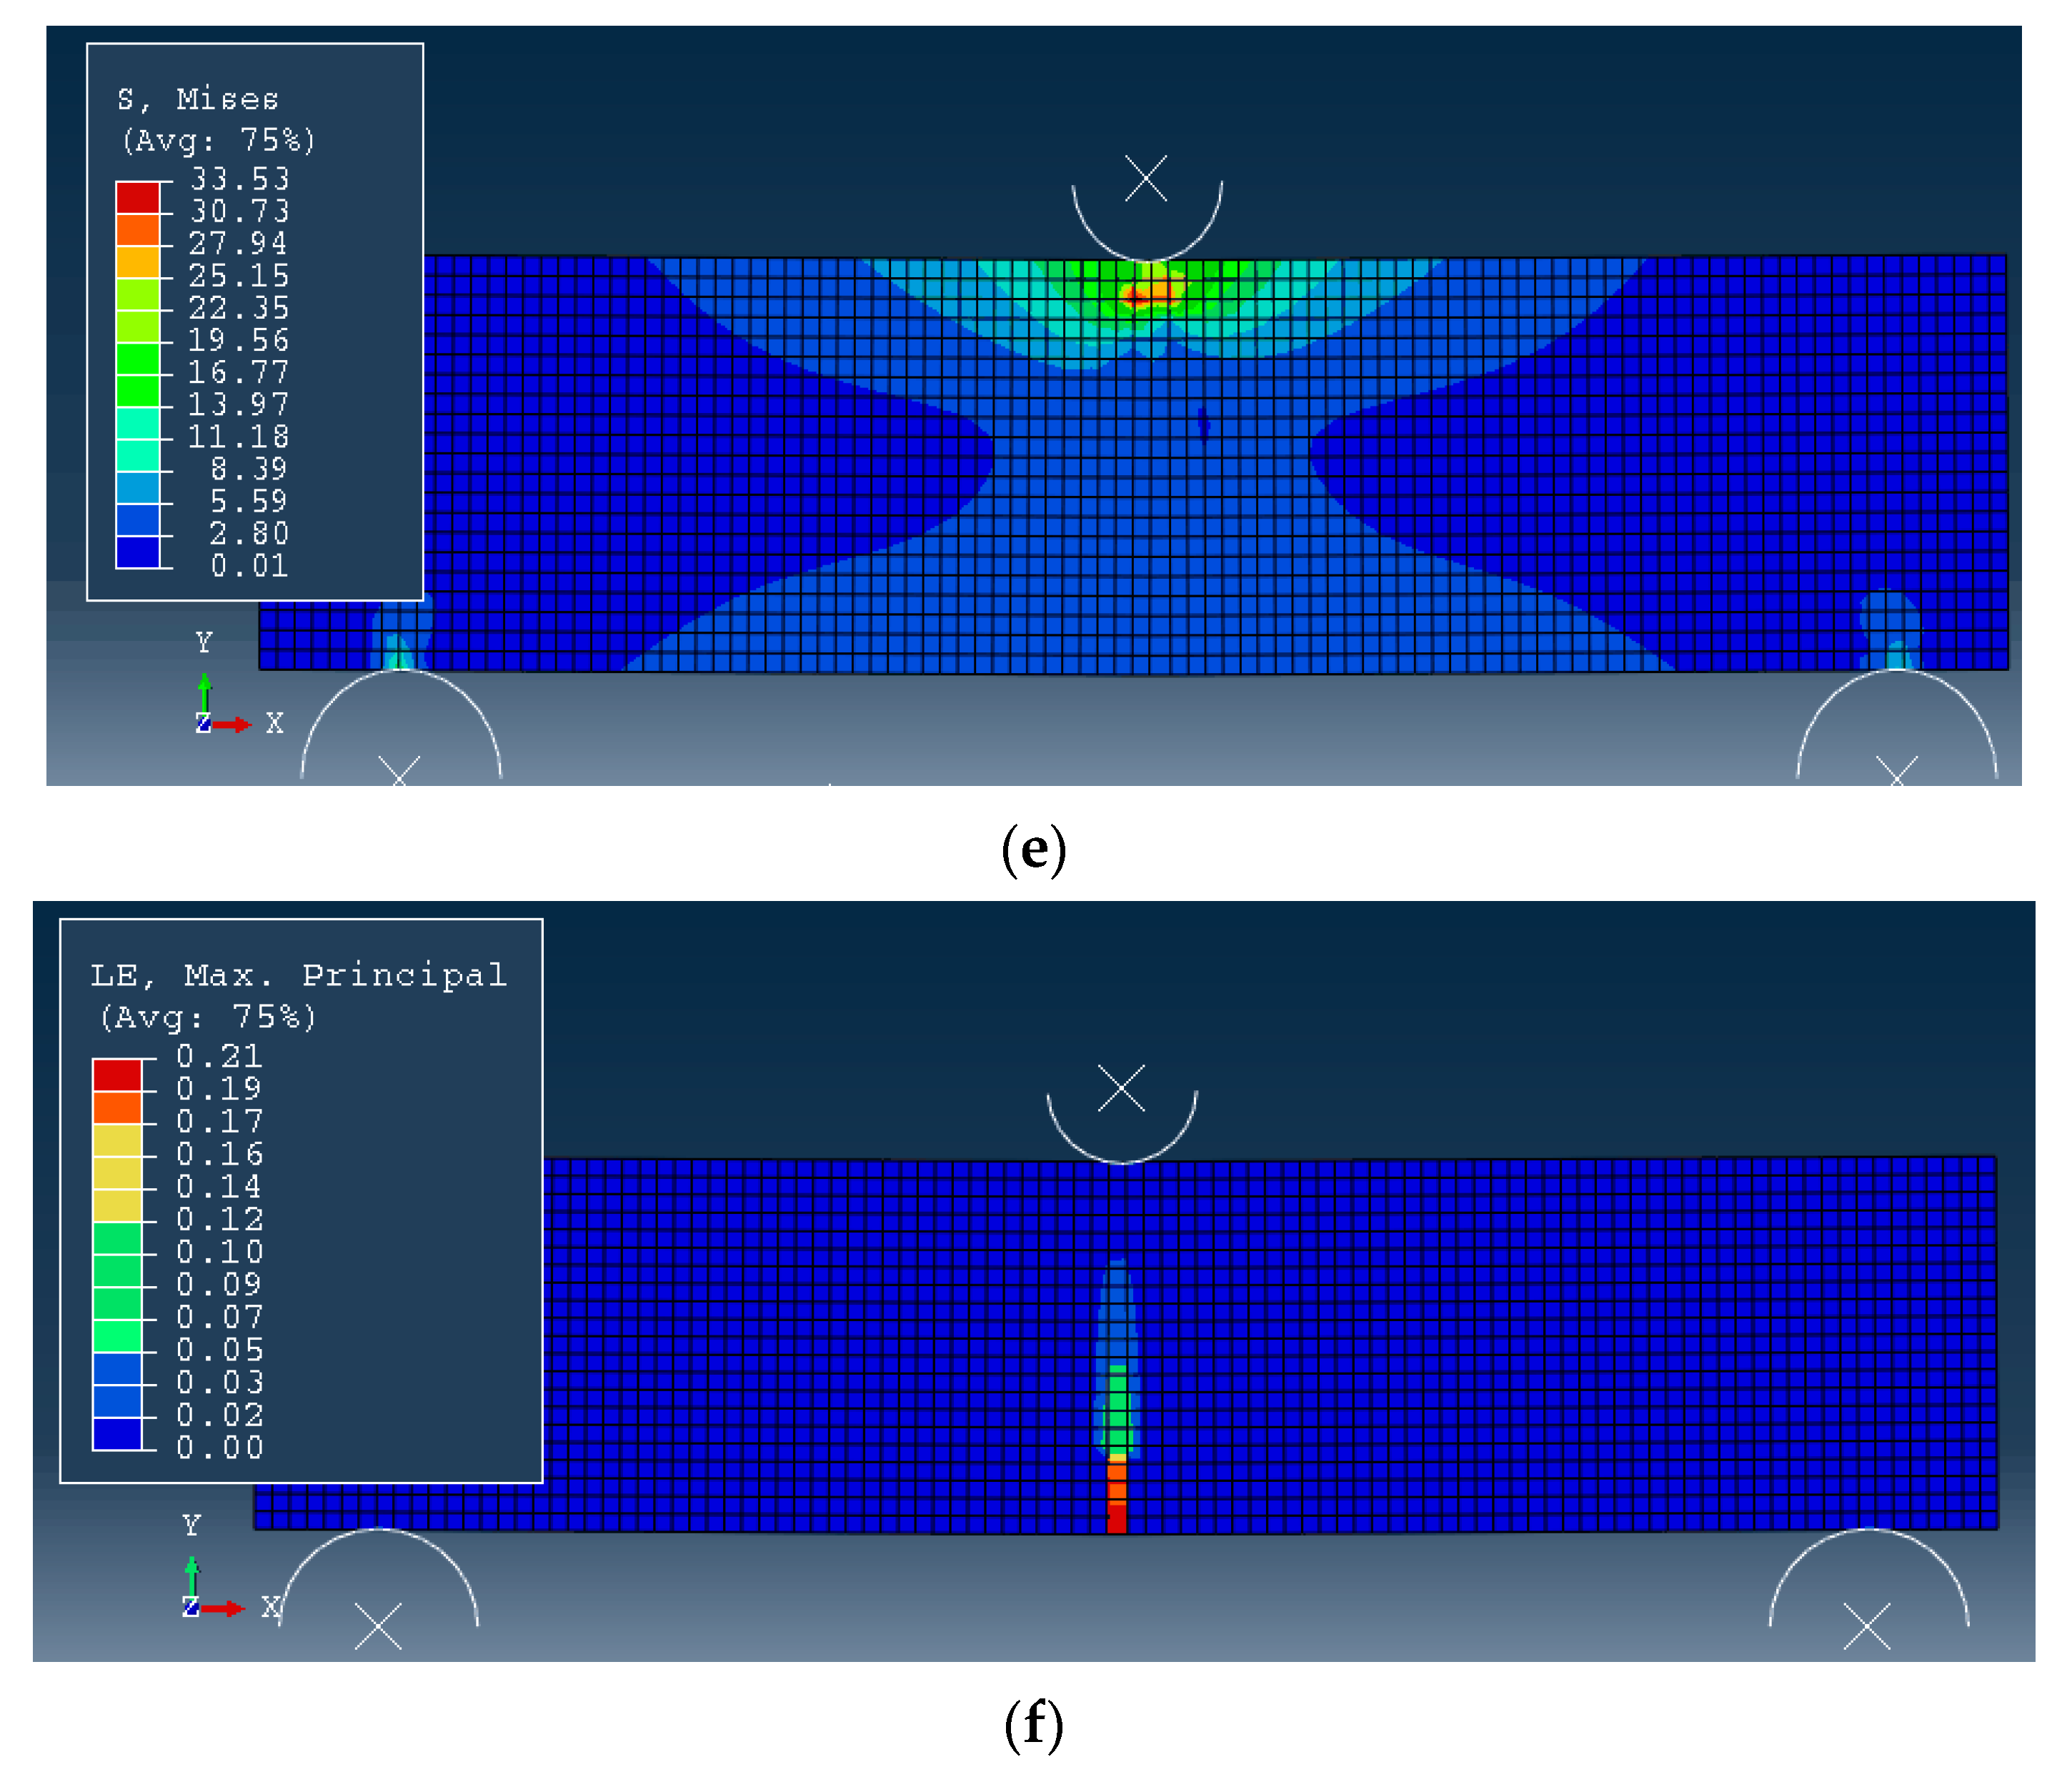
3.3. Results of Numerical Calculations of Fibre Concrete
4. Conclusions
- Three-point bending of fibre concrete samples is associated with the emission of acoustic signals characteristic of various destructive processes occurring in the material.
- The addition of curved steel reinforcing fibres in the form of equally distributed reinforcement changes the number and distribution of acoustic emission signals of individual classes.
- The differences in the number and distribution of acoustic emission signals of individual classes are observed at a low level of load and deformation.
- The acoustic emission method is very useful for monitoring elements or structures made of concrete reinforced with equally distributed steel fibres under load.
- In this paper, a hybrid method of analysis is proposed, which consists in complementing the results of strength tests, the results of numerical calculations and the results of deformation distributions (through the use of the GOM system). The proposed test method allows the determination of the characteristic values of the mechanical fields in the material, the knowledge of which makes it possible to assess the strength of concrete in its initial state and with reinforcement in the form of steel fibre participation.
- It was shown that the numerically determined effective stress levels decreased as the proportion of steel fibres in the concrete increased. However, the maximum levels of the first principal stresses increased (the highest value for specimen material A3).
- A preliminary comparison of the results of the deformation analyses of the analysed material indicates a fairly good agreement between the results of the distributions of the first principal stresses determined numerically and those obtained from the GOM software analysis. The work with the GOM system requires further experimental research.
Author Contributions
Funding
Institutional Review Board Statement
Informed Consent Statement
Data Availability Statement
Conflicts of Interest
References
- Allen, H.G. The Purpose and Methods of Fibre Reinforced. Prospect of Fibre Reinforced Construction Materials. Int. Build. Exhib. Conf. 1971, 1, 3–14. [Google Scholar]
- Bywalski, C.; Kaźmierowski, M.; Kamiński, M.; Drzazga, M. Material Analysis of Steel Fibre Reinforced High-Strength Concrete in Terms of Flexural Behaviour. Experimental and Numerical Investigation. Materials 2020, 13, 1631. [Google Scholar] [CrossRef] [PubMed] [Green Version]
- Labib, W.; Eden, N. An Investigation onto the Use of Fibres in Concrete Industrial Ground-Floor Slabs; Liverpool John Moores University: Liverpool, UK, 2006. [Google Scholar]
- Lee, S.-C.; Oh, J.-H.; Cho, J.-Y. Fiber Efficiency in SFRC Members Subjected to Uniaxial Tension. Constr. Build. Mater. 2016, 113, 479–487. [Google Scholar] [CrossRef]
- Koteš, P. Influence of Corrosion on Crack Width and Pattern in an RC Beam. Procedia Eng. 2013, 65, 311–320. [Google Scholar] [CrossRef] [Green Version]
- Sorelli, L.G.; Meda, A.; Plizzari, G.A. Bending and Uniaxial Tensile Tests on Concrete Reinforced with Hybrid Steel Fibers. J. Mater. Civ. Eng. 2005, 17, 519–527. [Google Scholar] [CrossRef]
- Koteš, P.; Brodnan, M.; Slopkova, K.; Kotula, P. Numerical Modelling of Reinforcement Corrosion in Reinforced Concrete. J. Ochr. Przed Koroz. 2010, 53, 307–309. [Google Scholar]
- Brodňan, M.; Koteš, P.; Zimen, V. Application of Fibre Concrete by Realization of Industrial Floor Construction. Proc. Fibre Concr. 2011 Technol. Des. Appl. 2011, 11, 95–100. [Google Scholar]
- Perkowski, Z.; Czabak, M.; Grzeszczyk, S.; Frączek, D.; Tatara, K.; Matuszek-Chmurowska, A.; Jurowski, K.; Jędraszak, B. Experimental Research on Concrete Beams Reinforced with High Ductility Steel Bars and Strengthened with a Reactive Powder Concrete Layer in the Compression Zone. Materials 2020, 13, 4173. [Google Scholar] [CrossRef]
- Aggelis, D.G.; El Kadi, M.; Tysmans, T.; Blom, J. Effect of Propagation Distance on Acoustic Emission Fracture Mode Classification in Textile Reinforced Cement. Constr. Build. Mater. 2017, 152, 872–879. [Google Scholar] [CrossRef]
- Aggelis, D.G.; Matikas, T.E. Effect of Plate Wave Dispersion on the Acoustic Emission Parameters in Metals. Comput. Struct. 2012, 98, 17–22. [Google Scholar] [CrossRef]
- Świt, G.; Adamczak, A.; Krampikowska, A. Wavelet Analysis of Acoustic Emissions during Tensile Test of Carbon Fibre Reinforced Polymer Composites. IOP Conf. Ser. Mater. Sci. Eng. 2017, 245, 022031. [Google Scholar] [CrossRef]
- Ono, K. Rayleigh Wave Calibration of Acoustic Emission Sensors and Ultrasonic Transducers. Sensors 2019, 19, 3129. [Google Scholar] [CrossRef] [Green Version]
- Gorman, M.R. Some Connections between Ae Testing of Large Structures and Small Samples. Nondestruct. Test. Eval. 1998, 14, 89–104. [Google Scholar] [CrossRef]
- Behnia, A.; Chai, H.K.; Shiotani, T. Advanced Structural Health Monitoring of Concrete Structures with the Aid of Acoustic Emission. Constr. Build. Mater. 2014, 65, 282–302. [Google Scholar] [CrossRef]
- Bugno, A.A.; Swit, G.; Krampikowska, A. Assessment of Destruction Processes in Fibre-Cement Composites Using the Acoustic Emission Method and Wavelet Analysis. IOP Conf. Ser. Mater. Sci. Eng. 2019, 471, 032042. [Google Scholar] [CrossRef] [Green Version]
- Ohtsu, M.; Shiotani, T.; Shigeishi, M.; Kamada, T.; Yuyama, S.; Watanabe, T.; Suzuki, T.; Mier, J.; Vogel, T.; Grosse, C.; et al. Recommendation of RILEM TC 212-ACD: Acoustic Emission and Related NDE Techniques for Crack Detection and Damage Evaluation in Concrete Test Method for Damage Qualification of Reinforced Concrete Beams by Acoustic Emission. Mater. Struct. 2010, 43, 1183–1186. [Google Scholar] [CrossRef] [Green Version]
- Goszczyńska, B.; Swit, G.; Trąmpczyński, W.; Krampikowska, A. Application of the Acoustic Emission Method of Identification and Location of Destructive Processes to the Monitoring of Concrete Bridges. In Bridge Maintenance, Safety, Management and Life Extension; Taylor and Francis Group: London, UK, 2014; pp. 688–694. ISBN 978-1-138-00103-9. [Google Scholar]
- Adamczak-Bugno, A.; Świt, G.; Krampikowska, A. Fibre-Cement Panel Ventilated Façade Smart Control System. Materials 2021, 14, 5076. [Google Scholar] [CrossRef]
- Szewczak, E.; Winkler-Skalna, A.; Czarnecki, L. Sustainable Test Methods for Construction Materials and Elements. Mater. Basel Switz. 2020, 13, 606. [Google Scholar] [CrossRef] [Green Version]
- Tsangouri, E.; Aggelis, D.G. A Review of Acoustic Emission as Indicator of Reinforcement Effectiveness in Concrete and Cementitious Composites. Constr. Build. Mater. 2019, 224, 198–205. [Google Scholar] [CrossRef]
- Aggelis, D.G.; Mpalaskas, A.C.; Matikas, T.E. Investigation of Different Fracture Modes in Cement-Based Materials by Acoustic Emission. Cem. Concr. Res. 2013, 48, 1–8. [Google Scholar] [CrossRef]
- Schabowicz, K. Modern Acoustic Techniques for Testing Concrete Structures Accessible from One Side Only. Arch. Civ. Mech. Eng. 2015, 15, 1149–1159. [Google Scholar] [CrossRef]
- Niu, Y.; Zhou, X.-P.; Zhou, L.-S. Fracture Damage Prediction in Fissured Red Sandstone under Uniaxial Compression: Acoustic Emission b-Value Analysis. Fatigue Fract. Eng. Mater. Struct. 2020, 43, 175–190. [Google Scholar] [CrossRef]
- Burud, N.B.; Chandra Kishen, J.M. Application of Generalized Logistic Equation for B-Value Analysis in Fracture of Plain Concrete Beams under Flexure. Eng. Fract. Mech. 2019, 210, 228–246. [Google Scholar] [CrossRef]
- Prem, P.R.; Murthy, A.R. Acoustic Emission Monitoring of Reinforced Concrete Beams Subjected to Four-Point-Bending. Appl. Acoust. 2017, 117, 28–38. [Google Scholar] [CrossRef]
- Koteš, P.; Vavruš, M.; Jošt, J.; Prokop, J. Strengthening of Concrete Column by Using the Wrapper Layer of Fibre Reinforced Concrete. Materials 2020, 13, 5432. [Google Scholar] [CrossRef]
- Tejchman, J.; Bobiński, J. Continuous and Discontinuous Modelling of Fracture in Concrete Using FEM; Springer Science & Business Media: Berlin, Germany, 2012; ISBN 978-3-642-28463-2. [Google Scholar]
- Skarżyński, Ł.; Nitka, M.; Tejchman, J. Modelling of Concrete Fracture at Aggregate Level Using FEM and DEM Based on X-Ray ΜCT Images of Internal Structure. Eng. Fract. Mech. 2015, 147, 13–35. [Google Scholar] [CrossRef]
- Yu, J.; Tan, K.-H. Experimental and Numerical Investigation on Progressive Collapse Resistance of Reinforced Concrete Beam Column Sub-Assemblages. Eng. Struct. 2013, 55, 90–106. [Google Scholar] [CrossRef]
- Lau, K.; Yuan, L.; Zhou, L.; Wu, J.; Woo, C. Strain Monitoring in FRP Laminates and Concrete Beams Using FBG Sensors. Compos. Struct. 2001, 51, 9–20. [Google Scholar] [CrossRef]
- Kmiecik, P.; Kamiński, M. Modelling of Reinforced Concrete Structures and Composite Structures with Concrete Strength Degradation Taken into Consideration. Arch. Civ. Mech. Eng. 2011, 11, 623–636. [Google Scholar] [CrossRef]
- Rabczuk, T.; Belytschko, T. Application of Particle Methods to Static Fracture of Reinforced Concrete Structures. Int. J. Fract. 2006, 137, 19–49. [Google Scholar] [CrossRef] [Green Version]
- Barbero, E.J. Finite Element Analysis of Composite Materials; CRC Press: Boca Raton, FL, USA, 2008; ISBN 978-1-4200-5434-7. [Google Scholar]
- Liu, G.R.; Quek, S.S. (Eds.) The Finite Element Method. In The Finite Element Method, 2nd ed.; Butterworth-Heinemann: Oxford, UK, 2014; p. i. ISBN 978-0-08-098356-1. [Google Scholar]
- Neimitz, A.; Lipiec, S. Fracture Toughness Correction due to the in- and out-of-Plane Constraints. Theor. Appl. Fract. Mech. 2021, 112, 1–10. [Google Scholar] [CrossRef]
- Dzioba, I.; Lipiec, S. Fracture Mechanisms of S355 Steel—Experimental Research, FEM Simulation and SEM Observation. Materials 2019, 12, 3959. [Google Scholar] [CrossRef] [PubMed] [Green Version]
- Huang, Y.; Yang, Z.; Ren, W.; Liu, G.; Zhang, C. 3D Meso-Scale Fracture Modelling and Validation of Concrete Based on in-Situ X-Ray Computed Tomography Images Using Damage Plasticity Model. Int. J. Solids Struct. 2015, 67, 340–352. [Google Scholar] [CrossRef]
- Hafezolghorani Esfahani, M.; Hejazi, F.; Vaghei, R.; Jaafar, M.; Karimzadeh, K. Simplified Damage Plasticity Model for Concrete. Struct. Eng. Int. 2017, 27, 68–78. [Google Scholar] [CrossRef]
- Tao, Y.; Chen, J.-F. Concrete Damage Plasticity Model for Modeling FRP-to-Concrete Bond Behavior. J. Compos. Constr. 2015, 19, 04014026. [Google Scholar] [CrossRef] [Green Version]
- Lee, S.-H.; Abolmaali, A.; Shin, K.-J.; Lee, H.-D. ABAQUS Modeling for Post-Tensioned Reinforced Concrete Beams. J. Build. Eng. 2020, 30, 101273. [Google Scholar] [CrossRef]
- Corr, D.; Accardi, M.; Graham-Brady, L.; Shah, S. Digital Image Correlation Analysis of Interfacial Debonding Properties and Fracture Behavior in Concrete. Eng. Fract. Mech. 2007, 74, 109–121. [Google Scholar] [CrossRef]
- Alam, S.Y.; Saliba, J.; Loukili, A. Fracture Examination in Concrete through Combined Digital Image Correlation and Acoustic Emission Techniques. Constr. Build. Mater. 2014, 69, 232–242. [Google Scholar] [CrossRef] [Green Version]
- Yang, Z.; Ren, W.; Sharma, R.; McDonald, S.; Mostafavi, M.; Vertyagina, Y.; Marrow, T.J. In-Situ X-ray Computed Tomography Characterisation of 3D Fracture Evolution and Image-Based Numerical Homogenisation of Concrete. Cem. Concr. Compos. 2017, 75, 74–83. [Google Scholar] [CrossRef] [Green Version]
- GOM Correlate Program, Version 2021; GOM GmbH: Leipheim, Germany.
- Fayyad, T.M.; Lees, J.M. Application of Digital Image Correlation to Reinforced Concrete Fracture. Procedia Mater. Sci. 2014, 3, 1585–1590. [Google Scholar] [CrossRef] [Green Version]
- Verbruggen, S.; Aggelis, D.G.; Tysmans, T.; Wastiels, J. Bending of Beams Externally Reinforced with TRC and CFRP Monitored by DIC and AE. Compos. Struct. 2014, 112, 113–121. [Google Scholar] [CrossRef]
- Stylianidis, P.M.; Petrou, M.F. Study of the Flexural Behaviour of FRP-Strengthened Steel-Concrete Composite Beams. Structures 2019, 22, 124–138. [Google Scholar] [CrossRef]
- Marcalikova, Z.; Cajka, R. Determination of Mechanical Properties of Fiber Reinforced Concrete for Numerical Modelling. Civ. Environ. Eng. 2020, 16, 86–106. [Google Scholar] [CrossRef]
- Obaidat, Y.T.; Heyden, S.; Dahlblom, O. The Effect of CFRP and CFRP/Concrete Interface Models When Modelling Retrofitted RC Beams with FEM. Compos. Struct. 2010, 6, 1391–1398. [Google Scholar] [CrossRef]
- Aggelis, D.G. Classification of Cracking Mode in Concrete by Acoustic Emission Parameters. Mech. Res. Commun. 2011, 38, 153–157. [Google Scholar] [CrossRef]
- ABAQUS, Version 6.12. ABAQUS/Standard User’s Manual, Version 6.12. Dassault Systèmes Simulia Corp: Johnston, RI, USA, 2020.
- Al-Rifaie, H.; Mohammed, D. Comparative Assessment of Commonly Used Concrete Damage Plasticity Material Parameters. Eng. Trans. 2022, 70, 157–181. [Google Scholar] [CrossRef]
- Jankowiak, T.; Łodygowski, T. Identification of Parameters of Concrete Damage Plasticity Constitutive Model. Found. Civ. Environ. Eng. 2005, 6, 53–69. [Google Scholar]
- Cornelissen, H.; Hordijk, D.; Reinhardt, H. Experimental Determination of Crack Softening Characteristics of Normalweight and Lightweight Concrete|TU Delft Repositories. Heron 1986, 31, 45–46. [Google Scholar]
- Lubliner, J.; Oliver, J.; Oller, S.; Oñate, E. A Plastic-Damage Model for Concrete. Int. J. Solids Struct. 1989, 25, 299–326. [Google Scholar] [CrossRef]
- Lee, J.; Fenves, G.L. A Plastic-Damage Concrete Model for Earthquake Analysis of Dams. Earthq. Eng. Struct. Dyn. 1998, 27, 937–956. [Google Scholar] [CrossRef]


| A1 | A2 | A3 | |
|---|---|---|---|
| Concrete mixture | 1 kg/m3 | 1 kg/m3 | 1 kg/m3 |
| CEM II/B-S 32,5R (Ladce) | 400 | 400 | 400 |
| Aggregate 0/8 mm | 910 | 910 | 910 |
| Aggregate 8/16 mm | 685 | 685 | 685 |
| Fly ash (USS Košice) | 80 | 80 | 80 |
| Water | 200 | 200 | 200 |
| Fibres DRAMIX 3D | 0 | 40 | 60 |
| Specimen | Max. Force, N | Displacement (for Max. Force), mm | Max. Displacement, mm |
|---|---|---|---|
| A1 | 14,068 | 2.18 | 2.18 |
| A2 | 15,882 | 1.94 | 1.95 |
| A3 | 19,088 | 2.22 | 14.70 |
| Material Characteristics/Sample Material | A1 | A2 | A3 |
|---|---|---|---|
| E, GPa | 37 | 37 | 37 |
| ν | 0.20 | 0.2 | 0.2 |
| Dilation angle | 30 | 30 | 30 |
| Eccentricity | 0.10 | 0.10 | 0.10 |
| fb0/fc0 (i.e., σb0/σc0) | 1.16 | 1.16 | 1.16 |
| K | 0.67 | 0.67 | 0.67 |
| Viscosity parameter | 0.00 | 0.00 | 0.00 |
| σcu, MPa | 38.72 | 40.76 | 42.38 |
| σtu, MPa | 14.07 | 15.82 | 19.08 |
| Numerical Results/Sample Material | A1 | A2 | A3 |
|---|---|---|---|
| σeff (Mises), MPa | 51.80 | 48.93 | 33.53 |
| εI, % | 13.31 | 20.01 | 21.12 |
| First Principal Strain εI, % Determined: | A1 | A2 | A3 |
|---|---|---|---|
| Numerical calculations | 13.31 | 20.01 | 21.12 |
| GOM system | 12.12 | 19.28 | 19.20 |
| Differences, % | 8.94 | 3.65 | 9.09 |
Publisher’s Note: MDPI stays neutral with regard to jurisdictional claims in published maps and institutional affiliations. |
© 2022 by the authors. Licensee MDPI, Basel, Switzerland. This article is an open access article distributed under the terms and conditions of the Creative Commons Attribution (CC BY) license (https://creativecommons.org/licenses/by/4.0/).
Share and Cite
Adamczak-Bugno, A.; Lipiec, S.; Vavruš, M.; Koteš, P. Non-Destructive Methods and Numerical Analysis Used for Monitoring and Analysis of Fibre Concrete Deformations. Materials 2022, 15, 7268. https://doi.org/10.3390/ma15207268
Adamczak-Bugno A, Lipiec S, Vavruš M, Koteš P. Non-Destructive Methods and Numerical Analysis Used for Monitoring and Analysis of Fibre Concrete Deformations. Materials. 2022; 15(20):7268. https://doi.org/10.3390/ma15207268
Chicago/Turabian StyleAdamczak-Bugno, Anna, Sebastian Lipiec, Martin Vavruš, and Peter Koteš. 2022. "Non-Destructive Methods and Numerical Analysis Used for Monitoring and Analysis of Fibre Concrete Deformations" Materials 15, no. 20: 7268. https://doi.org/10.3390/ma15207268