
Effect of Superhydrophobic Coating and Nanofiller Loading on Facial Elastomer Physical Properties


Abstract
:1. Introduction
2. Materials and Methods
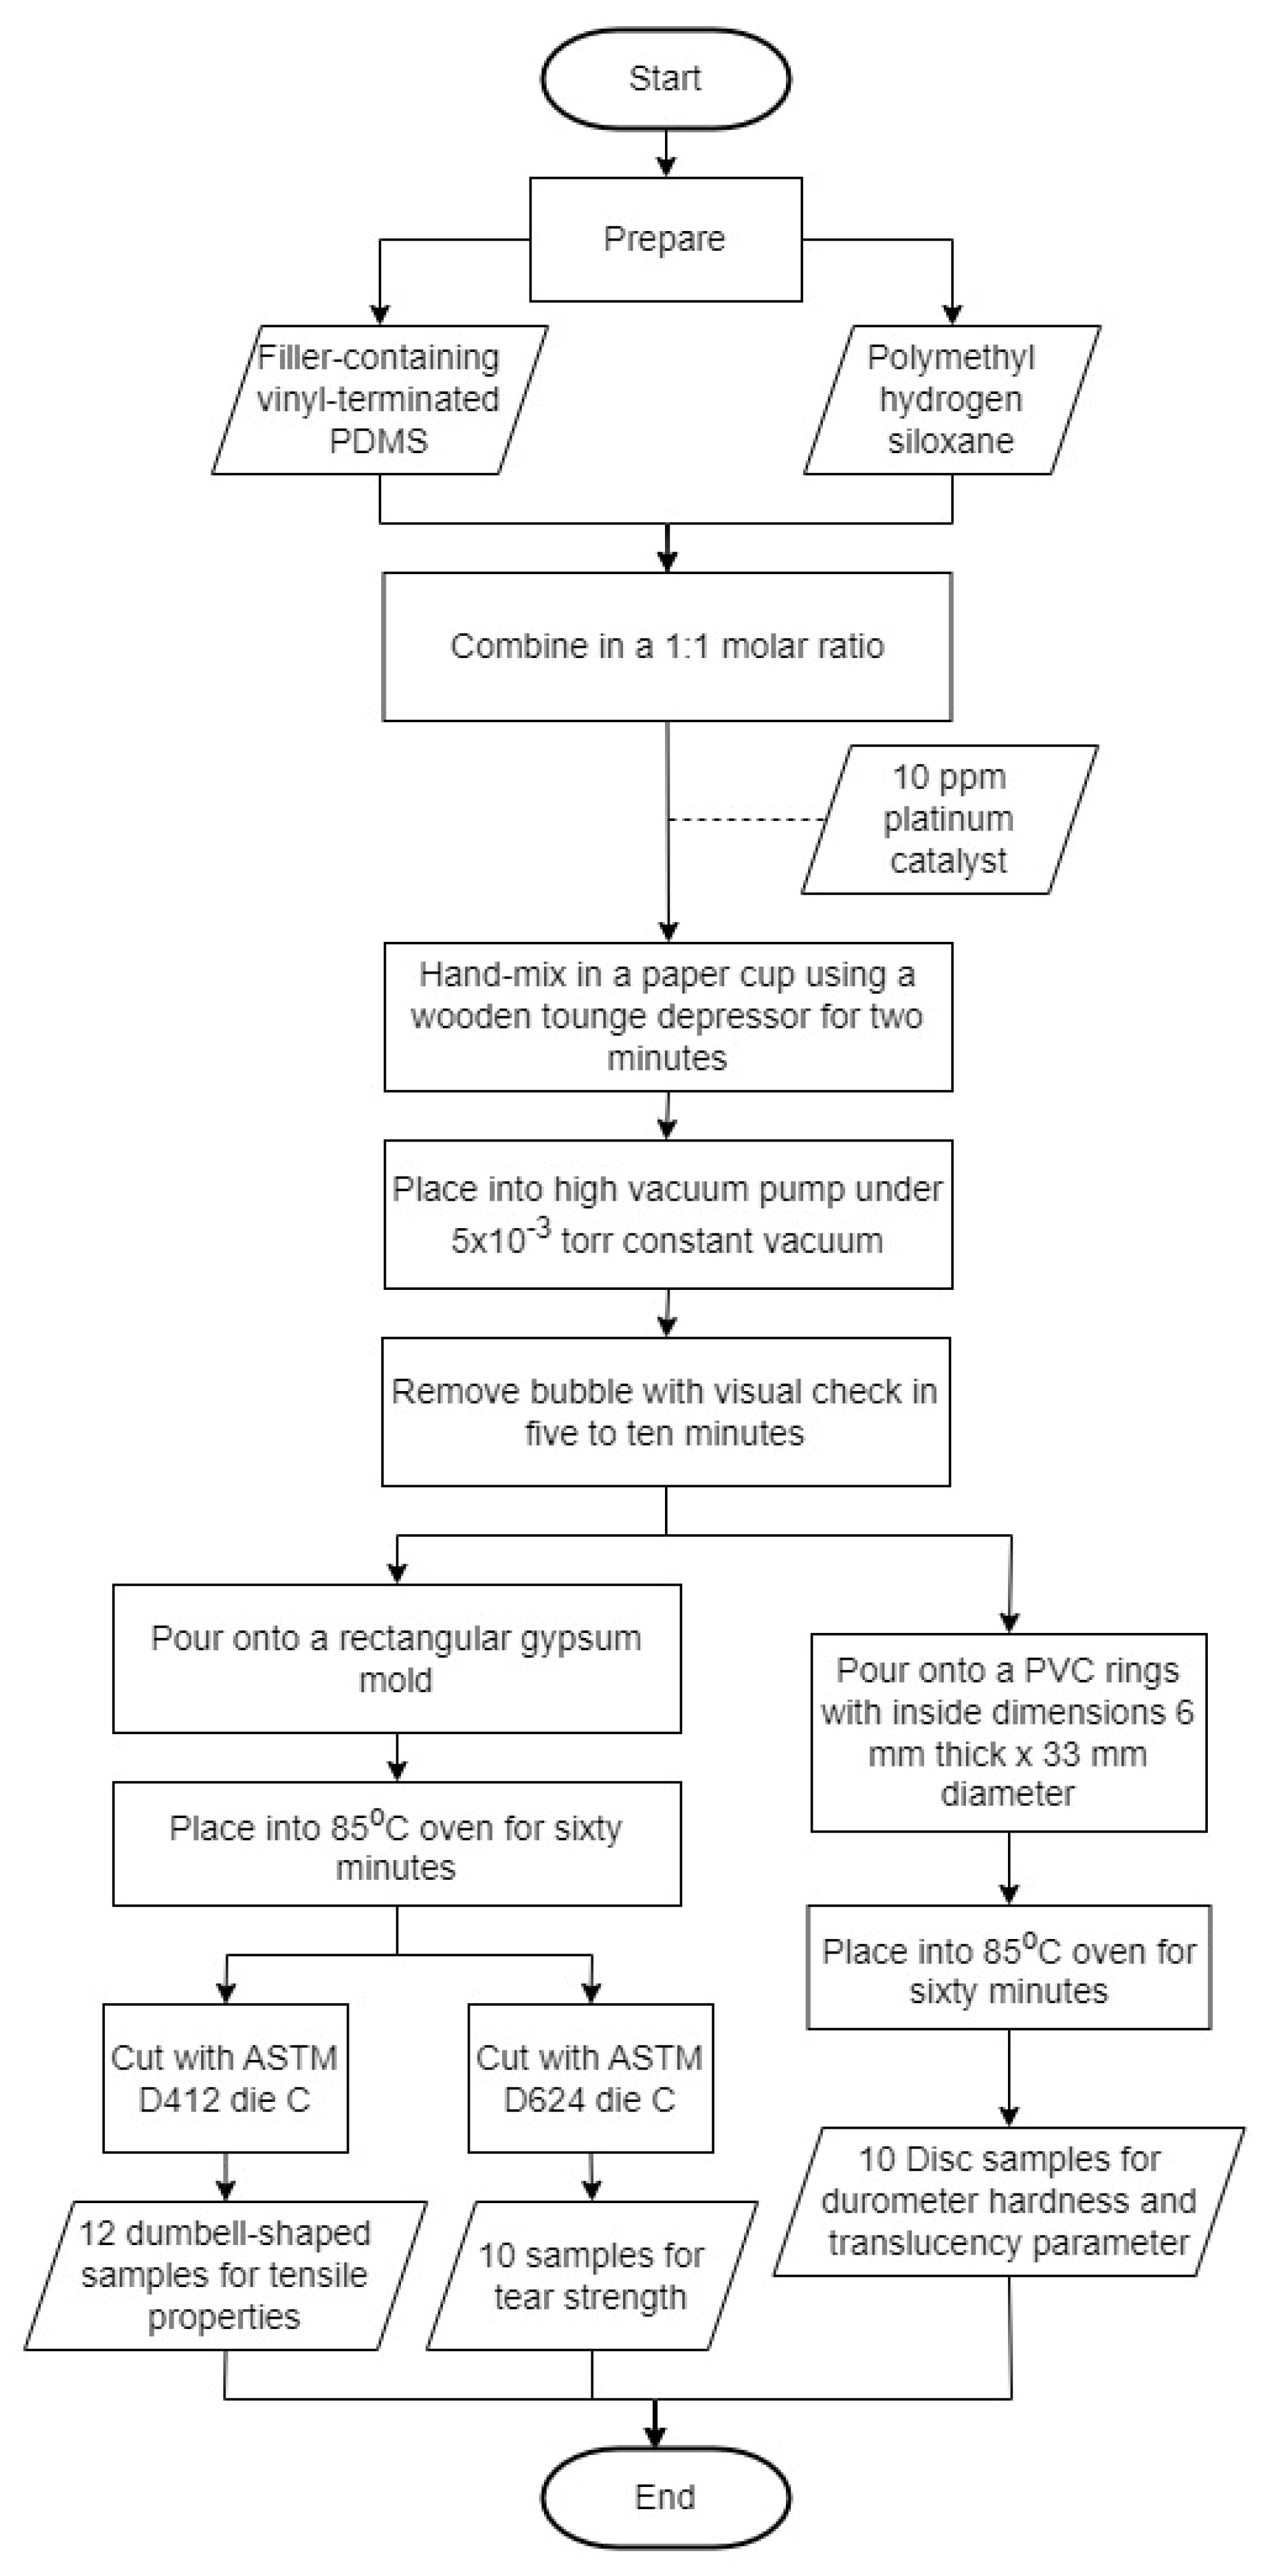
2.1. Preparation of Samples
2.2. Physical Properties Measurements
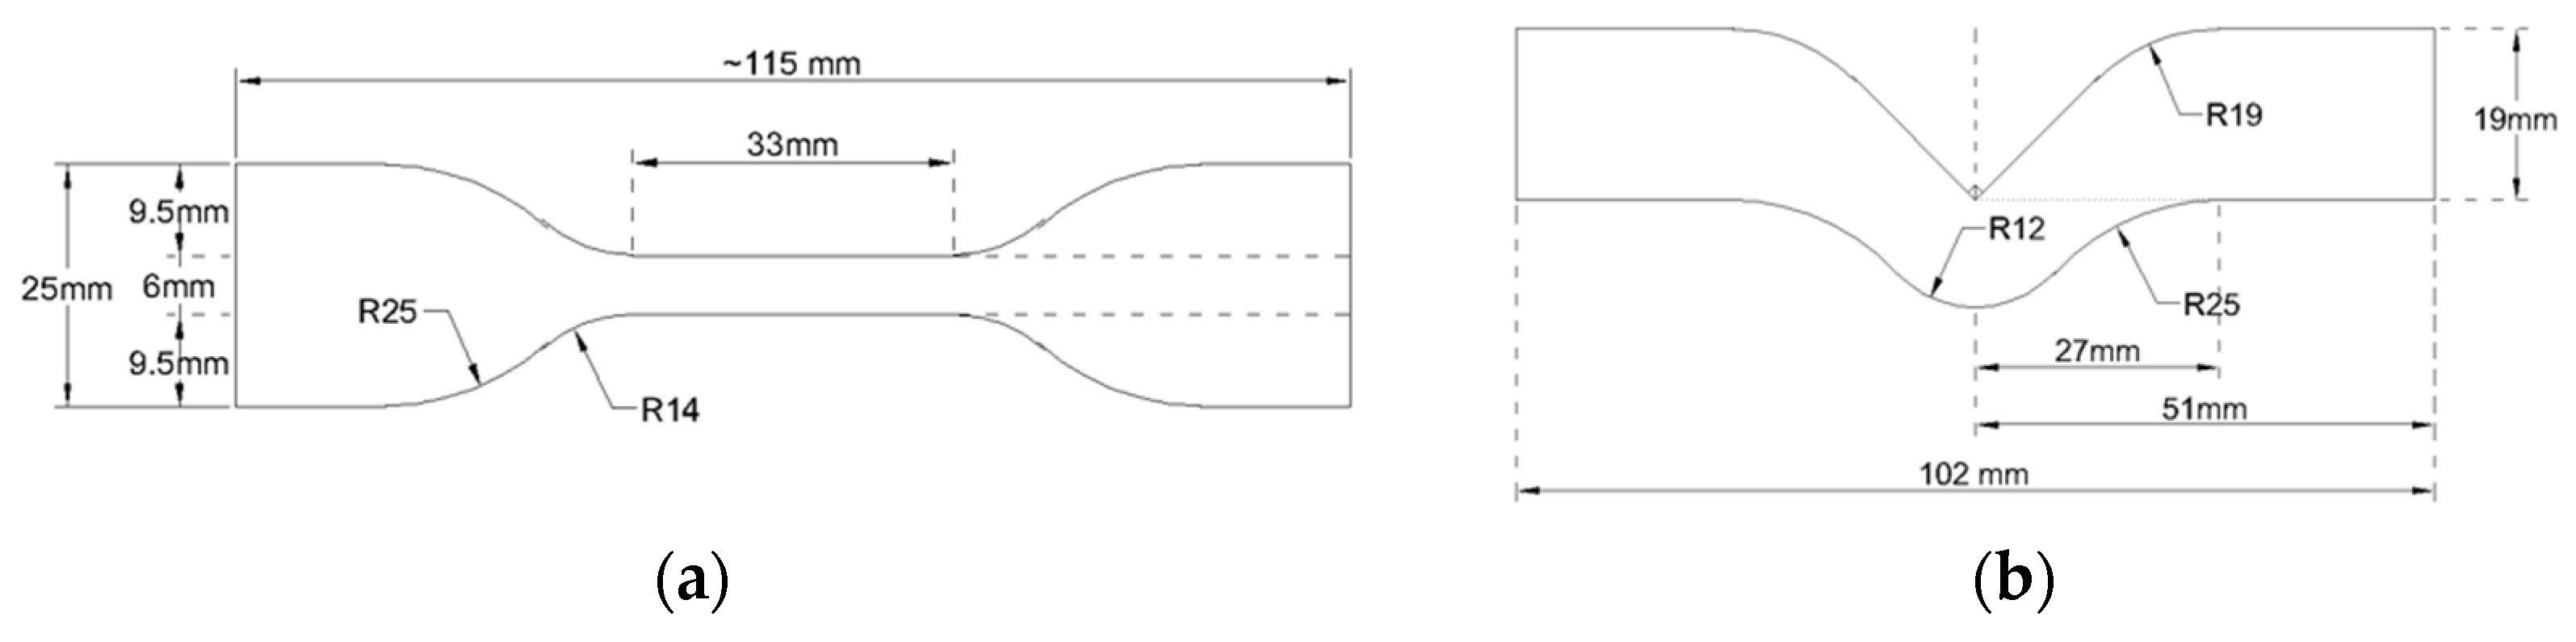
2.2.1. Tensile Properties Measurements
2.2.2. Tear Strength Measurement
2.2.3. Shore a Hardness Measurement
2.2.4. Translucency Parameter Measurement
2.2.5. Viscoelastic Properties Measurement
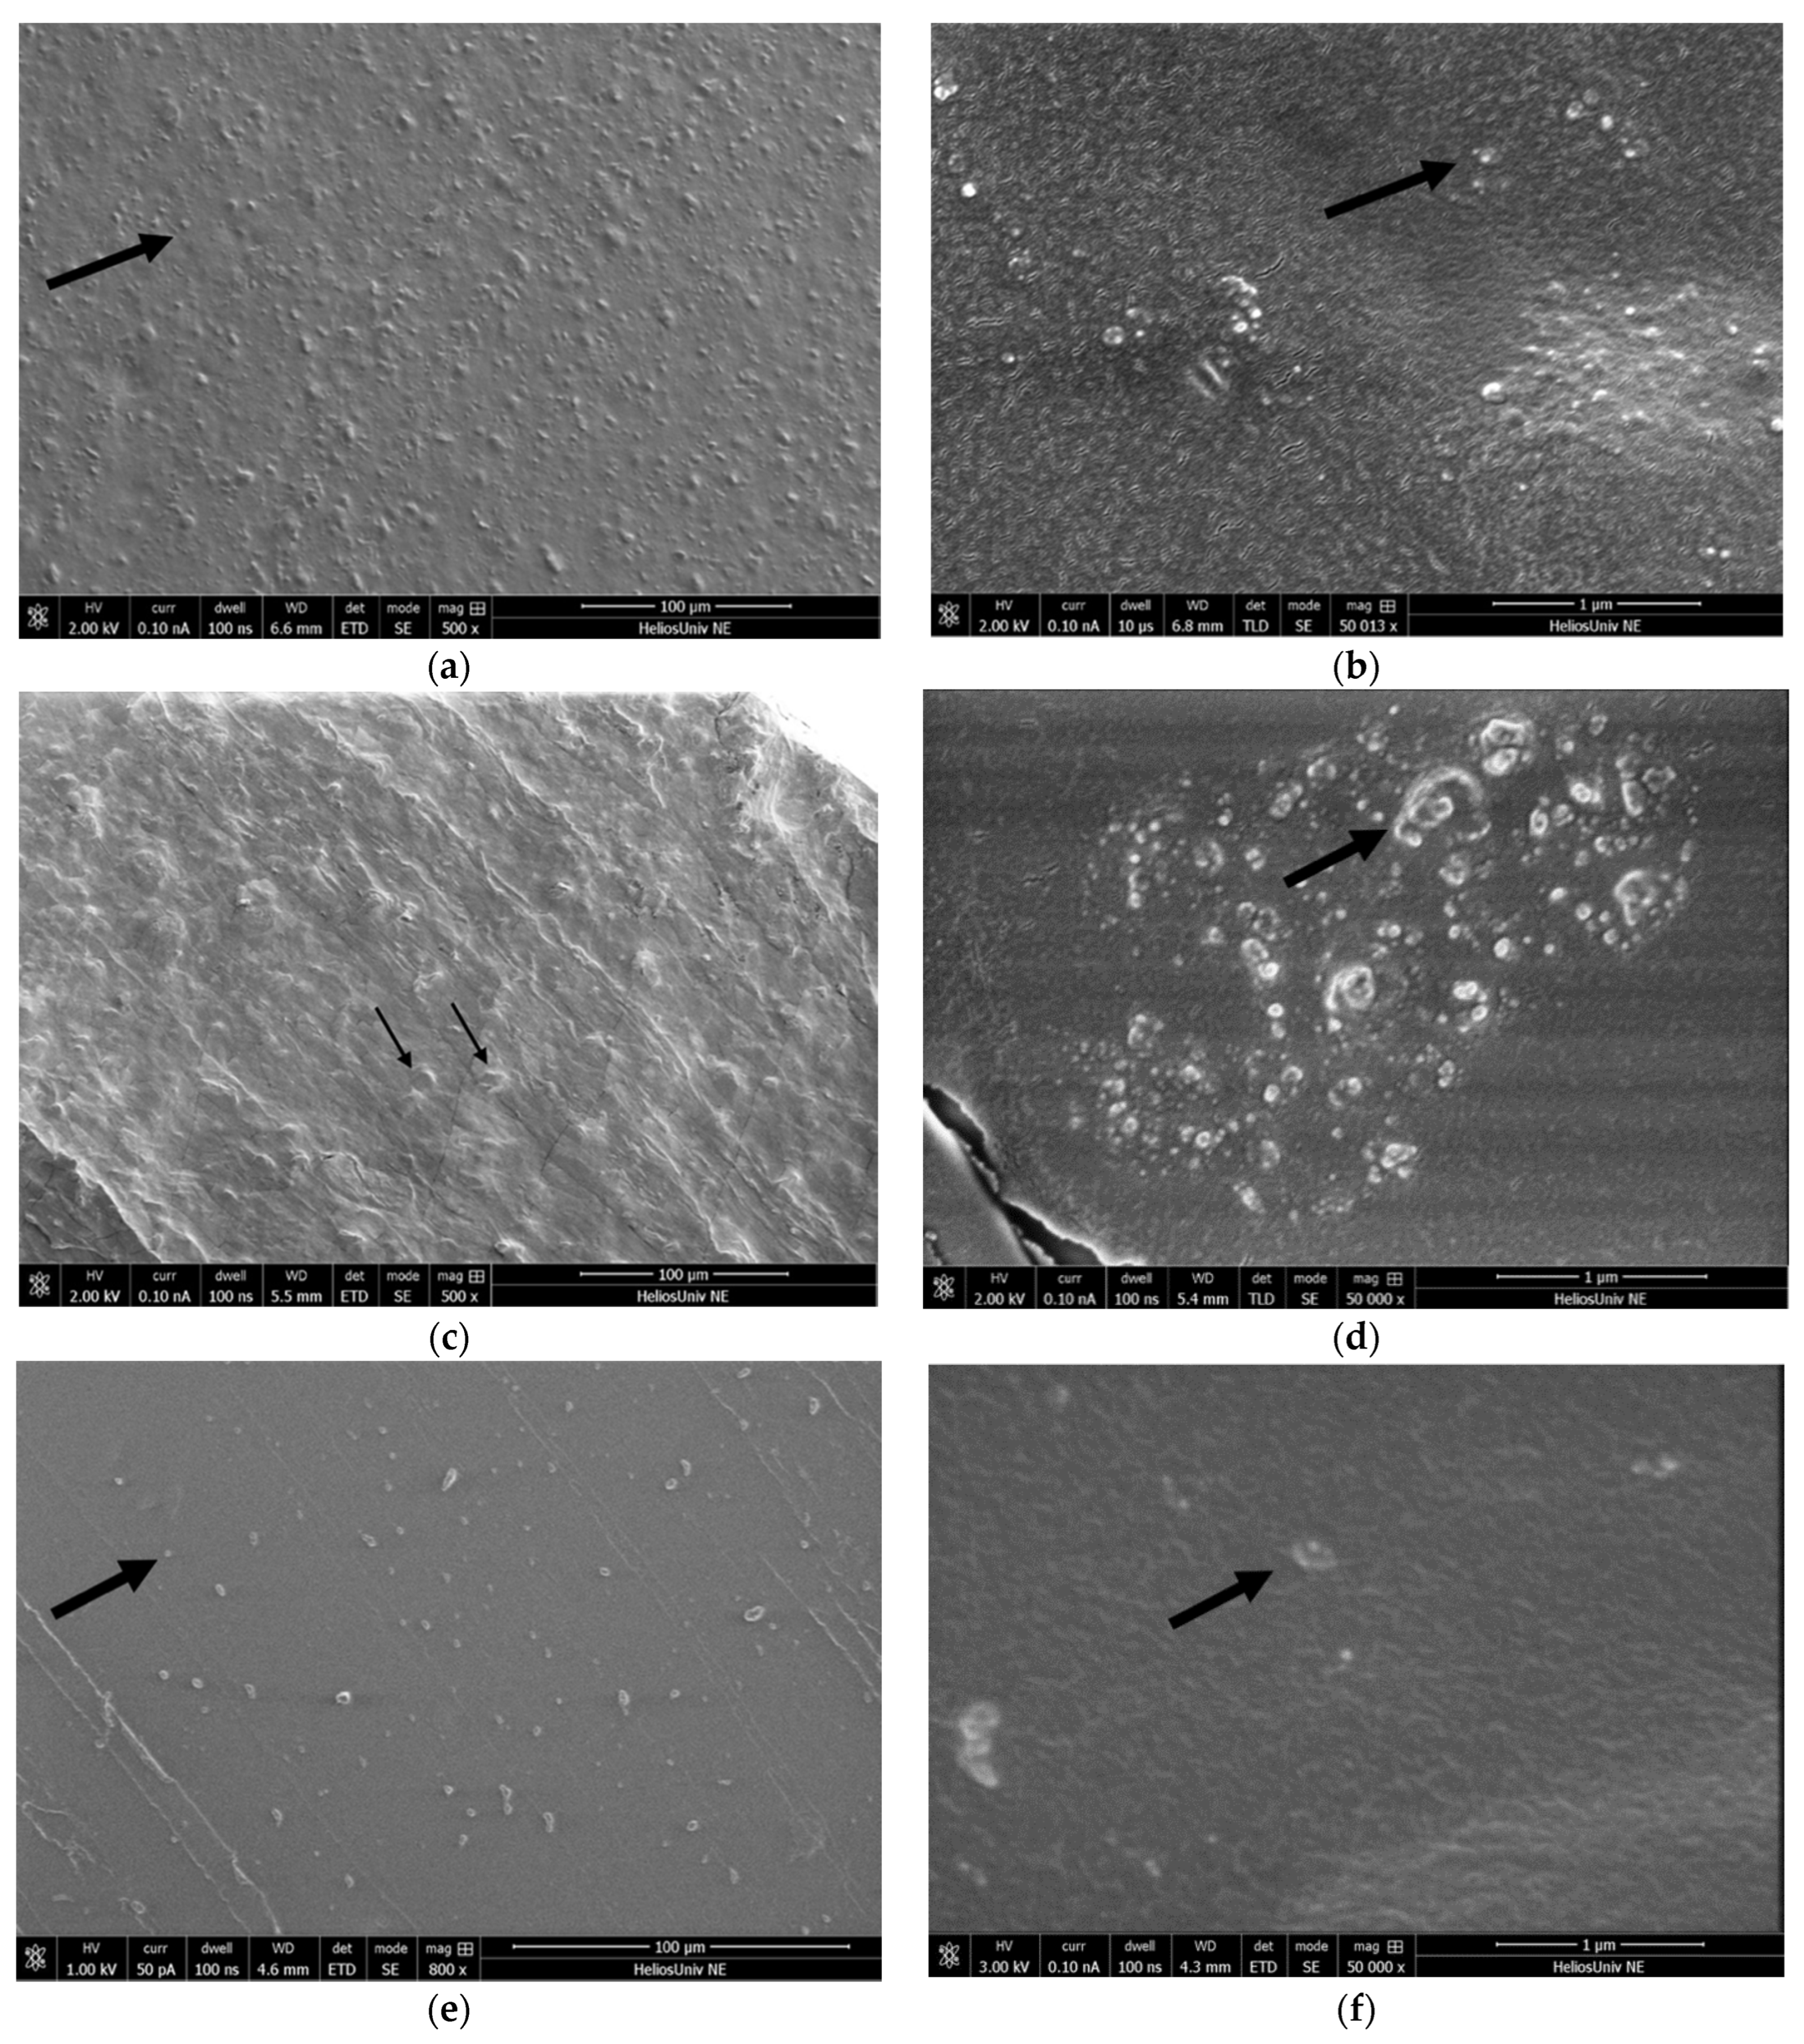
2.3. Microscopic Analysis
2.4. Data Analysis
3. Results
3.1. Nanoparticle Dispersion
3.2. Physical Properties
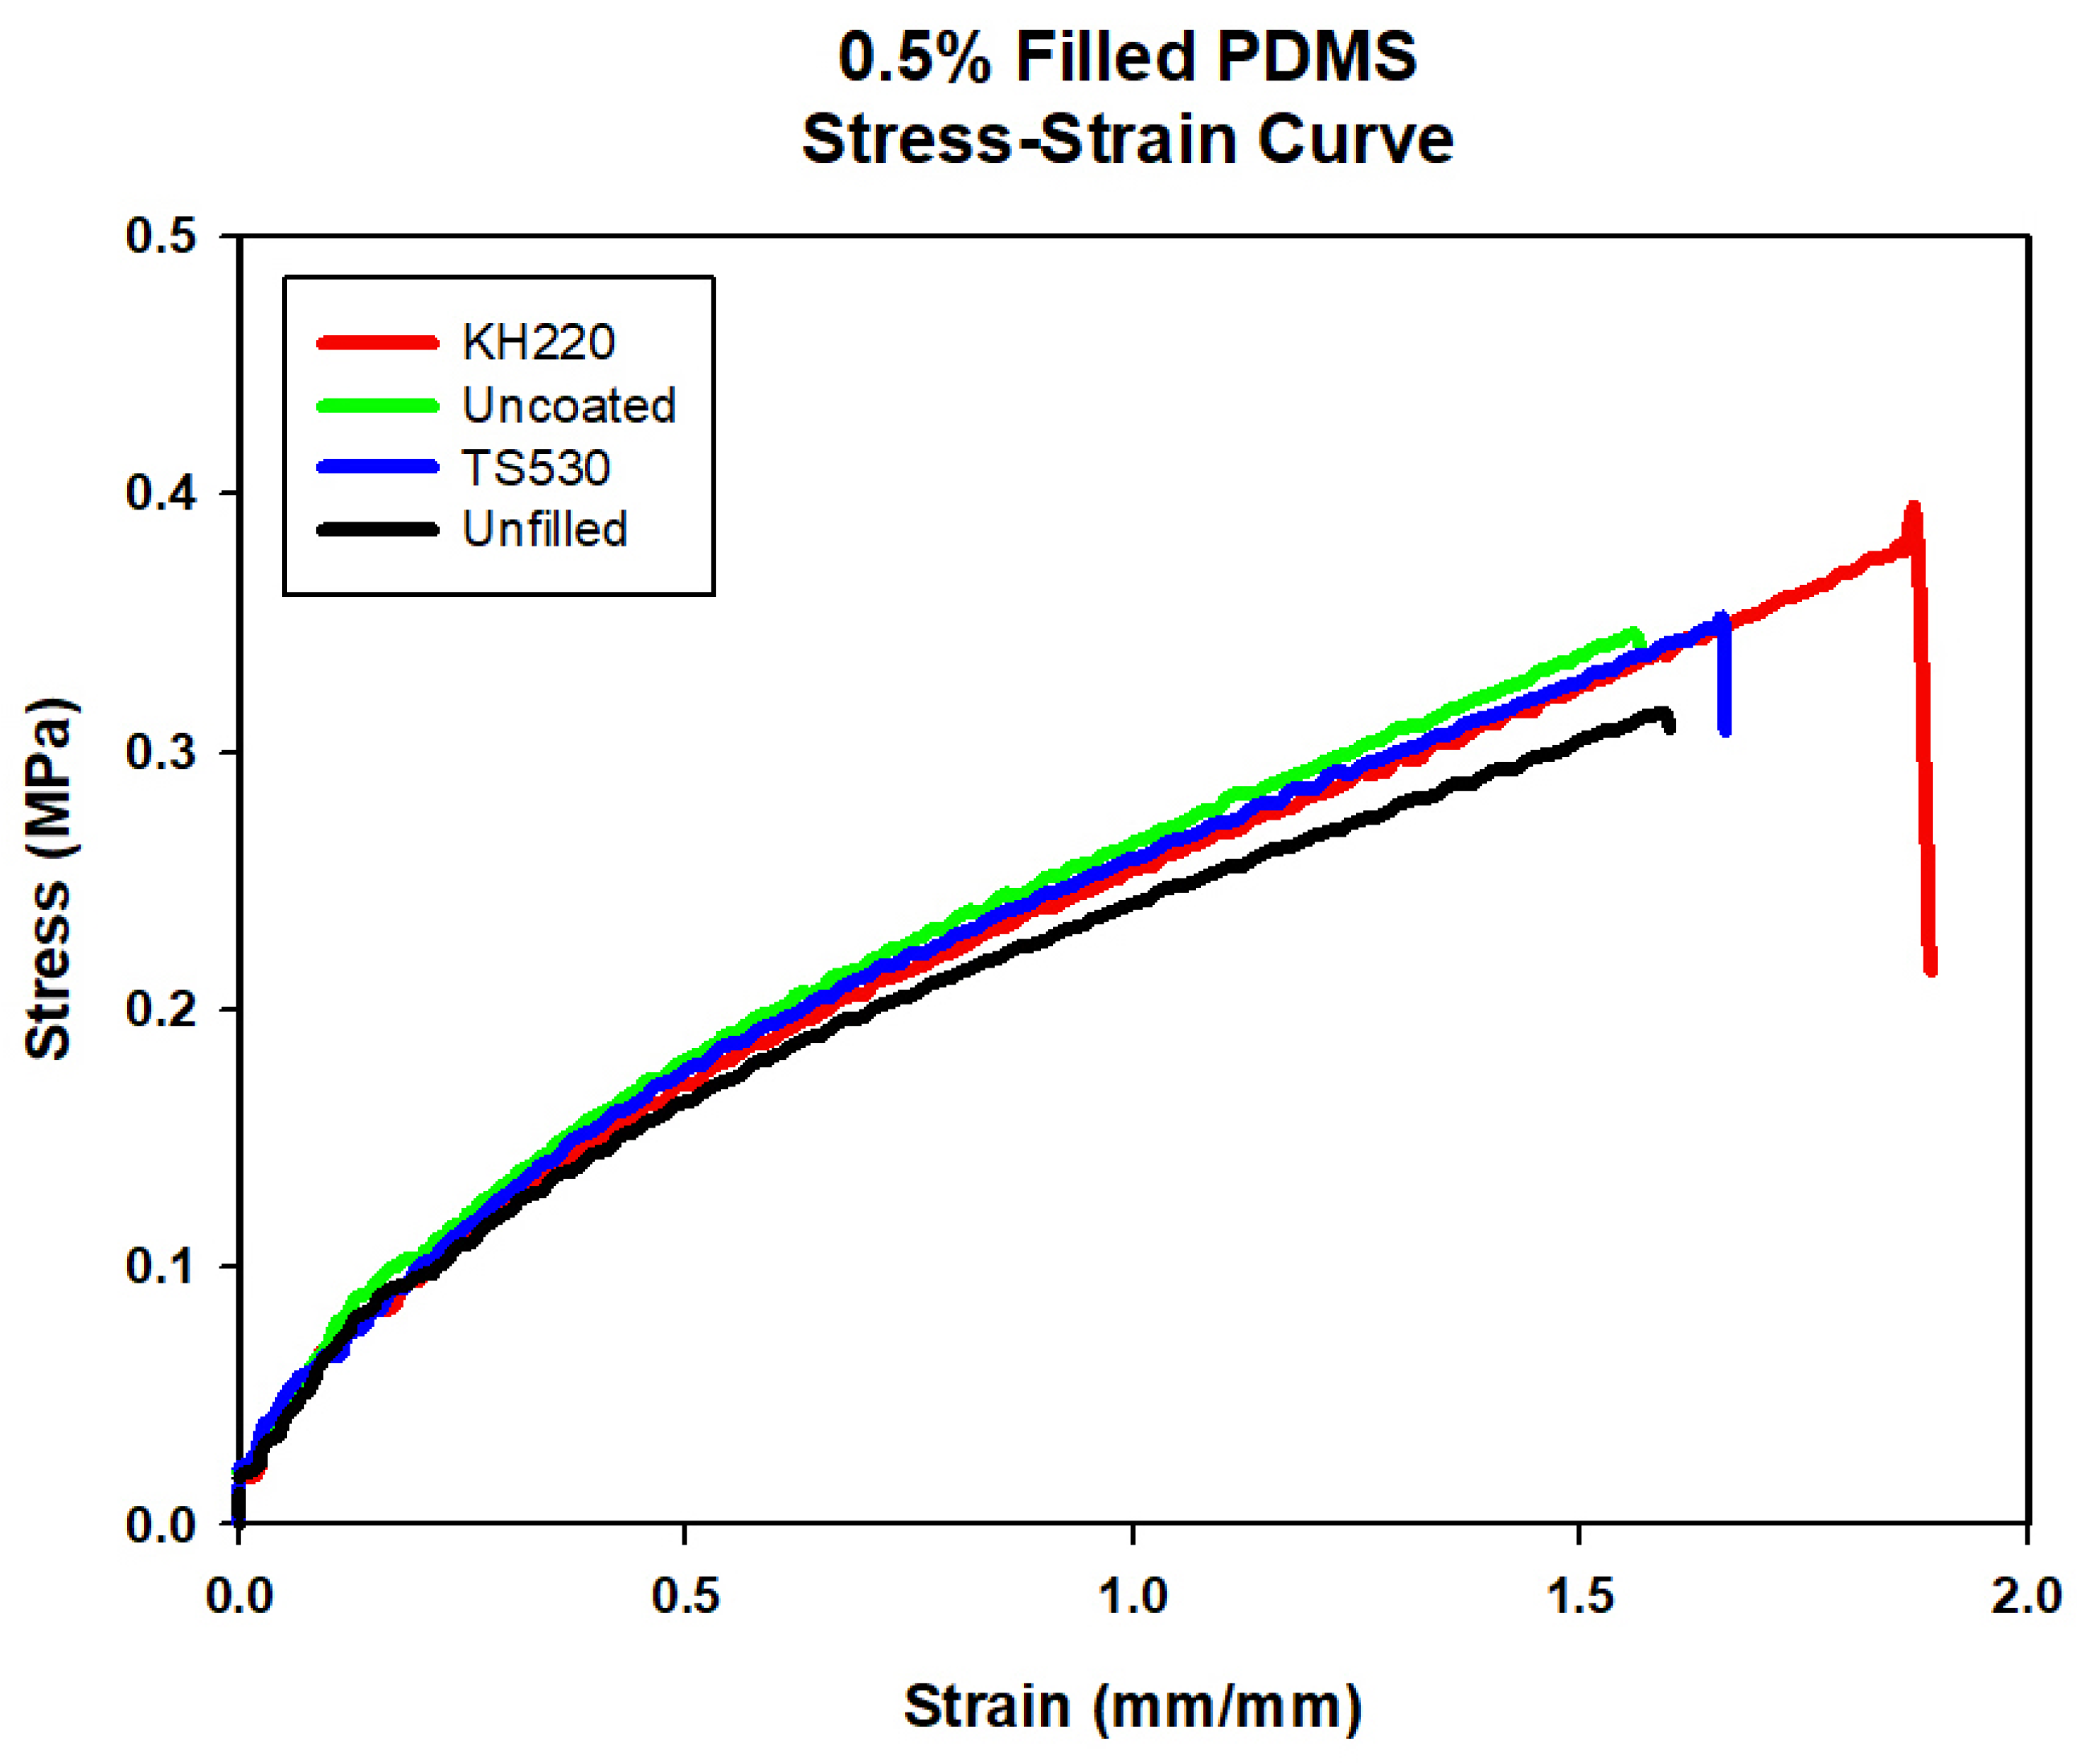
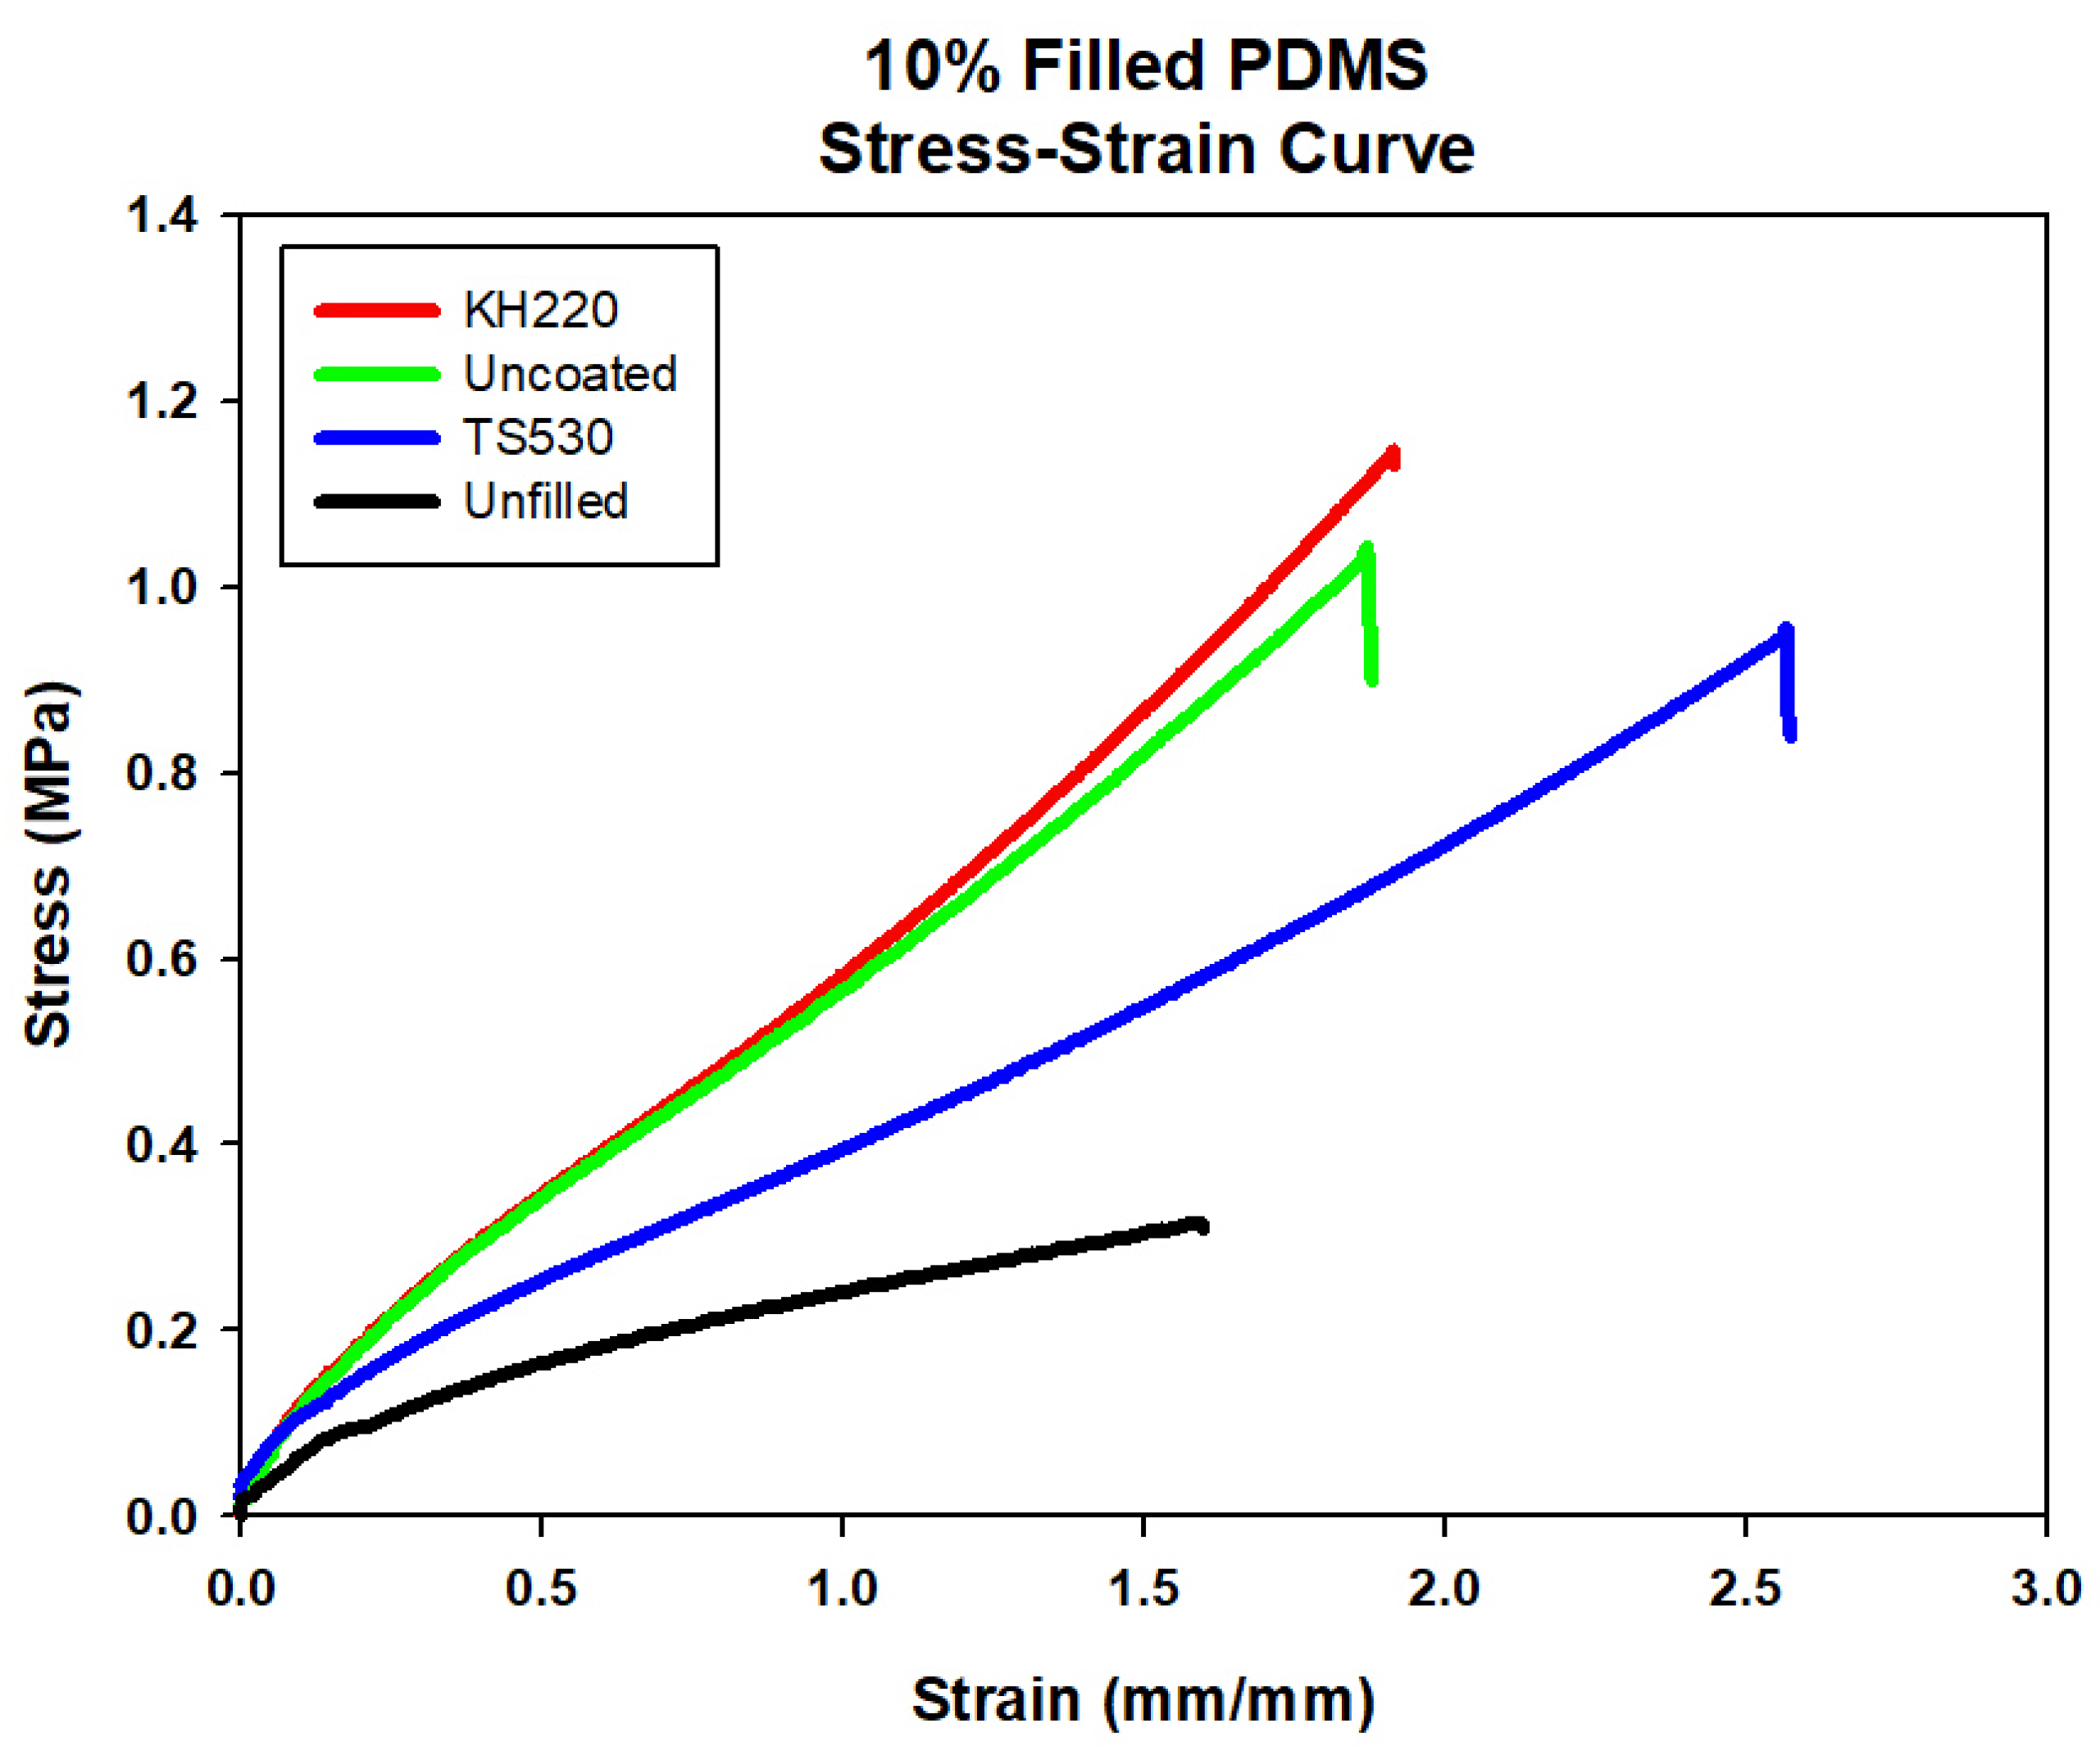
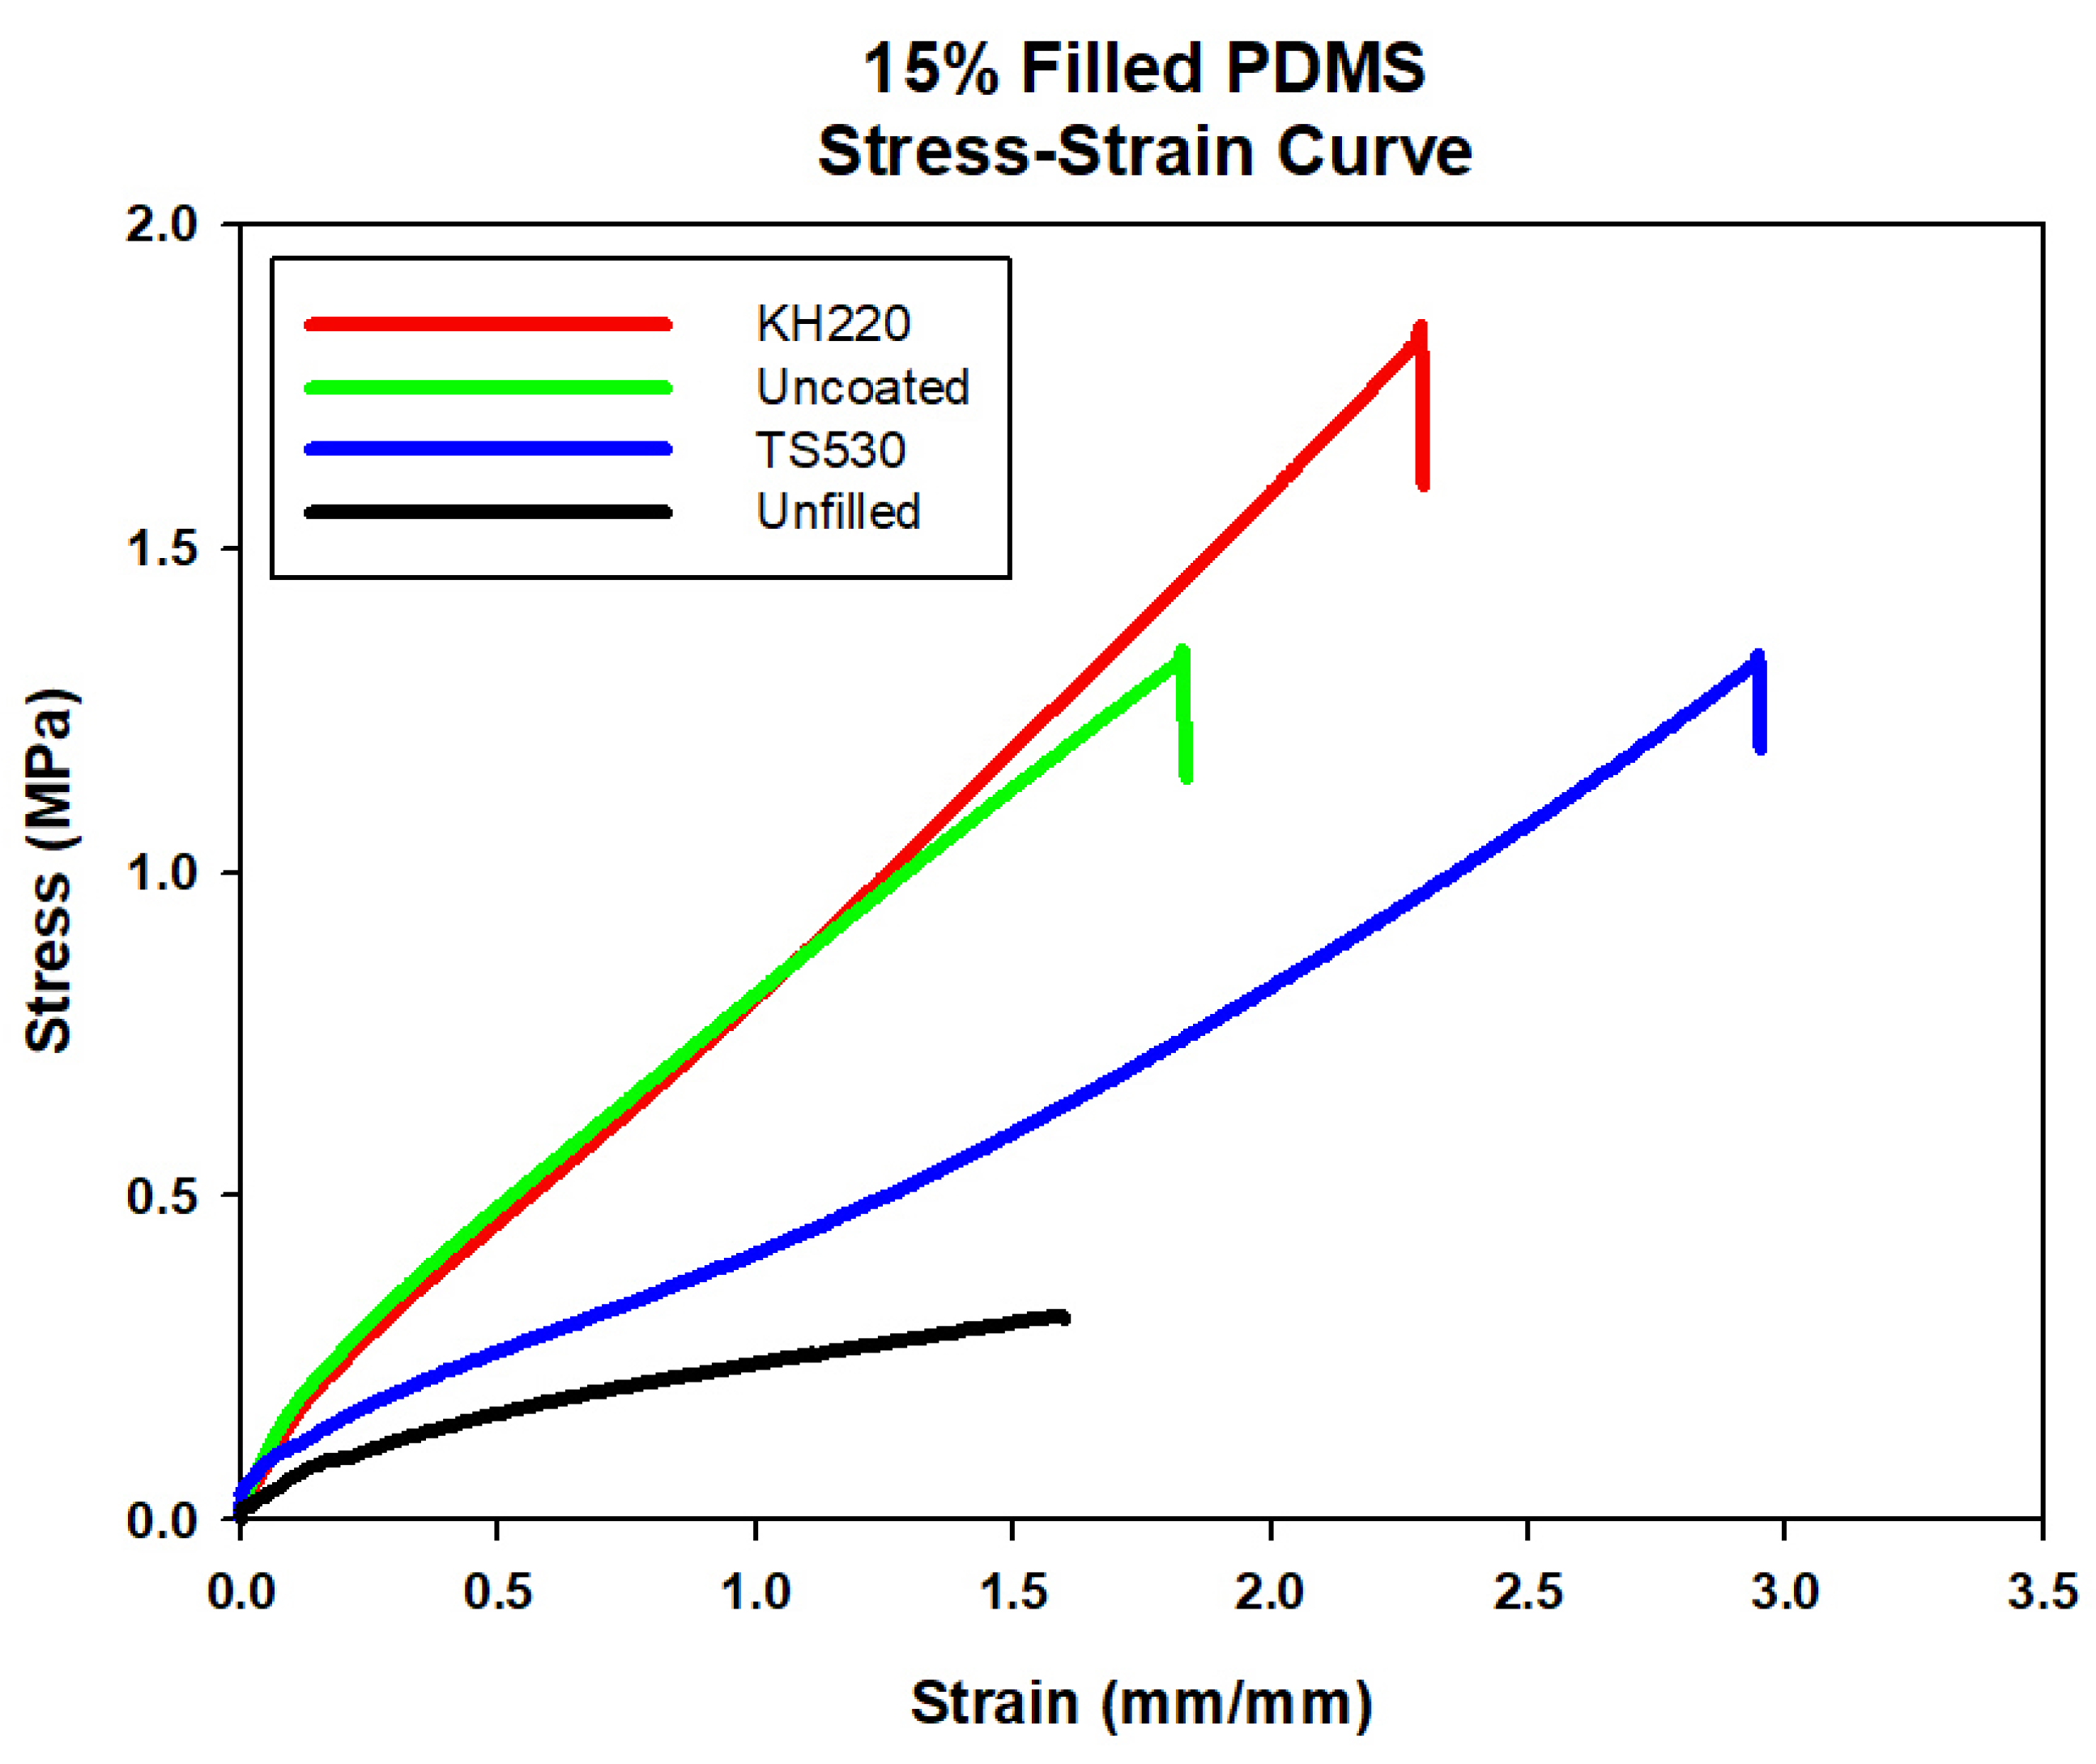
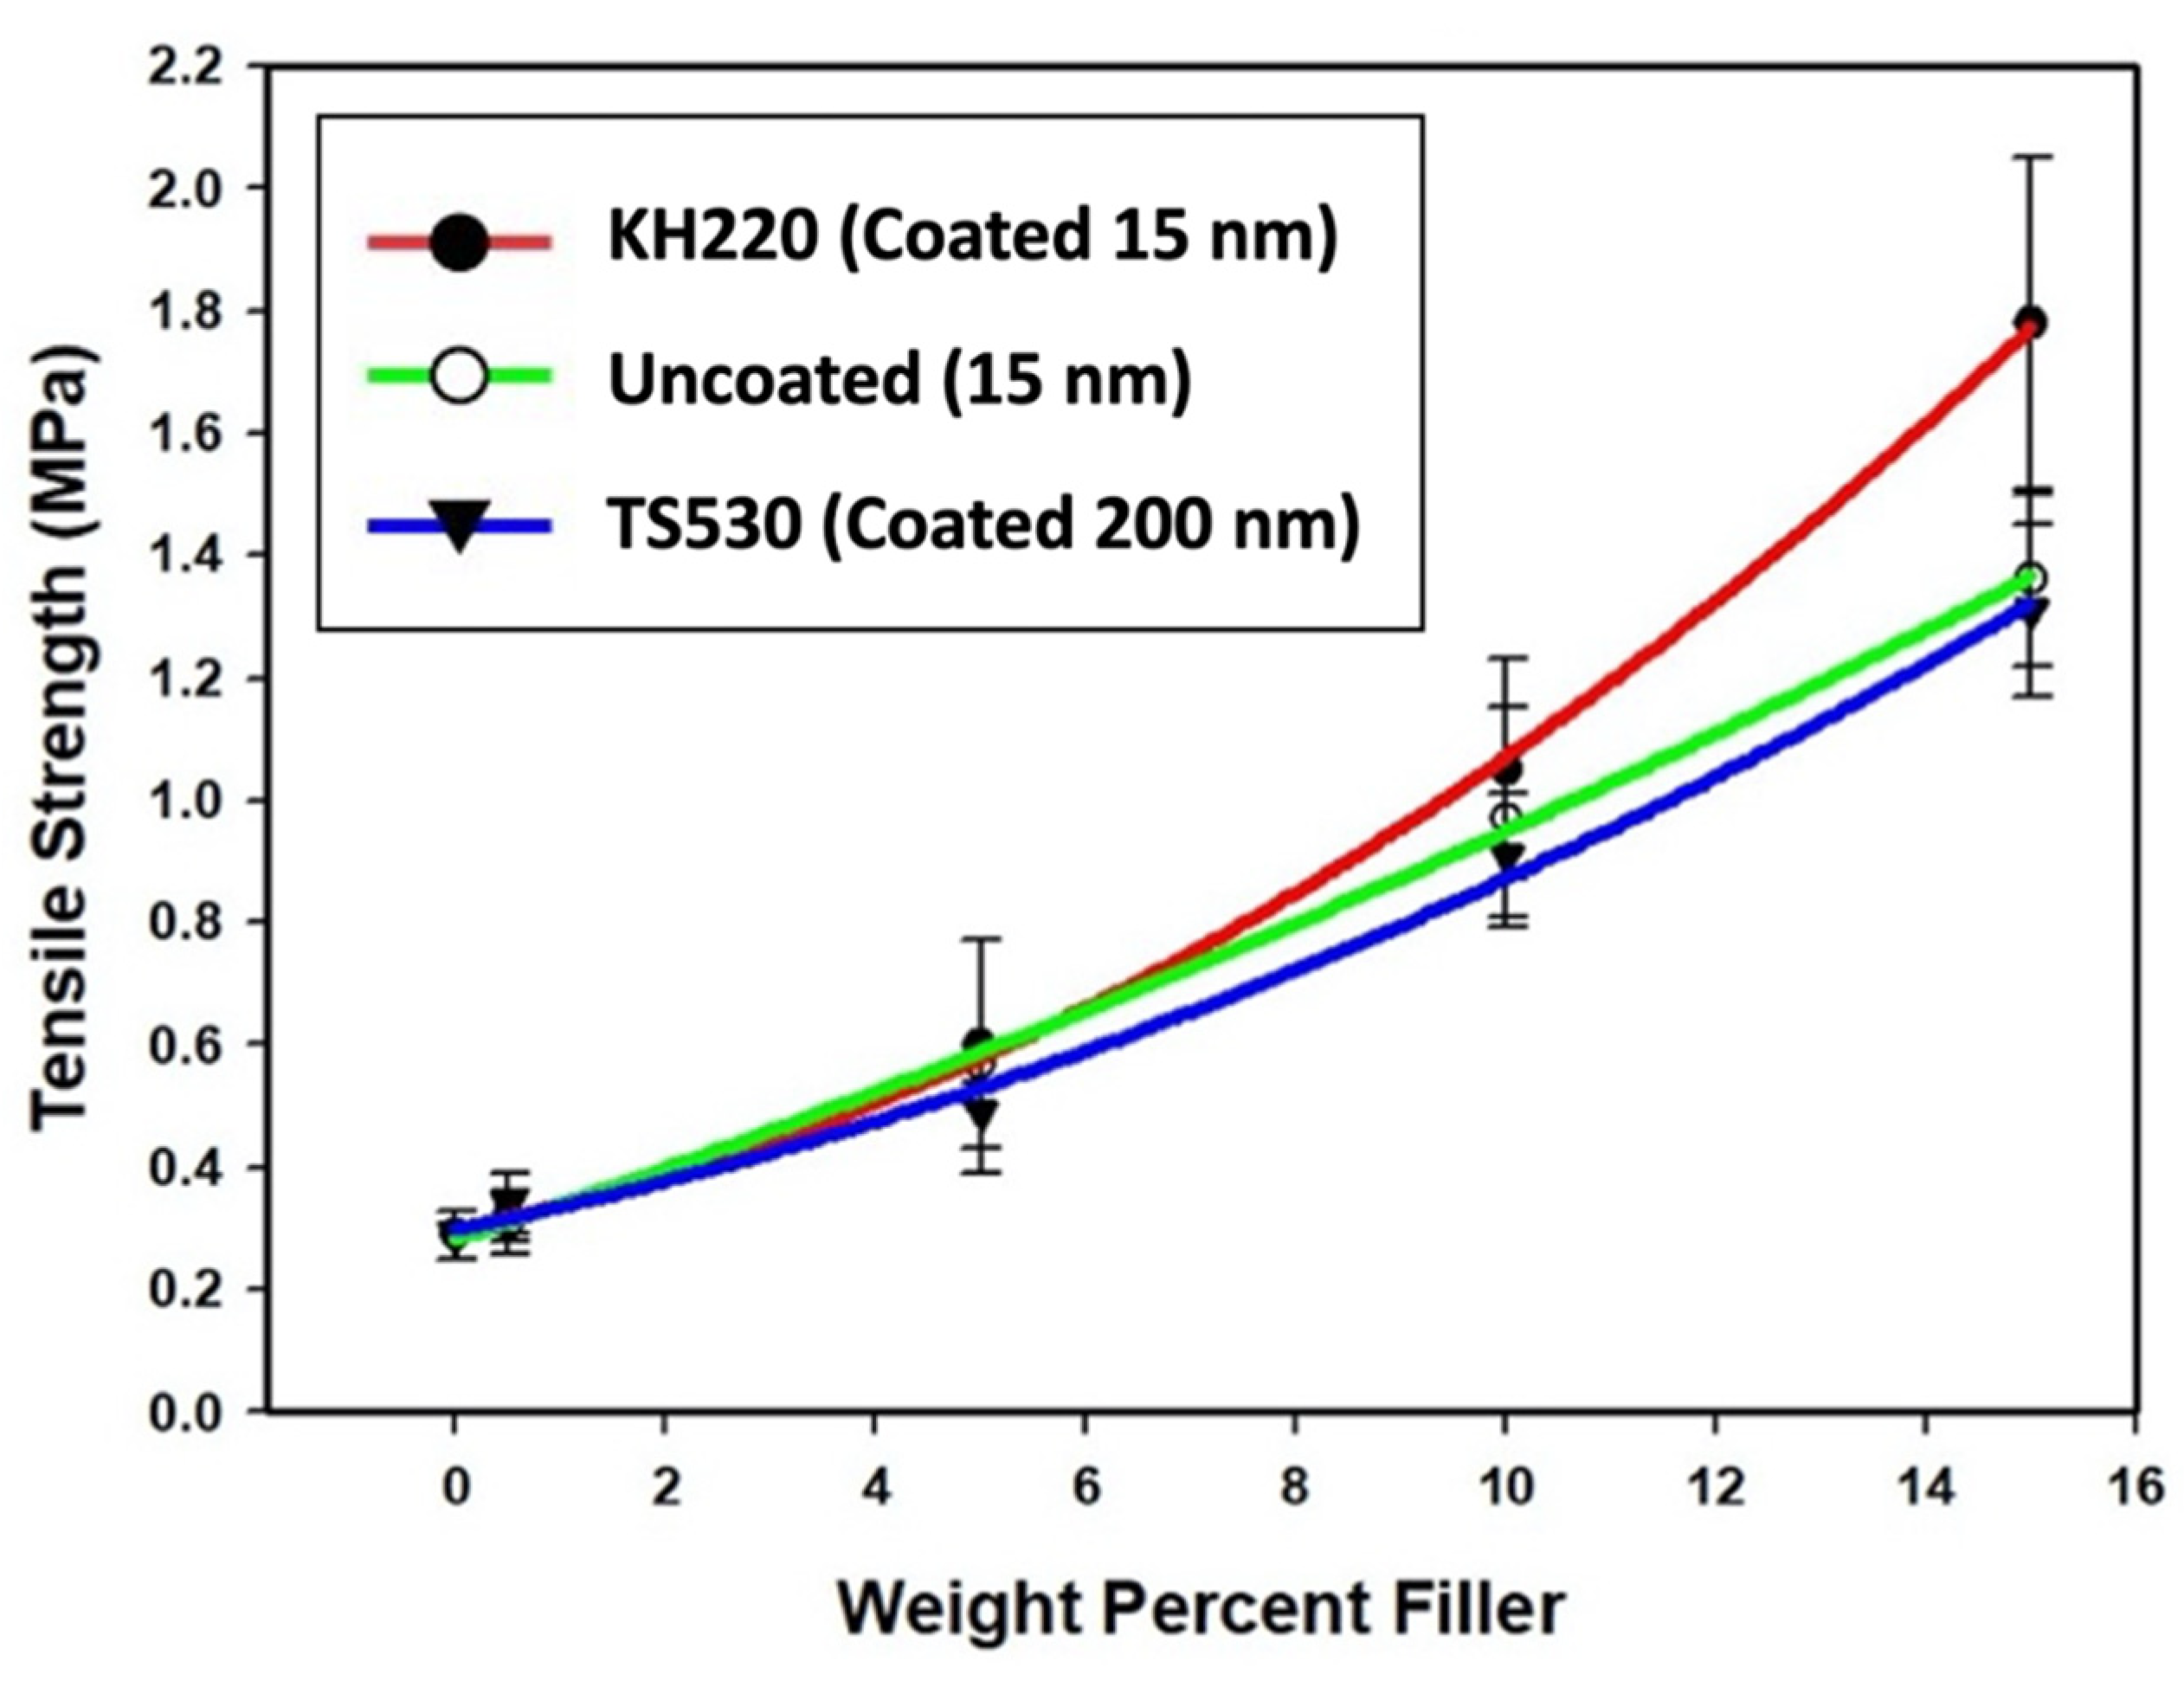
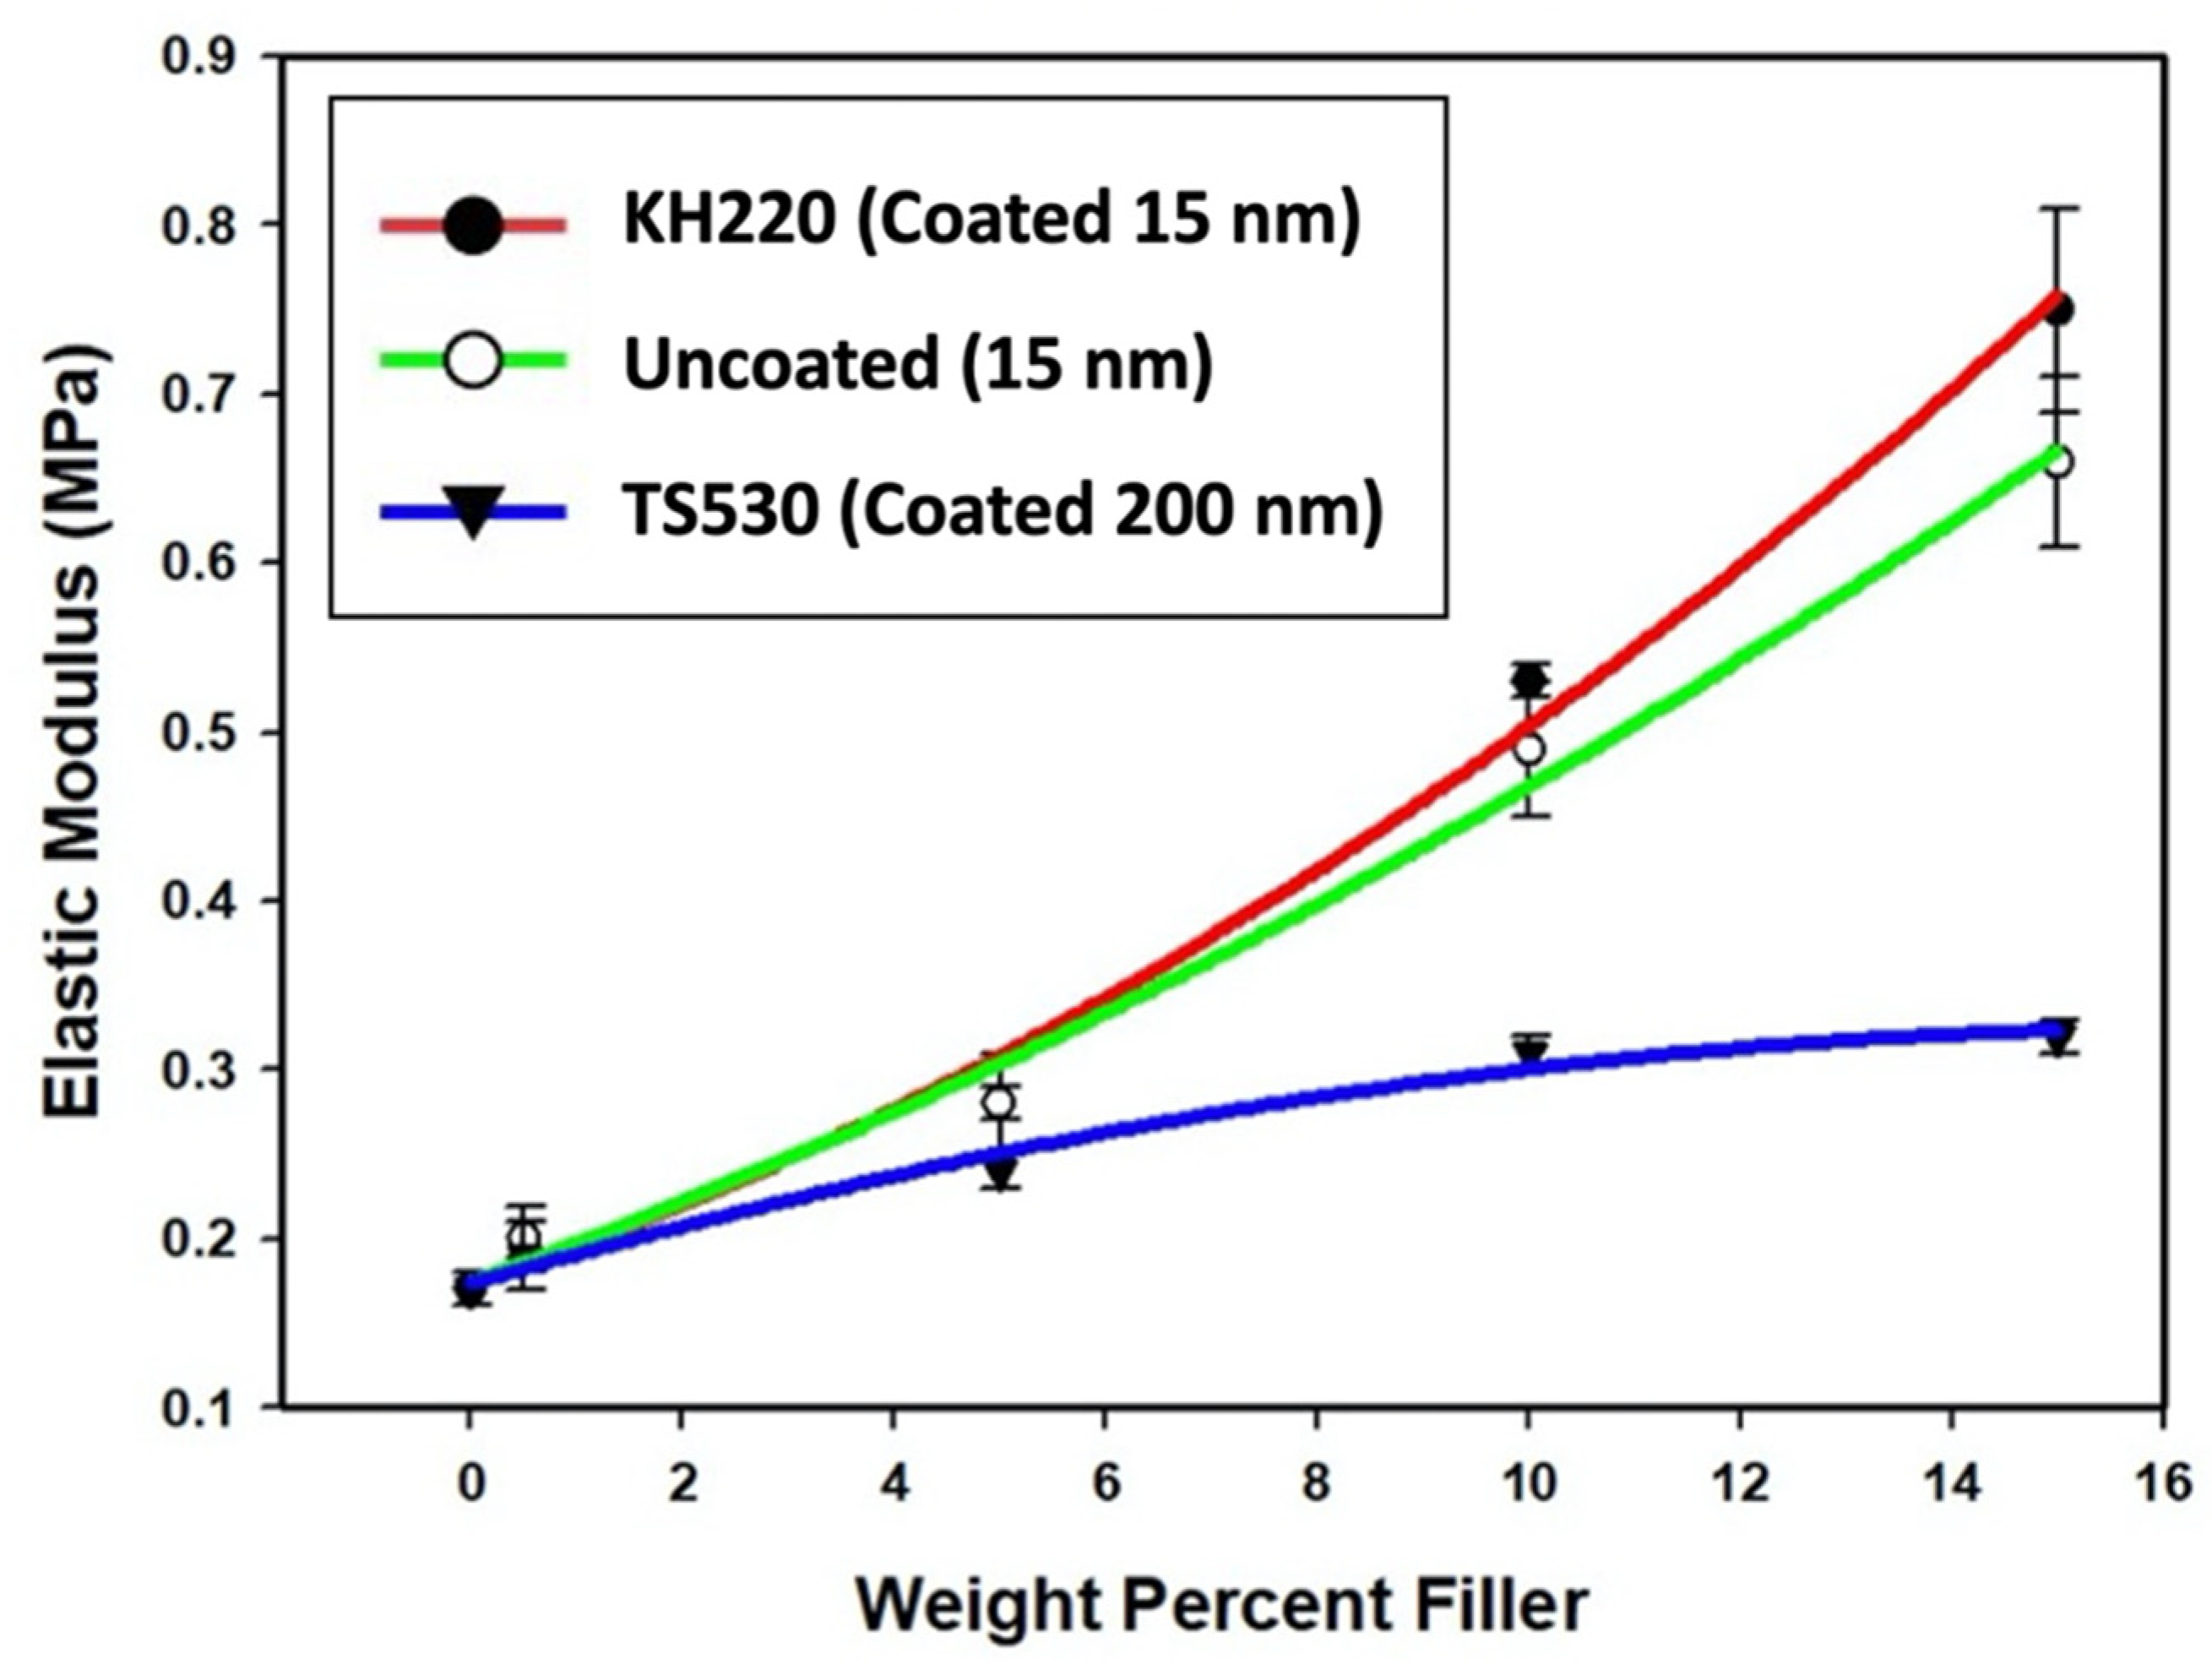
3.2.1. Tensile Properties
Tensile Strength
Elastic Modulus
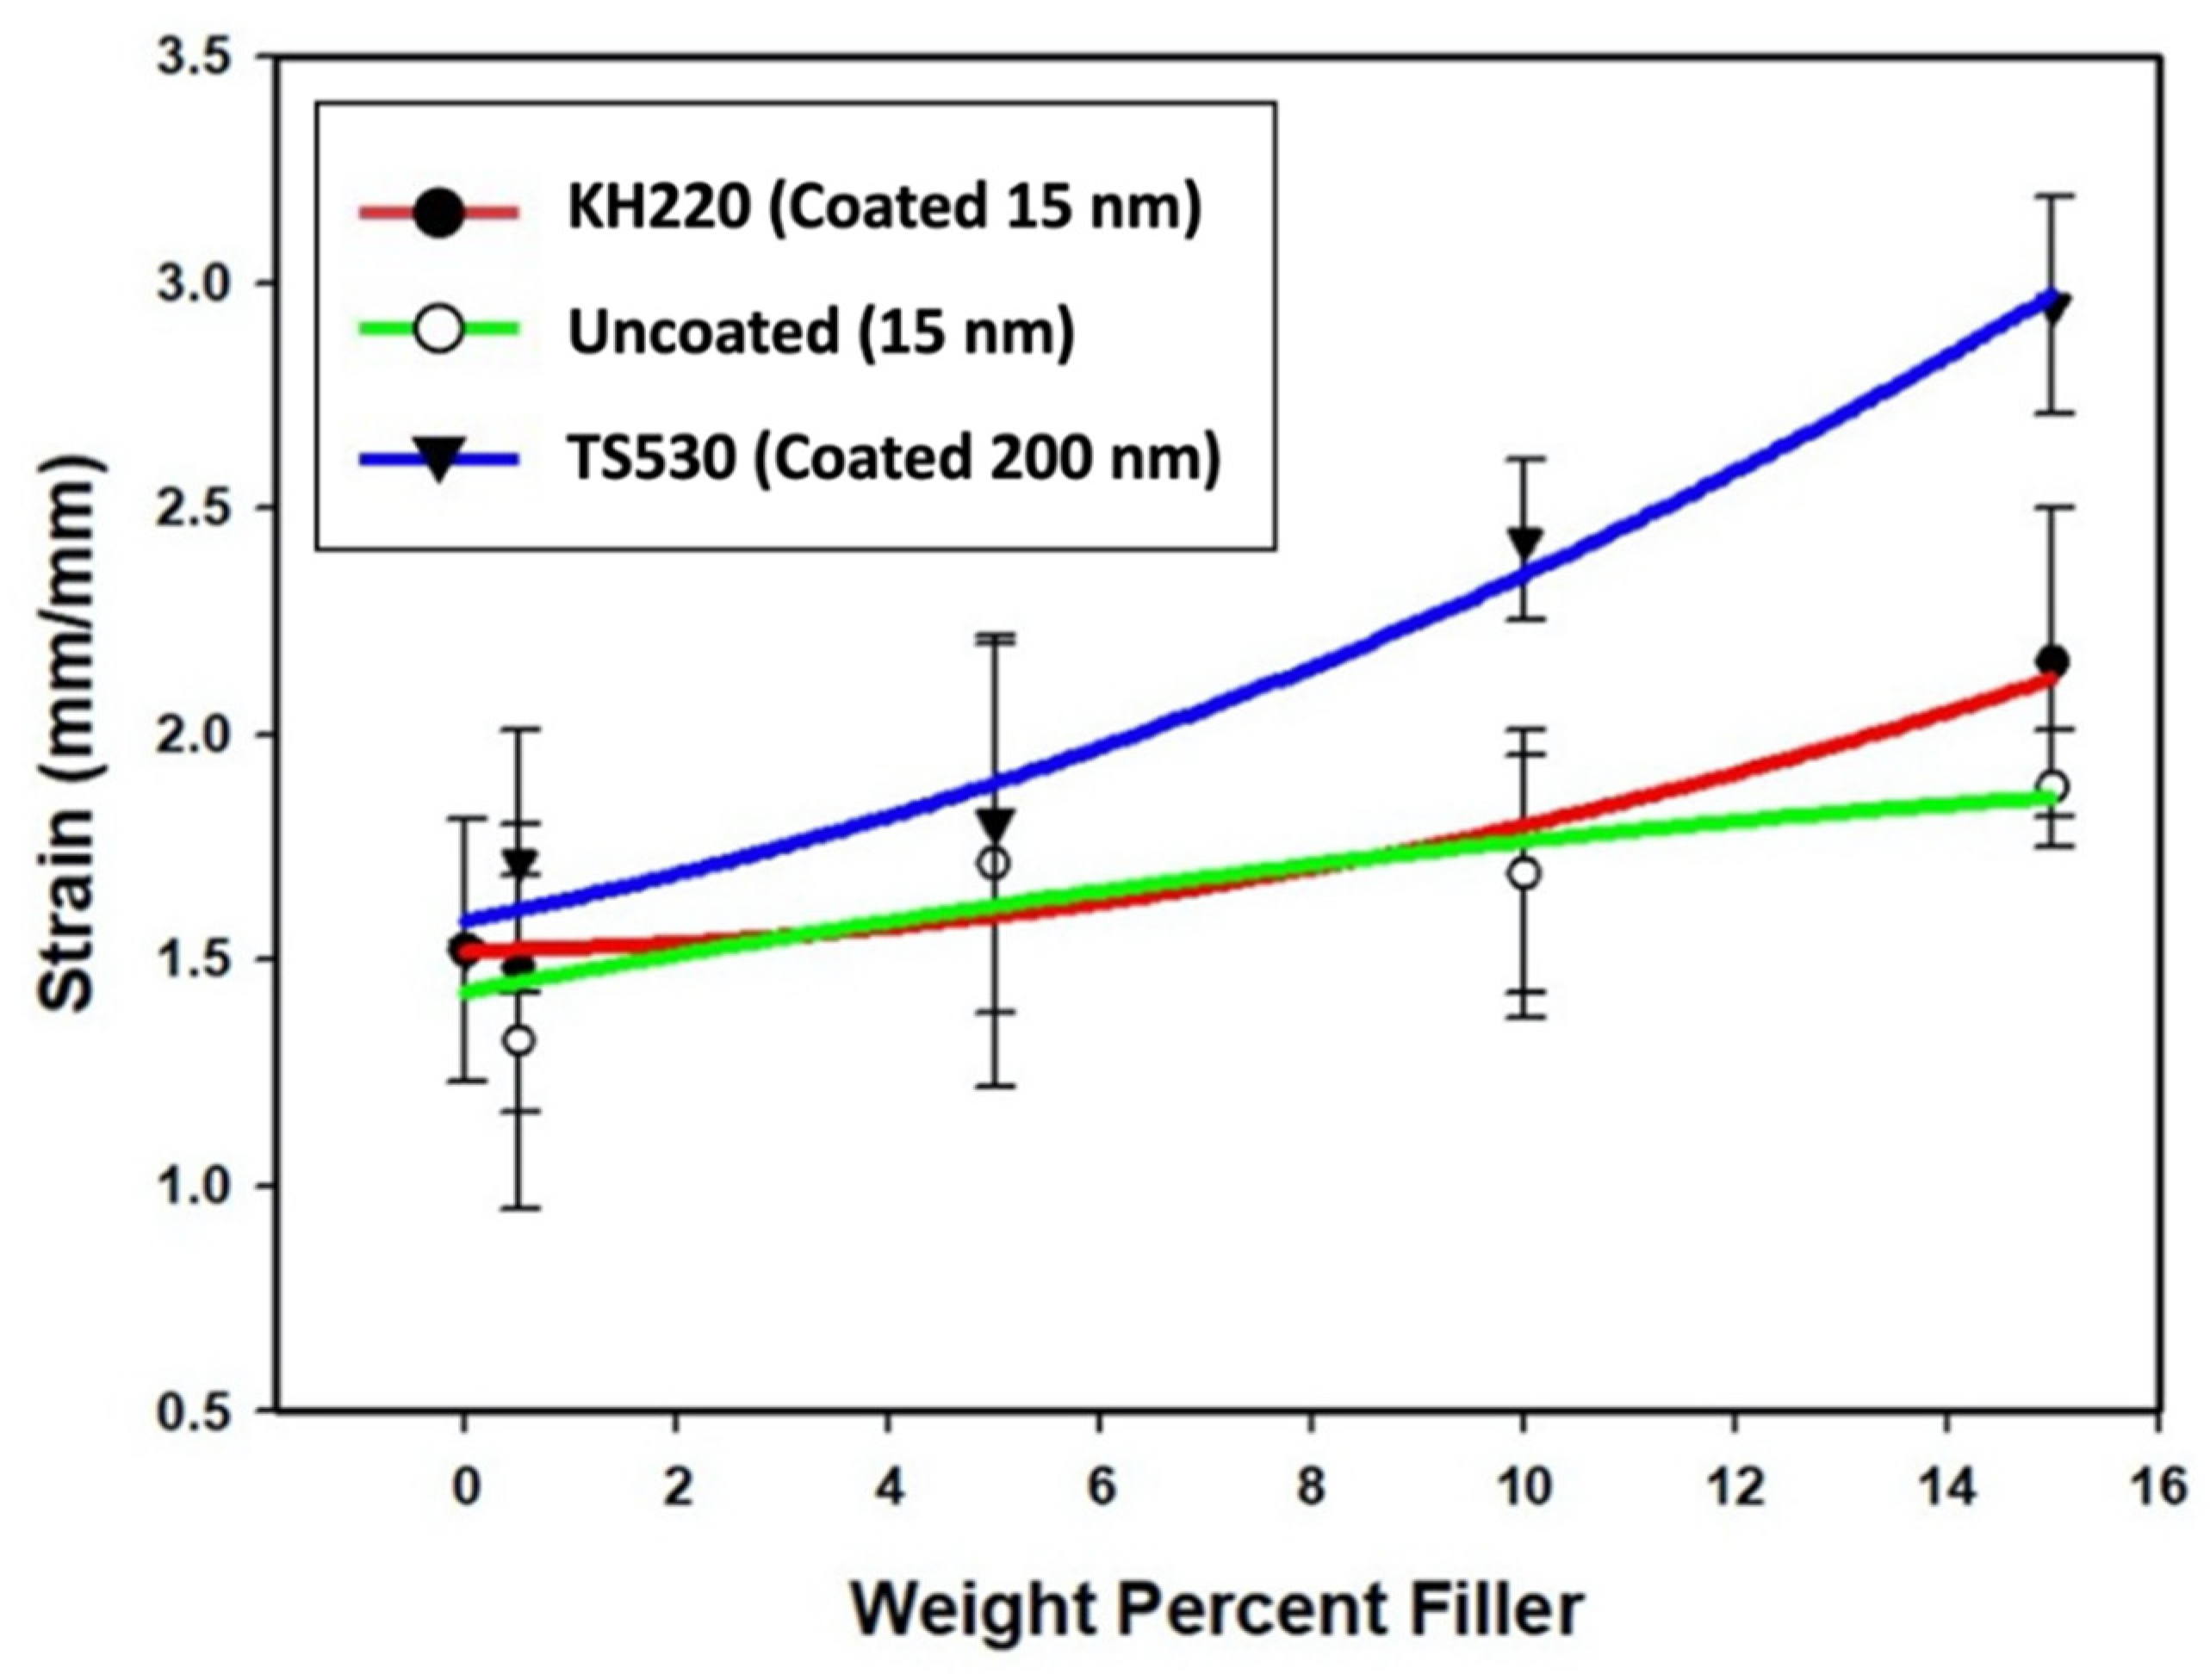
Failure Strain
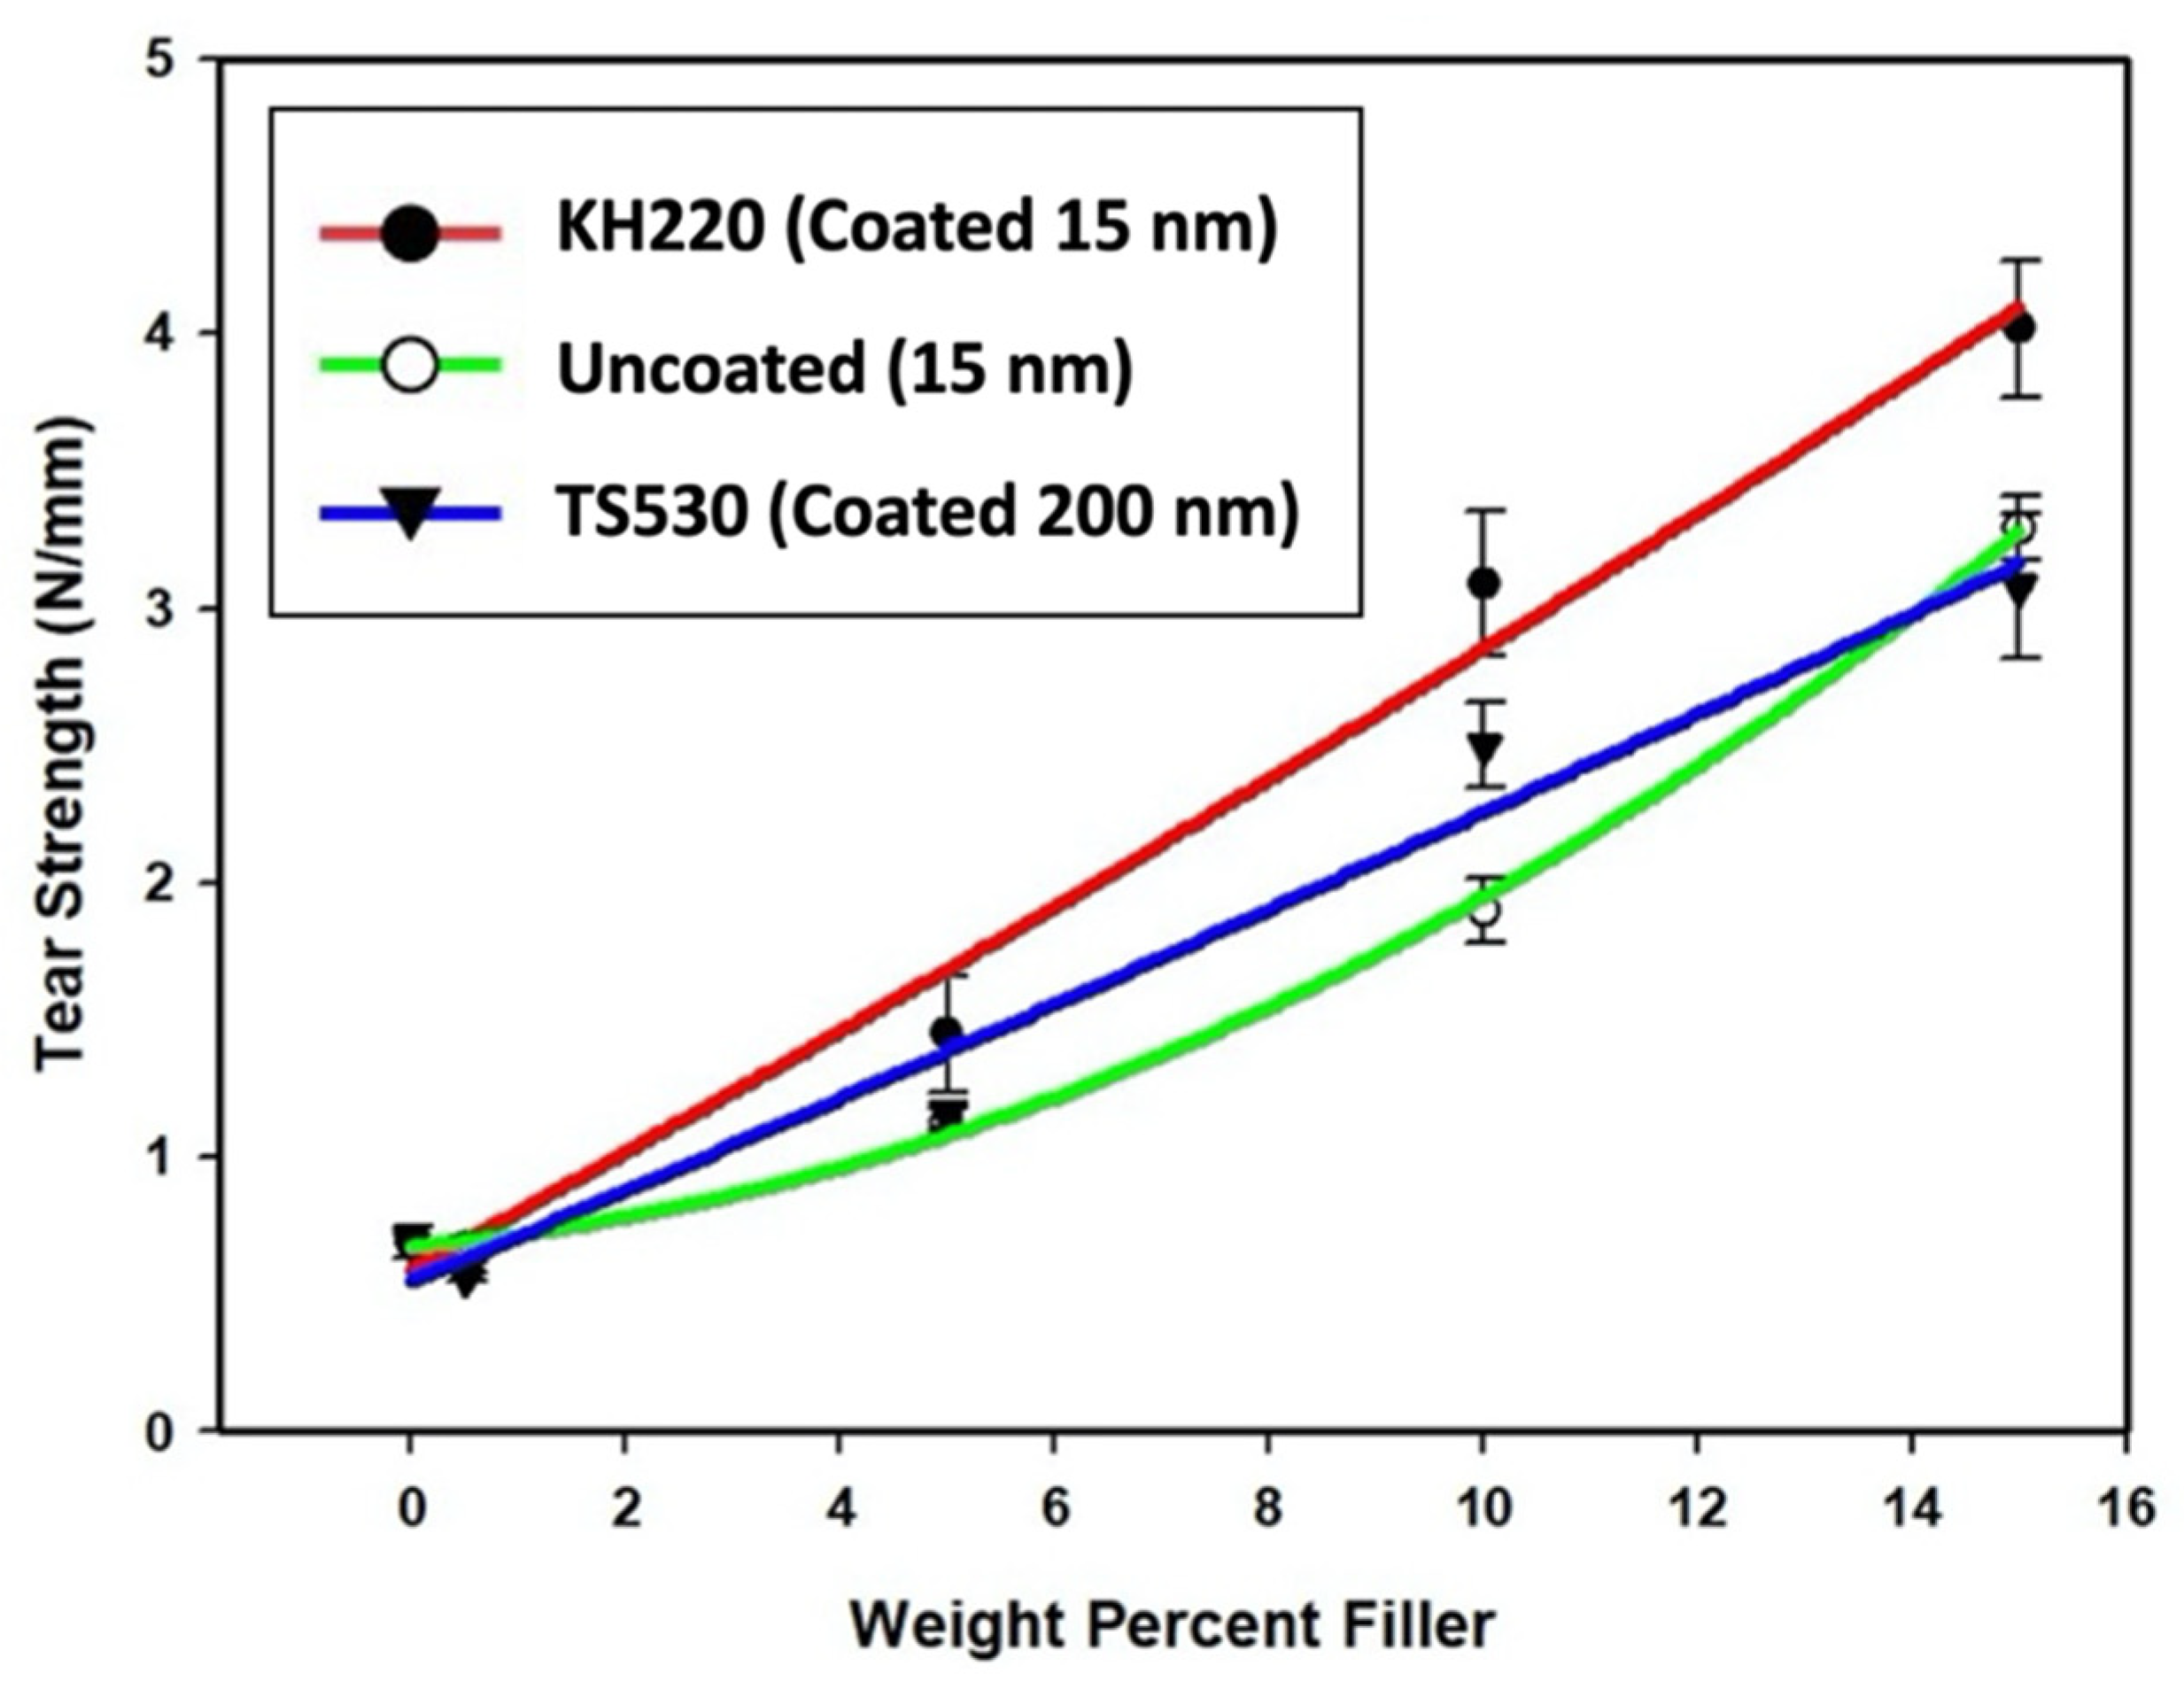
3.2.2. Tear Strength
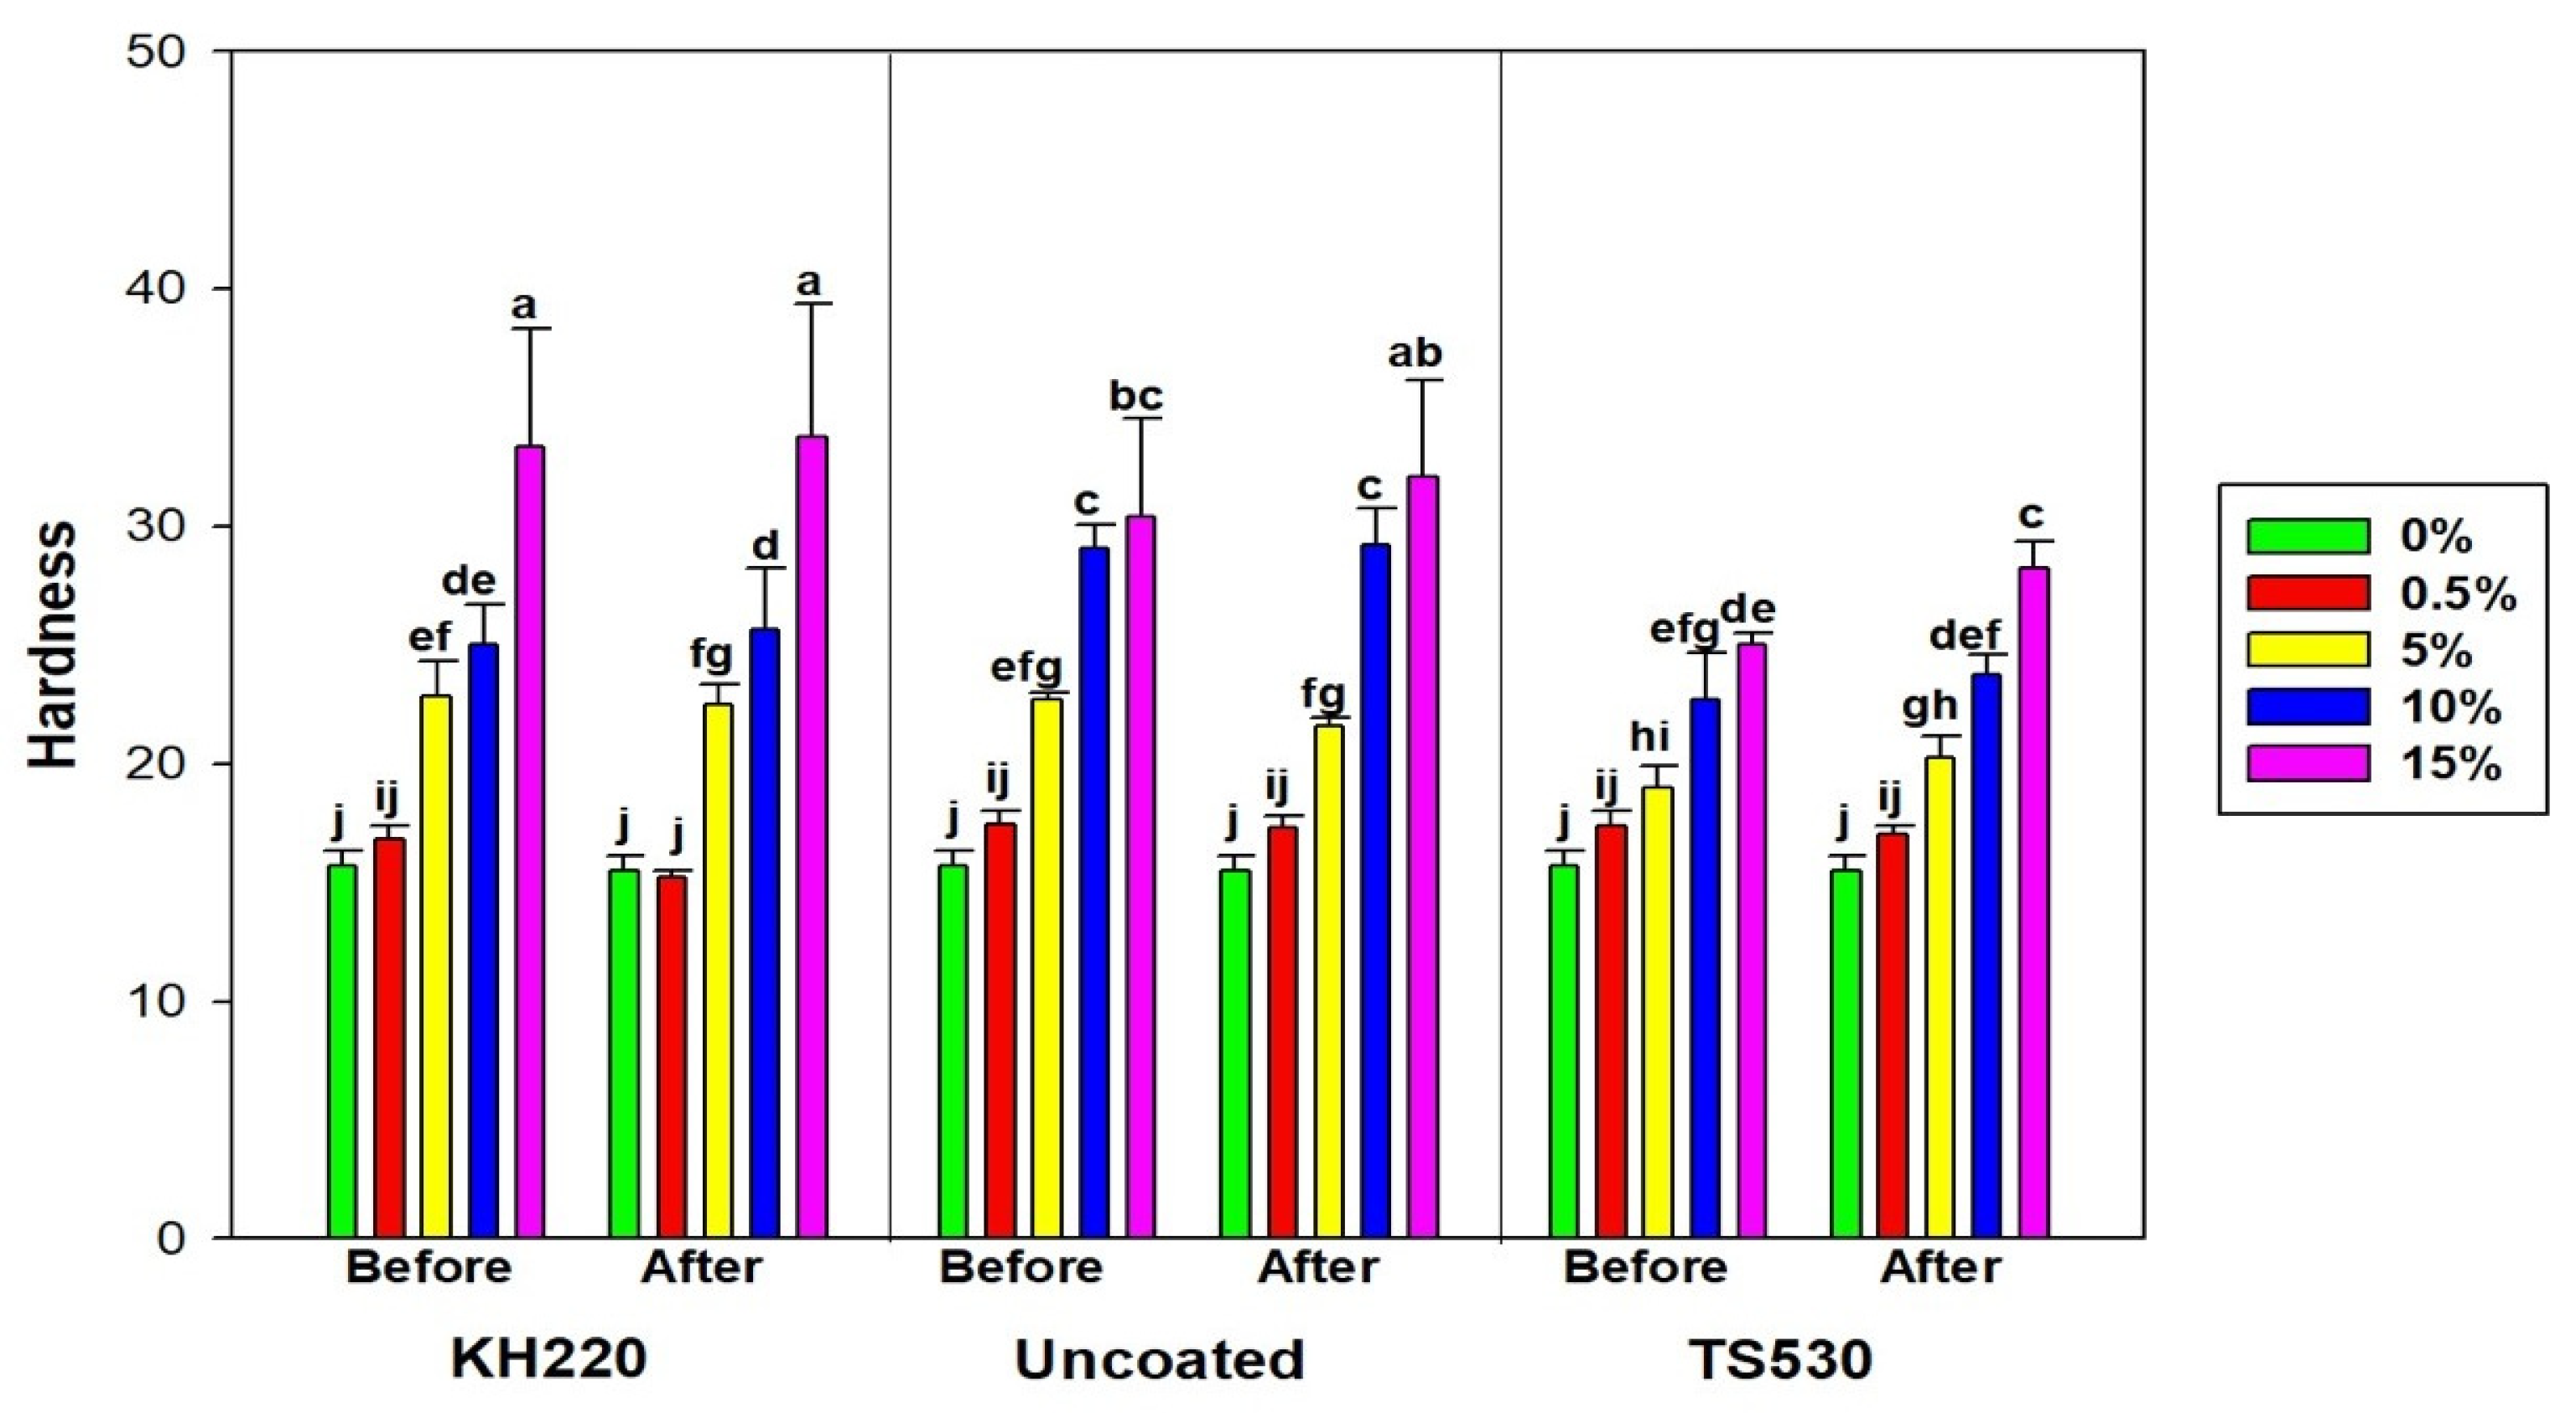
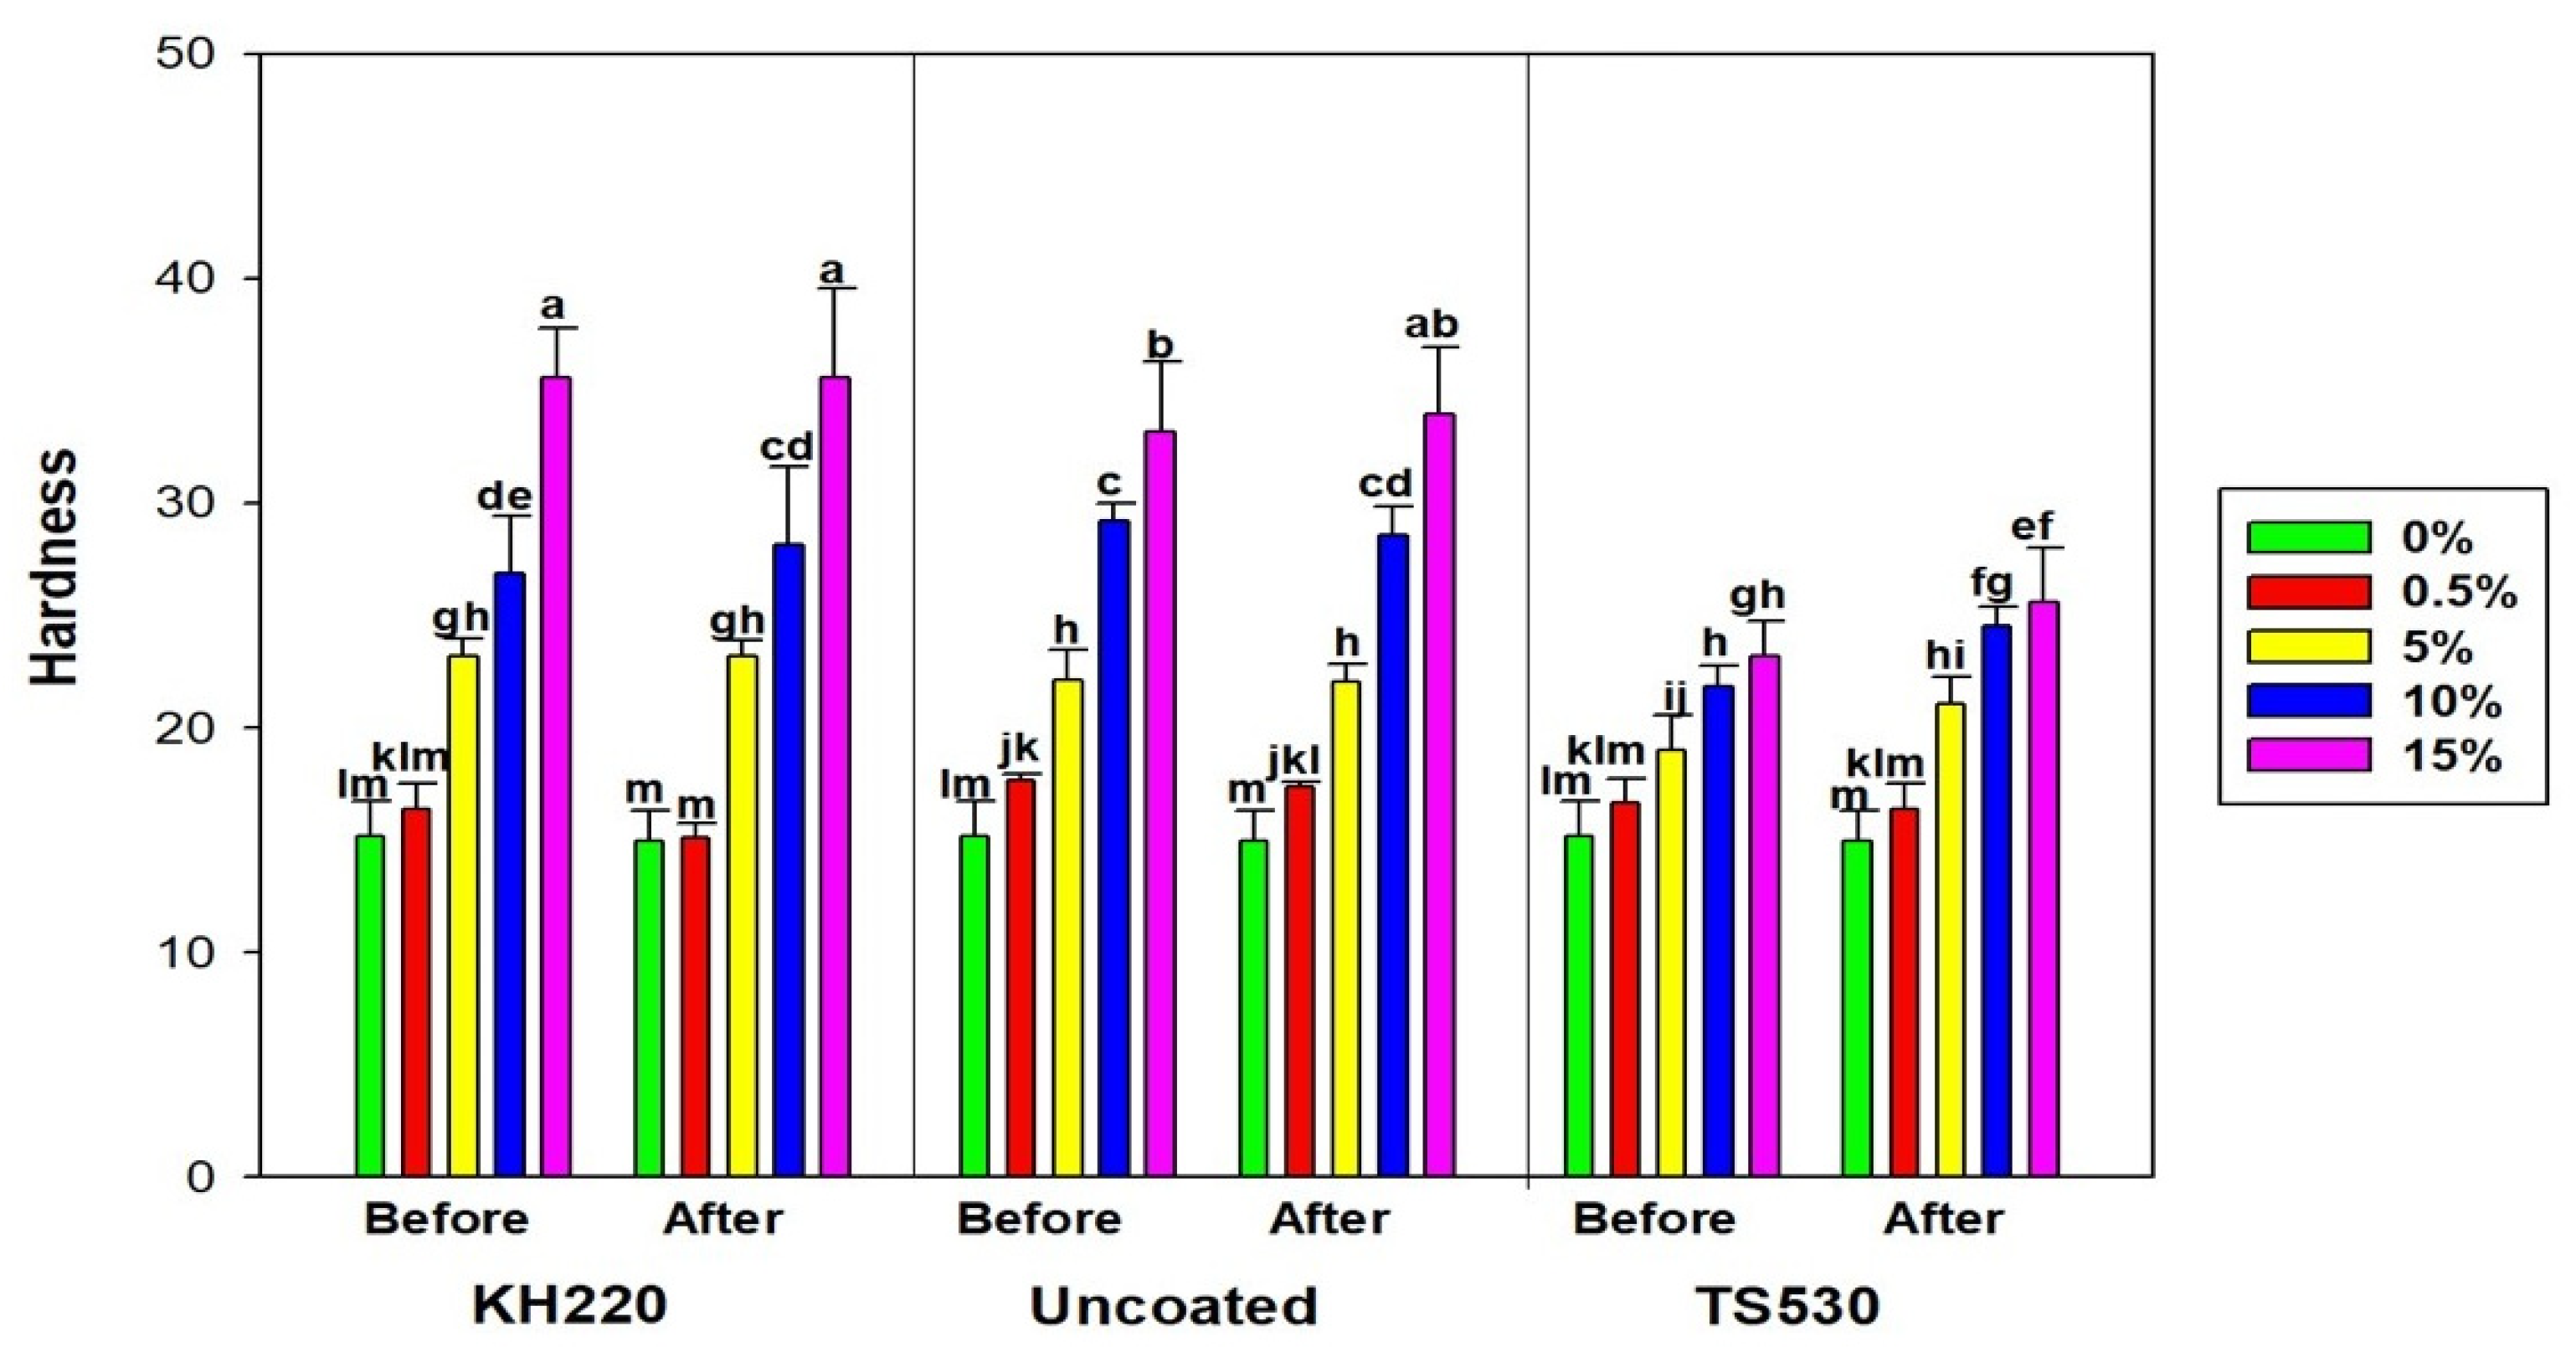
3.2.3. Shore a Durometer Hardness
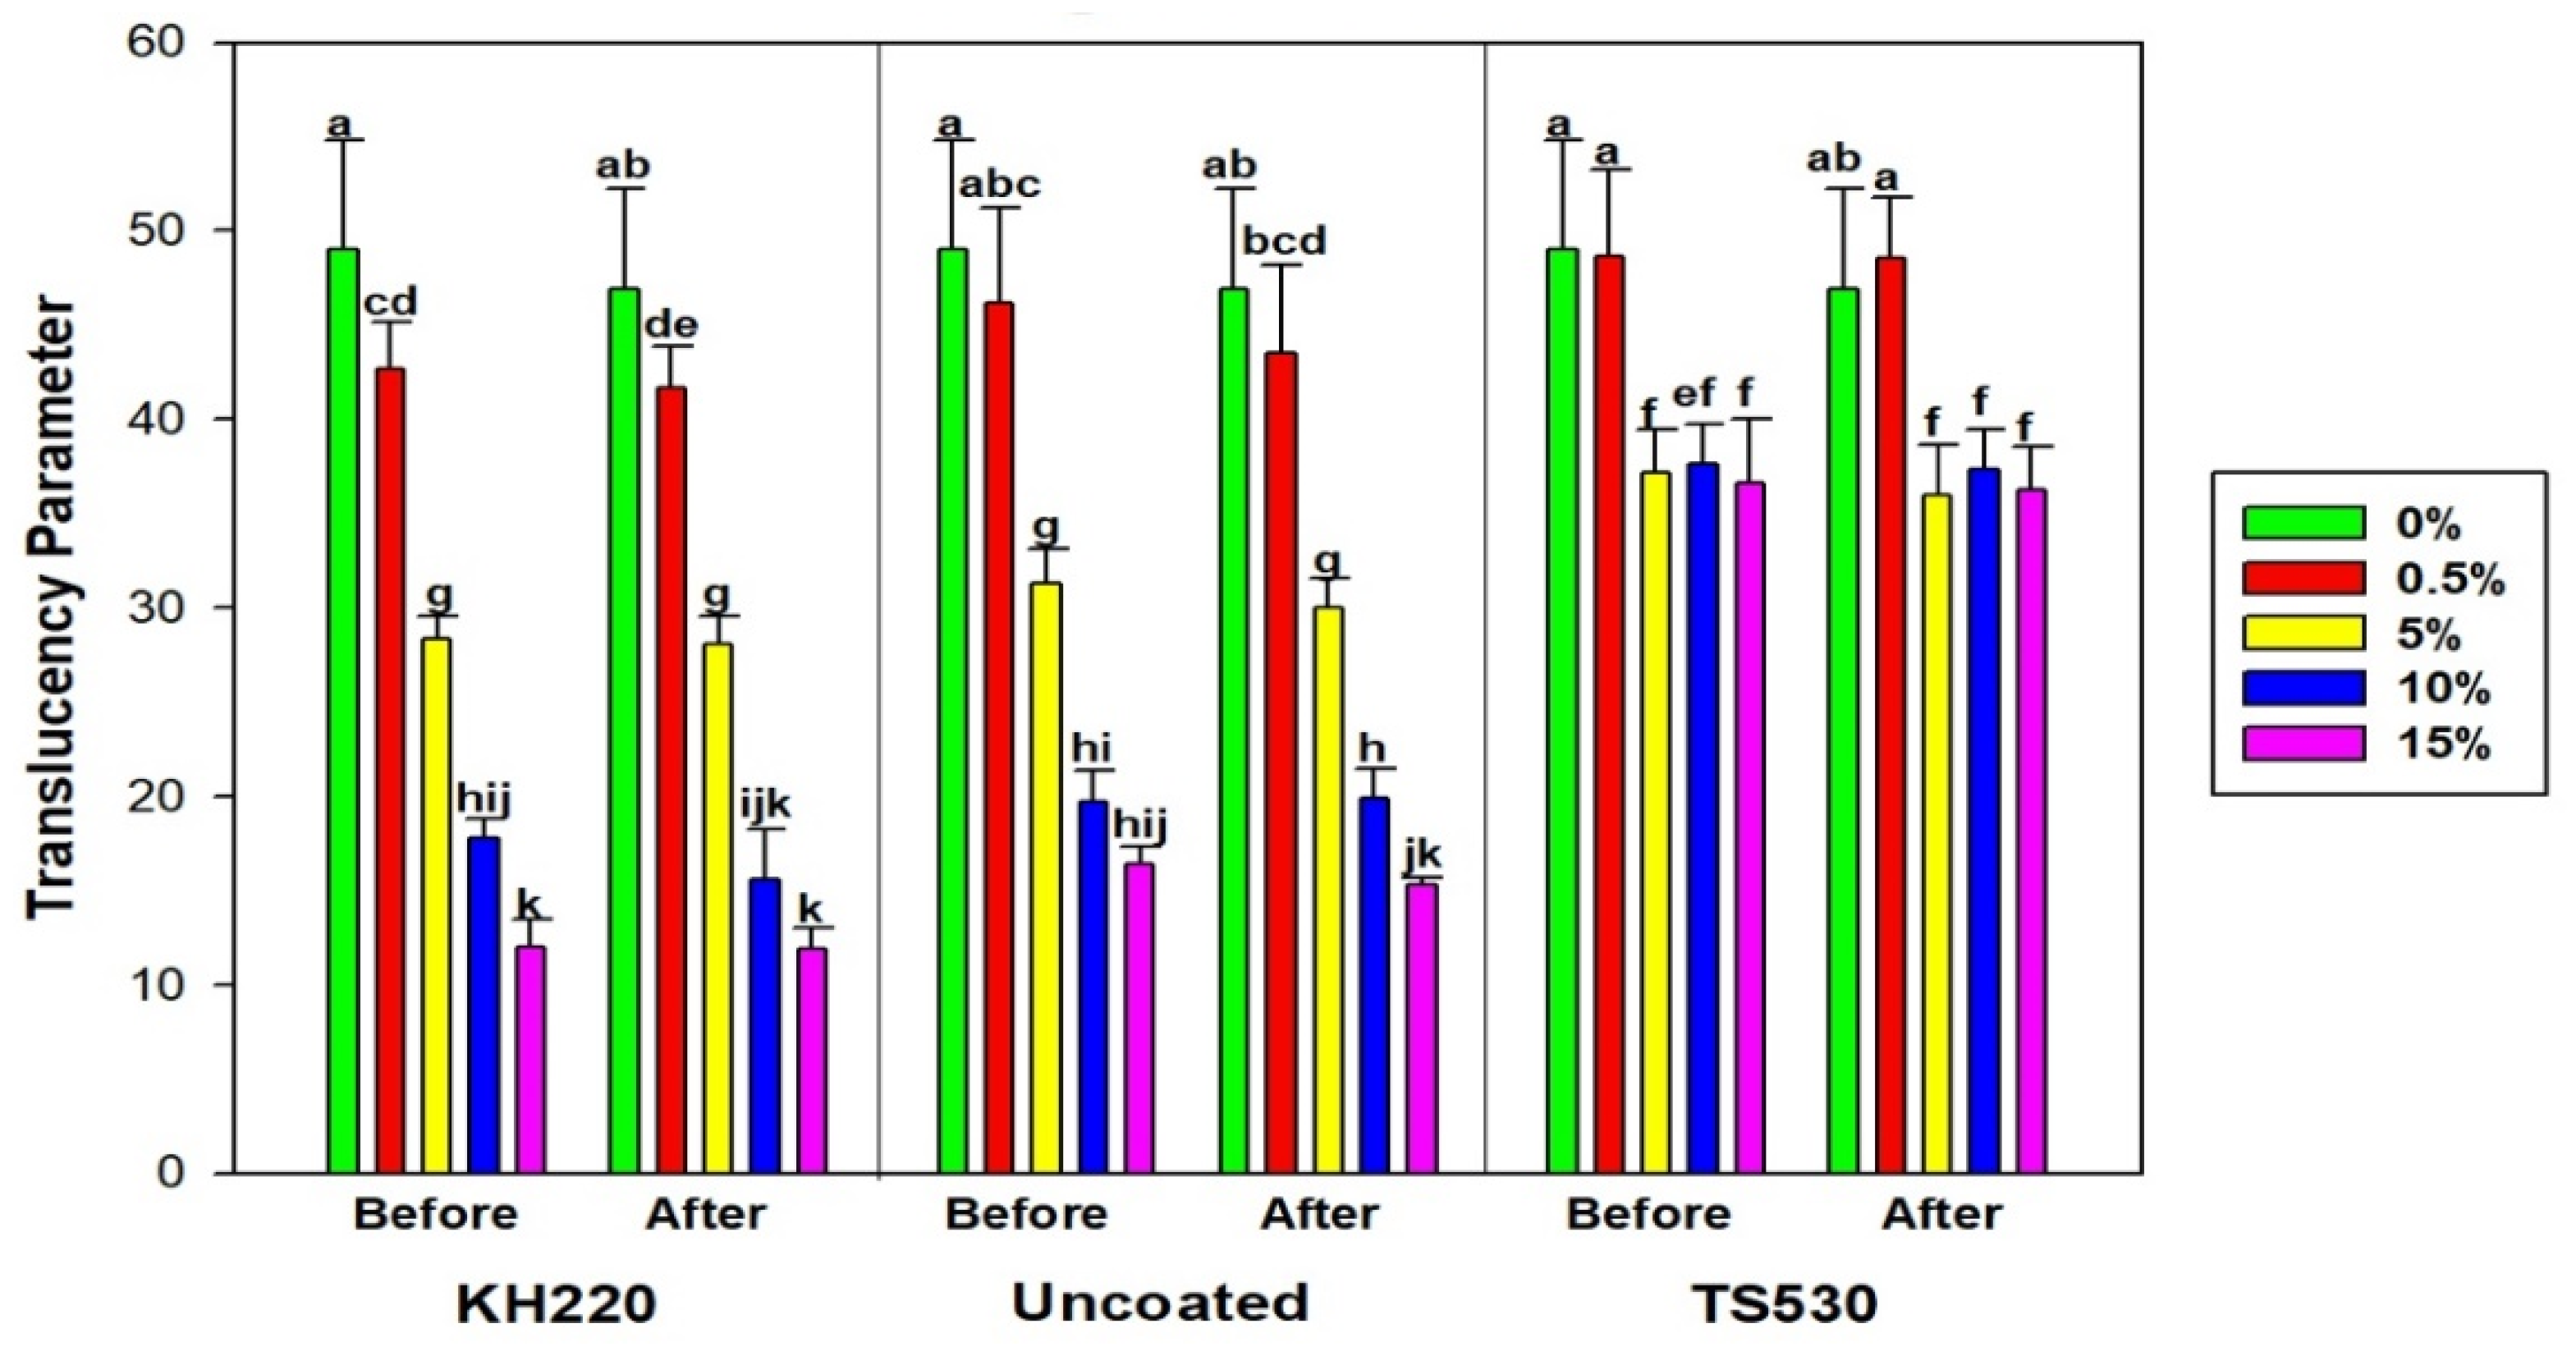
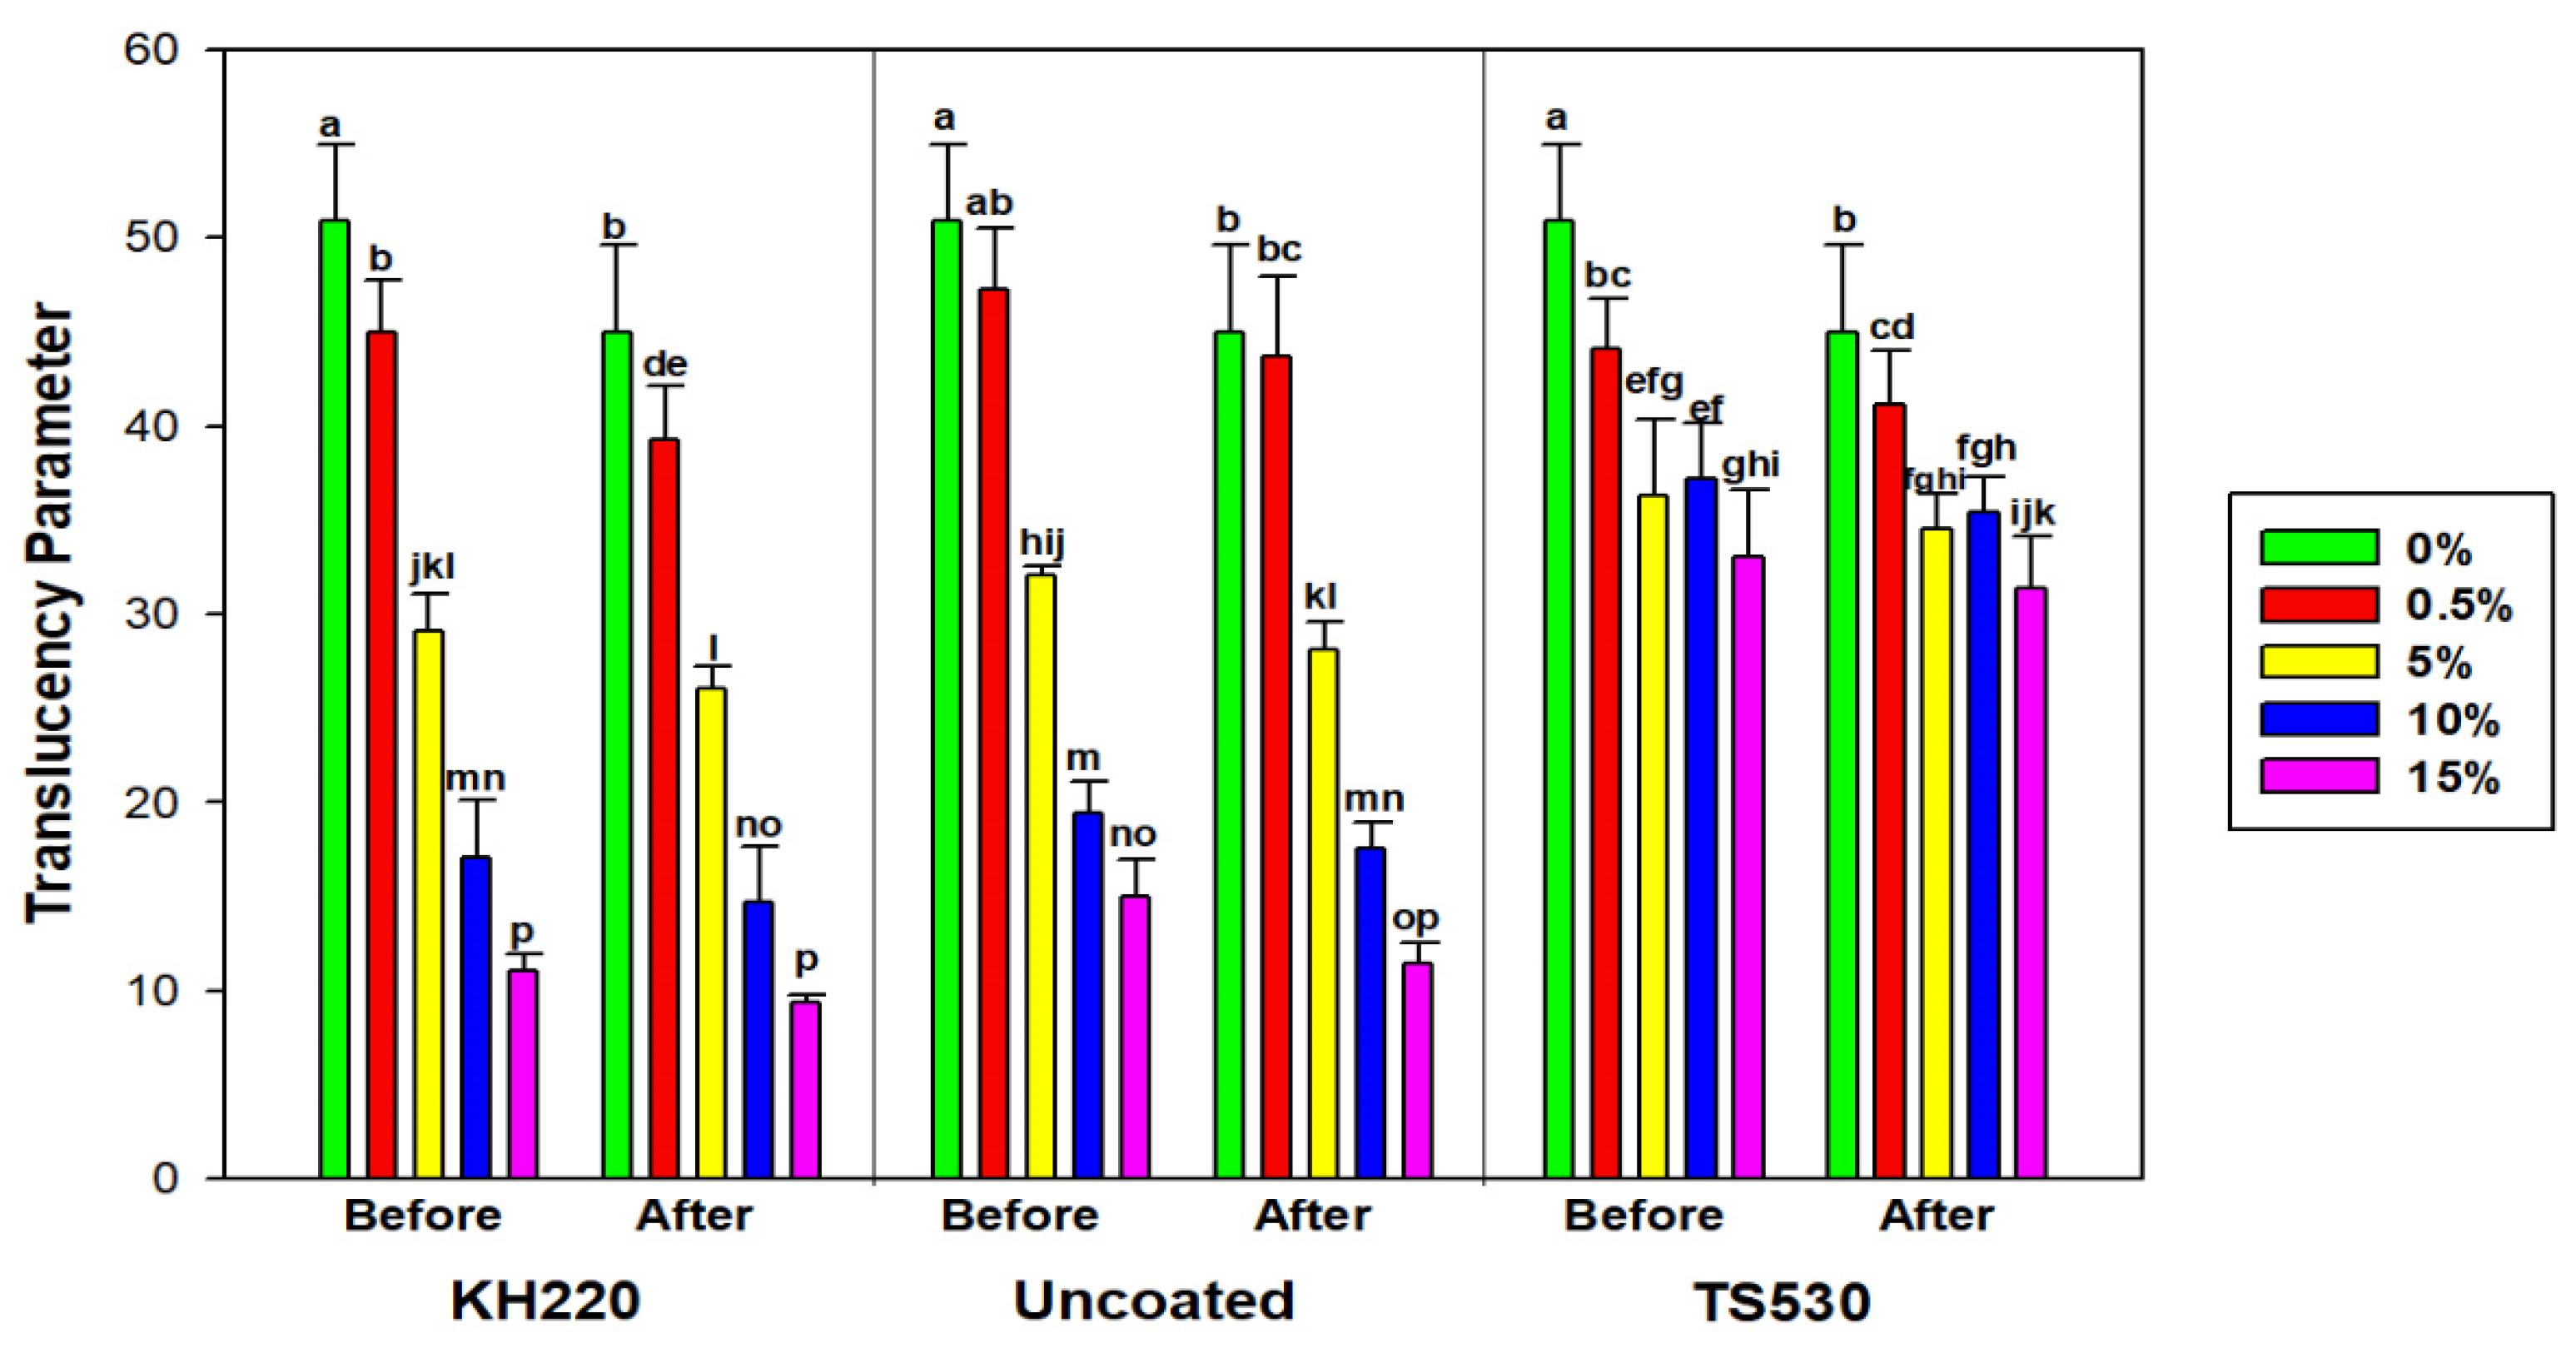
3.2.4. Translucency Parameter
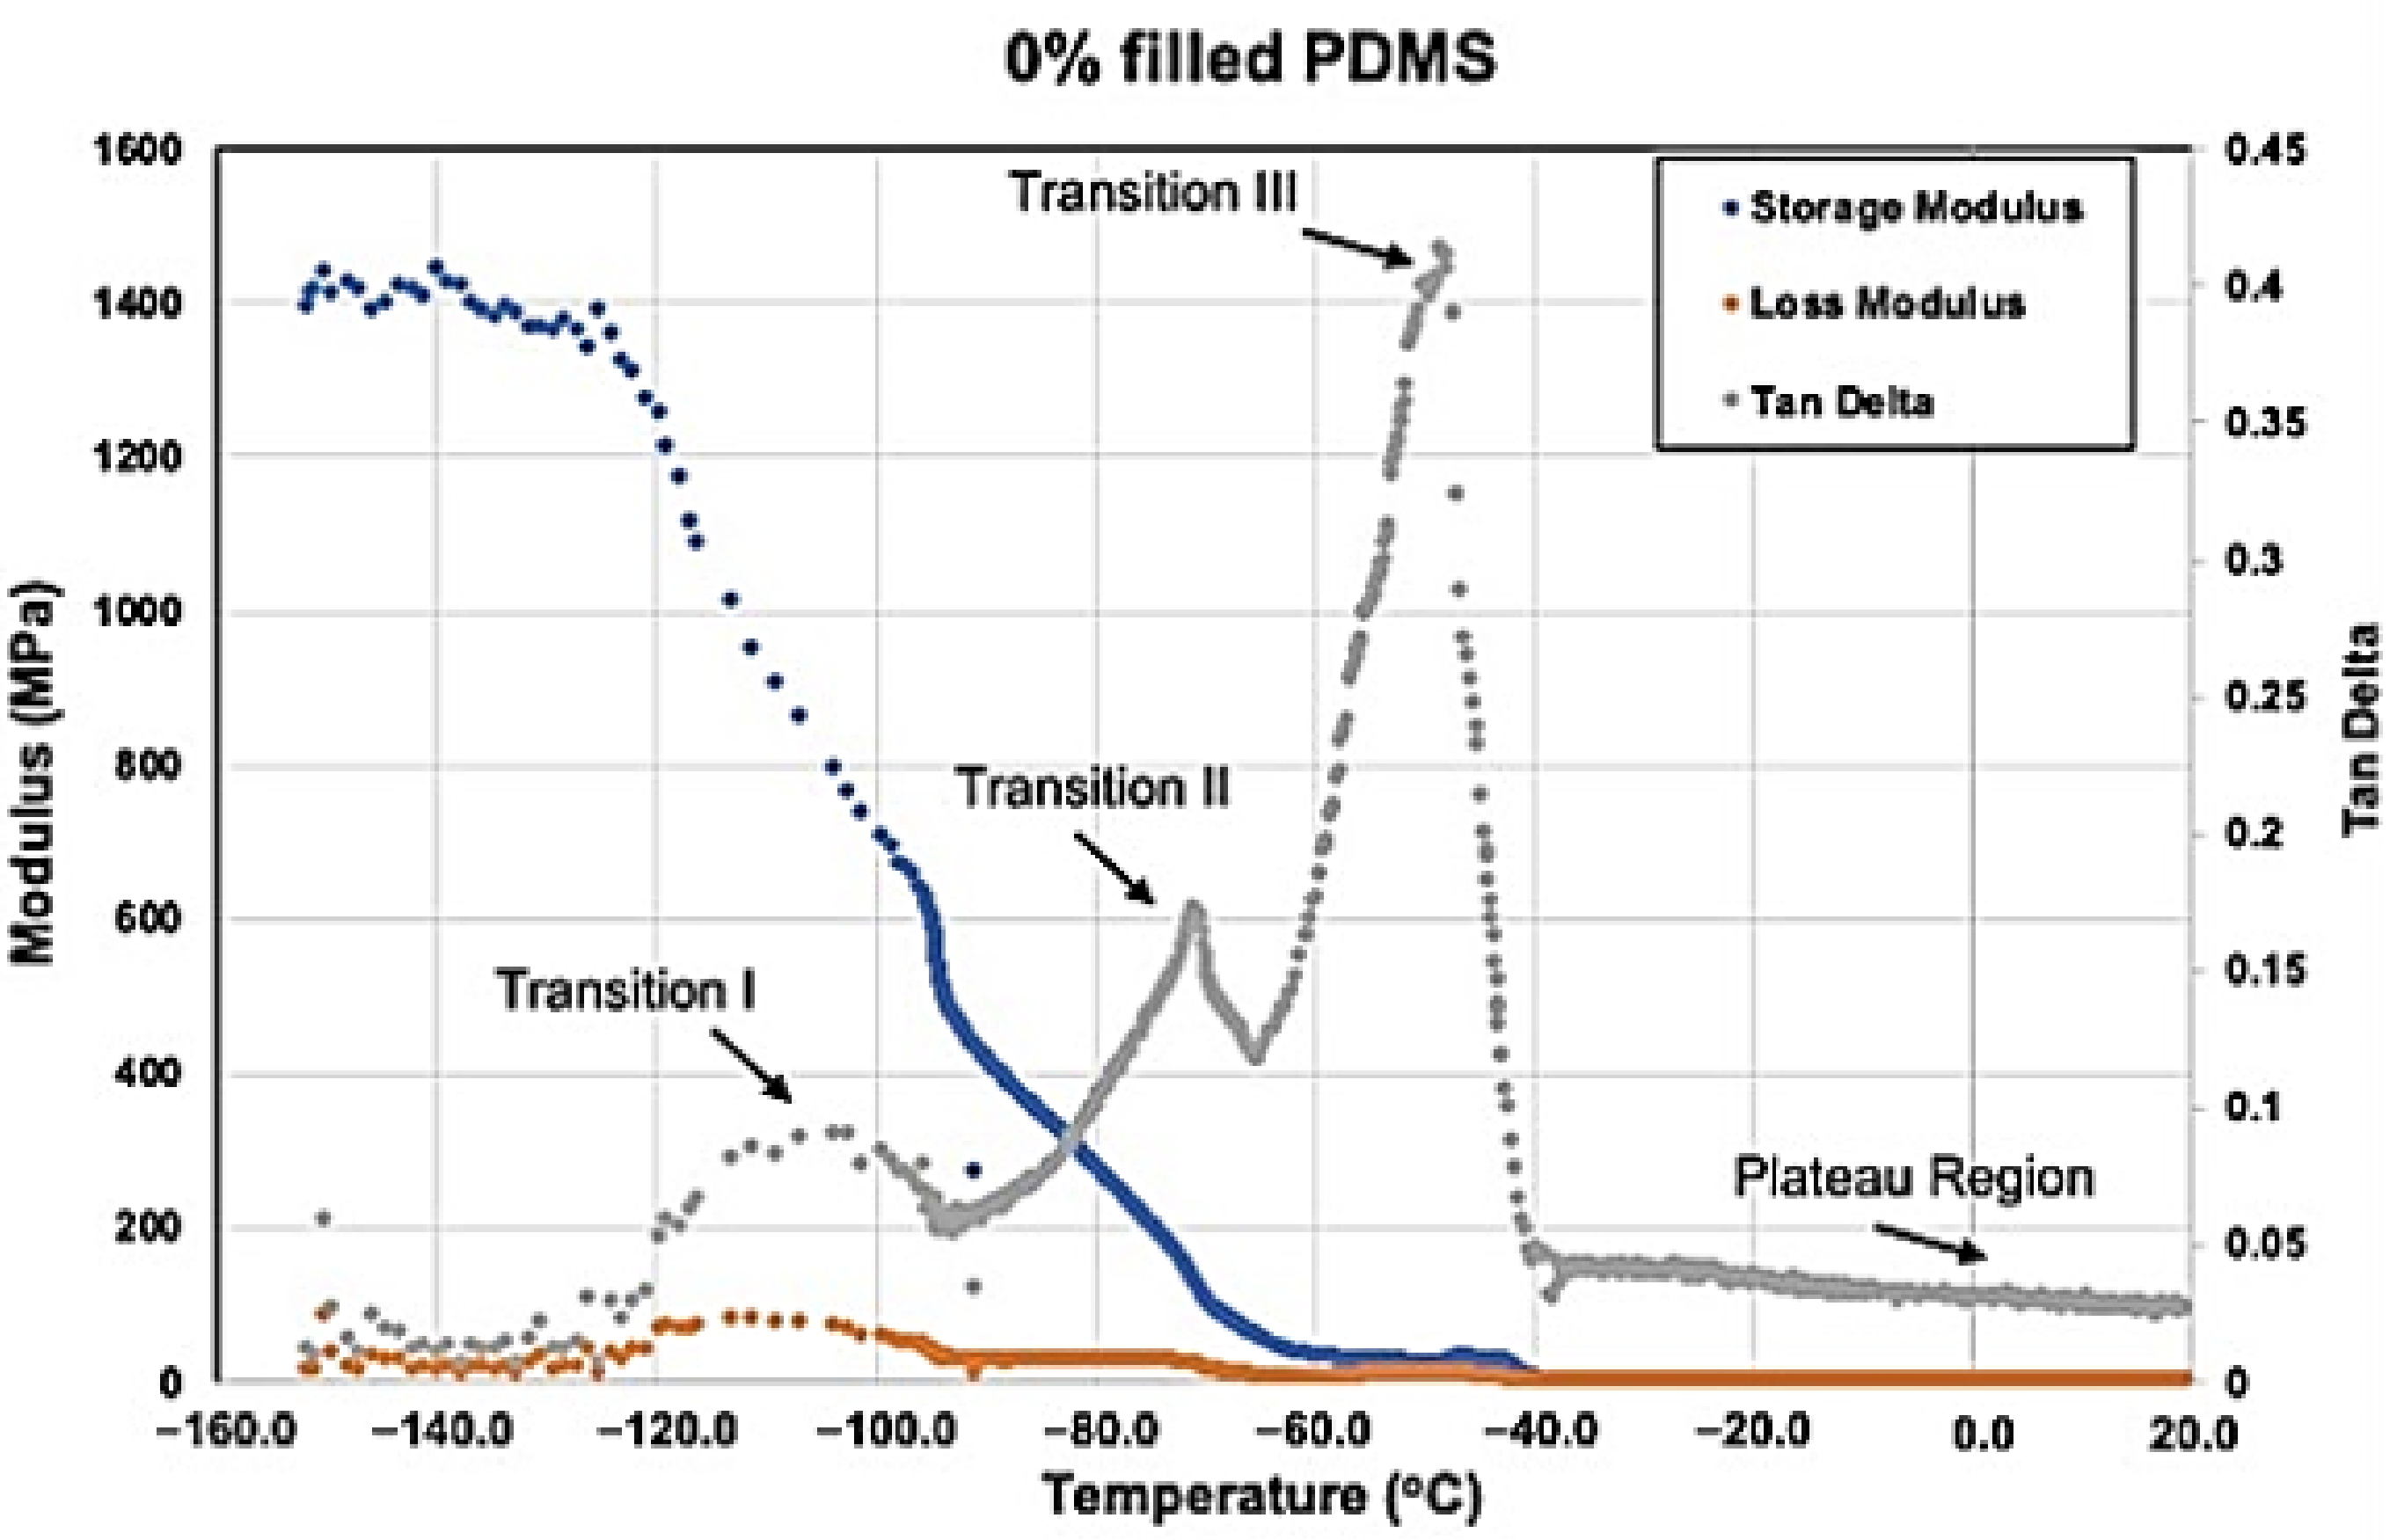
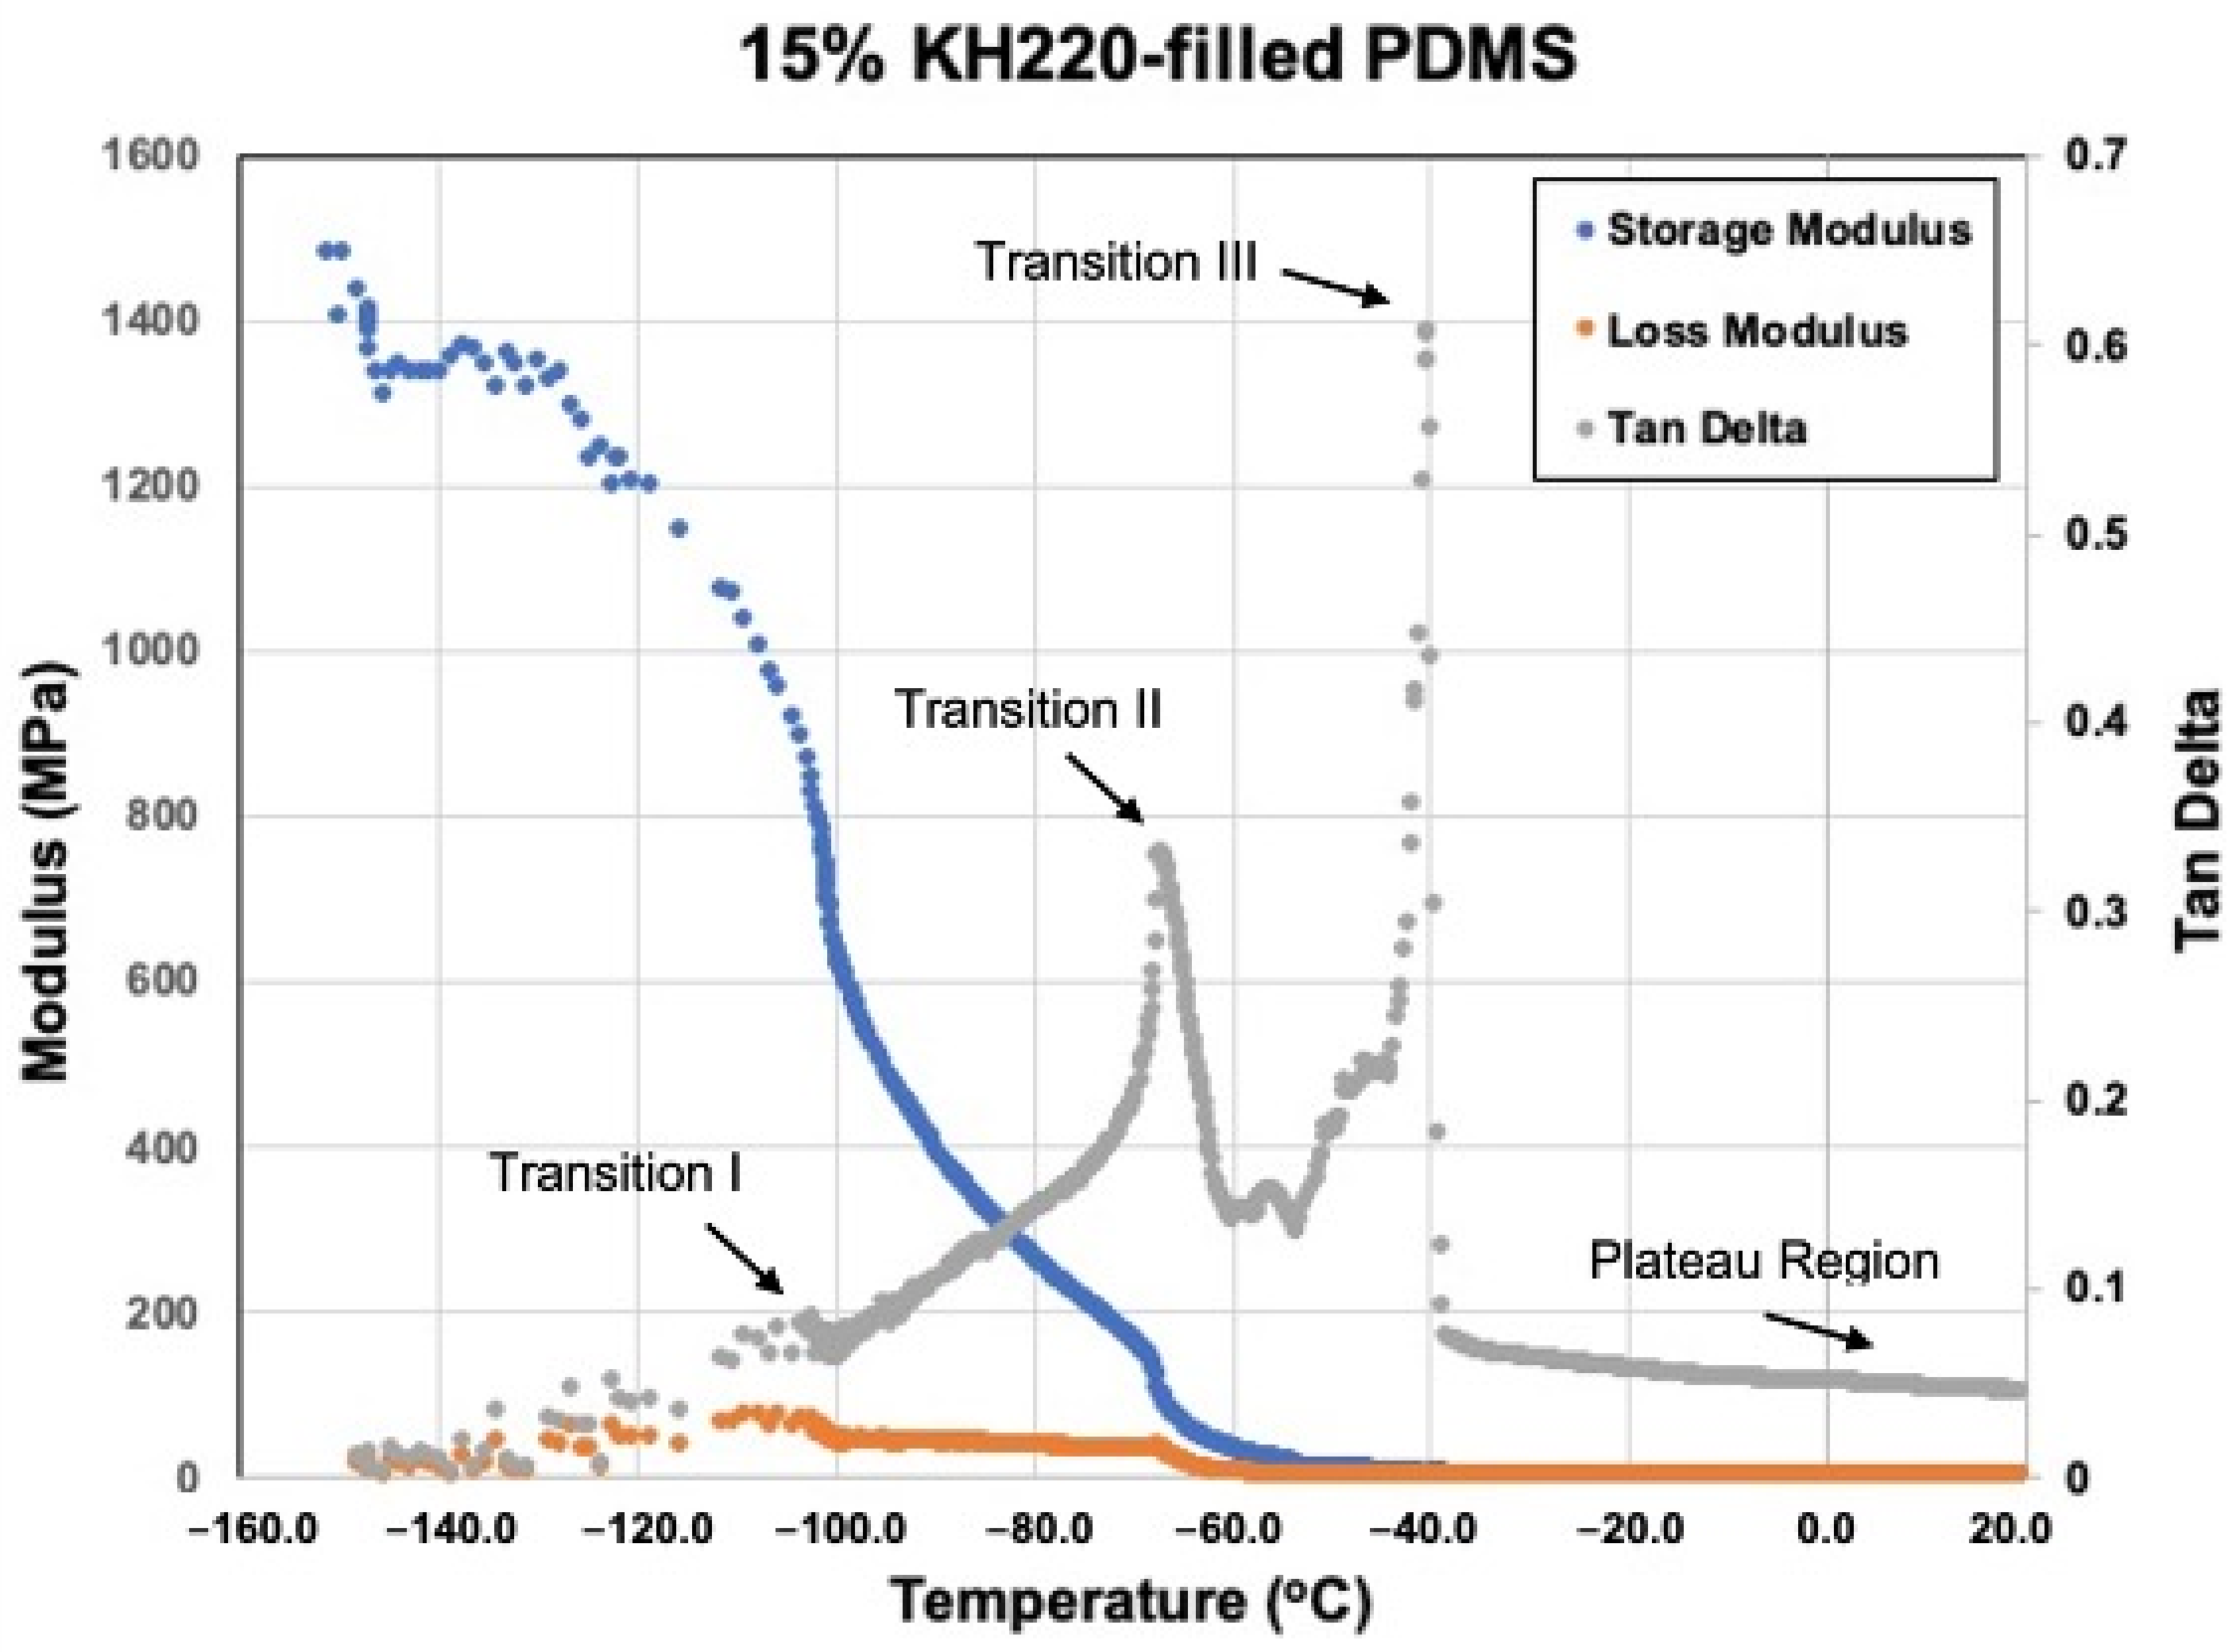
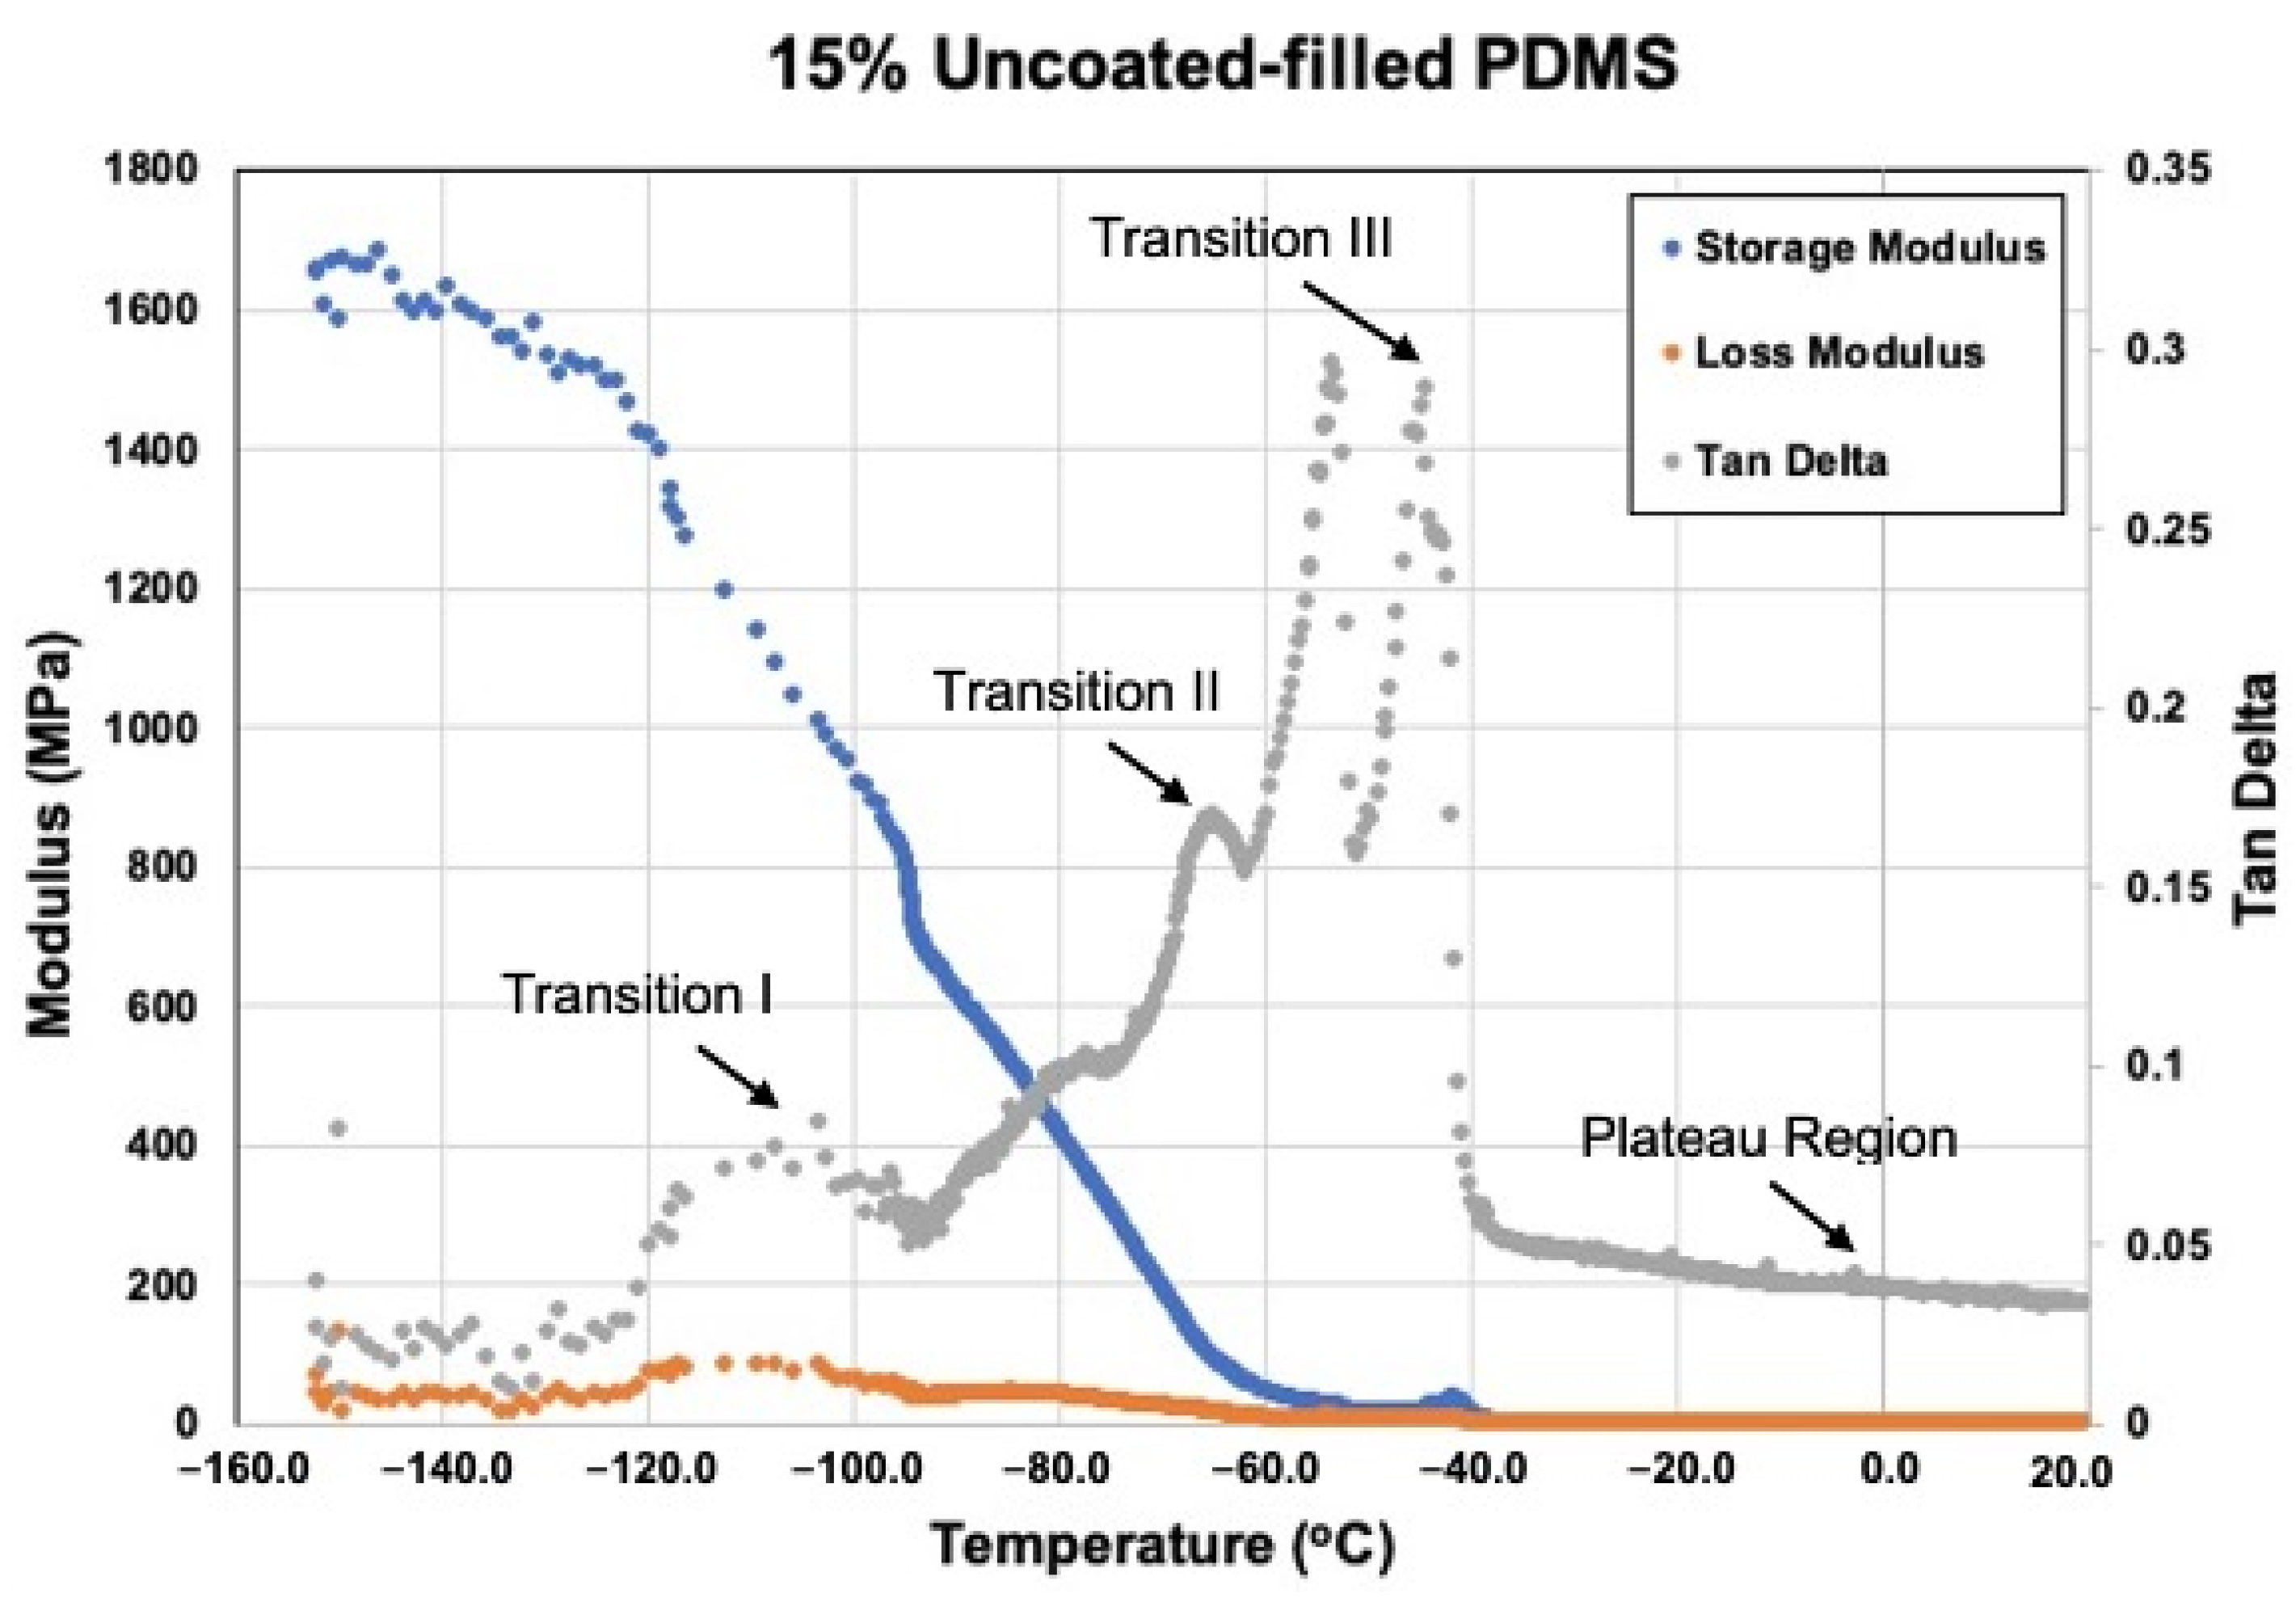
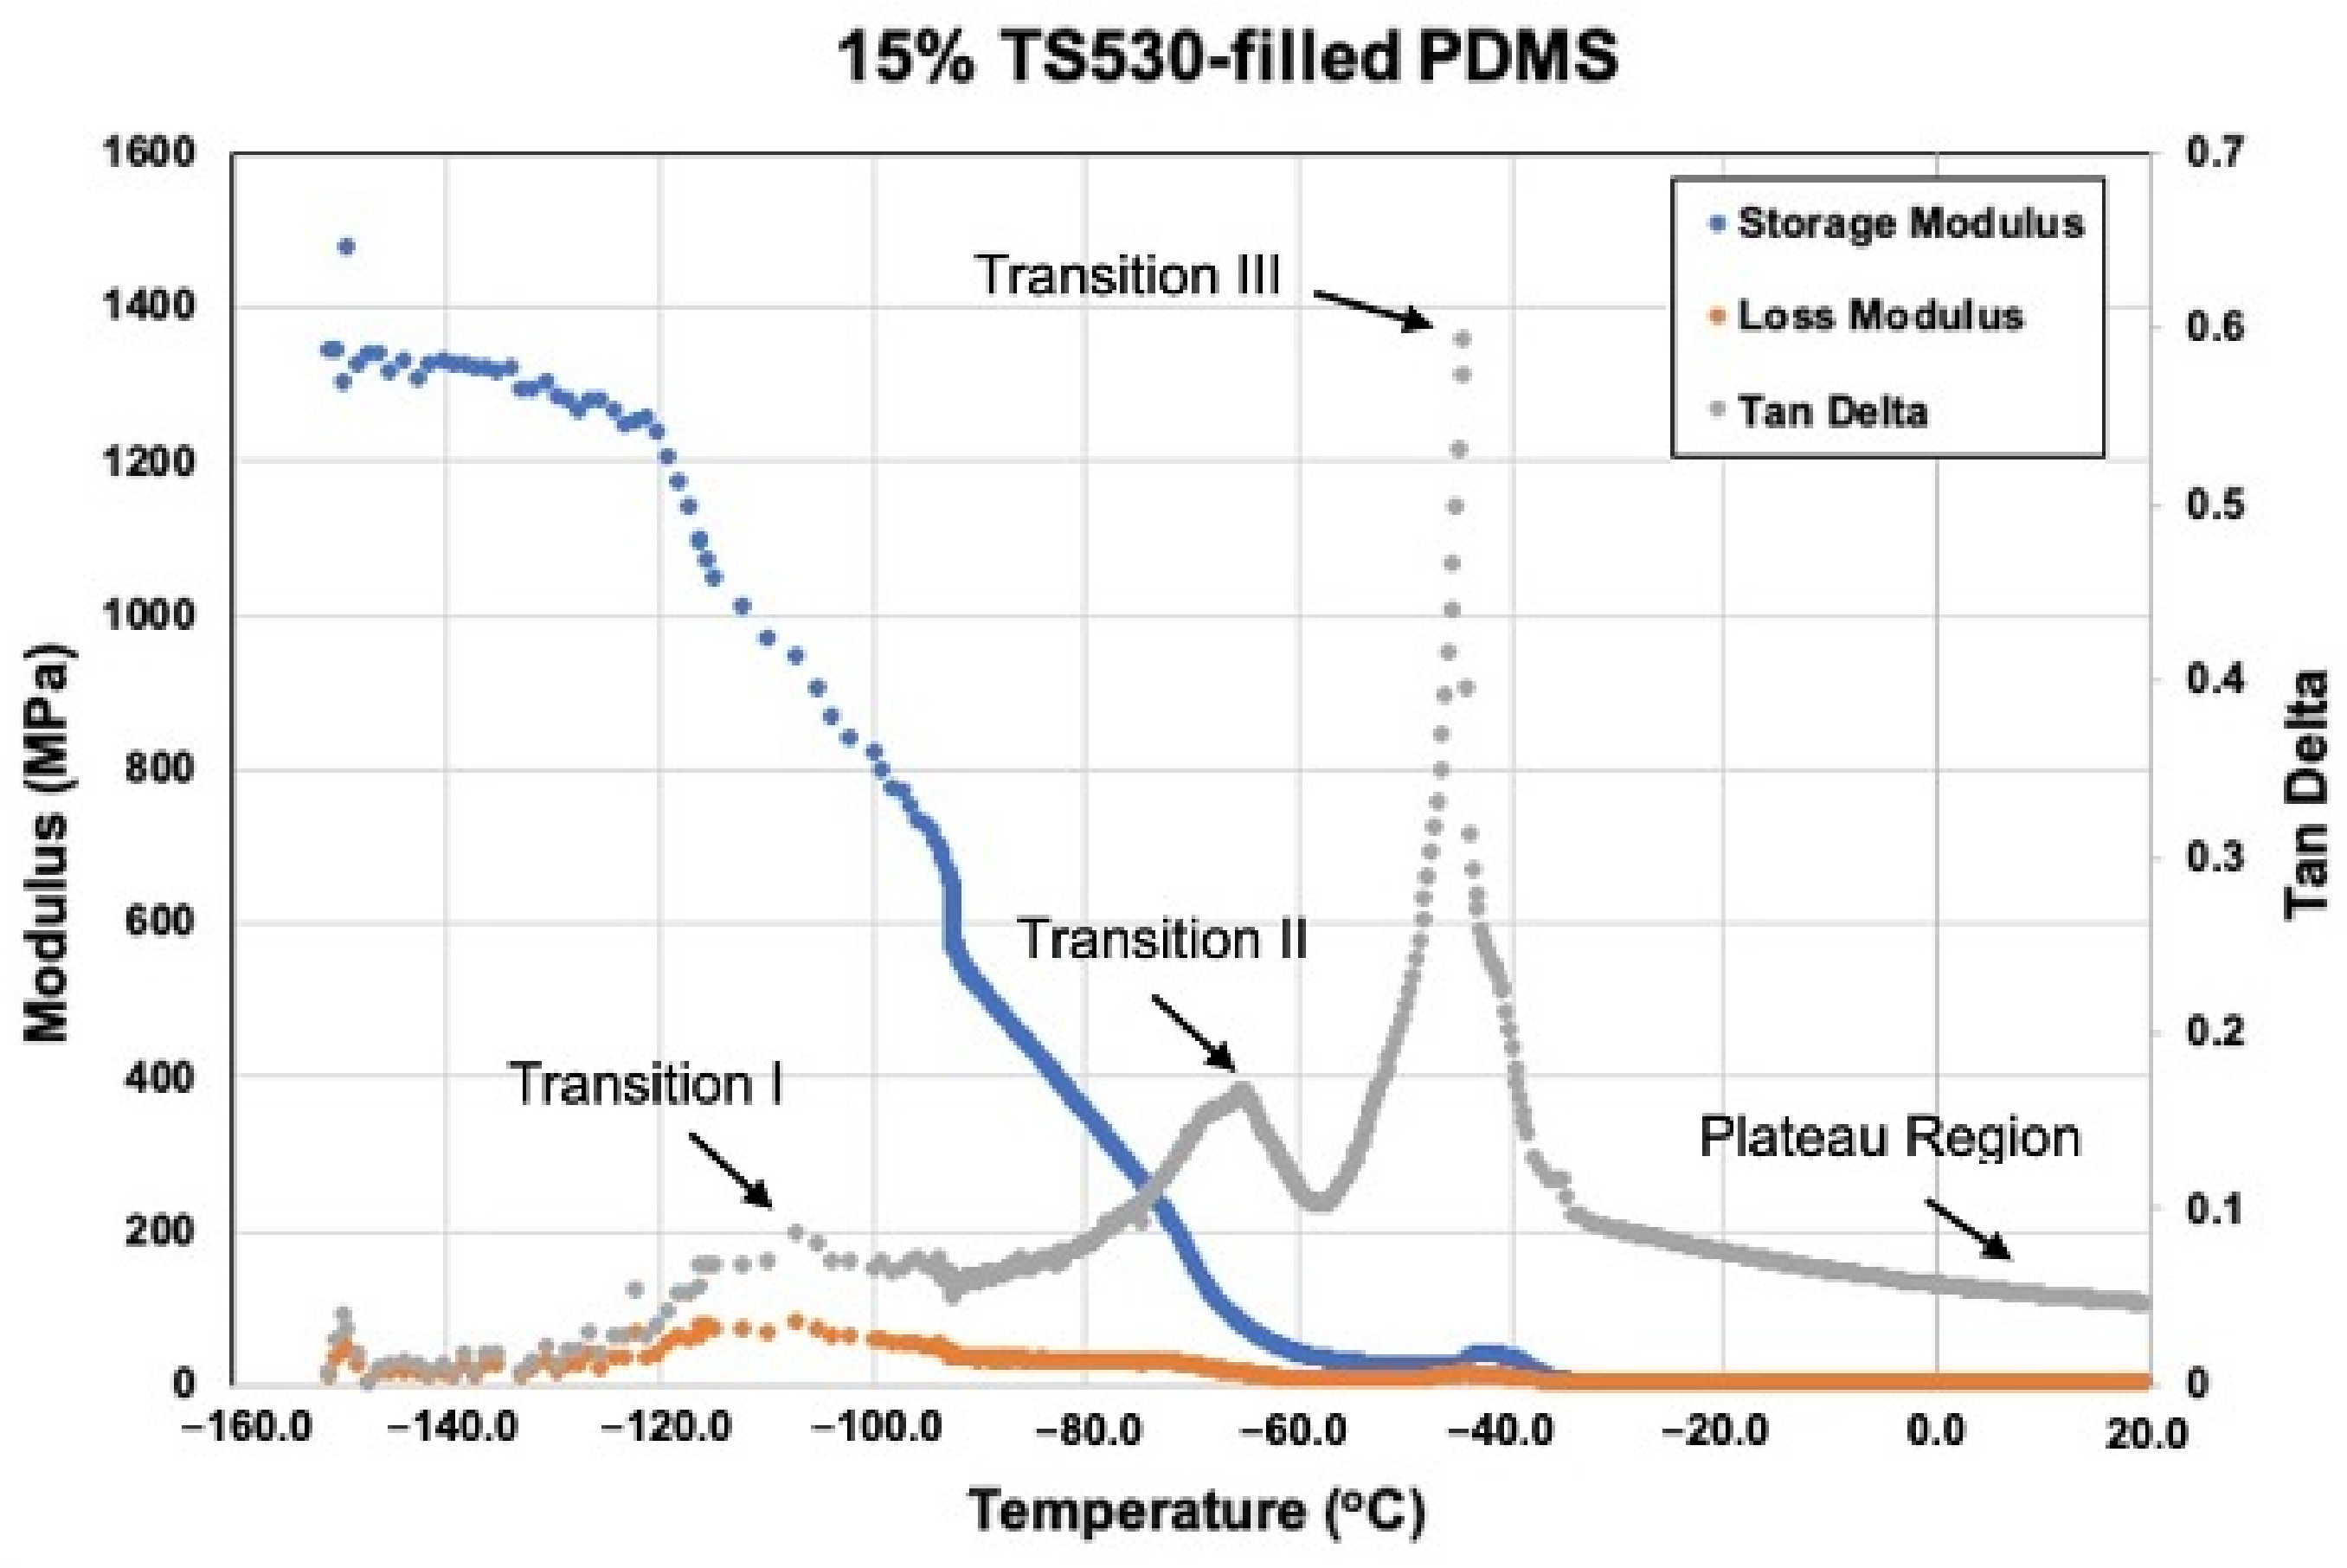
3.2.5. Viscoelastic Measurement
4. Discussion
4.1. Tensile and Tear Properties
4.2. Durometer Hardness
4.3. Translucency Parameter
4.4. Dynamic Mechanical Analysis (DMA)
5. Conclusions
Author Contributions
Funding
Institutional Review Board Statement
Informed Consent Statement
Data Availability Statement
Acknowledgments
Conflicts of Interest
References
- Lemon, J.C.; Kiat-Amnuay, S.; Gettleman, L.; Martin, J.W.; Chambers, M.S. Facial prosthetic rehabilitation: Preprosthetic surgical techniques and biomaterials. Cur. Opin. Otolaryngol. Head. Neck. Surg. 2005, 13, 255–262. [Google Scholar] [CrossRef] [PubMed] [Green Version]
- Thiele, O.C.; Brom, J.; Dunsche, A.; Ehrenfeld, M.; Federspil, P.; Frerich, B.; Hölzle, F.; Klein, M.; Kreppel, M.; Kübler, A.C.; et al. The current state of facial prosthetics—A multicenter analysis. J. Craniomaxillofac. Surg. 2015, 43, 1038–1041. [Google Scholar] [CrossRef] [PubMed]
- Chang, T.L.; Garrett, N.; Roumanas, E.; Beumer, J. Treatment satisfaction with facial prostheses. J. Prosthet. Dent. 2005, 94, 275–280. [Google Scholar] [CrossRef] [PubMed]
- Eleni, P.N.; Katsavou, I.; Krokida, M.K.; Polyzois, G.L.; Gettleman, L. Mechanical behavior of facial prosthetic elastomers after outdoor weathering. Dent. Mater. 2009, 25, 1493–1502. [Google Scholar] [CrossRef] [PubMed]
- Lai, J.H.; Wang, L.L.; Ko, C.C.; Delong, R.L.; Hodges, J.S. New organosilicon maxillofacial prosthetic materials. Dent. Mater. 2002, 18, 281–286. [Google Scholar] [CrossRef]
- Aziz, T.; Waters, M.; Jagger, R. Development of a New Poly(Dimethylsiloxane) Maxillofacial Prosthetic Material. J. Biomed. Mater. Res. B Appl. Biomater. 2003, 65, 252–261. [Google Scholar] [CrossRef]
- Nobrega, A.S.; Andreotti, A.M.; Moreno, A.; Sinhoreti, M.A.C.; dos Santos, D.M.; Goiato, M.C. Influence of adding nanoparticles on the hardness, tear strength, and permanent deformation of facial silicone subjected to accelerated aging. J. Prosthet. Dent. 2016, 116, 623–639. [Google Scholar] [CrossRef] [Green Version]
- Brandão, T.B.; Vechiato Filho, A.J.; de Souza Batista, V.E.; Prado Ribeiro, A.C.; Filho, H.N.; Chilvarquer, I.; Nunn, M.E.; Santos-Silva, A.R.; Barão, V.A.R.; Wee, A.G. Assessment of treatment outcomes for facial prostheses in patients with craniofacial defects: A pilot retrospective study. J. Prosthet. Dent. 2017, 118, 235–241. [Google Scholar] [CrossRef] [Green Version]
- Polyzois, G.L.; Eleni, P.N.; Krokida, M.K. Optical properties of pigmented polydimethylsiloxane prosthetic elastomers: Effect of “outdoor” and “indoor” accelerating aging. J. Craniofac. Surg. 2011, 22, 1574–1578. [Google Scholar] [CrossRef]
- Bellamy, K.; Limbert, G.; Waters, M.G.; Middleton, J. An elastomeric material for facial prostheses: Synthesis, experimental and numerical testing aspects. Biomaterial 2003, 24, 5061–5066. [Google Scholar] [CrossRef]
- Tetteh, S.; Bibb, R.J.; Martin, S.J. Maxillofacial prostheses challenges in resource constrained regions. Disabil. Rehabil. 2019, 41, 348–356. [Google Scholar] [CrossRef] [PubMed] [Green Version]
- Goiato, M.C.; Haddad, M.F.; CSinhoreti, M.A.; dos Santos, D.M.; Pesqueira, A.A.; Moreno, A. Influence of opacifiers on dimensional stability and detail reproduction of maxillofacial silicone elastomer. Biomed. Eng. Online 2010, 9, 85. [Google Scholar] [CrossRef] [Green Version]
- Duevel, D.; Beatty, M.; Simetich, B. Coated nanoparticles and polymer molecular weight- effects on PDMS properties. J. Dent. Res. 2015, 94, S3568. [Google Scholar]
- Zayed, S.M.; Alshimy, A.M.; Fahmy, A.E. Effect of surface treated silicon dioxide nanoparticles on some mechanical properties of maxillofacial silicone elastomer. Int. J. Biomater. 2014, 2014, 750398. [Google Scholar] [CrossRef]
- Xie, J.; Hu, J.; Lin, X.; Fang, L.; Wu, F.; Liao, X.; Luo, H.; Shi, L. Robust and anti-corrosive PDMS/SiO2 superhydrophobic coatings fabricated on magnesium alloys with different-sized SiO2 nanoparticles. Appl. Surf. Sci. 2018, 457, 870–880. [Google Scholar] [CrossRef]
- Arkles, B. Hydrophobicity, hydrophilicity and silanes. Paint. Coat. Ind. 2006, 22, 114. [Google Scholar]
- Chang, F.M.; Hong, S.J.; Sheng, Y.J.; Tsao, H.K. High contact angle hysteresis of superhydrophobic surfaces: Hydrophobic defects. Appl. Phys. Let. 2009, 95, 064102. [Google Scholar] [CrossRef]
- Meroni, D.; Ardizzone, S.; Cappelletti, G.; Ceotto, M.; Ratti, M.; Annunziata, R. Interplay between chemistry and texture in hydrophobic TiO2 hybrids. J. Phys. Chem. 2011, 115, 18649–18658. [Google Scholar] [CrossRef]
- Willett, E.S.; Beatty, M.W. Outdoor weathering of facial prosthetic elastomers differing in Durometer hardness. J. Prosthet. Dent. 2015, 113, 228–235. [Google Scholar] [CrossRef]
- ASTM D2240-05; Standard Test Method for Rubber Property—Durometer Hardness 1. ASTM International: West Conshohocken, PA, USA, 2005.
- Hu, X.; Johnston, W.M. Concentration additivity of coefficients for maxillofacial elastomer pigmented to skin colors. Dent. Mater. 2009, 25, 1468–1473. [Google Scholar] [CrossRef]
- Menard, K. An Introduction to Dynamic Mechanical Analysis. In Dynamic Mechanical Analysis; CRC Press: Boca Raton, FL, USA, 2008. [Google Scholar]
- Beatty, M.W.; Swartz, M.L.; Moore, B.K.; Phillips, R.W.; Roberts, T.A. Effect of microfiller fraction and silane treatment on resin composite properties. J. Biomed. Mater. Res. 1998, 40, 12–23. [Google Scholar] [CrossRef]
- Germain, H.S.; Swartz, M.L.; Phillips, R.W.; Moore, B.K.; Roberts, T.A. Properties of Microfilled Composite Resins as Influenced by Filler Content. J. Dent. Res. 1985, 64, 155–160. [Google Scholar] [CrossRef]
- Tukmachi, M.S.; MAli, M.M. Effect of Nano Silicon Dioxide Addition on Some Properties of Heat Vulcanized Maxillofacial Silicone Elastomer. IOSR J. Pharm. Biol. Sci. 2017, 12, 37–43. [Google Scholar] [CrossRef]
- Jansen, J.A. Characterization of Plastics in Failure Analysis; ASM International Materials Park: Novelty, OH, USA, 2002; Volume 2002, pp. 437–459. [Google Scholar]
- Liu, J.; Wu, S.; Zou, M.; Zheng, X.; Cai, Z. Surface modification of silica and its compounding with polydimethylsiloxane matrix: Interaction of modified silica filler with PDMS. Iran. Polym. J. 2012, 21, 9. [Google Scholar] [CrossRef]
- Polmanteer, K.E. Advances in Silicone Rubber Technology: Part I. In Handbook of Elastomers; CRC Press: Boca Raton, FL, USA, 2020; pp. 1944–1986. [Google Scholar]
- Camenzind, A.; Schweizer, T.; Sztucki, M.; Pratsinis, S.E. Structure & strength of silica-PDMS nanocomposites. Polymer 2010, 51, 1776–1804. [Google Scholar]
- Rothon, R.N. Particulate-Filled Polymer Composites, 2nd ed.; Smithers Rapra Technology: Shrewsbury, UK, 2003. [Google Scholar]
- Fu, S.Y.; Feng, X.Q.; Lauke, B.; Mai, Y.W. Effects of particle size, particle/matrix interface adhesion and particle loading on mechanical properties of particulate-polymer composites. Compos. B Eng. 2008, 39, 933–961. [Google Scholar] [CrossRef]
- Nie, Y.; Gu, Z.; Wei, Y.; Hao, T.; Zhou, Z. Features of strain-induced crystallization of natural rubber revealed by experiments and simulations. Polym. J. 2017, 49, 309–317. [Google Scholar] [CrossRef]
- Chien, A.; Maxwell, R.S.; Deteresa, S.; Thompson, L.; Cohenour, R.; Balazs, B. Effects of filler-polymer interactions on cold-crystallization kinetics in crosslinked, silica-filled polydimethylsiloxane/polydiphenylsiloxane copolymer melts. J. Polym. Sci. B Polym. Physic 2006, 44, 1898–1906. [Google Scholar] [CrossRef]
- Zhuravlev, L.T. The surface chemistry of amorphous silica. Zhuravlev model. Coll. Surfac. A Physicochem. Eng. Asp. 2000, 173, 1–38. [Google Scholar] [CrossRef] [Green Version]
- Choi, S.S.; Nah, C.; Lee, S.G.; Joo, C.W. Effect of filler-filler interaction on rheological behaviour of natural rubber compounds filled with both carbon black and silica. Polym. Int. 2003, 52, 23–28. [Google Scholar] [CrossRef]
- Rahman, I.A.; Padavettan, V. Synthesis of Silica nanoparticles by Sol-Gel: Size-dependent properties, surface modification, and applications in silica-polymer nanocompositesa review. J. Nanomater. 2012, 2012, 132424. [Google Scholar] [CrossRef] [Green Version]
- Ray, S.; Bhowmick, A.K. Influence of untreated and novel electron beam modified surface coated silica filler on dynamic mechanical thermal properties of ethylene-octene copolymer. Polymer. Eng. Sci. 2004, 44, 2453–2459. [Google Scholar] [CrossRef]
- Waters, M.G.J.; Jagger, R.G.; Winter, R.W. Effect of surface modified fillers on the water absorption of a (RTV) silicone denture soft lining material. J. Dent. 1996, 24, 297–300. [Google Scholar] [CrossRef]
- Mohammed, M.I.; Tatineni, J.; Cadd, B.; Peart, G.; Gibson, I. Applications of 3D topography scanning and multi-material additive manufacturing for facial prosthesis development and production. In Proceedings of the 2016 International Solid Freeform Fabrication Symposium, Austin, TX, USA, 8–10 August 2016. [Google Scholar]
- Ozdemir, N.G.; Zhang, T.; Aspin, I.; Scarpa, F.; Hadavinia, H.; Song, Y. Toughening of carbon fibre reinforced polymer composites with rubber nanoparticles for advanced industrial applications. Exp. Polymer. Lett. 2016, 10, 394–407. [Google Scholar] [CrossRef]
- Jim Curtis, A.C. Silicone Biomaterials: History and Chemistry and Medical Applications of Silicone. Biomater. Sci. 2004, 20, 80–85. [Google Scholar]
- Cottin, H.; Gazeau, M.C.; Doussin, J.F.; Raulin, F. An experimental study of the photodegradation of polyoxymethylene at 122, 147 and 193 nm. J. Photochem. Photobiol. A Chem. 2000, 135, 53–64. [Google Scholar] [CrossRef]
- Hatamleh, M.M.; Watts, D.C. Mechanical properties and bonding of maxillofacial silicone elastomers. Dent. Mater. 2010, 26, 185–191. [Google Scholar] [CrossRef]
- Eleni, P.N.; Krokida, M.; Polyzois, G.; Gettleman, L.; Bisharat, G.I. Effects of outdoor weathering on facial prosthetic elastomers. Odontology 2011, 99, 68–76. [Google Scholar] [CrossRef]
- Son, S.A.; Park, J.K.; Seo, D.G.; Ko, C.C.; Kwon, Y.H. How light attenuation and filler content affect the microhardness and polymerization shrinkage and translucency of bulk-fill composites? Clin. Oral. Investig. 2017, 21, 559–565. [Google Scholar] [CrossRef]
- Paravina, R.D.; Pérez, M.M.; Ghinea, R. Acceptability and perceptibility thresholds in dentistry: A comprehensive review of clinical and research applications. J. Esth. Rest. Dent. 2019, 31, 103–112. [Google Scholar] [CrossRef]
- Lee, Y.K. Influence of filler on the difference between the transmitted and reflected colors of experimental resin composites. Dent. Mater. 2008, 24, 1142–1147. [Google Scholar] [CrossRef] [PubMed]
- Bosq, N.; Guigo, N.; Persello, J.; Sbirrazzuoli, N. Melt and glass crystallization of PDMS and PDMS silica nanocomposites. Phys. Chem. 2014, 16, 7830–7840. [Google Scholar] [CrossRef] [PubMed]


| Materials | Manufacturers |
|---|---|
| V2K Vinyl-Terminated PDMS | Momentive Materials, Tarrytown, NY, USA |
| 15 nm Dimethoxydiphenylsilane-coated nano-SiO2 (KH220) | US Research Nanomaterials, Inc., Houston, TX, USA |
| 15 nm Uncoated nano-SiO2 | US Research Nanomaterials, Inc., Houston, TX, USA |
| 200 nm Hexamethyldisilazane-coated SiO2 (TS530) | Cabot Corporation, Boston, MA, USA |
| V-XL crosslinker | Momentive Materials, Tarrytown, NY, USA |
| 10 ppm Platinum catalyst | Momentive Materials, Tarrytown, NY, USA |
| Two-Way ANOVA of Transition I | |||||
| Source | DF | Sum of Square | Mean Square | F Value | Pr > F |
| Filler Type | 2 | 15.25911111 | 7.62955556 | 4.21 | 0.0245 |
| Weight Percent | 4 | 47.53688889 | 11.88422222 | 6.55 | 0.0006 |
| Weight Percent × Filler Type | 8 | 14.46977778 | 1.80872222 | 1.00 | 0.4582 |
| Two-Way ANOVA of Transition II | |||||
| Source | DF | Sum of Square | Mean Square | F Value | Pr > F |
| Filler Type | 2 | 274.3093333 | 137.1546667 | 3.35 | 0.0487 |
| Weight Percent | 4 | 649.1475556 | 162.2868889 | 3.96 | 0.0107 |
| Weight Percent × Filler Type | 8 | 386.3617778 | 48.2952222 | 1.18 | 0.3438 |
| Two-Way ANOVA of Transition III | |||||
| Source | DF | Sum of Square | Mean Square | F Value | Pr > F |
| Filler Type | 2 | 299.377333 | 149.688667 | 0.79 | 0.4614 |
| Weight Percent | 4 | 1196.134667 | 299.033667 | 1.59 | 0.2036 |
| Weight Percent × Filler Type | 8 | 1492.509333 | 186.563667 | 0.99 | 0.4637 |
| Filler Type | Weight Percent | Transition I (°C) Mean ± SE | Transition II (°C) Mean ± SE | Transition III (°C) Mean ± SE |
|---|---|---|---|---|
| 0 | −103.3 ± 0.64 D | −67.6 ± 3.57 A | −47.0 ± 4.78 | |
| KH220 | 0.5 | −101.3 ± 1.16 ABC | −68.5 ± 5.02 A | −44.6 ± 3.65 |
| 5 | −99.8 ± 0.66 A | −71.1 ± 1.01 A | −47.6 ± 1.53 | |
| 10 | −99.7 ± 1.39 A | −73.2 ± 8.04 AB | −49.5 ± 3.53 | |
| 15 | −99.8 ± 1.31 A | −65.8 ± 5.91 A | −43.7 ± 2.96 | |
| Uncoated | 0.5 | −101.4 ± 0.67 ABCD | −67.3 ± 1.27 A | −47.3 ± 1.83 |
| 5 | −102.3 ± 0.34 BCD | −68.7 ± 4.01 A | −47.5 ± 2.33 | |
| 10 | −102.6 ± 1.93 CD | −75.2 ± 14.51 ABC | −46.7 ± 4.84 | |
| 15 | −101.1 ± 2.20 ABC | −71.7 ± 8.96 AB | −44.2 ± 0.75 | |
| TS530 | 0.5 | −100.0 ± 2.07 A | −67.3 ± 4.84 A | −48.1 ± 5.39 |
| 5 | −101.3 ± 0.87 ABCD | −84.6 ± 3.50 C | −44.2 ± 3.50 | |
| 10 | −100.5 ± 1.53 ABC | −82.4 ± 6.86 BC | −44.3 ± 2.07 | |
| 15 | −100.1 ± 1.59 AB | −65.8 ± 7.63 AB | −43.4 ± 5.23 |
Publisher’s Note: MDPI stays neutral with regard to jurisdictional claims in published maps and institutional affiliations. |
© 2022 by the authors. Licensee MDPI, Basel, Switzerland. This article is an open access article distributed under the terms and conditions of the Creative Commons Attribution (CC BY) license (https://creativecommons.org/licenses/by/4.0/).
Share and Cite
Aulia, R.K.; Beatty, M.W.; Simetich, B. Effect of Superhydrophobic Coating and Nanofiller Loading on Facial Elastomer Physical Properties. Materials 2022, 15, 7343. https://doi.org/10.3390/ma15207343
Aulia RK, Beatty MW, Simetich B. Effect of Superhydrophobic Coating and Nanofiller Loading on Facial Elastomer Physical Properties. Materials. 2022; 15(20):7343. https://doi.org/10.3390/ma15207343
Chicago/Turabian StyleAulia, Rahmi Khairani, Mark W. Beatty, and Bobby Simetich. 2022. "Effect of Superhydrophobic Coating and Nanofiller Loading on Facial Elastomer Physical Properties" Materials 15, no. 20: 7343. https://doi.org/10.3390/ma15207343