Article

The Corrosion Resistance of Reinforced Magnesium Phosphate Cement Reactive Powder Concrete

1
School of Chemical and Mechanical Engineering, Liaodong University, Dandong 118001, China
2
College of Architecture and Civil Engineering, Beijing University of Technology, Beijing 100124, China
3
School of Civil and Environmental Engineering, Ningbo University, Ningbo 315000, China
*
Author to whom correspondence should be addressed.
Materials 2022, 15(16), 5692; https://doi.org/10.3390/ma15165692
Submission received: 19 July 2022 / Revised: 16 August 2022 / Accepted: 17 August 2022 / Published: 18 August 2022
(This article belongs to the Special Issue Durability and Sustainability of Cement and Concrete Composites)

Abstract

:
Magnesium phosphate cement-based reactive powder concrete (MPC-RPC) is a cement-based material with early strength, high strength and excellent durability. The slump flow and setting time of steel fibers reinforced MPC-RPC are investigated. Meanwhile, the flexural strength, the compressive strength, the ultrasonic velocity and the electrical resistivity of specimens cured for 3 h, 1 day, 3 days and 28 days are determined. Moreover, the corresponding corrosion resistance reinforced MPC-RPC exposing to NaCl freeze-thaw (F-T) cycles and dry-wet (D-W) alternations is researched. In this study, the steel fibers used are 0%, 0.5%, 1.0%, 1.5%, 2.0%, 2.5% and 3.0% by the volume of MPC-RPC. The corrosion of the inner reinforcement is reflected using the mass loss, electrical resistivity, ultrasonic velocity, and the AC impedance spectrum. Researching findings show that the steel fibers lead to decreasing the slump flow and setting time. The flexural strength, the compressive strength and ultrasonic velocity of MPC-RPC cured for 3 h are higher than 45% of the MPC-RPC cured for 28 days. Moreover, when the MPC-RPC is cured for 7 days, the flexural strength, the compressive strength and ultrasonic velocity of MPC-RPC are higher than 85% of the specimens cured for 28 days. The electrical resistance decreases in a quadratic function as the volume ratio of steel fibers increases. The corrosion resistance of the internal reinforcement can be improved by adding steel fibers at appropriate dosages. The reinforcement inner MPC-RPC corrodes more seriously under the NaCl D-W alternations than NaCl F-T cycles.

1. Introduction

Cement concrete is a type of material with high mechanical properties and good durability, which has been used in civil engineering industry for many years [1,2]. Recently, the frequent construction of large marine concrete structures provides a platform for the development and application of cement concrete [3]. The sea crossing bridge is the hub of coastal cities, which usually encounters complex application environment similar to scouring, dry-wet (D-W) alternations and freeze-thaw (F-T) cycles of seawater [4,5,6]. The expansion joint anchorage zone of sea crossing bridge encounters the action of complex loads. Due to the erosion by sea water and the complex loads, the cement concrete of the anchorage zone of bridge expansion joint materials is frequently damaged.
Sulphoaluminate cement matrix, the Portland cement matrix, the magnesium phosphate cement matrix and compound cement matrix are usually applied in the rapid repairing of cement concrete constructions [7,8,9,10,11]. Sulphoaluminate cement-based materials have been proved to possess quite high mechanical strength at early curing age (less than 1 d) [3]. However, the mechanical strength at later curing age is lower than that of Portland cement concrete. Meanwhile, the durability of magnesium phosphate cement matrix in marine environment is inferior [12]. Portland cement-based materials with early strength agent and the compound cement matrix show better later mechanical strength and durability than the cement concrete with only sulphoaluminate cement. This kind of concrete is unable to open to traffic until the curing age reaches 3 days.
Magnesium phosphate cement matrix is generally manufactured by combining the magnesium oxide and potassium dihydrogen phosphate [13,14]. This kind of cement matrix is simple to prepare and has good mechanical properties and durability [15,16,17,18]. Moreover, the magnesium phosphate cement matrix shows excellent bonding performance and impermeability. Du’s research pointed out that the addition of MgCl2 can be used for delaying the setting of magnesium phosphate cement and reducing the corresponding early cracks and the drying shrinkage rate [11]. Zhang et al. [19] found that the magnesium phosphate cement shows good resistance to NaCl F-T cycles and acid and alkali resistance. However, plain concrete is rarely used in real engineering.
When cement concrete is used in practical engineering, a certain amount of steel bars needs to be prepared. The steel bars’ inner cement concrete is prone to corrosion during service, due to the fact that the iron loses electrons to form iron compounds, and the corrosion occurs [20,21,22]. When the steel bars reinforced cement concrete is applied in the marine environment, the inner steel bars usually corrode seriously [23,24,25,26,27]. This is because chloride ions corrode the passive film of the steel bars, resulting in the increased corrosion [28,29]. The expansion joint is widely used mechanical connecting device with complex external load. The magnesium phosphate cement-based materials are often applied in the replacement of concrete in anchorage zone of bridge expansion joint. A certain amount of reinforcement is usually prepared in the anchorage zone of bridge expansion joint. Therefore, when the magnesium phosphate cement matrix is used for replacing the anchorage zone, the corrosion of the inner steel bars should be considered. However, little research about this has been reported.
As an ultra-dense material, reactive powder concrete (RPC) has been developed in 1990s. RPC usually consists of a large amount of mineral admixtures, which is applied to improve the activity of the cementitious material thus increasing the mechanical strength. Due to this reason, the blast furnace slag powder and fly ash serve as the mineral admixtures. Additionally, the steel fibers can effectively the crack resistance of RPC, leading eventually to improving the mechanical strength and durability [30]. Therefore, the steel fibers are used in the RPC.
Magnesium phosphate cement RPC (MPC-RPC) may possess the advantages of fast hardening, early strength, excellent later mechanical strength and corrosion resistance [31,32]. This kind of material may act as a perfect cement-based material applied in replacing the cement concrete of anchorage zone of bridge expansion joint. The anchorage zone of bridge composed by MPC-RPC may be corroded when exposed to the chloride corrosion environment. Ultrasonic testing and electrical parameter methods are the nondestructive testing methods, which may be well used for reflecting the corrosion resistance of reinforced MPC-RPC. However, little attention about the corrosion resistance of reinforced MPC-RPC under the chloride corrosion environment has been reported.
In this paper, the working performance, the flexural strength, the compressive strengths and the electrical resistance of magnesium phosphate cement RPC are investigated. Moreover, the corresponding corrosion resistance of inner steel bars are researched. F-T cycles and D-W alternations with 3% NaCl are provided as the erosive environment. This study will develop new rapid hardening repair concrete, which may be well-applied in the marine and civil engineering environment.

2. Experimental

2.1. Raw Materials

The potassium dihydrogen phosphate manufactured by Shandong jinyida Chemical Co., Ltd., Jinan, China is used for making the magnesium phosphate cement (MPC). The purity and density of potassium dihydrogen phosphate are 98.5% and 2.238 g/cm3, respectively. Another power material, pyrophoric magnesium oxide with the density of 3.58 g/cm³ and purity of 99.1% (Xi’an Haotian Bioengineering Co., Ltd., Xi’an, China) is added. Blast furnace slag powder (BFS) and fly ash (FA) are provided by Huixin mining processing plant, Shijiazhuang, China. BFS shows the density of 2.9 g/cm3 and the specific surface area of 436 m2/g, and the thermogravimetric loss rate of 1.7%. The SiO2 content of quartz sand is 99%, which is composed of three particle sizes (0.71 mm~1 mm, 0.35 mm~0.59 mm and 0.15 mm~0.297 mm), and the proportions of the three particle sizes are 1:1.5:0.8, respectively. The water reducer used is polycarboxylic acid high-performance water reducer (SP) produced by Henan Pingdingshan admixture Co., Ltd., Pingdingshan, China. The water reduction rate can reach 40%. The dosage of water reducer is unified as 1.33% of the total mass of cementitious materials (the sum of the mass of potassium dihydrogen phosphate, magnesium oxide, BFS and FA), and the water binder ratio of MPC-RPC is 0.15. Table 1 and Table 2 show the cumulative passing rate and chemical composition of raw materials, respectively. The particle passing percentage of raw materials is obtained by screening experiment. The measuring process is carried out by the manufactory. Copper plated steel fibers show the density of 7.85 g/cm3, the tensile strength of 3125 MPa, the diameters of 0.10 mm~0.25 mm and the length of 10 mm~20 mm showing the average diameter and length of 0.21 mm and 15 mm, respectively.

2.2. Sample Preparation

Table 3 is the mix proportion of MPC-RPC per unit volume, which is used for making the MPC-RPC. The percentages of admixtures are obtained from prior studies [9,17,19], which are based on the maximum density theory. In addition, it is also convenient for comparison with previous studies. The specimens are manufactured by the following steps.
Firstly, the weighed dried raw materials (MgO, MgCl2, Borax, K2HPO4, FA and BFS) are added to the Hobart A200C mixer and combined at the stirring speed of (107 ± 5) rpm for 2 min. During the mixing, the steel fibers are scattered into the mixing pot in batches and combined at the mixing speed of (198 ± 5) rpm for another 1 min, finally the mixed liquids with water and water reducer are added to the mixing pot and 5 min stirring with the mixing speed of (361 ± 5) rpm provided for stirring the MPC-RPC mixture. The fresh MPC-RPC is used to measure the slump flow and setting time after the mixing is completed. NLD-3 electric jumping table cement mortar fluidity tester is used for the measurement of slump flow. ZKS-100 mortar setting time tester is used for the measurement of the setting of MPC-RPC. All measuring processes are referred in the published papers and the Chinese standards GB/T2419-2005 and JGJ/T 70-2009 [33,34]. After the above testing, the fresh MPC-RPC is poured into molds with sizes of 40 × 40 × 160 mm3 and 50 × 50 × 50 mm3 to form specimens.

2.3. Measurement Methods

2.3.1. Mechanical Strengths

YAW-300E cement mortar compressive and flexural machine is used to measure the flexural and compressive strengths of specimens with size of 40 × 40 × 160 mm3. After the specimens are cured in the environment of 20 °C and relative humility of 99% for the needed curing ages, the specimens are moved to the bending fixture with the flat and smooth surface of test piece on the fixture. Then, load rate with 0.05 kN/s is provided for the flexural strength. After the flexural specimen is broken, two fault blocks are moved to the compressive fixture and the load with the loading rate of 2.4 kN/s is used [35]. The measuring process of mechanical strengths is shown in Figure 1.

2.3.2. Ultrasonic Velocity Test

Specimens with size of 50 × 50 × 50 mm3 are applied in the determination of ultrasonic velocity. The Jinghong CJ-10 intelligent nonmetal ultrasonic detector manufactured by Cangzhou Jinghong Engineering Instrument Co., Ltd., Cangzhou, China is used for the measurement of ultrasonic velocity. The vaseline is coupled with the surface of the specimens before testing. Figure 2 shows the measurement of the ultrasonic velocity.

2.3.3. AC Electrical Parameters Test

The electrical parameters of specimens are tested by TH2810D LCR digital electric bridge (AC electrical resistance measurement) and PARSTAT 3000A electrochemical workstation (Determination of AC impedance spectrum). The testing frequency, the voltage and the sampling frequency of TH2810D are 104 Hz, 1 V and 10 Hz. The testing frequency and voltage of PARSTAT 3000A electrochemical workstation are 105 Hz~1 Hz and −10 mV~10 mV. Two pieces of 316 L stainless steel mesh with aperture’s diameter of 4 mm serve as two electrodes. The distance between two electrodes is 40 mm. The measurement of the electrical parameters are shown in Figure 3. The experimental details are described in Wang’s paper [36,37].

2.3.4. Corrosion of Steel Bars Inner MPC-RPC under NaCl Eroded Environment

The steel bars are embedded the center position of the MPC-RPC. The specimens are under the NaCl F-T cycles’ environment with the NaCl concentration of 3%. Fully automatic control concrete rapid freezing and thawing test box with the temperature range of −25 °C~50 °C and unit operating power of 5.5 kW is used for the freeze-thaw experiment. 24 days’ standard curing condition is provided for the specimens. After this, some specimens are immersed in the solution containing 3% NaCl for 4 days and are moved to the rapid freezing and thawing test box with the working temperature of −15 °C~8 °C. Some other specimens are used for the experiment of D-W alternations of NaCl solution. Firstly, the specimens are immersed in the NaCl solution for 10 h, then the specimens are dried in the DHG series vertical 300 °C blast drying oven with the temperature of 60 °C for 36 h. Finally, the specimens are moved from the drying oven and cooled in the temperature of 20 °C and relative humility of 40% for 2 h, until the next D-W cycle. The mass loss rate, the ultrasonic velocity, the electrical resistance and the AC impedance spectrum of specimens during the corrosion process are obtained. The measuring methods are the same as RPC specimens without steel fibers. A 316 L stainless steel mesh serves as an electrode, meanwhile, the embedded steel bar is used as another electrode. The experimental measurements of corrosion of steel bars inner RPC are exhibited in Figure 4 and Figure 5. In this study, 3 specimens are used for the measurement of mechanical strength, and 6 specimens are applied in the test of electrical parameters and ultrasonic velocity.

3. Results and Discussions

3.1. The Workability of MPC-RPC

The slump flow and setting time of the MPC-RPC are shown in Figure 6. Figure 6 shows that when the ratio of steel fibers increases, the slump flow and the setting time decrease. This is mainly because the steel fibers’ networks can prevent the flow of fresh MPC-RPC paste [38]. Therefore, the slump flow of fresh MPC-RPC slurry will be decreased due to the addition of steel fibers. Moreover, as depicted in Figure 6, the setting time of MPC-RPC decreases with an increase in steel fibers ratio as the steel fibers may absorb some free water, leading to decreasing the setting time of MPC-RPC. Moreover, the addition of steel fiber will affect the physical state of MPC-RPC, thus decreasing the setting time of MPC-RPC [39]. The values of error bars are lower than 0.096, which ensures the experiment’s accuracy. The setting time of MPC-RPC ranges from 33.2 min to 56.1 min, which provides sufficient operation time for construction. Meanwhile, the slump flow of fresh MPC-RPC is 121.4 mm~181.3 mm, which ensures the sufficient fluidity during pouring.

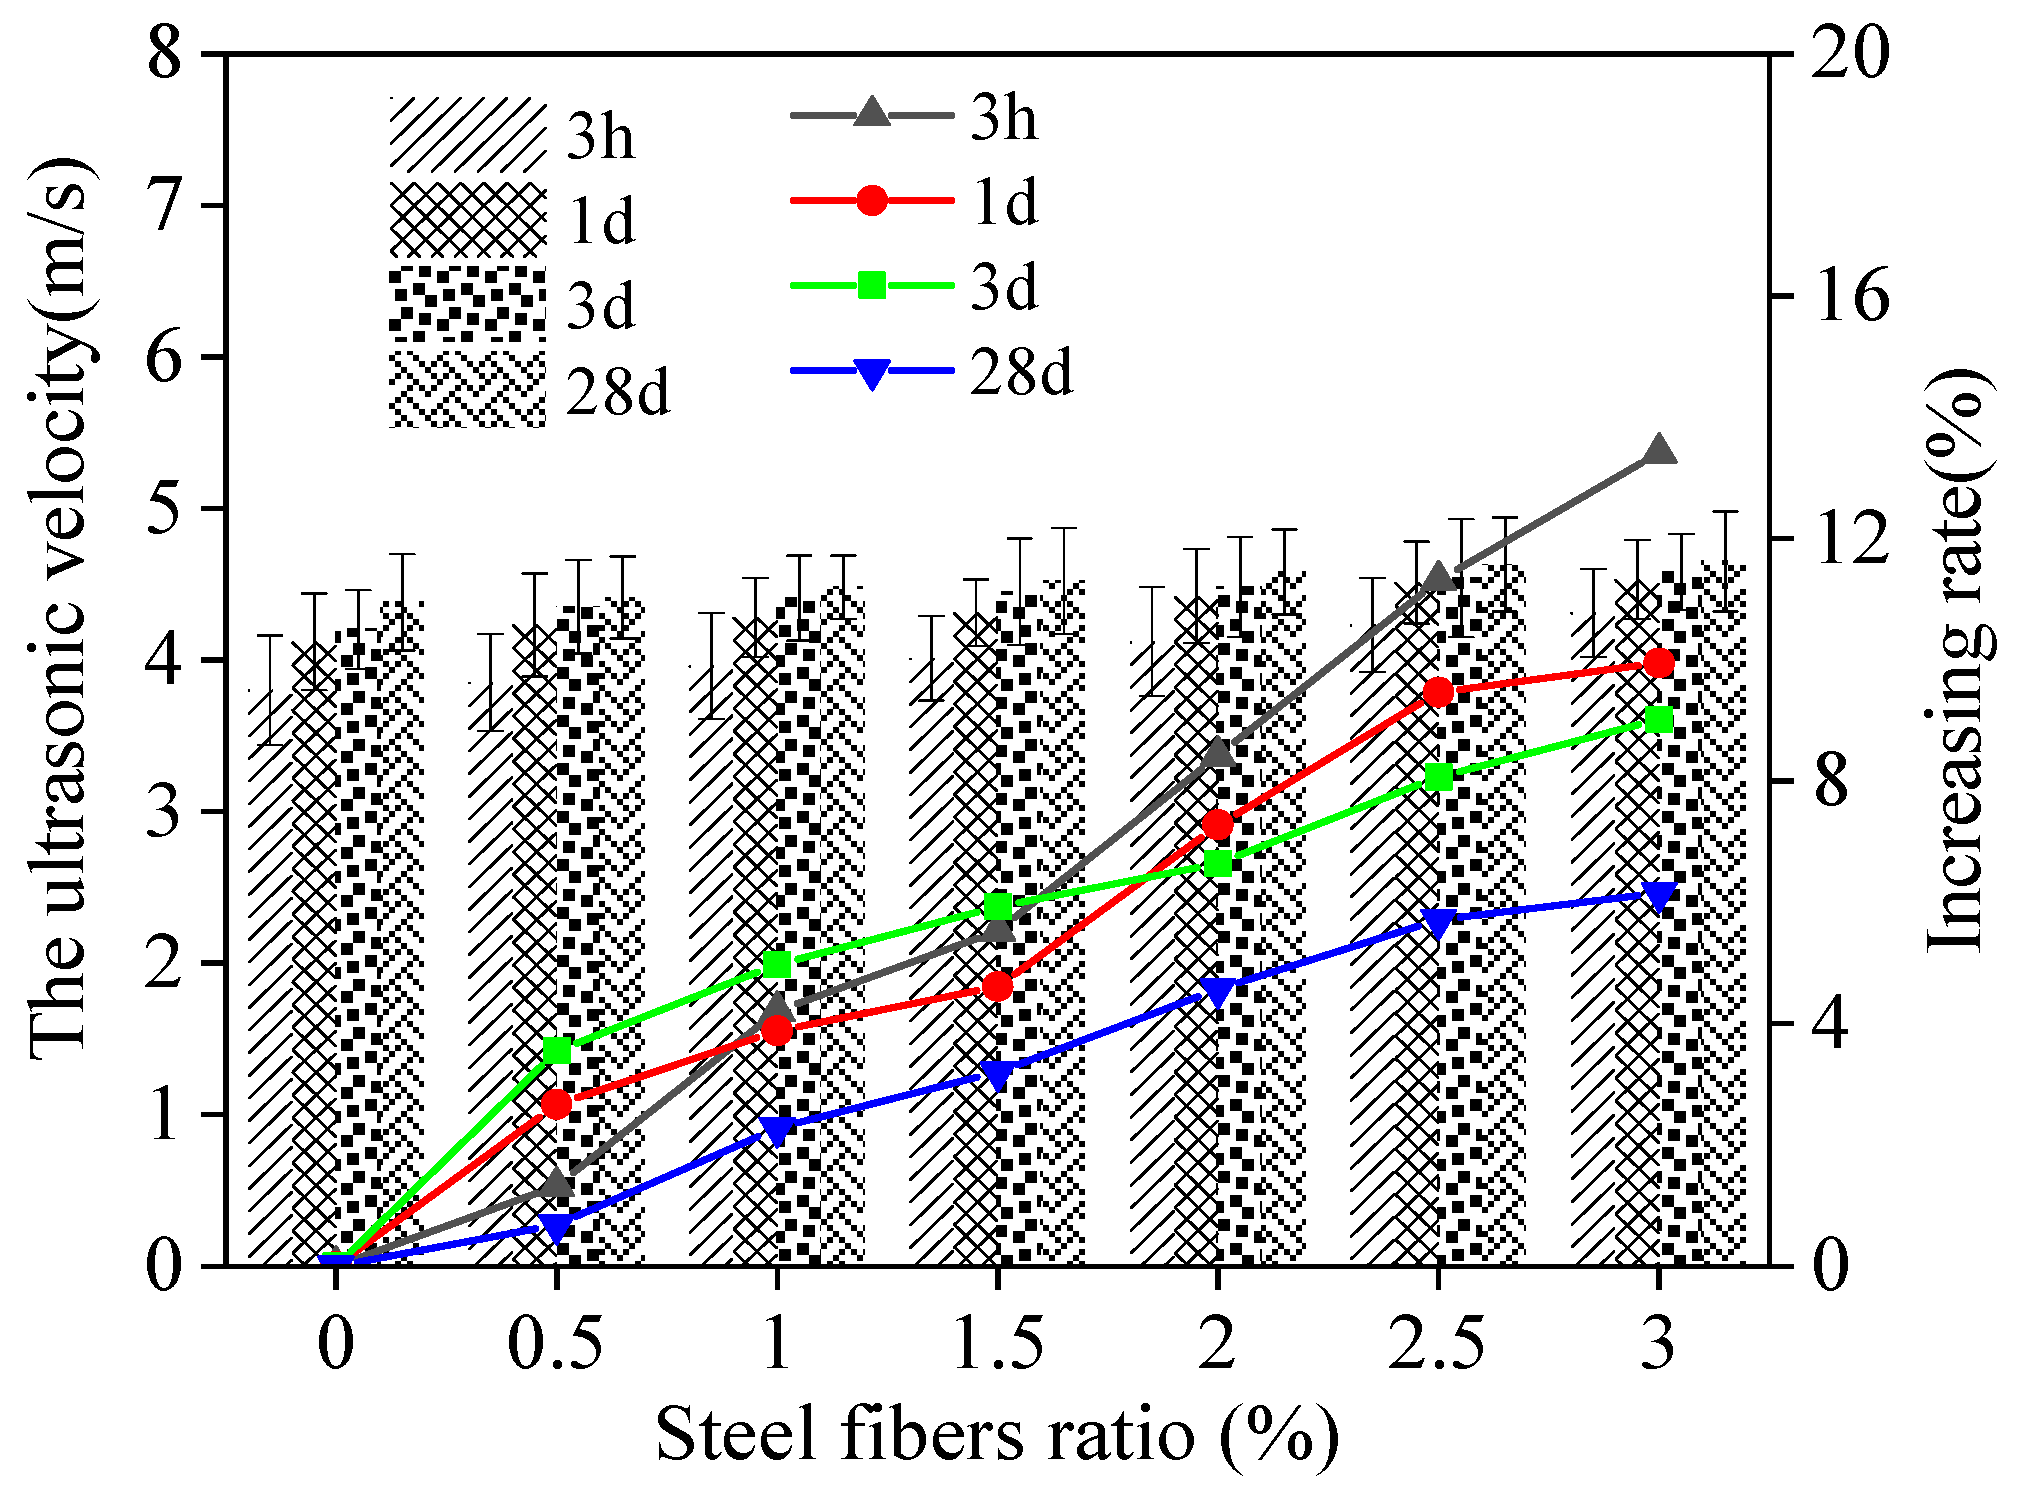
3.2. The Mechanical Strengths of MPC-RPC

As reported in References [3,9], the curing ages of 3 h, 1 day, 3 days and 28 days are usually used for reflecting the mechanical strength of magnesium phosphate cement-based material. In order to facilitate comparison with previous studies, the curing ages of 3 h, 1 day, 3 days and 28 days are selected. The flexural and compressive strengths of MPC-RPC are depicted in Figure 7. It can be observed in Figure 7, the flexural and compressive strengths increase with the increasing steel fibers ratio and the curing age. The flexural strength of MPC-RPC cured for 3 h increases by 156.9%, when the steel fibers ratio varies from 0% to 3%. While, when the curing ages are 1 day, 3 days and 28 days, the increasing rates are 119.4%, 61.4% and 50%, respectively. Moreover, the increasing rates of compressive strength by steel fibers of specimens cured for 3 h, 1 day, 3 days and 28 days are 0~30.4%, 0~32.7%, 0~64.8% and 0~50%, respectively. When the curing age ranges from 3 h to 1 d, the increasing rate of flexural strength of MPC-RPC is 3.8~21.5%. Meanwhile, when the curing age ranges from 3 h to 28 days, the increasing rate of flexural strength of MPC-RPC is 28.2~119.6%. Additionally, the maximum increasing rate of compressive strength by curing age is 102.1%. Meanwhile, the maximum increasing rate of compressive strength by the steel fibers ratio is 49.4%. This is attributed to the reason that the magnesium oxide will react with potassium dihydrogen phosphate to form hydrated magnesium phosphate rapidly [40,41,42], besides the mechanical strengths of MPC-RPC at low curing age is enough high. The addition of steel fibers can bridge cracks inner MPC-RPC, thus improving the mechanical strengths, especially the flexural strength. The values of error bars are lower than 0.073, indicating the accuracy of experimental results. Compared with the RPC prepared with sulphoaluminate cement, the flexural strength of MPC-RPC is reduced by 13.2~25.4%, and the compressive strength is increased by 10.6~31.3% [43]. The flexural strength and compressive strength of MPC-RPC before 28 days are 25% higher than those of RPC prepared with ordinary Portland cement. Meanwhile, when the curing age is 28 days, the mechanical strengths of MPC-RPC are lower than that of RPC with Ordinary Portland cement [44].

3.3. The Ultrasonic Velocity of MPC-RPC

The ultrasonic velocity (v) of MPC-RPC after curing for 3 h, 1 day, 3 days and 28 days, is shown in Figure 8. It can be noticed in Figure 8, as the curing age increases and steel fibers are added, the ultrasonic velocity also increases. This is explained by the fact that when the curing age increases, the amount of hydrated magnesium phosphate increases and MPC-RPC become more compact, which increases the ultrasonic velocity [43]. Moreover, the increased dosages of steel fibers can improve the compactness of steel fibers’ networks, which results in increasing the ultrasonic velocity. In comparison to 80% of the specimens that are cured for 28 days, the ultrasonic velocity of specimens cured for 3 h is higher. Additionally, the ultrasonic velocity of blank specimens is higher than 81.7% of the specimens with 3.0% steel fibers. The flexural strength, the compressive strength and ultrasonic velocity of RPC cured for 3 h are higher than 45% of the MPC-RPC cured for 28 days. The flexural strength, the compressive strength and ultrasonic velocity of MPC-RPC cured for 7 days are higher than 85% of the specimens cured for 28 days. The values of error bars are all lower than 0.085, ensuring the precision of researching results. The ultrasonic velocity of MPC-RPC is 5.4~11.3% lower than that of RPC with Ordinary Portland cement [44,45]. The detailed data of Figure 6, Figure 7 and Figure 8 have been provided by the graphs be presented in the form of tables at the end of the article (Appendix A).

3.4. Electrical Resistivity of MPC-RPC

The electrical resistivity (ρ) of MPC-RPC is shown in Figure 9. As illustrated in Figure 9, the electrical resistivity of MPC-RPC decreases in the form of quadratic function. The fitting results of the relationship between ρ and V are listed in Table 4, and it can be seen that the fitting degree is higher than 0.99, which verifies the rationality of the fitted equation. When the volume ratio (V) of steel fibers increases from 0% to 1.5%, the electrical resistivity of MPC-RPC drops obviously. This is ascribed to the fact that the conductive fiber networks come into being, therefore, the electrical resistivity is very sensitive to the increase of steel fibers’ content [46]. While, when the steel fibers’ volume ratio is higher than 1.5%, the electrical resistivity of MPC-RPC tends to be stable, due to the complete conductive fibers’ network. Hence, the increasing steel fibers’ ratio has little influence on the conductive performance of MPC-RPC.

3.5. Corrosion Resistance of Steel Bars Inner MPC-RPC

The mass loss rate (Δm/m) of reinforced MPC-RPC during NaCl F-T cycles(N) is illustrated in Figure 10. The fitting results of the relationship between (Δm/m) and the N are shown in Table 5. Figure 10 shows that as the number of NaCl F-T cycles (N) increases, so does the mass loss rate of reinforced MPC-RPC. This is explained by the fact that frozen-heave stress can make the surface on the cement concrete spall [47]. Moreover, the chloridion can corrode the steel bars and steel fibers inner MPC-RPC thus causing cracking of MPC-RPC and reducing the mass of MPC-RPC. When the steel fibers’ ratio varies from 0% to 2.0%, the mass loss increases up as the dosage of steel fibers is increased, due to the fact that the steel fibers enhance the loss of electronic capability. When the dosage of steel fibers is 2.0%~3.0%, the mass loss rate of reinforced MPC-RPC decreases with the increasing steel fibers’ ratio. This is explained by the ability of the steel fibers to bridge internal cracks in MPC-RPC, which decreases the mass loss of MPC-RPC [48].
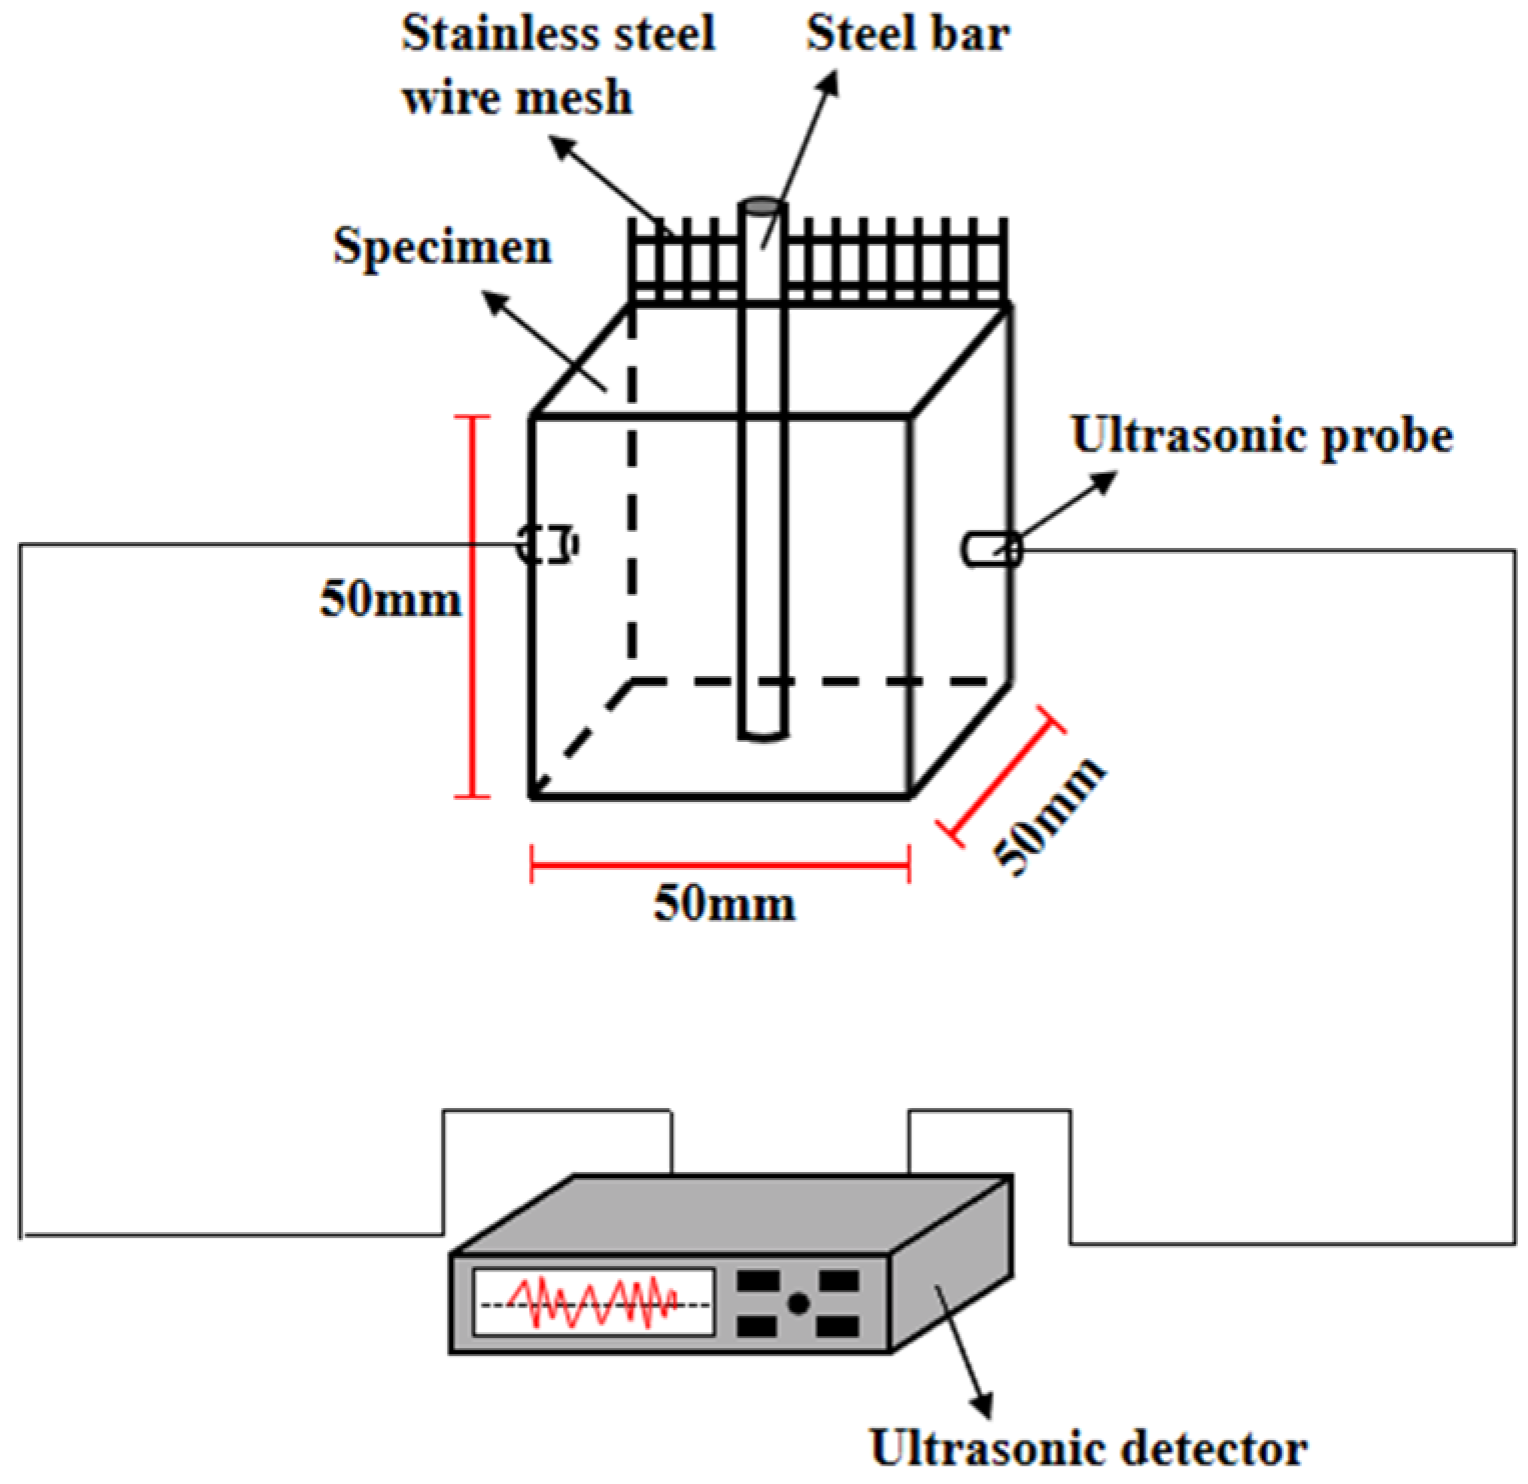
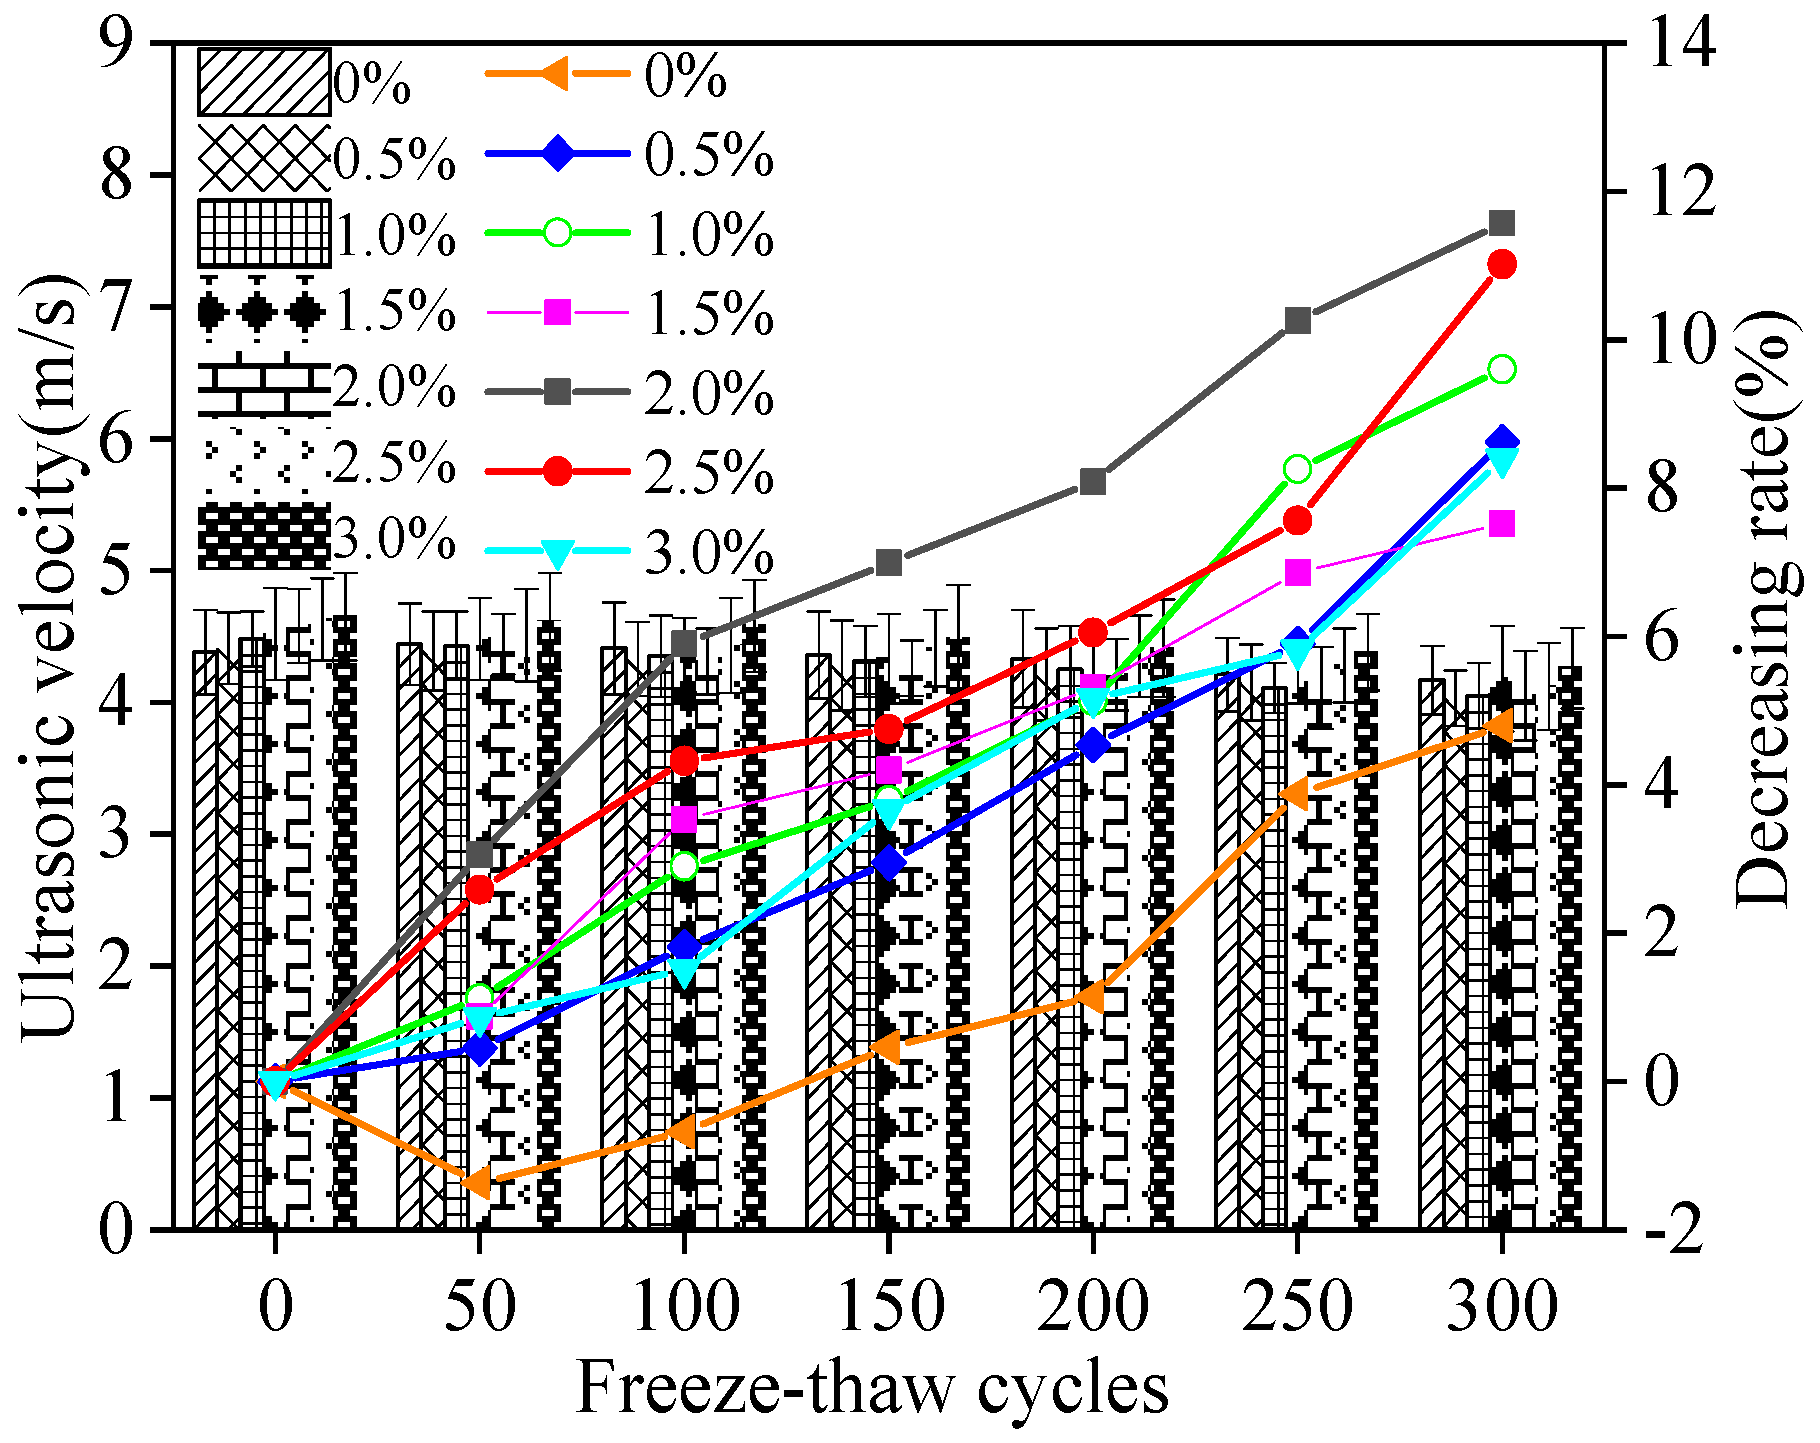
The variation rate of ultrasonic velocity of MPC-RPC is illustrated in Figure 11. The ultrasonic velocity decreases with the increasing number of NaCl F-T cycles, as shown in Figure 11. This is explained by the fact that the NaCl F-T cycles can accelerate the MPC-RPC’s crack propagation which blocks the propagation process of ultrasound [49,50]. Additionally, the chloride ions will penetrate into MPC-RPC through the cracks developed by NaCl F-T cycles thereby corroding the passive film of reinforcement and steel fibers thus accelerating the following corrosion [28,29]. Consequently, the cracks increase and the ultrasonic velocity decreases. Moreover, as observed in Figure 11, in some conditions, the addition of steel fibers lead to decreasing the ultrasonic velocity, due to the increasing dosages of steel fibers can improve the electrical conduction of MPC-RPC, which accelerates the electrochemical corrosion of the inner reinforcement. On the other hand, the increasing dosage of steel fibers can limit the cracking of cracks, which increases the ultrasonic velocity [51]. The values of error bars are lower than 0.1, which exhibits accurate experimental results.
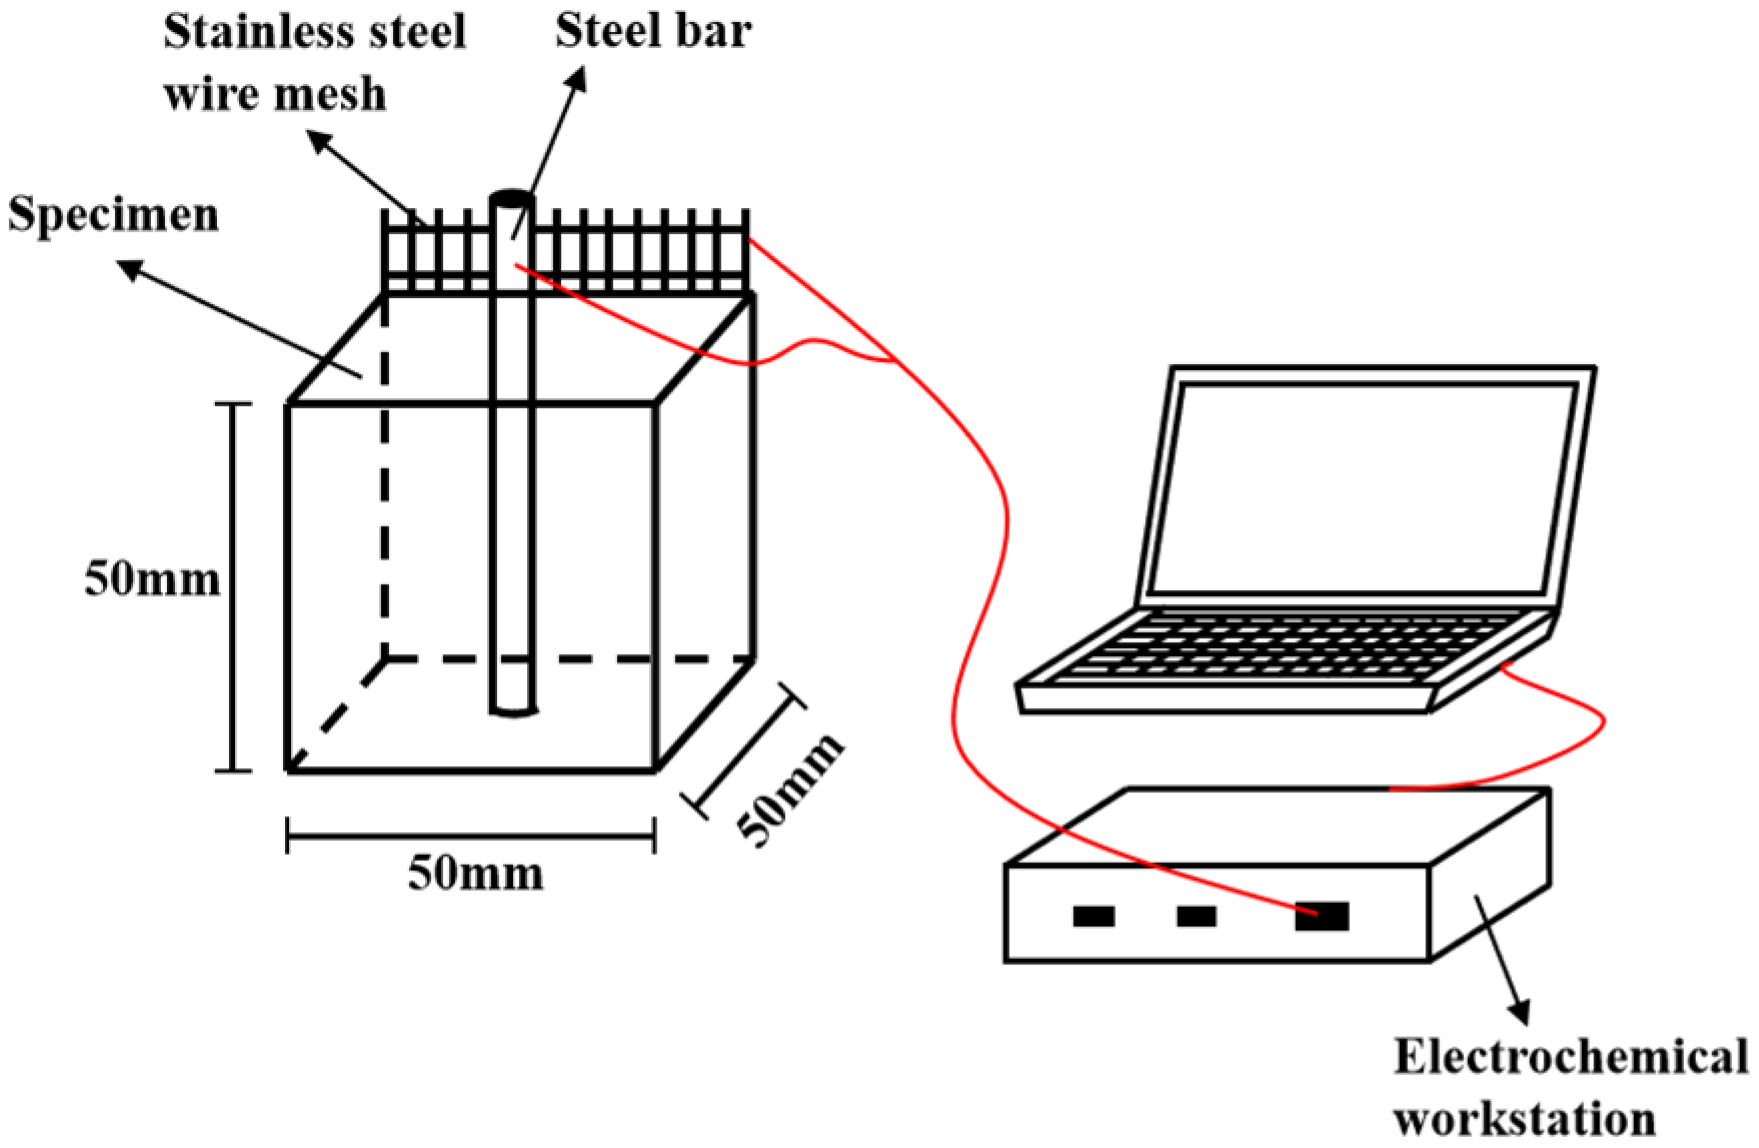
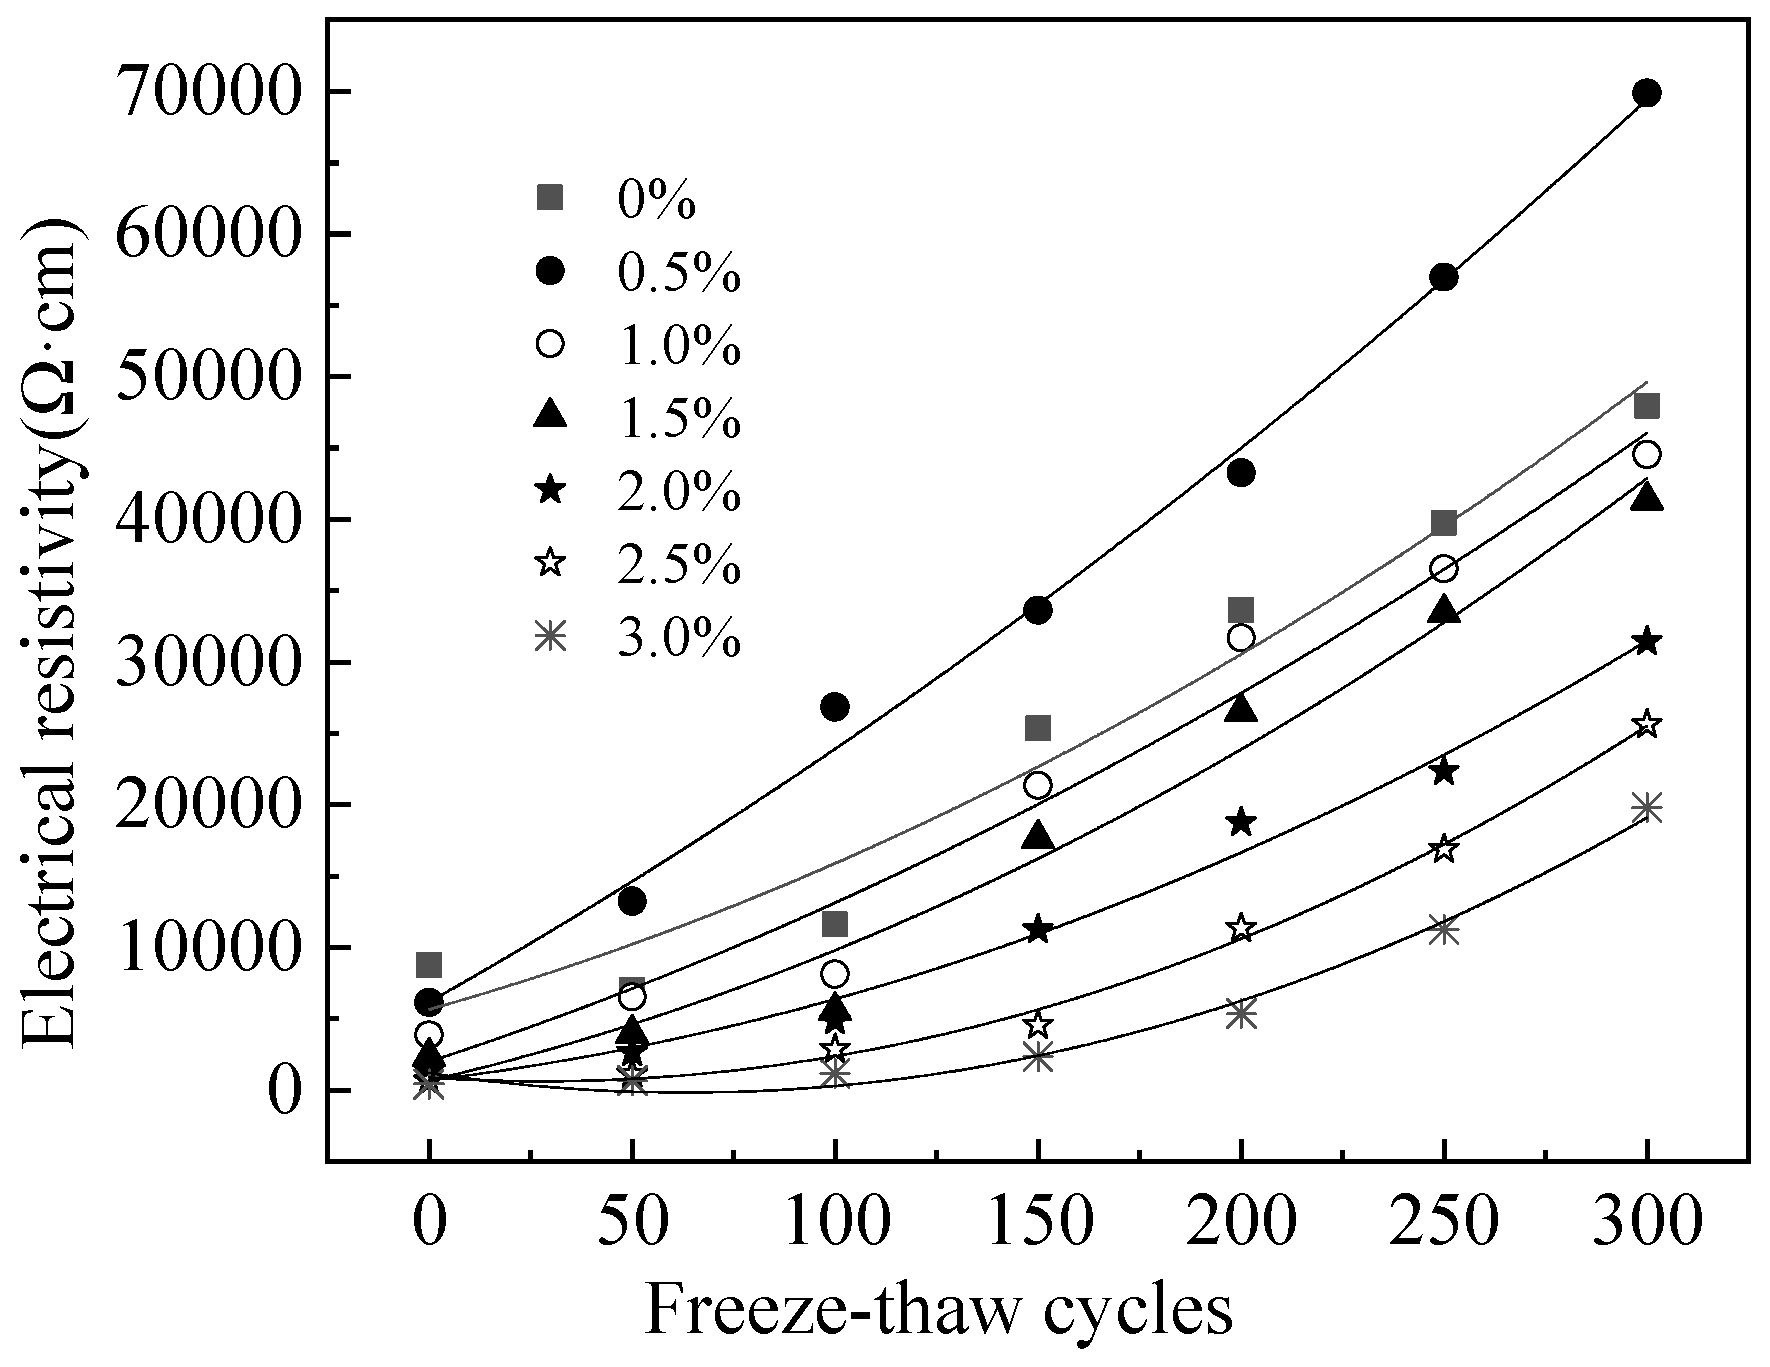
Figure 12 presents the electrical resistivity of MPC-RPC. It is apparent from Figure 12 that the electrical resistivity increases with the increasing NaCl F-T cycles(N). The relationship between electrical resistivity and the number of F-T cycles is deduced as quadratic function. The fitting results are exhibited in Table 6. As shown in Table 6, the fitting degrees are higher than 0.99, thus proving the accuracy of the fitting equations. This is mainly because the NaCl F-T cycles can increase the F-T cracks which blocks the migration of conductive particles and increases the electrical resistivity of MPC-RPC [49,50]. Moreover, the NaCl F-T cycles can accelerate the corrosion of reinforcement and steel fibers. The rust inner MPC-RPC can prevent the electron transferring though reinforcement and steel fibers. Moreover, the rust can block the channel of pore solution, thus increasing the electrical resistivity [52,53]. Furthermore, the electrical resistivity of MPC-RPC is decreased by the increase in the dosage of steel fibers due to the improved steel fibers’ network.
The mass loss rate of reinforced MPC-RPC during NaCl D-W alternations (n) is exhibited in Figure 13. As can be seen in Figure 13, the mass loss rates of all curves increase as a quadratic function with the NaCl D-W alternations. The fitting results are shown in Table 7. It can be found in Table 7, the fitting degrees are higher than 0.99, therefore, the fitting equation is reasonable. This is due to the fact that the NaCl D-W alternations can increase crystallization stress’ effect thus increasing the spalling of MPC-RPC and decreasing the following mass. Moreover, the NaCl D-W alternations lead to accelerating the corrosion of reinforcement and steel fibers, the rust by corrosion can induce the spalling on the surface of MPC-RPC, which decreases the mass [54,55].
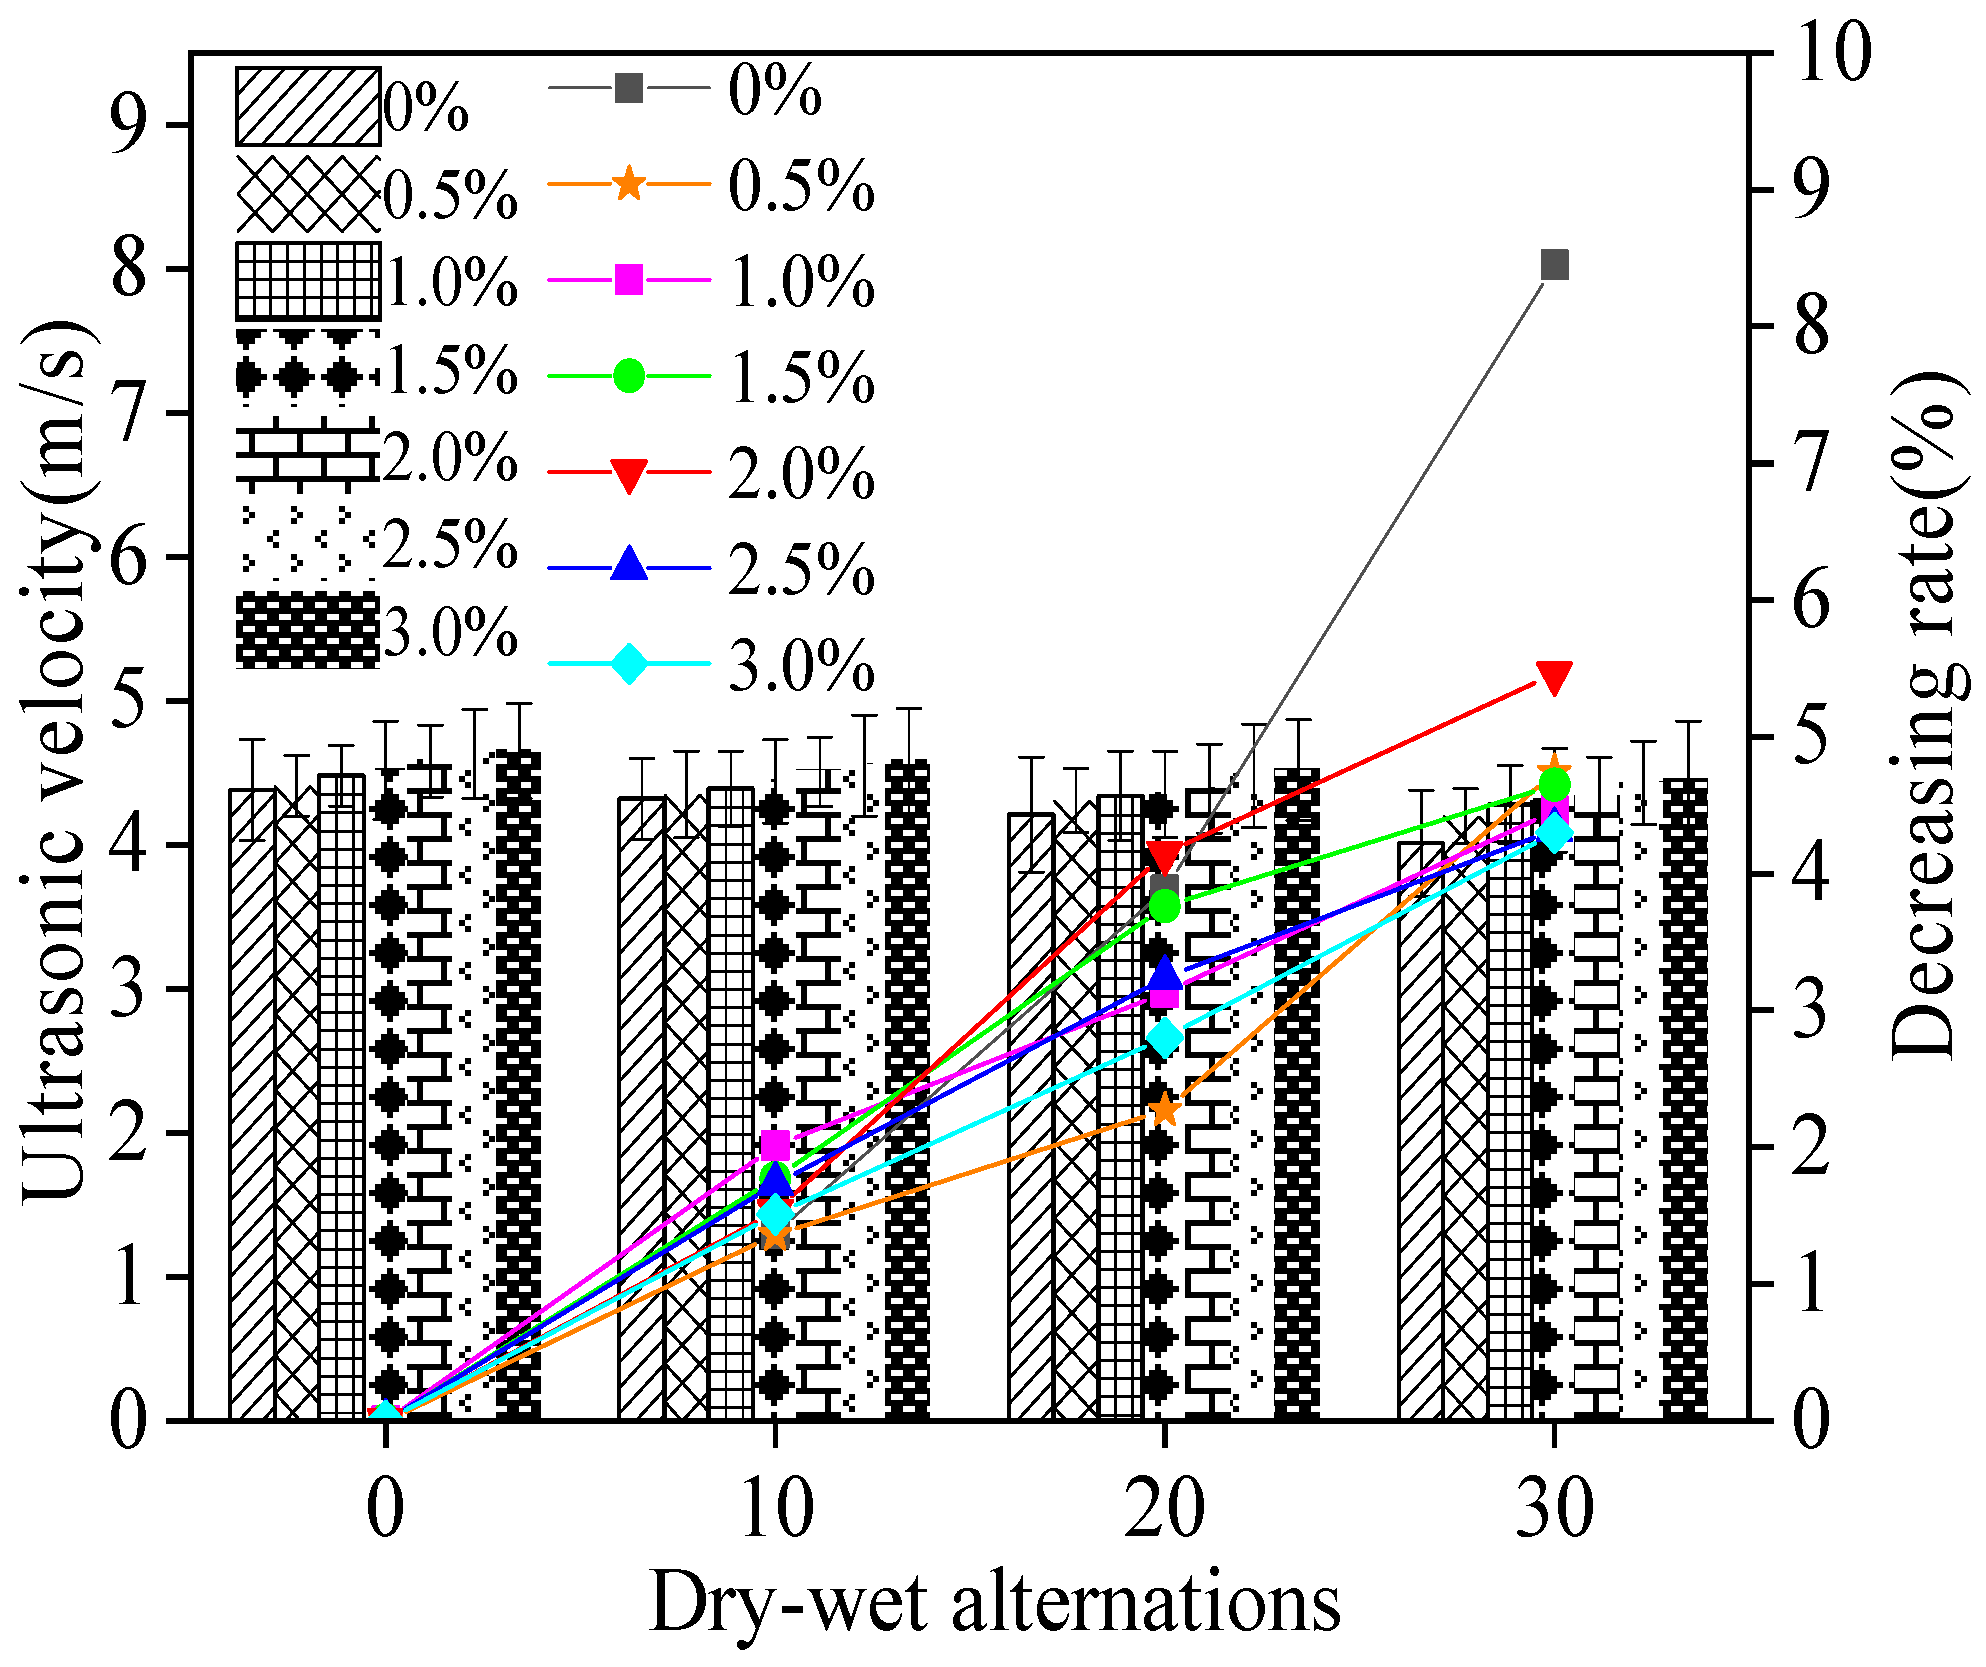
Figure 14 demonstrates the ultrasonic velocity of MPC-RPC during NaCl D-W alternations. It can be noticed from Figure 14 that the ultrasonic velocity of MPC-RPC decreases with the increasing NaCl D-W alternations due to the increased inner cracks by NaCl D-W alternations. Moreover, the increased steel fibers’ dosages can form dense networks inner MPC-RPC, which increases the ultrasonic velocity of MPC-RPC.
Figure 15 shows the electrical resistivity of MPC-RPC during NaCl D-W alternations. As depicted in Figure 15, the electrical resistivity of MPC-RPC increases with the increasing number of NaCl D-W alternations. This is due to the fact that the NaCl D-W cracks induced by NaCl D-W alternations can reduce the transmission speed of conductive particles, therefore, the electrical resistivity of MPC-RPC is increased by the NaCl D-W alternations [55]. Table 8 illustrates the fitting results. As illustrated in Figure 15 and Table 8, the relationship between electrical resistivity of MPC-RPC and the number of NaCl D-W alternations fits well with quadratic function. Moreover, the corrosion degree of steel fibers and steel bars are increased by NaCl D-W alternations, resulting in a higher electrical resistivity of MPC-RPC [56,57]. Furthermore, the electrical resistivity of MPC-RPC is decreased with the increase in the increasing amount of steel fibers, due to the improved conductive networks by steel fibers.
Figure 16 depicts the AC impedance spectrum curves of reinforced MPC-RPC. The AC impedance spectrum curves consist of real part and imaginary part. The real part represents the electrical resistance. Meanwhile, the imaginary part refers to the electrical reactance. The imaginary parts of all curves firstly decrease and then increase with the increasing real part. As illustrated in Figure 16, the values of extreme point move from right to the left when the amount of steel fibers is increased, indicating enhanced electrical conduction. Moreover, it can be found in Figure 16, the NaCl F-T cycles and NaCl D-W alternations lead to increasing the real parts’ values of the extreme point. This is due to the increased electrical resistance by NaCl F-T cycles and NaCl D-W alternations, reflecting that the corrosion degree of reinforcement has been accelerated [55]. Furthermore, the increasing rate the values of extreme point by NaCl D-W alternations are higher than that by NaCl F-T cycles.
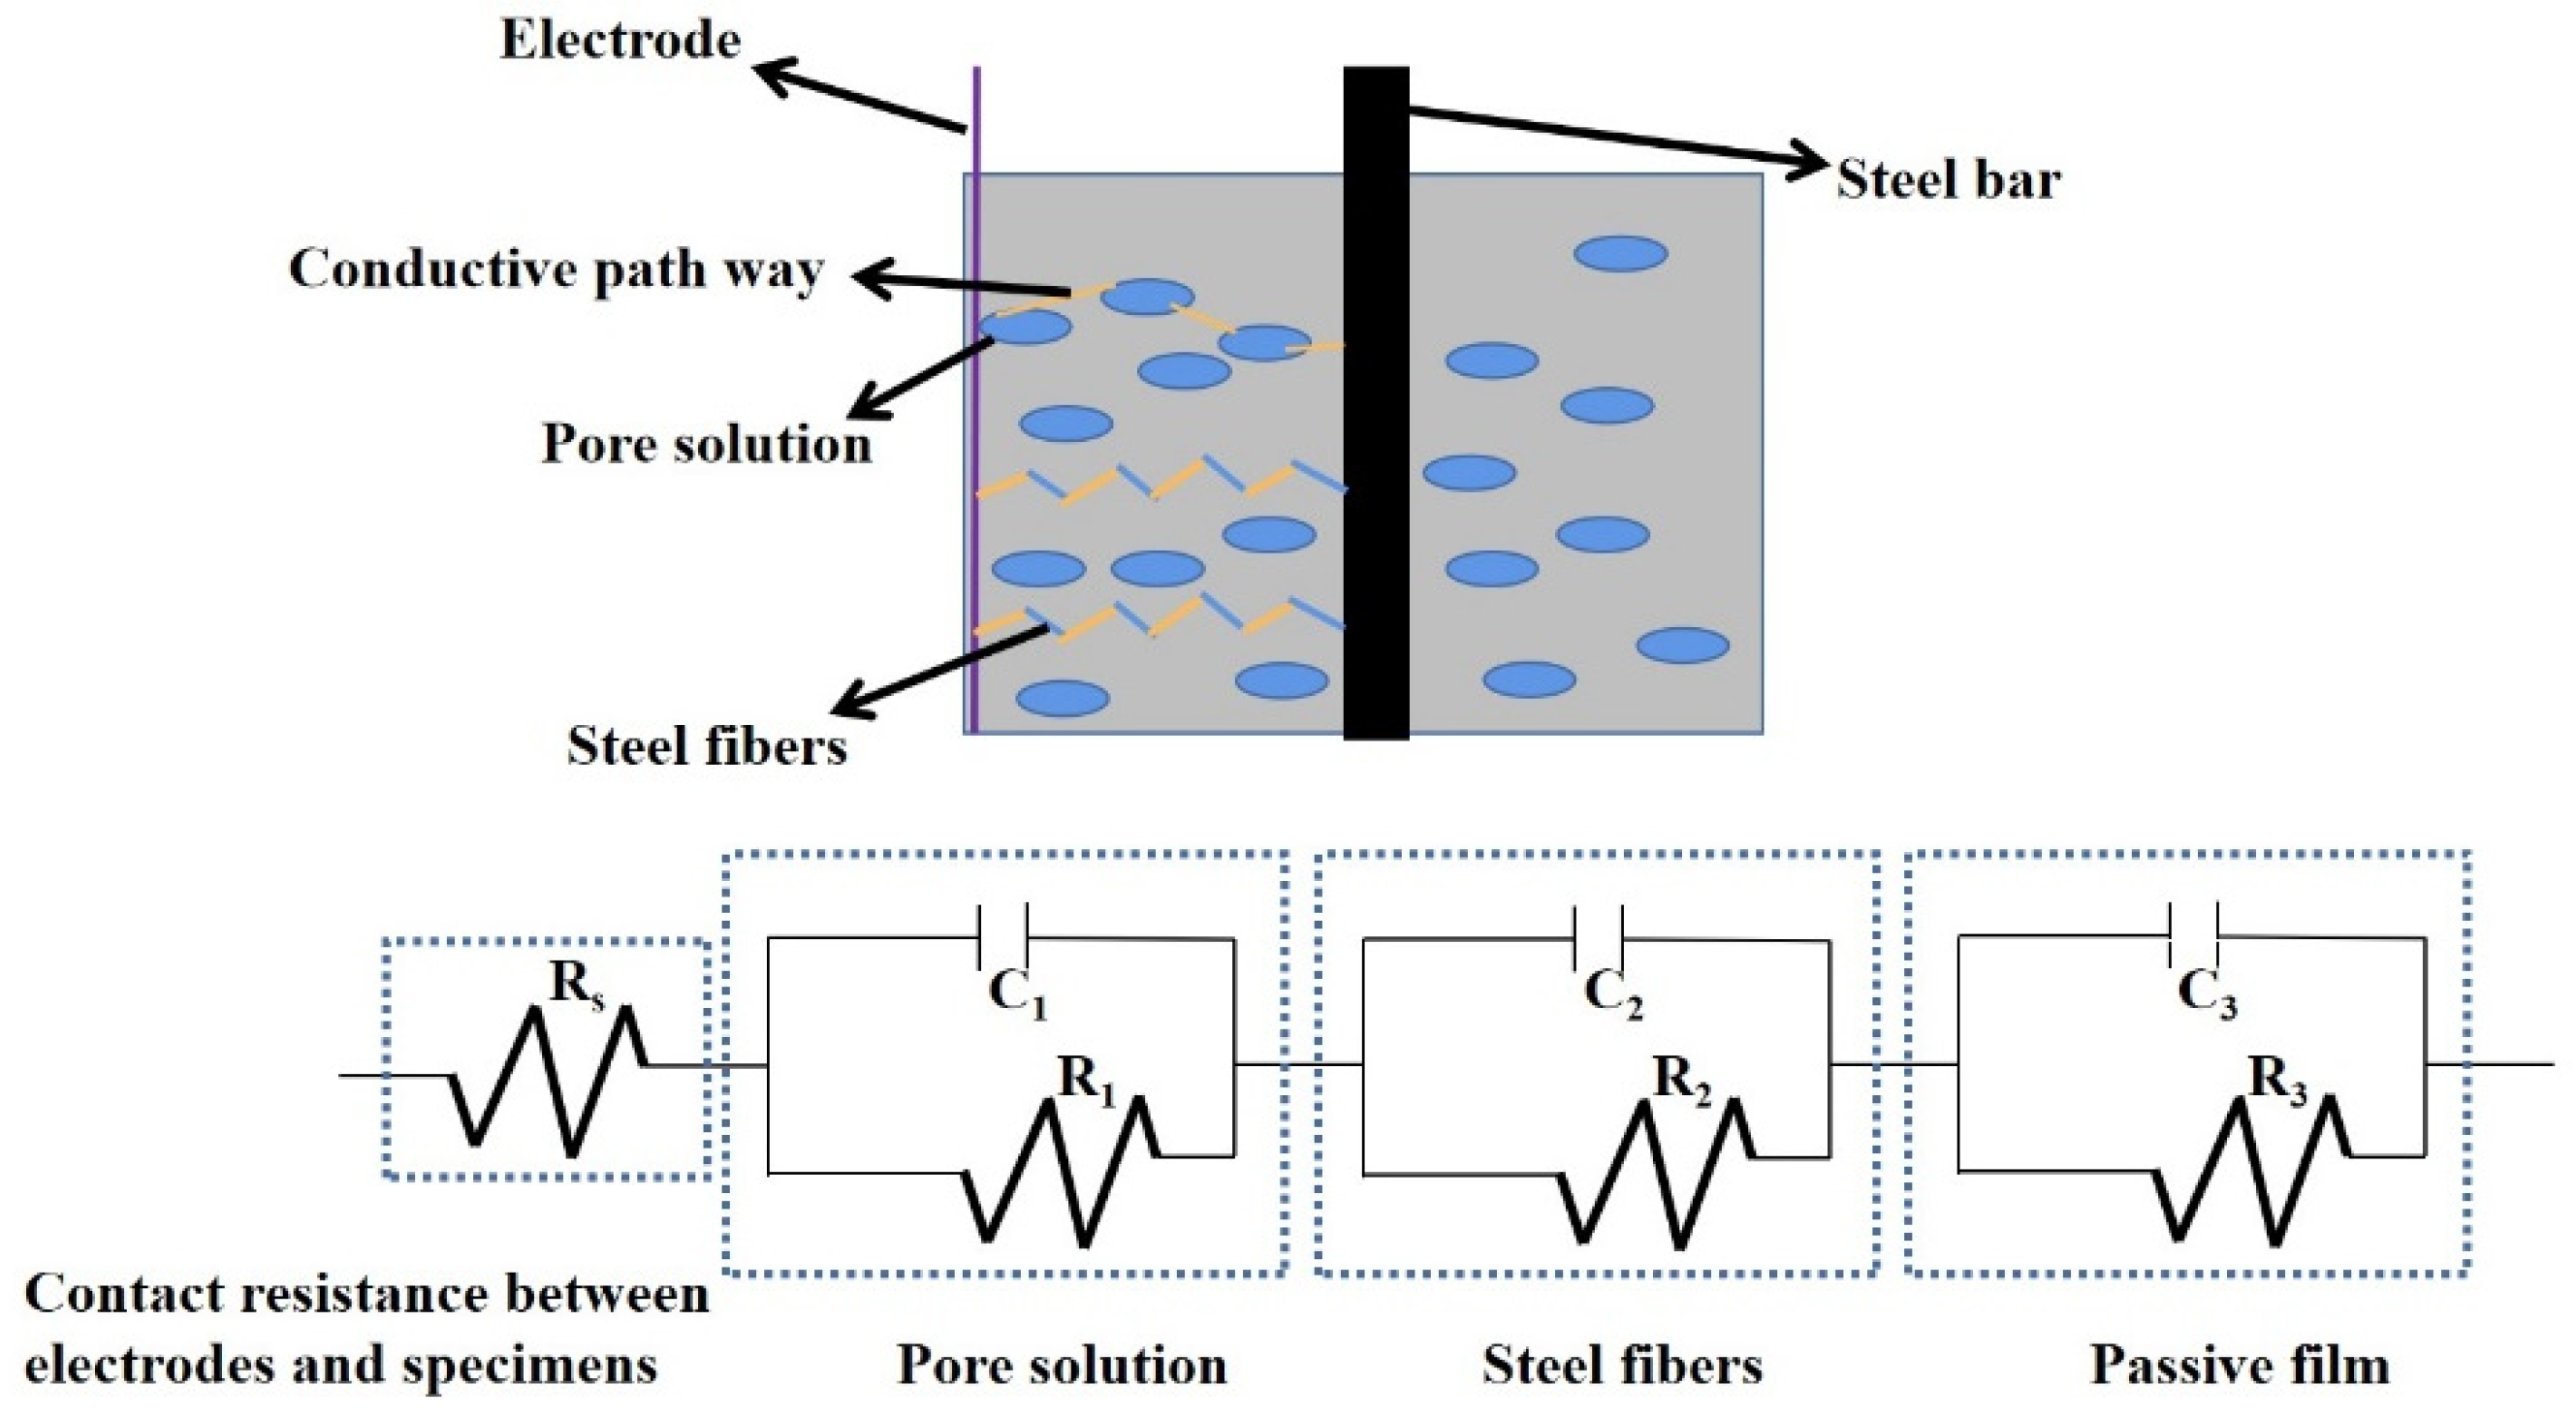
Figure 17 shows the equivalent circuit diagram of reinforced MPC-RPC. The electric circuit of reinforced MPC-RPC is consisted of three parallel electrical components (the parallel electrical resistance and reactance of passive film, steel fibers and pore solution), as detailed in Figure 17. The corresponding Chi-squared is lower than 0.01, indicating the rationality of equivalent circuit diagram.
Figure 18 shows the electrical resistivity calculated by the equivalent circuit diagram of Figure 17. As can be seen in observed from Figure 18, the electrical resistivity of passive film increases when the addition of steel fibers increases from 0% to 0.5%, the electrical resistance increases with amount of steel fibers used, due to the increased electrochemical corrosion of inner steel bars [55]. However, when the dosages of steel fibers increase from 0.5% to 3.0%, the electrical resistivity of passive film decreases with the increasing steel fibers. This is attributed to the improving effect of steel fibers on the corrosion resistance of steel bars. Finally, it can be found that the electrical resistivity of the passive film of the specimens after 30 NaCl D-W alternations is higher than that after 300 NaCl F-T cycles. Therefore, the steel bars inner MPC-RPC corrode more seriously after 30 NaCl D-W alternations than that after 300 NaCl F-T cycles.

4. Conclusions

This paper aims to develop the rapid repairing cement-based material named MPC-RPC. The corrosion resistance of reinforced MPC-RPC exposed to the environment of NaCl F-T cycles and D-W alternations is systematically studied. The working performance and mechanical properties of MPC-RPC are investigated. The corresponding corrosion resistance of reinforced MPC-RPC exposed to the environment of is obtained. The conclusions are derived as follows.
The slump flow and the setting time of fresh MPC-RPC are decreased by an increase in the dose of steel fibers. The lowest slump flow and the setting time are 33.2 min and 121.4 mm.
The addition of steel fibers demonstrates positive effect on the flexural and compressive strengths of hardened MPC-RPC. The flexural strength, the compressive strength and ultrasonic velocity of RPC cured for 3 h are higher than 45% of the MPC-RPC cured for 28 d. The flexural strength, the compressive strength and ultrasonic velocity of MPC-RPC cured for 7 d are higher than 85% of the specimens cured for 28 d. The increasing rate of flexural strength by steel fibers of MPC-RPC cured for 3 h is 0%~156.9%, meanwhile, when the curing ages are 1 d, 3 d and 28 d, the increasing rates are 0%~119.4%, 0%~61.4% and 0%~50%, respectively. Additionally, the increasing rates of compressive strength by steel fibers of specimens cured for 3 h, 1 d, 3 d and 28 d are 0%~30.4%, 0%~32.7%, 0%~64.8% and 0%~50%, respectively. The maximum increasing rate by steel fibers is 18.3%.
When the reinforced MPC-RPC is exposed to the NaCl F-T cycles and NaCl D-W alternations, the mass loss rate and the electrical resistivity increase in the form with the numbers of NaCl F-T cycles and NaCl D-W alternations. The electrical mechanism can be explained by an equivalent circuit, which is tandem parallel electrical resistance and reactance of pore solution, steel fibers and passive film. As obtained from the results of the ultrasonic velocity, the mass loss rate, and the AC impedance spectrum, the steel fibers can improve the corrosion resistance of reinforced MPC-RPC, except 0.5% steel fibers. Moreover, the reinforced MPC-RPC corrodes more seriously exposed to NaCl D-W alternations than NaCl F-T cycles.

Author Contributions

Data curation, Z.X. and D.W.; Formal analysis, Z.X.; Funding acquisition, H.W.; Investigation, Z.X., P.C. and D.W.; Methodology, D.W.; Project administration, Z.X. and H.W.; Resources, P.C.; Software, P.C.; Writing—original draft, Z.X.; Writing—review & editing, P.C. and H.W. All authors have read and agreed to the published version of the manuscript.

Funding

This research was funded by Zhejiang Provincial Natural Science Foundation grant number No. Y22E081344.

Institutional Review Board Statement

Not applicable.

Informed Consent Statement

Not applicable.

Conflicts of Interest

The authors declare no conflict of interest.

Appendix A

Table A1. The working performance of MPC-RPC.
Steel Fibers’ Ratio (%)Slump Flow (mm)Error Bars’ Values of Slump FlowSetting Time (min)Error Bars’ Values of Setting TimeDecreasing Rate of Slump Flow (%)Decreasing Rate of Setting Time (%)
0.00 181.30 6.40 56.10 3.20 0.00 0.00
0.50 175.10 5.10 48.30 2.80 3.42 13.90
1.00 170.20 3.80 46.70 4.10 6.12 16.76
1.50 160.30 4.20 41.20 3.20 11.58 26.56
2.00 151.80 3.70 38.60 1.80 16.27 31.19
2.50 143.20 5.50 36.50 2.10 21.01 34.94
3.00 121.40 4.30 33.20 2.50 33.04 40.82
Table A2. The flexural strength strengths of MPC-RPC (MPa).
Steel Fibers’ Ratio (%)3 hError Bars of 3 h1 DayError Bars of 1 Day3 DaysError Bars of 3 Days28 DaysError Bars of 28 Days
05.10.366.20.4810.10.5711.20.88
0.55.80.416.50.5310.90.6512.40.94
17.10.557.60.5911.30.8613.21.05
1.510.10.7910.80.8613.20.9114.21.03
211.80.9812.70.9814.10.8415.30.92
2.512.41.0113.11.0115.61.2116.10.89
313.10.8613.60.9516.31.3316.81.06
Table A3. The compressive strength of MPC-RPC (MPa).
Steel Fibers’ Ratio (%)3 hError Bars of 3 h1 DayError Bars of 1 Day3 DaysError Bars of 3 Days28 DaysError Bars of 28 Days
035.81.4437.91.9253.12.2862.33.52
0.538.11.6439.62.1261.32.671.53.76
140.32.242.12.3671.63.4476.84.2
1.543.13.1644.63.4480.33.6487.14.12
245.23.9247.13.9286.13.3691.33.68
2.546.14.0448.94.0487.34.8492.63.56
346.73.4450.33.887.55.3293.14.24
Table A4. The ultrasonic velocity of MPC-RPC (m/s).
Steel Fibers’ Ratio (%)3 hError Bars of 3 h1 DayError Bars of 1 Day3 DaysError Bars of 3 Days28 DaysError Bars of 28 Days
03.80.364.120.324.2010.264.380.32
0.53.850.324.230.344.350.314.410.27
13.960.354.280.264.410.284.480.21
1.54.010.284.310.224.450.354.520.35
24.120.364.420.314.480.334.580.28
2.54.230.314.510.274.540.394.630.31
34.310.294.530.264.580.254.650.33

References

  1. Shah, J. Laboratory characterization of controlled low-strength material and its application to construction of flexible pipe drainage system. Health Manpow. Manag. 2000, 19, 30–59. [Google Scholar]
  2. Haselbach, L.; Valavala, S.; Montes, F. Permeability predictions for sand clogged Portland cement pervious concrete pavement systems. J. Environ. Manag. 2005, 81, 42–49. [Google Scholar] [CrossRef]
  3. Halit, Y.; Mert, Y.Y.; Hüseyin, Y.; Serdar, A.; Selçuk, T. Mechanical properties of reactive powder concrete containing high volumes of ground granulated blast furnace slag. Cem. Concr. Compos. 2010, 32, 639–648. [Google Scholar]
  4. Ding, Y.; Huang, Y.; Zhang, Y.; Jalali, S.; Aguiar, J. Self-monitoring of freeze-thaw damage using triphasic electric conductive concrete. Constr. Build. Mater. 2015, 101, 440–446. [Google Scholar] [CrossRef]
  5. Gao, Y.; Qu, L.; He, B.; Dai, K.; Fang, Z.; Zhu, R. Study on effectiveness of anti-icing and deicing performance of super-hydrophobic asphalt concrete. Constr. Build. Mater. 2018, 191, 270–280. [Google Scholar] [CrossRef]
  6. Jiang, W.; Shen, X.; Xia, J.; Mao, L.; Yang, J.; Liu, Q. A numerical study on chloride diffusion in freeze-thaw affected concrete. Constr. Build. Mater. 2018, 179, 553–565. [Google Scholar] [CrossRef]
  7. Wei, Y.; Gao, X.; Zhang, Q. Evaluating performance of concrete pavement joint repair using different materials to reduce reflective cracking in asphalt concrete overlay. Road Mater. Pavement Des. 2014, 15, 966–976. [Google Scholar] [CrossRef]
  8. Qiao, F.; Chau, C.; Li, Z. Property evaluation of magnesium phosphate cement mortar as patch repair material. Constr. Build. Mater. 2010, 24, 695–700. [Google Scholar] [CrossRef]
  9. Hong, X.; Wang, H.; Shi, F. Influence of NaCl freeze thaw cycles and cyclic loading on the mechanical performance and permeability of sulphoaluminate cement reactive powder concrete. Coatings 2020, 10, 1227. [Google Scholar] [CrossRef]
  10. Wang, Y.; Ye, J.; Liu, Y.; Qiang, X.; Feng, L. Influence of freeze–thaw cycles on properties of asphalt-modified epoxy repair materials. Constr. Build. Mater. 2013, 41, 580–585. [Google Scholar] [CrossRef]
  11. Du, Y.; Wang, Z.; Gao, P.; Yang, J.; Zhen, S.; Wang, H.; Du, T. The Effect of Magnesium Chloride on the Macroscopic and MI-Croscopic Properties of Phosphate Cement-Based Materials. Coatings 2022, 12, 370. [Google Scholar] [CrossRef]
  12. Xu, L.; Liu, S.; Li, N.; Peng, Y.; Wu, K.; Wang, P. Retardation effect of elevated temperature on the setting of calcium sulfoaluminate cement clinker. Constr. Build. Mater. 2018, 178, 112–119. [Google Scholar] [CrossRef]
  13. Mestres, G.; Aguilera, F.S.; Manzanares, N.; Sauro, S.; Osorio, R.; Toledano, M.; Ginebra, M.P. Magnesium phosphate cements for endodontic applications with improved long-term sealing ability. Int. Endod. J. 2014, 47, 127–139. [Google Scholar] [CrossRef]
  14. Ding, Z.; Dong, B.; Xing, F.; Han, N.; Li, Z. Cementing mechanism of potassium phosphate based magnesium phosphate cement. Ceram. Int. 2012, 38, 6281–6288. [Google Scholar] [CrossRef]
  15. Ostrowski, N.; Roy, A.; Kumta, P.N. Magnesium phosphate cement systems for hard tissue applications: A review. ACS Biomater. Sci. Eng. 2016, 2, 1067–1083. [Google Scholar] [CrossRef]
  16. Cao, Z.; Lu, F.; Qiu, P.; Yang, F.; Liu, G.; Wang, S.; Zhong, H. Formation of a hydrophobic and corrosion resistant coating on manganese surface via stearic acid and oleic acid diethanolamide. Colloids Surf. A 2018, 555, 372–380. [Google Scholar] [CrossRef]
  17. Du, Y.; Gao, P.; Yang, J.; Shi, F. Research on the Chloride Ion Penetration Resistance of Magnesium Phosphate Cement (MPC) Material as Coating for Reinforced Concrete Structures. Coatings 2020, 10, 1145. [Google Scholar] [CrossRef]
  18. Li, Y.; Chen, B. Factors that affect the properties of magnesium phosphate cement. Constr. Build. Mater. 2013, 47, 977–983. [Google Scholar] [CrossRef]
  19. Zhang, L.; Zhang, A.; Wang, Q.; Han, Y.; Tang, Z. Corrosion resistance of wollastonite modified magnesium phosphate cement paste exposed to freeze-thaw cycles and acid-base corrosion. Case Stud. Constr. Mater. 2020, 13, e00421. [Google Scholar] [CrossRef]
  20. Shi, W.; Wang, T.Z.; Dong, Z.H.; Guo, X.P. Application of wire beam electrode technique to investigate the migrating behavior of corrosion inhibitors in mortar. Constr. Build. Mater. 2017, 134, 167–175. [Google Scholar] [CrossRef]
  21. Wang, H.; Zhang, A.; Zhang, L.; Liu, J.; Han, Y.; Shu, H.; Wang, J. Study on the influence of compound rust inhibitor on corrosion of steel bars in chloride concrete by electrical parameters. Constr. Build. Mater. 2020, 262, 120763. [Google Scholar] [CrossRef]
  22. Goyal, A.; Ganjian, E.; Pouya, H.S.; Tyrerd, M. Inhibitor efficiency of migratory corrosion inhibitors to reduce corrosion in reinforced concrete exposed to high chloride environment. Constr. Build. Mater. 2021, 303, 124461. [Google Scholar] [CrossRef]
  23. Harb, M.B.; Abubshait, S.; Etteyeb, N.; Kamoun, M.; Dhouib, A. Olive leaf extract as a green corrosion inhibitor of reinforced concrete contaminated with seawater. Arab. J. Chem. 2020, 13, 4846–4856. [Google Scholar] [CrossRef]
  24. Jiang, C.; Wub, Y.; Dai, M. Degradation of steel-to-concrete bond due to corrosion. Constr. Build. Mater. 2018, 158, 1073. [Google Scholar] [CrossRef]
  25. Lei, L.; Wang, Q.; Xu, S.; Wang, N.; Zheng, X. Fabrication of superhydrophobic concrete used in marine environment with anti-corrosion and stable mechanical properties. Constr. Build. Mater. 2020, 251, 118946. [Google Scholar] [CrossRef]
  26. Liang, J.; Zhu, H.; Chen, L.; Qinglin, X.; Ying, G. Rebar corrosion investigation in rubber aggregate concrete via the chloride electro-accelerated test. Materials 2019, 126, 862. [Google Scholar] [CrossRef]
  27. Wang, N.; Wang, Q.; Xu, S.; Zheng, X. Eco-Friendly and safe method of fabricating superhydrophobic surfaces on stainless steel substrates. J. Phys. Chem. C 2019, 123, 25738–25746. [Google Scholar] [CrossRef]
  28. Xu, Q.; Ji, T.; Yang, Z.; Ye, Y. Steel rebar corrosion in artificial reef concrete with sulphoaluminate cement, sea water and marine sand. Constr. Build. Mater. 2019, 227, 116685. [Google Scholar] [CrossRef]
  29. Song, J.; Li, Y.; Xu, W.; Liu, H.; Xu, Y. Inexpensive and non-fluorinated superhydrophobic concrete coating for anti-icing and anti-corrosion. J. Colloid Interface Sci. 2019, 514, 86–92. [Google Scholar] [CrossRef]
  30. Du, Y.; Wang, S.; Hao, W.; Shi, F.; Wang, H.; Xu, F.; Du, T. Investigations of the Mechanical Properties and Durability of Reactive Powder Concrete Containing Waste Fly Ash. Buildings 2022, 12, 560. [Google Scholar] [CrossRef]
  31. You, C.; Qian, J.; Qin, J.; Wang, H.; Wang, Q.; Ye, Z. Effect of early hydration temperature on hydration product and strength development of magnesium phosphate cement (MPC). Cem. Concr. Res. 2015, 78, 179–189. [Google Scholar] [CrossRef]
  32. Seehra, S.; Gupta, S.; Kumar, S. Rapid setting magnesium phosphate cement for quick repair of concrete pavements-characterisation and durability aspects. Cem. Concr. Res. 1993, 23, 254–266. [Google Scholar] [CrossRef]
  33. GB/T2419-2005; Test Method for Fluidity of Cement Mortar. The State Bureau of Quality and Technical Supervision: Beijing, China, 2005.
  34. JGJ/T70-2009; Standard for Test Method of Basic Properties of Construction Mortar. Ministry of Housing and Urban-Rural Development of the People’s Republic of China: Beijing, China, 2009.
  35. GB/T17671-1999; Method of Testing Cements—Determination of Strength. The State Bureau of Quality and Technical Supervision: Beijing, China, 1999.
  36. Wang, H.; Shen, J.; Liu, J.; Lu, S.; He, G. Influence of carbon nanofiber content and sodium chloride solution on the stability of resistance and the following self-sensing performance of carbon nanofiber cement paste. Case Stud. Constr. Mater. 2019, 11, e00247. [Google Scholar] [CrossRef]
  37. Cui, L.; Wang, H. Research on the Mechanical Strengths and the Following Corrosion Resistance of Inner Steel Bars of RPC with Rice Husk Ash and Waste Fly Ash. Coatings 2021, 11, 1480. [Google Scholar] [CrossRef]
  38. Tibebu, A.; Mekonnen, E.; Kumar, L.; Chimdi, J.; Hailu, H.; Fikadu, N. Compression and workability behavior of chopped glass fiber reinforced concrete. Mater. Today Proc. 2022, 62, 5087–5094. [Google Scholar] [CrossRef]
  39. Kakooei, S.; Akil, H.; Jamshidi, M.; Rouhi, J. The effects of polypropylene fibers on the properties of reinforced concrete structures. Constr. Build. Mater. 2012, 27, 73–77. [Google Scholar] [CrossRef]
  40. Yang, J.; Li, T.; Xu, X. Effect of Fine Aggregates on Properties of Magnesium Potassium Phosphate Cement Mortar. J. Mater. Civ. Eng. 2017, 29, 06017012. [Google Scholar]
  41. Li, Y.; Shi, T.; Li, Y.; Bai, W.; Lin, H. Damage of magnesium potassium phosphate cement under dry and wet cycles and sulfate attack. Constr. Build. Mater. 2019, 210, 111–117. [Google Scholar] [CrossRef]
  42. Wu, C.; Yu, H. Preparation and properties of modified magnesium oxysulfate cement derived from waste sulfuric acid. Adv. Cem. Res. 2016, 28, 178–188. [Google Scholar]
  43. Huang, G.; Wang, H.; Shi, F. Coupling Effect of Salt Freeze-Thaw Cycles and Carbonation on the Mechanical Performance of Quick Hardening Sulphoaluminate Cement-Based Reactive Powder Concrete with Basalt Fibers. Coatings 2021, 11, 1142. [Google Scholar] [CrossRef]
  44. Wang, H.; Shi, F.; Shen, J.; Zhang, A.; Zhang, L.; Huang, H.; Liu, J.; Jin, K.; Feng, L.; Tang, Z. Research on the self-sensing and mechanical properties of aligned stainless steel fiber reinforced reactive powder concrete. Cem. Concr. Compos. 2021, 119, 104001. [Google Scholar] [CrossRef]
  45. Velazco, G.; Almanza, J.M.; Cortés, D.A.; Escobedo, J.C.; Escalante-Garcia, J.I. Effect of citric acid and the hemihydrate amount on the properties of a calcium sulphoaluminate cement. Mater. Constr. 2014, 64, e036. [Google Scholar] [CrossRef]
  46. Dong, S.; Han, B.; Ou, J.; Li, Z.; Han, L.; Yu, X.; Li, Z.; Han, L.; Yu, X. Electrically conductive behaviors and mechanisms of short-cut super-fine stainless wire reinforced reactive powder concrete. Cem. Concr. Compos. 2016, 72, 48–65. [Google Scholar] [CrossRef]
  47. Liu, Q.; Iqbal, M.; Yang, J.; Lu, X.Y.; Zhang, P.; Rauf, M. Prediction of chloride diffusivity in concrete using artificial neural network: Modelling and performance evaluation. Constr. Build. Mater. 2021, 266, 12108. [Google Scholar] [CrossRef]
  48. Shi, X.; Fay, L.; Peterson, M. Freeze-thaw damage and chemical change of a portland cement concrete in the presence of diluted deicers. Mater. Struct. 2010, 43, 933–946. [Google Scholar] [CrossRef]
  49. Wang, H.; Gao, X.; Liu, J. Effects of salt freeze-thaw cycles and cyclic loading on the piezoresistive properties of carbon nano-fibers mortar. Constr. Build. Mater. 2018, 177, 192–201. [Google Scholar] [CrossRef]
  50. Wang, H.; Gao, X.; Liu, J. Coupling effect of salt freeze-thaw cycles and cyclic loading on performance degradation of carbon nanofiber mortar. Cold Reg. Sci. Technol. 2018, 154, 95–102. [Google Scholar] [CrossRef]
  51. Cao, H.; Liang, Z.; Peng, X.; Cai, X.; Wang, K.; Wang, H.; Lyu, Z. Research of Carbon Dioxide Curing on the Properties of Reactive Powder Concrete with Assembly Unit of Sulphoaluminate Cement and Ordinary Portland Cement. Coatings 2022, 12, 209. [Google Scholar] [CrossRef]
  52. Castellote, M.; Andrade, C.; Turrillas, X.; Campo, J.; Cuello, G.J. Accelerated carbonation of cement pastes in situ monitored by neutron diffraction. Cem. Concr. Res. 2008, 38, 1365–1373. [Google Scholar] [CrossRef]
  53. Gaitero, J.J.; Campillo, I.; Guerrero, A. Reduction of the calcium leaching rate of cement paste by addition of silica nanoparticles. Cem. Concr. Res. 2008, 38, 1112–1118. [Google Scholar] [CrossRef]
  54. Wang, H.; Jin, K.; Zhang, A.; Zhang, L.; Han, Y.; Liu, J.; Shi, F.; Feng, L. External erosion of sodium chloride on the degradation of self-sensing and mechanical properties of aligned stainless steel fiber reinforced reactive powder concrete. Constr. Build. Mater. 2021, 287, 06629. [Google Scholar] [CrossRef]
  55. Zhu, J.; Liu, S.; Song, L.; Qu, Z.; Wang, H. Influence of Carbon Dioxide Curing on the Corrosion Resistance of Reinforced Cement Mortar under the External Erosion of NaCl Freeze–Thaw Cycle. Appl. Sci. 2022, 12, 5061. [Google Scholar] [CrossRef]
  56. Li, J.; Yang, S.; Liu, Y.; Muhammad, Y.; Su, Z.; Yang, J. Studies on the properties of modified heavy calcium carbonate and SBS composite modified asphalt. Constr. Build. Mater. 2019, 218, 413–423. [Google Scholar] [CrossRef]
  57. Alhozaimy, A.; Hussain, R.R.; Al-Negheimish, A. Electro-chemical investigation for the effect of rebar source and surface condition on the corrosion rate of reinforced concrete structures under varying corrosive environments. Constr. Build. Mater. 2020, 244, 118317. [Google Scholar] [CrossRef]
Figure 1. The process of measuring mechanical strength.
Materials 15 05692 g001
Figure 2. The ultrasonic velocity test process.
Materials 15 05692 g002
Figure 3. The measurement of AC electrical parameters.
Materials 15 05692 g003
Figure 4. The ultrasonic velocity’s measurement.
Materials 15 05692 g004
Figure 5. Measurement of AC electrical parameters.
Materials 15 05692 g005
Figure 6. The working performance of MPC-RPC.
Materials 15 05692 g006
Figure 7. The mechanical strengths of MPC-RPC. (a) The flexural strength. (b) The compressive strength.
Materials 15 05692 g007
Figure 8. Ultrasonic velocity of MPC-RPC.
Materials 15 05692 g008
Figure 9. Electrical resistivity of MPC-RPC.
Materials 15 05692 g009
Figure 10. The mass loss rate of reinforced MPC-RPC during NaCl F-T cycles.
Materials 15 05692 g010
Figure 11. The ultrasonic velocity of MPC-RPC during NaCl F-T cycles.
Materials 15 05692 g011
Figure 12. The electrical resistivity of MPC-RPC during NaCl F-T cycles.
Materials 15 05692 g012
Figure 13. Mass loss rate of steel bars reinforced MPC-RPC during NaCl D-W alternations.
Materials 15 05692 g013
Figure 14. The ultrasonic velocity of MPC-RPC during NaCl D-W alternations.
Materials 15 05692 g014
Figure 15. The electrical resistivity of MPC-RPC during NaCl D-W alternations.
Materials 15 05692 g015
Figure 16. AC impedance spectrum curves of reinforced MPC-RPC. (a) Before corrosion. (b) After 300 NaCl F-T cycles. (c) After 30 NaCl D-W alternations.
Materials 15 05692 g016aMaterials 15 05692 g016b
Figure 17. AC impedance spectrum curves.
Materials 15 05692 g017
Figure 18. The electrical resistivity of the passive film through equivalent circuit diagram.
Materials 15 05692 g018
Table 1. Particle passing percentage of raw materials (%).
Materials0.3 μm0.6 μm1 μm4 μm8 μm64 μm360 μm
BFS0.030.13.519.635.097.9100.0
Quartz sand0.00.00.00.00.0320.0100.0
FA12.341.766.2100.0100.0100.0100.0
Table 2. The chemical composition of cement (%).
MaterialsSiO2Al2O3FexOyMgOCaOSO3K2ONa2OTi2OLoss on Ignition
BFS34.1014.700.209.7035.900.202.902.30
Quartz sand99.600.40
FA55.0020.006.0010.204.500.111.262.130.060.74
Table 3. The mix of RPC per unit volume (kg/m3).
SamplesWaterMgOMgCl2BoraxK2HPO4FABFSQuartz SandSteel Fibers
MPC-RPC-0183.3695.517.413.913.9370.3111.1977.90
MPC-RPC-0.5183.3695.517.413.913.9370.3111.1977.939.3
MPC-RPC-1.0183.3695.517.413.913.9370.3111.1977.978.5
MPC-RPC-1.5183.3695.517.413.913.9370.3111.1977.9117.8
MPC-RPC-2.0183.3695.517.413.913.9370.3111.1977.9157.0
MPC-RPC-2.5183.3695.517.413.913.9370.3111.1977.9196.3
MPC-RPC-3.0183.3695.517.413.913.9370.3111.1977.9235.5
Table 4. The fitting results of the relationship between ρ and V.
Equation Curing AgeabcR2
ρ = a V 2 + b V + c 3 h182.56−992.641403.840.99
1 day589.15−2863.593506.890.99
3 days832.44−4457.686240.320.99
28 days998.57−5745.318735.051.00
Table 5. The fitting results of the relationship between (Δm/m) and the N.
Equation Steel Fibers’ RatioabcR2
Δ m m = a N 2 + b N + c 0%3.90 × 10−53.56 × 10−3−0.290.97
0.5%3.63 × 10−54.69 × 10−3−0.110.99
1.0%3.35 × 10−56.26 × 10−3−0.0770.99
1.5%3.13 × 10−56.95 × 10−3−0.0490.99
2.0%2.86 × 10−58.22 × 10−3−0.0550.99
2.5%2.67 × 10−54.19 × 10−3−0.0420.99
3.0%2.78 × 10−52.05 × 10−3−0.005951.00
Table 6. The fitting results of the relationship between ρ and the N.
Equation Steel Fibers’ RatioabcR2
ρ = a N 2 + b N + c 0%0.2280.256701.00
0.5%0.1716161900.99
1.0%0.1893.720001.00
1.5%0.2566.76721.00
2.0%0.2334.17031.00
2.5%0.34−18.68960.99
3.0%0.34−43.412100.99
Table 7. The fitting results of the relationship between (Δm/m) and n.
Equation Steel Fibers’ RatioabcR2
Δ m m = a n 2 + b n + c 0%1.50 × 10−39.79 × 10−24.85 × 10−21.00
0.5%1.80 × 10−35.29 × 10−23.90 × 10−20.99
1.0%1.00 × 10−35.88 × 10−28.00 × 10−31.00
1.5%1.20 × 10−34.72 × 10−22.20 × 10−21.00
2.0%9.00 × 10−34.50 × 10−22.50 × 10−21.00
2.5%8.30 × 10−43.56 × 10−23.05 × 10−20.99
3.0%6.50 × 10−43.07 × 10−22.70 × 10−20.99
Table 8. The fitting results of the relationship between ρ and the n.
Equation Steel Fibers’ RatioabcR2
ρ = a n 2 + b n + c 0%4.15105084501.00
0.5%6.01105058501.00
1.0%0.18614742100.99
1.5%7.1922823401.00
2.0%0.27719013801.00
2.5%0.5050.8116541.00
3.0%0.215−0.144341.00
Publisher’s Note: MDPI stays neutral with regard to jurisdictional claims in published maps and institutional affiliations.

