
Relationship between Biodegradation Rate and Grain Size Itself Excluding Other Structural Factors Caused by Alloying Additions and Deformation Processing for Pure Mg


Abstract
:1. Introduction
2. Experimental Procedures
3. Results
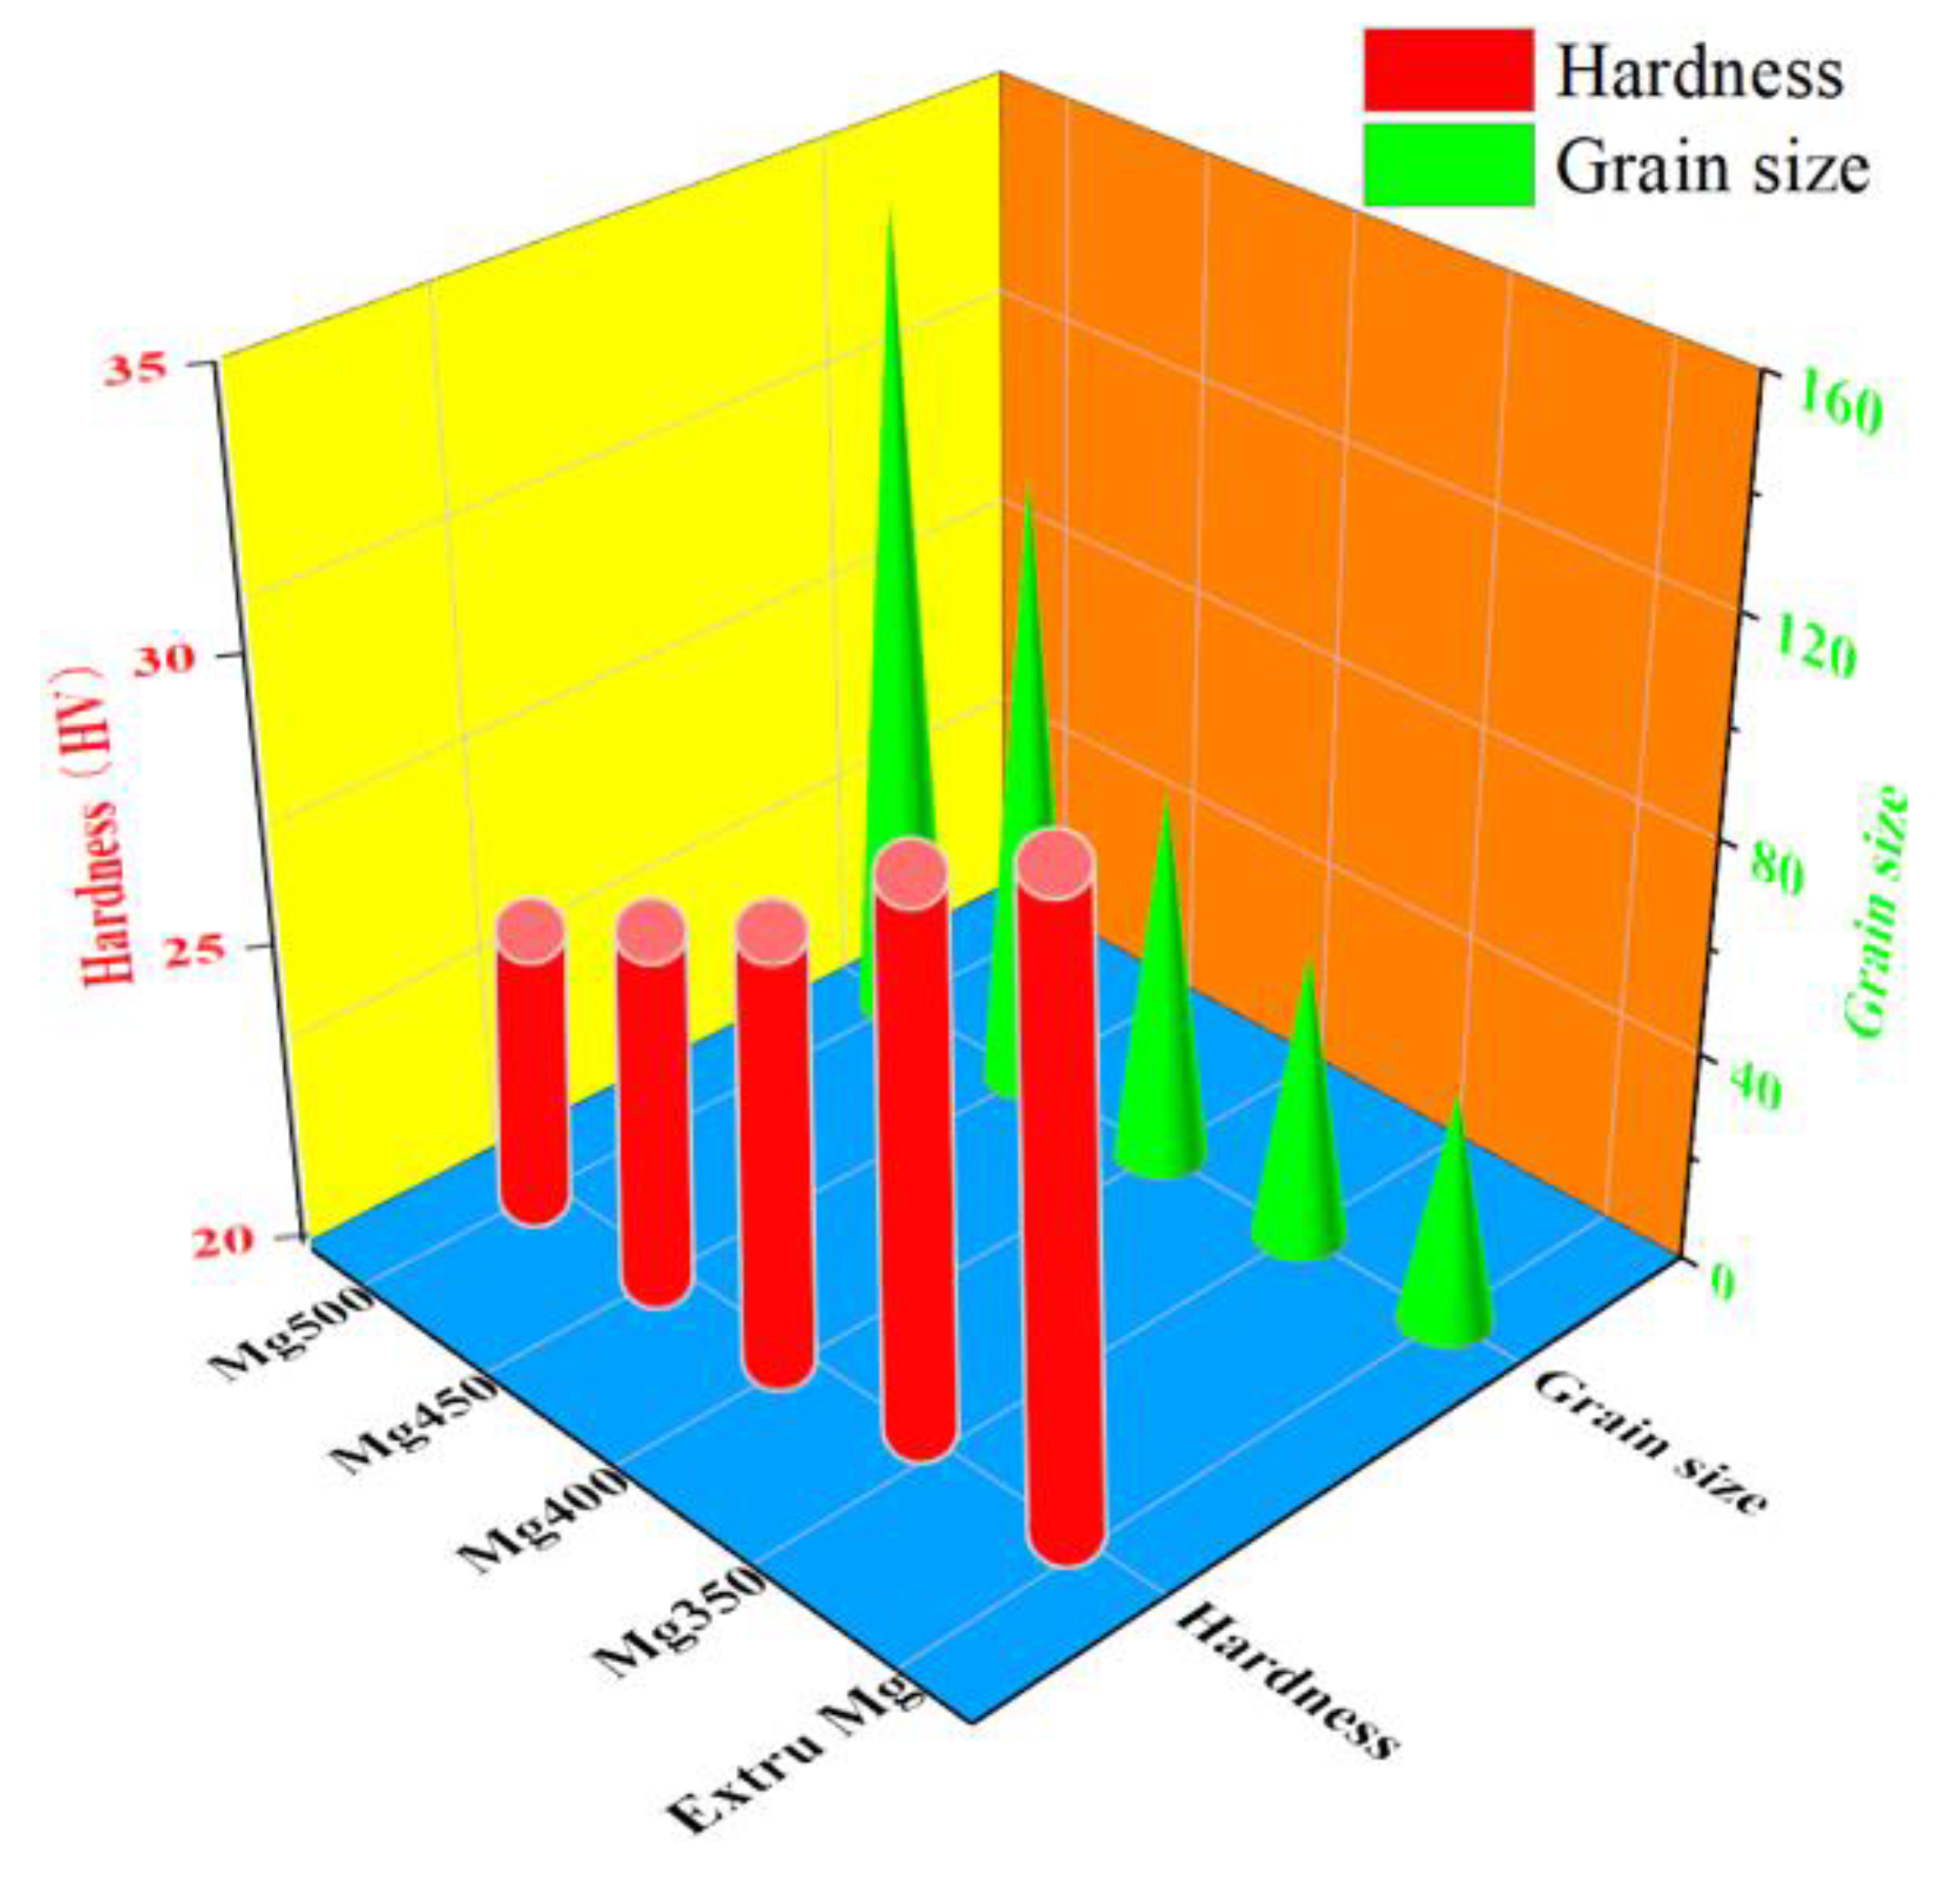
3.1. Grain Size and Hardness
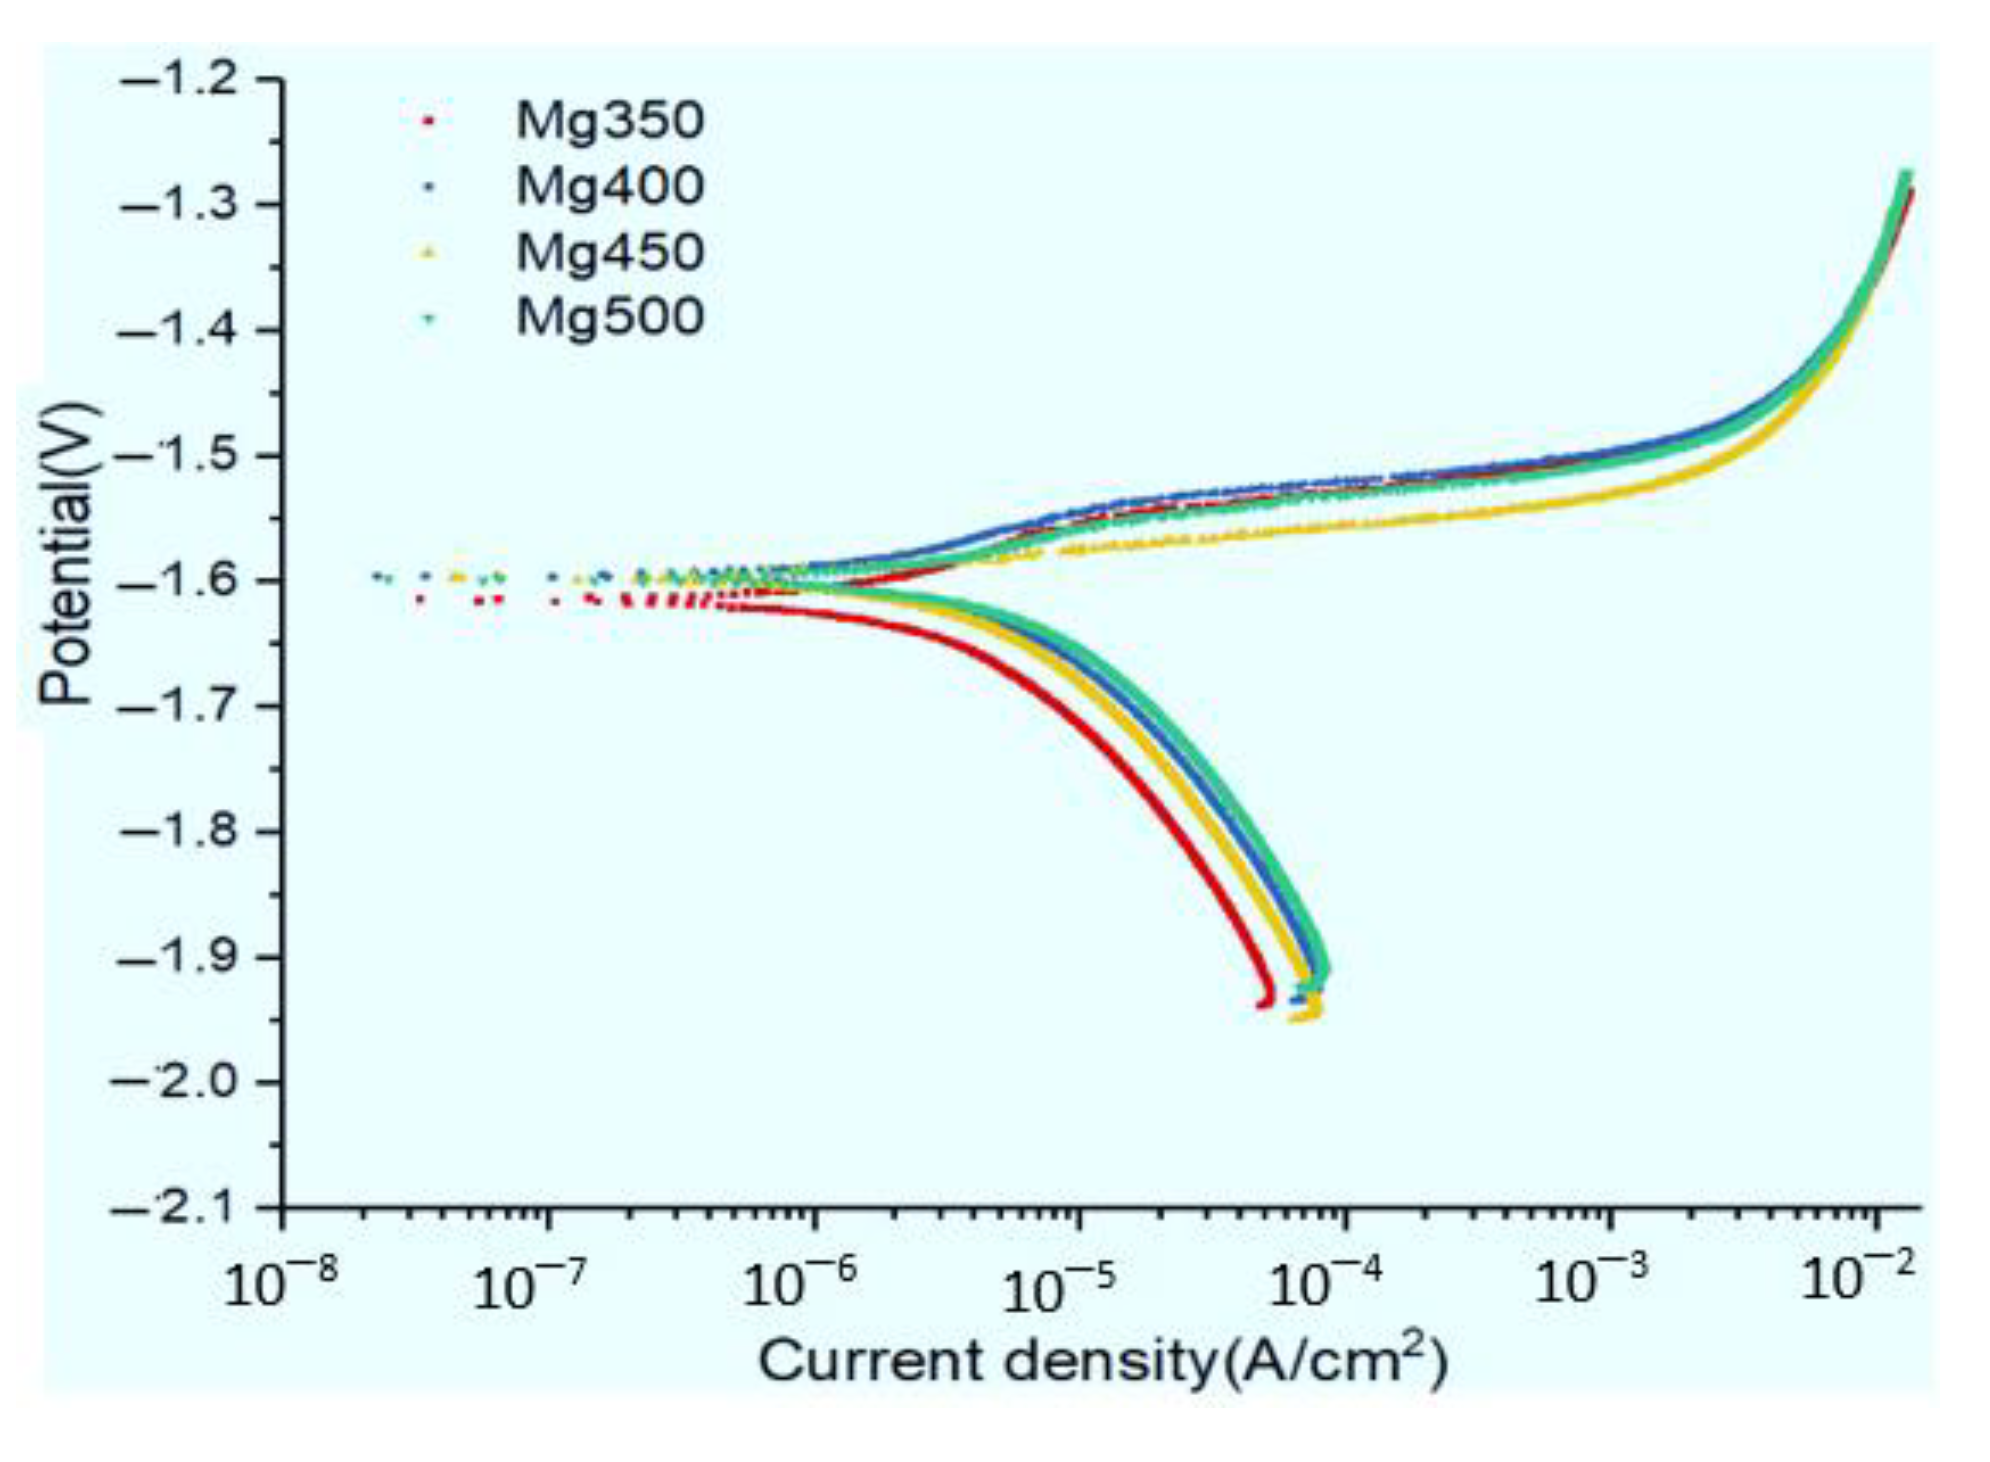
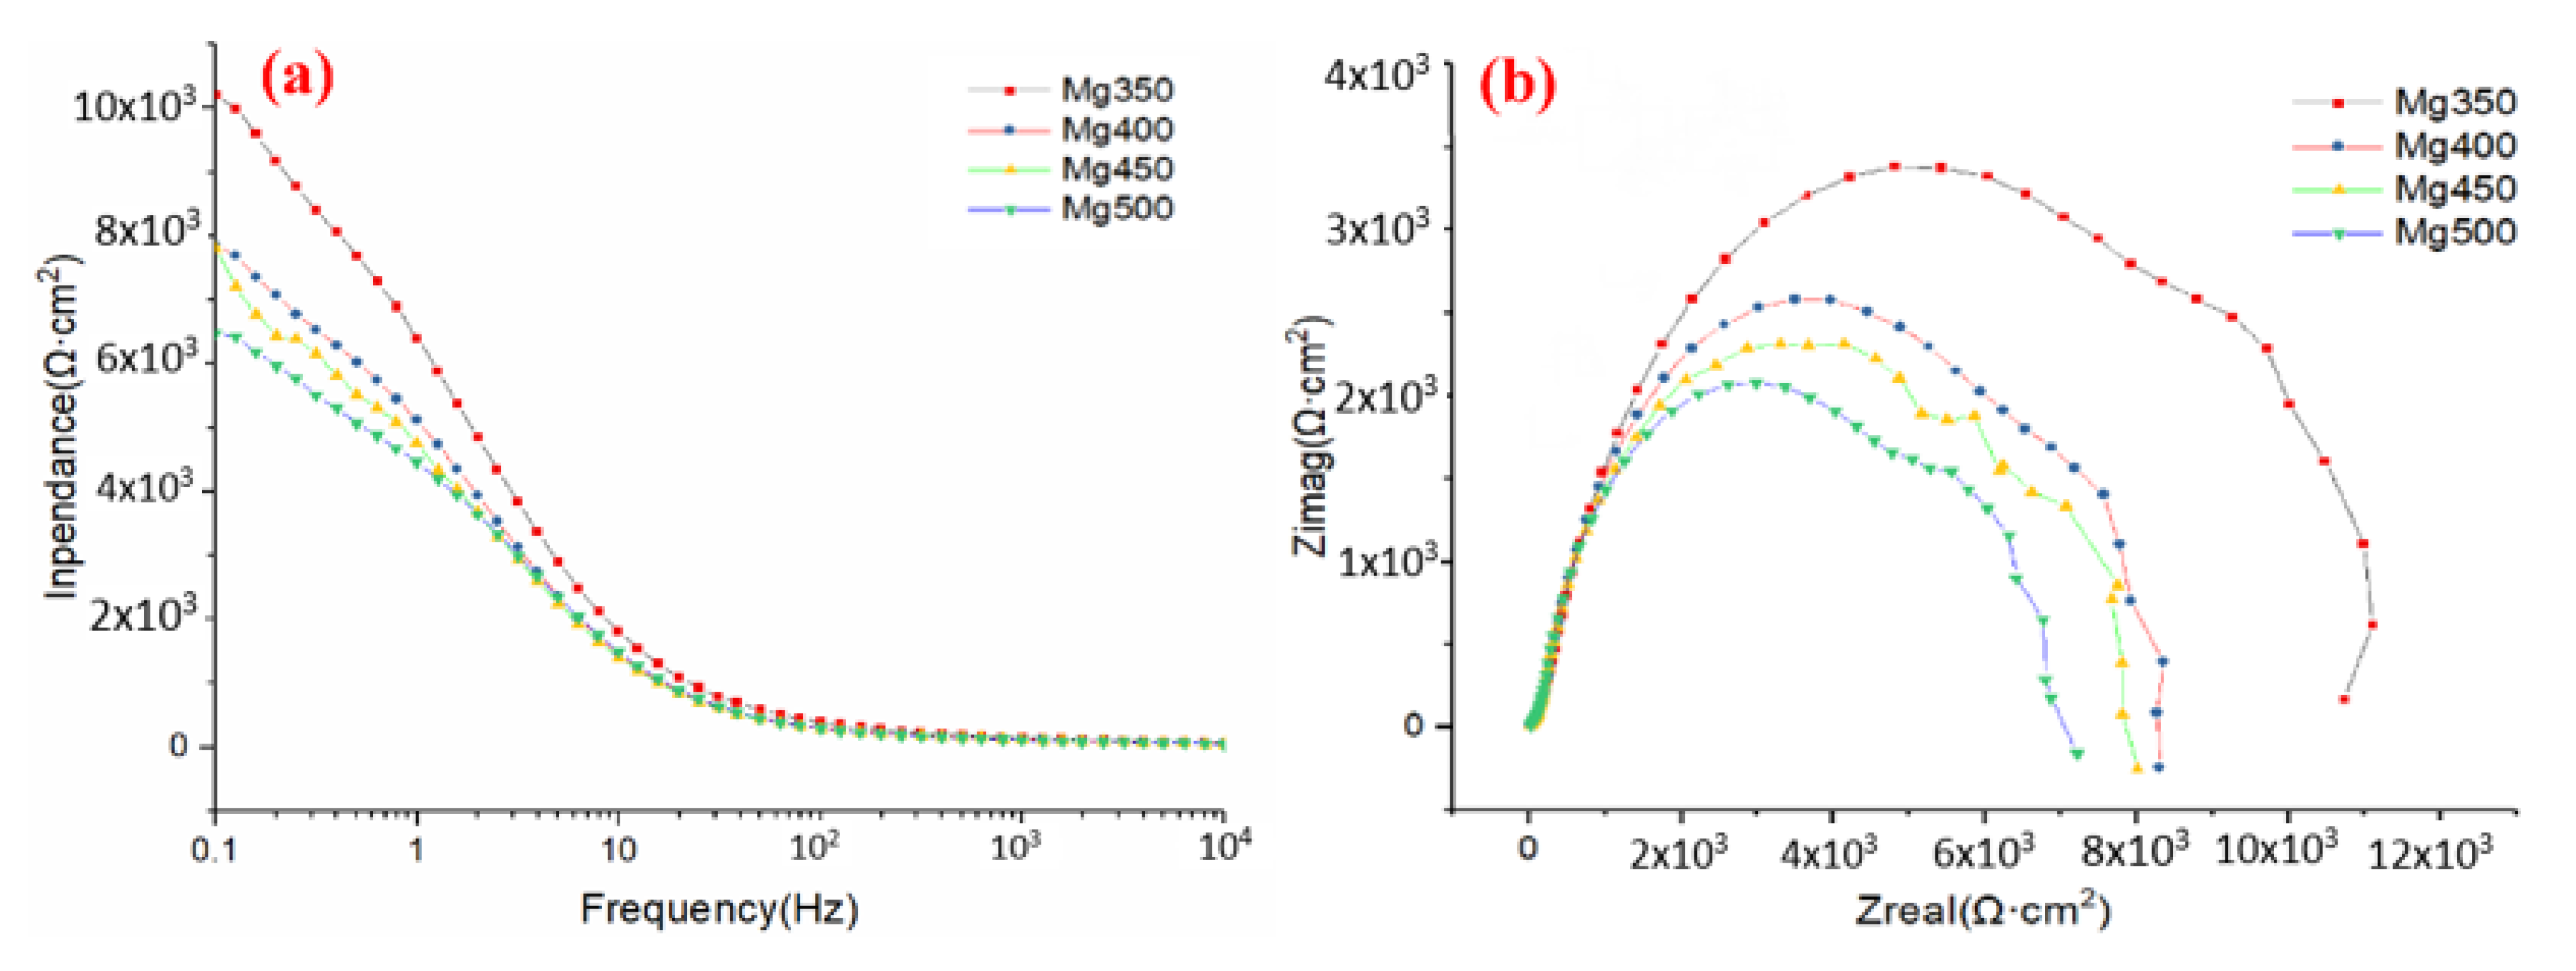
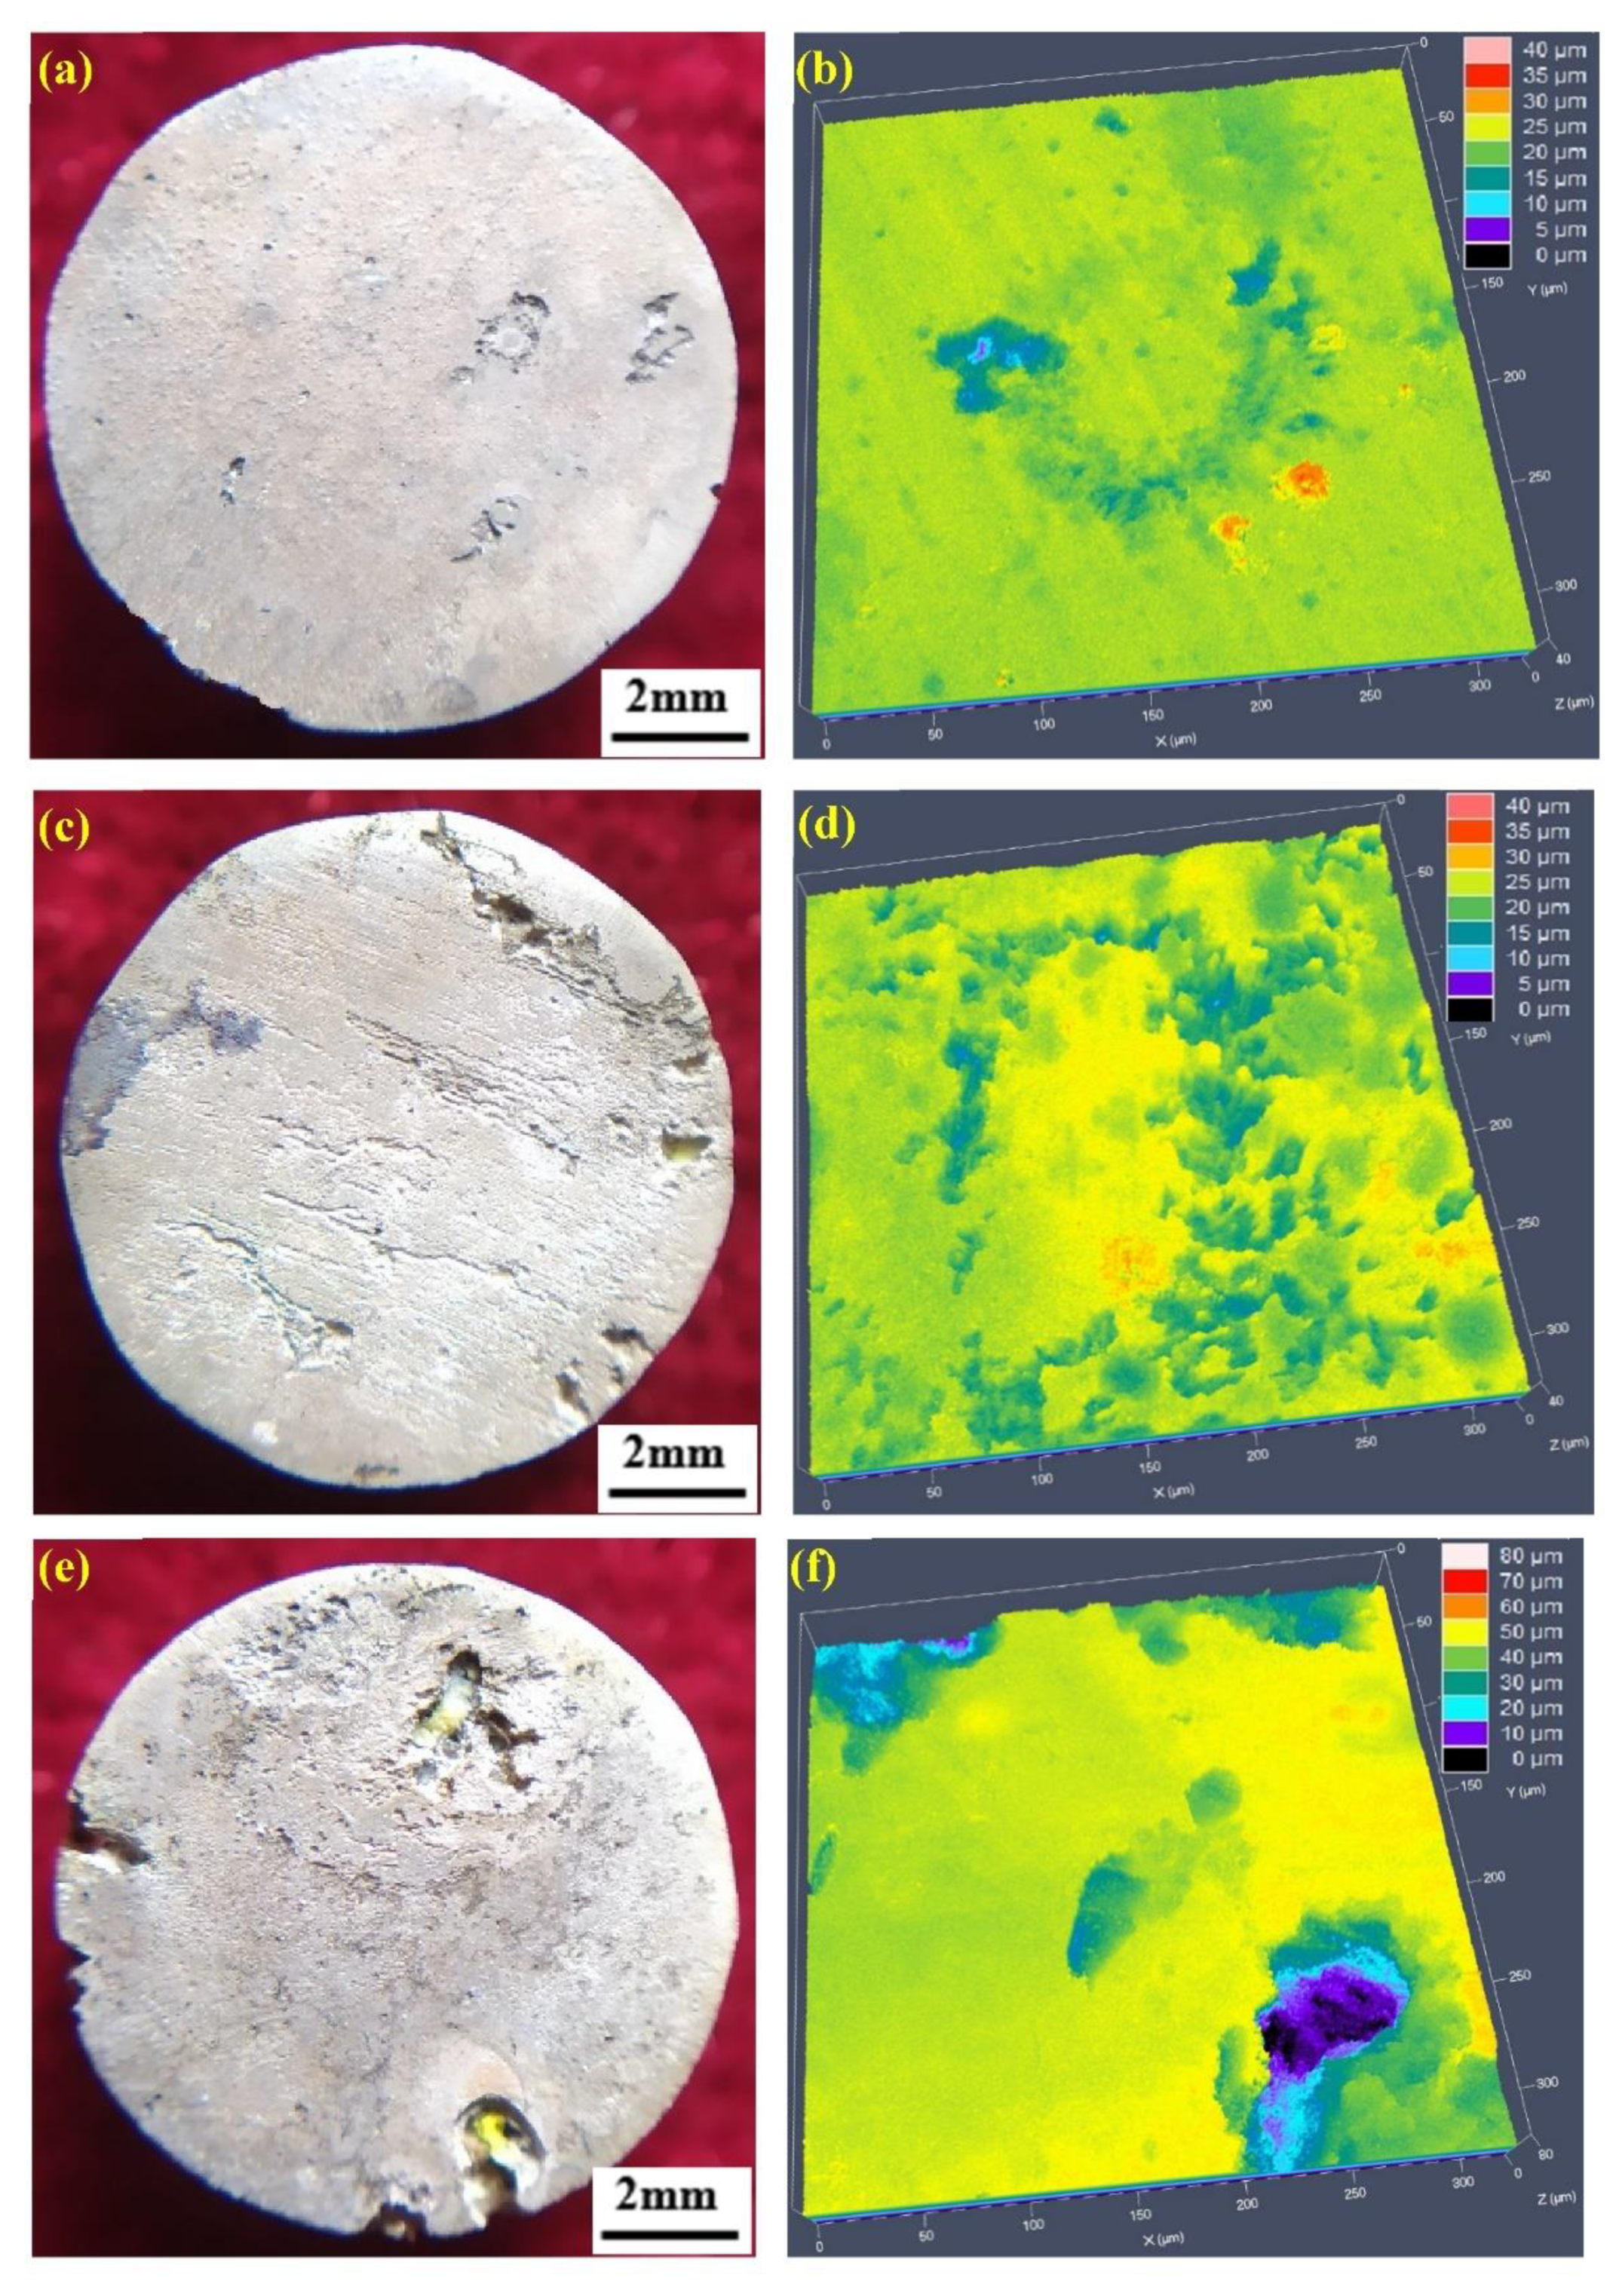
3.2. Biodegradation
4. Discussion
5. Conclusions
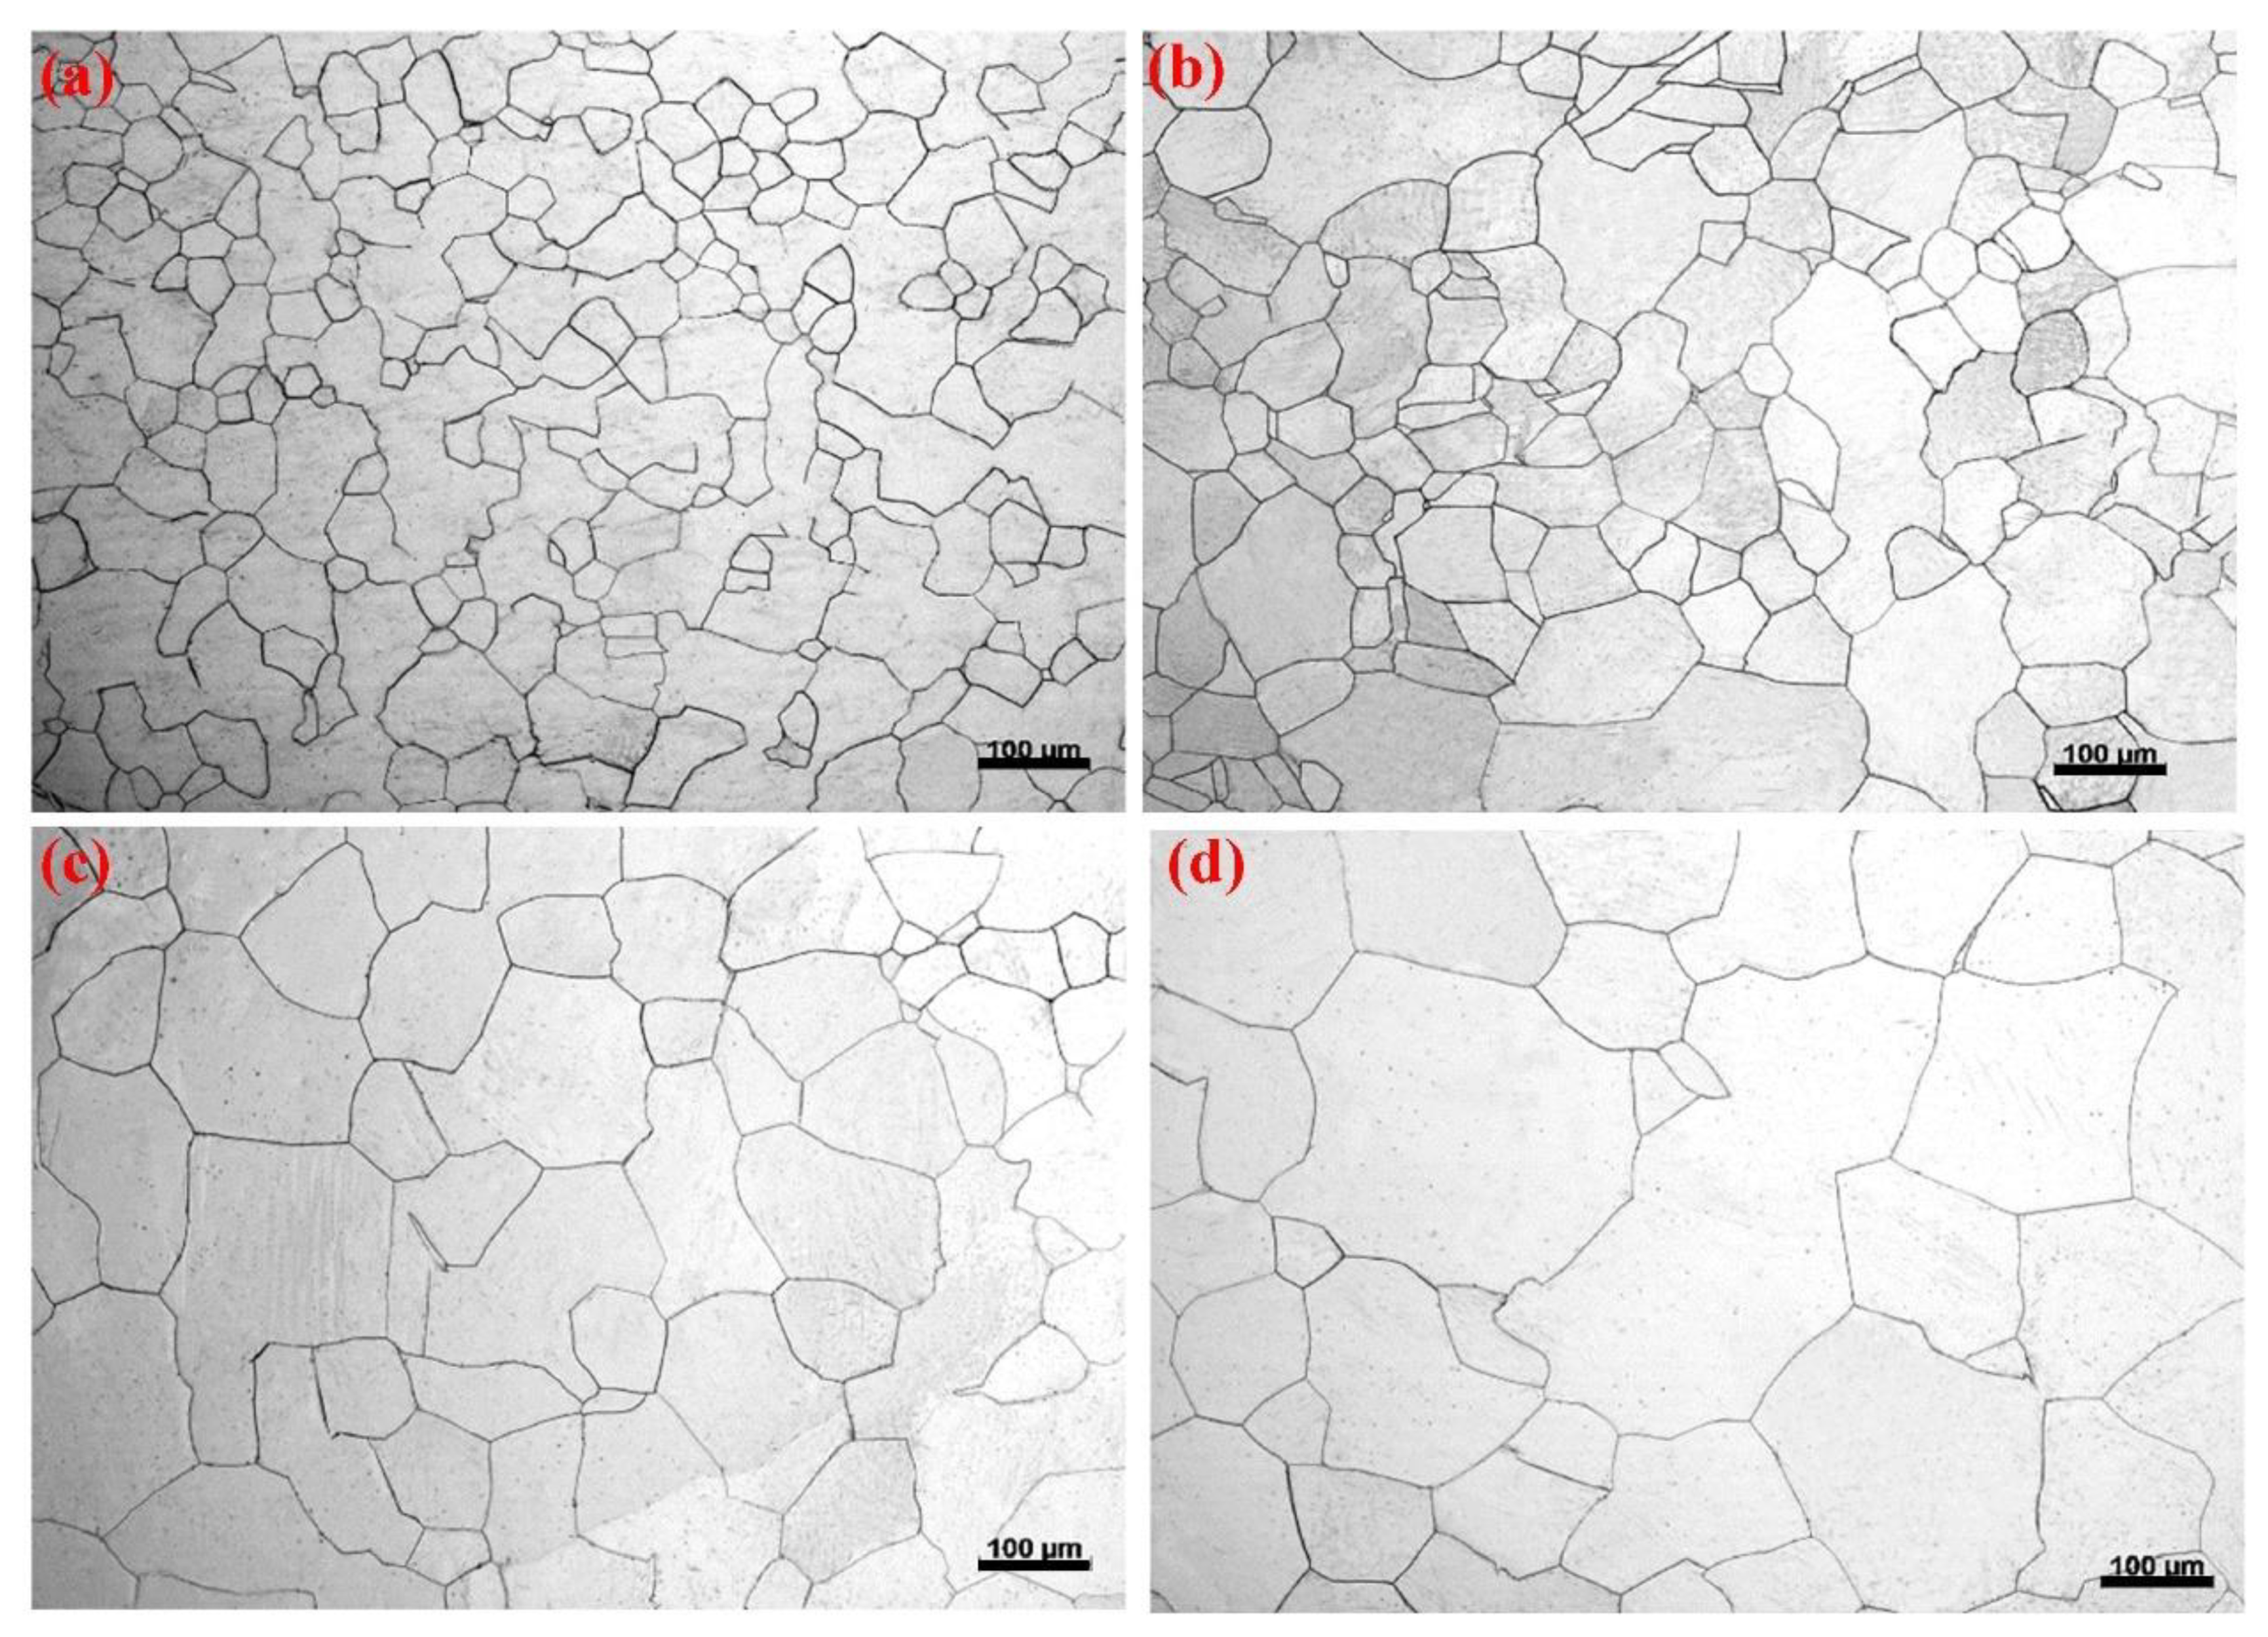
- Homogeneous microstructures with a spectrum of grain size for pure Mg were obtained by annealing through changing the annealing temperature.
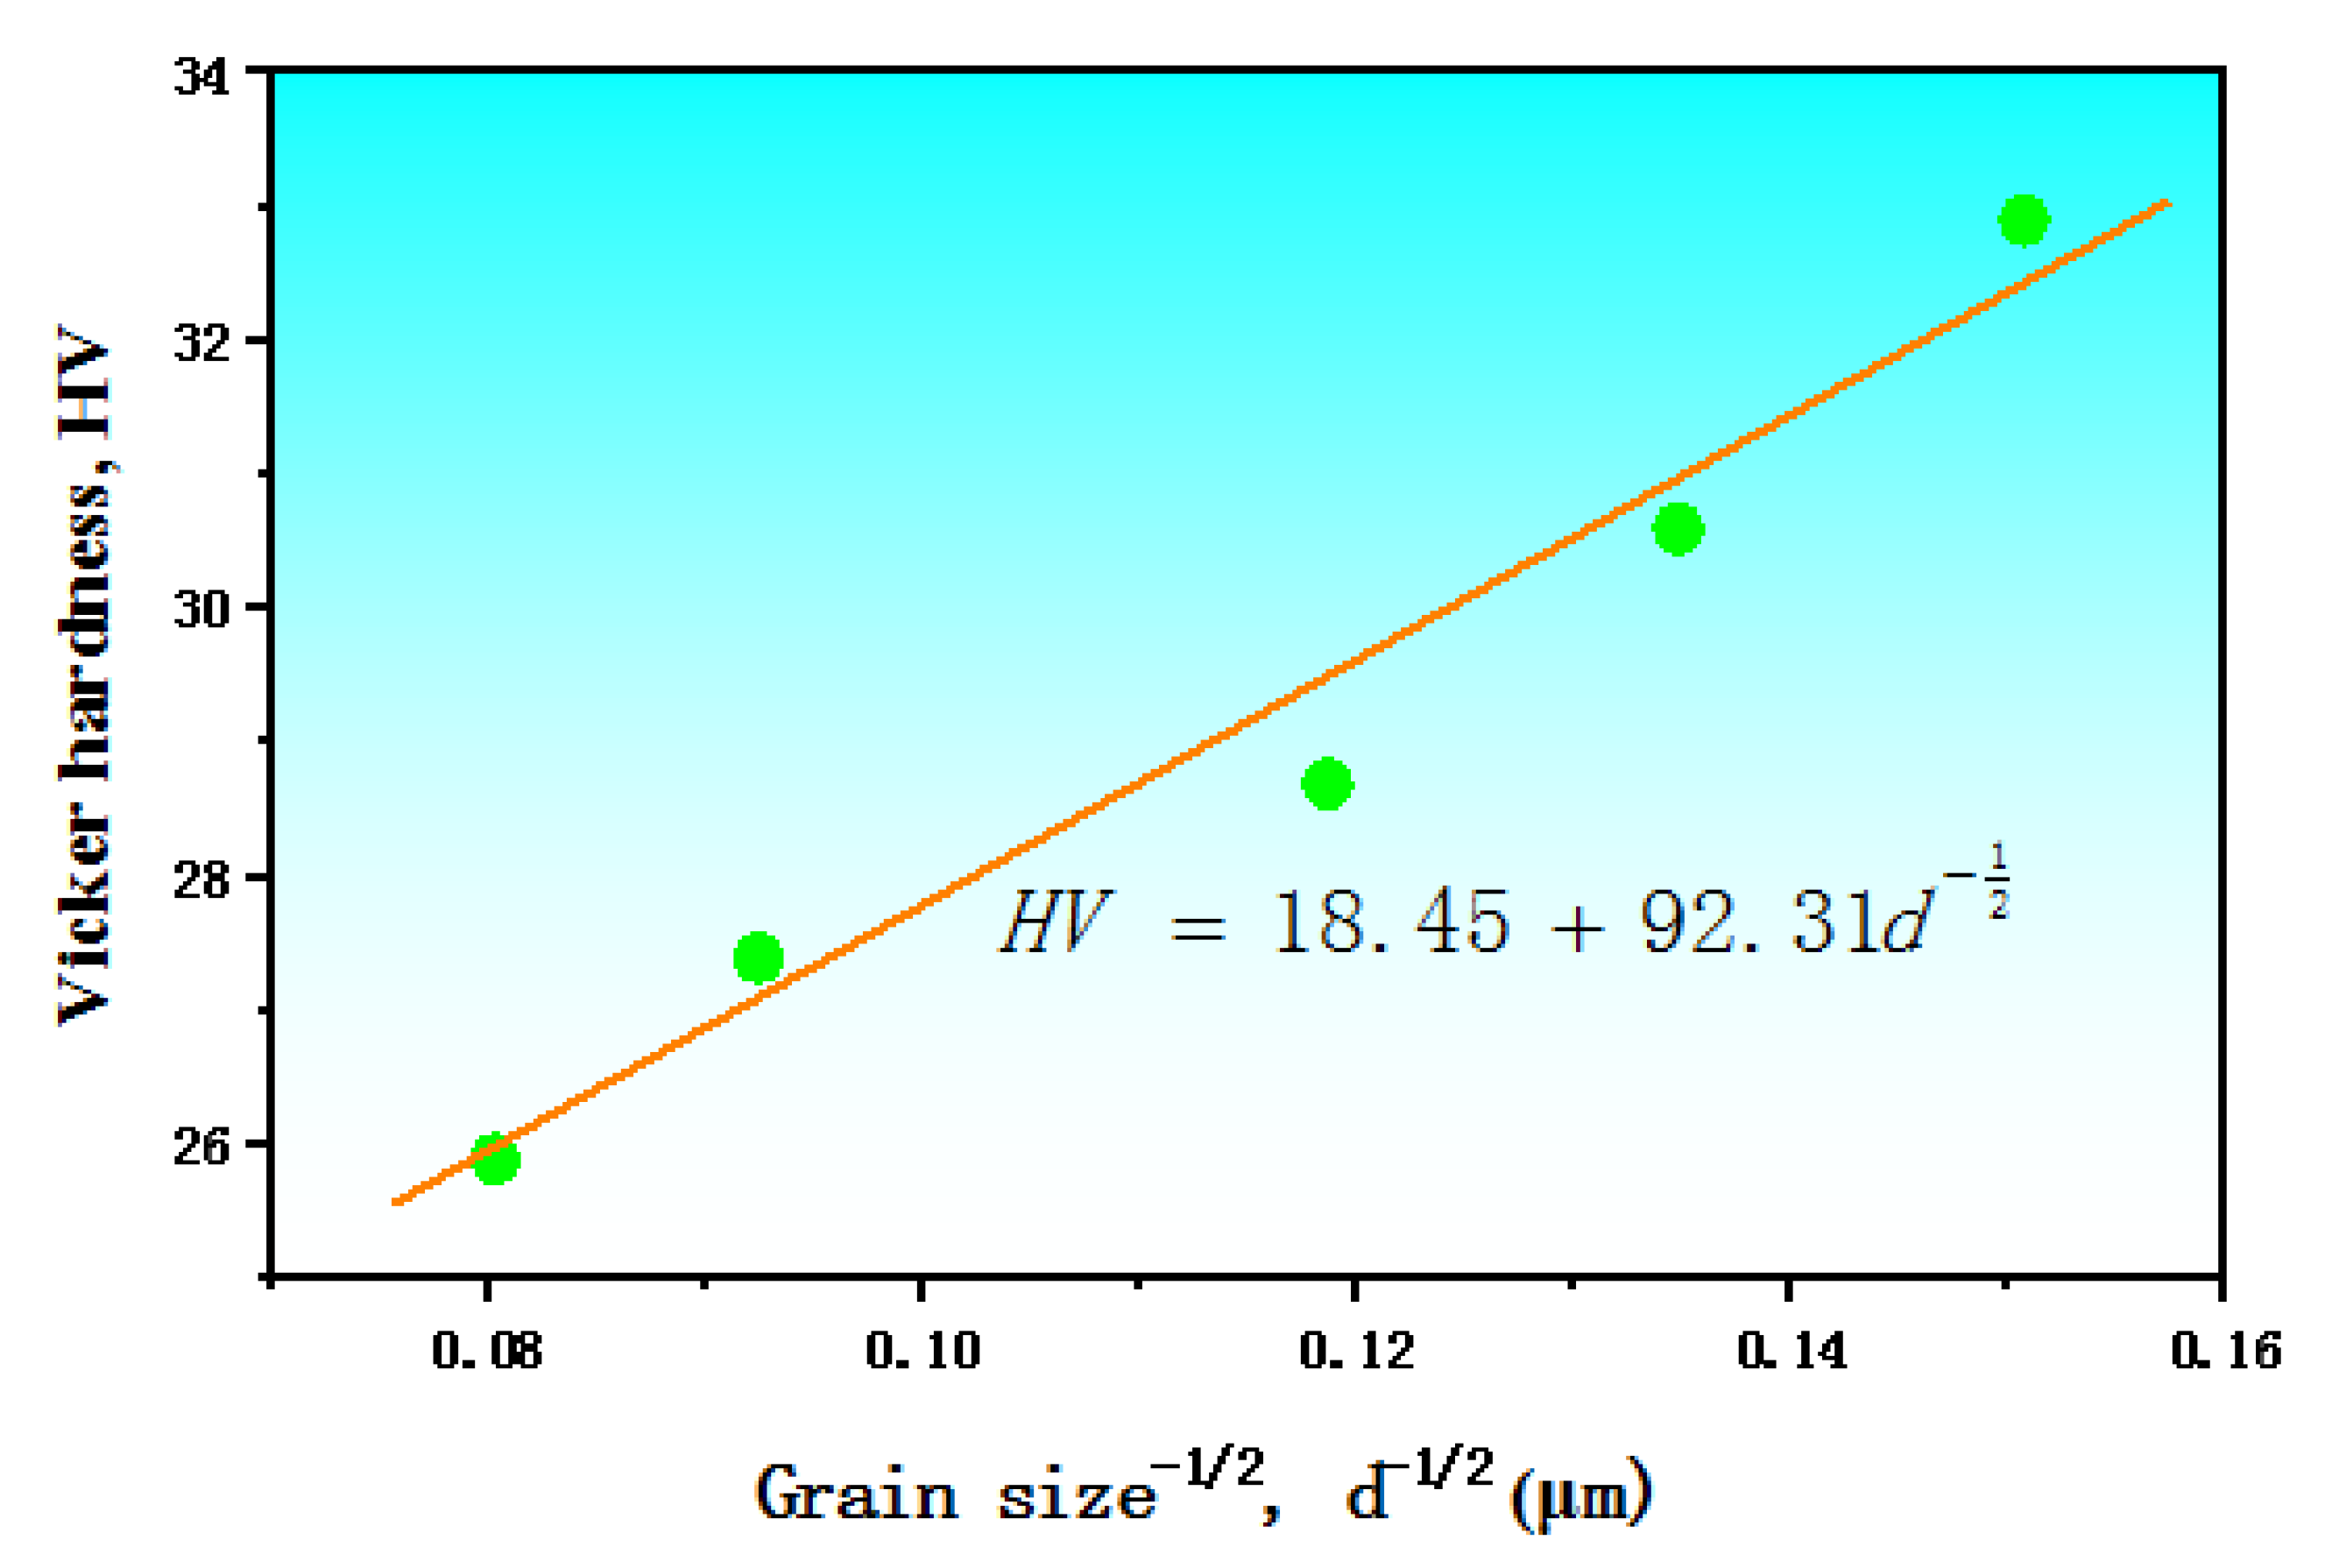
- The hardness of the pure Mg was grain size-dependent, following a typical Hall–Petch relation: .
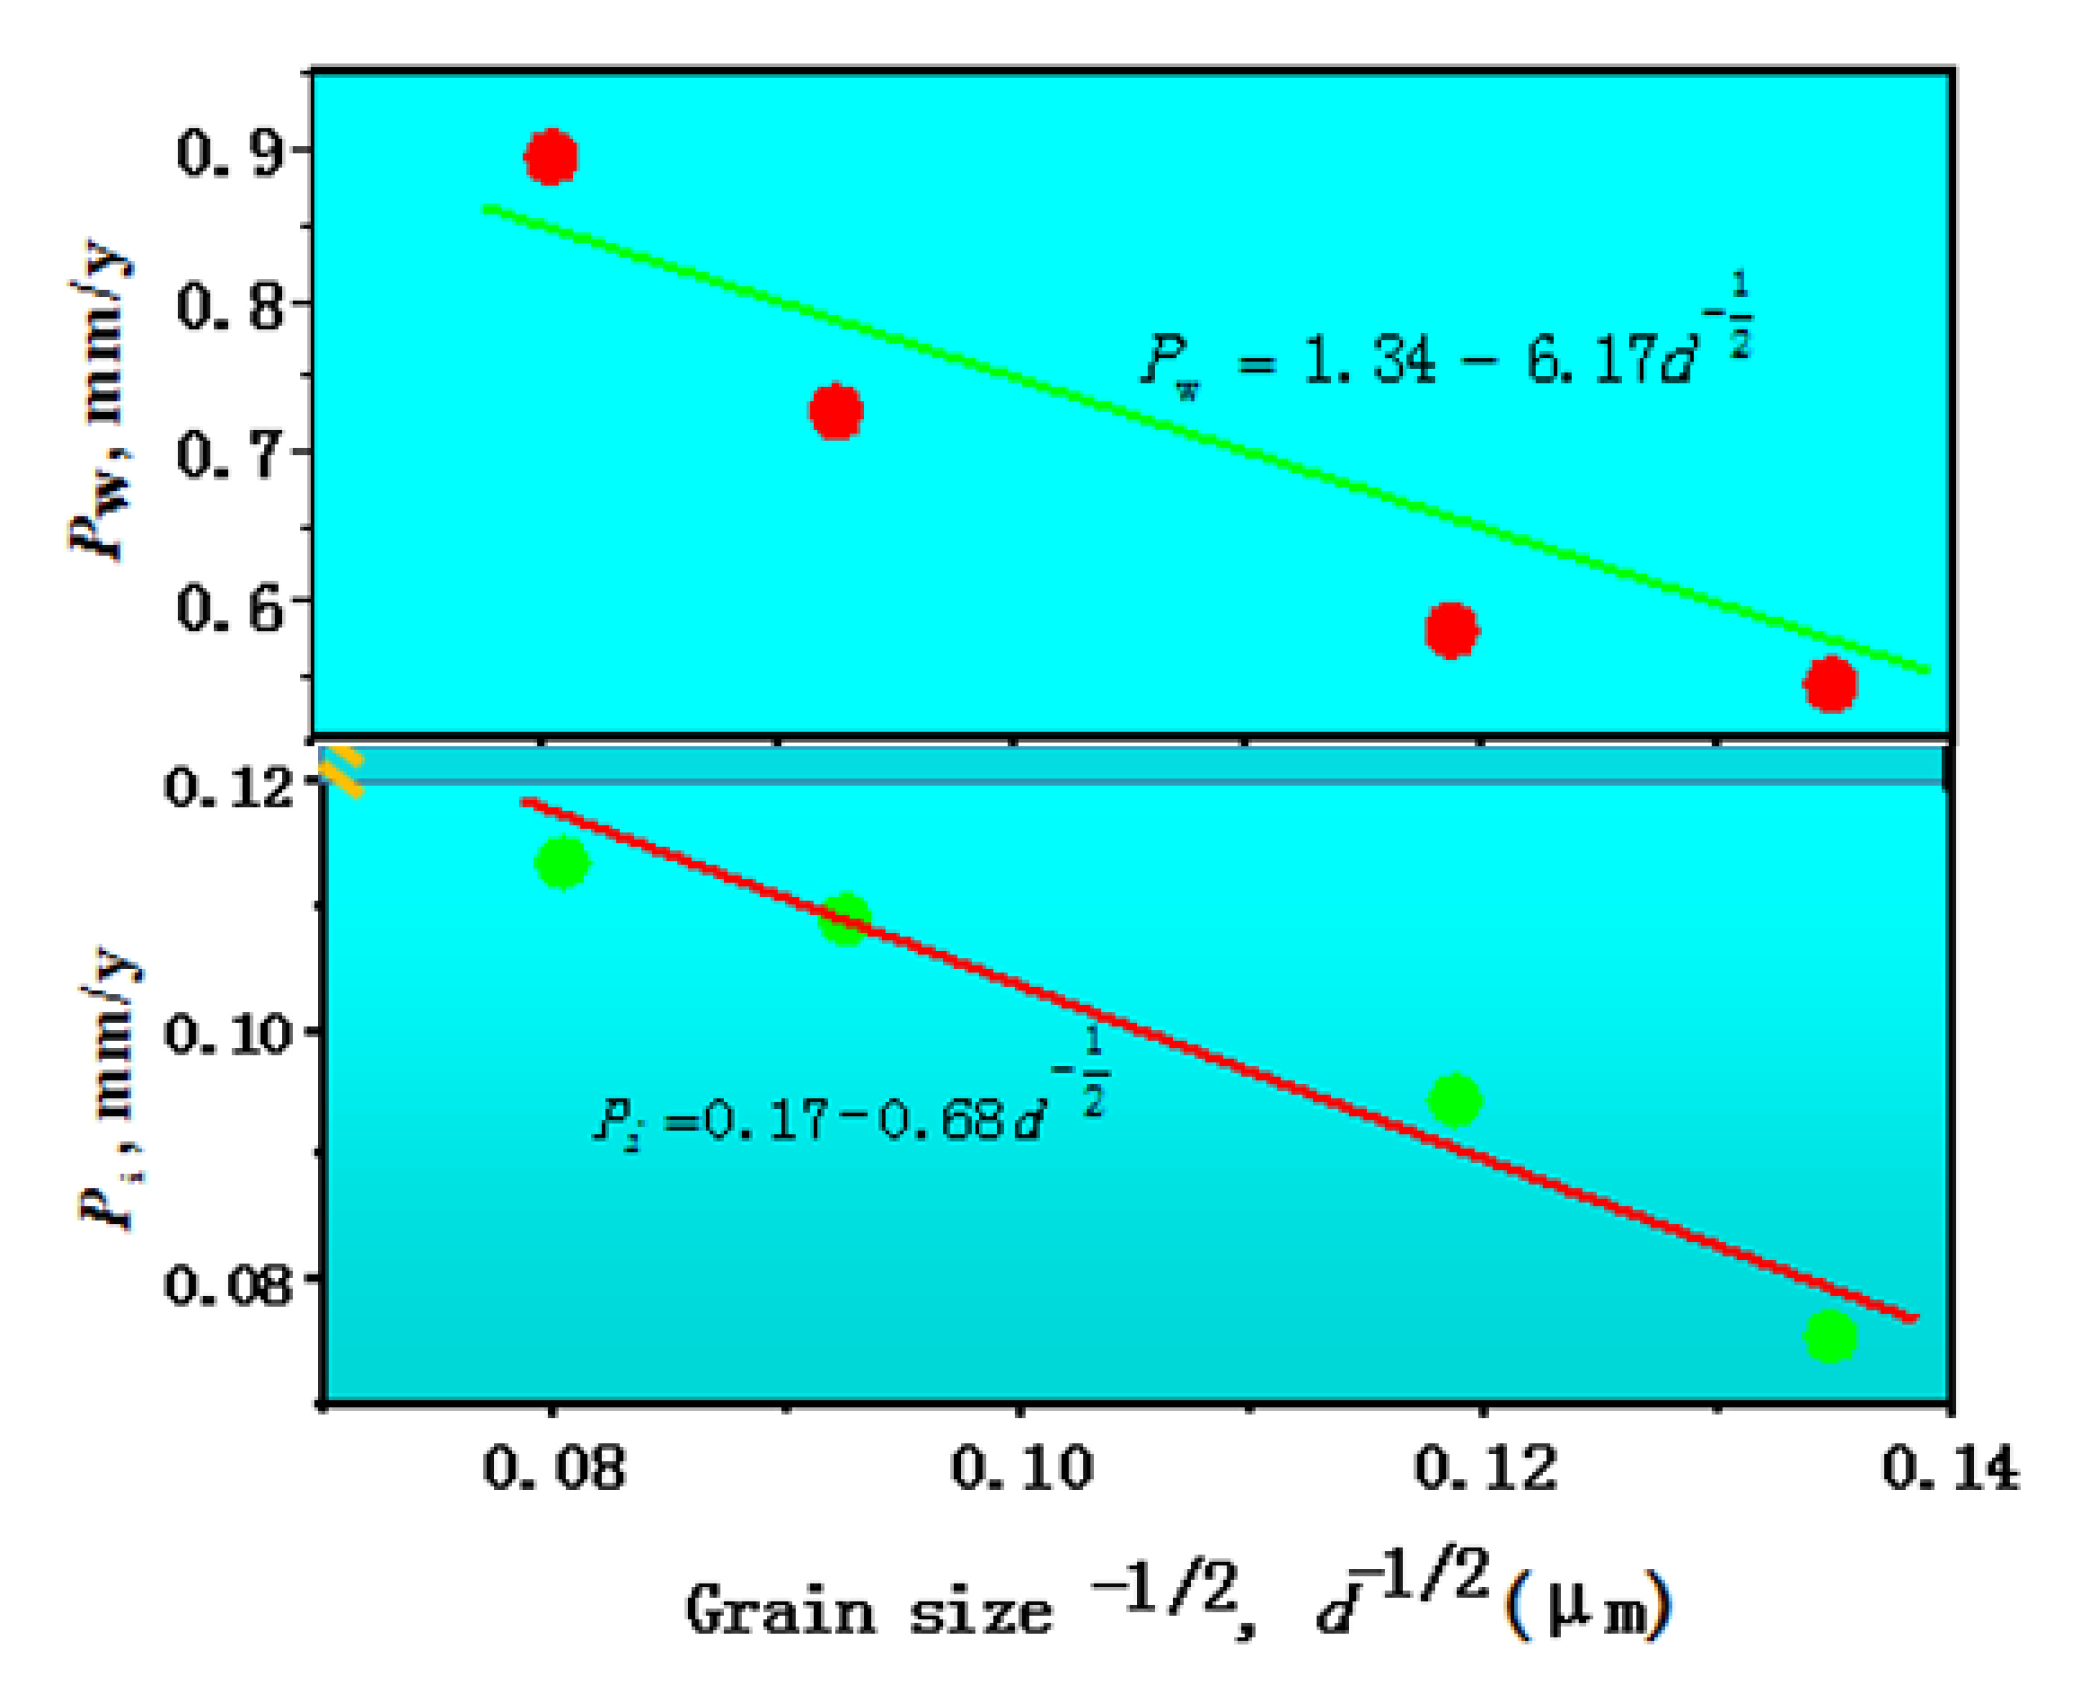
- Grain boundary influenced the biodegradation behavior of pure Mg. The biodegradation rate decreased with decreasing grain size, following a similar Hall–Petch relation: or .
Author Contributions
Funding
Conflicts of Interest
References
- Lopes, D.R.; Silva, C.L.P.; Soares, R.B.; Pereira, P.H.R.; Oliveira, A.C.; Figueiredo, R.B.; Langdon, T.G.; Lins, V.F.C. Cytotoxicity and Corrosion Behavior of Magnesium and Magnesium Alloys in Hank’s Solution after Processing by High-Pressure Torsion. Adv. Eng. Mater. 2019, 21, 1900391. [Google Scholar] [CrossRef]
- Shahin, M.; Wen, C.E.; Munir, K.; Li, Y.C. Mechanical and corrosion properties of graphene nanoplatelet-reinforced Mg-Zr and Mg-Zr-Zn matrix nanocomposites for biomedical applications. J. Magnes. Alloys 2022, 10, 458–477. [Google Scholar] [CrossRef]
- Xie, B.; Zhao, M.C.; Xu, R.; Zhao, Y.C.; Yin, D.F.; Gao, C.D.; Atrens, A. Biodegradation, Antibacterial Performance, and Cytocompatibility of a Novel ZK30-Cu-Mn Biomedical Alloy Produced by Selective Laser Melting. Int. J. Bioprinting 2021, 7, 78–89. [Google Scholar] [CrossRef]
- Cui, L.Y.; Gao, L.; Zhang, J.C.; Tang, Z.; Fan, X.L.; Liu, J.C.; Chen, D.C.; Zeng, R.C.; Li, S.Q.; Zhi, K.Q. In vitro corrosion resistance, antibacterial activity and cytocompatibility of a layer-by-layer assembled DNA coating on magnesium alloy. J. Magnes. Alloys 2021, 9, 266–280. [Google Scholar] [CrossRef]
- Dong, J.H.; Lin, T.; Shao, H.P.; Wang, H.; Wang, X.T.; Song, K.; Li, Q.H. Advances in degradation behavior of biomedical magnesium alloys: A review. J. Alloys Compd. 2022, 908, 164600. [Google Scholar] [CrossRef]
- Carluccio, D.; Bermingham, M.; Kent, D.; Demir, A.G.; Previtali, B.; Dargusch, M.S. Comparative Study of Pure Iron Manufactured by Selective Laser Melting, Laser Metal Deposition, and Casting Processes. Adv. Eng. Mater. 2019, 21, 1900049. [Google Scholar] [CrossRef]
- Ralston, K.D.; Birbilis, N.; Davies, C.H.J. Revealing the relationship between grain size and corrosion rate of metals. Scr. Mater. 2010, 63, 1201–1204. [Google Scholar] [CrossRef]
- Xie, B.; Zhao, M.; Tao, J.X.; Zhao, Y.C.; Yin, D.F.; Gao, C.D.; Shuai, C.J.; Atrens, A. Comparison of the biodegradation of ZK30 subjected to solid solution treating and selective laser melting. J. Mater. Res. Technol.-JMRT 2021, 10, 722–729. [Google Scholar] [CrossRef]
- Wang, P.J.; Ma, L.W.; Cheng, X.Q.; Li, X.G. Influence of grain refinement on the corrosion behavior of metallic materials: A review, International Journal of Minerals. Metall. Mater. 2021, 28, 1112–1125. [Google Scholar]
- Zhang, W.; Zhao, M.; Wang, Z.; Tan, L.; Qi, Y.; Yin, D.; Yang, K.; Atrens, A. Enhanced initial biodegradation resistance of the biomedical Mg-Cu alloy by surface nanomodification. J. Magnes. Alloys 2022, 10, in press. [Google Scholar] [CrossRef]
- Wu, P.; Song, G.; Zhu, Y.; Feng, Z.; Zheng, D. The corrosion of Al-supersaturated Mg matrix and the galvanic effect of secondary phase nanoparticles. Corros. Sci. 2021, 184, 109410. [Google Scholar] [CrossRef]
- Zhao, Y.C.; Zhao, M.; Xu, R.; Liu, L.; Tao, J.X.; Gao, C.D.; Shuai, C.J.; Atrens, A. Formation and characteristic corrosion behavior of alternately lamellar arranged alpha and beta in as-cast AZ91 Mg alloy. J. Alloys Compd. 2019, 770, 549–558. [Google Scholar] [CrossRef] [Green Version]
- Mohapatra, S.; Prasad, R.; Jain, J. Temperature dependence of abnormal grain growth in pure magnesium. Mater. Lett. 2021, 283, 128851. [Google Scholar] [CrossRef]
- Tian, Y.; Zhao, M.; Liu, W.; Zhang, J.; Zhang, M.; Li, H. Comparison on Tensile Characteristics of Plain C-Mn Steel with Ultrafine Grained Ferrite/Cementite Microstructure and Coarse Grained Ferrite/Pearlite Microstructure. Materials 2021, 14, 2309. [Google Scholar] [CrossRef] [PubMed]
- Hansen, N. Hall–Petch relation and boundary strengthening. Scr. Mater. 2004, 51, 801–806. [Google Scholar] [CrossRef]
- Yan, X.; Zhao, M.C.; Yang, Y.; Tan, L.; Zhao, Y.; Yin, D.; Yang, K.; Atrens, A. Improvement of biodegradable and antibacte-rial properties by solution treatment and micro-arc oxidation (MAO) of a magnesium alloy with a trace of copper. Corros. Sci. 2019, 156, 125–138. [Google Scholar] [CrossRef]
- Zheng, Z.R.; Zhao, M.C.; Tan, L.L.; Zhao, Y.C.; Xie, B.; Yin, D.F.; Yang, K.; Atrens, A. Corrosion behavior of a self-sealing coating containing CeO2 particles on pure Mg produced by micro-arc oxidation. Surf. Coat. Technol. 2020, 386, 125456. [Google Scholar] [CrossRef]
- Wang, K.X.; Yin, D.; Zhao, Y.; Atrens, A.; Zhao, M. Microstructural evolution upon heat treatments and its effect on corrosion in Al-Zn-Mg alloys containing Sc and Zr. J. Mater. Res. Technol. -JMRT 2020, 9, 5077–5089. [Google Scholar] [CrossRef]
- Mercier, D.; Światowska, J.; Zanna, S.; Seyeux, A.; Marcus, P. Role of segregated Iron at grain boundaries on Mg corrosion. J. Electrochem. Soc. 2018, 165, C42–C49. [Google Scholar] [CrossRef]
- Hänsel, H.; Stratmann, L.; Keller, H. Effects of the grain boundary segregants P, S, C and N on the grain boundary self-diffusivity in α-iron. Acta Metall. 1985, 33, 659–665. [Google Scholar] [CrossRef]
- Babinsky, K.; Weidow, J.; Knabl, W.; Lorich, A.; Leitner, H.; Primig, S. Atom probe study of grain boundary segregation in technically pure molybdenum. Mater. Charact. 2014, 87, 95–103. [Google Scholar] [CrossRef]
- Surholt, T.; Herzig, C. Grain boundary self-diffusion in Cu polycrystals of different purity. Acta Mater. 1997, 45, 3817–3823. [Google Scholar] [CrossRef]
- Kinneberg, D.J.; Williams, S.R.; Agarwal, D.P. Origin and effects of impurities in high purity gold. Gold Bull. 1998, 31, 58–67. [Google Scholar] [CrossRef] [Green Version]
- Hoog, C.O.; Birbilis, N.; Estrin, Y. Corrosion of pure Mg as a function of grain size and processing route. Adv. Eng. Mater. 2008, 10, 579–582. [Google Scholar] [CrossRef]
- Meng, G.Z.; Li, Y.; Shao, Y.W.; Zhang, T.; Wang, Y.Q.; Wang, F.H.; Cheng, X.Q.; Dong, C.F.; Li, X.G. Effect of Microstructures on Corrosion Behavior of Nickel Coatings: (II) Competitive Effect of Grain Size and Twins Density on Corrosion Behavior. J. Mater. Sci. Technol. 2016, 32, 465–469. [Google Scholar] [CrossRef]
- Gollapudi, S. Grain size distribution effects on the corrosion behaviour of materials. Corros. Sci. 2012, 62, 90–94. [Google Scholar] [CrossRef]
- Liu, L.; Li, Y.; Wang, F.H. Electrochemical corrosion behavior of nanocrystalline materials-A review. J. Mater. Sci. Technol. 2010, 26, 1–14. [Google Scholar] [CrossRef]
- Ahmadkhaniha, D.; Fedel, M.; Sohi, M.H.; Deflorian, F. Corrosion behavior of severely plastic deformed magnesium based alloys: A review. Surf. Eng. Appl. Electrochem. 2017, 53, 439–448. [Google Scholar] [CrossRef]
- Birbilis, N.; Ralston, K.D.; Virtanen, S.; Fraser, H.L.; Davies, C.H.J. Grain character influences on corrosion of ECAPed pure magnesium. Corros. Eng. Sci. Technol. 2010, 45, 224–230. [Google Scholar] [CrossRef]


| Specimens No. | Ecorr (VSCE) | icorr (μA/cm2) | Pi (mm y−1) | Pw (mm y−1) |
|---|---|---|---|---|
| Mg350 | −1.608 | 3.304 | 0.0755 | 0.545 |
| Mg400 | −1.596 | 4.137 | 0.0945 | 0.581 |
| Mg450 | −1.597 | 4.414 | 0.109 | 0.726 |
| Mg500 | −1.598 | 4.972 | 0.1136 | 0.895 |
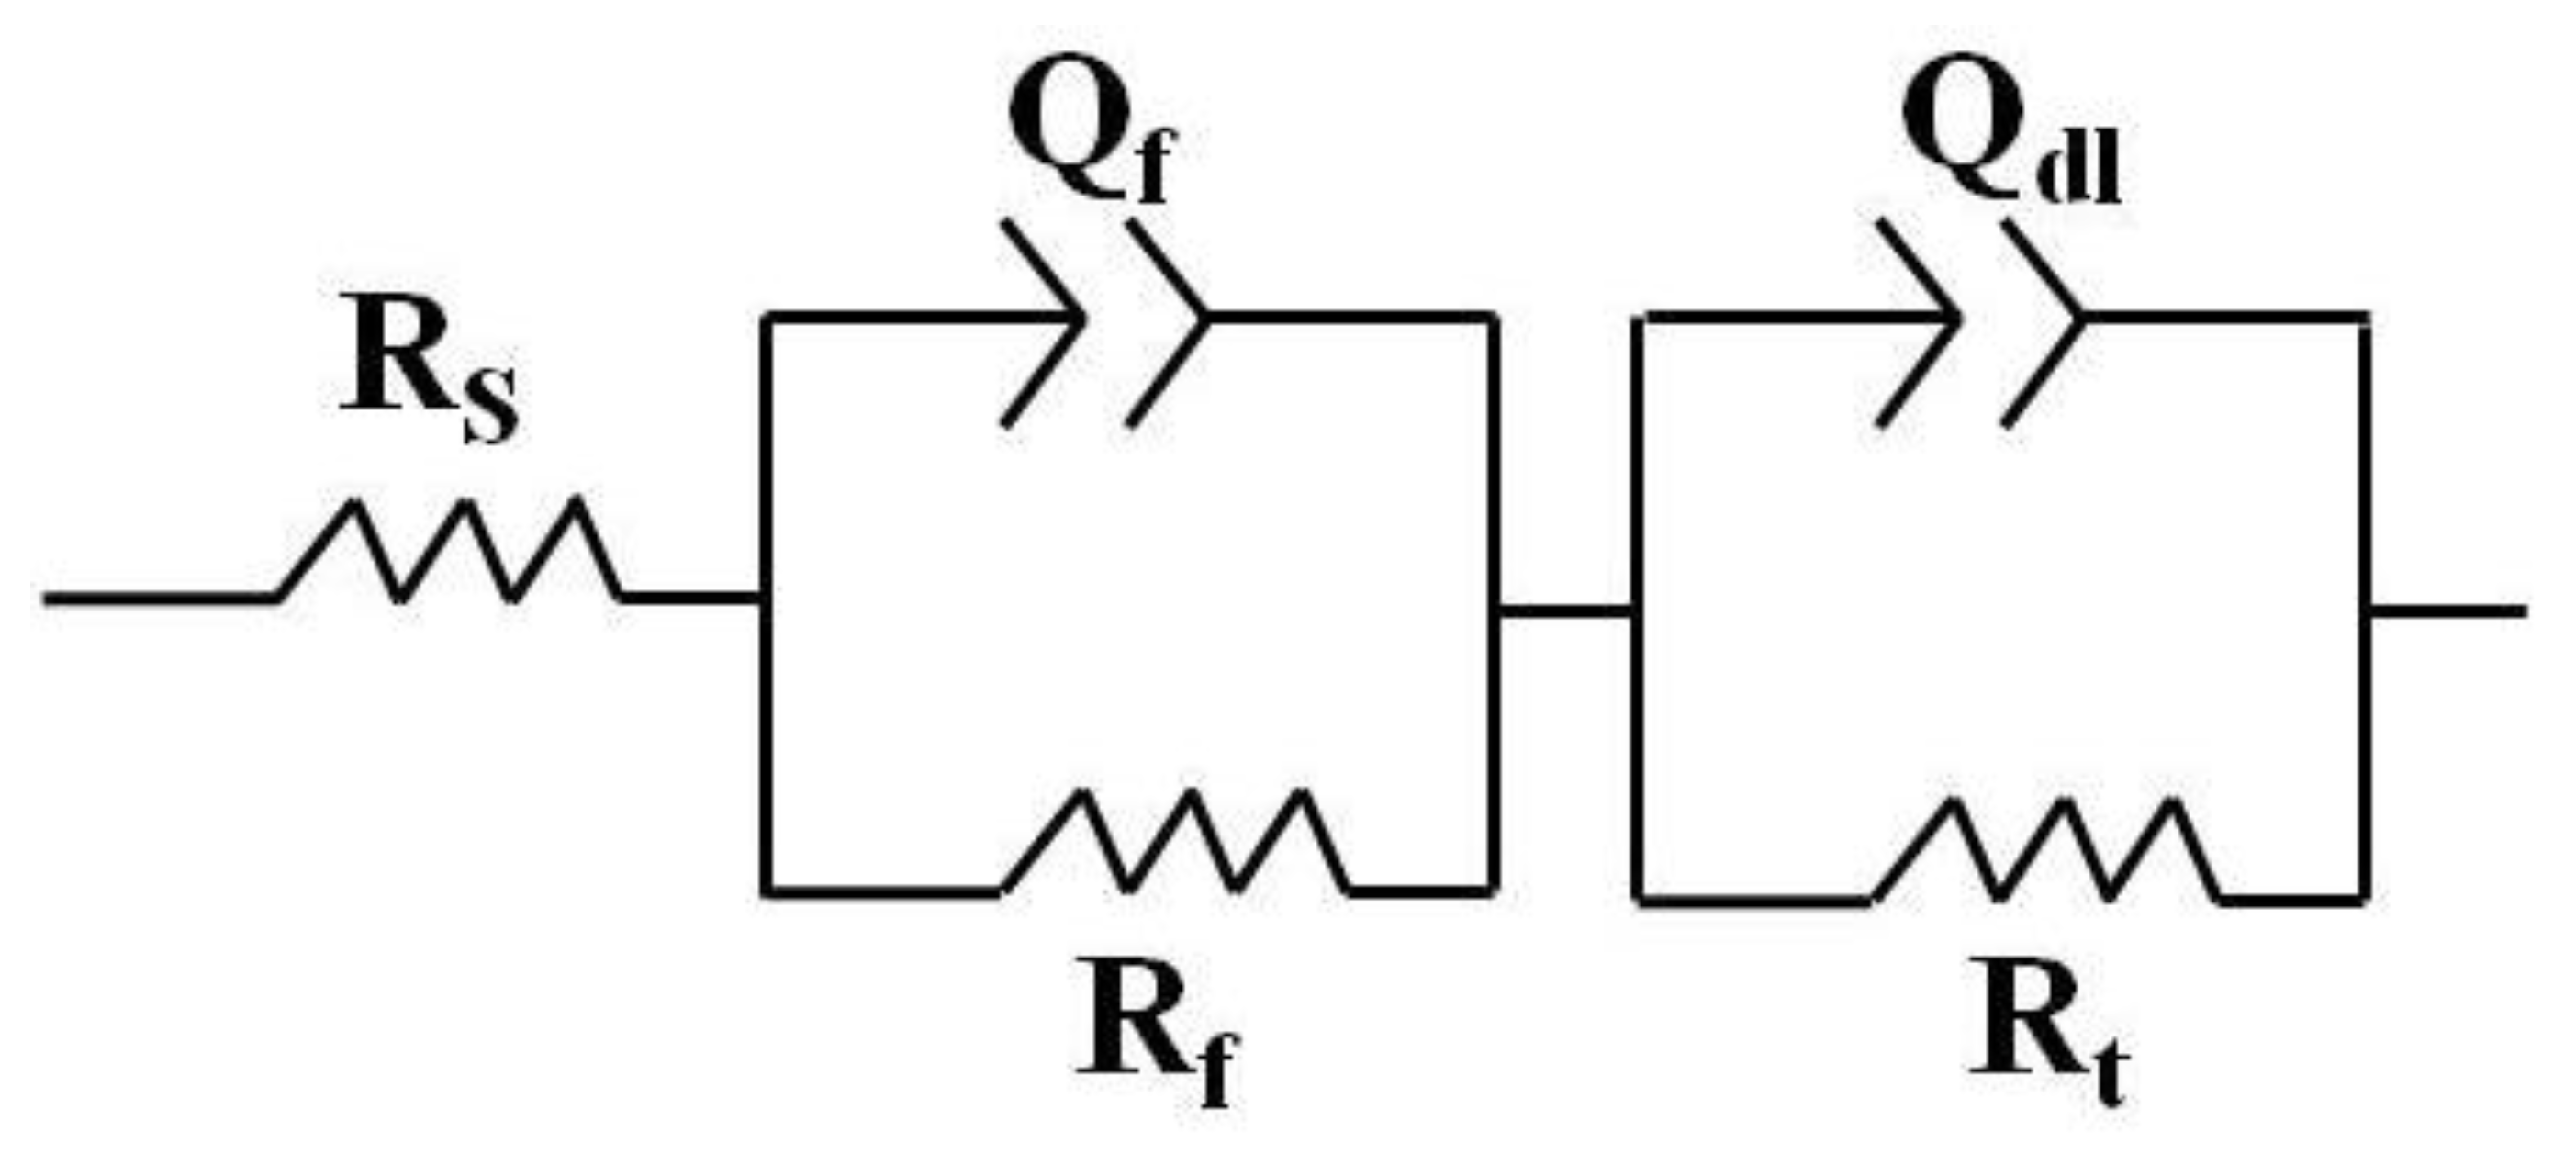
| Specimens No. | RS (Ωcm2) | CPEfilm-T (Ω−1s−n/cm2) | n | Rf (Ωcm2) | CPEct-T (Ω−1s−n/cm2) | n | Rt (Ωcm2) |
|---|---|---|---|---|---|---|---|
| Mg350 | 19.94 | 6.963 × 10⁻⁶ | 0.706 | 168.5 | 20.89 × 10⁻⁶ | 0.740 | 30.42 × 10³ |
| Mg400 | 17.25 | 11.59 × 10⁻⁶ | 0.678 | 175.0 | 20.09 × 10⁻⁶ | 0.786 | 16.48 × 10³ |
| Mg450 | 20.50 | 19.77 × 10⁻⁶ | 0.644 | 178.2 | 15.97 × 10⁻⁶ | 0.807 | 15.09 × 10³ |
| Mg500 | 19.88 | 15.04 × 10⁻⁶ | 0.665 | 142.5 | 15.72 × 10⁻⁶ | 0.808 | 7.257 × 10³ |
Publisher’s Note: MDPI stays neutral with regard to jurisdictional claims in published maps and institutional affiliations. |
© 2022 by the authors. Licensee MDPI, Basel, Switzerland. This article is an open access article distributed under the terms and conditions of the Creative Commons Attribution (CC BY) license (https://creativecommons.org/licenses/by/4.0/).
Share and Cite
Qu, Z.; Liu, L.; Deng, Y.; Tao, R.; Liu, W.; Zheng, Z.; Zhao, M.-C. Relationship between Biodegradation Rate and Grain Size Itself Excluding Other Structural Factors Caused by Alloying Additions and Deformation Processing for Pure Mg. Materials 2022, 15, 5295. https://doi.org/10.3390/ma15155295
Qu Z, Liu L, Deng Y, Tao R, Liu W, Zheng Z, Zhao M-C. Relationship between Biodegradation Rate and Grain Size Itself Excluding Other Structural Factors Caused by Alloying Additions and Deformation Processing for Pure Mg. Materials. 2022; 15(15):5295. https://doi.org/10.3390/ma15155295
Chicago/Turabian StyleQu, Zhan, Lulin Liu, Youming Deng, Ran Tao, Weidong Liu, Zhongren Zheng, and Ming-Chun Zhao. 2022. "Relationship between Biodegradation Rate and Grain Size Itself Excluding Other Structural Factors Caused by Alloying Additions and Deformation Processing for Pure Mg" Materials 15, no. 15: 5295. https://doi.org/10.3390/ma15155295