Article

Study of the Effect of Manganese Ion Addition Points on the Separation of Scheelite and Calcite by Sodium Silicate

1
Faculty of Land Resource Engineering, Kunming University of Science and Technology, Kunming 650093, China
2
Meishan Shunying Power Battery Materials Co., Ltd., Meishan 620000, China
3
State Key Laboratory of Complex Nonferrous Metal Resources Clean Utilization, Kunming 650093, China
4
Yunnan Key Laboratory of Green Separation and Enrichment of Strategic Mineral Resources, Kunming 650093, China
*
Author to whom correspondence should be addressed.
Materials 2022, 15(13), 4699; https://doi.org/10.3390/ma15134699
Submission received: 26 May 2022 / Revised: 27 June 2022 / Accepted: 1 July 2022 / Published: 5 July 2022
(This article belongs to the Special Issue Advanced Materials and Technologies in Separation)

Abstract

:
The flotation separation (FS) of both scheelite and calcite minerals with similar physicochemical properties remains challenging, since the Ca active sites exist on their surfaces. The present work investigated the effects of different addition points of MnCl2 on the FS of scheelite and calcite by micro-flotation tests, zeta potential measurements, UV-Vis spectrophotometer measurements, infrared spectrum analysis, and X-ray photoelectron spectroscopy (XPS) tests, and the mechanism of separation is elucidated. Interestingly, the recovery of scheelite was 91.33% and that of calcite was 8.49% when MnCl2 was added after sodium silicate. Compared with the addition of MnCl2 before Na2SiO3, the recovery of scheelite was 64.94% and that of calcite was 6.64%. The sequence of adding MnCl2 followed by Na2SiO3 leads to the non-selective adsorption of Mn2+ on the surface of scheelite and calcite firstly, and later, sodium silicate will interact with it to produce hydrophilic silicate. This substantially enhances the hydrophilicity on the surface of both minerals, making separation impossible. In contrast, the addition of MnCl2 after sodium silicate can promote the formation of a metal silicate and enhance the selectivity and inhibition effect on calcite. Meanwhile, under this dosing sequence, the adsorption of Mn2+ on the scheelite surface offered more active sites for sodium oleate, which improved the scheelite surface hydrophobicity. This leads to a great improvement of the FS effect of scheelite and calcite.

Graphical Abstract

1. Introduction

Tungsten(W) has outstanding properties and is an important metal resource in military, medical, mechanical, and chemical fields [1,2,3]. One of the main sources of W is scheelite (CaWO4), which is often related to some calcium-bearing vein minerals, mainly fluorite (CaF2), apatite (Ca10(PO4)6F2), and calcite (CaCO3) [4,5]. Currently, scheelite is mainly recovered and utilized by froth flotation [6,7]. The similar crystal structure of scheelite and its vein minerals and the similar surface chemistry of calcium atoms on the solvation [8,9,10,11] make the separation of calcium-bearing minerals a persistent problem.
In flotation processes, flotation separation (FS) between minerals is usually achieved by adding different flotation reagents that change the wettability of mineral surfaces and thus separate the minerals [9,12]. The flotation process of scheelite uses inhibitors such as sodium silicate (water glass), modified water glass, carboxymethyl cellulose, phosphoric acid, and phosphate [7,13,14,15]. The hydrophilicity of the vein mineral surface is enhanced by the interaction of functional groups in the inhibitors with Ca2+ on their surfaces through adsorption or generation of new hydrophilic sites [8], achieving the inhibition effect. Meanwhile, the scheelite flotation is trapped using fatty acid traps, including NaOL, oxidized paraffin soap, etc. [14,15]. The ions in these fatty acid traps react with Ca2+ on the mineral surface to form (Ca(OL)2), enhancing the floatability of the mineral [16]. In addition, isohydroxamic acid and its metal ion complexes [11,17,18], which have high trapping properties, are also gradually applied to scheelite flotation.
Metal ions still play an important role in flotation, as they can achieve enhanced inhibition or activation of the target mineral. Moreover, these metal ions, when used in combination with chemicals, enhance the selectivity of the chemicals for minerals [19]. By pre-interacting Pb(II) with scheelite, Dong et al., found that it could increase the active site of NaOL adsorption on the scheelite surface, and, hence, the coverage of NaOL, in turn [4]. Meanwhile, when Pb-water glass and Al-Na2SiO3 are used as combined inhibitors, the metal silicate polymers adsorb more on the calcite surface and less on the scheelite surface [5,20]. The flotation rate of scheelite can also be improved by using a combination of Pb-BHA and Fe-BHA collectors [11,21,22]; however, their widespread application is hindered due to the high cost. The meticulous literature study reveals that most of the previous studies have centered around the effect of metal ions on enhancing the selectivity and catchability of the agents, while ignoring that different orders of agent action on the mineral surface also bring different flotation effects. The results show that adding some metal ions promotes the chemical reaction between metal ions and silicate substances, the generation of silicate substances Si(OH)4, and the generation of more selective and inhibitory metal silicate substances, enhancing the inhibition of calcite [23,24]. In specific, no in-depth study on the effect of the order of adding agents in the flotation process was reported.
Therefore, in this work, the effect of different MnCl2 addition points on the flotation recovery (FR) of scheelite and calcite was studied. The effects of different addition points of Mn2+ on the flotation behavior of scheelite and calcite were studied by single mineral flotation tests. The interaction mechanism of Mn2+ with the surface of scheelite and calcite under the conditions of different addition points of Mn2+ was further investigated by a zeta potential test, FT-IR, adsorption amount determination, and XPS analysis.

2. Experimental Section

2.1. Materials

The pure mineral scheelite was taken from Qinghai, China, and the pure mineral calcite was taken from Changsha, China. Ore samples of −74 + 38 μm were collected for flotation tests. The −38 μm particle size samples were further ground to −5 μm for X-ray diffraction, IR spectroscopy, and XPS analysis. The XRD analysis of scheelite and calcite is indicated in Figure 1 and Figure 2.
The XRD analysis results of scheelite and calcite mineral samples show that both samples are high purity with no impurity peaks, and both meet the requirements of the pure mineral flotation test.

2.2. Micro-Flotation

The flotation tests were performed in a 40 mL FGC-type hanging tank flotation machine at an impeller speed of 1630 r/min. First, 2.0 g of the mineral sample was weighed into the 40 mL flotation tank, 36 mL of deionized water was added, and the pulp was stirred for 1 min to ensure it was as uniform as possible. Then, the corresponding flotation chemicals were added, as indicated in Figure 2. The flotation scraping time was 3 min. The froth product scraped out is the concentrate, and the remaining product in the tank is the tailings. The concentrate and tailings were filtered and weighed after being dried.

2.3. Zeta-Potential Measurement

Zeta potential assays were carried out by a potential analyzer (Zen-3700, Malvern Instrument Ltd., United Kingdom). A 20 mg sample was weighed in a beaker each time. Then an electrolyte sodium chloride solution of 40 mL (5 × 10⁻³ mol/L) was added and stirred with a magnetic stirrer (800 r/min) for 2 min, then the agent was added according to the agent regime of flotation test. It was stirred for 15 min and left for 5 min; the supernatant was pipetted out and put into the electrophoresis chamber for potential measurement, keeping the same conditions. Each sample was tested 3 times, and the average value was calculated as the experiment result.

2.4. UV–Vis Measurement

The assay was performed with an ultraviolet-visible spectrophotometer (UV-2700). First, standard solutions of different concentration gradients of NaOL were configured separately, and deionized water was used as a comparison for scanning. The absorbance of different concentrations of NaOL was measured at the stable UV absorption peak (λ = 186.8 nm), and the relationship between NaOL and absorbance was plotted by making a dotted line.
Then, 2 g of the mineral sample and 40 mL of deionized water were mixed, the agents were added in turn, stirred and left to stand for the same time. The supernatant for absorbance determination was taken, and the adsorption amount can be calculated by the formula:
τ = C 0 C V 1000   m
where: τ is the agent’s adsorbed amount (mol/g); C0 is the initial agent concentration (mol/L); C is the agent concentration after action (mol/L); V is the solution volume (mL); m is the sample mass (g).

2.5. FTIR Tests

A Nicolet FTIR-740 FTIR spectrometer was adopted. The −2 μm mineral sample was taken 2.0 g at a time, ultrasonically cleaned for 1 min, and followed by a replenishment of deionized water to 40 mL, with the addition of chemicals according to the flotation chemicals regime and full stirring for 30 min. It was then left for 20 min, then rinsed three times with deionized water of the same pH, filtered, and dried. Grinding and mixing of KBr powder and samples, pressed using a tablet press, occurred and was subsequently tested.

2.6. XPS Tests

XPS testing was performed using a multifunctional scanning imaging photoelectron spectrometer model PHI5000 Versaprobe-II (Al target Kα rays as the X-ray emission source). The pulp pH was adjusted, and flotation chemicals were added sequentially in accordance with the flotation test situation, followed by rinsing the mineral samples 3–5 times with deionized water, filtering, and drying. MultiPak software was used to process and analyze the experimental data.

2.7. Calculations of Solution Chemistry

The hydrolysis composition distribution of Mn2+ and Na2SiO3 at room temperature (298.15 K) was calculated by Make Equilibrium Using Sophisticated Algorithms (MEDUSA). Analysis of the reaction process and action mechanism of flotation agents in the flotation process based on flotation solution chemistry.

3. Results and Discussion

3.1. Micro-Flotation Study

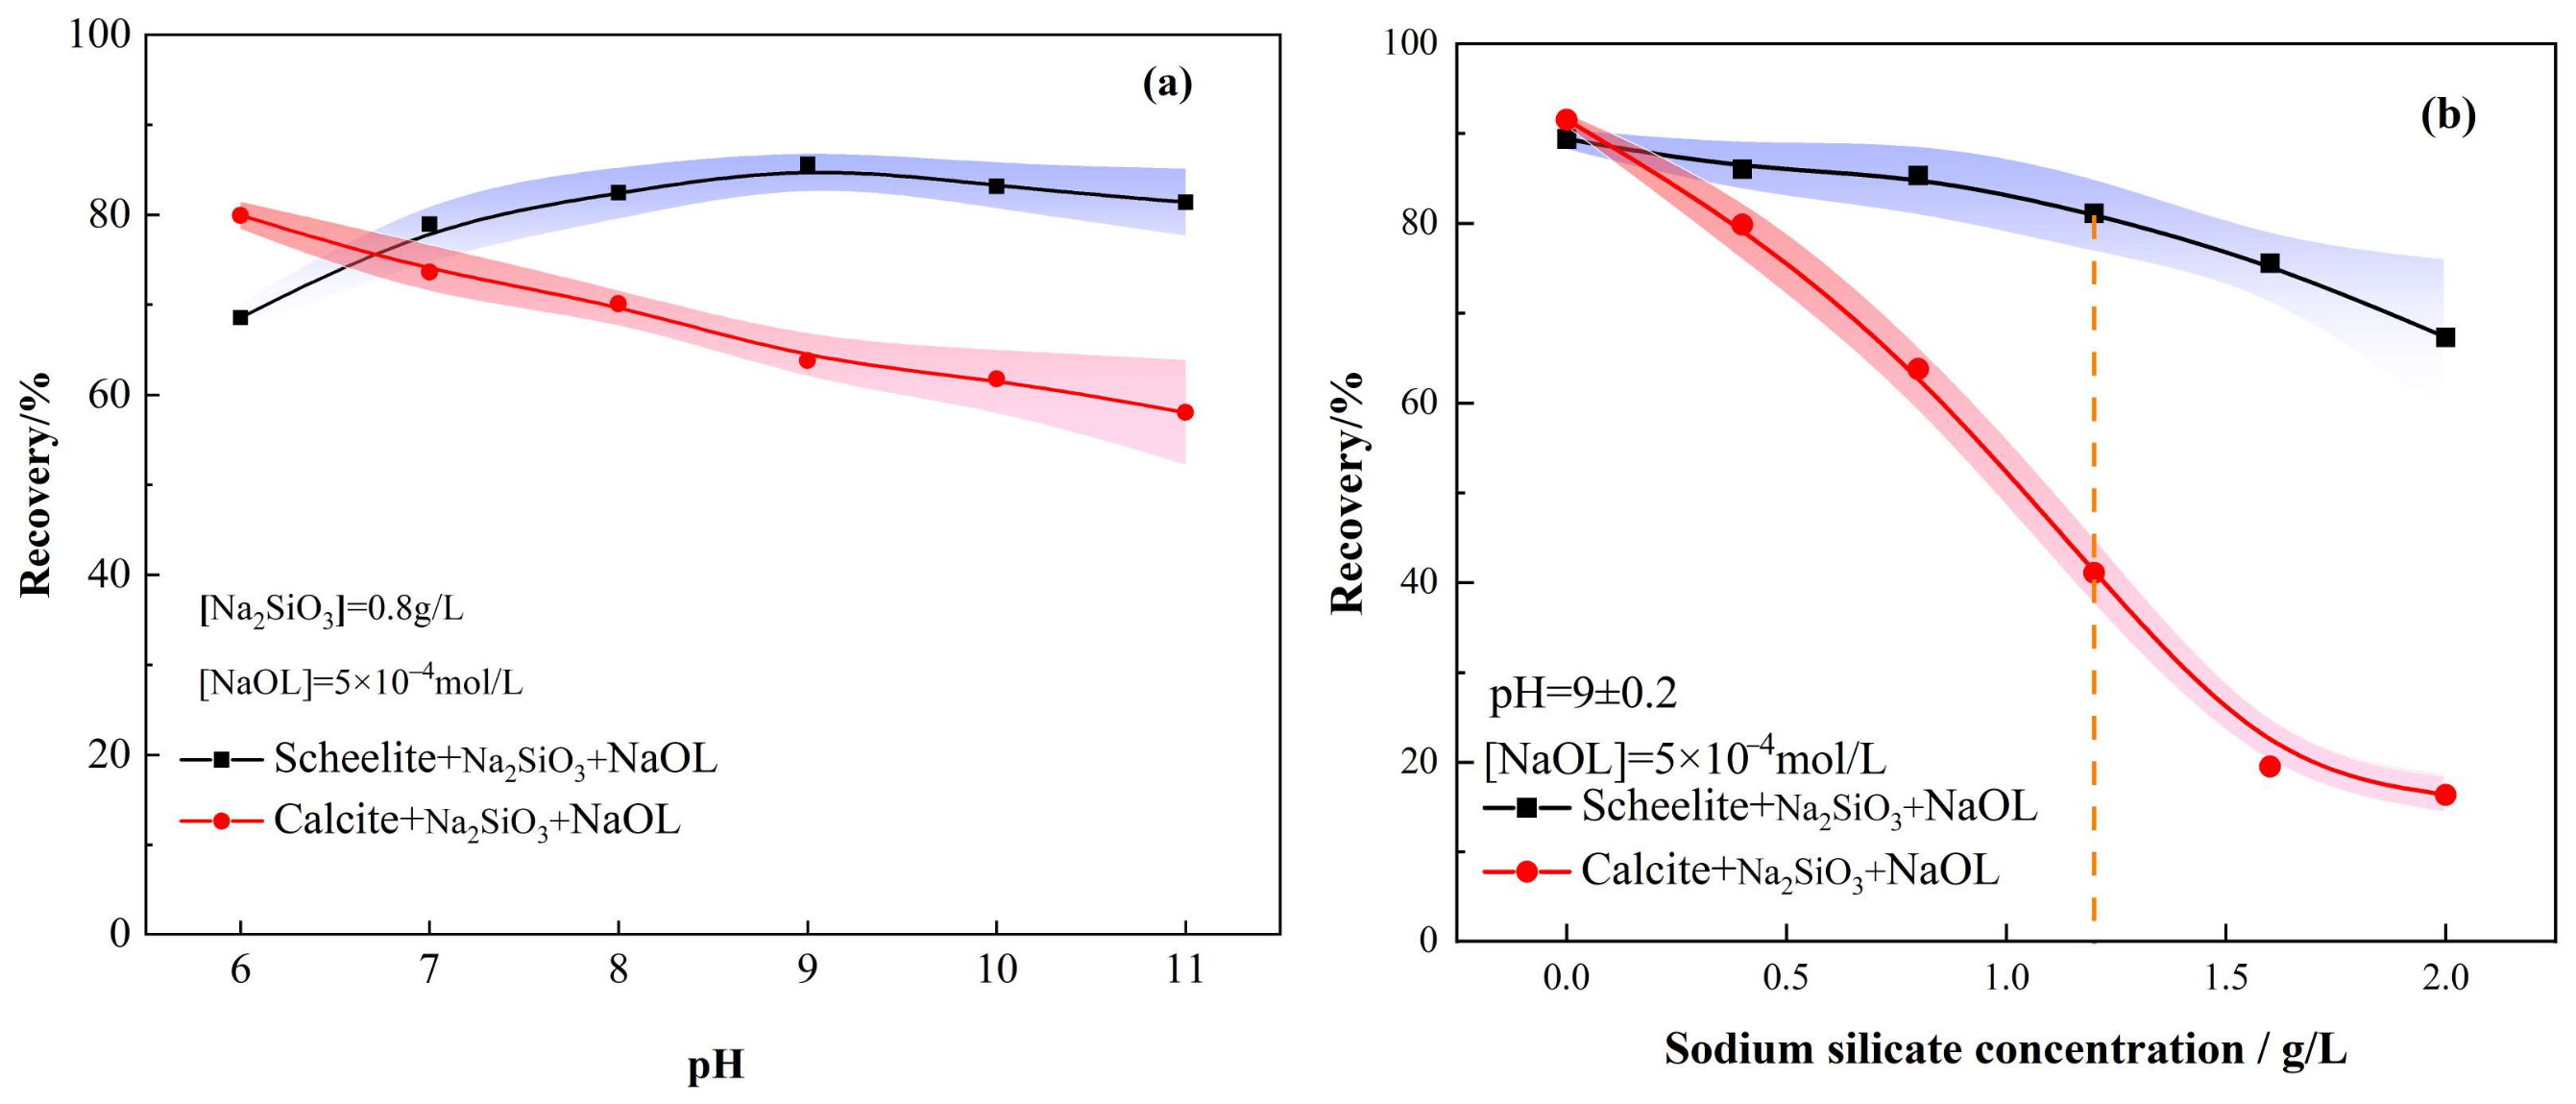
The effect of pH on the recovery rates is presented in Figure 3a. The recovery of scheelite increased and then decreased as pH increases with the addition of sodium silicate as an inhibitor, while calcite showed a continuous decreasing trend and stabilized. The difference between scheelite and calcite recoveries was the largest at pH = 9 ± 0.2, and, thus, was subsequently selected as the optimal pH to study the effect of Na2SiO3 dosage on the recoveries of both minerals. The effect of Na2SiO3 dosage on the recovery rates is indicated in Figure 3b. The scheelite recovery decreased gradually with the increase of Na2SiO3 dosage; it shows that when too much Na2SiO3 is used, it will also adsorb with scheelite, thus reducing the FR of scheelite [25]. Relatively speaking, the inhibition effect of Na2SiO3 on calcite was more obvious. Among all the Na2SiO3 dosage contents, 1.2 g/L showed a better separation effect (As shown by the dotted line in the Figure 3b). The FR of the two minerals differed by 40.03%; however, it is insufficient to effectively separate scheelite and calcite. Therefore, the separation effect of both minerals was enhanced by adding metal ions.
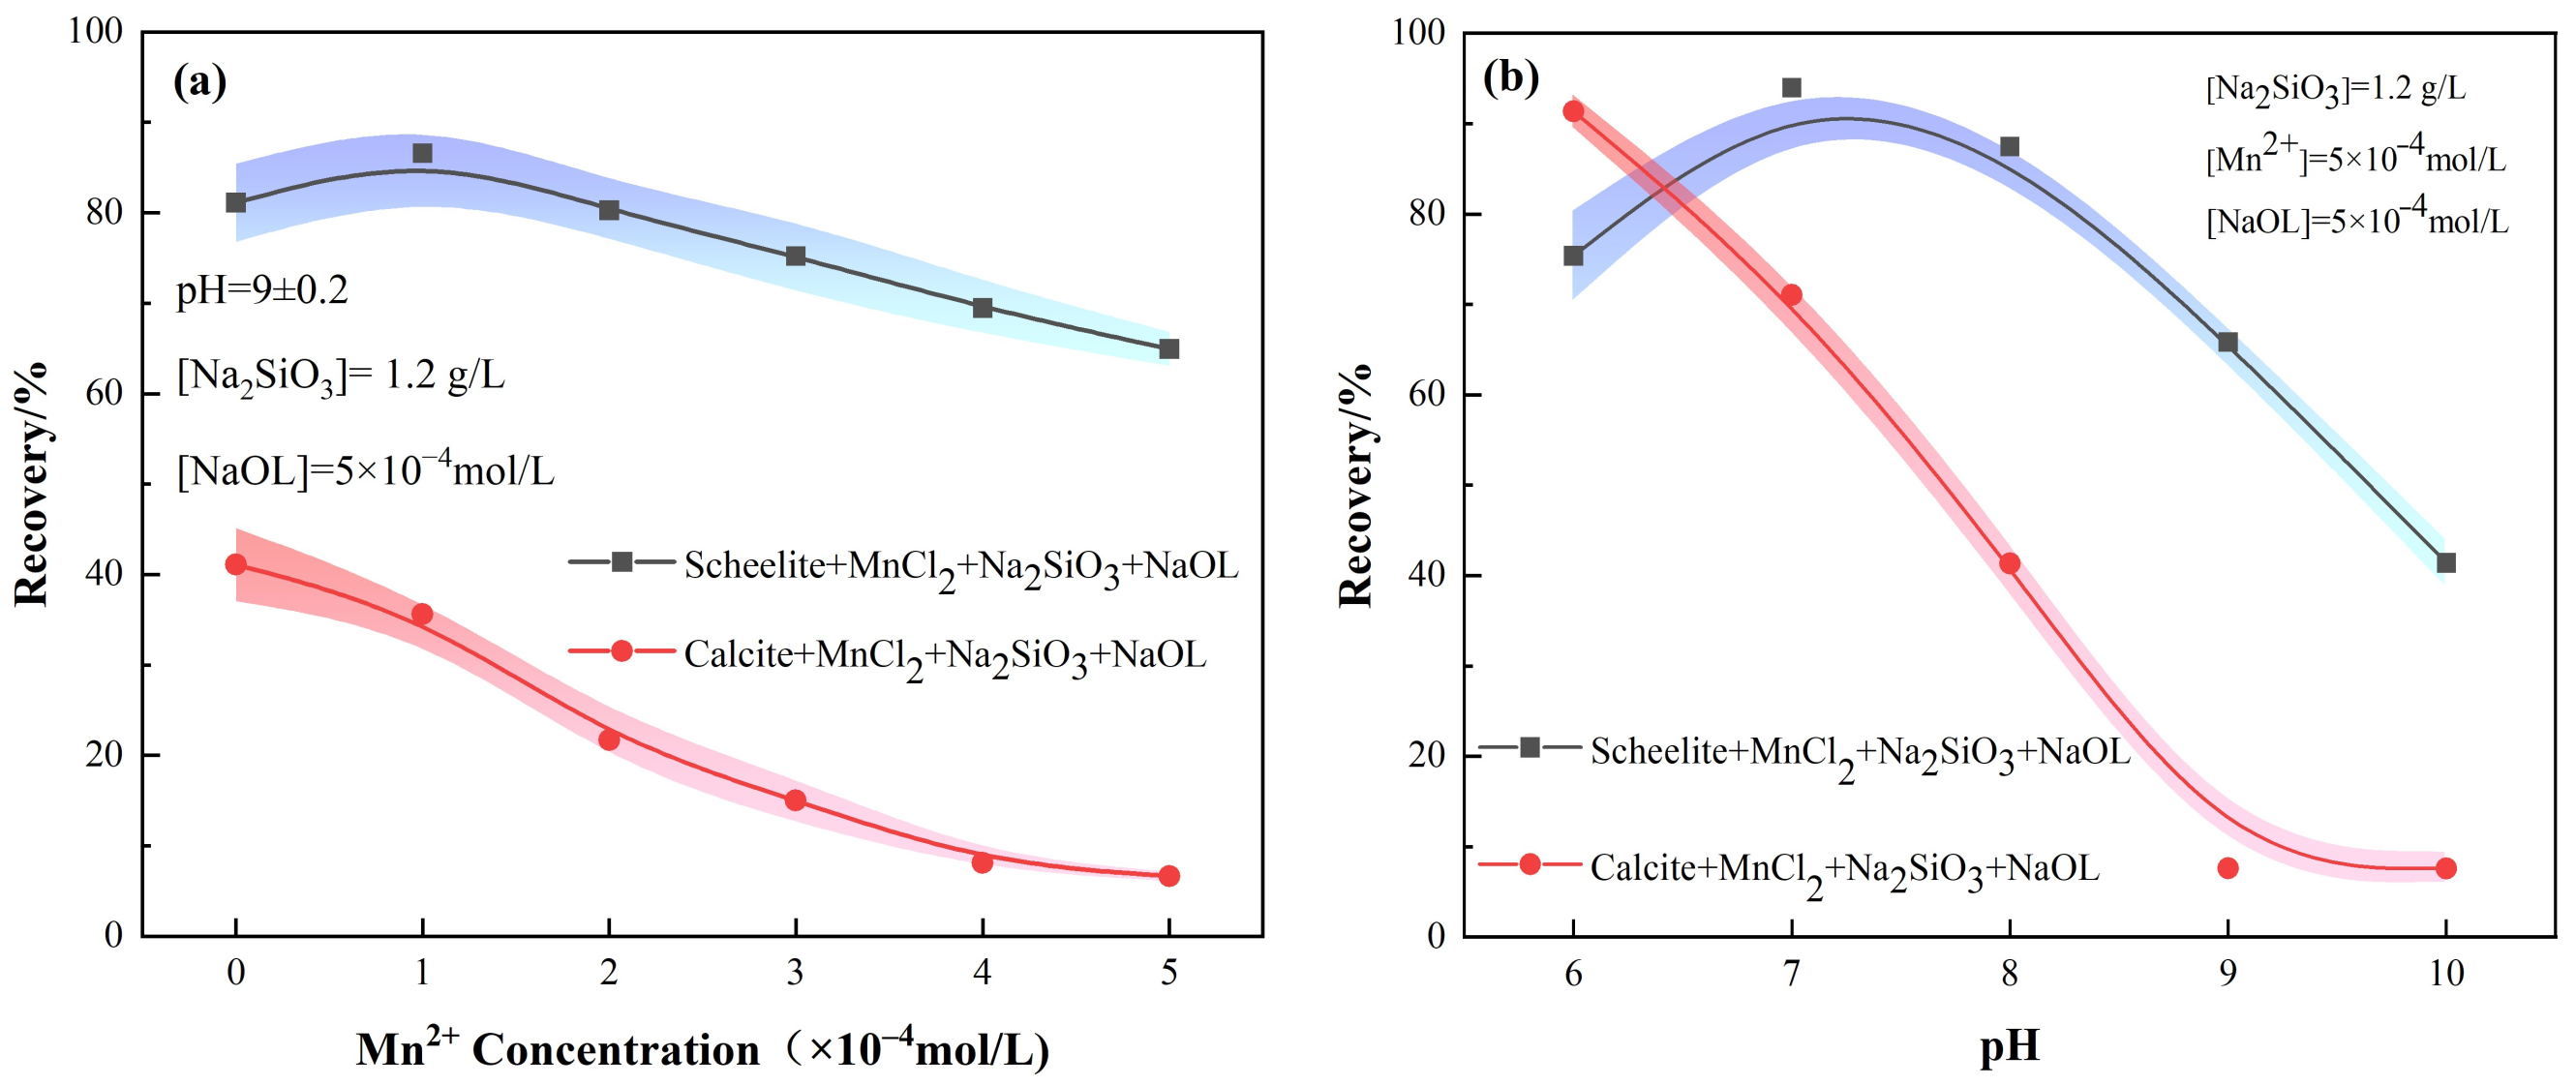
The effect of adding MnCl2 at different stages on the flotation recoveries of the two minerals is indicated in Figure 4 and Figure 5, and Figure 4b represents the recovery rates when MnCl2 was added first, followed by Na2SiO3. The scheelite recovery first increased and then decreased significantly with the increase of pH, while the recovery of calcite gradually decreased and then flattened out. It can be seen that the best separation efficiency of the two minerals was achieved at pH = 9 ± 0.2. On the other hand, when the dosing sequence was Na2SiO3 followed by MnCl2, the recovery of scheelite tended to increase gradually as pH increases, reaching the maximum at pH = 9 ± 0.2, after which it started decreasing. In contrast, the recovery of calcite gradually decreased and then leveled off, similar to that in the other dosing sequence with MnCl2 + Na2SiO3.
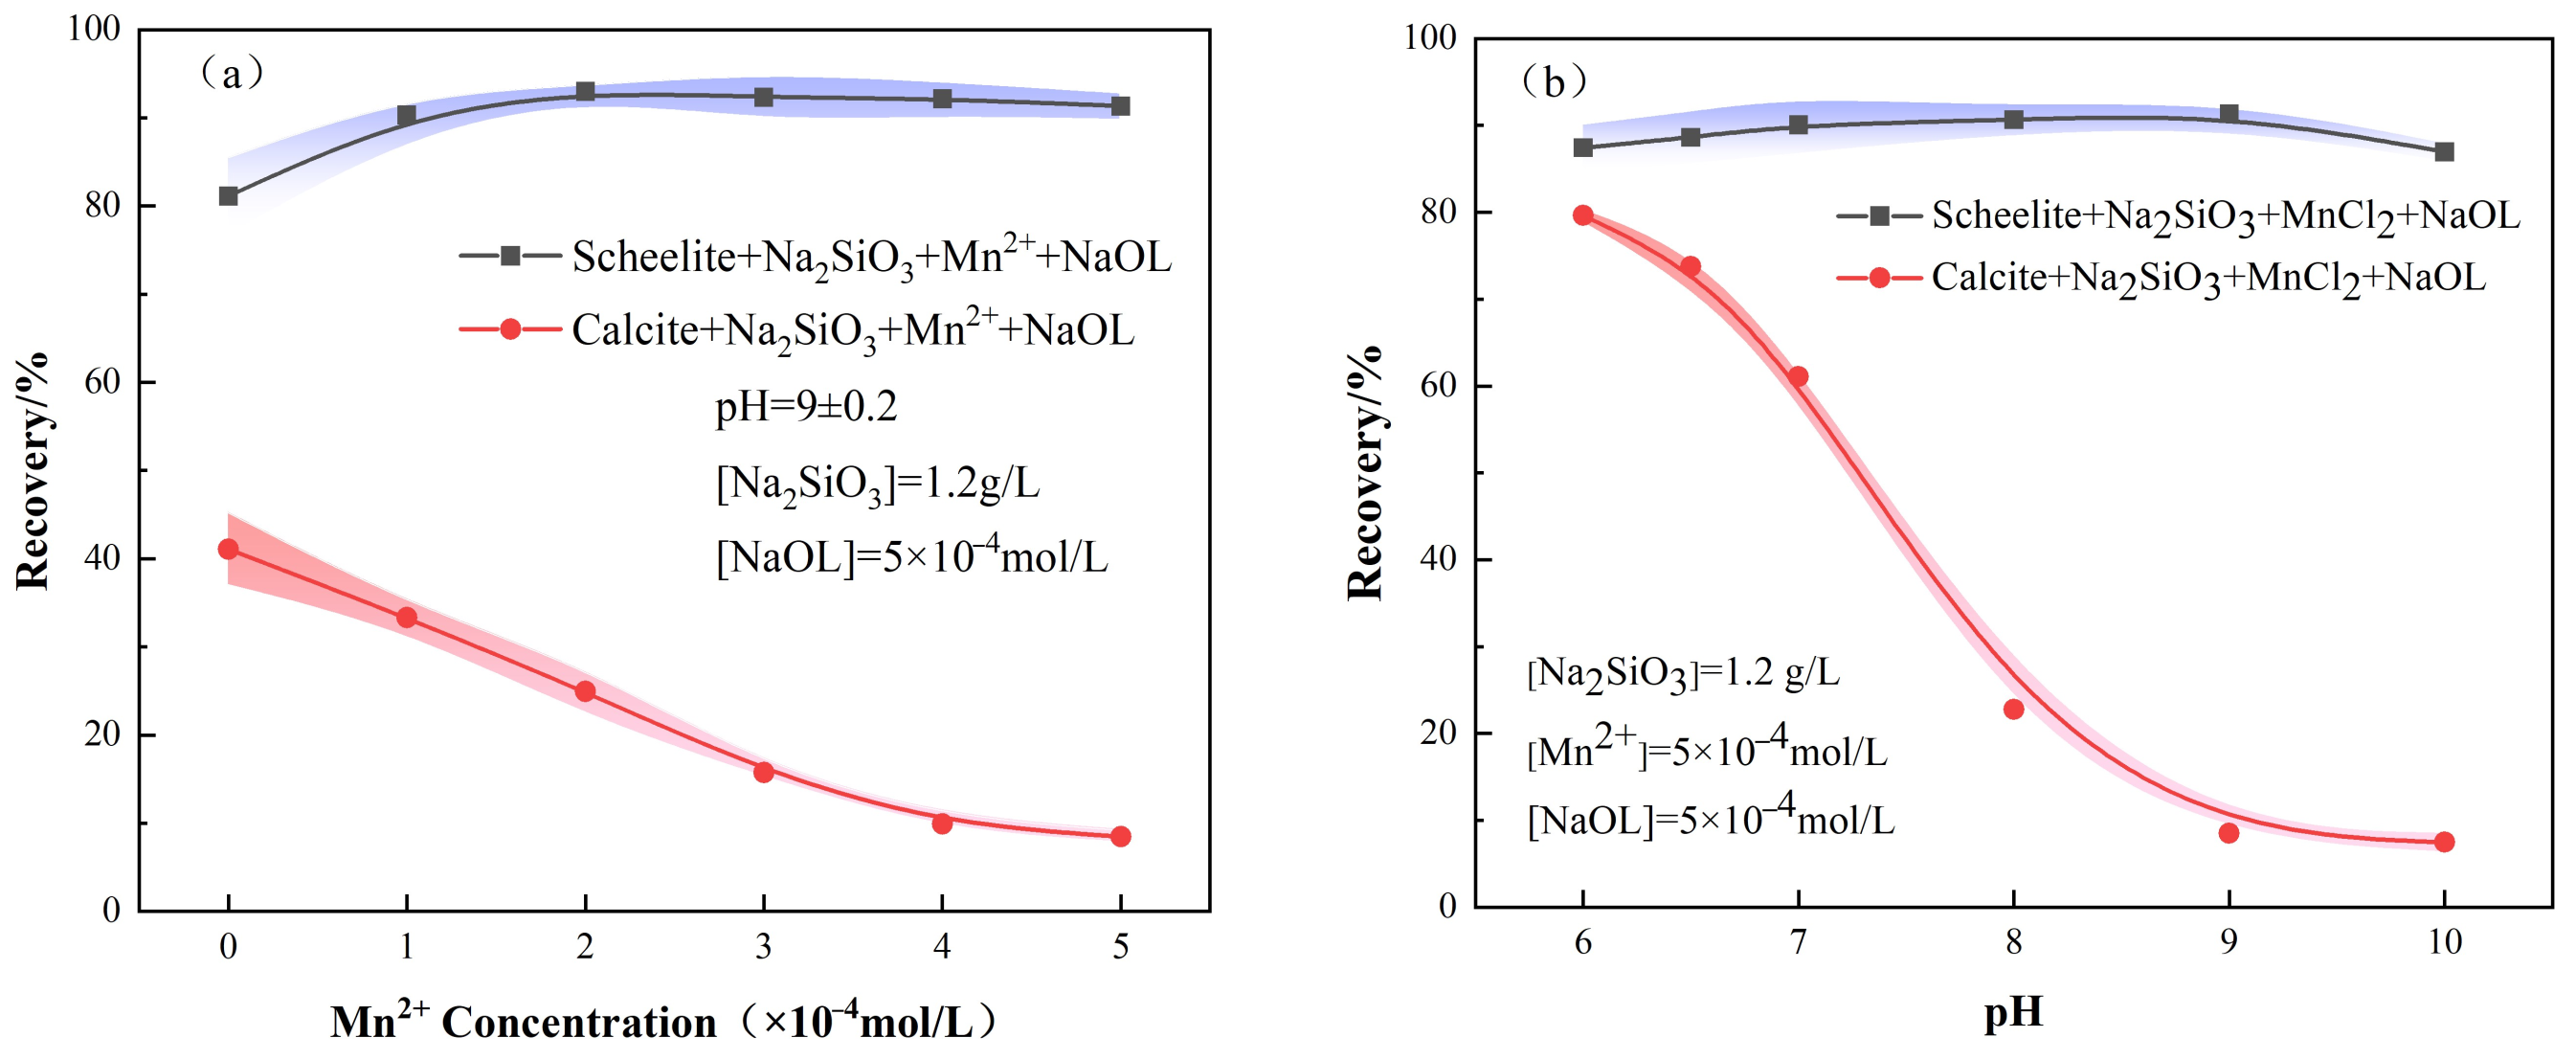
Furthermore, the relationship between Mn2+ concentration and mineral FR was also investigated. For the target mineral scheelite, it is obvious from Figure 4a that the recovery of scheelite firstly increases with the addition sequence of MnCl2 + Na2SiO3, and then decreases continuously with the increase of the Mn2+ concentration. However, when Na2SiO3 was added first, the recovery of scheelite increased first and then leveled off at a concentration of Mn2+ of 5 × 10⁻⁴ mol/L (Figure 5a). The separation efficiency of scheelite and calcite under this condition was the best, with a difference of 82.84% in recovery.
As for the calcite, after the addition of MnCl2, its FR was lower than the condition of Na2SiO3 alone, regardless of the addition order, indicating that the addition of MnCl2 contributes to the selective inhibition of calcite by Na2SiO3. As the Mn2+ dosage increases, the recovery of calcite gradually decreased and then leveled off. Therefore, the dosing sequence of Na2SiO3 + MnCl2 can separate the two minerals more effectively.

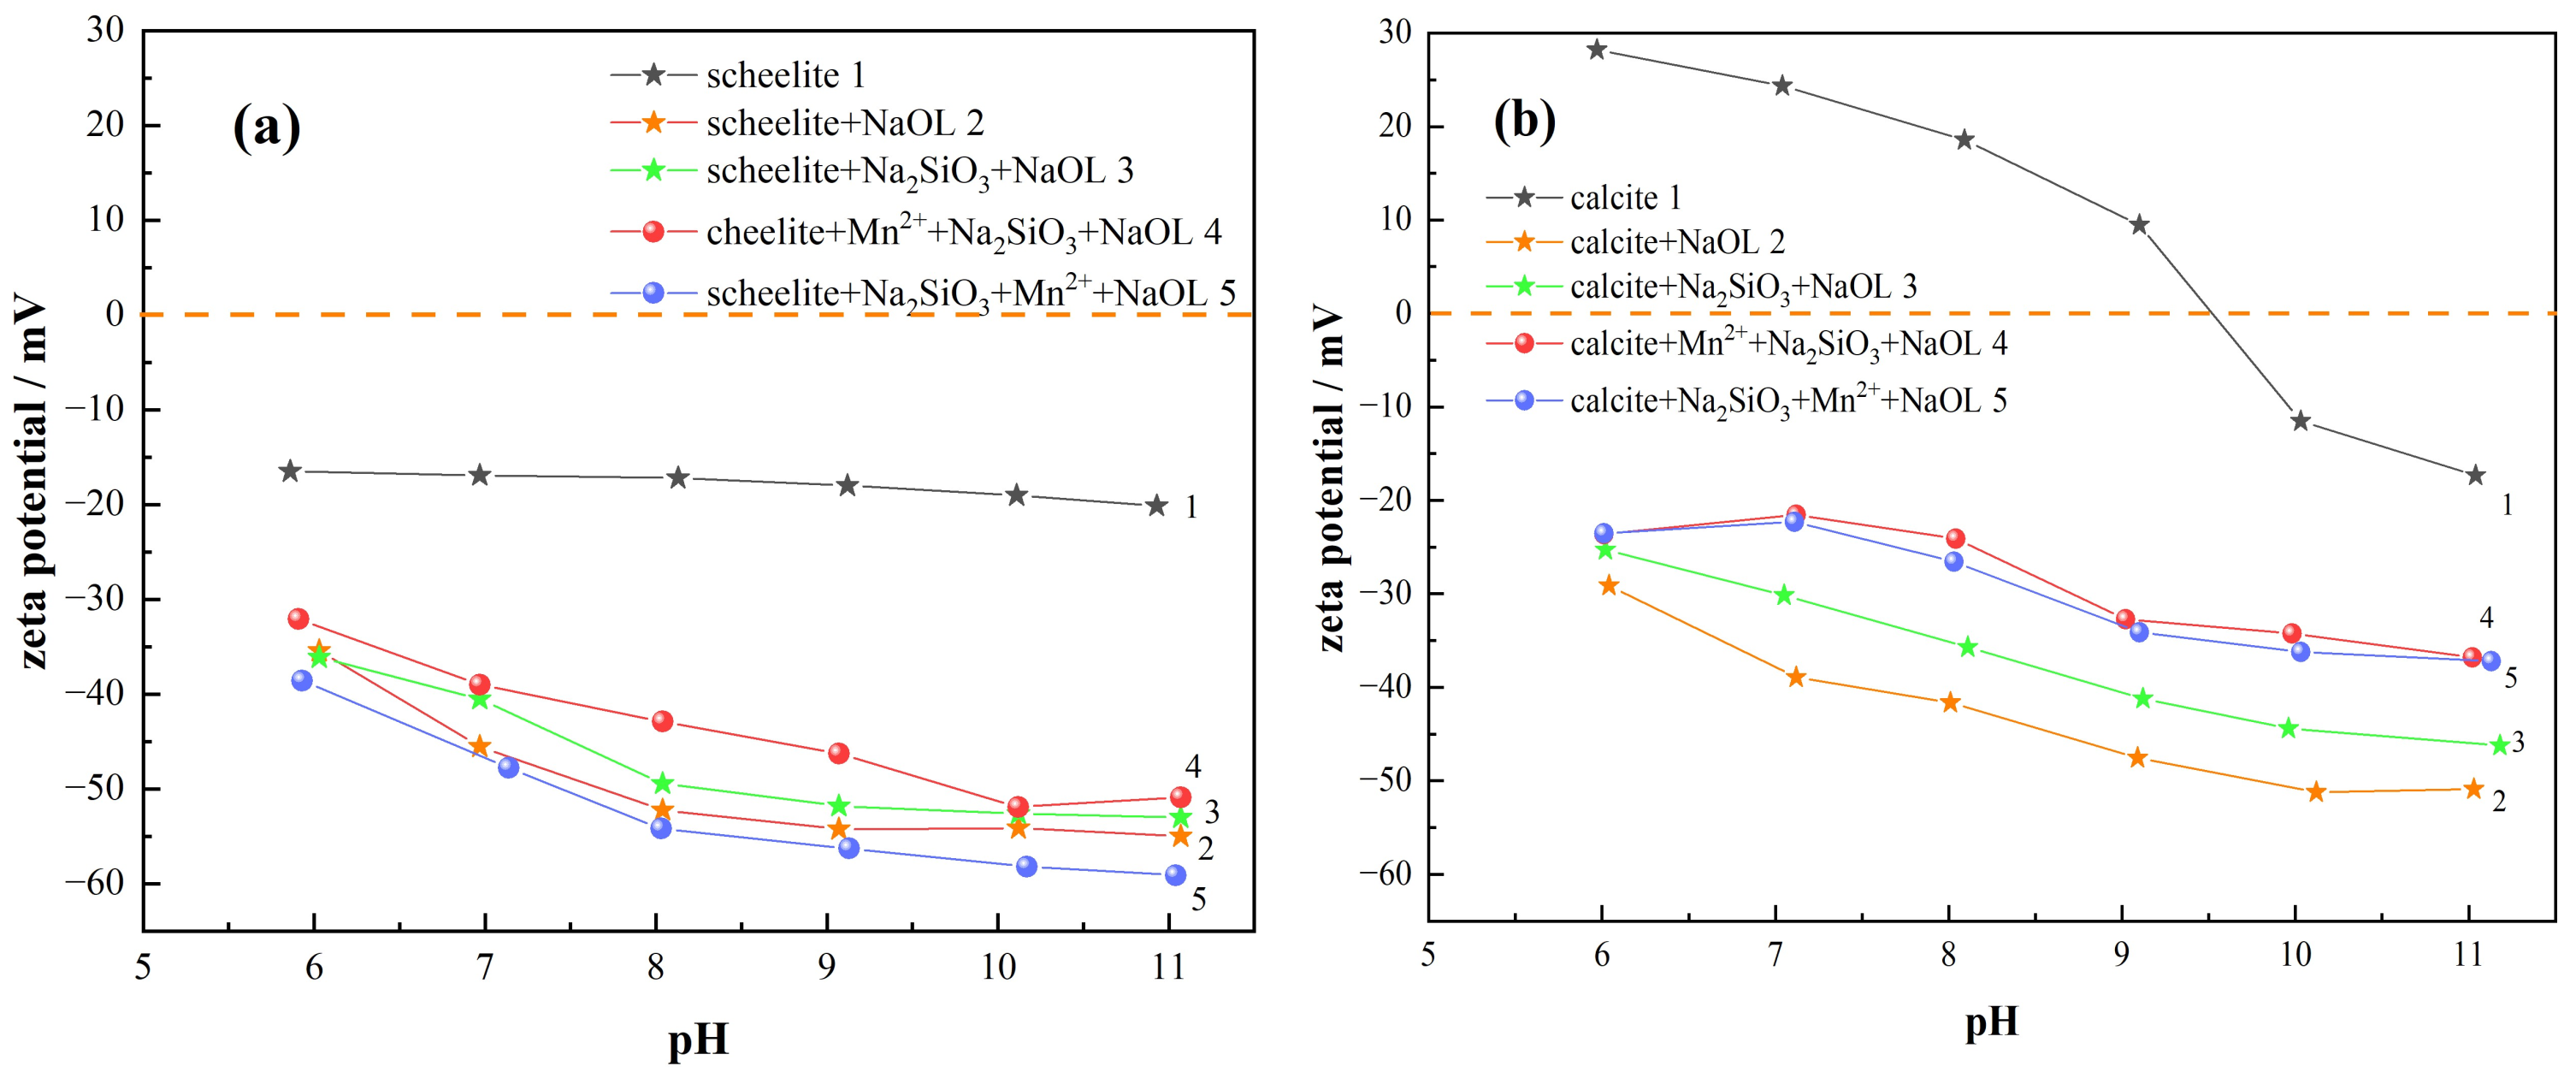
3.2. Zeta Potential Analysis

This assay can be used to analyze the adsorption behavior of reagents on the surface of mineral particles during flotation and the effect on the surface charge of minerals [26]. The effect of pH on the surface zeta potential of mineral particles of scheelite and calcite is given in Figure 6.
Figure 6a indicates that the zero electric point is not observed in scheelite throughout the pH interval and the surface potentials are negative [12]. The iso-electric point (IEP) of the surface of calcite was obtained at around pH = 9.5 (Figure 6b), which was consistent with previous literature studies [13,27].
Obviously, when NaOL interacts with minerals, the potentials all tend to show a negative shift (line 2 in Figure 6), indicating that the interaction of the oleate ion (RCOO) with the mineral surface in the anion collector NaOL leads to a transfer in the negative direction, as evidenced by previous studies by some scholars [26,28]. In contrast, when Na2SiO3 was added (line 3 in Figure 6), The mineral particle surface potentials of both scheelite and calcite are shifted in the positive direction; however, the shift of the scheelite potential is smaller. The results of the previous flotation tests also confirm this, indicating that sodium silicate would interact more with the calcite surface; thus, it prevents NaOL from reacting with its surface and inhibits its floating [27].
When Mn2+ was added first (line 4 in Figure 6a), The scheelite potential was positively shifted by 5.5 mV at pH = 9 compared with the case of adding only Na2SiO3. The increase of sodium silicate adsorption may decrease the adsorption of NaOL on the mineral surface. On the other side, when the MnCl2 is added later (line 5 in Figure 6a), the scheelite potential is clearly the most negatively shifted compared to all other dosing conditions and shifted in the negative direction by 4.5 mV when only sodium silicate was added. Referring to the flotation test results, which showed an increase in recovery compared with the addition of Na2SiO3 only, it is obvious that the post-addition of Mn2+ promotes the activity of the scheelite surface and causes more oleate ions to react with the surface of scheelite by adsorption, thus contributing to the negative shift trend of surface potential.
After adding Mn2+ first (line 4 in Figure 6b), the calcite surface potential is positively shifted by 8.5 mV at pH = 9 when Mn2+ was added first, more than that when only sodium silicate was added, due to the lower adsorption of oleate ions. The calcite surface potential was slightly shifted in the negative direction when Mn2+ was added later (line 5 in Figure 6b), more than when Mn2+ was added first. The recovery was slightly higher when Mn2+ was added first. The addition of Mn2+ first provides active sites for sodium silicate, resulting in a slight enhancement of the calcite surface hydrophilicity. Therefore, the dosing sequence of adding Na2SiO3 first and then Mn2+ was chosen as the best condition.

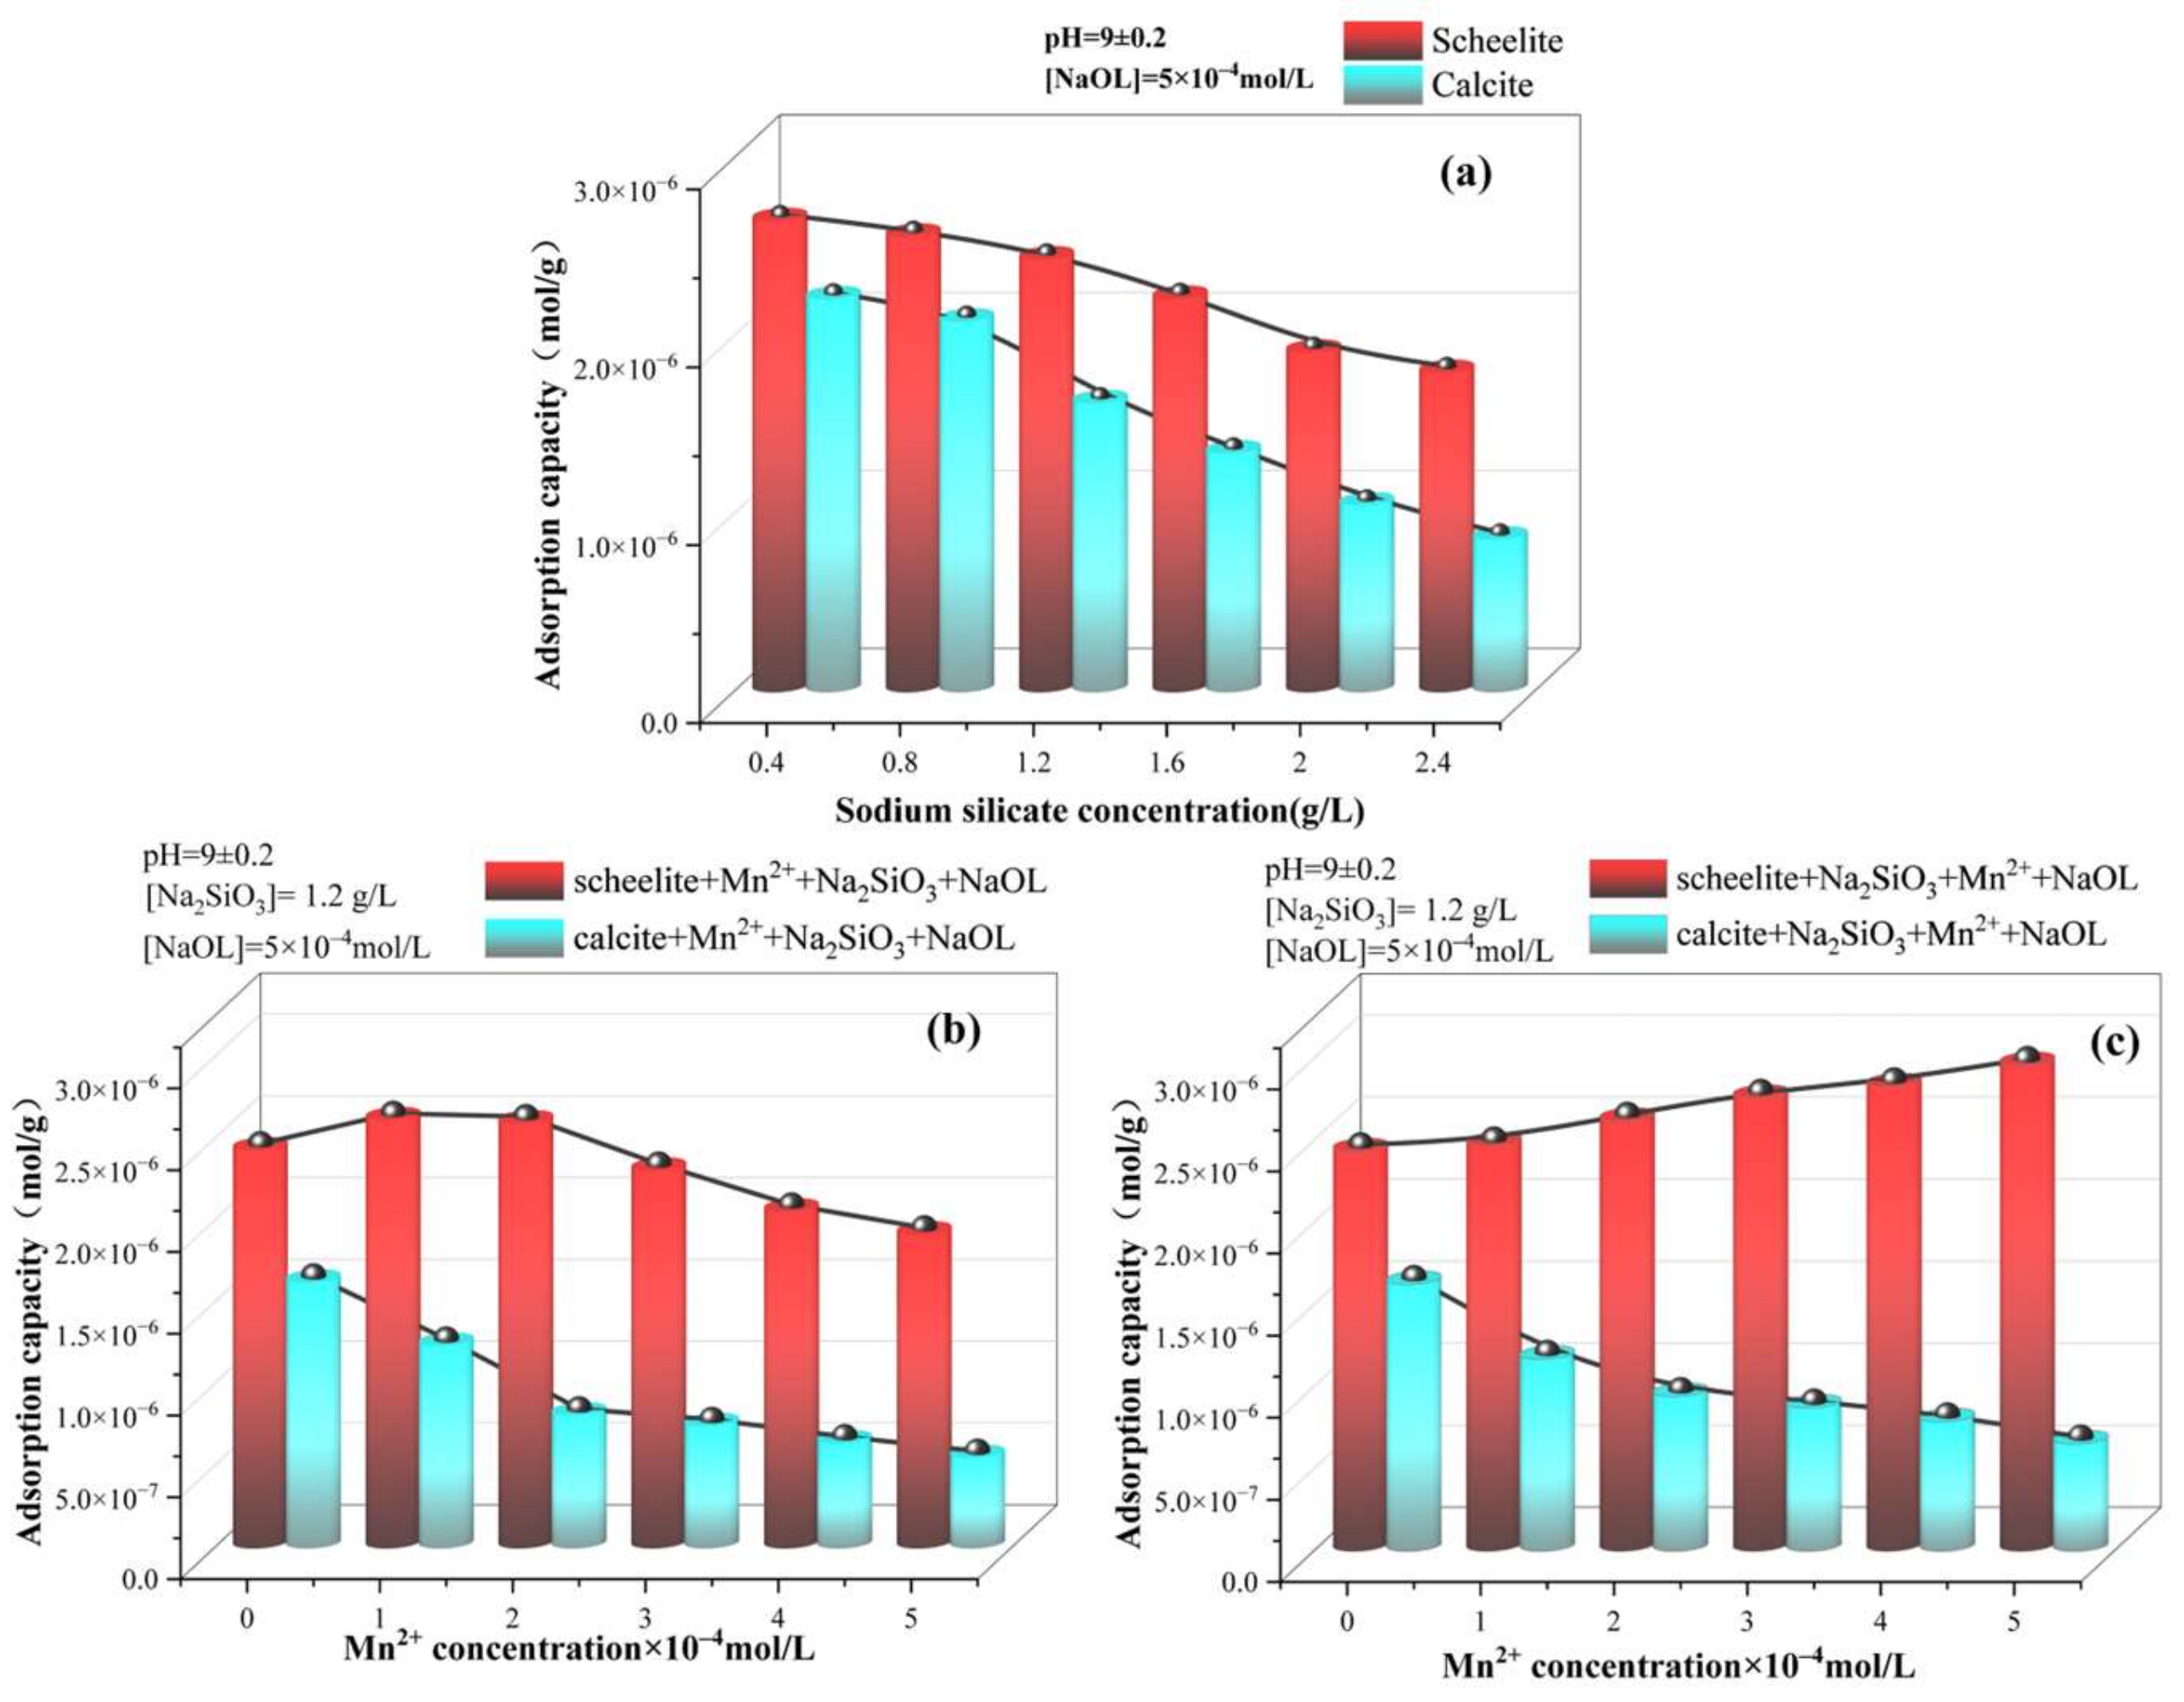
3.3. UV–Vis Analysis

The effect of adding different agents and varying dosages is presented in Figure 7a. The addition of sodium silicate resulted in an inhibition effect in both minerals; however, the inhibition effect on calcite was more obvious. The adsorption capacity of NaOL on both mineral surfaces showed a negative correlation with the dosage of Na2SiO3. The increase of sodium silicate dosage makes it impossible to achieve FS of two minerals.
The effect of increasing the Mn2+ concentration on the adsorption amount of NaOL when MnCl2 was added first is shown in Figure 7b. An increasing trend was observed with the increasing dosage of Mn2+ when MnCl2 was added first, compared to that without MnCl2 addition. This may be due to the fact that at low Mn2+ concentrations, NaOL will preferentially adsorb on the scheelite surface before Na2SiO3 due to the poor adsorption of sodium silicate itself to scheelite, causing an increase in adsorption. On the other hand, the increase of Mn2+ dosage led to more active sites of Mn2+ adsorption on the scheelite surface, and, thus, the adsorption of Na2SiO3 also increased, which increased the hydrophilicity of the surface. In addition, the adsorption of NaOL on scheelite showed a decreasing trend, indicating that the increase of Mn2+ dosage would inhibit the flotation of scheelite. In addition, the adsorption of NaOL on calcite also showed a decreasing trend, leading to the inability of the two minerals to be separated.
As shown in Figure 7c, the addition of MnCl2 after Na2SiO3 increased the adsorption of C18H33NaO2 on the scheelite surface gradually as the Mn2+ concentration increases. The NaOL content of the calcite surface gradually decreased and did not vary much under the two dosing orders, which was consistent with the results of the flotation test and zeta potential. At the dosage of Mn2+ of 5 × 10⁻⁴ mol/L, the difference in the C18H33NaO2 adsorption amount between the two minerals reached 2.306 × 10⁻⁶ mol/g. It indicates that the dosing sequence of adding Mn2+ after sodium silicate can facilitate the FS of the two minerals.
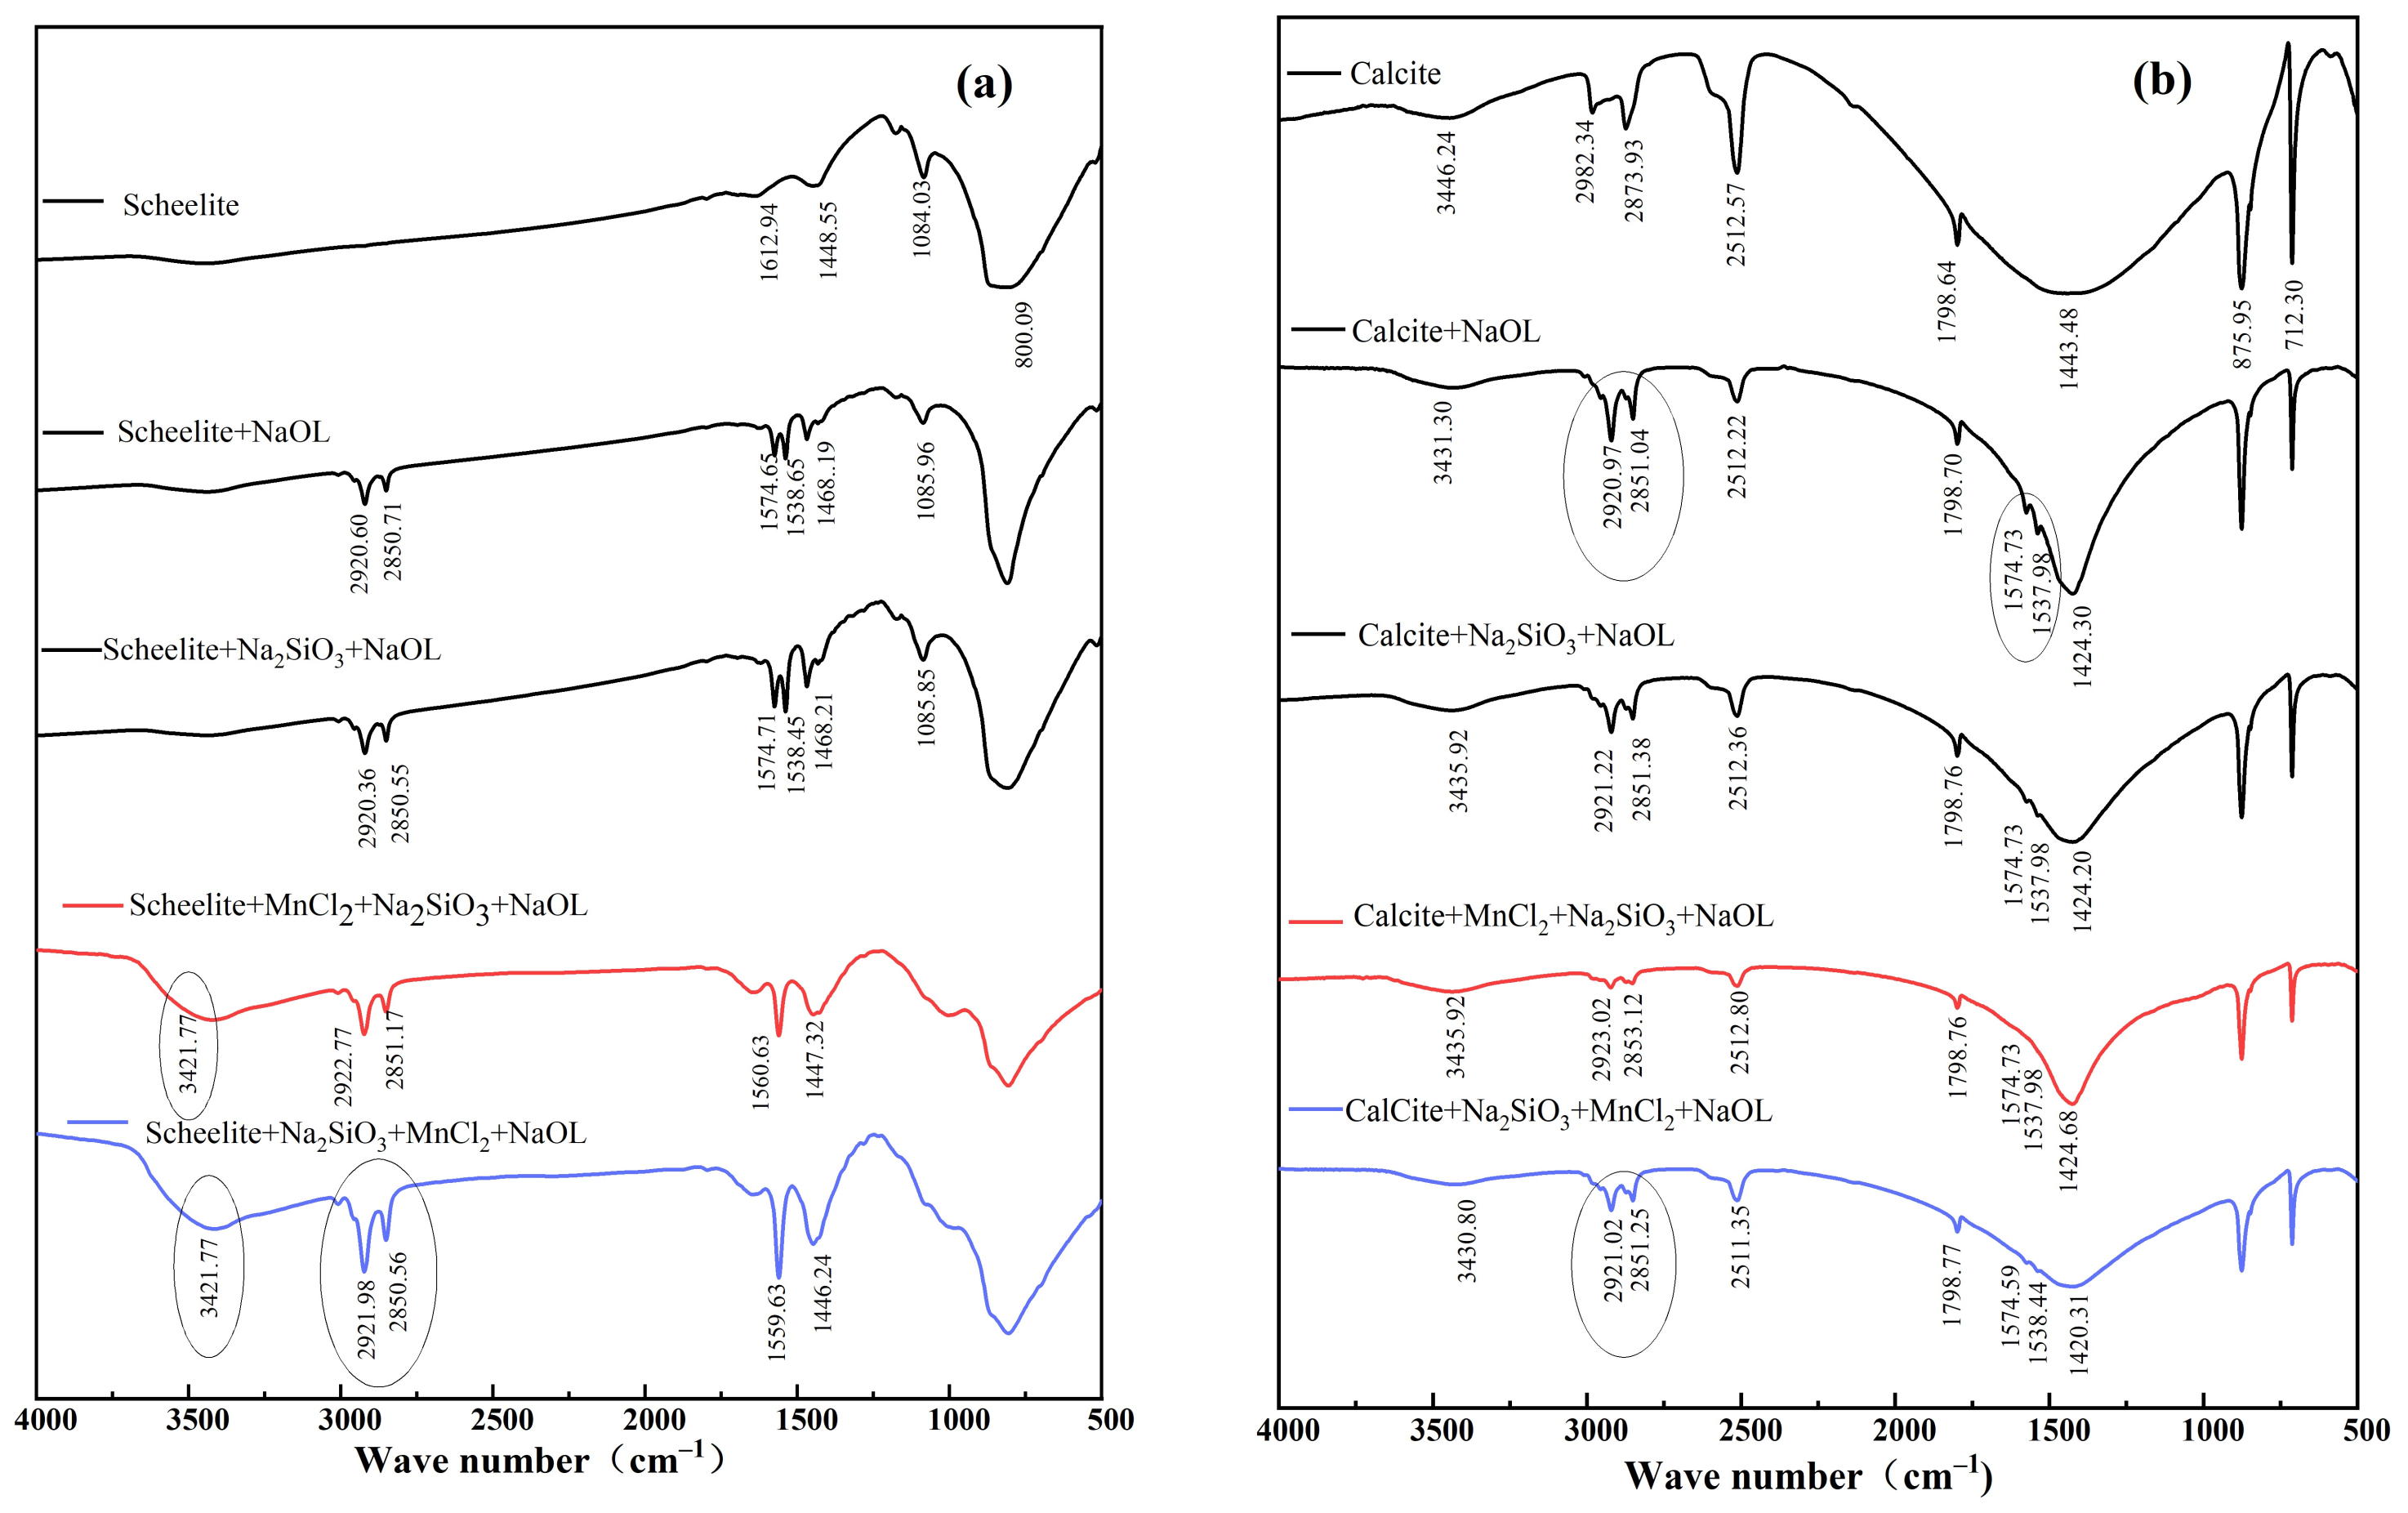
3.4. FTIR Analysis

The IR spectral method is used to study the nature and phenomena of adsorption of substances at the solid–liquid interface to study the nature of adsorption of flotation chemicals on mineral surfaces during flotation, as well as the orientation of adsorbed substances and detailed information on adsorption/resolution equilibria and substance formation [29]. The mechanism of the action of the agents on the surface of the two minerals under the conditions of two incorporation points of manganese ions was analyzed by infrared spectroscopy.
The IR spectra before and after the addition of agents are displayed in Figure 8. In the presence of added sodium oleate, new absorption peaks were observed at 2920.60 cm−1 and 2850.71 cm−1, indicating the adsorption of C18H33NaO2 onto the scheelite surface, respectively, and the absorption peaks at 1574.65 cm−1, 1538.65 cm−1, and 1468.19 cm−1 due to the symmetric and asymmetric stretching vibrations of carboxyl [30]. It indicates that NaOL is adsorbed on the scheelite surface. The absorption peaks at 2920.36 cm−1 and 2850.55 cm−1 were attributed to -CH2-symmetric stretching peaks after the interaction of Na2SiO3 and NaOL with minerals [31]. After adding Mn2+ in a different order, a new peak appeared in the IR spectrum at 3421.77 cm−1 on the scheelite surface, due to the interaction of MnCl2 with the surface of the scheelite mineral. When Mn2+ was added after sodium silicate, the absorption peaks at 2921.98 cm−1 and 2850.56 cm−1, because of the antisymmetric stretching peak of alkyl CH2, and the absorption peaks at 1559.63 cm−1 and 1446.24 cm−1, are attributed to the -COO absorption vibration peak. Meanwhile, the absorption peaks of alkyl CH2 and COO- appearing on the scheelite surface are significantly enhanced in intensity compared with those under other agent regimes. The results showed that Mn2+ added after sodium silicate could adsorb onto the scheelite surface and enhance its Mn2+ active site; thus, the adsorption capacity of NaOL on the scheelite surface was enhanced.
After adding NaOL (Figure 8b), the absorption peaks at 2920.97 cm−1 and 2851.04 cm−1 because of the antisymmetric stretching peak of CH2. The absorption peak of calcite at 1443.48 cm−1 is shifted to 1424.30 cm−1. After the addition of Mn2+ after sodium silicate, the absorption peaks on the calcite surface at 2921.02 cm−1 and 2851.25 cm−1, because of the antisymmetric stretching peaks of alkyl CH2, and the peaks at 1572.53 cm−1 and 1534.69 cm−1 were attributed to the COO-absorption vibration peaks. In comparison with the IR spectra of calcite after the action of the other three agent regimes, the absorption peaks of alkyl CH2 and COO- were also present on the calcite surface, but their intensities were greatly weakened. Combined with the results of the adsorption amount test, and obviously, after the addition of Na2SiO3, they preferentially adsorb with calcite, and then after the addition of manganese chloride, there is more free Mn2+ in the solution due to the physical and chemical adsorption of calcite surface with sodium silicate, followed by the inability to adsorb Mn2+. After adding sodium oleate, more oleate is generated by the reaction between Mn2+ and sodium oleate, which makes the calcite-weak sodium oleate absorption peaks appear on the surface.
The IR spectra of the two mineral surfaces were analyzed together, and the two dosing orders of MnCl2 had different effects on the adsorption of inhibitors and traps on the surfaces of the two minerals. The dosing sequence of adding MnCl2 after Na2SiO3 can enhance the adsorption capacity of NaOL to scheelite and reduce the adsorption capacity of NaOL to calcite, thus enabling the two minerals to be separated.
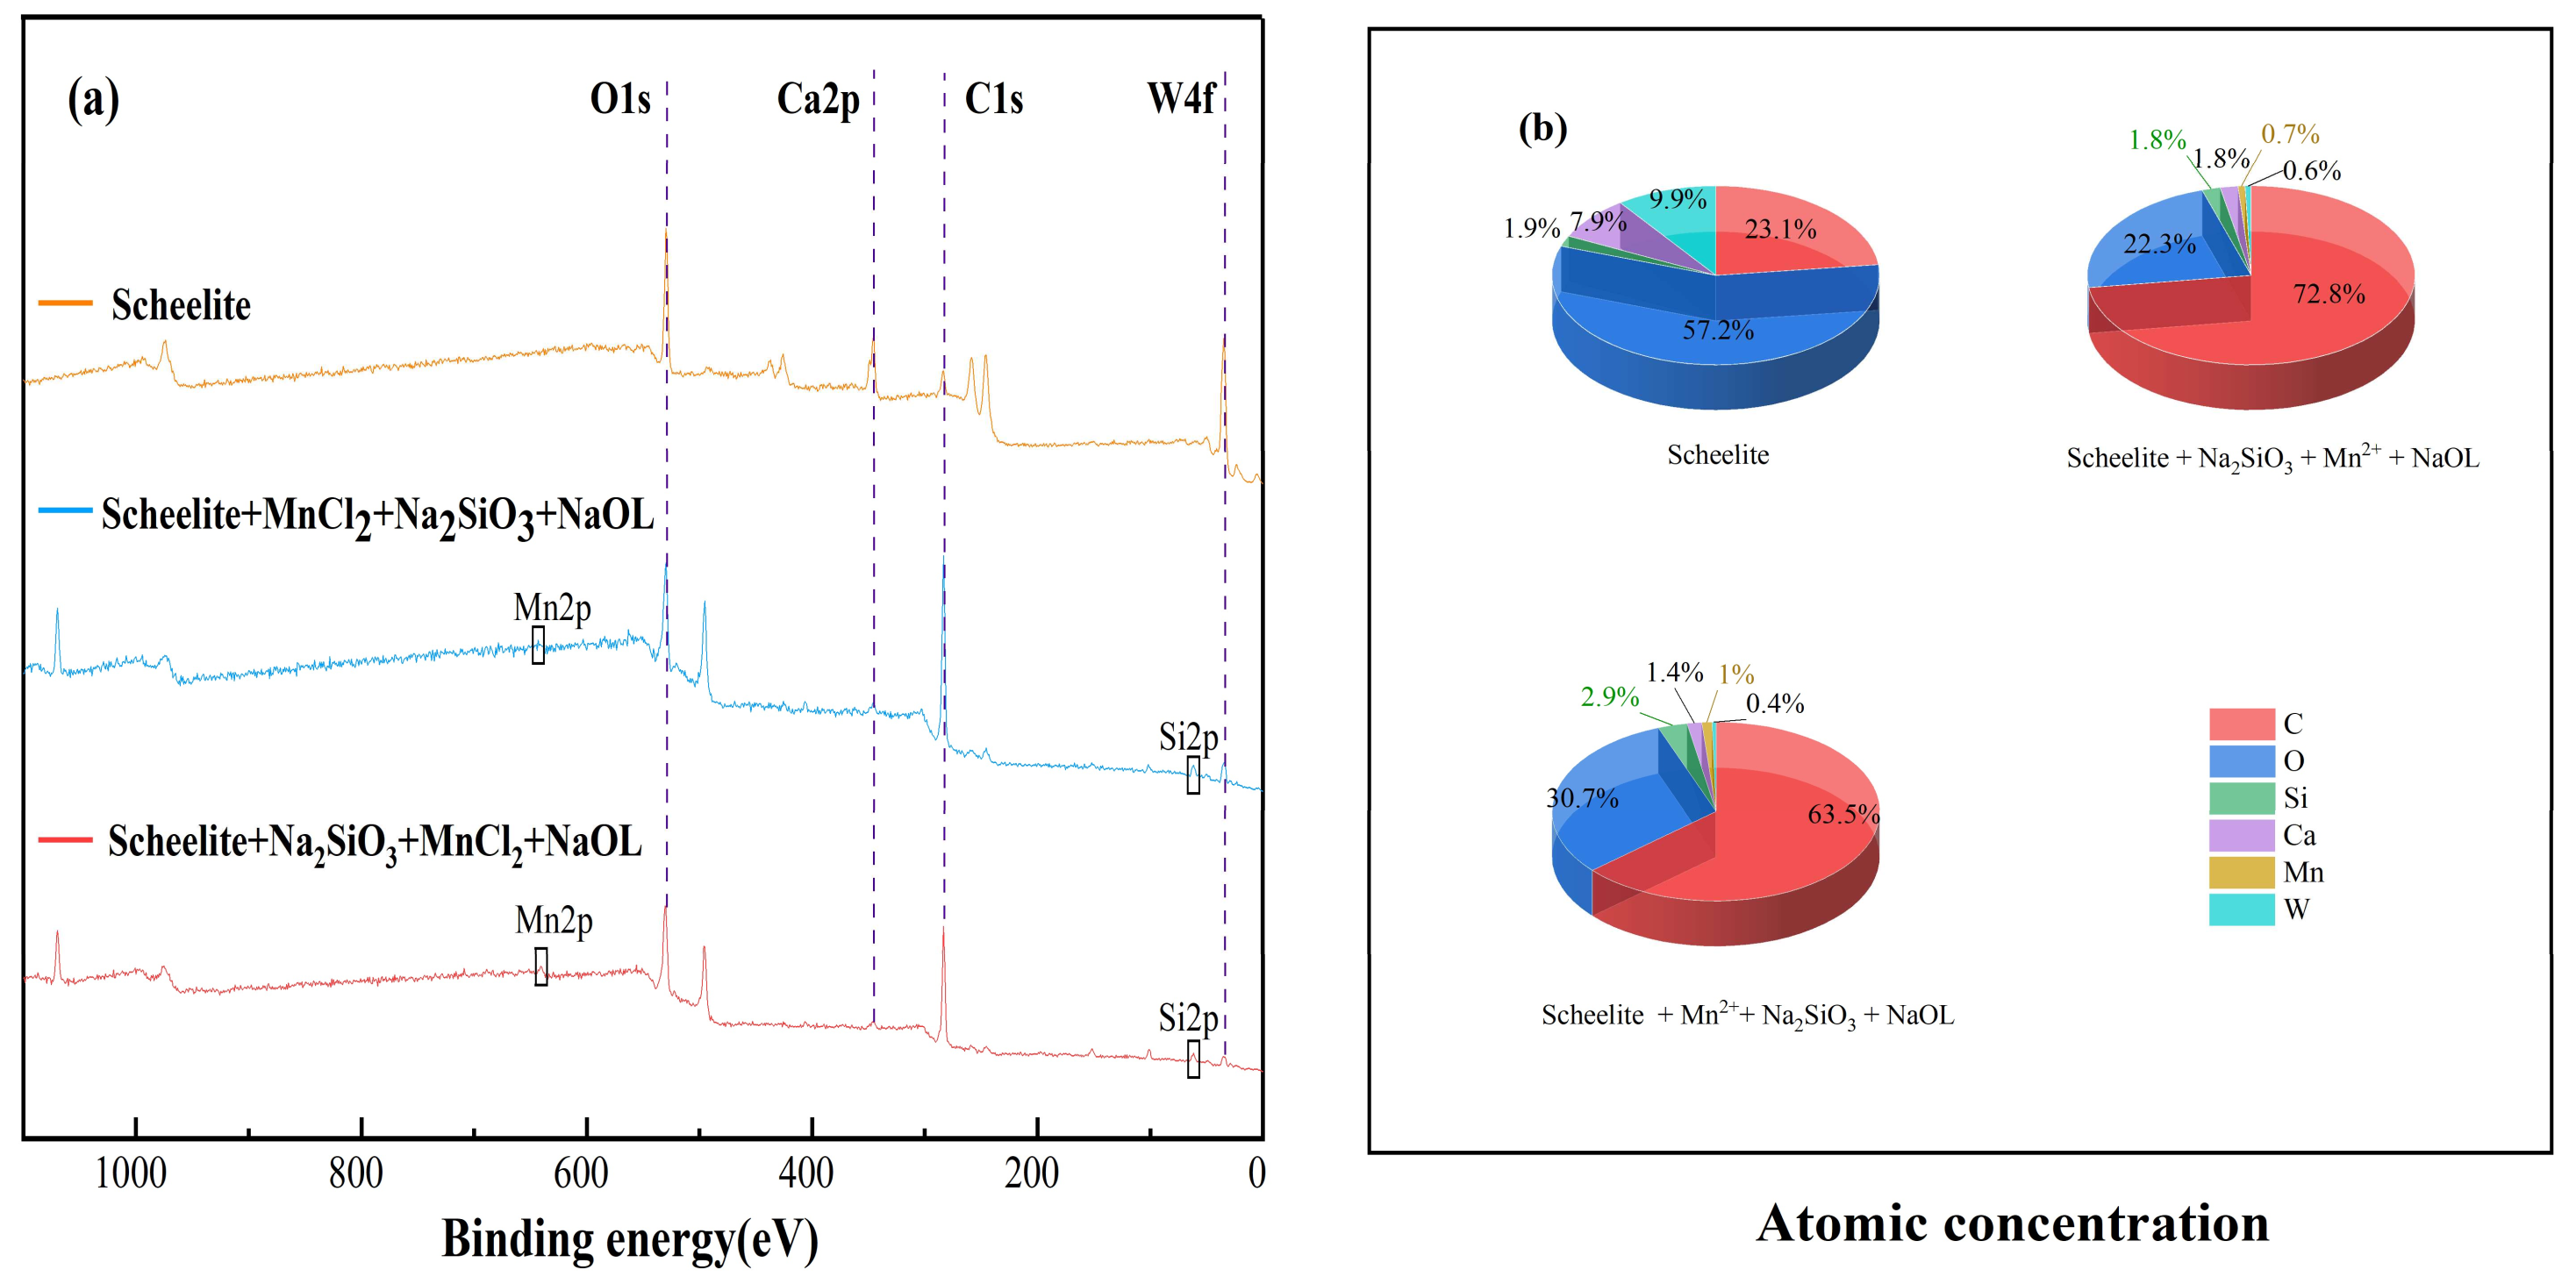
3.5. XPS Analysis

The XPS spectra of scheelite under different dosing sequences (Figure 9a) show that the characteristic peaks of Mn and Si appear under two different dosing sequences (I, MnCl2 + Na2SiO3 + NaOL; II, Na2SiO3 + MnCl2 + NaOL), which led to the conclusion that Mn and Si would adsorb to the surface of scheelite under these two conditions. However, the peak intensity of C1s in II was obviously larger than that of I. The atomic concentration statistics (Figure 9b) of C in the II order increased by 9.3% compared to those of I. Moreover, the atomic concentration of Si under the II condition is 1.8%, which is 1.1% lower than that of I, indicating that the I order can lead to more sodium silicate acting on the scheelite surface, leading to the enhancement of hydrophilicity on the scheelite surface. This may be because in condition I (when Mn2+ was added first), Mn2+ with more active sites adsorbs on the surface, and subsequently, after adding sodium silicate, reacts with silicate to generate more metal silicates adsorbed on the scheelite surface. In condition II (when sodium silicate was added first), sodium silicate is less selective, and thus less adsorbed on scheelite. After adding MnCl2, Mn2+ acts on the surface of minerals, and when sodium oleate is added, it can better act with scheelite to strengthen the flotation effect of scheelite.
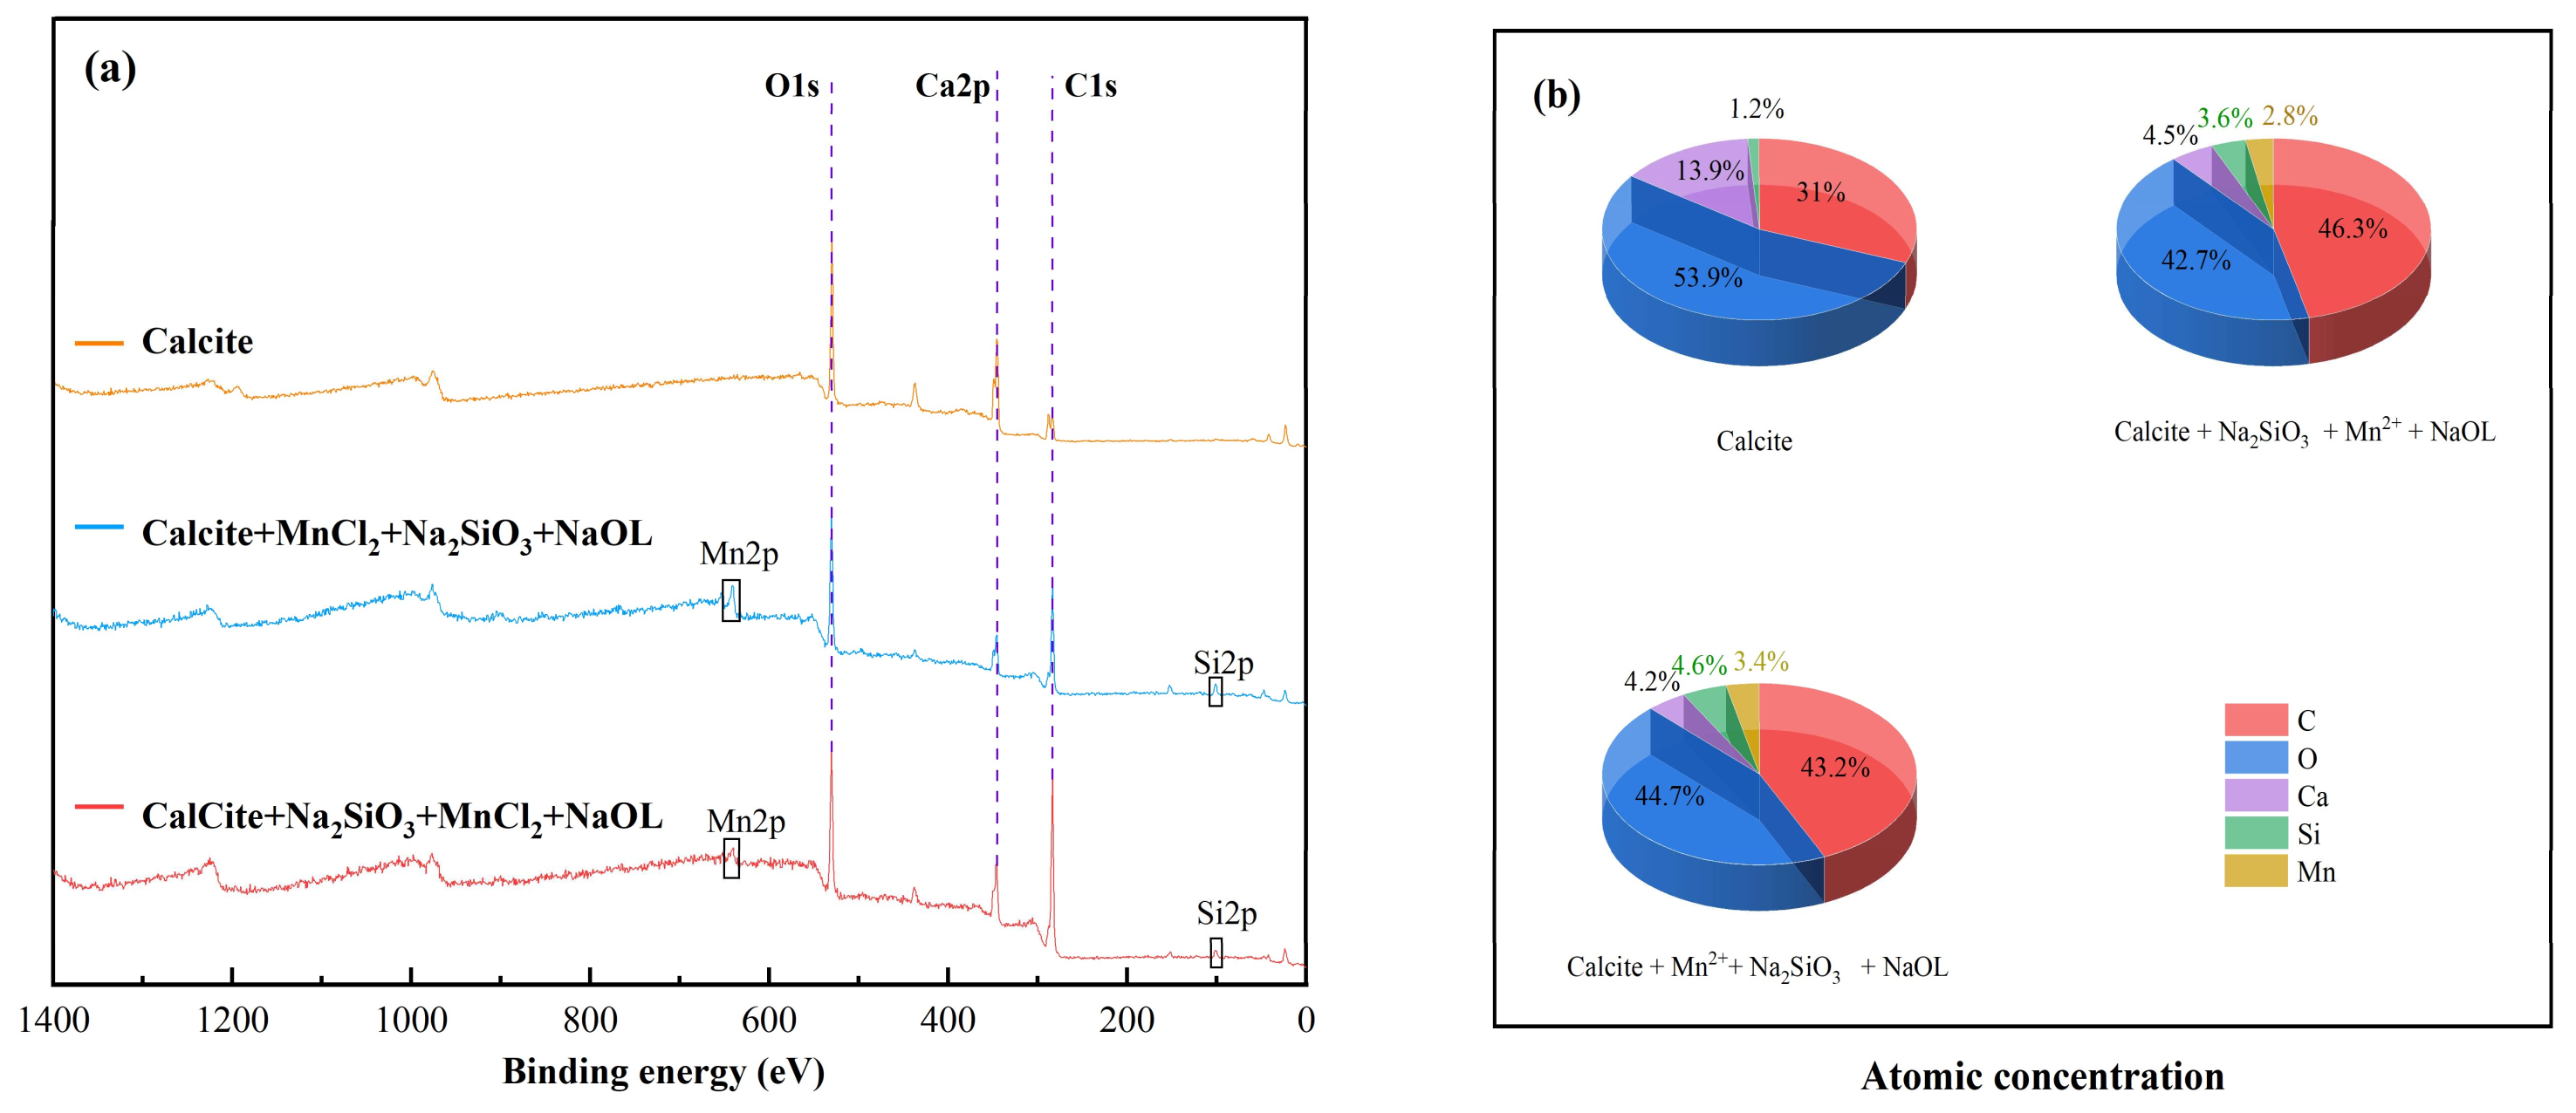
The XPS spectra of calcite under different dosing sequences (Figure 10a) show that the characteristic peaks of Mn and Si were generated under both conditions. Comparing the intensity of the peaks under the two dosing orders, the intensity of the peaks of C1s under the I order is lower than that in II. The atomic concentration statistics (Figure 10b) reveal that C atomic concentration in the I order is 3.1% lower than that of II, while the concentration of Si atoms is 1% more than that of II. It can be seen that MnCl2 acts with calcite first before Na2SiO3, which can reduce the floatability of minerals. However, when MnCl2 was added first, resulting in the absence of selectivity of sodium silicate for scheelite and calcite, the recovery of calcite was lower under the I sequence. It is not possible to separate scheelite and calcite by this dosing sequence. Therefore, the separation of the two minerals under the dosing sequence of Minerals + Na2SiO3 + MnCl2 + NaOL was better than that of sodium silicate alone.
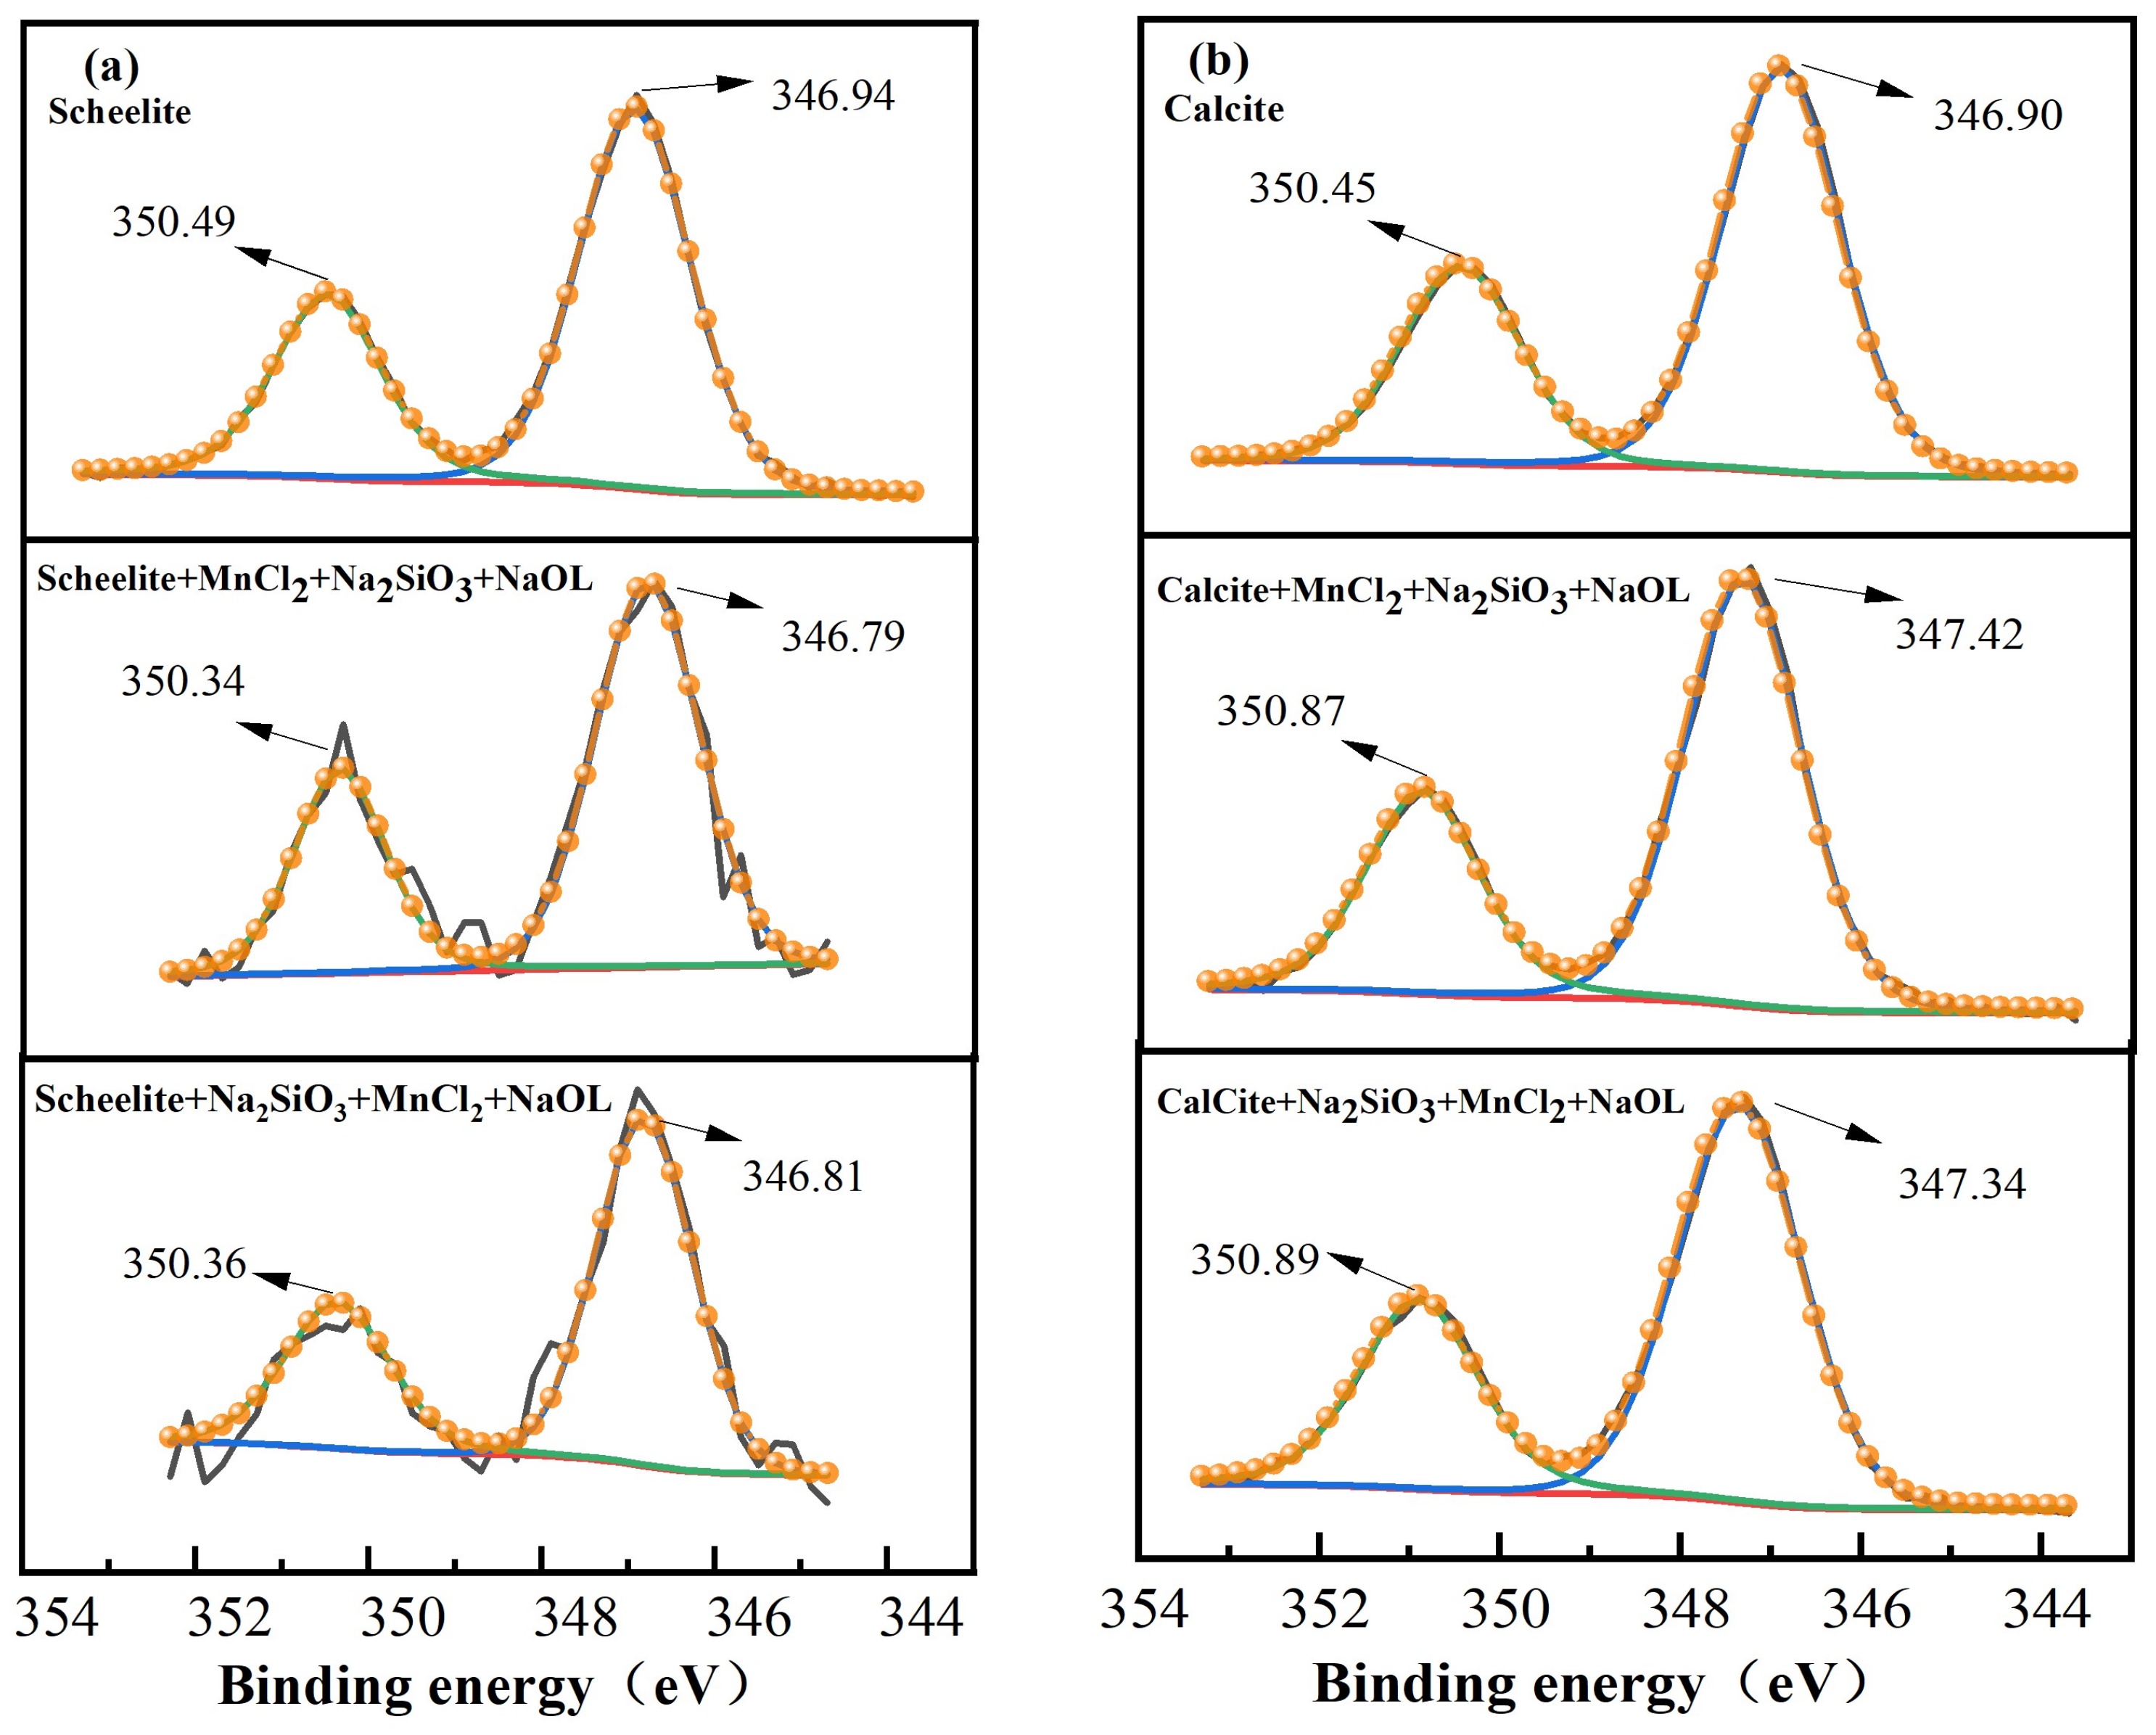
The high-resolution XPS spectra of the Ca2p of scheelite and calcite interacting with pharmaceuticals under different dosing sequences were analyzed by peak fitting and separation. It can be observed from Figure 11a that the peaks appearing at the binding energies of 346.94 eV and 350.49 eV can be assigned to Ca2p3/2 and Ca2p1/2, respectively [31]. The binding energies (BE) of Ca2p3/2 and Ca2p1/2 on the surface of scheelite after the action of MnCl2 + Na2SiO3 + NaOL were both shifted by 0.15 eV and after, the actions of Na2SiO3 + MnCl2 + NaOL were both shifted by 0.13 eV. The Ca2p BE on the surface of the scheelite had some offset, but the offset value was smaller than the error value, which indicated that the effect of chemicals on the Ca2p orbitals on the surface of the scheelite was small under the two dosing sequences.
The calcite also presented a similar spectrum for Ca2p. As can be observed from Figure 11b, the peaks Ca2p3/2 and Ca2p1/2 appeared at the binding energies of 346.90 eV and 350.45 eV, respectively [5]. The BE shift of Ca2p3/2 on the calcite surface after the action of MnCl2 + Na2SiO3 + NaOL was 0.52 eV, and that of Ca2p1/2 was 0.42 eV. Similarly, the BE shift of Ca2p3/2 on the calcite surface after the action of Na2SiO3 + MnCl2 + NaOL was 0.44 eV, and there was one for Ca2p1/2. The shift after the action of MnCl2 + Na2SiO3 + NaOL was more significant, indicating that the chemisorption was stronger under this dosing sequence, the results of previous flotation tests also confirm this. The Ca2p BE on the calcite surface also shifted after the action with the agent, and the shifted values were larger than the instrumental error values, indicating that the agent can react with the calcite surface.

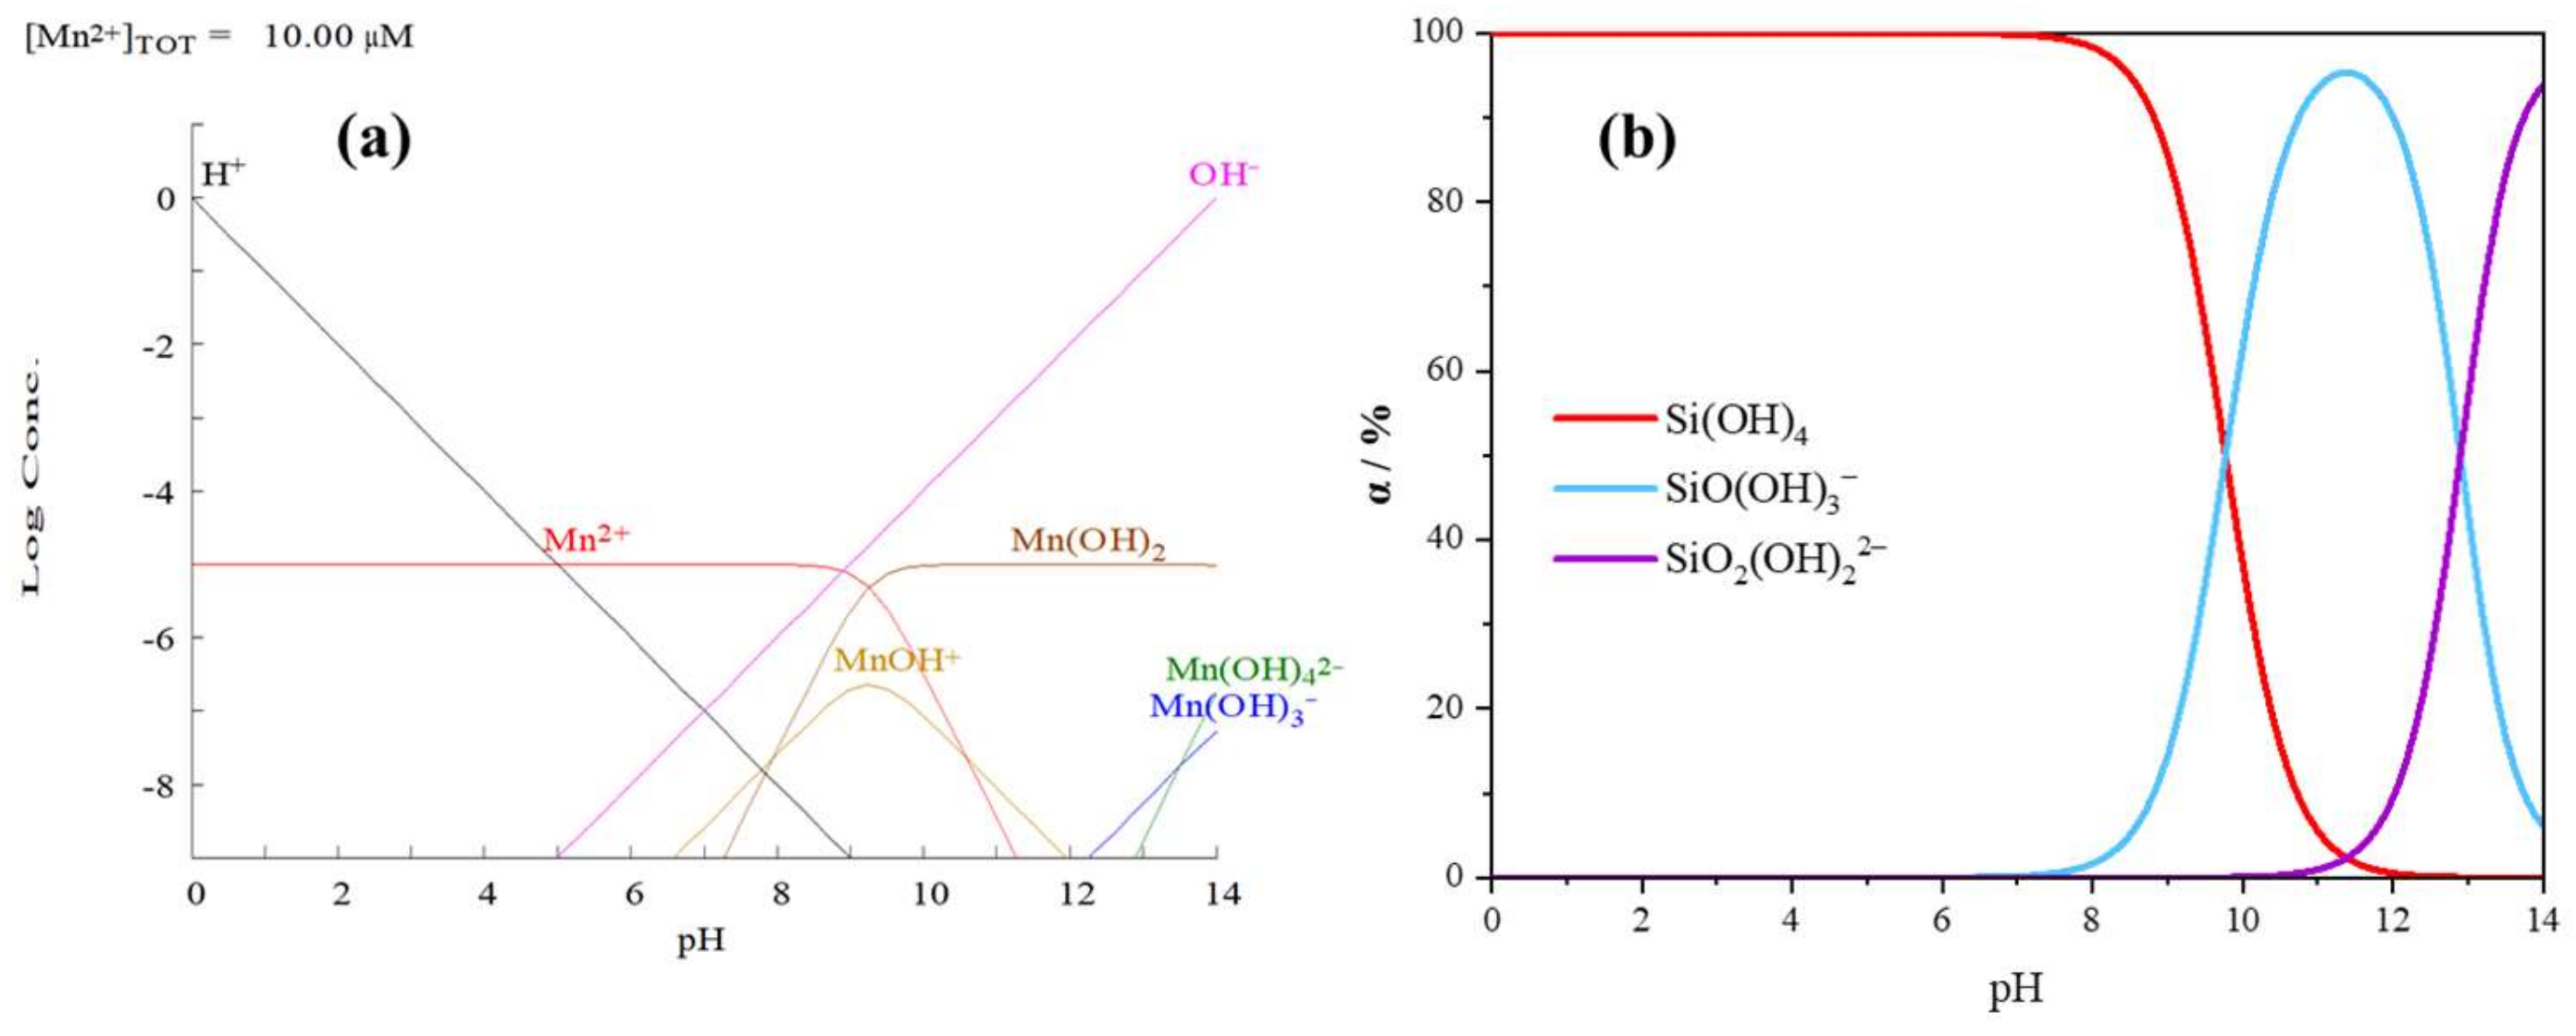
3.6. Solution Chemistry Calculation Analysis

The effect of pH on the species formation and content of Mn2+, silicates in the Mn2+, and the silicate solution system is indicated in Figure 12. Based on Figure 12, the main chemical equations for the chemical equilibrium of Mn2+ and the silicate in a solution can be deduced as follows:
MnCl 2 Mn 2 + + 2 Cl ,
Mn 2 + + OH MnOH + ,
Mn 2 + + 2 OH MnOH 2   ,
Mn 2 + + 3 OH Mn OH 3 ,
Mn 2 + + 4 OH Mn OH 4 2 ,
S i O 2 + 2 H 2 O S i 0 H 4 ,
S i OH 4 S i O OH 3 + H + ,
S i O OH 3 S i O 2 OH 2 2 + H + .
Figure 12a shows the gradual hydrolysis of Mn2+ in the solution and the generation of four manganese-containing components: MnOH+, Mn OH 2 , Mn OH 3 , and Mn OH 4 2 . When the pH < 9.29, Mn2+ dominates the composition. After increasing the pH, Mn OH 2 , Mn OH 4 2 , and Mn OH 3 dominate the system. Figure 12b shows that there are three main components in the Na2SiO3 solution. Si(OH)4 dominates when the pH < 9.6, and S i O OH 3 and S i O 2 OH 2 2 dominate when the pH < 12.8. When MnCl2 is added after Na2SiO3, the hydrolysis of Mn2+ consumes lots of OH. Consequently, the concentration of H+ in the solution increases and Equations (8) and (9) move in the opposite direction, leading to the production of more Si(OH)4. Si(OH)4 is the active component that inhibits calcite flotation since it selectively acts on calcite and interferes with the adsorption of NaOL on its surface, thus reducing the recovery during calcite flotation [23,27]. When MnCl2 is added before Na2SiO3, Mn2+ is pre-sorbed on the surface of both minerals, and when Na2SiO3 is subsequently added, the silicate hydrolysis products interact with the mineral surface through physical adsorption, resulting in both scheelite and calcite being inhibited from floating.
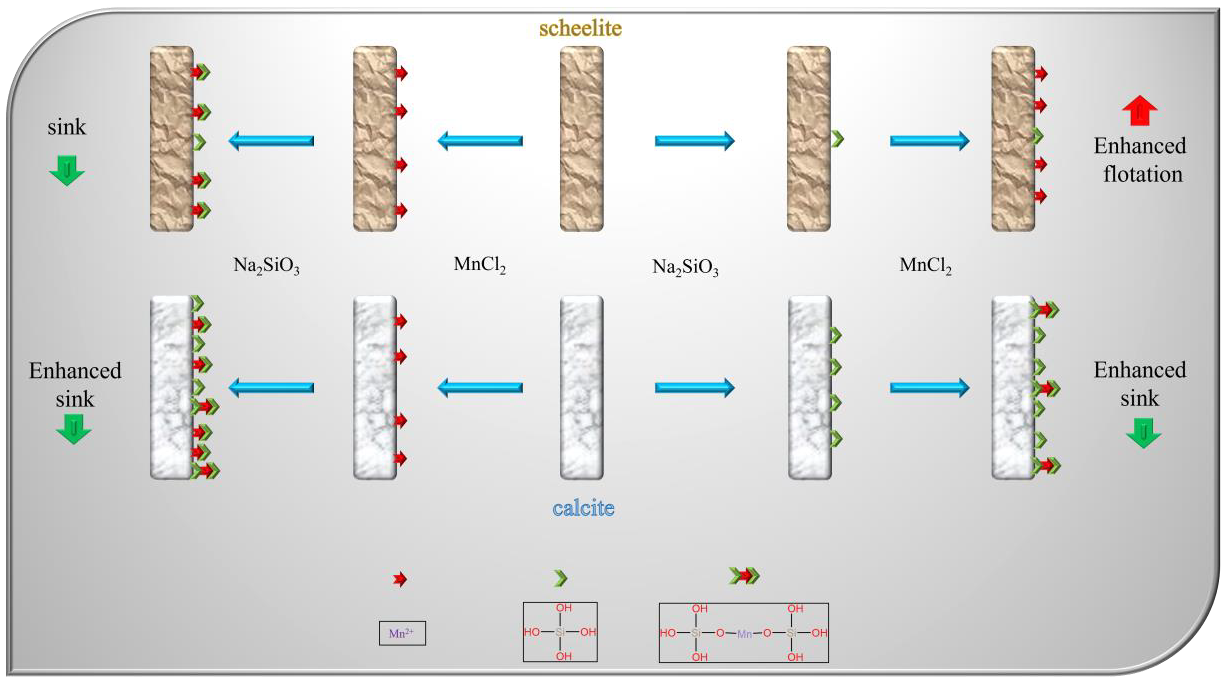
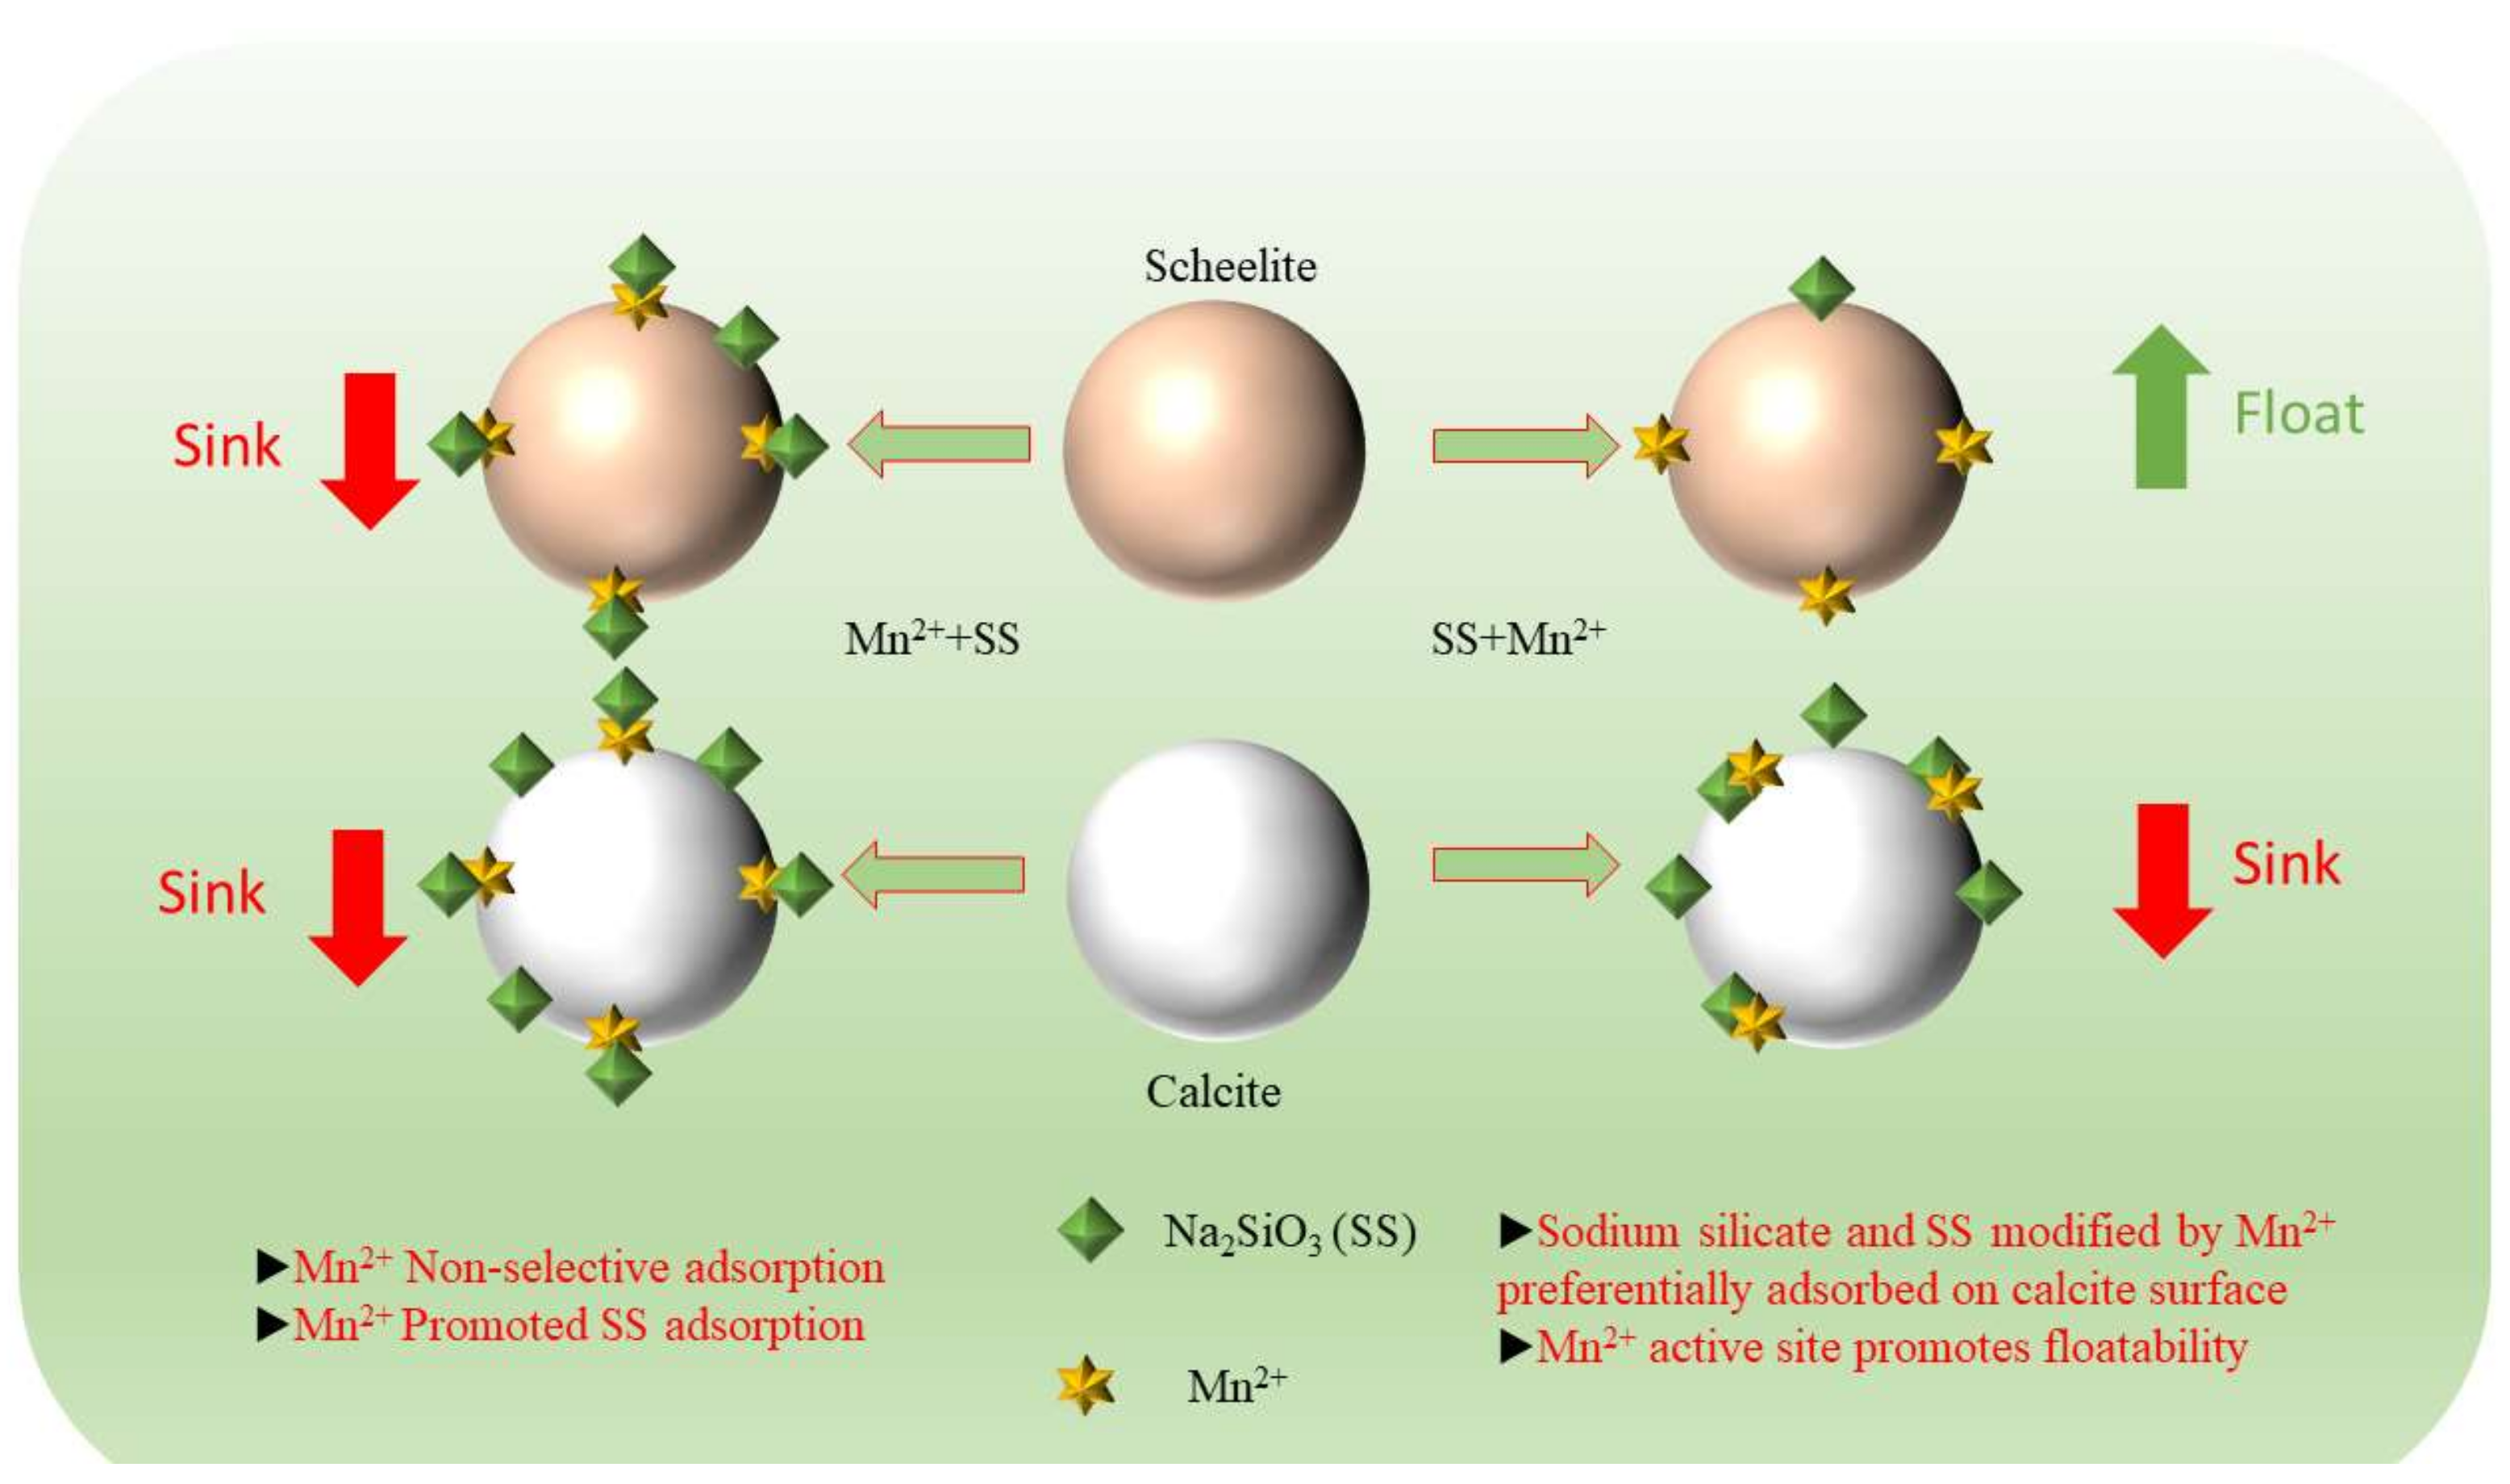
The mechanism of the interaction between two different addition points of MnCl2 and mineral surfaces is shown in Figure 13. Under the additional order of MnCl2 + Na2SiO3, Mn2+ will be adsorbed on both mineral surfaces due to its lack of selectivity, increasing the active sites on both minerals surfaces. This resulted in enhanced adsorption of sodium silicate on both minerals surfaces., which led to the enhancement of hydrophilicity on both minerals surfaces. This inhibited the minerals, and separation could not be achieved. In contrast, under the dosing sequence of Na2SiO3+ MnCl2, sodium silicate was added first, and Na2SiO3 selectively adsorbed on calcite surface, while it adsorbed less on scheelite. With the subsequential addition of MnCl2, Mn2+ reacted with the surface of scheelite and adsorbed on its surface, thus increasing the active site of NaOL on its surface. It also reacted with free sodium silicate in the pulp to form a more selective metal silicate; as a result, the inhibition effect on calcite was enhanced.

4. Conclusions

In this work, the separation efficiency of scheelite and calcite was studied under different dosing orders of MnCl2 and Na2SiO3. Through micro-flotation tests, it can be seen that different addition points of MnCl2 lead to different flotation results (I, MnCl2 + Na2SiO3 + NaOL; II, Na2SiO3 + MnCl2 + NaOL). The recovery of scheelite and calcite was lower in condition I. Furthermore, the suppression efficiency of the agent on calcite was clearly better than that on scheelite under the II condition, and a small activation effect on scheelite was also observed. The results of the zeta potential analysis show that the interaction of NaOL and the mineral surface results in a negative shift of the potential, and condition I led to a positive shift in the surface potential of scheelite compared to the effect of Na2SiO3 alone. On the other hand, in the II condition, the shift was in the negative direction. Combined with the analysis of UV-Vis results, under condition I, the effect of NaOL interaction with both scheelite and calcite showed a decreasing trend, while the adsorption of C18H33NaO2 was enhanced on scheelite and weakened on calcite under condition II. FTIR and XPS analyses show the adsorption of Mn on the surface of both minerals under the two different addition point conditions of MnCl2. By comparing the Si atom concentration, condition I was significantly higher than condition II, indicating that Na2SiO3 has a stronger effect with scheelite in condition I. This inhibits the flotation of scheelite and makes the separation process difficult. In contrast, the increase of C1s peak on the surface of scheelite and the increase of the C atom concentration under condition II indicates that the adsorption of NaOL on the scheelite surface was higher. The adsorption of Na2SiO3 on both minerals surfaces is promoted under condition I, leading to the inhibition of both minerals. In contrast, under condition II, the hydrophilic silicate and the generated metal silicate material dissolved in the slurry selectively adsorb on the calcite surface, increasing the calcite surface hydrophilicity. More Mn2+ and less Na2SiO3 adsorb with scheelite, providing Mn active sites for the adsorption of NaOL. Conclusively, the dosage sequence plays a significant role in the separation process of scheelite and calcite and provides a new research idea and effective method for the separation of scheelite and calcite.

Author Contributions

Conceptualization, K.L.; Data curation, Z.G.; Formal analysis, Z.G.; Funding acquisition, Y.Z.; Investigation, Z.G., K.L., H.Y. and X.L.; Methodology, Z.G.; Project administration, Y.Z.; Resources, H.Y.; Software, Z.G.; Supervision, K.L.; Validation, Z.G. and K.L.; Visualization, Z.G.; Writing—original draft, Z.G.; Writing—review & editing, Y.Z. All authors have read and agreed to the published version of the manuscript.

Funding

This study was financially supported by the National Natural Science Foundation of China (No. 52164022).

Informed Consent Statement

Not applicable.

Conflicts of Interest

The authors declare no conflict of interest.

References

  1. Han, Z.; Golev, A.; Edraki, M. A Review of Tungsten Resources and Potential Extraction from Mine Waste. Minerals 2021, 11, 701. [Google Scholar] [CrossRef]
  2. Kupka, N.; Rudolph, M. Froth flotation of scheelite—A review. Int. J. Min. Sci. Technol. 2018, 28, 373–384. [Google Scholar] [CrossRef]
  3. Yang, X. Beneficiation studies of tungsten ores—A review. Miner. Eng. 2018, 125, 111–119. [Google Scholar] [CrossRef]
  4. Dong, L.; Jiao, F.; Qin, W.; Zhu, H.; Jia, W. Activation effect of lead ions on scheelite flotation: Adsorption mechanism, AFM imaging and adsorption model. Separat. Purif. Technol. 2019, 209, 955–963. [Google Scholar] [CrossRef]
  5. Yao, W.; Li, M.; Zhang, M.; Cui, R.; Shi, J.; Ning, J. Decoupling the effects of solid and liquid phases in a Pb-water glass mixture on the selective flotation separation of scheelite from calcite. Miner. Eng. 2020, 154, 106423. [Google Scholar] [CrossRef]
  6. Abdalla, M.A.; Peng, H.; Younus, H.A.; Wu, D.; Abusin, L.; Shao, H. Effect of synthesized mustard soap on the scheelite surface during flotation. Colloids Surf. A Physicochem. Eng. Asp. 2018, 548, 108–116. [Google Scholar] [CrossRef]
  7. Wang, J.; Bai, J.; Yin, W.; Liang, X. Flotation separation of scheelite from calcite using carboxyl methyl cellulose as depressant. Miner. Eng. 2018, 127, 329–333. [Google Scholar] [CrossRef]
  8. Chen, W.; Feng, Q.; Zhang, G.; Yang, Q. Investigations on flotation separation of scheelite from calcite by using a novel depressant: Sodium phytate. Miner. Eng. 2018, 126, 116–122. [Google Scholar] [CrossRef]
  9. Jiao, F.; Dong, L.; Qin, W.; Liu, W.; Hu, C. Flotation separation of scheelite from calcite using pectin as depressant. Miner. Eng. 2019, 136, 120–128. [Google Scholar] [CrossRef]
  10. Kang, J.; Hu, Y.; Sun, W.; Liu, R.; Yin, Z.; Tang, H.; Meng, X.; Zhang, Q.; Liu, H. A significant improvement of scheelite flotation efficiency with etidronic acid. J. Clean. Prod. 2018, 180, 858–865. [Google Scholar] [CrossRef]
  11. Zhao, C.; Sun, C.; Yin, W.; Luo, B. An investigation of the mechanism of using iron chelate as a collector during scheelite flotation. Miner. Eng. 2019, 131, 146–153. [Google Scholar] [CrossRef]
  12. Huang, Z.; Kuang, J.; Yuan, W.; Yu, M.; Wang, X. Regulation mechanism of ultrasonication on surface hydrophobicity of scheelite. Colloids Surf. A Physicochem. Eng. Asp. 2021, 629, 127412. [Google Scholar] [CrossRef]
  13. Dong, L.; Jiao, F.; Qin, W.; Liu, W. Selective flotation of scheelite from calcite using xanthan gum as depressant. Miner. Eng. 2019, 138, 14–23. [Google Scholar] [CrossRef]
  14. Dong, L.; Jiao, F.; Qin, W.; Zhu, H.; Jia, W. Effect of acidified water glass on the flotation separation of scheelite from calcite using mixed cationic/anionic collectors. Appl. Surf. Sci. 2018, 444, 747–756. [Google Scholar] [CrossRef]
  15. Wang, X.; Jia, W.; Yang, C.; He, R.; Jiao, F.; Qin, W.; Cui, Y.; Zhang, Z.; Li, W.; Song, H. Innovative application of sodium tripolyphosphate for the flotation separation of scheelite from calcite. Miner. Eng. 2021, 170, 106981. [Google Scholar] [CrossRef]
  16. Yin, W.Z.; Wang, J.Z.; Sun, Z.M. Structure–activity relationship and mechanisms of reagents used in scheelite flotation. Rare Met. 2015, 34, 882–887. [Google Scholar] [CrossRef]
  17. Wang, J.; Gao, Z.; Han, H.; Sun, W.; Gao, Y.; Ren, S. Impact of NaOL as an accelerator on the selective separation of scheelite from fluorite using a novel self-assembled Pb-BHA-NaOL collector system. Appl. Surf. Sci. 2021, 537, 147778. [Google Scholar] [CrossRef]
  18. Wang, R.; Wei, Z.; Han, H.; Sun, W.; Hu, Y.; Wang, J.; Wang, L.; Liu, H.; Yang, Y.; Zhang, C. Fluorite particles as a novel calcite recovery depressant in scheelite flotation using Pb-BHA complexes as collectors. Miner. Eng. 2019, 132, 84–91. [Google Scholar] [CrossRef]
  19. Gao, Z.; Jiang, Z.; Sun, W.; Gao, Y. Typical roles of metal ions in mineral flotation: A review. Trans. Nonferr. Met. Soc. China 2021, 31, 2081–2101. [Google Scholar] [CrossRef]
  20. Wei, Z.; Hu, Y.; Han, H.; Sun, W.; Wang, R.; Wang, J. Selective flotation of scheelite from calcite using Al-Na2SiO3 polymer as depressant and Pb-BHA complexes as collector. Miner. Eng. 2018, 120, 29–34. [Google Scholar] [CrossRef]
  21. Fu, J.; Han, H.; Wei, Z.; Liu, R.; Li, W.; Xu, T.; Ji, D. Selective separation of scheelite from calcite using tartaric acid and Pb-BHA complexes. Colloids Surf. A Physicochem. Eng. Asp. 2021, 622, 126657. [Google Scholar] [CrossRef]
  22. Han, H.; Xiao, Y.; Hu, Y.; Sun, W.; Nguyen, A.V.; Tang, H.; Gui, X.; Xing, Y.; Wei, Z.; Wang, J. Replacing Petrov’s process with atmospheric flotation using Pb-BHA complexes for separating scheelite from fluorite. Miner. Eng. 2020, 145, 106053. [Google Scholar] [CrossRef]
  23. Sun, R.; Liu, D.; Liu, Y.; Wang, D.; Wen, S. Pb-water glass as a depressant in the flotation separation of fluorite from calcite. Colloids Surf. Physicochem. Eng. Asp. 2021, 629, 127447. [Google Scholar] [CrossRef]
  24. Yao, W.; Li, M.; Zhang, M.; Cui, R.; Shi, J.; Ning, J. Effect of Zn2+ and its addition sequence on flotation separation of scheelite from calcite using water glass. Colloids Surf. Physicochem. Eng. Asp. 2020, 588, 124394. [Google Scholar] [CrossRef]
  25. Han, H.; Hu, Y.; Sun, W.; Li, X.; Cao, C.; Liu, R.; Yue, T.; Meng, X.; Guo, Y.; Wang, J. Fatty acid flotation versus BHA flotation of tungsten minerals and their performance in flotation practice. Int. J. Miner. Process. 2017, 159, 22–29. [Google Scholar] [CrossRef]
  26. Wonyen, D.; Kromah, V.; Gibson, B.; Nah, S.; Chelgani, S. A Review of Flotation Separation of Mg Carbonates (Dolomite and Magnesite). Minerals 2018, 8, 354. [Google Scholar] [CrossRef] [Green Version]
  27. Faramarzpour, A.; Yazdi, M.R.S.; Mohammadi, B.; Chelgani, S.C. Calcite in froth flotation—A review. J. Mater. Res. Technol. 2022, 19, 1231–1241. [Google Scholar] [CrossRef]
  28. Dhar, P.; Thornhill, M.; Kota, H.R. An Overview of Calcite Recovery by Flotation. Mater. Circ. Econ. 2020, 2, 9. [Google Scholar] [CrossRef]
  29. Hind, A.R.; Bhargava, S.K.; McKinnon, A. At the solid/liquid interface: FTIR/ATR—The tool of choice. Adv. Colloid Interf. Sci. 2001, 93, 91–114. [Google Scholar] [CrossRef]
  30. Espiritu, E.R.L.; Naseri, S.; Waters, K.E. Surface chemistry and flotation behavior of dolomite, monazite and bastnäsite in the presence of benzohydroxamate, sodium oleate and phosphoric acid ester collectors. Colloids Surf. A Physicochem. Eng. Asp. 2018, 546, 254–265. [Google Scholar] [CrossRef]
  31. Zhong, C.; Wang, H.; Feng, B.; Zhang, L.; Chen, Y.; Gao, Z. Flotation separation of scheelite and apatite by polysaccharide depressant xanthan gum. Miner. Eng. 2021, 170, 107045. [Google Scholar] [CrossRef]
Figure 1. XRD patterns of pure minerals.
Materials 15 04699 g001
Figure 2. Flow chart for pure mineral flotation.
Materials 15 04699 g002
Figure 3. Effect of Na2SiO3 on the flotation recoveries of minerals as a function of the solution pH value (a) and Na2SiO3 dosage (b).
Materials 15 04699 g003
Figure 4. Effect of MnCl2 on mineral FR under the addition sequence of MnCl2+ Na2SiO3. (a) MnCl2 dosage; (b) pH.
Materials 15 04699 g004
Figure 5. Effect of MnCl2 on mineral FR under the addition sequence of Na2SiO3+ MnCl2. (a) MnCl2 dosage; (b) pH.
Materials 15 04699 g005
Figure 6. Effect of different agent regimes on the surface potential of two minerals. (a) Scheelite; (b) calcite.
Materials 15 04699 g006
Figure 7. Effects of different agent concentrations and dosing sequences on the adsorption of sodium oleate on the surface of two minerals. (a) Na2SiO3; (b) MnCl2 + Na2SiO3; (c) Na2SiO3 + MnCl2.
Materials 15 04699 g007
Figure 8. Infrared spectra of mineral surfaces before and after the action of different agents. (a) Scheelite; (b) calcite.
Materials 15 04699 g008
Figure 9. XPS survey scan and atomic concentrations of scheelite under different dosing sequences. (a) XPS total spectrum; (b) atomic concentration.
Materials 15 04699 g009
Figure 10. XPS survey scan and atomic concentrations of calcite under different dosing sequences. (a) XPS total spectrum; (b) atomic concentration.
Materials 15 04699 g010
Figure 11. High-resolution XPS spectra of Ca2p for two minerals under different dosing sequences. (a) Scheelite; (b) calcite.
Materials 15 04699 g011
Figure 12. Effect of the solution’s pH value on the species distribution diagram of (a) monomer Mn2+ (C = 5 × 10⁻⁴ mol/L) and (b) silicate anions.
Materials 15 04699 g012
Figure 13. Mechanism of interaction on the surface of scheelite and calcite under different addition sequences of MnCl2.
Materials 15 04699 g013
Publisher’s Note: MDPI stays neutral with regard to jurisdictional claims in published maps and institutional affiliations.

