Article

A Study of the Effects of Hf and Sn on the Microstructure, Hardness and Oxidation of Nb-18Si Silicide-Based Alloys-RM(Nb)ICs with Ti Addition and Comparison with Refractory Complex Concentrated Alloys (RCCAs)

by
Eleftherios Zacharis
,
Claire Utton
and
Panos Tsakiropoulos
*
Department of Materials Science and Engineering, Sir Robert Hadfield Building, The University of Sheffield, Mappin Street, Sheffield S1 3JD, UK
*
Author to whom correspondence should be addressed.
Materials 2022, 15(13), 4596; https://doi.org/10.3390/ma15134596
Submission received: 23 May 2022 / Revised: 9 June 2022 / Accepted: 15 June 2022 / Published: 30 June 2022
(This article belongs to the Special Issue Feature Papers in "Metals and Alloys" Section)

Abstract

:
In this paper, we present a systematic study of the as-cast and heat-treated microstructures of three refractory metal intermetallic composites based on Nb (i.e., RM(Nb)ICs), namely the alloys EZ2, EZ5, and EZ6, and one RM(Nb)IC/RCCA (refractory complex concentrated alloy), namely the alloy EZ8. We also examine the hardness and phases of these alloys. The nominal compositions (at.%) of the alloys were Nb-24Ti-18Si-5Hf-5Sn (EZ2), Nb-24Ti-18Si-5Al-5Hf-5Sn (EZ5), Nb-24Ti-18Si-5Cr-5Hf-5Sn (EZ6), and Nb-24Ti-18Si-5Al-5Cr-5Hf-5Sn (EZ8). All four alloys had density less than 7.3 g/cm3. The Nbss was stable in EZ2 and EZ6 and the C14-NbCr2 Laves phase in EZ6 and EZ8. In all four alloys, the A15-Nb3X (X = Al,Si,Sn) and the tetragonal and hexagonal Nb5Si3 were stable. Eutectics of Nbss + Nb5Si3 and Nbss + C14-NbCr2 formed in the cast alloys without and with Cr addition, respectively. In all four alloys, Nb3Si was not formed. In the heat-treated alloys EZ5 and EZ8, A15-Nb3X precipitated in the Nb5Si3 grains. The chemical compositions of Nbss + C14-NbCr2 eutectics and some Nb5Si3 silicides and lamellar microstructures corresponded to high-entropy or complex concentrated phases (compositionally complex phases). Microstructures and properties were considered from the perspective of the alloy design methodology NICE. The vol.% Nbss increased with increasing ΔχNbss. The hardness of the alloys respectively increased and decreased with increasing vol.% of A15-Nb3X and Nbss. The hardness of the A15-Nb3X increased with its parameter Δχ, and the hardness of the Nbss increased with its parameters δ and Δχ. The room-temperature-specific strength of the alloys was in the range 271.7 to 416.5 MPa cm3g−1. The effect of the synergy of Hf and Sn, or Hf and B, or Hf and Ge on the macrosegregation of solutes, microstructures, and properties of RM(Nb)ICs/RCCAs from this study and others is compared. Phase transformations involving compositionally complex phases are discussed.

1. Introduction

Metallic ultra-high-temperature materials (UHTMs) that are currently under development include refractory metal (RM) intermetallic composites (RMICs) based on Nb (i.e., RM(Nb)ICs), refractory metal high-entropy alloys (RHEAs), and refractory metal complex concentrated alloys (RCCAs) [1,2]. The RM(Nb)ICs are also known as Nb-silicide-based alloys, Nb in situ composites, or Nb in situ silicide composites [1,3], and some of them are also RHEAs or RCCAs, which below are referred to as RM(Nb)ICs/RHEAs or RM(Nb)ICs/RCCAs.
The RHEAs and RCCAs are a subset of high-entropy alloys (HEAs) [2,4,5], the development of which was motivated by [6,7], whereas the development of RM(Nb)ICs was stimulated by research on high-temperature intermetallics [1,8,9]. Currently, metallic UHTMs are being developed for structural engineering applications as potential replacements of Ni-based superalloys in advanced gas turbine engines and must meet specific property goals for fracture toughness, creep, and oxidation [1,3,7]. HEAs target a wider range of potential structural and functional applications [5,10].
A characteristic feature of metallic UHTMs is the fact that they share the same elements [3], which can be simple metal and metalloid elements, rare-earth (RE) elements, transition metals (TMs), and RMs. At least 23 elements and about 16 elements have been used to date, respectively, in RM(Nb)ICs [1,3] and in RHEAs or RCCAs [2], albeit not all in the same metallic UHTM. Chromium, Hf, Mo, Nb, Re, Ta, V, W, and Zr are used in RHEAS and RCCAs, which can also contain Al, Co, Ni, Si, Ti, C, or N [2]. The latter seven elements may form intermetallic phases that may increase the strength and hardness, may improve oxidation, and can decrease the density of RHEAs and RCCAs [2]. The addition of B, Fe, or Y in RCCAs has also been suggested [2].
Currently, Sn is used only in RM(Nb)ICs and RM(Nb)ICs/RCCAs or RM(Nb)ICs/RHEAs [1,3], in which (a) Al, Cr, Hf, Si, Sn, and Ti can significantly improve the oxidation resistance in the range of pest oxidation temperatures and at high temperatures [1,3,11]; (b) Hf, Nb, Si, and Ti are crucial for low- and high-temperature strength and creep properties (note that there is currently only data for the creep of RM(Nb)ICs and RM(Nb)ICs/RCCAs [1,3]); (c) Al, Cr, Hf, Si, and Ti are key for fracture toughness, whereas (d) Al, Hf, Si, Sn, and Ti are key for control of the vol.% of bcc solid solution(s); (e) Al, Cr, Si, Sn, and Ti are key for the vol.% of A15-Nb3X compounds or C14-NbCr2 Laves phase; and (f) Hf and Ti are key for the type of solid solution that can form [1,3]. In other words, Al, Cr, Hf, Si, Sn, and Ti are key to meeting all three property goals or a balance of properties (together with other alloying additions) [1,3,11].
RM(Nb)ICs and RM(Nb)ICs/RCCAs or RM(Nb)ICs/RHEAs are multiphase alloys, and their microstructures usually consist of bcc solid solution(s) and silicides (M3Si, M5Si3, where M = TM and/or RM) [12]; C14 Laves phase and A15 compounds can also be present [13], in addition to other intermetallics [14,15]. Aluminium, Cr, Hf, Si, Sn, and Ti are found in the chemical composition of all aforementioned phases. Microstructure and properties of RM(Nb)ICs containing these elements have been studied by different groups [16,17,18,19,20,21,22,23,24,25,26,27,28,29,30,31,32,33]. With the exception of one systematic study on the effect of the concentration of Sn (2 to 8 at.%) on the microstructure of as-cast and heat-treated (1200 °C/120 h) MASC-based Nb-25Ti-16Si-8Hf-2Al-2Cr-xSn alloys and their oxidation [16], all other studies and patents have been of Sn-free alloys (e.g., [17,18,19,20]), Hf-free alloys (e.g., [21,22,23]), Al-, Cr-, and Sn-free alloys (e.g., [24,25]), Ti-free alloys [26], or alloys where the elements Al, Cr, Hf, Si, Sn and Ti were in synergy with other TMs or RMs or REs (e.g., [27,28,29,30,31]). (MASC is the RM(Nb)IC Nb-25Ti-16Si-8Hf-2Al-2Cr developed by General Electric [32].)
Aluminium, Cr, Hf, Sn, and Ti partition to the Nb5Si3 and the bcc Nbss, where their concentrations increase with increasing Ti content (e.g., Figure 20 in [3] and Figure 1 in [34] for Nb5Si3, and Figure 19 in [3] for the Nbss). Aluminium, Hf, Si, and Ti partition to the C14-NbCr2 Laves phase, where the concentrations of Al and Si respectively decrease and increase with increasing Cr concentration (e.g., Figure 21 in [3]); Ti and Hf substitute Nb; and Al, Cr, Hf, Si, Sn, and Ti partition to the A15-Nb3X (X = Al,Si,Sn). Thus, two factors make the characterization of microstructures difficult and can mislead phase identification: (a) the chemical inhomogeneity of alloy microstructures, which increases when Al, Cr, Si, and Ti are in synergy with Sn in the absence of Hf [22,23], or with Hf in the absence of Sn [20], or when Al, Cr, Hf, Si, and Sn are in synergy in the absence of Ti [26]; and (b) the similar backscattered electron (BSE) contrast between (i) Nbss and A15-Nb3X, and (ii) the A15-Nb3X and Hf-rich Nb5Si3 (e.g., see [26]). Furthermore, the chemical inhomogeneity can be important vis-à-vis the contamination of RM(Nb)ICs with interstitials [20,22,23]. The contamination of the aforementioned phases with interstitials differs (for example, it is more severe for Nbss than Nb5Si3) and depends on their chemical composition (e.g., [20,22,23,31]).
The partitioning of solutes changes the creep properties of the aforementioned phases [11,34]. The steady-state creep rate of RM(Nb)ICs increases with increasing Al or Ti concentration and decreases with increasing Si content in the alloy (Figure 22 in [3]). The synergy of Hf, Nb, and Ti in RM(Nb)ICs is important (i) for their creep properties (for example, the creep deteriorates as the alloy ratio (Nb/Ti+Hf) decreases [12,32,33]); and (ii) for the structure of Nb5Si3, the likelihood of which being hexagonal increases as the [Nb/(T i+ Hf)]Nb5Si3 decreases below one [24].
Even though the importance of the addition of Hf, Sn, or Ti for the properties of RM(Nb)ICs is documented in the literature [32], our understanding of how these three elements “work together” with Al, Cr, and Si is poor, because researchers use all or some of the six elements with other alloying additions in the same alloy. To sort out this problem, our research group did a systematic study of the effect of the synergy of Al, Cr, Hf, Si, Sn, or Ti in the absence of other simple metal and metalloid elements, TMs, RMs, and REs on the microstructure and properties of Nb-24Ti-18Si-based RM(Nb)ICs for alloys without (i) Hf and Sn [21], (ii) Ti [26] and Ti and Sn [25], (iii) Hf [22,23], and (iv) Al, Cr, and Sn [25].
The motivation for the research presented in this paper was to do a systematic study to understand how Hf, Sn, and Ti work in synergy with Al and/or Cr in the microstructure of Nb-24Ti-18Si-based RM(Nb)ICs by expanding our earlier research on Ti-free alloys [26], and to subsequently compare the synergy of Sn or Ge or B with Al, Cr, Hf, Si, and Ti in equivalent RM(Nb)ICs/RCCAs without other alloying addition(s). Four alloys were chosen for this systematic study. Their nominal compositions (at.%) were as follows: Nb-24Ti-18Si-5Hf-5Sn (alloy EZ2), Nb-24Ti-18Si-5Al-5Hf-5Sn (EZ5), Nb-24Ti-18Si-5Cr-5Hf-5Sn (EZ6), and Nb-24Ti-18Si-5Al-5Cr-5Hf-5Sn (EZ8).
The structure of the paper is as follows. After the experimental details, in the results section, the microstructure of each alloy in the as-cast and heat-treated condition is described separately to show how complicated some microstructures can be, and data is given for densities, alloy hardness, and the hardness of phases, as well as the lattice parameter of the solid solution. The discussion covers macrosegregation, then each phase separately, namely Nbss, Nb5Si3, A15-Nb3X, C14-NbCr2 Laves, Nbss + Nb5Si3 eutectics, Nbss + C14-NbCr2 eutectics, and other lamellar microstructures, then the vol.% of Nbss and the hardness of alloys and phases, and the specific strength of alloys. Then, we examine properties from the perspective of the alloy design methodology NICE [1,3,11,12]. Finally, the RM(Nb)IC/RCCA alloy EZ8 is compared with the equivalent RM(Nb)ICs/RCCAs alloys ZF9 [35] and TT7 [36], with Ge or B, respectively, in their chemical composition instead of Sn.

2. Experimental

The alloys were prepared as large button/ingots of approximately 0.6 kg weight using elements of purity better than 99.99 wt.% and arc melting with a non-consumable tungsten electrode and water-cooled copper crucible in an argon atmosphere. Cubic specimens (2 × 2 × 2 cm3) from the bulk of the ingot of each alloy were used for the heat treatments. The cubic specimens were wrapped in Ta foil and placed in a LENTON 1850 high-temperature tube furnace under a constant flow of Ti-gettered argon (10−5 m3·s−1). The microstructures were characterized using X-ray diffraction (XRD) and electron probe microanalysis (EPMA). For the XRD, a Siemens D5000 diffractometer with Cu radiation was used, and X-rays were collected with a step of 0.02 degrees over 2θ range 20 to 90 degrees. Phases were identified using the JCPDS data. The lattice parameter of the Nbss was determined using the Nelson–Riley function [37]. BSE imaging and quantitative analysis were done in a JEOL 8600 EPMA equipped with energy-dispersive (EDS) and wavelength-dispersive (WDS) spectrometers. Standards of high-purity elements of Nb, Ti, Si, Cr, Al, Hf, and Sn, which had been polished to a finish of 1 µm, were used. The Vickers hardness (HV) of all the alloys in the as-cast and the heat-treated conditions was measured using a CV-430 AAT automatic hardness testing machine with a load of 10 kg (HV10) that was applied for 20 s. At least 10 measurements were taken for each alloy. The hardness of phases in the alloys were measured using a Mitutoyo microhardness testing machine with a load of 0.1 kg that was applied for 20 s. At least 10 measurements were taken for each phase. A Sartorius Masterpro Series electronic analytical balance, along with a Sartorius YDK density determination kit, was used to calculate the density of the alloys. The Archimedean principle was applied for measuring the density of the alloys.

3. Results

Data for the densities and hardness of the alloys and the % area of phases in the alloy micro-structures are given in Table 1, which lists the average value, the standard deviation, and the minimum and maximum density and hardness values. The macrosegregation of alloying additions in the cast alloys is given in Table 2. The phases in the microstructures of the as-cast (AC) and heat-treated (HT) alloys are summarized in Table 3. The chemical compositions of different parts of the AC alloys, of the bulk of the HT alloys, and of the phases in all parts of the alloys are given in Tables S1–S4 in the Supplemental Data, which summarize the EPMA data for the whole ingot for the phases that were confirmed using XRD and EPMA. Bottom of the ingot refers to the part of the ingot that was close to the water-cooled Cu crucible during arc melting. These tables give the average value, the standard deviation, and the minimum and maximum analysis values. The XRD data of the alloys for the AC and HT conditions are given in Figures S1–S4 in the Supplemental Data.

3.1. As-Cast EZ2

The actual alloy composition (at.%) was 46Nb-24.1Ti-19.6Si-5.3Hf-5Sn. Compared with the nominal composition, the EZ2-AC was richer in Si. There was macrosegregation of Si and Ti (Table 2). The microstructure consisted of Nbss, Nb5Si3, and A15-Nb3X (X = Si, Sn) phases (Table 3, Figure 1 and Figure S1 in the Supplemental Data). No hafnia particles were observed. There was eutectic of the Nbss and Nb5Si3 (Figure 1) and Ti-rich Nbss and Hf-rich Nb5Si3 (Table 3 and Table S1 in the Supplemental Data). Note that the latter was also rich in Ti. Eutectic was observed in-between or around faceted Nb5Si3 grains (Figure 1). The Ti-rich Nbss exhibited darker contrast under BSE imaging, had Nb/Ti < 1, and was also richer in Hf and Sn compared with the “normal” Nbss (Table S1 in the Supplemental Data). The Hf-rich Nb5Si3 exhibited a brighter contrast than the Nb5Si3. This can be seen in the Figure 1a, where the darker contrast “core” of the silicide grains had average Ti/Hf = 4.3, compared with 2.8 for the surrounding grey contrast Hf-rich (and Ti-rich) Nb5Si3. The Nb/(Ti + Hf) ratios for the dark and grey contrast areas of the silicide were 1.8 and 1.97, respectively. According to the XRD data (Figure S1 in the Supplemental Data), both αNb5Si3 and βNb5Si3 were present. Considering the analyses in all parts of the ingot and the Nb/(Ti + Hf) ratios of the Nb5Si3 and the Hf-rich Nb5Si3 (which were 2.3 and 1.6, respectively), the data would suggest that there was no hexagonal Nb5Si3 in the microstructure, in agreement with the XRD data. The A15-Nb3X was confirmed only in the bottom of the ingot using EPMA. It exhibited brighter contrast than the Nbss (Figure 1c). The microstructure in the bottom of the ingot was similar to that shown in Figure 1b.
The microstructure in the top and bulk of the ingot was the same and comprised of Nbss and Nb5Si3. In some areas of the bulk, the microstructure in the vicinity of blocky faceted Nb5Si3 was different from that shown in Figure 1. This microstructure, which is shown in Figure 2, was observed near Nbss + Nb5Si3 eutectic (see 5 in Figure 2b) and consisted of a lamellar microstructure, which either (i) grew into a blocky faceted Nb5Si3 grain (see the left-hand side of number 17 in Figure 2b) or (ii) connected adjacent Nb5Si3 grains (indicated with the numbers 1, 2, 3, and 4 in Figure 2a). The average composition (at.%) of the lamellar microstructure was 28.9Nb-38.9Ti-17.2Si-8.5Hf-6.5Sn, that is, a complex concentrated or compositionally complex (CC) lamellar microstructure [11], with Si + Sn, Si/Sn, Ti/Hf, Ti + Hf and Nb/(Ti + Hf) of about 23.7 at.%, 2.65, 4.6, 47.4 at.%, and 0.6, respectively.
The average composition of the eutectic seen adjacent to the lamellar microstructure (e.g., see 5 in Figure 2b) was 44.1Nb-26.2Ti-18.1Si-5.7Hf-5.9Sn (at.%) and had Si+Sn, Si/Sn, Ti/Hf, Ti+Hf, and Nb/(Ti+Hf) of about 24.1 at.%, 3.1, 4.6, 31.9 at.%, and 1.4, respectively. The average composition of the eutectic surrounding the faceted Nb5Si3 grains (Figure 1b) was 49.8Nb-22.9Ti-16.9Si-4.8Hf-5.6Sn (at.%) with Si+Sn, Si/Sn, Ti/Hf, Ti+Hf, and Nb/(Ti + Hf) of about 22.5 at.%, 3.1, 4.8, 27.7 at.%, and 1.8, respectively. The average composition of the Nbss+Nb5Si3 eutectic in the ingot (e.g., see Figure 1c) was 46.8Nb-26.5Ti-15.5Si-5.5Hf-5.7Sn (at.%) with Si+Sn, Si/Sn, Ti/Hf, Ti + Hf, and Nb/(Ti + Hf) of about 21.2 at.%, 2.7, 4.8, 32 at.%, and 1.5, respectively. In other words, the lamellar microstructure shown in Figure 2 had significantly different Ti + Hf sum and Nb/(Ti + Hf) ratio compared with the eutectic in EZ2-AC.
The Nb5Si3 grains in between the lamellar microstructure (e.g., 6 and 7 in Figure 2a) were rich in Hf and Ti, with average composition 30.5Nb-22.4Ti-36.2Si-8.7Hf-2.2Sn (at.%) and Si+Sn, Si/Sn, Ti/Hf, Ti + Hf, and Nb/(Ti + Hf) of about 38.4 at.%, 16.5, 2.6, 31.1 at.%, and 1, respectively, which corresponds to a complex concentrated or compositionally complex (CC) [11] tetragonal Nb5Si3 based on the Nb/(Ti + Hf) ratio. The blocky faceted Nb5Si3 grains near the lamellar microstructure (e.g., 9 in Figure 2a and 8 in Figure 2b) had average composition 43.75Nb-13.5Ti-36.3Si-4.85Hf-1.6Sn (at.%) with Si+Sn, Si/Sn, Ti/Hf, Ti + Hf, and Nb/(Ti + Hf) about 37.9 at.%, 22.7, 2.8, 18.4 at.%, and 2.4, respectively, which (i) is consistent with tetragonal Nb5Si3 in accordance with its Nb/(Ti + Hf) ratio and (ii) was not significantly different from the average composition of Nb5Si3 in the whole of the ingot (see Table S1 in Supplemental Data). Hexagonal Nb5Si3 was not confirmed by XRD. In other words, the Hf (and Ti)-rich Nb5Si3 that was connected (associated) with the lamellar microstructure (or the Hf (and Ti)-rich Nb5Si3 from which the lamellar microstructure formed) was CC tetragonal Nb5Si3 that had higher Ti + Hf sum and lower Nb/(Ti + Hf) ratio than the blocky Nb5Si3.
The solid solution away from the lamellar microstructure (e.g., 10, 13, 14, and 16 in Figure 2b) had average composition 53Nb-31.9Ti-2.65Si-4.45Hf-8Sn (at.%), not significantly different from the average composition of Nbss in the whole of the ingot (see Table S1 in the Supplemental Data), and it had Si+Sn, Si/Sn, Ti/Hf, Ti + Hf, and Nb/(Ti + Hf) of about 10.65 at.%, 0.33, 7.2, 36.35 at.%, and 1.46, respectively. The Nbss close to the lamellar microstructure (e.g., 11, 12, 15, 17, and 18 in Figure 2) had average composition 43.2Nb-39.9Ti-2.4Si-5.7Hf-8.8Sn (at.%), which was different from the average composition of the Ti-rich Nbss in the whole of the ingot (see Table S1 in the Supplemental Data), and it had Si+Sn, Si/Sn, Ti/Hf, Ti + Hf, and Nb/(Ti + Hf) of about 11.2 at.%, 0.27, 7, 45.6 at.%, and 0.95, respectively. In other words, the Nbss associated with the lamellar microstructure had higher Ti + Hf sum and lower Nb/(Ti + Hf) ratio compared with the Nbss away from it.
The microstructure near the bottom of the ingot (Figure 1c) consisted of three phases, namely the Nbss, A15-Nb3X, and Nb5Si3. There was no Ti-rich Nbss, only Hf (and Ti)-rich Nb5Si3. The Nb5Si3 and Hf-rich Nb5Si3 had Nb/(Ti + Hf) of, respectively, 2.4 and 1.5, which would suggest tetragonal Nb5Si3. The Si+Sn sum and the Si/Sn ratios of the Nbss and A15-Nb3X were 10 at.% and 0.3, and 18.9 at.% and 0.4, respectively.

3.2. Heat-Treated EZ2 (1500 °C/100 h)

The XRD (Figure S1 in the Supplemental Data) and EPMA (Table S1 in the Supplemental Data) indicated Nbss, A15-Nb3X, and Nb5Si3 in the microstructure. Hf (and Ti)-rich Nb5Si3 was also present. The typical microstructure is shown in Figure 1d. The Si+Sn concentration of the Nbss was 6.6 at.%, compared with 10.3 at.% in EZ2-AC, with the concentrations of Si and Sn about 1.1 at.% and 2.6 at.% lower, but the Si/Sn ratio was the same (0.3). The A15-Nb3X had Si + Sn and Si/Sn of, respectively, 18.7 at.% and 0.3, and the Sn concentration had increased by about 1 at.%. The Nb/(Ti + Hf) ratios for the Nb5Si3 and the Hf-rich Nb5Si3 were, respectively, 2.1 and 0.7; the latter value would suggest hexagonal Nb5Si3 (see Figure S1 in the Supplemental Data).

3.3. As-Cast EZ5

The actual composition (at.%) of the alloy was 42.1Nb-23.9Ti-19.3Si-4.7Al-5.1Hf-4.9Sn. Compared with the nominal composition, the EZ5-AC was richer in Si. There was stronger macrosegregation of Si than Ti in the ingot (Table 2). Study of the microstructure was difficult owing to the partitioning of Hf and the presence of the A15-Nb3X (X = Al,Si,Sn), the contrast of which was similar to that of the Nbss (Figure 3). According to the XRD data (Figure S2 in the Supplemental Data), the phases in EZ5-AC were αNb5Si3, βNb5Si3, γNb5Si3, Nbss, and Nb3Sn. There was Ti- and Hf-rich Nb5Si3 (Table 3 and Table S2 in the Supplemental Data). The Nb/(Ti + Hf) ratio of the Hf-rich Nb5Si3 would suggest the presence of γNb5Si3, in agreement with the XRD results.
Table S2 in the Supplemental Data gives the compositions of the phases that were confirmed using XRD and EPMA, namely the Nb5Si3, Nbss, and A15-Nb3X (Table 3, Figure 3 and Figure S2 in the Supplemental Data). The latter was not observed in all parts of the ingot. The former two formed a eutectic consisting of the Nbss and Ti- and Hf-rich Nb5Si3 (Figure 3). This eutectic was not observed in all parts of the ingot. No HfO2 was observed in EZ5-AC. The Ti- and Hf-rich Nb5Si3 exhibited a brighter contrast than the Nb5Si3. This can be seen in Figure 3a (see areas indicated with the numbers 1 to 7), in Figure 3b (numbers 1 to 3), in Figure 3d (numbers 1 to 3), and in Figure 3e (numbers 1 and 2). The Ti- and Hf-rich Nb5Si3 in these areas had average Hf+Sn and Ti/(Hf+Sn) of, respectively, about 9.8 at.% and 2.3, compared with 6.2 at.% and 2.8 for the “normal” Nb5Si3.
The microstructure in the top of the ingot consisted of large Nb5Si3 grains surrounded by Nbss (Figure 3a), but A15-Nb3X was not observed. The Hf-rich areas of Nb5Si3 grains exhibited different contrasts of grey (see 1 to 7 in Figure 3a). The Nbss had Si/(Sn+Al) of about 0.2. In both the Nb5Si3 and the Hf-rich Nb5Si3, the Si + Sn + Al concentration was about 37.8 at.%. In the latter, the Nb/(Ti + Hf) ratio was 1.4, indicative of tetragonal Nb5Si3.
The microstructure in the bulk of the ingot was different than that in the top and consisted of Nb5Si3, Ti- and Hf-rich Nb5Si3, Nbss, and A15-Nb3X phases (Figure 3b,c). Large Nb5Si3 grains were surrounded by a eutectic of the Ti- and Hf-rich Nb5Si3 and the Nbss (see Table S2 in Supplemental Data). In the Figure 3b, the Hf-rich Nb5Si3 in the eutectic is indicated with the numbers 1 to 3. The A15-Nb3X compound was adjacent to the eutectic. In more than one case, it grew directly next to Nb5Si3 (see Figure 3b,c). The Nbss in the eutectic exhibited a lighter grey contrast compared with the Nb5Si3 and Hf-rich Nb5Si3. The Nbss had Si/(Sn+Al) of about 0.2. The Si + Sn + Al concentration of the eutectic was 23.2 at.%, with Si/(Sn+Al) of about 1.4, and the corresponding values for the A15-Nb3X were about 20.6 at.% and 0.3, respectively. In the Nb5Si3 and the Ti- and Hf-rich Nb5Si3, the Si + Sn + Al concentration was about 37.6 and 38.5 at.%, respectively. The Ti- and Hf-rich Nb5Si3 had Nb/(Ti + Hf) of about 0.7, indicative of hexagonal Nb5Si3.
In the bottom of the ingot, the microstructure consisted of Nb5Si3 adjacent to or surrounded by Ti- and Hf-rich Nb5Si3, which was occasionally surrounded by A15-Nb3X, and by Nbss adjacent to or surrounded by the Ti- and Hf-rich Nb5Si3 (Figure 3d,e). The Ti- and Hf-rich Nb5Si3 grew from the Nb5Si3 with a distinct morphology (see Figure 3d). No eutectic was observed in the bottom of the ingot. The Nbss had Si/(Sn+Al) of about 0.2. The Si + Al + Sn content and the Si/(Sn + Al) ratio of the A15-Nb3X were about 20.3 at.% and 0.3, respectively. The Si + Sn + Al concentration in the Nb5Si3 was about 36.9 at.%, whereas in the Ti- and Hf-rich Nb5Si3, it was about 37.9 at.%. Furthermore, the Nb/(Ti + Hf) ratio of the Ti- and Hf-rich Nb5Si3 was about 0.8, which pointed to hexagonal Nb5Si3.

3.4. Heat-Treated EZ5-HT1 (1500 °C/100 h)

According to the XRD data (Figure S2 in the Supplemental Data) the microstructure consisted of the αNb5Si3, βNb5Si3, γNb5Si3 silicides and the Nb3Sn compound (Figure 4a). Nbss and HfO2 were not observed. The microstructure consisted of Nb5Si3 (dark contrast) and Hf-rich Nb5Si3 (grey contrast) surrounded by the A15-Nb3X (brighter contrast). Submicron particles precipitated in the Nb5Si3 and the Hf-rich Nb5Si3. The composition of these particles could not be determined owing to their size. The Si + Sn + Al concentration in the A15-Nb3X was about 19.7 at.% and the Si/(Sn+Al) ratio was about 0.3. In the Nb5Si3 and the Ti- and Hf-rich Nb5Si3 the Si + Sn + Al concentration was about 38.2 at.% and 39.3 at.%, respectively. The Nb/(Ti + Hf) ratio in the Ti- and Hf-rich Nb5Si3 was about 0.8, indicating hexagonal Nb5Si3.

3.5. Heat-Treated EZ5-HT2 (1500 °C/200 h)

The alloy EZ5 was given a second heat treatment at 1500 °C for an additional 100 h, in order to find out whether equilibrium had been achieved. The same specimen that was first heat treated for 100 h was given another 100 h heat treatment. According to the XRD data, the microstructure consisted of the same phases as in EZ5-HT1, namely αNb5Si3, βNb5Si3, γNb5Si3 silicides, and the Nb3Sn compound (Figure S2 in the Supplemental Data), and did not change compared with the EZ5-HT1. In some parts of the microstructure, the A15-Nb3X exhibited a small variation in contrast (see numbers 1 and 2 in the Figure 4b). Data for the chemical composition of the phases in EZ-HT2 are given in Table S2 in the Supplemental Data. The precipitates that were observed in both the Nb5Si3 and the Ti- and Hf-rich Nb5Si3 in EZ5-HT1 were still present (Figure 4b), but in the EZ5-HT2, the size of these precipitates in some Nb5Si3 grains made possible their chemical analysis. The results confirmed that the precipitates were indeed the A15-Nb3X compound. The Si + Sn + Al concentration of the Nb3X was about 19.6 at.% with an Si/(Sn + Al) ratio of about 0.3. The S + Sn + Al concentration of the Nb5Si3 and the Ti- and Hf-rich Nb5Si3 was about 37.7 at.% and 38.4 at%, respectively. Both values were lower than the corresponding ones in EZ5-HT1. Similar to the EZ5-HT1, the Nb/(Ti + Hf) ratio of the Ti- and Hf-rich Nb5Si3 phase was about 0.8, which is indicative of hexagonal Nb5Si3.

3.6. As-Cast EZ6

The actual alloy composition (at.%) was 41Nb-24.2Ti-19.7Si-4.8Cr-5.3Hf-5Sn. Compared with the nominal composition, the EZ6-AC ingot was richer in Si. There was macrosegregation of Si, Ti, and Cr (Table 2), which was particularly strong for Si and Ti. Study of the microstructure was difficult owing to the partitioning of Hf and Sn (Figure 5 and Figure 6). The XRD data (Figure S3 in the Supplemental Data) indicated the presence of Nbss, Nb3Sn, αNb5Si3, βNb5Si3, γNb5Si3, C14-NbCr2 Laves, and HfO2. The EPMA confirmed the Nbss, A15-Nb3X, Nb5Si3, and C14-NbCr2 Laves phase and eutectic of Nbss and NbCr2 (Table 3).
The microstructure near the top of the ingot (Figure 6a) was similar to that in the bulk (Figure 5a) and consisted of bulky, faceted Nb5Si3 (dark contrast) surrounded by Nbss (grey contrast), A15-Nb3X (very bright contrast), and NbCr2 Laves (very dark contrast). The A15-Nb3X was surrounded by the Nbss or by the Laves phase and Ti- and Hf-rich Nb5Si3 (Figure 6a). The Laves phase was formed in between A15-Nb3X grains or Ti-rich Nbss and Ti- and Hf-rich Nb5Si3 (Figure 6a). The Ti-rich Nbss exhibited a darker contrast compared with the “normal” Nbss (numbers 1 and 2 in Figure 6a). The Ti- and Hf-rich Nb5Si3 (numbers 3 and 4 in Figure 6a) was separate from the “normal” Nb5Si3.
In the top of the ingot, the Si+Sn concentration in the Nbss was about 8.9 at.%, and the Si/Sn ratio was about 0.3, while the corresponding values for the Ti-rich Nbss were about 9.0 at.% and 0.2, respectively. In the A15-Nb3X, the Si+Sn content and Si/Sn ratio was about 18.6 at.% and 0.4. The Si+Sn concentration in the Nb5Si3 and the Ti- and Hf-rich Nb5Si3 was about 37.4 at.% and 38.3 at.%, respectively, and the Nb/(Ti + Hf) ratio of the latter was about 0.7, which corresponds to hexagonal γNb5Si3. The Si + Sn + Cr concentration of the Laves phase was about 58.9 at.%. The Laves phase formed a very fine eutectic with the Nbss. In this part of the ingot, the average composition of the eutectic was 23.3Nb-24.7Ti-7.4Si-35.7Cr-6.0Hf-2.9Sn (at.%), with Si+Sn+Cr of about 46.0 at.%.
In the bulk, the microstructure consisted of the same phases as near the top (Figure 5a and Figure 6b–d), but the vol.% of the A15-Nb3X was higher. The Si+Sn concentration in both the Nbss and the Ti-rich Nbss was slightly reduced compared with the top (about 8.4 at.%), and both had the same Si/Sn ratio (about 0.3). In the A15-Nb3X, the Si+Sn content was about 18.7 at.%, and Si/Sn about 0.4. The Si+Sn concentration in the Nb5Si3 and the Ti- and Hf-rich Nb5Si3 was the same (about 38.1 at.%), but the Nb/(Ti + Hf) ratio of the latter silicide was about 1.4. The Si + Sn + Cr concentration of the Laves phase was about 51.1 at.%. There was also a Nbss+NbCr2 eutectic, with average composition 21.2Nb-32.6Ti-11.6Si-22.6Cr-8.2Hf-3.8Hf (at.%), and Si+Sn+Cr of about 38.0 at.%. The eutectic was formed near Ti- and Hf-rich Nb5Si3. Some eutectic areas contained chunks of the Laves phase (e.g., see eutectic on the left-hand side of number 1 in Figure 6c).
The microstructure in the bottom of the ingot consisted of the same phases as near the top and bulk (Figure 5b and Figure 6e), but the vol.% of the A15-Nb3X was significantly reduced. Furthermore, there was no evidence of the NbCr2 + Nbss eutectic. The Si+Sn concentration and Si/Sn ratio in the Nbss and Ti rich Nbss were about 8.6 at.% and 0.3, and 8.8 at.% and 0.2, respectively. The Si+Sn content and the Si/Sn ratio of the A15-Nb3X were about 18.4 at.% and 0.4, respectively. In the Nb5Si3 and the Ti- and Hf-rich Nb5Si3, the Si+Sn concentration was essentially the same (about 38.2 at.%), and the Nb/(Ti + Hf) ratio in the latter was about 0.8, which corresponds to hexagonal γNb5Si3, as was the case near the top of the ingot. The Cr + Si + Sn concentration in the Laves phase was about 56.8 at%. The Laves phase was surrounded by either Ti-rich Nbss or Ti- and Hf-rich Nb5Si3.

3.7. Heat-Treated EZ6-HT1 (1500 °C/100 h)

After the heat treatment at 1500 °C for 100 h, there was liquation in EZ-HT1. The microstructure had significantly coarsened compared with EZ6-AC (compare Figure 7 with Figure 5a) and exhibited features similar to those reported for the heat-treated alloy Nb-24Ti-18Si-8Cr-4Al (alloy KZ2-HT1 (1500 °C/100 h), in [21]), which also had undergone liquation.
Data for the microstructure of EZ6-HT1 is given in Table S3 and in Figure S3 in the Supplemental Data, and in Figure 7. According to the XRD data, αNb5Si3, βNb5Si3, γNb5Si3, Nb3Sn, Nbss, HfO2, and C14-NbCr2 Laves phase were present. There were no Ti-rich areas in the Nbss, but there was still Ti- and Hf-rich Nb5Si3. Precipitation of the Laves phase had occurred not only at the interfaces of the Nbss with the A15-Nb3X or Hf-rich Nb5Si3, but also within the Nbss grains, as shown in Figure 7. The needle-like Laves precipitates that were formed within and around the grains of the Nbss exhibited similar morphology to those observed in the KZ2-HT1 alloy that had experienced liquation [21]. After this heat treatment, a very small volume fraction of HfO2 was formed. The Si+Sn content and Si/Sn ratio of the Nbss were about 7.3 at.% and 0.1, respectively. The corresponding values for the A15-Nb3X were about 18.5 at.% and 0.3, respectively. The Si+Sn concentration in the Nb5Si3 and the Ti- and Hf-rich Nb5Si3 was about 38.1 at.% and 38.8 at.%, respectively. The Nb/(Ti + Hf) ratio in the Ti- and Hf-rich Nb5Si3 was about 0.7, indicating hexagonal γNb5Si3. The Cr+Si+Sn concentration in the Laves phase was about 54.1 at.%. The latter value should be viewed with caution owing to the size of the Laves phase in EZ6-HT1.

3.8. Heat-Treated EZ6-HT2 (1200 °C/100 h)

Given the liquation that occurred in EZ6-HT1, the alloy was heat treated at 1200 °C for 100 h. According to the XRD data (Figure S3 in the Supplemental Data), the microstructure consisted of αNb5Si3, βNb5Si3, γNb5Si3, Nb3Sn, Nbss, HfO2, and C14-NbCr2 Laves phase. Table S3 in the Supplemental Data summarizes the EPMA data for the phases that were confirmed with XRD and EPMA. In other words, the microstructure of EZ6-HT2 contained Nbss, A15-Nb3X, Nb5Si3, HfO2, and C14-NbCr2 Laves phase (Table 3).
The microstructure of EZ6-HT2 was significantly different compared with EZ6-HT1 (Figure 8a). There was no Ti-rich Nbss, but Ti- and Hf-rich Nb5Si3 was still present. The vol.% of the Nbss was significantly reduced compared with EZ6-AC (Table 1). The Nb5Si3 was still facetted (Figure 8a). The average Si+Sn concentration and the Si/Sn ratio of the Nbss were about 4.6 at.% and 0.2, and the corresponding values for the A15-Nb3X were about 18.2 at.% and 0.2, respectively. There was growth of the Laves phase (Figure 8), of which the average Cr + Si + Sn concentration was about 59.7 at.%. The Si+Sn concentration in Nb5Si3 was about 37.4 at.%. The Ti- and Hf-rich Nb5Si3 was distinct from the “normal” Nb5Si3, and its contrast was very close to that of the A15-Nb3X (Figure 8b).
Figure 8b,c,d shows that adjacent to “normal” Nb5Si3 silicide grains, but not surrounding the whole Nb5Si3 grain, there was a microstructure that had formed after this heat treatment (indicated with A in Figure 8, and referred to below as microstructure A). The average composition of the “normal” Nb5Si3 grains, next to which the microstructure A was formed, was 42.5Nb-13.9Ti-36.7Si-0Cr-5Hf-1.8Sn (at.%), with Si + Sn = 38.5, Si/Sn = 20.8, Ti/Hf = 2.8, Ti + Hf = 19 at.%, and Nb/(Ti + Hf) = 2.25 (i.e., tetragonal silicide). Note that there was no Cr in these silicide grains. The phases in microstructure A exhibited different contrasts, and possibly formed a “lamellar” microstructure (Figure 8d). The contrast of the phases was similar to that of the phases in the microstructure of EZ6-HT2. Separate analysis of the composition of each of the phases was not possible owing to their size. Instead, large area analysis of microstructure A gave its average composition as 25Nb-27.1Ti-33.8Si-1.2Cr-11.2Hf-1.7Sn (at.%), with Si + Sn = 35.5 at.%, Si/Sn = 19.9, Ti/Hf = 2.4, Ti + Hf = 38.3 at.%, and Nb/(Ti + Hf) = 0.66.
The interface of microstructure A with the A15-Nb3X was often decorated with fine particles exhibiting white contrast, that is, a bright contrast phase (BCP) (Figure 8b–d). The average composition of the BCP was 18.6Nb-25.7Ti-39.8Si-0.6Cr-14.7Hf-0.65Sn (at.%), with Si + Sn = 40.45 at.%, Si/Sn = 61.9, Ti/Hf = 1.75, Ti + Hf = 40.4 at.%, and Nb/(Ti + Hf) = 0.5. Next to the BCP particles, the A15-Nb3X (Figure 8c) had average composition 45.6Nb-31.1Ti-2.7Si-3.1Cr-2Hf-15.6Sn (at.%), with Si + Sn = 18.3 at.%, Si/Sn = 0.2, Ti/Hf = 15.9, Ti + Hf = 33 at.%, and Nb/(Ti + Hf) = 1.4; the average composition of the Nbss was 55.1Nb-31.1Ti-0.5Si-7.1Cr-2.3Hf-3.9Sn (at.%), with Si + Sn = 4.4 at.%, Si/Sn = 0.3, Ti/Hf = 13.3, Ti + Hf = 33.4 at.%, and Nb/(Ti + Hf) = 1.65; and the average composition of the Laves phase was 22.3Nb-12.5Ti-10.1Si-48.7Cr-6Hf-0.4Sn (at.%), with Si + Sn = 10.5 at.%, Si/Sn = 25.3, Ti/Hf = 2.1, Ti + Hf = 18.6 at.%, Nb/(Ti + Hf) = 1.2, and Cr + Si + Sn = 59.2 at.%.

3.9. As-Cast EZ8

The actual composition (at.%) of the alloy was 36.9Nb-24.6Ti-17.8Si-4.9Al-5.1Cr-5.4Hf-5.3Sn. The macrosegregation of Si was the highest of all the alloys. In addition, there was macrosegregation of Cr and Ti (Table 2). Typical microstructures are shown in Figure 9 and Figure 10. Study of the microstructure of EZ8 was difficult owing to the partitioning of Hf and the formation of A15-Nb3X, the contrast of which was similar to that of the Nbss. According to the XRD data (Figure S4 in Supplemental Data), the microstructure consisted of αNb5Si3, βNb5Si3, γNb5Si3, Nb3Sn, Nbss, HfO2, and C14-NbCr2 Laves phase. The analysis data (Table S4 in Supplemental Data) supports the presence of γNb5Si3, as the Nb/(Ti + Hf) ratio of the silicide was less than one. The HfO2 was observed only in the bulk of the ingot, where it had formed at a very small vol.%.
The microstructure in the top of the ingot was similar to that in the bulk. It consisted of large Nb5Si3 grains that were surrounded by Ti- and Hf-rich Nb5Si3. There was strong microsegregation of Hf in the Nb5Si3 that exhibited different contrasts (Figure 10a,b). Adjacent to the Ti- and Hf-rich Nb5Si3, Nbss was formed. The A15-Nb3X was formed adjacent to the Nbss, and it was often completely surrounded by it. In many parts of the microstructure, a complicated network of Ti- and Hf-rich Nb5Si3 and A15-Nb3X had grown adjacent to Nb5Si3. The microstructure in these areas (denoted as A in Figure 10a,b) seemed to have grown directly from the Nb5Si3, and even though it was coarser, it resembled a lamellar microstructure.
The Laves phase was often observed at the interface of the Nbss with the A15-Nb3X. The average Si + Al + Sn concentration in the Nbss was about 13.1 at.% with an Si/(Sn + Al) ratio of about 0.2. The corresponding values for the A15-Nb3X were about 20.9 at.% and 0.3, respectively. In the Nb5Si3, the Si + Al + Sn concentration was about 35.8 at.%, and it was about 37.2 at.% for the Ti- and Hf-rich Nb5Si3. The Nb/(Ti + Hf) ratio of the latter was about 0.7, indicating γNb5Si3. The Si + Sn + Al + Cr concentration of the Laves phase was about 47.9 at.%. There was a Nbss+NbCr2 eutectic in the areas close to the top of the ingot.
The microstructure in the bulk of the ingot was similar to the one observed in the top (see Figure 9a and Figure 10c,d). The areas between the A15-Nb3X and the Ti- and Hf-rich Nb5Si3 (denoted as A) that were observed in the top of EZ8-AC were also present in this part of the ingot. The average Si + Al + Sn concentration in the Nbss was about 12.9 at.%, the Si/(Sn+Al) ratio was about 0.2, and the corresponding values for the A15-Nb3X were about 21.1 at.% and 0.3, respectively. In the Nb5Si3, the Si + Al + Sn concentration was about 38.3 at.%. The respective concentration in the Ti- and Hf-rich Nb5Si3 was about 37.2 at.%, with Nb/(Ti + Hf) of about 0.7. The average Si + Al + Sn + Cr concentration in the Laves phase was about 50 at.%. There was Nbss + NbCr2 eutectic in some areas of the bulk of EZ8-AC.
The microstructure in the bottom of the ingot was different compared with the top and bulk. The vol.% of the Nb5Si3 was significantly decreased. The Si concentration in the bottom of the ingot was about 14.7 at.%, that is, significantly lower than the nominal composition of Si in the alloy (Table S4 in Supplemental Data). Furthermore, the microstructure shown in Figure 9b and Figure 10e,f was distinctively finer compared with that observed in the top and bulk, and consisted of Nb5Si3, Ti- and Hf-rich Nb5Si3, A15-Nb3X, Nbss, and the C14-NbCr2 Laves phase. A sharp (flat) interface was formed between the Nb5Si3 and Nbss. The areas where this morphology was evident are denoted as B in Figure 10f. The average Si + Sn + Al concentration in the Nbss was about 13.0 at.%, with Si/(Sn + Al) of about 0.1. The corresponding values for the A15-Nb3X were about 20.6 at.% and 0.3, respectively. The Si + Sn + Al concentration in the Nb5Si3 and the Ti- and Hf-rich Nb5Si3 was about 37.0 at.% and 38.5 at.%, respectively. As was the case in other areas of EZ8-AC, the Ti- and Hf-rich Nb5Si3 had Nb/(Ti + Hf) of about 0.7, indicating hexagonal γNb5Si3. The Si + Sn + Al + Cr concentration in the Laves phase was about 59.6 at.%. The Nbss + NbCr2 eutectic was also observed.

3.10. Heat-Treated EZ8 (EZ8-HT)

After heat treatment at 1300 °C for 100 h, the micro-structure of EZ8-HT consisted of αNb5Si3, βNb5Si3, γNb5Si3 (Nb/(Ti + Hf) about 0.7), A15-Nb3X, C14-NbCr2 Laves phase, and HfO2 (Figure S4 in the Supplemental Data). The microstructure is shown in Figure 11 and consisted of large Nb5Si3 grains surrounded by a network of interpenetrating Ti- and Hf-rich Nb5Si3 and A15-Nb3X. Nbss was not observed. The C14-NbCr2 Laves phase had grown significantly larger and formed distinct areas at the boundaries of either the Ti- and Hf-rich Nb5Si3 or the A15-Nb3X phase. The average Si + Sn + Al concentration in the A15-Nb3X was about 19.7 at%, with Si/(Sn + Al) of about 0.2. In the Nb5Si3 and the Ti- and Hf-rich Nb5Si3 phases, the Si + Sn + Al concentration was about 36.7 at.% and 38.1 at.%, respectively. The Laves phase had average Si + Sn + Al + Cr of about 62 at.%. A15-Nb3X had precipitated in the Nb5Si3.

3.11. Hardness

The hardness of the alloys and the hardness of the A15-Nb3X, Nbss, and Nb5Si3 phases are given in Table 1 and Table 4, respectively. The hardness of the alloy EZ2 did not change after the heat treatment, whereas the hardness of the alloys EZ5, EZ6, and EZ8 increased. In the case of the alloy EZ2, there was a slight reduction in the hardness of Nb5Si3 and a more significant reduction in the hardness of Nbss. The hardness of Nbss in EZ6 also decreased after heat treatment. Regarding the alloys EZ5, EZ6, and EZ8, the hardness of A15-Nb3X increased after heat treatment. However, the hardness of Nb5Si3 increased in EZ5 and decreased in EZ6 and EZ8.

3.12. Lattice Parameter of Nbss

The lattice parameter of the bcc Nbss in the alloys of this work is given in Table 5, where data for other comparable alloys is included (see discussion).

4. Discussion

4.1. Macrosegregation

Macrosegregation of solute additions is common in cast RM(Nb)ICs [40]. The macrosegregation of Si (MACSi) in Nb-18Si silicide-based alloys with/without the addition of Al, Cr, Hf, Sn, or Ti is compared in Table 6. The data show the following:
(i)
In the absence of Sn,
(a)
the synergy of Ti with simultaneous additions of Al and Cr decreased MACSi (compare the alloys KZ7, KZ4 and KZ5);
(b)
the effect of the synergy of Ti with Hf on the increase of MACSi was stronger than the synergy of Ti with Cr or Al individually (compare the alloys YG3, KZ7, KZ4), and the same was the case when Ti was in synergy with Al, Cr, and Hf simultaneously (compare the alloys KZ5 and JN1);
(ii)
In the absence of both Ti and Sn,
(c)
the synergy of Hf with Al slightly increased MACSi compared with the synergy of Hf with Cr (alloys YG2 and YG1);
(iii)
With the addition of 5 at.% Sn but with no Ti in the alloy,
(d)
the MACSi increased when Hf and Sn were in synergy with Cr or Al (compare the alloys EZ3, EZ4, EZ1, EZ7, NV9);
(iv)
With the simultaneous addition of 24 at.% Ti and 2 at.% Sn,
(e)
the MACSi decreased when said elements were in synergy with Al and/or Cr (alloys ZX7, ZX3, ZX5), a similar trend as with (ia);
(v)
With the simultaneous addition of 24 at.% Ti and 5 at.% Sn but in the absence of Hf,
(f)
the MACSi increased significantly when Al and/or Cr were in synergy (alloys ZX8, ZX4, ZX6), which is the opposite behaviour compared with the 2 at.% Sn addition, see (ive);
(vi)
With the simultaneous addition of 24 at.% Ti and 5 at.% Sn and 5 at.% Hf,
(g)
the MACSi increased significantly when Al and/or Cr were in synergy with the said elements (alloys EZ8, EZ6, ZX6, EZ2, EZ5).
In other words, (1) the synergy of 5 at.% Hf with 5 at.% Al, 5 at.% Cr, 5 at.% Sn, and 24 at.% Ti slightly reduced MACSi, compared with the Hf-free alloy ZX8; and (2) the synergy of Hf and Sn with the addition of Ti, Al, and Cr increased MACSi in EZ8, compared with the alloys EZ2, EZ5, and EZ6. However, compared with the Ge addition in equivalent Nb-18Si silicide-based alloys, where the synergy of 5 at.% Hf with 5 at.% Al, 5 at.% Cr, 5 at.% Ge, and 24 at.% Ti reduced MACSi in the alloy ZF9 (MACSi = 3.1 at.%, ZF9 = Nb-24Ti-18Si-5Al-5Cr-5Hf-5Ge, nominal [35]) but increased MACSi in the Hf-free alloy ZF6 (MACSi = 4.3 at.%, ZF6 = Nb-24Ti-18Si-5Al-5Cr-5Ge, nominal [35]), the synergy of Hf and Sn had a similar but weaker effect on MACSi (compare ZX8 and EZ8 (10 versus 7.7 at.%) with ZF6 and ZF9 (4.3 at.% versus 3.1 at.%)). To put it another way, MACSi is less of an issue when Al, Cr, Hf, Si, and Ti are simultaneously in synergy with Ge than with Sn, but given that all the aforementioned elements are key for the oxidation resistance of RM(Nb)ICs, and that the simultaneous presence of Ge and Sn in RM(Nb)ICs suppressed pest oxidation and scale spallation at high temperatures [41] (see Section 4.2.14), it is unlikely that MACSi-free and oxidation-resistant metallic UHTMs can be produced using cold-hearth processing.
Comparison of the alloys EZ2, EZ5, EZ6, and EZ8 with regard to the macrosegregation of Ti (MACTi) (Table 2) shows (a) that Al, when it was in synergy with Hf and Sn, decreased MACTi (compare the alloys EZ2 and EZ5); (b) that Cr, when it was in synergy with Hf and Sn, had a very strong effect on MACTi (alloys EZ2 and EZ6); and (c) that in the presence of Al, the effect of Cr, Hf, and Sn on MACTi was reduced (alloys EZ6 and EZ8). The macrosegregation of Cr (MACCr) that was observed in the alloy EZ6 (Table 2) was slightly reduced with the addition of Al in the alloy EZ8, which would suggest that the effect of the synergy of Ti, Hf, and Sn on MACCr was not annulled by the addition of Al.

4.2. Microstructures

4.2.1. Suppression of Nb3Si

The alloying of Nb-18Si with 5 at.% Sn suppressed the formation of Nb3Si during solidification [39]. This effect of Sn was not “eliminated” when Sn was in synergy (a) with Ti [39], even though Ti stabilizes the Nb3Si [21,42,43,44,45]; (b) with Hf (alloy EZ1 [26]); or (c) with Ti and Hf (alloy EZ2), even though the synergy of the latter two elements in the absence of Sn furthered the formation of Nb3Si in the alloy Nb-24Ti-18Si-5Hf [25]. Thus, it was concluded that when Ti and/or Hf were in synergy with Sn, the latter element was still “in charge” of the suppression of Nb3Si.
The Nb3Si silicide was destabilized in RM(Nb)ICs (i) by Al (alloy KZ7, [21]); and (ii) by the synergy (a) of Hf and Al (alloy YG2, [25]), (b) of Sn and Al in the absence of Hf (alloy EZ7 [26]), and (c) of Sn with Al and Hf (alloy EZ4 [26], for the nominal compositions of alloys see the Table 6). Thus, in selecting the alloy EZ5 for this study, it was expected that the Nb3Si would be suppressed by the synergy of Hf and Sn with Al and Ti. This was confirmed by the experimental results. Furthermore, it has also been shown that in the alloy Nb-18Si-5Hf-5Cr (alloy YG1, [25]), the synergy of Hf and Cr destabilized the Nb3Si either via enhancing the transformation of the latter to Nbss and αNb5Si3 or by rendering the formation of Nb3Si sensitive to the cooling rate, so that it could not form during solidification with the high cooling rates prevailing in the bottom of the ingot. In other words, the synergy of Cr with Sn and Hf in EZ3-AC [26] further strengthened the destabilizing effect of Sn on the Nb3Si. This effect was not cancelled out by the addition of Ti in the alloy EZ6. Thus, it was expected that in EZ8-AC, the formation of Nb3Si would be suppressed by the synergy of Sn and Hf with Ti, Al, and Cr. This also was confirmed by the experimental results.
The absence of Nb3Si in the microstructures of the alloys EZ2, EZ5, EZ6, and EZ8 suggested that αNb5Si3 or γNb5Si3 could not be attributed to the phase transformations tP32 Nb3Si + βNb5Si3 → αNb5Si3 and tP32 Nb3Si → (Nb) + αNb5Si3 [38] or the solidification path L → tP32 Nb3Si → tP32 Nb3Si + Nb →(γNb5Si3 + Nb)eutectic [24], where tP32 Nb3Si is the tetragonal Nb3Si and (Nb) the solid solution in the Nb-Si binary [38]. Furthermore, the data for the Ti-free alloys EZ1, EZ3, EZ4, and EZ7 in [26]; the Ti-containing alloys ZX3, ZX5, and ZX7 with 2 at.% Sn [22], and ZX4, ZX6, and ZX8 with 5 at.% Sn addition [23] (see Table 6 for nominal compositions); and the alloys of this work, taken together, warn that in RM(Nb)ICs and RM(Nb)ICs/RCCAs with Al, Cr, Hf, Si, Sn, and Ti addition, phase transformations that use the Nb3Si silicide to engineer the microstructure of the metallic UHTM cannot be used.

4.2.2. Nbss + Nb5Si3 Eutectic

The suppression of Nb3Si in Nb-18Si-5Sn (alloy NV9, [39]) was accompanied with the stabilization of the Nbss+Nb5Si3 eutectic, the formation of which was attributed to the addition of Sn given that such a eutectic does not exist in the equilibrium Nb-Si binary system [38]. The Nbss+Nb5Si3 eutectic was not destabilized by the synergy of Sn with Hf in EZ1-AC [26].
The vol.% of the Nbss + Nb5Si3 eutectic was high in the alloy NV9, but with the addition of Ti in the alloy NV6, the vol.% of the eutectic was reduced [39]. Comparison of the microstructures of the alloys YG3-AC [25] and KZ3-AC (Nb-24Ti-18Si [21]) confirmed that the addition of Hf in the former stabilized the Nb5Si3, but the vol.% of Nb5Si3 was very low, as was the Nbss+Nb5Si3 eutectic. The synergy of Sn and Hf with Ti in the alloy EZ2 reduced the vol.% of the eutectic compared with the alloy EZ1-AC [26]. Thus, it was concluded that when the alloying elements Ti, Hf, and Sn are in synergy in Nb-18Si based alloys, the vol.% of the Nbss+Nb5Si3 eutectic is controlled by Sn, as the synergy of Ti and Hf favors Nb3Si selection and the Nbss+Nb3Si eutectic (alloy YG3, [25]).
The effect of different alloying elements on the formation of the Nbss+Nb5Si3 eutectic is summarized in Table 7. The addition of Al in the alloy YG2 [25] stabilized an Nbss+Nb5Si3 eutectic in all parts of the as-cast ingot (Table 7). However, the addition of Al in the alloy EZ4 [26] made the formation of the Nbss+Nb5Si3 eutectic susceptible to solidification conditions, as the eutectic was not formed in the bottom of the ingot (Table 7). Comparison of the alloys EZ1, EZ4, and YG2 would suggest that it is most likely the synergy of Al with Sn in the presence of Hf that makes the formation of the Nbss+Nb5Si3 eutectic sensitive to cooling rate. This effect was accentuated in the alloy EZ5, in which the synergy of Al with Ti rendered the formation of the Nbss+Nb5Si3 eutectic sensitive to cooling rate during solidification (Table 7). Comparison of EZ7-AC [26], in which a eutectic between Nb3Sn and Nb5Si3 was formed, with the alloys EZ4-AC [26] and EZ5-AC would suggest that it was Hf that destabilized the above eutectic, and that the addition of Ti in the alloy EZ5 enhanced the role of Hf in the formation of the Nbss+Nb5Si3 eutectic. The <Si> = Si + Sn + Al content of the Nbss+Nb5Si3 eutectic was in agreement with the <Si> of eutectics in RM(Nb)ICs and RM(Nb)ICs/RCCAs [13].

4.2.3. Nbss + C14-NbCr2 Eutectic

In the alloy EZ3 [26], the synergy of Cr with Sn and Hf destabilized the Nbss + Nb5Si3 eutectic and instead resulted in the formation of a Nbss + C14-NbCr2 Laves phase eutectic (Table 7). In accordance with the results for the alloy EZ3 [26], no Nbss + Nb5Si3 eutectic was formed in EZ6-AC, in which the addition of Ti did not suppress the Nbss + C14-NbCr2 eutectic that had formed in the Ti-free alloy EZ3 [26]. Aluminum stabilizes the C14-NbCr2 Laves phase in the Nb-Cr-Al ternary system [46]. The addition of Al in Ti-containing RM(Nb)ICs did not suppress the formation of the C14-NbCr2 Laves phase (e.g., compare the alloy KZ4-AC with KZ5-AC in [21]), but the addition of Hf did (compare JN1-AC in [20] with KZ5-AC), and in both these alloys (i.e., KZ5 and JN1), the Nbss+Nb5Si3 eutectic formed. The additions of Hf and Sn in EZ6 did not suppress the Laves phase (compare the alloy KZ4-AC [21] with EZ6-AC), in which the Nbss + NbCr2 eutectic formed. Similarly, the addition of Al in EZ8 did not suppress the Laves phase and the Nbss + NbCr2 eutectic, and shifted its composition closer to the eutectic in EZ3-AC [26] (Table 7). In the alloys EZ6-AC and EZ8-AC, the composition of the Nbss+NbCr2 eutectic corresponded to that of a high-entropy eutectic (EZ6) or a complex concentrated eutectic (EZ8) [11,12]. It was concluded that in Ti-containing RM(Nb)ICs and RM(Nb)ICs/RCCAs, the synergy of Cr, Hf, and Sn promotes the stability of the C14-NbCr2 Laves phase and the formation of Nbss+NbCr2 eutectic in the cast alloys, where the latter is a high-entropy eutectic or a complex concentrated eutectic that forms together with “conventional” phases (see [11]).

4.2.4. The Nb5Si3 Silicide

Compared with the as-cast Nb-18Si-5Sn (alloy NV9 in [39]), alloying with Hf (alloy EZ1) or with Al (alloy EZ7) or with Hf and Cr (alloy EZ3, see Table 6 for the nominal compositions) shifted the composition of the Nb5Si3 away from the Nb-rich corner (also see Table 2 in [34]). This effect was reduced when Hf was in synergy with Ti (alloy EZ2) or with Al (alloy EZ4) or with both Ti and Cr (alloy EZ6) and was further reduced when Hf was in synergy with both Ti and Al (alloy EZ5) or with Ti and Al and Cr (alloy EZ8) (see Table 8). In EZ6-AC, the average concentrations of alloying elements in Nb5Si3 were similar to those of the same elements in the as-cast alloys EZ2, EZ3 [26], YG1, YG3 [25], and KZ4 [21]. The same was the case for Nb5Si3 in EZ6-HT2 compared with the aforementioned alloys. However, in EZ6-HT2, the range of Si concentrations in Nb5Si3 was wider and varied from 30.2 to 36.9 at%. In the Hf-rich Nb5Si3, the Ti and Hf concentrations were higher than those in the as-cast alloys EZ2, EZ3 [26], and YG1 [25]. After heat treatment, the Ti and Hf concentrations in the Hf-rich Nb5Si3 increased compared with EZ6-AC and were higher compared with the heat-treated alloys EZ2, EZ3 [26], and YG3 [25]. It is suggested that in the presence of Hf, the dominant elements controlling the partitioning of the different solutes between the Nb5Si3 phase and the melt were Ti and Al, with the latter being the most potent.
Note that complex concentrated silicide [11] co-existed with “conventional” phases in EZ2-AC (see 6 and 7 in the Figure 2a). Hexagonal Nb5Si3 was stable in all the alloys of this work after the heat treatment(s) (Table 3). All the data for the Nb5Si3 for all the alloys of this work gives Nb/(Ti + Hf) = 0.92, whereas this ratio is 0.97 and 0.93, respectively, for the “normal” Nb5Si3 and the Hf-rich Nb5Si3 (Figure 12). This is considered to indicate that the synergy of Sn with Hf and Ti in the absence of other TMs, RMs, and metalloid elements encourages the stability of the hexagonal γNb5Si3 in RM(Nb)ICs and RM(Nb)ICs/RCCAs.
The Ti versus Hf and the Nb versus Ti/Hf maps for the Nb5Si3 in the alloys of this work are shown in Figure 13. The Ti/Hf ratio was 1.46 when all the data for Nb5Si3 were taken into account (1.2 for the Nb5Si3 in EZ8), and it was 1.25 for the Hf-rich Nb5Si3. The maximum value of the Ti/Hf ratio was 3.67 for Nb = 43.65 at.%.

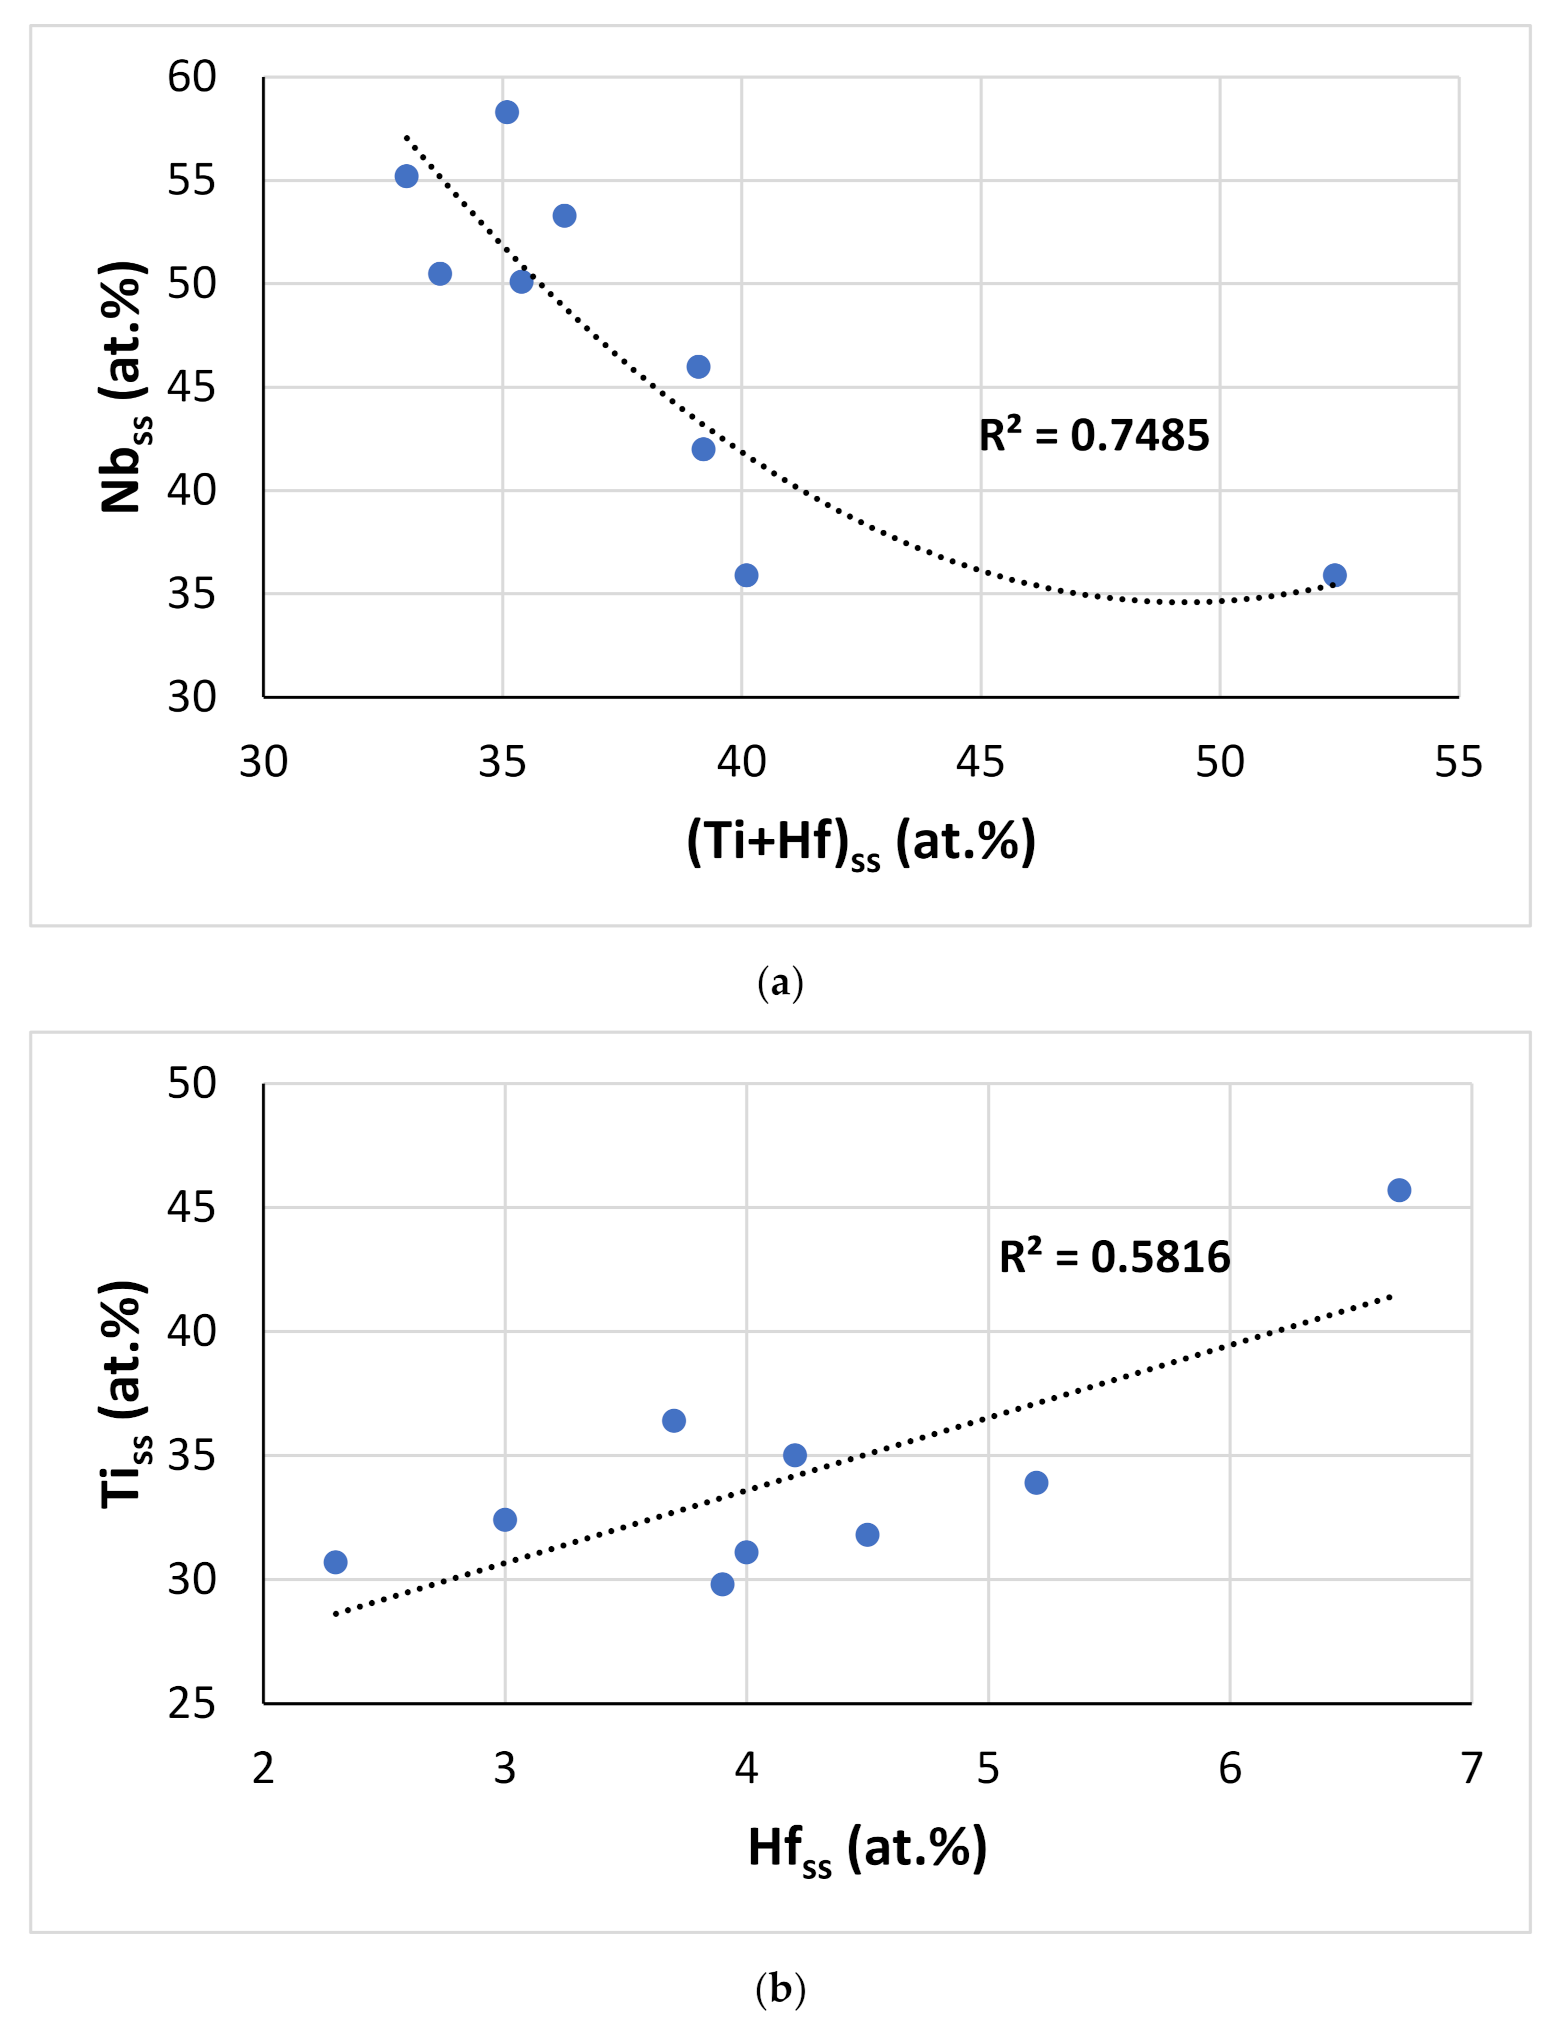
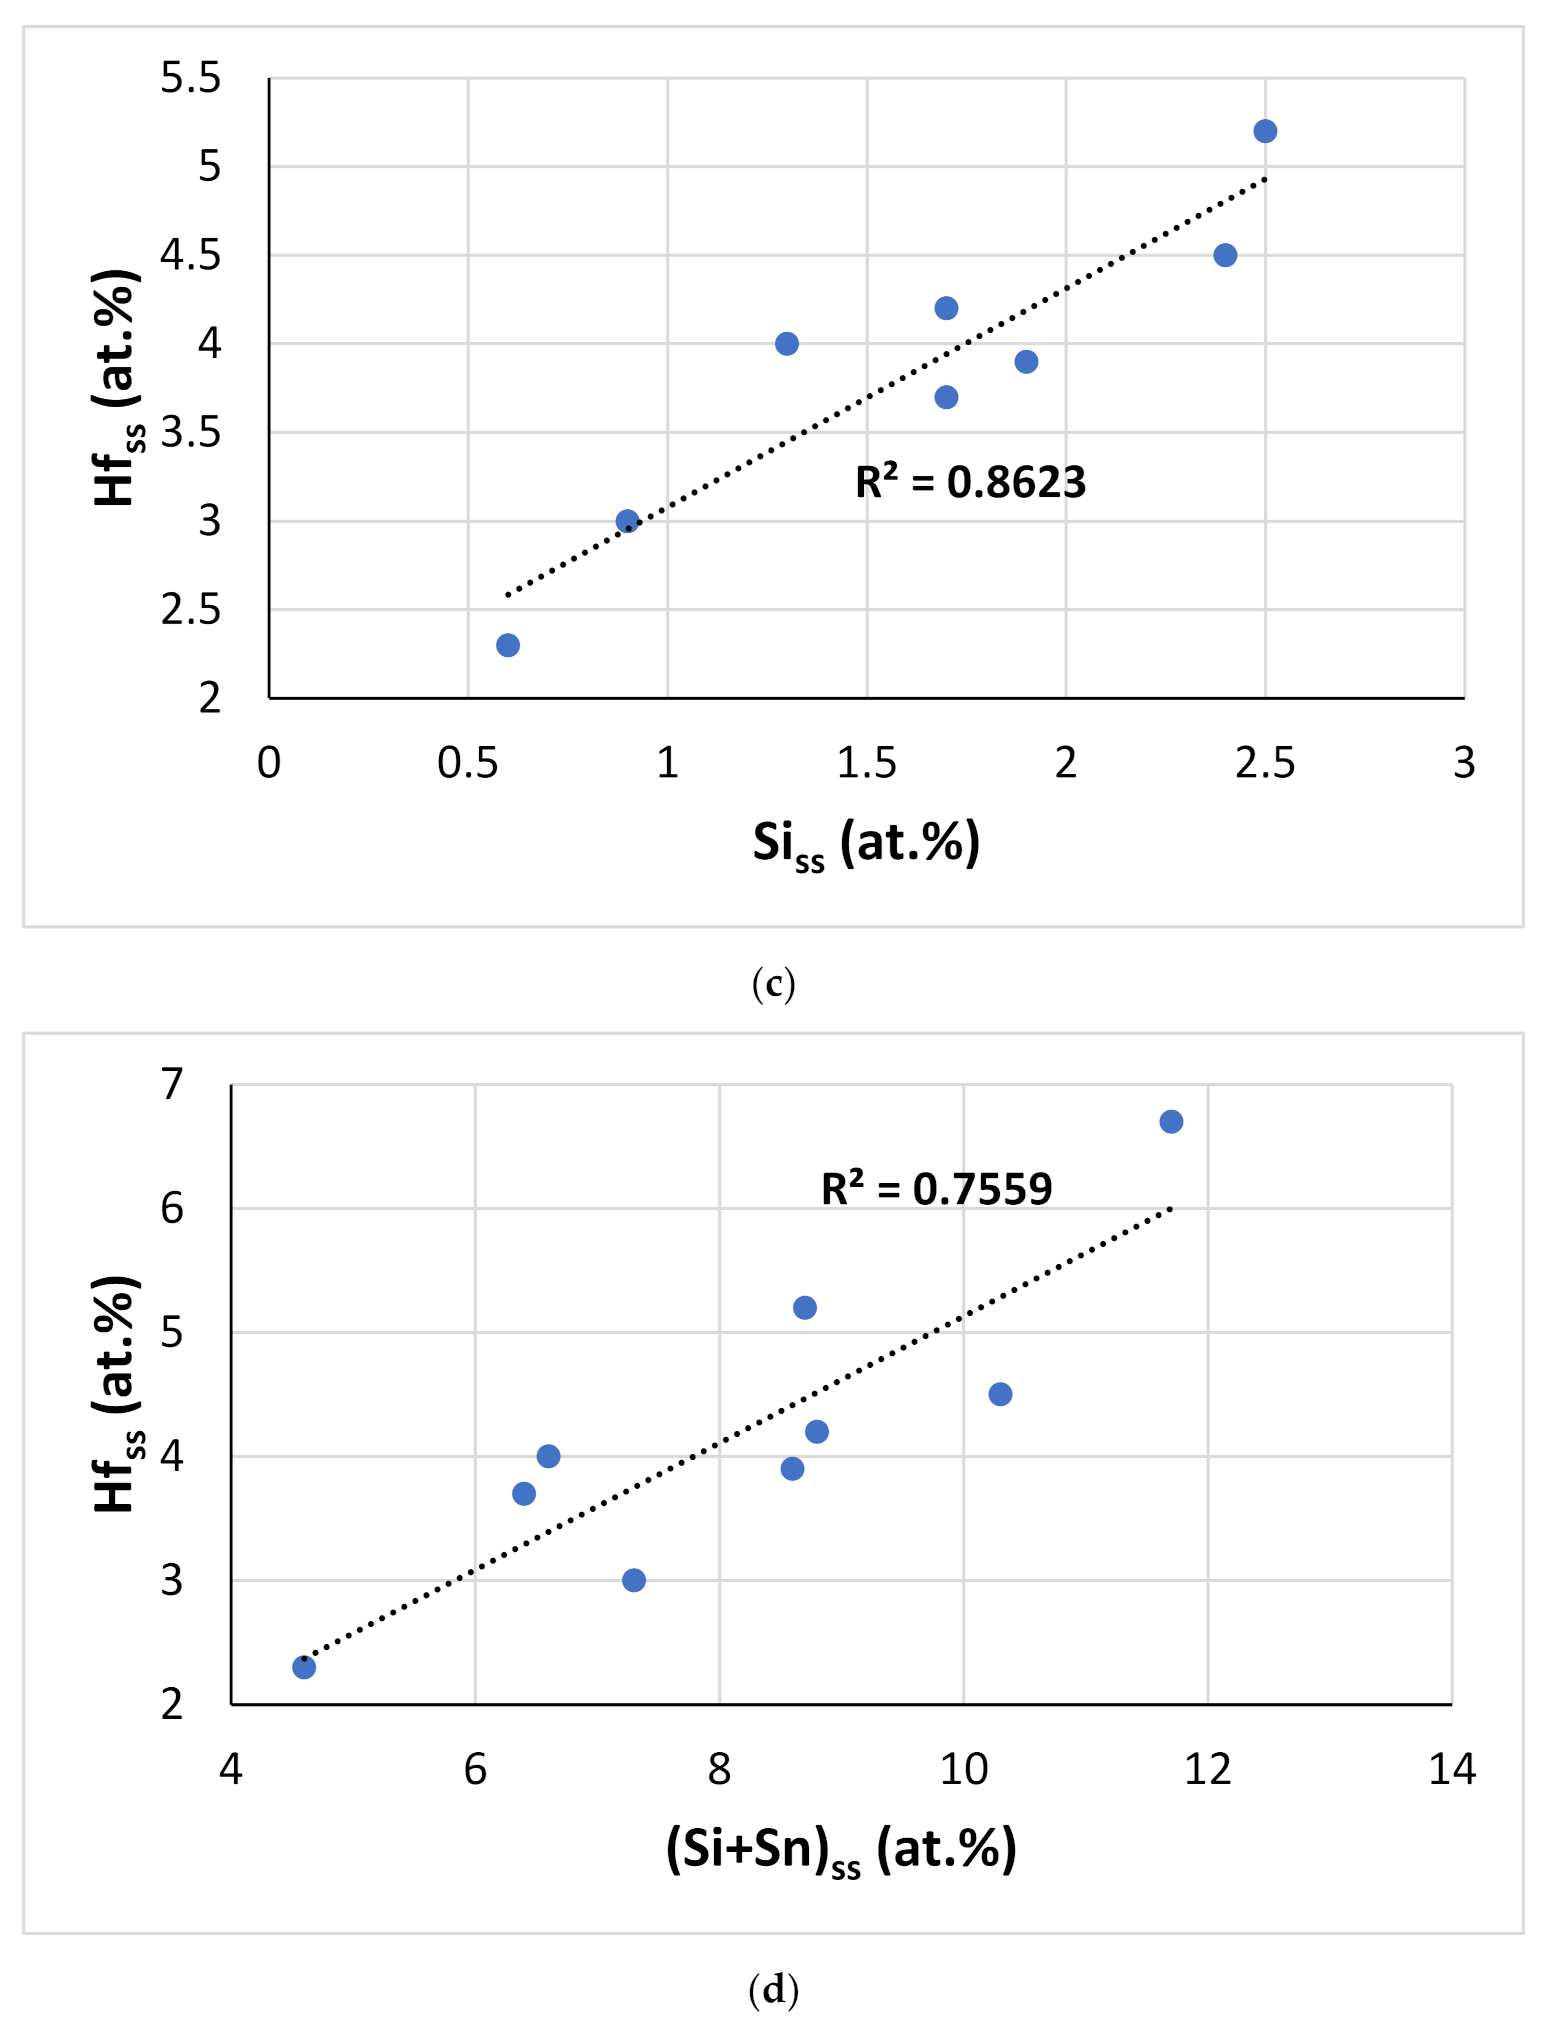
4.2.5. The Nbss Solid Solution

Compared with EZ1-AC [26], in EZ2-AC the synergy of Ti with Hf and Sn did not affect the solubility of Si in the Nbss and Ti-rich Nbss, but it increased the concentration of Sn in the Nbss by about 1.8 at.%. Thus, the Si+Sn concentration in Nbss and Ti-rich Nbss was about 10.3 at.% and 11.7 at.%, respectively, compared with 8.2 at.% in EZ1-AC [26]. In EZ2-HT, the Si concentration in Nbss was reduced to the same value as in EZ1-HT1 [26].
Compared with the alloy EZ7-AC [26], in which the Nbss was not stable, the data for the alloys EZ2, EZ4 [26], and EZ5 would suggest that the synergy of Hf with Ti (alloy EZ2), or with Al (alloy EZ4 [26]), or with Ti and Al (alloy EZ5) did not suppress the formation of Nbss during solidification that was controlled by the Si/Sn or Si/(Sn + Al) ratios (see Table 8). However, compared with the alloys EZ2-AC and EZ4-AC [26]—in which the Si+Sn and Si + Sn + Al concentrations in Nbss were, respectively, 10.3 at.% and 10.9 at.%—in EZ5-AC, the corresponding concentration was higher (about 15 at.%; see Table S2 in the Supplemental Data).
Compared with the alloy EZ2-AC, the Nb/Ti and Nb/(Ti + Hf) ratios in the Ti-rich Nbss in EZ6-AC were greater than 1, and in both alloys, the Hf and Sn content increased with the Ti concentration. However, for both solutes (i.e., Hf and Sn), the increase was more significant in EZ2-AC (no Cr present). The Si content of the Nbss was higher in EZ2-AC than in EZ6-AC, where it was the same as in EZ3-AC [26], KZ4-AC [21], and YG1-AC [25]. Thus, the data for the as-cast alloys YG1, YG3 [25], EZ2, EZ3 [26], and EZ6 would suggest that the synergy of Ti and Hf increased the Si concentration in the Nbss. After heat treatment, there was no Ti-rich Nbss, as was the case in the alloys EZ2, KZ4, and YG3. In EZ6-HT2, the Hf content of the Nbss decreased, as was the case in YG3-HT and EZ3-HT [26]. Furthermore, the Sn content of the Nbss decreased, as was the case in EZ3-HT. The concentration of Si in the Nbss was the same as in other RM(Nb)ICs but lower than that in EZ2-HT. Compared with the alloys EZ1 [26], EZ2, and EZ3 [26], the data for the alloy EZ6 would support the conclusion that the Nbss (and A15-Nb3X, see below) formation during solidification was controlled by the Si/Sn ratio (about 0.3) and the Si+Sn concentration (about 18 at.%), respectively, for the two phases (see Table 8).
The Nbss was not stable in the Al-, Hf-, and Ti-containing alloys EZ5 and EZ8 after heat treatment(s), even though it had formed in their cast microstructures (Table 3). Furthermore, in the Ti- and/or Hf-free alloys Nb-18Si-5Al-5Sn (EZ7) and Nb-18Si-5Al-5Hf-5Sn (EZ4) [26], the Nbss did not form during solidification and was not stable in EZ7 after the heat treatment (1500 °C/100 h), and also was not stable in EZ4 after the prolonged heat treatment (1500 °C/300 h). In all the aforementioned alloys (i.e., EZ4, EZ5, EZ7, EZ8), the concentration of Sn was 5 at.% (nominal). The Nbss was stable in the Hf-free but Al- and Ti-containing alloys ZX5 (Nb-24Ti-18Si-5Al-2Sn [22]) and ZX7 (Nb-24Ti-18Si-5Al-5Cr-2Sn [22]), and in the alloy ZX8 (Nb-24Ti-18Si-5Al-5Cr-5Sn [23]), but not in the alloy ZX6 (Nb-24Ti-18Si-5Al-5Sn [23]). Note that in the latter two alloys, the Sn concentration was 5 at.% (nominal), compared with 2 at.% in the former two alloys.
The data for the Ti-free alloys EZ4 and EZ7 suggested that the stability of Nbss was controlled by the synergy of 5 at.% Al with 5 at.% Sn. However, the Nbss was stable in the alloys EZ6, ZX5, ZX7, and ZX8 but not in the alloys ZX6, EZ5, and EZ8. The data would suggest (i) that Hf does indeed play a role in the stability of Nbss; (ii) that the concentration of Sn in the alloy is important for the stability of Nbss in RM(Nb)ICs where Al, Sn, and Ti are in synergy; and (iii) that the effect of the synergy of Al, Hf, and Sn on the stability of Nbss in the absence/presence of Ti in the alloy is very strong and cannot be annulled with the addition of Cr.
Given that Al, Hf, and Sn are key alloying additions in RM(Nb)ICs and RM(Nb)ICs/RCCAs to obtain a balance of properties [3], alloy design must aim to optimize the concentrations of these elements to control (a) the vol.% of Nbss and (b) the stability of Nbss in the alloy, due to the fact that the Nbss is important for all three property goals, namely fracture toughness, creep, and oxidation. The alloy design methodology NICE [12] can take care of (a) and (b).
The lattice parameters of the Nbss in the alloys of this work were given in Table 5, where data is also included for comparable alloys. The lattice parameter of the Nbss was lower than that of pure Nb (3.303 Å), with the exception of EZ1-HT. Changes of the lattice parameter of Nbss were attributed to the size effect of solutes (1.429, 1.462, 1.153, 1.578, 1.62, 1.432, and 1.249 Å, respectively, for Nb, Ti, Si, Hf, Sn, Al, and Cr) and to changes in the chemical composition of the Nbss after heat treatment.
In cast alloys free of Hf and Sn addition, with the addition of Al or Cr, the lattice parameter (αNbss) respectively decreased (ΔαNbss < 0) and increased (ΔαNbss > 0), whereas with the simultaneous addition of Al or Cr with Hf and Sn, the lattice parameter increased, most significantly in the case of Cr (Figure 14a). In heat-treated alloys with/without Hf and Sn in synergy with Cr, the lattice parameter increased (Figure 14b). With the addition of Hf, the ΔαNbss was positive in as-cast and heat-treated alloys with Sn, whereas in Hf-free alloys, the addition of Sn resulted to ΔαNbss < 0 in as-cast and ΔαNbss > 0 in heat-treated alloys (Figure 14). The synergy of Hf and Sn simultaneously with Al or Cr decreased αNbss in cast alloys (Figure 14a) and increased αNbss in heat-treated alloys (Figure 14b). The synergy of Ti simultaneously with Hf and Sn in Al- and Cr-free alloys resulted in ΔαNbss > 0, and the increase was more significant in the heat-treated condition.
It should be noted that the Nbss of the alloys of this work was Ti-rich (or in other words, the synergy of Hf with Sn and Ti resulted in Ti-rich Nbss), with a minimum Ti concentration of about 31.4 at.%, for which the corresponding concentrations of Si, Sn, and Hf, respectively, were 0.8 at.%, 5.6 at.%, and 3.1 at.% (that is to say, the chemical composition of the Nbss with the minimum Ti content was 59.1Nb-31.4Ti-0.8Si-3.1Hf-5.6Sn, with Si + Sn and Ti + Hf sum, and Si/Sn, Ti/Hf, and Nb/(Ti + Hf) ratio, respectively, of 6.4 at.%, 34.5 at.%, 0.14, 10.1, and 1.71). The data also indicated Nb/(Ti + Hf) = 0.7 for minimum concentrations of Nb and Ti + Hf in the Nbss of, respectively, 34.6 at.% and 49.2 at.% (Figure 15a). Note that the Nbss associated with the lamellar microstructure in EZ2-AC had similar Ti + Hf sum and Nb/(Ti + Hf) ratio (respectively 45.6 at.% and 0.95). Increasing Ti concentration in the Nbss also increased the Hf concentration (Figure 15b), and with increasing Hf content in the Nbss, the concentrations of Si and Sn increased by, respectively, 0.8 at.%/at.%Hf and 1.6 at.%/at.%Hf, as did the Si/Sn ratio and the Si+Sn sum, the latter by 1.96/at.%Hf (Figure 15c,d).
Considering that Hf, Si, Sn, and Ti are key elements for oxidation resistance and that refractory metals, in particular Mo and W, are key for strength and creep [1,3,11,12,33], the synergy of Hf, Sn, and Ti that promotes Ti rich Nbss (i) improves the oxidation resistance of the Nbss but (ii) reduces the strength and creep of the Nbss in alloys with RM addition, owing to the relationship between the concentration of Ti and RMs in the Nbss in RM(Nb)ICs and RM(Nb)ICs/RCCAs (e.g., see Figure S4 in the Supplemental Data in [47], Figure 12 in [48], and Figure 12 in [49]). Thus, a challenge for alloy design is to “balance” these effects. This is achievable with the alloy design methodology NICE [3,11,12].

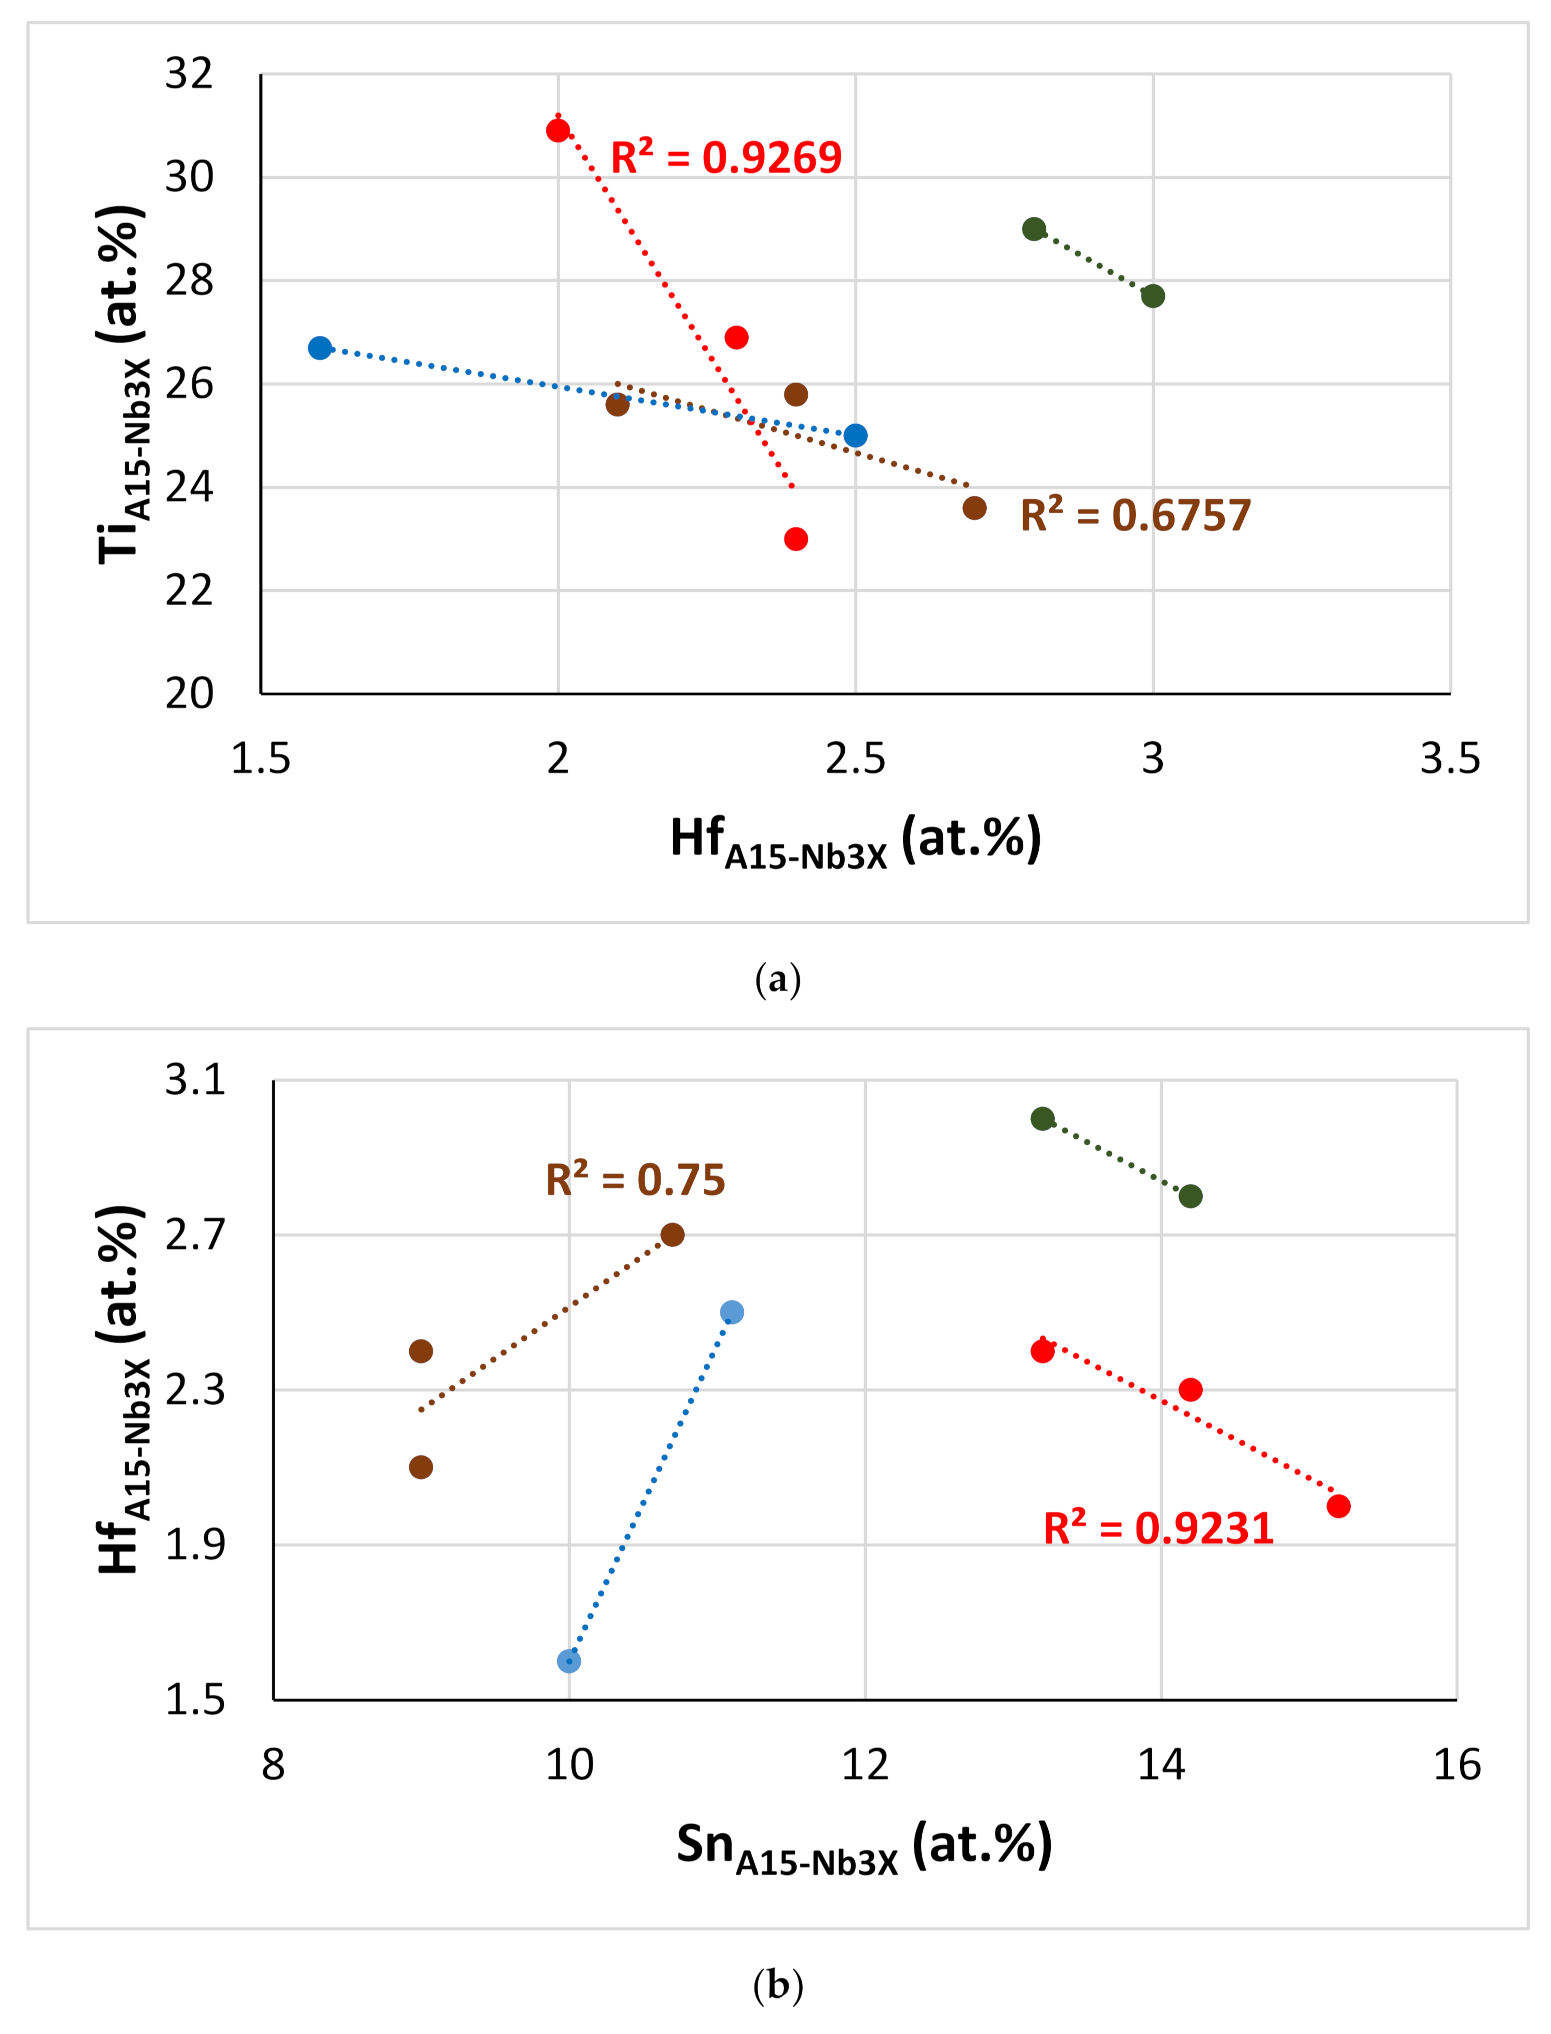
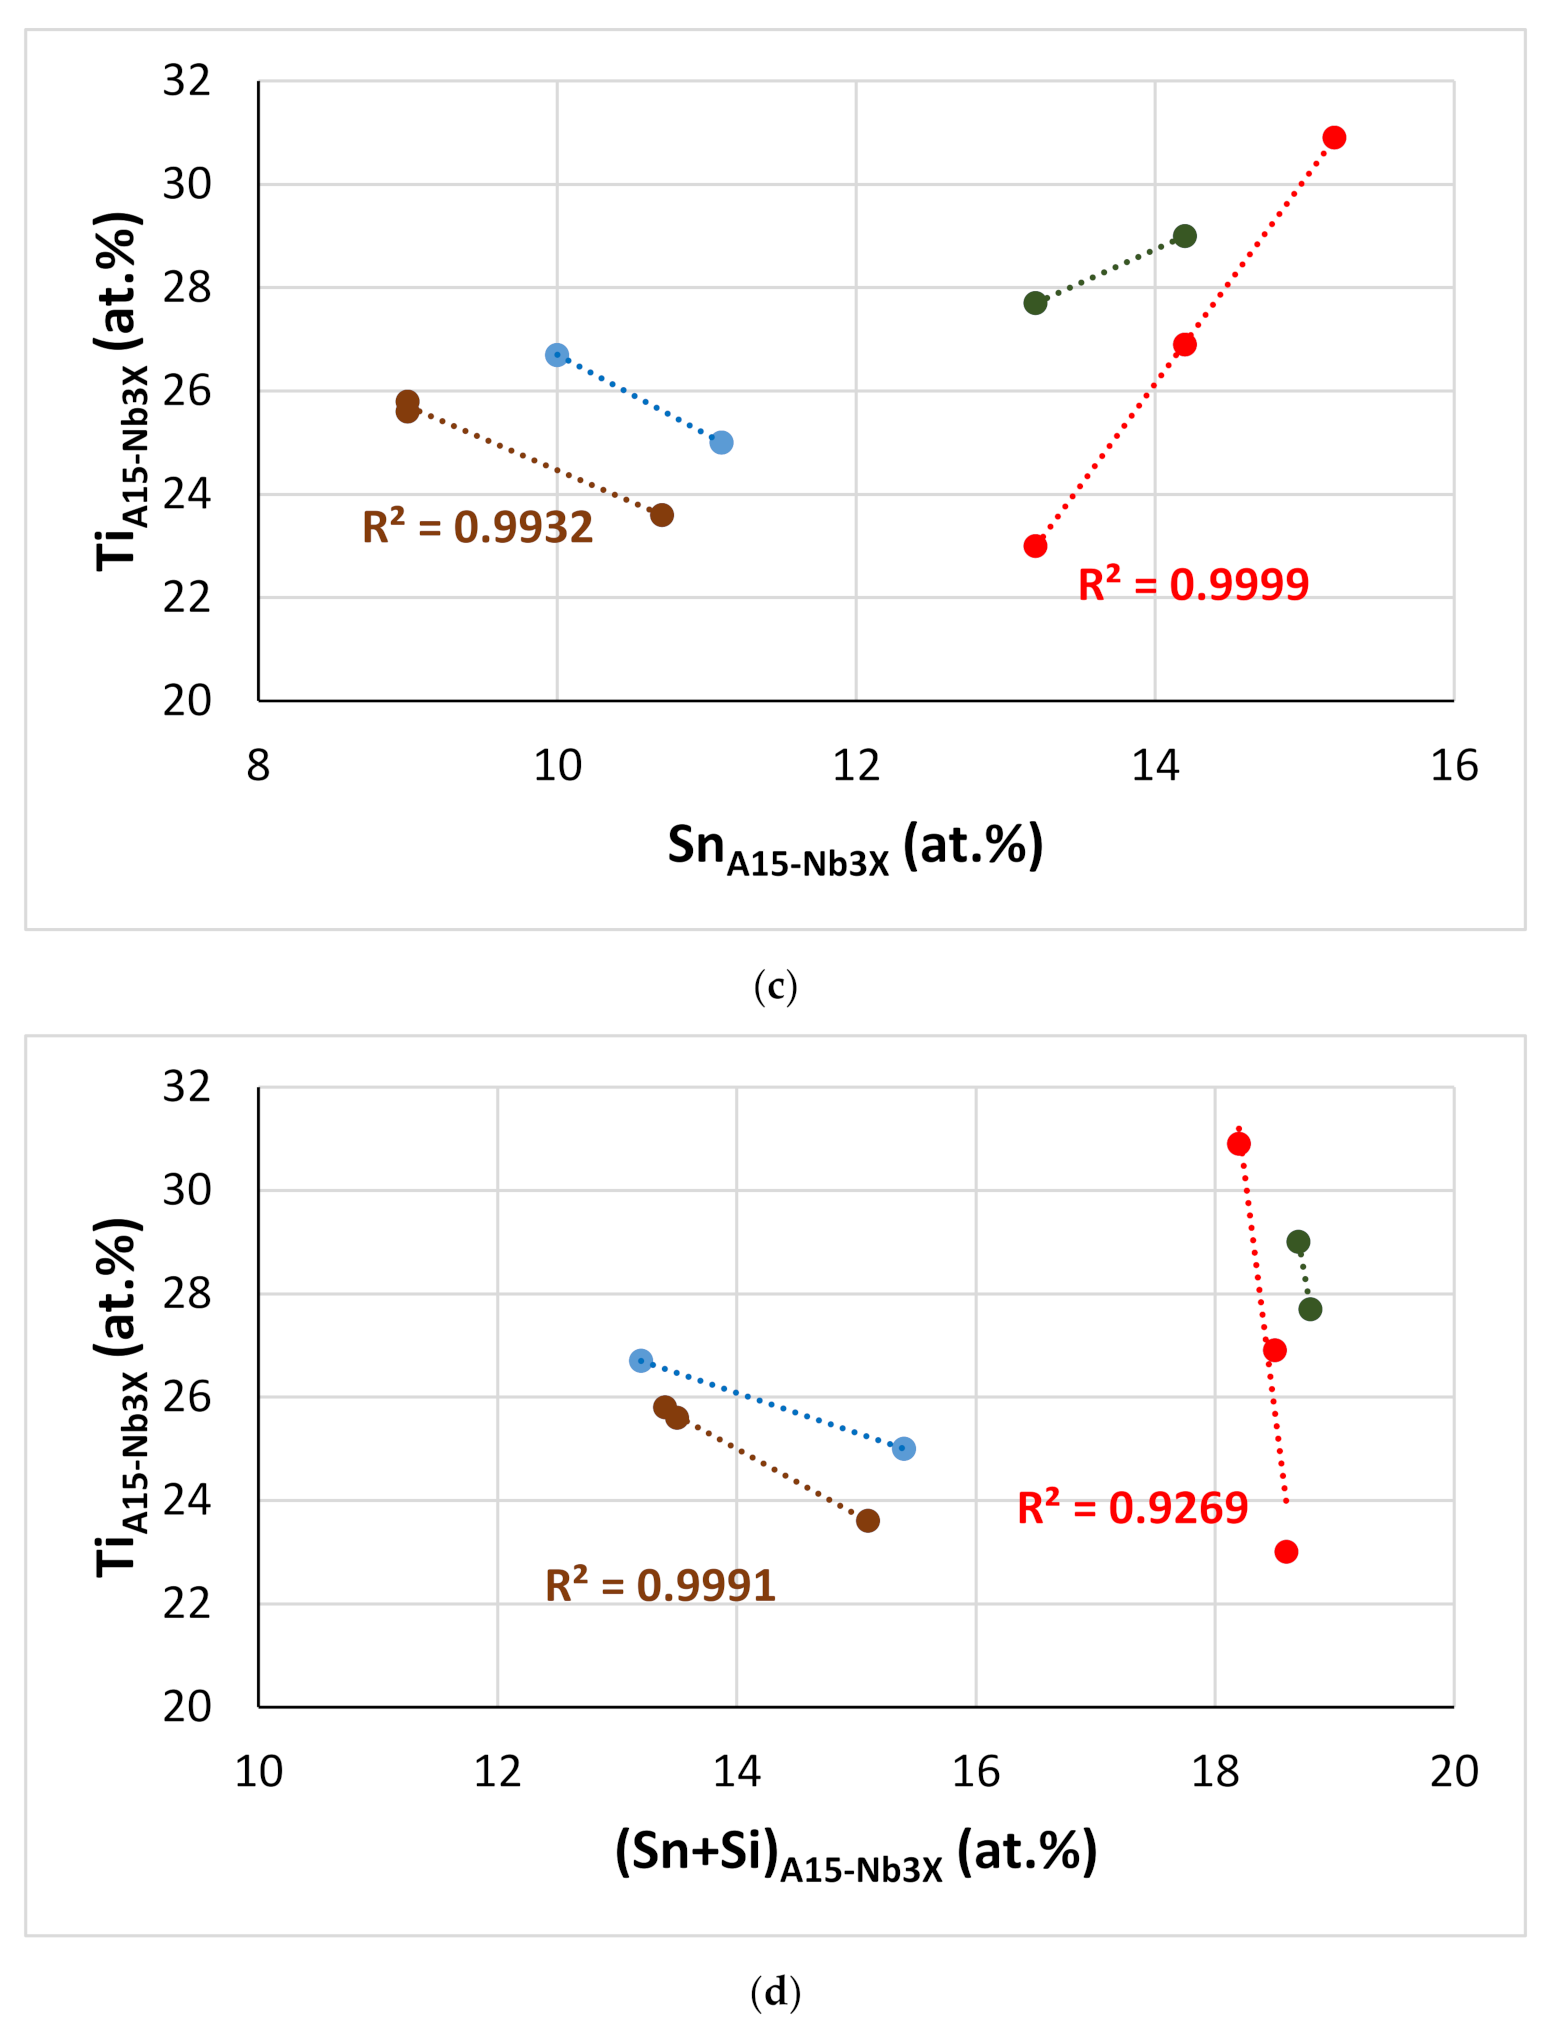
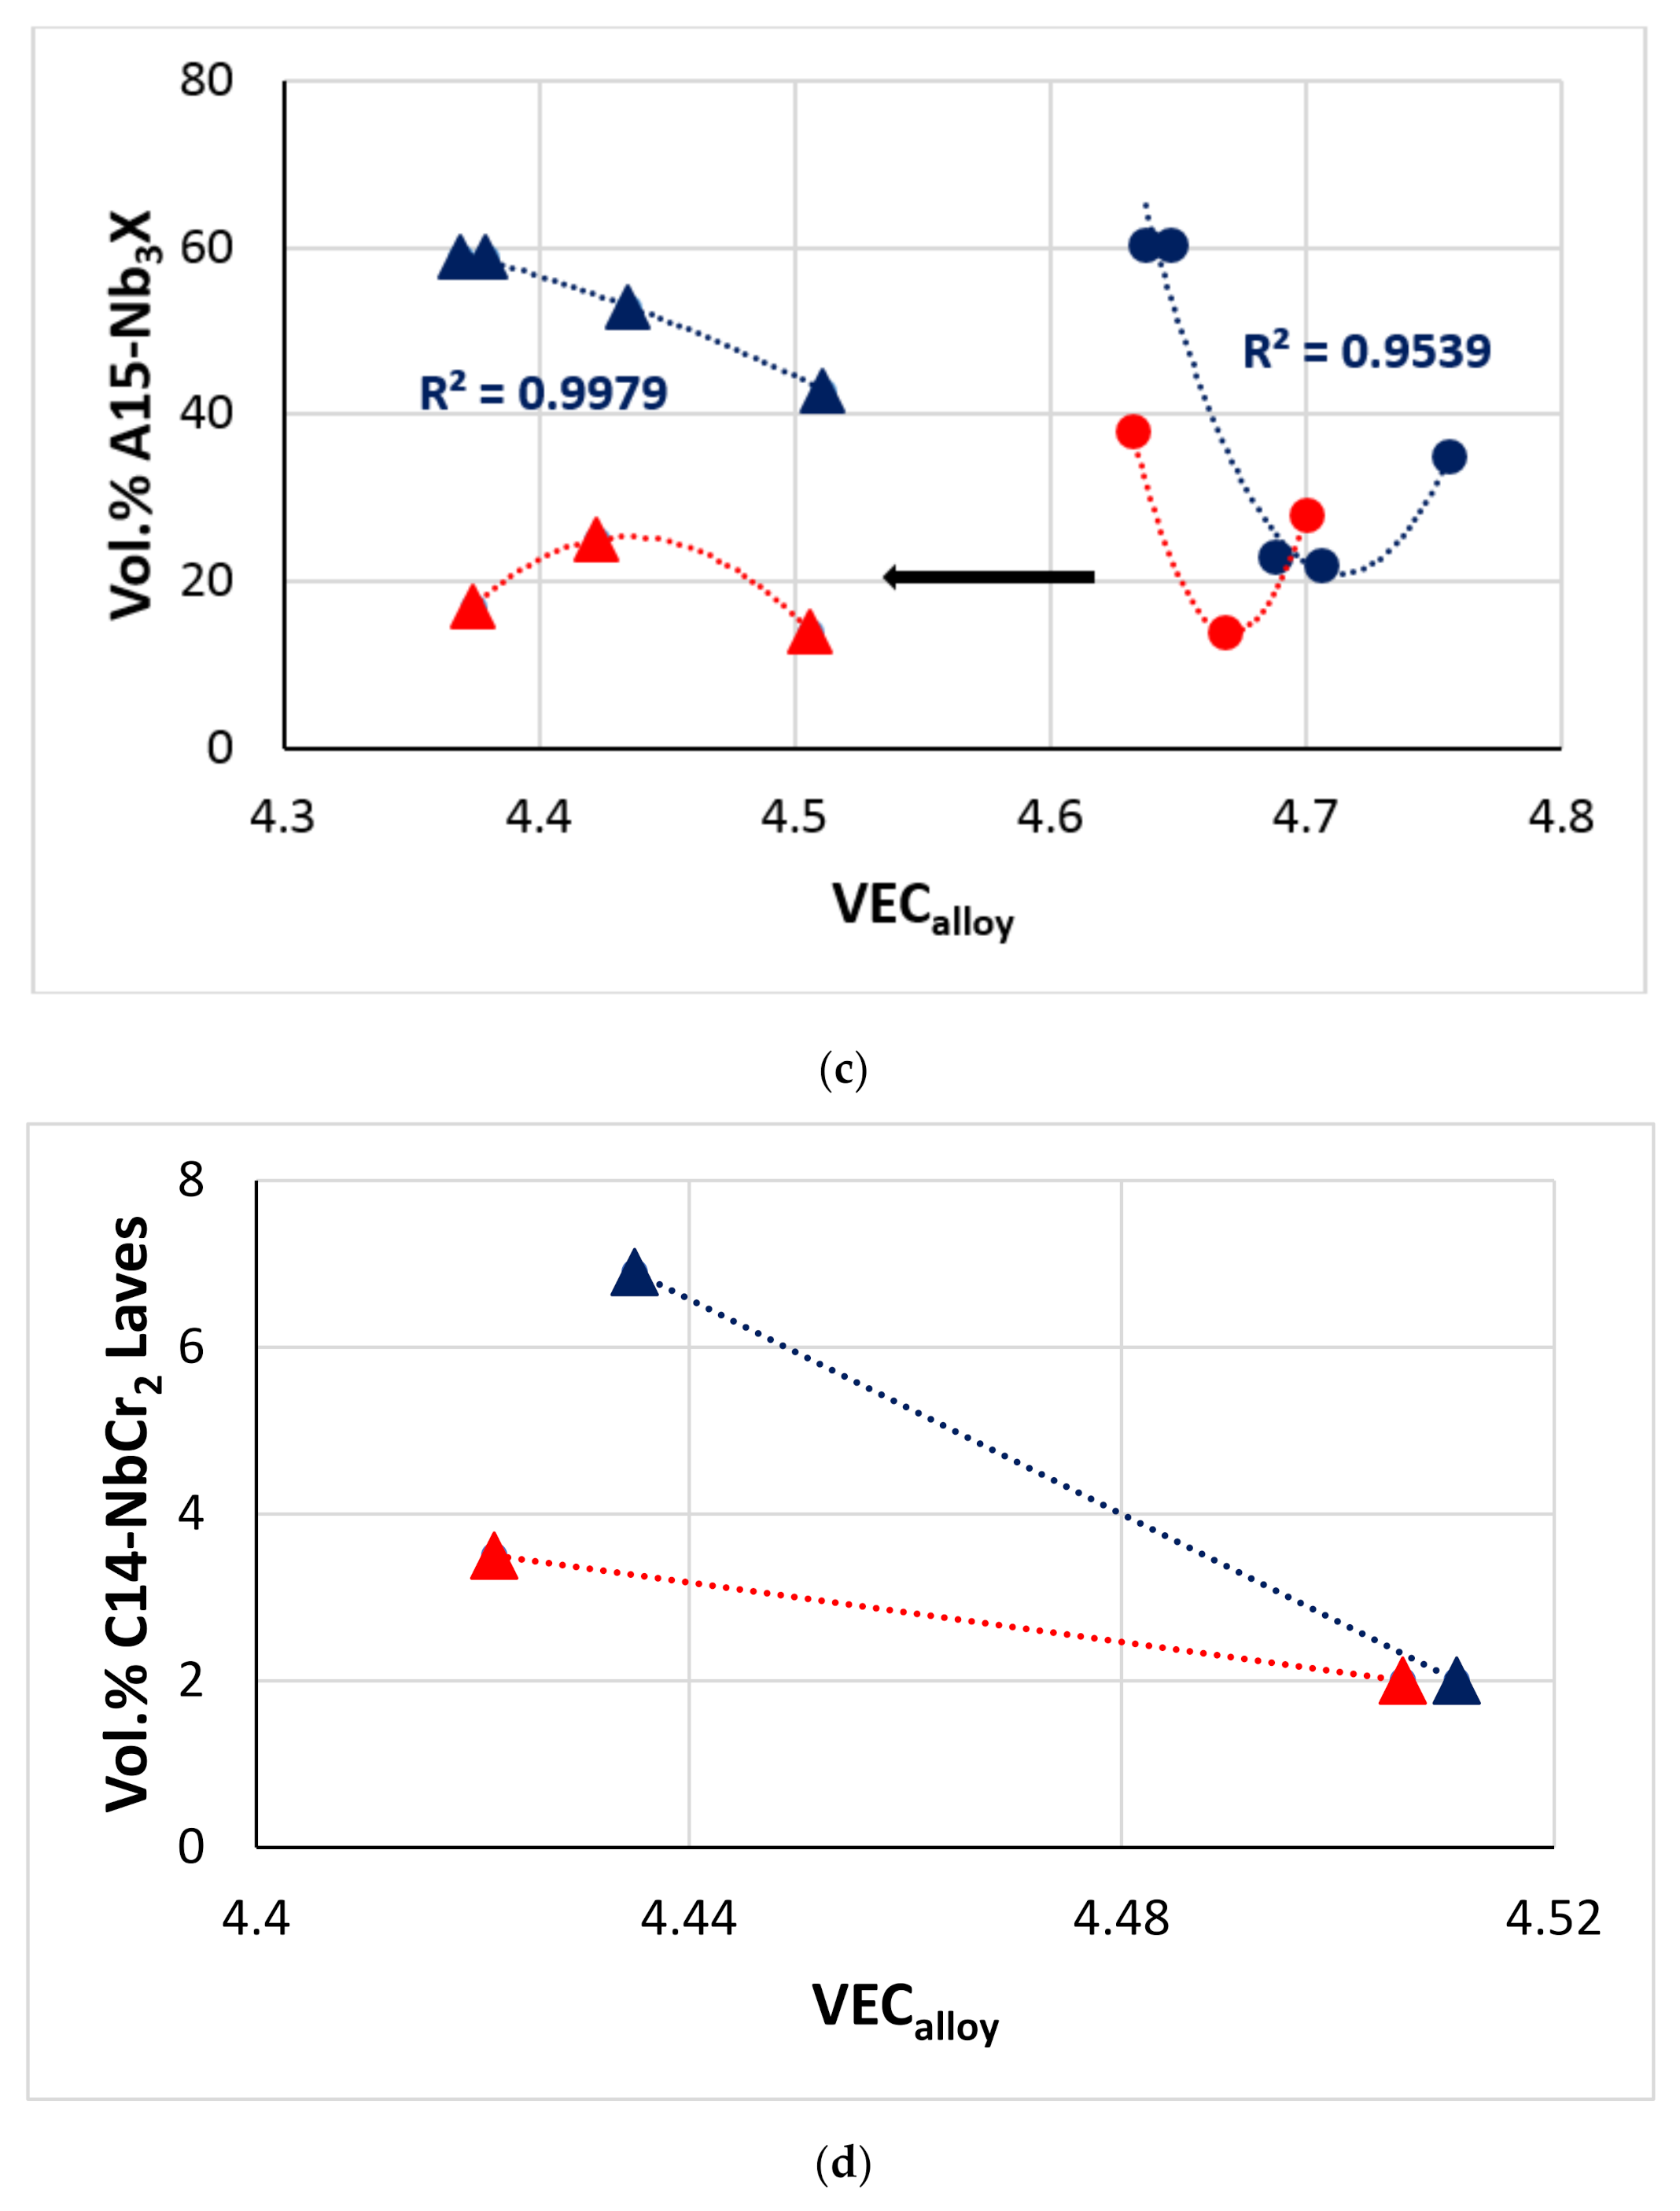
4.2.6. The A15-Nb3X Compound

The addition of Sn promoted the formation of Nb3Sn in the alloys Nb-18Si-5Sn (NV9) and Nb-24Ti-18Si-5Sn (NV6) [39], where the Nb3Sn was present in all parts of the ingot of each alloy. However, the addition of Hf in the alloys EZ1 [26] and EZ2, despite the fact that it did not completely destabilize the A15-Nb3X, essentially rendered its formation sensitive to cooling rate, probably due to the fact that Hf affected the Si+Sn and Si/Sn values that control its formation. On the other hand, Al addition not only promoted the formation of the A15-Nb3X (EZ1 vs. EZ7 [26]) but actually reversed the effect that Hf had on it, by stabilizing the formation of the A15-Nb3X to most parts of the as-cast ingots and also by increasing the vol.% of this phase (EZ1 vs. EZ4 [26], EZ2 vs. EZ5), indicating that its effect on the partitioning of Sn (and thus the Si + Sn + Al and Si/(Sn + Al) values) between the solid phases and the melt was stronger than that of Hf. As a matter of fact, the Si + Sn + Al concentration in the Al-containing alloys EZ4, EZ5, and EZ7 was higher by about 2 at.% (see Table 8 and Table 9). A similar effect to that of Al was seen with the addition of Cr in the alloys Nb-18Si-5Cr-5Hf-5Sn (EZ3 vs. EZ1 [26]) and Nb-24Ti-18Si-5Cr-5Hf-5Sn (EZ6 vs. EZ2), the presence of which resulted in the stabilization of the A15-Nb3X in all areas of the as-cast ingots (Table 9). Thus, it was expected that when Al and Cr were present simultaneously, as in the case of the alloy EZ8, the A15-Nb3X would be stabilized in all parts of the ingot. This was confirmed by the experimental results for EZ8-AC. Furthermore, the increased vol. % of A15-Nb3X in EZ8-AC was in agreement with the results for the alloys EZ1 to EZ7 [26].
It should be noted that for the alloys of this work, the minimum concentration of Ti in the A15-Nb3X (about 24.9 at.%) corresponded to Si = 4.9 at.%, Sn = 11.26 at.%, that is, the chemical composition of the A15-Nb3X with the minimum Ti content was 58.9Nb-24.9Ti-4.9Si-11.3Sn, with Si+Sn sum and Si/Sn ratio of, respectively, 15.2 at.% and 0.43, in good agreement with the Si, Sn, and Ti concentrations in the cast alloys EZ5, EZ6, and EZ8.
Figure 16 shows correlations between Hf, Si, Sn, and Ti concentrations in A15-Nb3X compounds in the alloys of this work. Note the similar trends exhibited by the alloys EZ2 and EZ6 (green and red data) and the alloys EZ5 and EZ8 (brown and blue data), and remember the addition of Cr in EZ6, and that Al was present in both EZ5 and EZ8. In all the alloys, as the Hf content in A15-Nb3X increased, that of Ti decreased (Figure 16a), but the trends of Hf vs. Sn and Ti vs. Sn were opposite for the alloys EZ5 and EZ8 (as Hf increased, the Sn content increased too (Figure 16b), and as Ti decreased, the Sn content increased (Figure 16c)) and the alloys EZ2 and EZ6 (Figure 16b,c). Note also that the Sn and Si+Sn content of the A15-Nb3X in the latter alloys was higher than in the former (Figure 16b–d), but with the Si+Sn concentration in a very narrow range (18.2 to 18.8 at.%, Figure 16d). Furthermore, the Nb concentration of the A15-Nb3X decreased significantly with increasing Ti/Hf ratio in the Al-free alloys (Figure 16e).

4.2.7. C14-NbCr2 Laves Phase

The <Cr> = Cr + Al + Si + Sn content of the C14-NbCr2 Laves phase in the cast and heat-treated alloys of this work was in agreement with other work on RM(Nb)ICs [13,50]. Figure 17 shows the correlation between VEC and Cr content of the C14-NbCr2 Laves phase and the average atomic size <R>, with the ratio of the average atomic sizes of elements that substitute Nb or Cr in the Laves. The two correlations are in agreement with [13].

4.2.8. Vol.% of Phases

Correlations of the vol.% of phases in RM(Nb)ICs with/without Ti addition with VECalloy are shown in the Figure 18. Notice (i) that Al, Cr, Hf, Si, Sn, and Ti are key alloying additions in RM(Nb)ICs for improving oxidation and for controlling strength, fracture toughness, and creep (e.g., [32,33,51,52,53,54]); (ii) that the vol.% of Nbss and Nb5Si3 is key for fracture toughness, creep, and oxidation resistance, of which the former and the latter two have a tendency to increase and decrease with increasing vol.% Nbss, respectively, and to decrease and increase with increasing vol.% of Nb5Si3 (e.g., [12,32,55]); (iii) that the C14-NbCr2 Laves phase can improve the oxidation of RM(Nb)ICs but at the expense of their fracture toughness (e.g., [32,56]); (iv) that the A15-Nb3X is key to improving the oxidation of RM(Nb)ICs in the range of temperatures of pest oxidation and at high temperatures [22,23,27]; and (v) that according to NICE, in order to meet the oxidation or creep goal, VECalloy should decrease and increase, respectively [3,12]. In addition, note that the black arrow in the Figure 18a–c shows that the Ti effect is consistent with the improvement of oxidation resistance of RM(Nb)ICs owing to the corresponding reduction of VECalloy [1,3,11,12,50].
Notice (a) that the vol.% of Nbss, Nb5Si3, A15-Nb3X, and C14-NbCr2 Laves decreased and increased after heat treatment for the former two and the latter two phases, respectively (Figure 18a–d); (b) that similar trends were exhibited by the data for Nb5Si3 and A15-Nb3X in the alloys with/without Ti addition; (c) that up to about (i) 30% Nbss could be stable without Al and Cr addition in the alloy EZ2 (Figure 18a), and (ii) 40% Nb5Si3 and 7% C14-NbCr2 Laves could be stable in the alloy EZ8 with simultaneous Al and Cr addition (Figure 18b,d); (d) that the vol% of A15-Nb3X significantly increased after heat treatment in Cr-free alloys with Al addition and with/without Ti addition (Figure 18c), and that the aforementioned volume fractions correlate with low VECalloy values, which is an essential requirement for improved oxidation resistance according to NICE [1,3,12]. In other words, the data would suggest that with Ti, Hf, Si, Sn, and Al or Cr additions, the oxidation of RM(Nb)ICs and RM(Nb)ICs/RCCAs (note that the alloy EZ8 is also a RM(Nb)IC/RCCA alloy) can be improved owing to the decrease of VECalloy. It should be noted (i) that improved oxidation resistance in the pest temperature range was confirmed for all the heat-treated alloys of this work, which did not pest and did not suffer from scale spallation; and (ii) that in oxidation at 1200 °C of the alloys with Al and/or Cr addition, their scales spalled off, similarly to other Sn-containing RM(Nb)ICs [22,23] (oxidation data is not included in this paper).

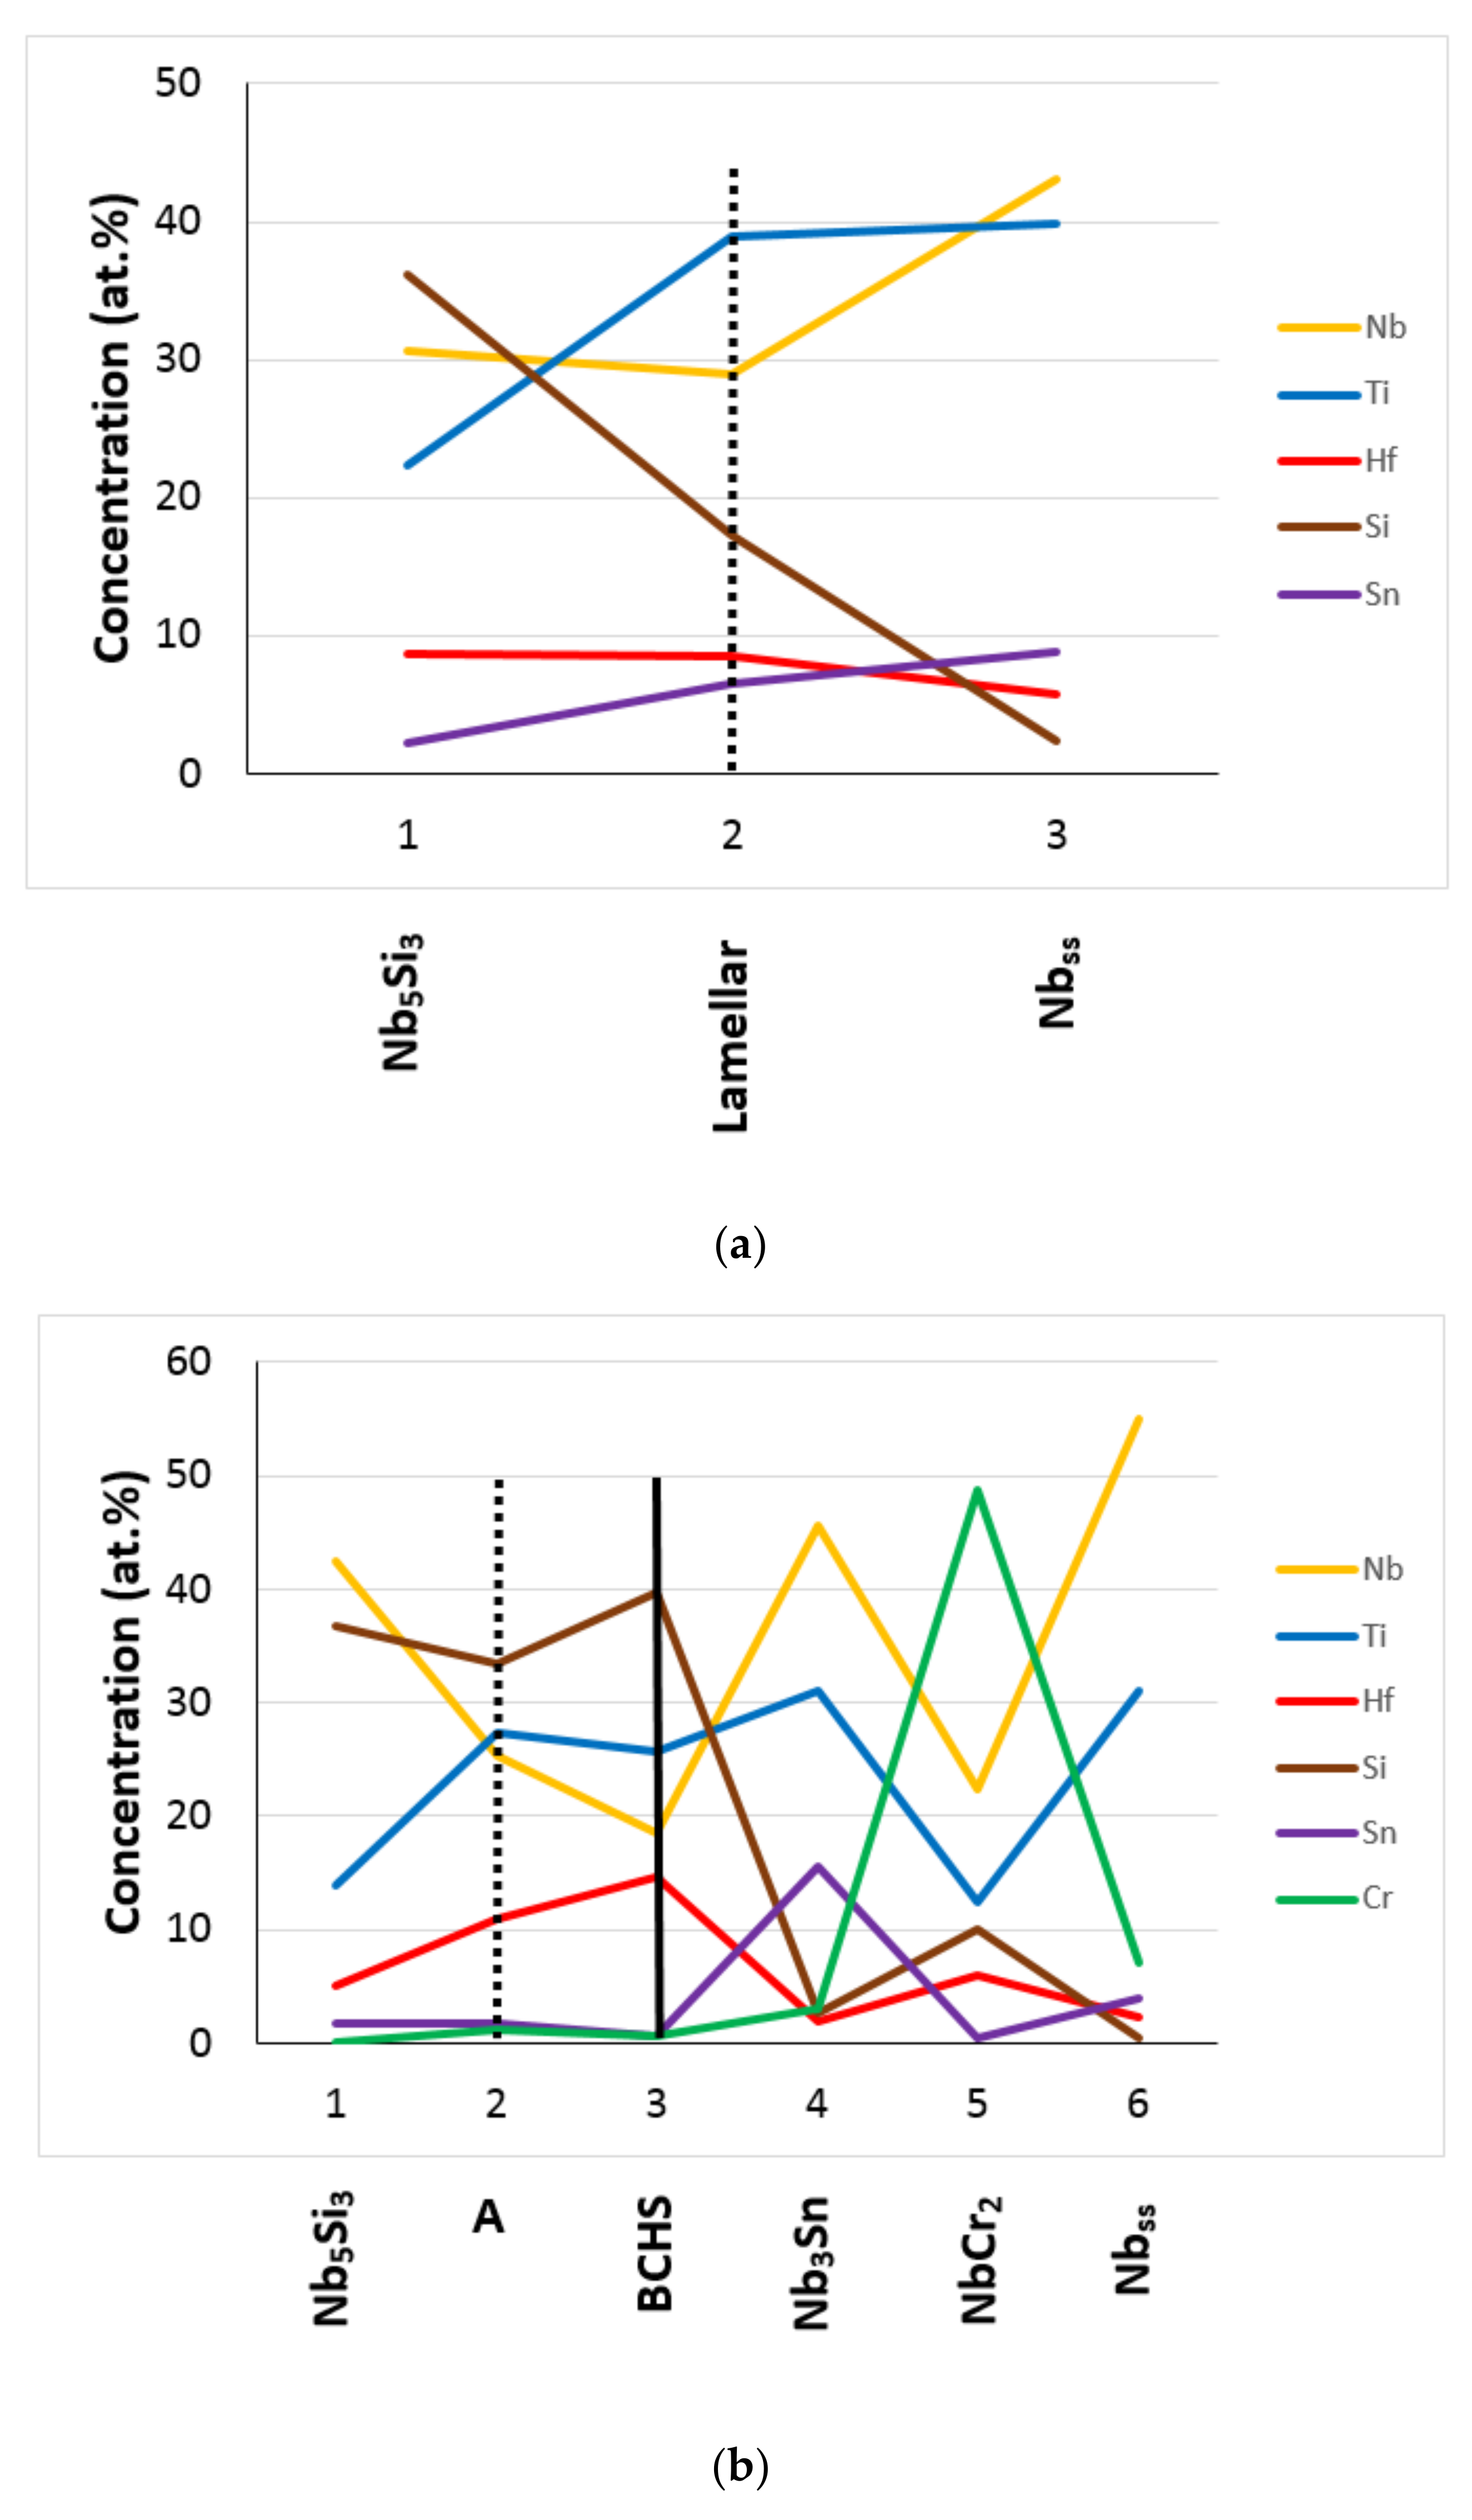
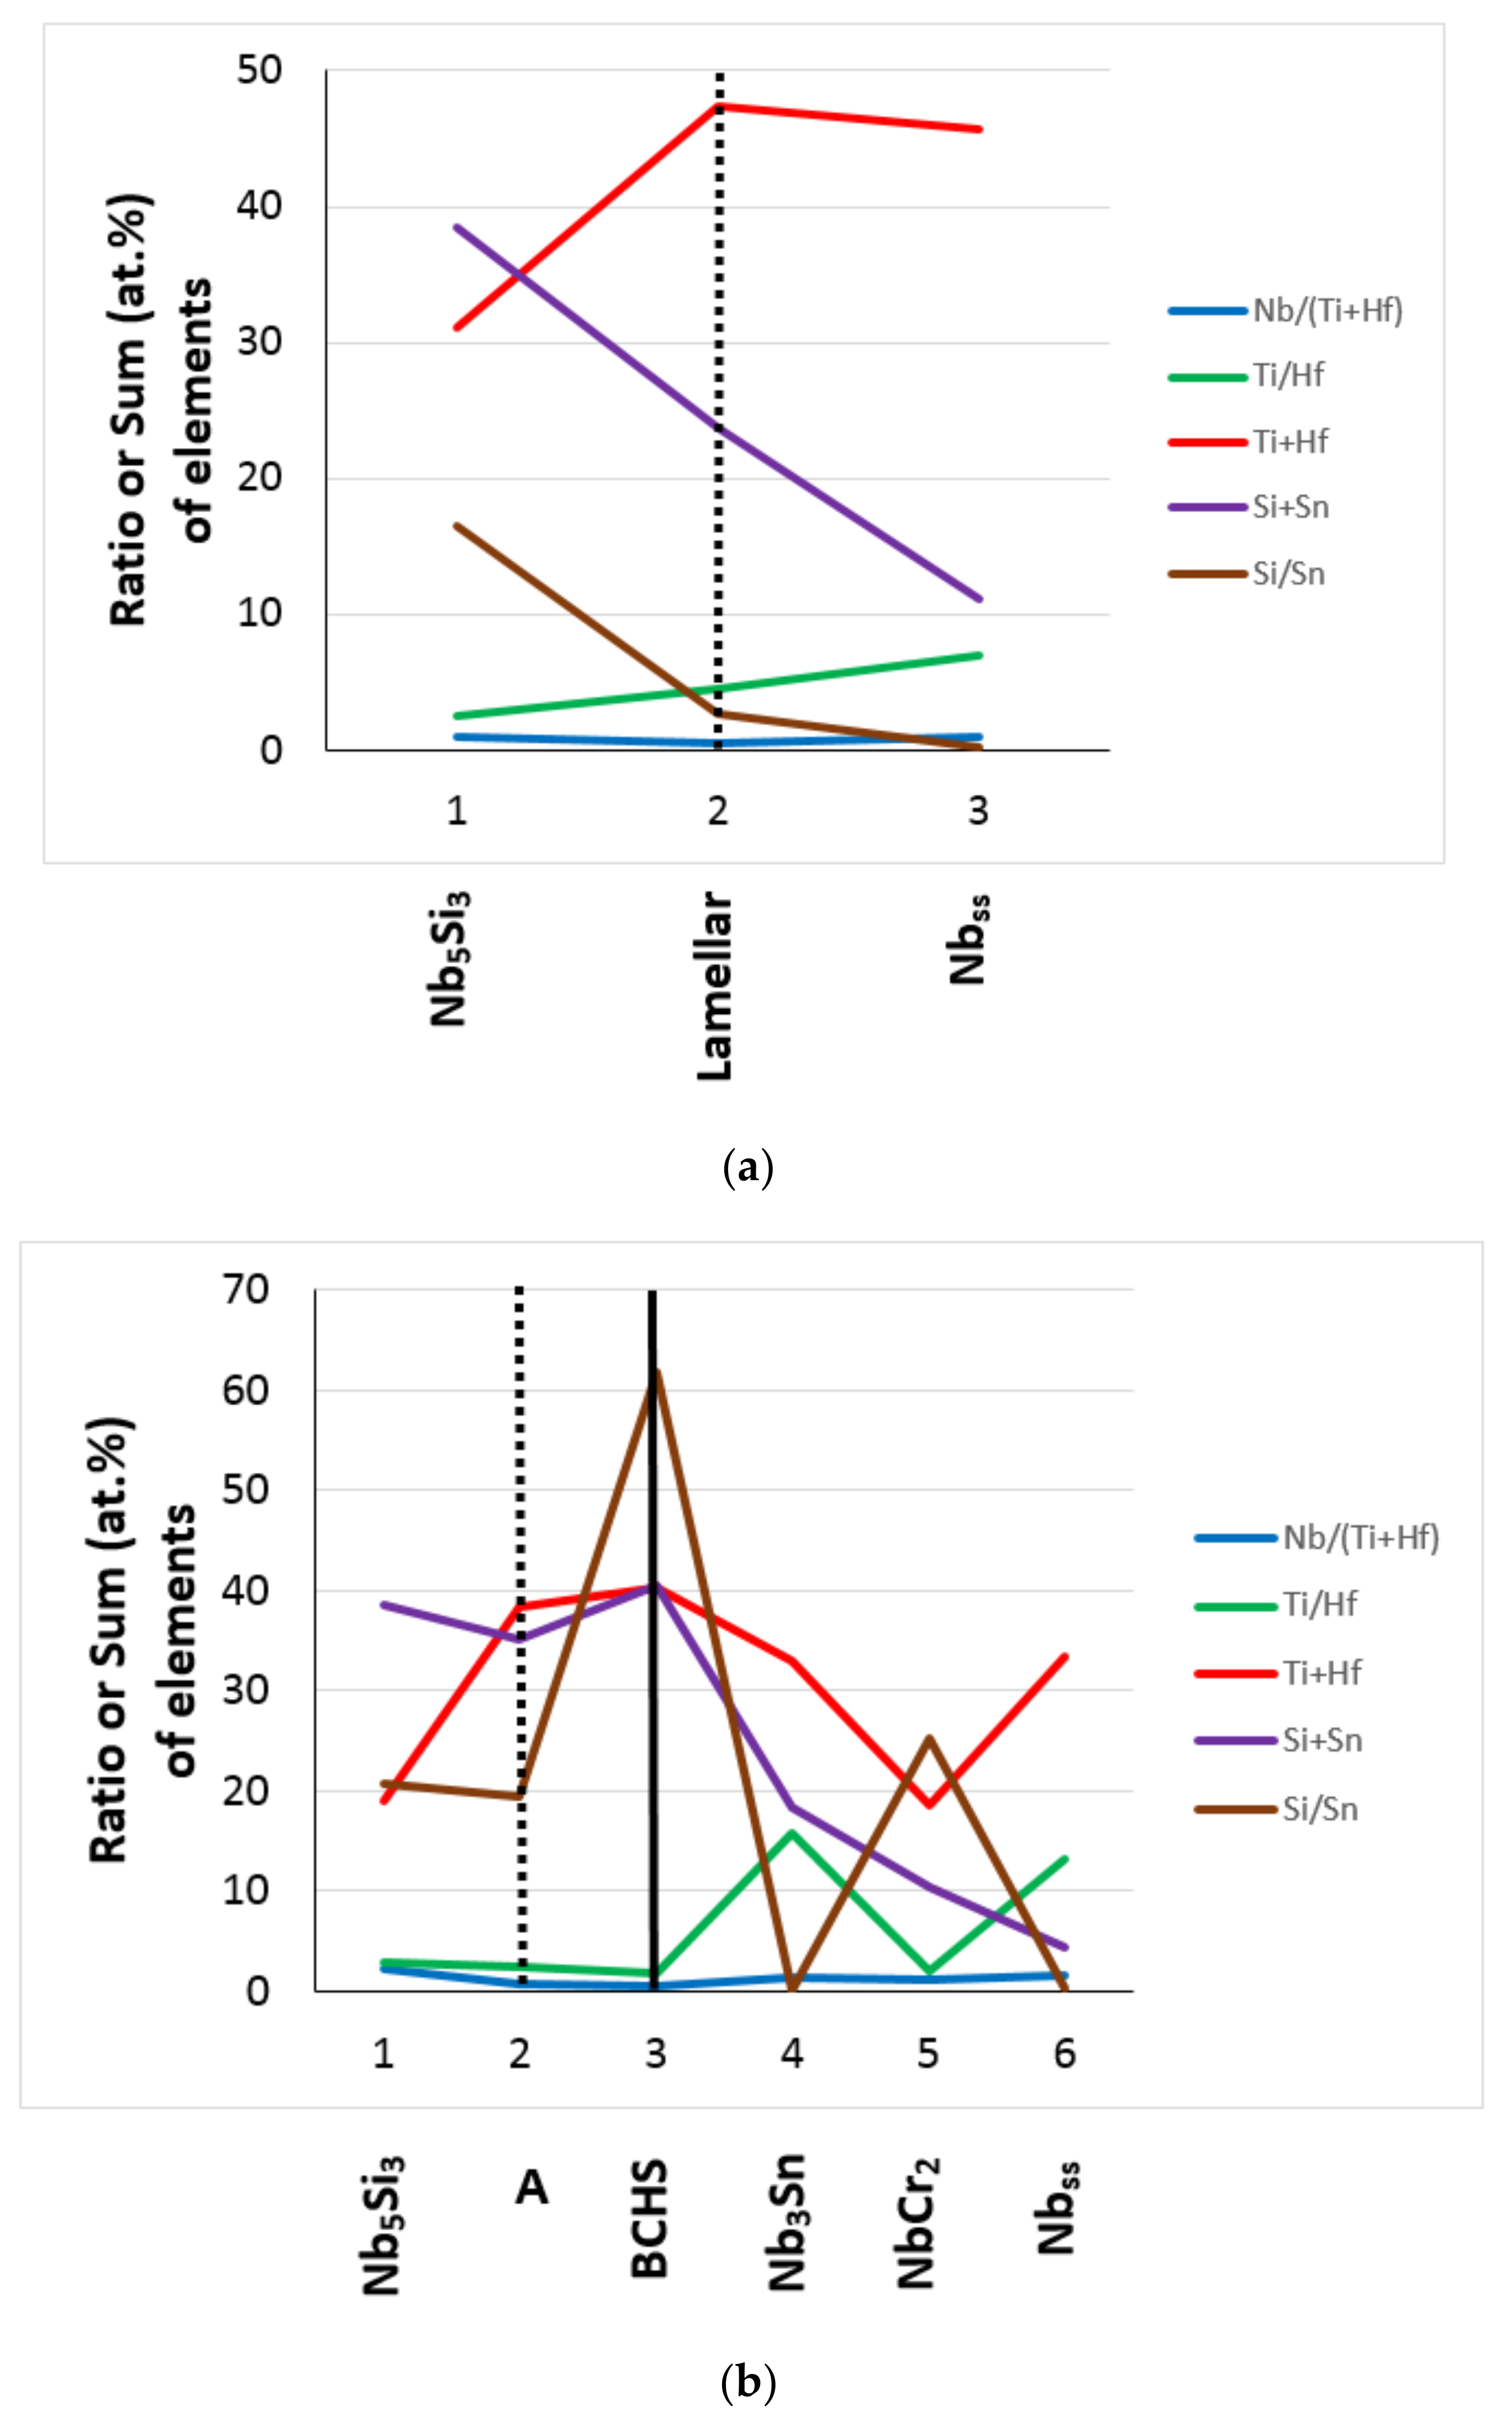
4.2.9. Partitioning of Solutes and Solidification of the Alloys

The synergy of Hf and Sn in RM(Nb)ICs with/without Ti addition not only made the characterization of the microstructures difficult (this work and [26]) but also promoted (i) different types of Nb5Si3 in the microstructure (meaning tetragonal α or βNb5Si3 or hexagonal γNb5Si3, Table 3) and/or (ii) microstructures that arise from phase transformations that involve the two key phases, namely Nb5Si3 and Nbss. The melt solidified following different solidification paths in different parts of the ingot.
Three different microstructures were observed in EZ5-AC owing to the sensitivity of the solidification of this alloy to the partitioning of solutes in different parts of the solidifying melt. The βNb5Si3 was the primary phase. The microstructure in the bulk of EZ5-AC consisted of primary βNb5Si3 surrounded by Nbss+Nb5Si3 eutectic and the A15-Nb3X. As the primary βNb5Si3 formed, the melt became poorer in Si and richer in Ti, and when the melt concentration reached Si + Al + Sn of about 23 at.%, the eutectic formed. As the melt became poorer in Si, the Si + Al + Sn concentration reached about 20.6 at.%, and the A15-Nb3X formed. It is suggested that the solidification path in the bulk of EZ5-AC was L → L + βNb5Si3 → L + βNb5Si3 + γNb5Si3 + [Nbss + Nb5Si3]eutectic → βNb5Si3 + γNb5Si3 + [Nbss + Nb5Si3]eutectic + A15-Nb3X + αNb5Si3. The Si+Al+Sn concentration of the Nb5Si3 and the Hf-rich Nb5Si3 was about 37.6 at% and 38.5 at.%, respectively. These values were very close to the ones observed in the bulk of the alloy EZ4-AC [26]. The Ti addition in EZ5 had a significant effect on the partitioning of Hf, and the concentrations of Ti and Hf increased by, respectively, about 8.1 at.% and 6.3 at.% in the Hf-rich Nb5Si3, leading to Nb/(Ti + Hf) about 0.7, which indicated hexagonal γNb5Si3 [24]. The Ti addition in EZ5 also affected the composition of the Nbss, in which the average Si + Al + Sn concentration was about 15.9 at.%, that is, about 5 at.% higher than in the Nbss in the alloy EZ4-AC [26], and Si/(Al + Sn) about 0.2 (the same as in the alloy EZ4-AC, see Table 8). The Sn content in A15-Nb3X was also affected by the addition of Ti, and in the bulk of EZ5-AC, it was about 4 at.% higher than in the alloy EZ4-AC.
In the top of EZ5-AC, the microstructure consisted of primary Nb5Si3 surrounded by the Nbss. There were Hf-rich areas in the βNb5Si3, with the core exhibiting a darker contrast owing to the lower Hf concentration. As the primary βNb5Si3 formed, the melt became poorer in Si + Al + Sn, and when the latter concentration reached about 16 at.% and Si/(Al + Sn) about 0.2, the Nbss formed. It is suggested that the solidification path in the top of EZ5-AC was L → L + βNb5Si3 → βNb5Si3 + Nbss → βNb5Si3 + Nbss + αNb5Si3. In the bottom of EZ5-AC, the microstructure consisted of the Nb5Si3, Nbss, and A15-Nb3X phases. The βNb5Si3 was the primary phase. It is suggested that the solidification path in this part of the ingot was L → L + βNb5Si3 + γNb5Si3 → L + βNb5Si3 + γNb5Si3 + A15-Nb3X + Nbss → βNb5Si3 + γNb5Si3 + αNb5Si3 + A15-Nb3X + Nbss.
Two different microstructures were observed in EZ8-AC owing to the sensitivity of the solidification of this alloy to the partitioning of the solutes in the different areas of the ingot. The alloy EZ8 was hypereutectic in the top and bulk of the ingot and solidified with the βNb5Si3 as its primary phase. As the primary βNb5Si3 formed, the melt became richer in Ti and Hf, and Hf-rich Nb5Si3 formed. The solubility of Cr and Sn in particular, and of Al in the Hf-rich Nb5Si3, was small (Table S4 in the Supplemental Data). Thus, the melt surrounding the βNb5Si3 became richer in Al, Cr, and Sn and leaner in Si and Hf. When the composition of the melt reached Si + Al + Sn about 20.9 at.%, the A15-Nb3X formed. The Hf and Si were rejected into the melt, which became rich in these elements. When the Si/(Sn+Al) ratio in the melt reached about 0.2, the Nbss formed. Then, the melt became richer in Si, and when its composition reached Cr + Si + Al + Sn about 49 at.%, a eutectic between the NbCr2 Laves phase and the Nbss grew. The aforementioned eutectic formed in between these phases as the solutes partitioned between the solidifying intermetallics and the solid solution. The presence of Nbss, αNb5Si3, γNb5Si3, and Hf-rich Nb5Si3 in EZ8-AC is in agreement with [16]. The C14-NbCr2 Laves phase was not observed in [16] owing to the low Cr concentration in the Nb-25Ti-16Si-8Hf-2Al-2Cr-xSn (x = 2 to 8 at.%) alloys. The A15-Nb3X was not observed in the alloy with x = 5 at.% Sn, but was stable after the heat treatment [16].
According to the XRD data (Figure S4 in the Supplemental Data), both αNb5Si3 and βNb5Si3 were present in EZ8-AC, which suggests that during the cooling down of the ingot, some βNb5Si3 transformed to αNb5Si3. In addition, during the cooling down of the EZ8-AC ingot, a lamellar microstructure formed between the Hf-rich Nb5Si3 silicide and the A15-Nb3X (see A in Figure 10). It is suggested that the solidification of EZ8 was L → L + βNb5Si3 → L + βNb5Si3 + γNb5Si3 → L + βNb5Si3 + γNb5Si3 + A15-Nb3X → L + βNb5Si3 + γNb5Si3 + A15-Nb3X + Nbss → L + βNb5Si3 + γNb5Si3 + A15-Nb3X + Nbss + [NbCr2 + Nbss]eutectic → βNb5Si3 + γNb5Si3 + A15-Nb3X + Nbss + [NbCr2 + Nbss]eutectic + αNb5Si3.
In EZ2-AC, the primary phase was the βNb5Si3, and as the liquid became poorer in Si, the Si+Sn concentration reached about 22 at.%, and the eutectic formed around the primary βNb5Si3. It is suggested that the solidification path of EZ2-AC in the top and bulk of the ingot (where the A15-Nb3X was not observed) was L → L + βNb5Si3 → L + βNb5Si3 + [Nbss + Nb5Si3]eutectic → βNb5Si3 + [Nbss + Nb5Si3]eutectic + αNb5Si3. In the bottom of the ingot the solidification path was L → L + βNb5Si3 → L + βNb5Si3 + A15-Nb3X → Nb5Si3 + A15-Nb3X + [Nbss + Nb5Si3]eutectic.
The EZ6-AC solidification started with the βNb5Si3 silicide, which was subsequently surrounded by Ti-rich Nbss. The Hf-rich Nb5Si3 was in the parts with the higher Ti concentration. The A15-Nb3X was formed next to the Nbss, while the C14-NbCr2 Laves phase grew in between the A15-Nb3X and the Nbss or near the Nbss. It is suggested that the solidification path of EZ6-AC was L → L + βNb5Si3 → L + βNb5Si3 + Nbss → L + βNb5Si3 + γNb5Si3 + Nbss + A15-Nb3X → L + βNb5Si3 + γNb5Si3 + Nbss + A15-Nb3X + [NbCr2 + Nbss]eutectic → βNb5Si3 + αNb5Si3 + γNb5Si3 + A15-Nb3X + Nbss + [NbCr2 + Nbss]eutectic.
Owing to the partitioning of solutes, a lamellar microstructure was formed in the bulk of EZ2-AC and microstructure A in EZ6-HT2. The chemical composition of the former corresponded to high-entropy or complex concentrated lamellar microstructure (see Section 3.1) and coexisted with “conventional” phases [11]. The chemical composition of microstructure A and the bright contrast phase (BCP, see Section 3.8) also corresponded to complex concentrated microstructure [11]. These microstructures are considered further in the next two sections.

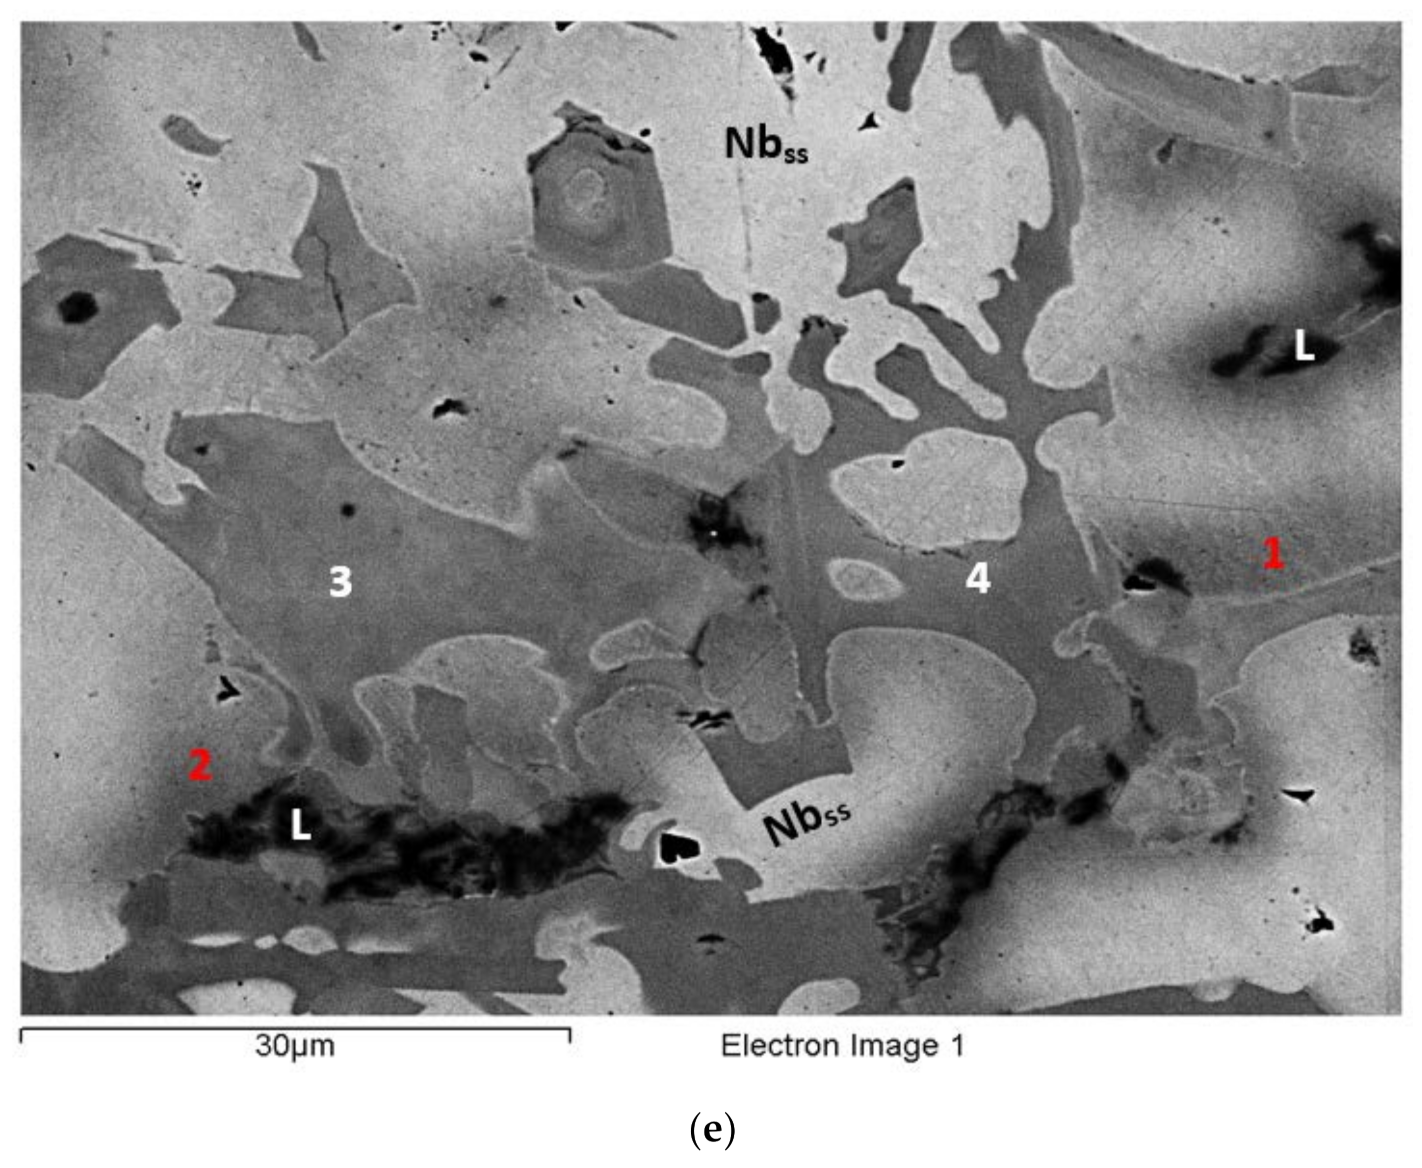
4.2.10. Eutectic and Lamellar Microstructures in EZ2-AC

The case of the Nbss + Nb5Si3 eutectic and the lamellar microstructures observed only in the bulk of EZ2-AC (Figure 1 and Figure 2) requires attention. The chemical composition of said phases will be taken into account. In EZ2-AC, there was Ti-rich Nbss, similarly to the alloy YG3-AC (see Table 6 for nominal composition), but in EZ2-AC, the concentration of Ti in the Nbss was higher than that of Nb (i.e., the Ti-rich Nbss in EZ2 had Nb/Ti < 1), and the concentrations of Sn and Hf in the Nbss increased with the Ti concentration. It should be noted that Ti-rich Nbss was not observed in the alloy NV6-AC (Nb-24Ti-18Si-5Sn [39]), which would suggest that in the presence of Sn, the synergy of Ti and Hf had a strong effect on the partitioning of Ti to the Nbss.
In EZ2-AC, the Ti and Hf concentrations in the Nb5Si3 were similar to those in YG3-AC [25]. In the latter alloy, the Hf-rich Nb5Si3 corresponded to hexagonal γNb5Si3 according to its Nb/(Ti + Hf) ratio, whereas in EZ2-HT, the Hf- and Ti-rich tetragonal Nb5Si3 that was already present in EZ2-AC became richer in both Ti and Hf after the heat treatment, and according to its Nb/(Ti + Hf) ratio (0.7), it was hexagonal γNb5Si3 [24]. In EZ2-AC, the average Si+Sn concentration in Nb5Si3 was 38.0 at% and did not change significantly in EZ2-HT (38.5 at.%), similarly with EZ1-HT [26]. The Ti addition in EZ2 did not change the solubility of Sn in the silicide, which was similar to that in EZ1-AC, but increased the Hf concentration. In EZ2-AC, in the Hf-rich Nb5Si3, the Ti concentration increased by about 4.6 at.% compared with the “normal” Nb5Si3, but the Si+Sn, Si, and Sn concentrations did not change.
It was suggested [25] that the Hf-rich Nb5Si3 that formed in YG3-HT was the product of the eutectoid transformation tP32 Nb3Si → Nbss + Hf-rich (hP16) Nb5Si3 and that the synergy of Ti and Hf in YG3 led to the replacement of the eutectoid transformation tP32 Nb3Si → Nbss + (tI32) αNb5Si3 with the alternative eutectoid phase transformation given above, in which the Nb5Si3 had the hexagonal (hP16) structure instead of the tetragonal (tI32) one [24]. As the Nb3Si was not formed in EZ2, the above phase transformations cannot account for the presence of γNb5Si3 and αNb5Si3.
In EZ2-AC, there was tetragonal βNb5Si3 and αNb5Si3 according to the XRD data (Figure S1 in the Supplemental Data). The synergy of Ti and Sn in the alloy NV6 (Nb-24Ti-18Si-5Sn) enhanced the transformation βNb5Si3 → αNb5Si3 [39]. The formation of αNb5Si3 in EZ2-AC was attributed to the presence of both Ti and Sn in the alloy. Furthermore, the addition of Ti in EZ2 decreased the liquidus of the alloy, and thus, as the homologous temperature increased, the solute diffusivities increased during solid-state cooling. In other words, in EZ2-AC, the βNb5Si3 was the primary phase and the βNb5Si3 → αNb5Si3 phase transformation had started during the cooling of the ingot.
Figure 2 shows (a) a lamellar microstructure that grew into a blocky faceted Nb5Si3 grain (see microstructure on the left of number 17 in Figure 2b, and note that outer parts of some Nb5Si3 were richer in Hf with lower Ti/Hf ratio compared with the inner darker contrast parts, Figure 1a,b), with a lamellar microstructure (numbers 1, 2, 3, and 4 in Figure 2a) that connected with (was adjacent to) Nb5Si3 grains (numbers 6 and 7 in Figure 2a).
The lamellar microstructure (i) was significantly richer in Ti and Hf than the Nbss+Nb5Si3 eutectic in EZ2-AC and (ii) had higher and lower Ti + Hf sum and Nb/(Ti + Hf) ratio, respectively, than the eutectic. Furthermore, the Nb5Si3 associated with the lamellar microstructure (e.g., numbers 6 and 7 in Figure 2a) was (iii) richer in Ti and Hf and had tetragonal structure like the tetragonal, and poorer in Ti and Hf, “normal” Nb5Si3. In addition, the lamellar microstructure and the Nb5Si3 associated with it had chemical composition consistent with high-entropy or complex concentrated phases [11]. Moreover, the Nbss near the lamellar microstructure (e.g., numbers 11, 12, 15, 17, and 18 in Figure 2) was (iv) richer in Ti and Hf compared with the Nbss away from the lamellar microstructure, and (v) had a Nb/(Ti + Hf) ratio close to that corresponding to the minimum Ti + Hf and Nb concentrations in the Nbss (Figure 15a). Chemical analysis of the individual phases in the lamellar microstructure was not possible.
Figure 19a shows the average solute concentrations from Nb5Si3 to the lamellar microstructure to the Nbss and Figure 20a shows the ratios or sums of solutes from Nb5Si3 to the lamellar microstructure to the Nbss. From the tetragonal Nb5Si3 to the lamellar microstructure, (a) the Ti concentration increased, the Hf essentially did not change, and thus the Ti + Hf and Ti/Hf increased; (b) the Nb decreased slightly, and thus the Nb/(Ti + Hf) essentially did not change; and (c) the Si content decreased significantly, and the Sn increased slightly, and thus the Si+Sn and Si/Sn decreased. From the lamellar microstructure to the Nbss, (d) the Ti and Hf increased and decreased slightly, respectively, while the Ti + Hf decreased slightly but the Ti/Hf continued to increase; (e) the Nb increased significantly, but the change of Nb/(Ti + Hf) was marginal; and (f) the increase of Sn and decrease of Si continued, and thus the Si + Sn sum and the Si/Sn ratio continued to decrease, the latter less than the former.
In other words, owing to the partitioning of solutes between the Nbss and Nb5Si3, in particular the partitioning of Ti and Hf, a phase transformation started from the Ti- and Hf-rich complex concentrated tetragonal Nb5Si3 that resulted in a complex concentrated lamellar microstructure, namely the eutectoid transformation tetragonal Nb5Si3 → Nbss + [Nb5Si3]Hf and Ti rich. The key solutes in this transformation were Hf and Ti. In the lamellar microstructure (i) the contrast of the Nbss was similar to that of the nearby solid solution, meaning the solid solution was Ti and Hf rich, and (ii) the contrast of the Nb5Si3 was similar or slightly brighter than that of the silicide adjacent to the lamellar microstructure. Brighter contrast Nb5Si3 means that it is richer in Hf silicide, which could be hexagonal γNb5Si3 depending on its Nb/(Ti + Hf) ratio [24]. The synergy of Hf and Ti with Sn in the alloys of this work promoted the γNb5Si3 (Figure 12). Thus, it is suggested that the Hf and Ti silicide in the lamellar microstructure was hexagonal γNb5Si3, that is, the aforementioned eutectoid phase transformation was Hf- and Ti-rich tetragonal αNb5Si3 → Nbss + γNb5Si3 with orientation relationships between Nb and αNb5Si3 and Nb and γNb5Si3 [29,57].
Now consider the lamellar microstructure on the left of number 17 in Figure 2b. It is suggested that the transformation nucleated at the interface between the Hf- and Ti-rich Nb5Si3 and the Ti- and Hf-rich Nbss (note that the Ti-rich Nbss was also richer in Hf than the “normal” Nbss). The transformation front moved in a direction from the top right-hand corner to the bottom left-hand corner, and it would have stopped when the chemical composition of the Nb5Si3 grain was similar to that of the dark blocky Nb5Si3.
The lamellar microstructures were not stable in EZ2-HT, which would suggest that the proposed phase transformation had been completed after 100 h at 1500 °C and the hexagonal Hf-rich Nb5Si3 was a stable phase in EZ2, in agreement with the XRD data (Figure S1 in the Supplemental Data).
Eutectic and lamellar microstructure similar to those in EZ2-AC were also observed in the alloy NV1-AC (Nb-23Ti-5Si-5Al-5Hf-5V-2Cr-2Sn, [31]). In NV1-AC, the Nb5Si3 that was associated with the lamellar Nbss + Nb5Si3 had Ti + Hf = 35 at.% and Nb/(Ti + Hf) = 0.67, and was CC hexagonal Nb5Si3, whereas the lamellar microstructure, the composition of which corresponded to a CC lamellar microstructure [11], had Ti + Hf about 30 at.%, and Nb/(Ti + Hf) about 1.3. In EZ2-AC, the Nb5Si3 with Nb/(Ti + Hf) = 1 and Ti + Hf = 31.1 at.% (CC tetragonal Nb5Si3) was associated with a lamellar microstructure that was very Ti + Hf-rich (= 47.4 at.%) and had Nb/(Ti + Hf) = 0.6. Thus, comparison of the cast alloys NV1 and EZ2 shows that the Nb5Si3 silicides associated with the lamellar microstructure were different, CC hexagonal in NV1-AC and CC tetragonal in EZ2-AC, and the chemical compositions of the CC lamellar microstructures were also different. The eutectic in EZ2-AC has Ti + Hf = 31.9 at.% and Nb/(Ti + Hf) = 1.4, essentially the same as the lamellar in NV1-AC. The lamellar microstructure in NV1 was the product of a eutectic reaction plus some eutectoid transformation [31].

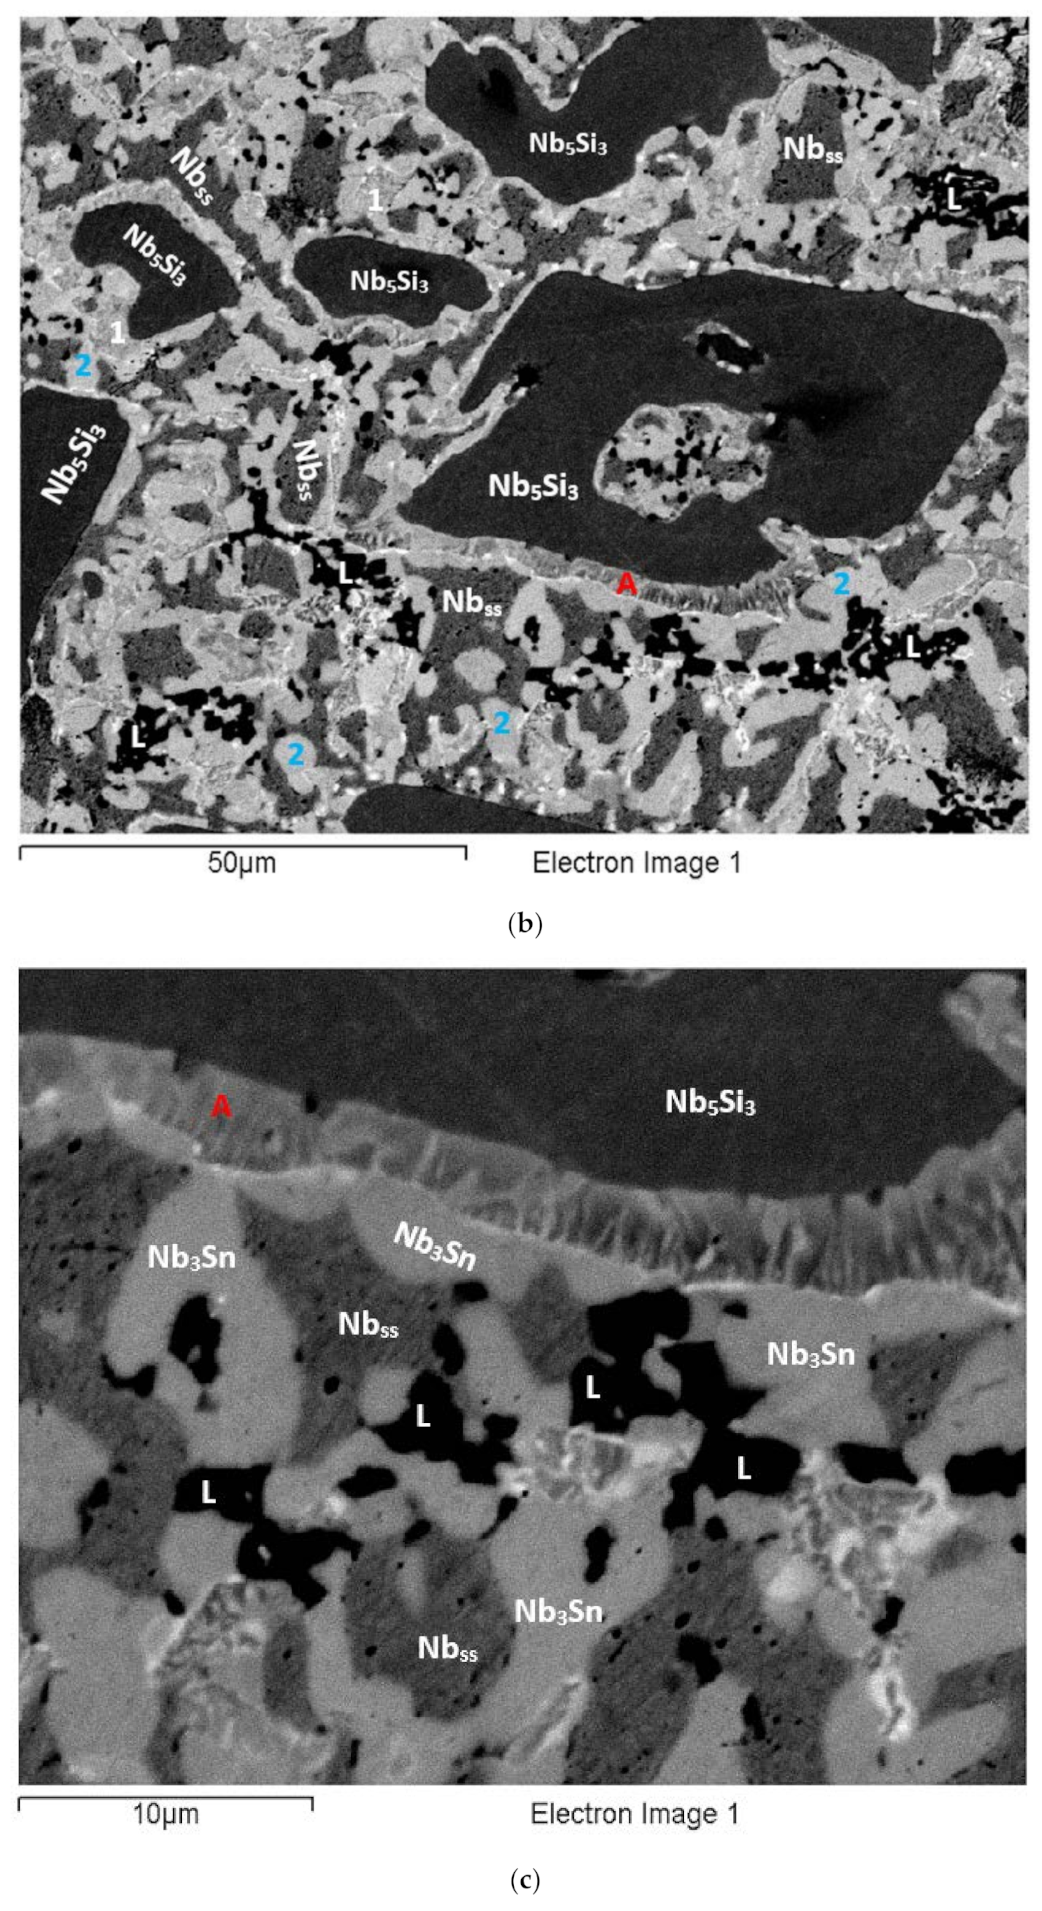
4.2.11. Microstructure A in EZ6-HT

In EZ6-AC, the Nb5Si3 was surrounded by Nbss. The contrast of the Hf-rich Nb5Si3 and the A15-Nb3X in EZ6-HT2 was very similar. The microstructure A formed adjacent to some Nb5Si3 grains but did not surround the whole grain (Figure 8b–d). The Nb5Si3 adjacent to microstructure A had Ti + Hf = 19 at.% and Nb/(Ti + Hf) = 2.25 (i.e., was tetragonal Nb5Si3), and microstructure A had Ti + Hf = 38.3 at.% and Nb/(Ti + Hf) = 0.66. A very thin bright contrast phase (BCP) was formed at the interface of microstructure A with A15-Nb3X (Figure 8c). This was actually bright contrast hexagonal silicide (BCHS). After the BCHS was the A15-Nb3X, and then the C14-NbCr2 Laves and the Nbss (Figure 8b–d). In the EZ6-HT2, the Hf-rich Nb5Si3 formed separate (distinct) grains from the “normal” Nb5Si3 (Figure 8b). The Hf-rich Nb5Si3 had Ti + Hf = 39.1 at.%, and Nb/(Ti + Hf) = 0.56, which were similar to those (a) of the BCHS of microstructure A (40.4 at.% and 0.46, respectively) and (b) the microstructure A (38.3 at.% and 0.66, respectively). The chemical compositions of microstructure A and the BCHS corresponded to complex concentrated phases.
Figure 19b shows the average solute concentrations, and Figure 20b shows the ratios or sums of solutes from Nb5Si3 to the microstructure A, to the BCHS, to the Nb3Sn, to the NbCr2, and to the Nbss. From the tetragonal Nb5Si3, (a) the concentration of Hf increased to A, and then to the BCHS, whereas the concentration of Ti increased to A and then decreased slightly, and the concentration of Nb decreased to A and then to the BCHS, an thus the Nb/(Ti + Hf) and Ti/Hf ratios decreased to A and then to the BCHS, whereas the Ti + Hf sum increased markedly to A and then slightly to the BCHS; (b) the Si concentration decreased to A and then increased to the BCHS, that is, it exhibited the opposite trend compared with Ti, and the Sn concentration decreased after A to the BCHS, and thus both the Si+Sn sum and the Si/Sn ratio decreased to A and increased to the BCHS, with a remarkable increase of the Si/Sn ratio. The tetragonal Nb5Si3 was Cr free, and the Cr concentration increased slightly to A and then decreased to the BCHS. Thus, as microstructure A formed and the solutes partitioned between the Nbss and Nb5Si3, the microstructure became rich in Hf, Si, and Ti, and the BCHS formed.
From the BCHS to the A15-Nb3X, (c) the concentrations of Nb, Ti, Sn, and Cr increased, and those of Hf and Si decreased, and thus the Ti + Hf and Si + Sn sums and the Si/Sn ratio decreased, and the Ti/Hf and Nb/(Ti + Hf) ratios increased. On the other hand, (d) from the A15-Nb3X to the C14-NbCr2 Laves phase, the concentrations of Cr, Si, and Hf increased, and those of Nb, Ti, and Sn decreased, and thus the Ti + Hf and Si + Sn sums and the Ti/Hf ratio decreased, the Si/Sn ratio increased, but the Nb/(Ti + Hf) essentially did not change. In addition, (e) from the Laves phase to the Nbss, the concentrations of Nb, Ti, and Sn increased, and those of Cr, Si and Hf decreased, and thus the Si/Sn ratio and the Si + Sn sum decreased, but the Ti + Hf sum and the Ti/Hf ratio increased, and the Nb/(Ti + Hf) ratio increased slightly. In other words, where the A15-Nb3X was stable, the microstructure was poorer in Hf and Si and richer in Nb, Sn, and Ti, but still poor in Cr compared with the BCHS. In the Cr-, Hf-, and Si-rich areas of the microstructure, the Laves phase was stable, and in the Nb-, Sn-, and Ti-rich areas, the Nbss was stable.
The microstructure A formed in areas of EZ6-HT2 where the Nbss was adjacent to the tetragonal Nb5Si3 prior to the heat treatment. The average composition of this Nbss in EZ6-AC was 45.6Nb-32.4Ti-1.8Si-8.7Cr-4.6Hf-6.9Sn, with Si + Sn = 8.7 at.%, Si/Sn = 0.26, Ti/Hf = 7, Ti + Hf = 37 at.%, and Nb/(Ti + Hf) = 1.23, compared with Si + Sn = 8.6 at.%, Si/Sn = 0.28, Ti/Hf = 7.6, Ti + Hf = 33.7 at.%, and Nb/(Ti + Hf) = 1.5 for the Nbss far away from the Nb5Si3 in EZ6-AC. In other words, the Nbss around tetragonal Nb5Si3 grains on some parts of which the microstructure A had formed was rich in Ti + Hf at the start of HT. In EZ6-HT2, the average chemical composition of the Nbss away from microstructure A was 55.1Nb-31.1Ti-0.5Si-7.1Cr-2.3Hf-3.9Sn, that is, the solid solution was poor in Si, and its Hf concentration was half that in the cast alloy, and it had Si + Sn = 4.4 at.%, significantly lower than the Nbss in the cast alloy; Si/Sn = 0.28, essentially the same with the cast alloy; Ti/Hf = 13.3, significantly higher compared with the cast alloy; Ti + Hf = 33.4 at.%, essentially the same as in the cast alloy; and Nb/(Ti + Hf) = 1.65, higher than the cast alloy. The data would suggest that partitioning of Hf, Si, Sn, and Ti was essential in the transformation that occurred in EZ6-HT2 and led to the formation of microstructure A. It is suggested (a) that the microstructure A was the product of the phase transformation [Nbss]Ti+Hf rich, Si+Sn rich → [Nbss]Si+Sn poor, Hf poor + [Nb5Si3]Ti and Hf rich and (b) that owing to the promotion of the γNb5Si3 by the synergy of Hf and Ti with Sn in the alloys of this work (Figure 12), the [Nb5Si3]Ti and Hf rich in the above phase transformation was γNb5Si3.
Comparison of the solute concentrations from the tetragonal Nb5Si3 to the lamellar microstructure in EZ2-AC and microstructure A in EZ6-HT2 shows similar trends for Nb, Si, and Ti and opposite trends for Hf and Sn. The lamellar microstructure in EZ2-AC and microstructure A in EZ6-HT2 were rich in Ti + Hf (47.4 at.% in EZ2-AC and 38.3 at.% in EZ6-HT2) and essentially had the same Nb/(Ti + Hf) ratio (0.6 in EZ2-AC and 0.66 in EZ6-HT2) (note also that the Ti + Hf sum and the Nb/(Ti + Hf) ratio of Hf-rich Nb5Si3 in NV1-AC and EZ6-HT2 were similar (35 at.% and 0.67 in NV1-AC [31] and 39.1 and 0.56 in EZ6-HT2)).
In EZ6-HT2, the growth of microstructure A was away from the silicide, and was “stopped” by the very Hf-rich BCHS (18.6Nb-25.7Ti-39.8Si-0.6Cr-14.7Hf-0.65Sn, with Si + Sn = 40.45 at.%, Si/Sn = 61.9, Ti/Hf = 1.75, Ti + Hf = 40.4 at.%, and Nb/(Ti + Hf) = 0.5), and the A15-Nb3X (45.6Nb-31.1Ti-2.7Si-3.1Cr-2Hf-15.6Sn, with Si + Sn = 18.3 at.%, Si/Sn = 0.2, Ti/Hf = 15.9, Ti + Hf = 33 at.%, and Nb/(Ti + Hf) = 1.4.

4.2.12. Precipitation in Nb5Si3
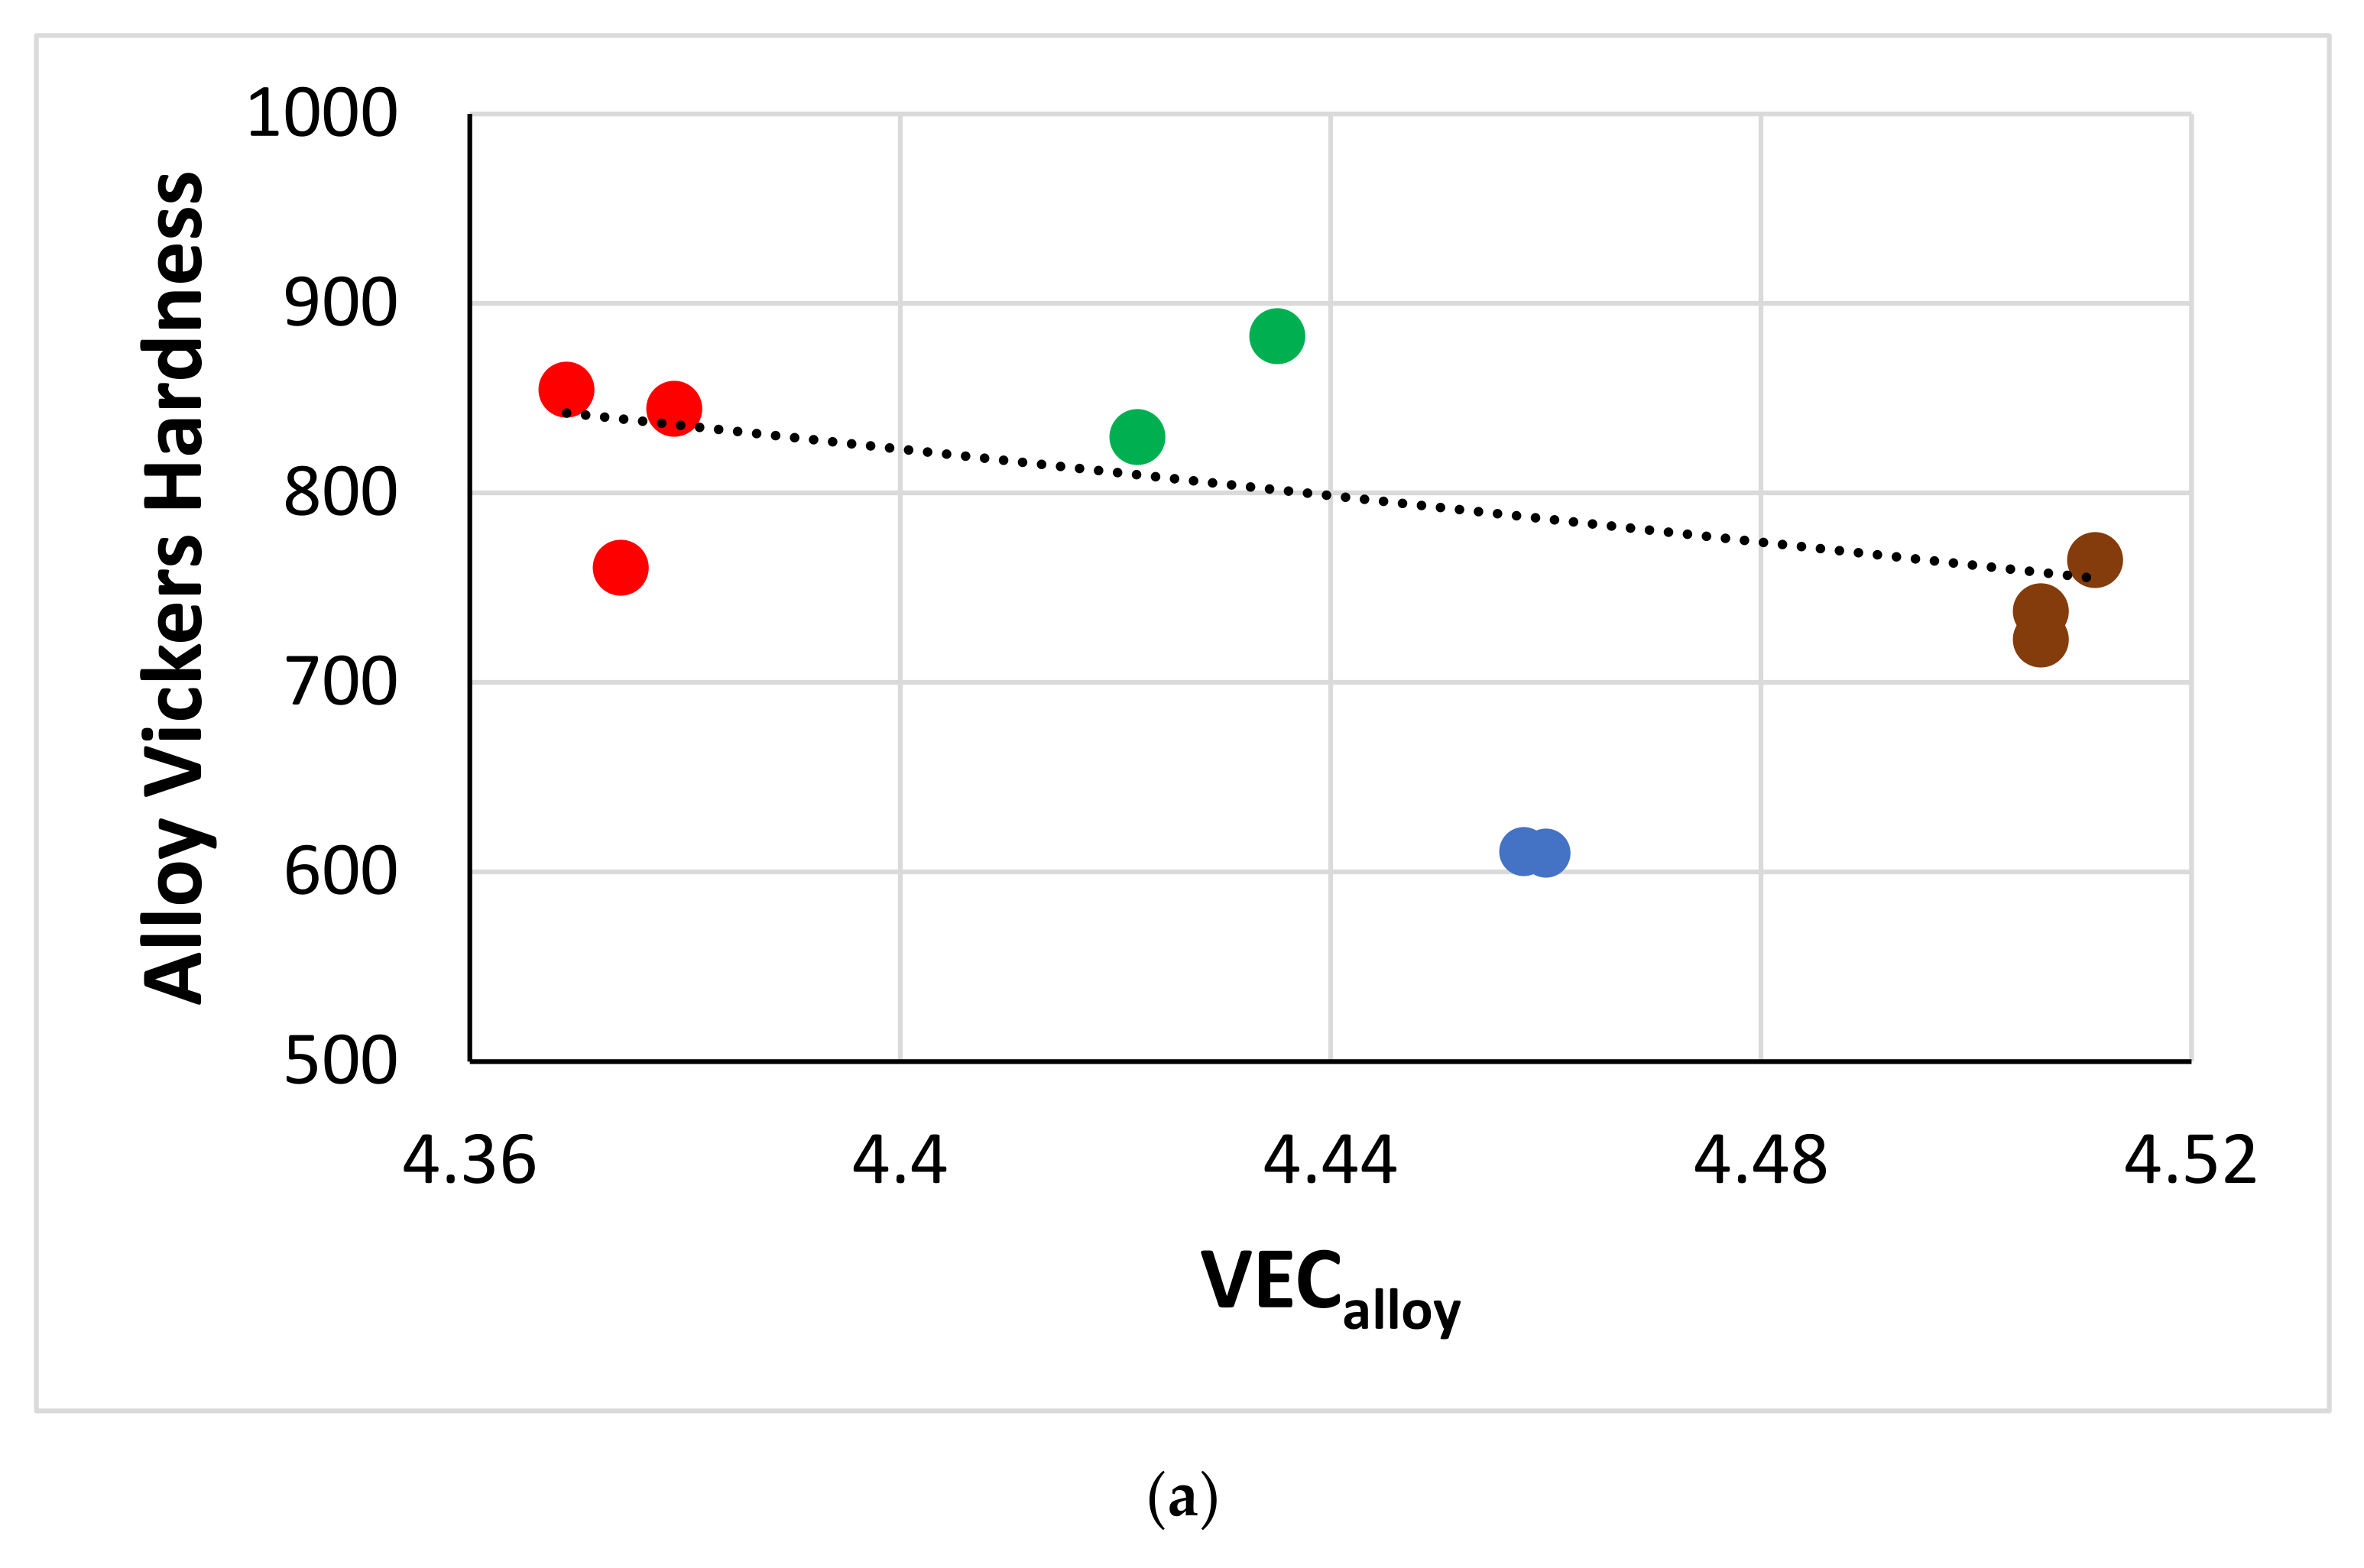
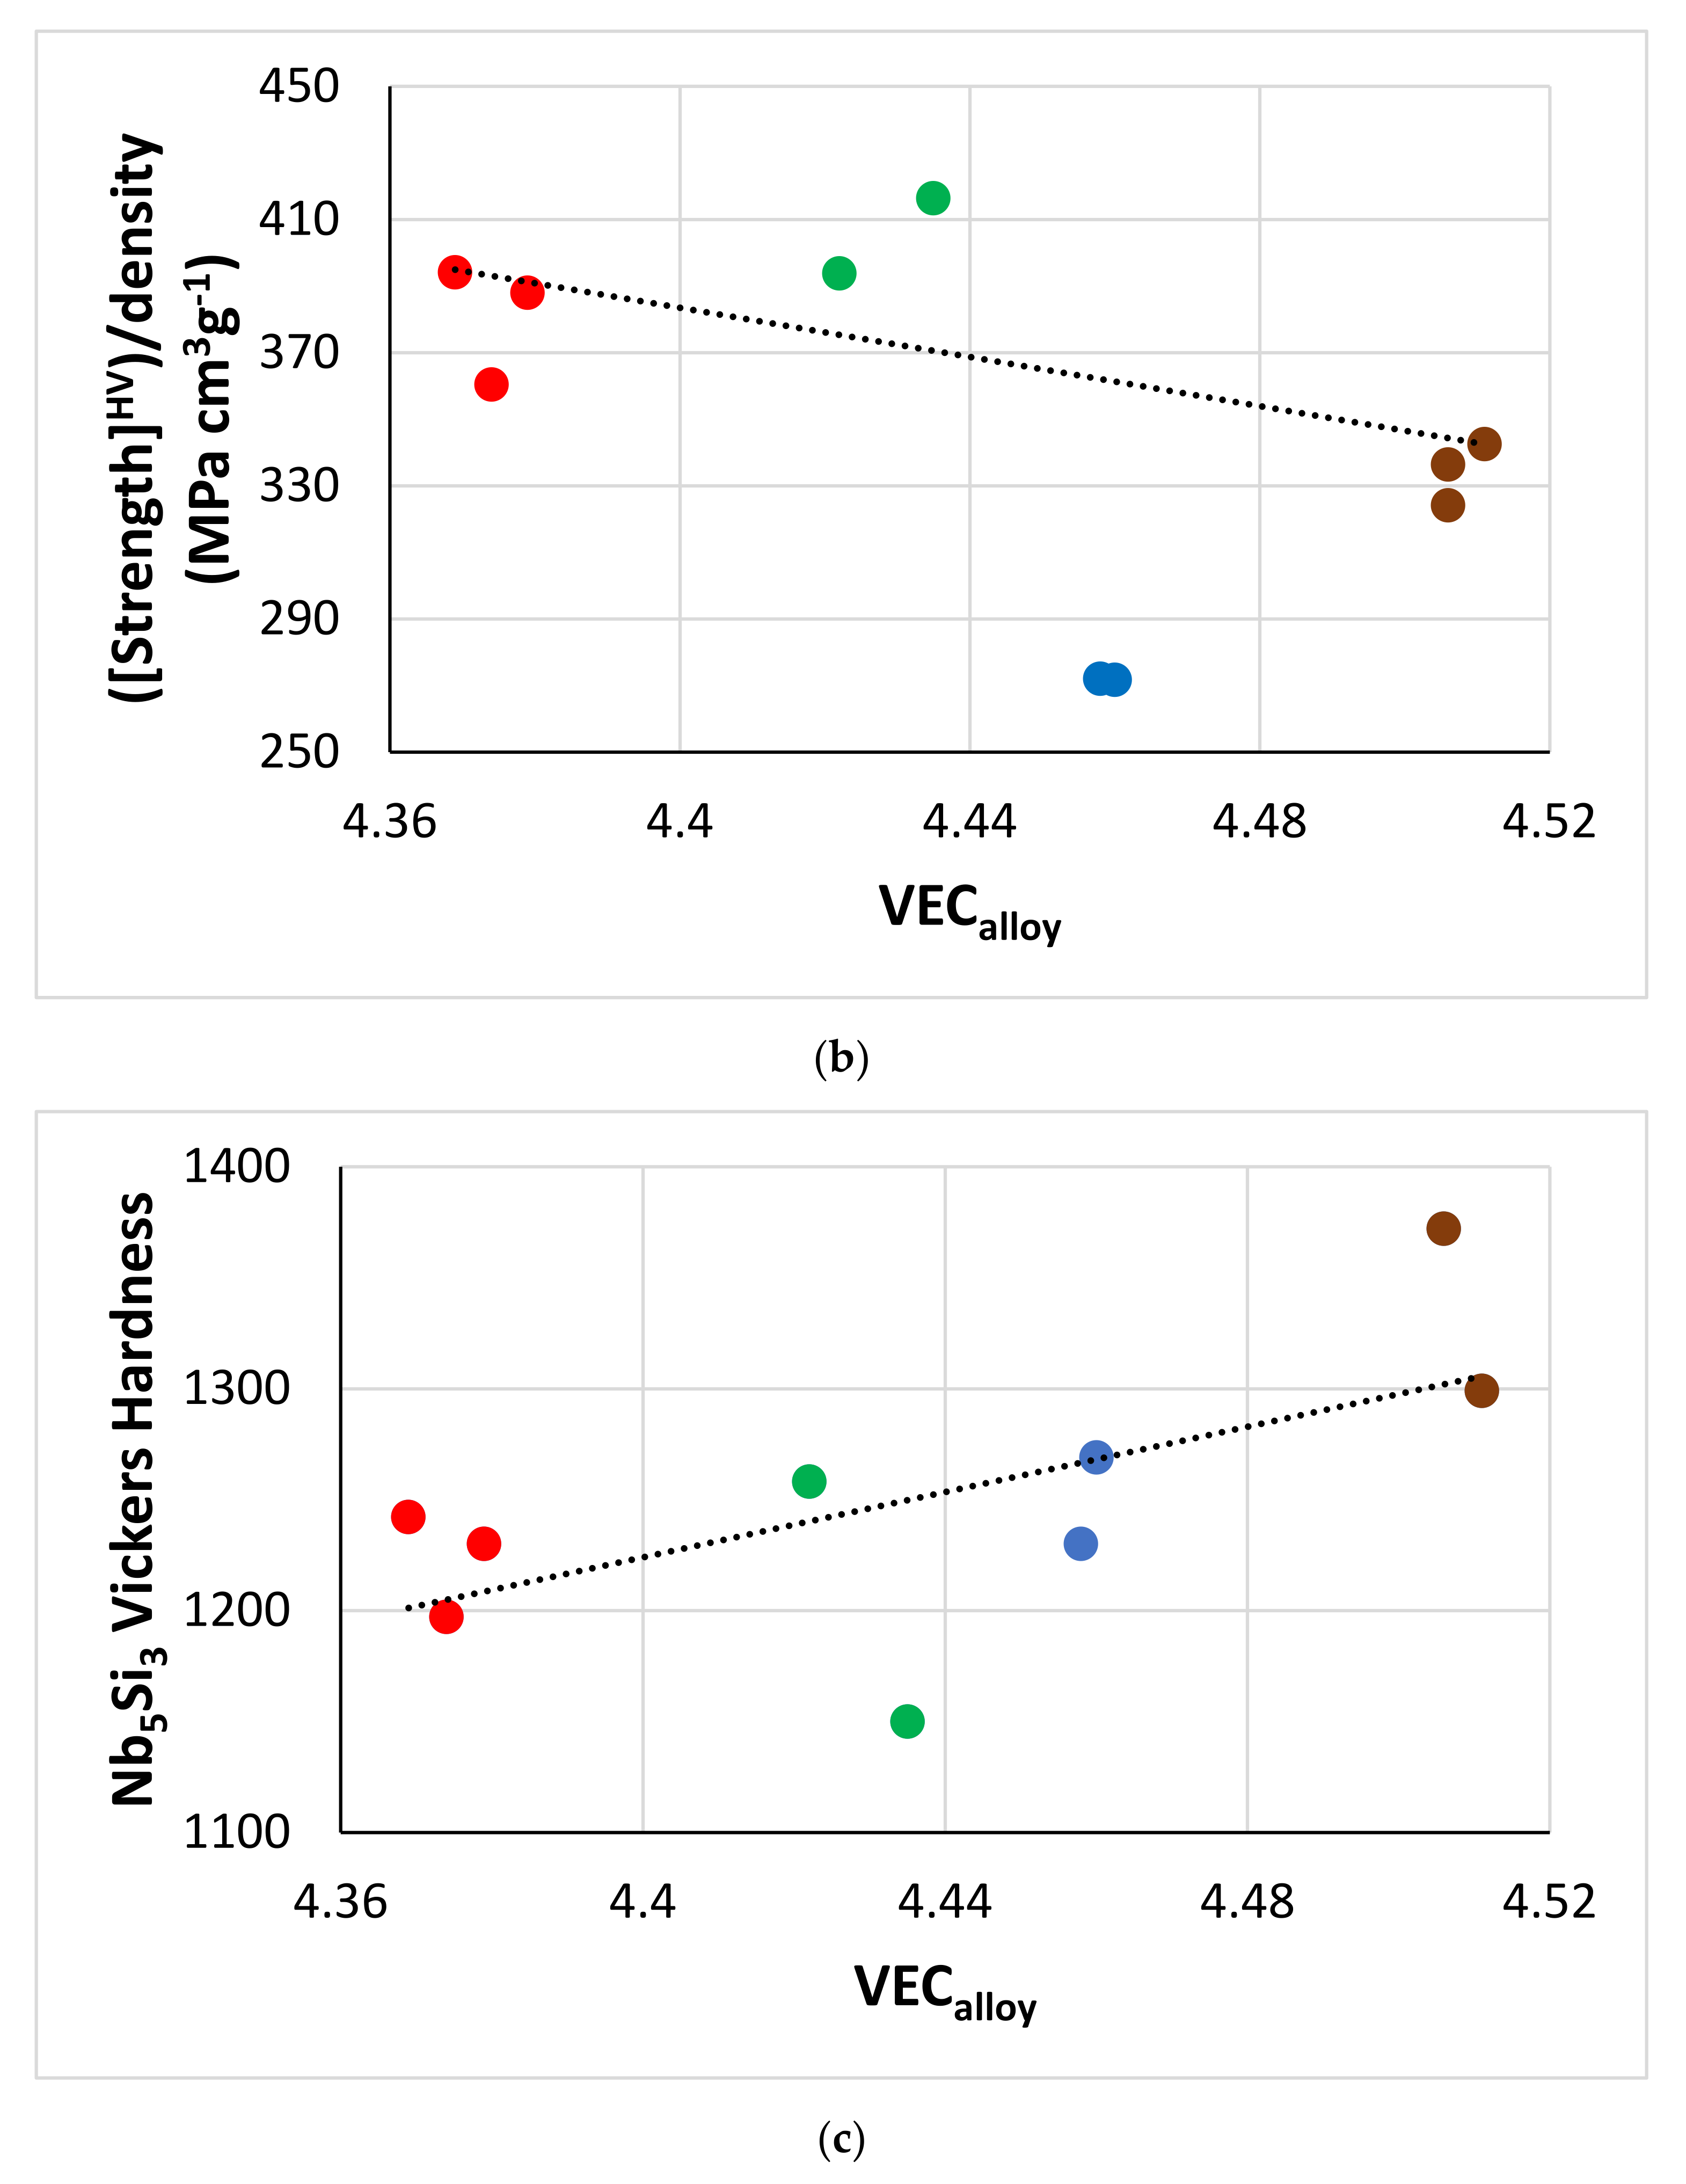
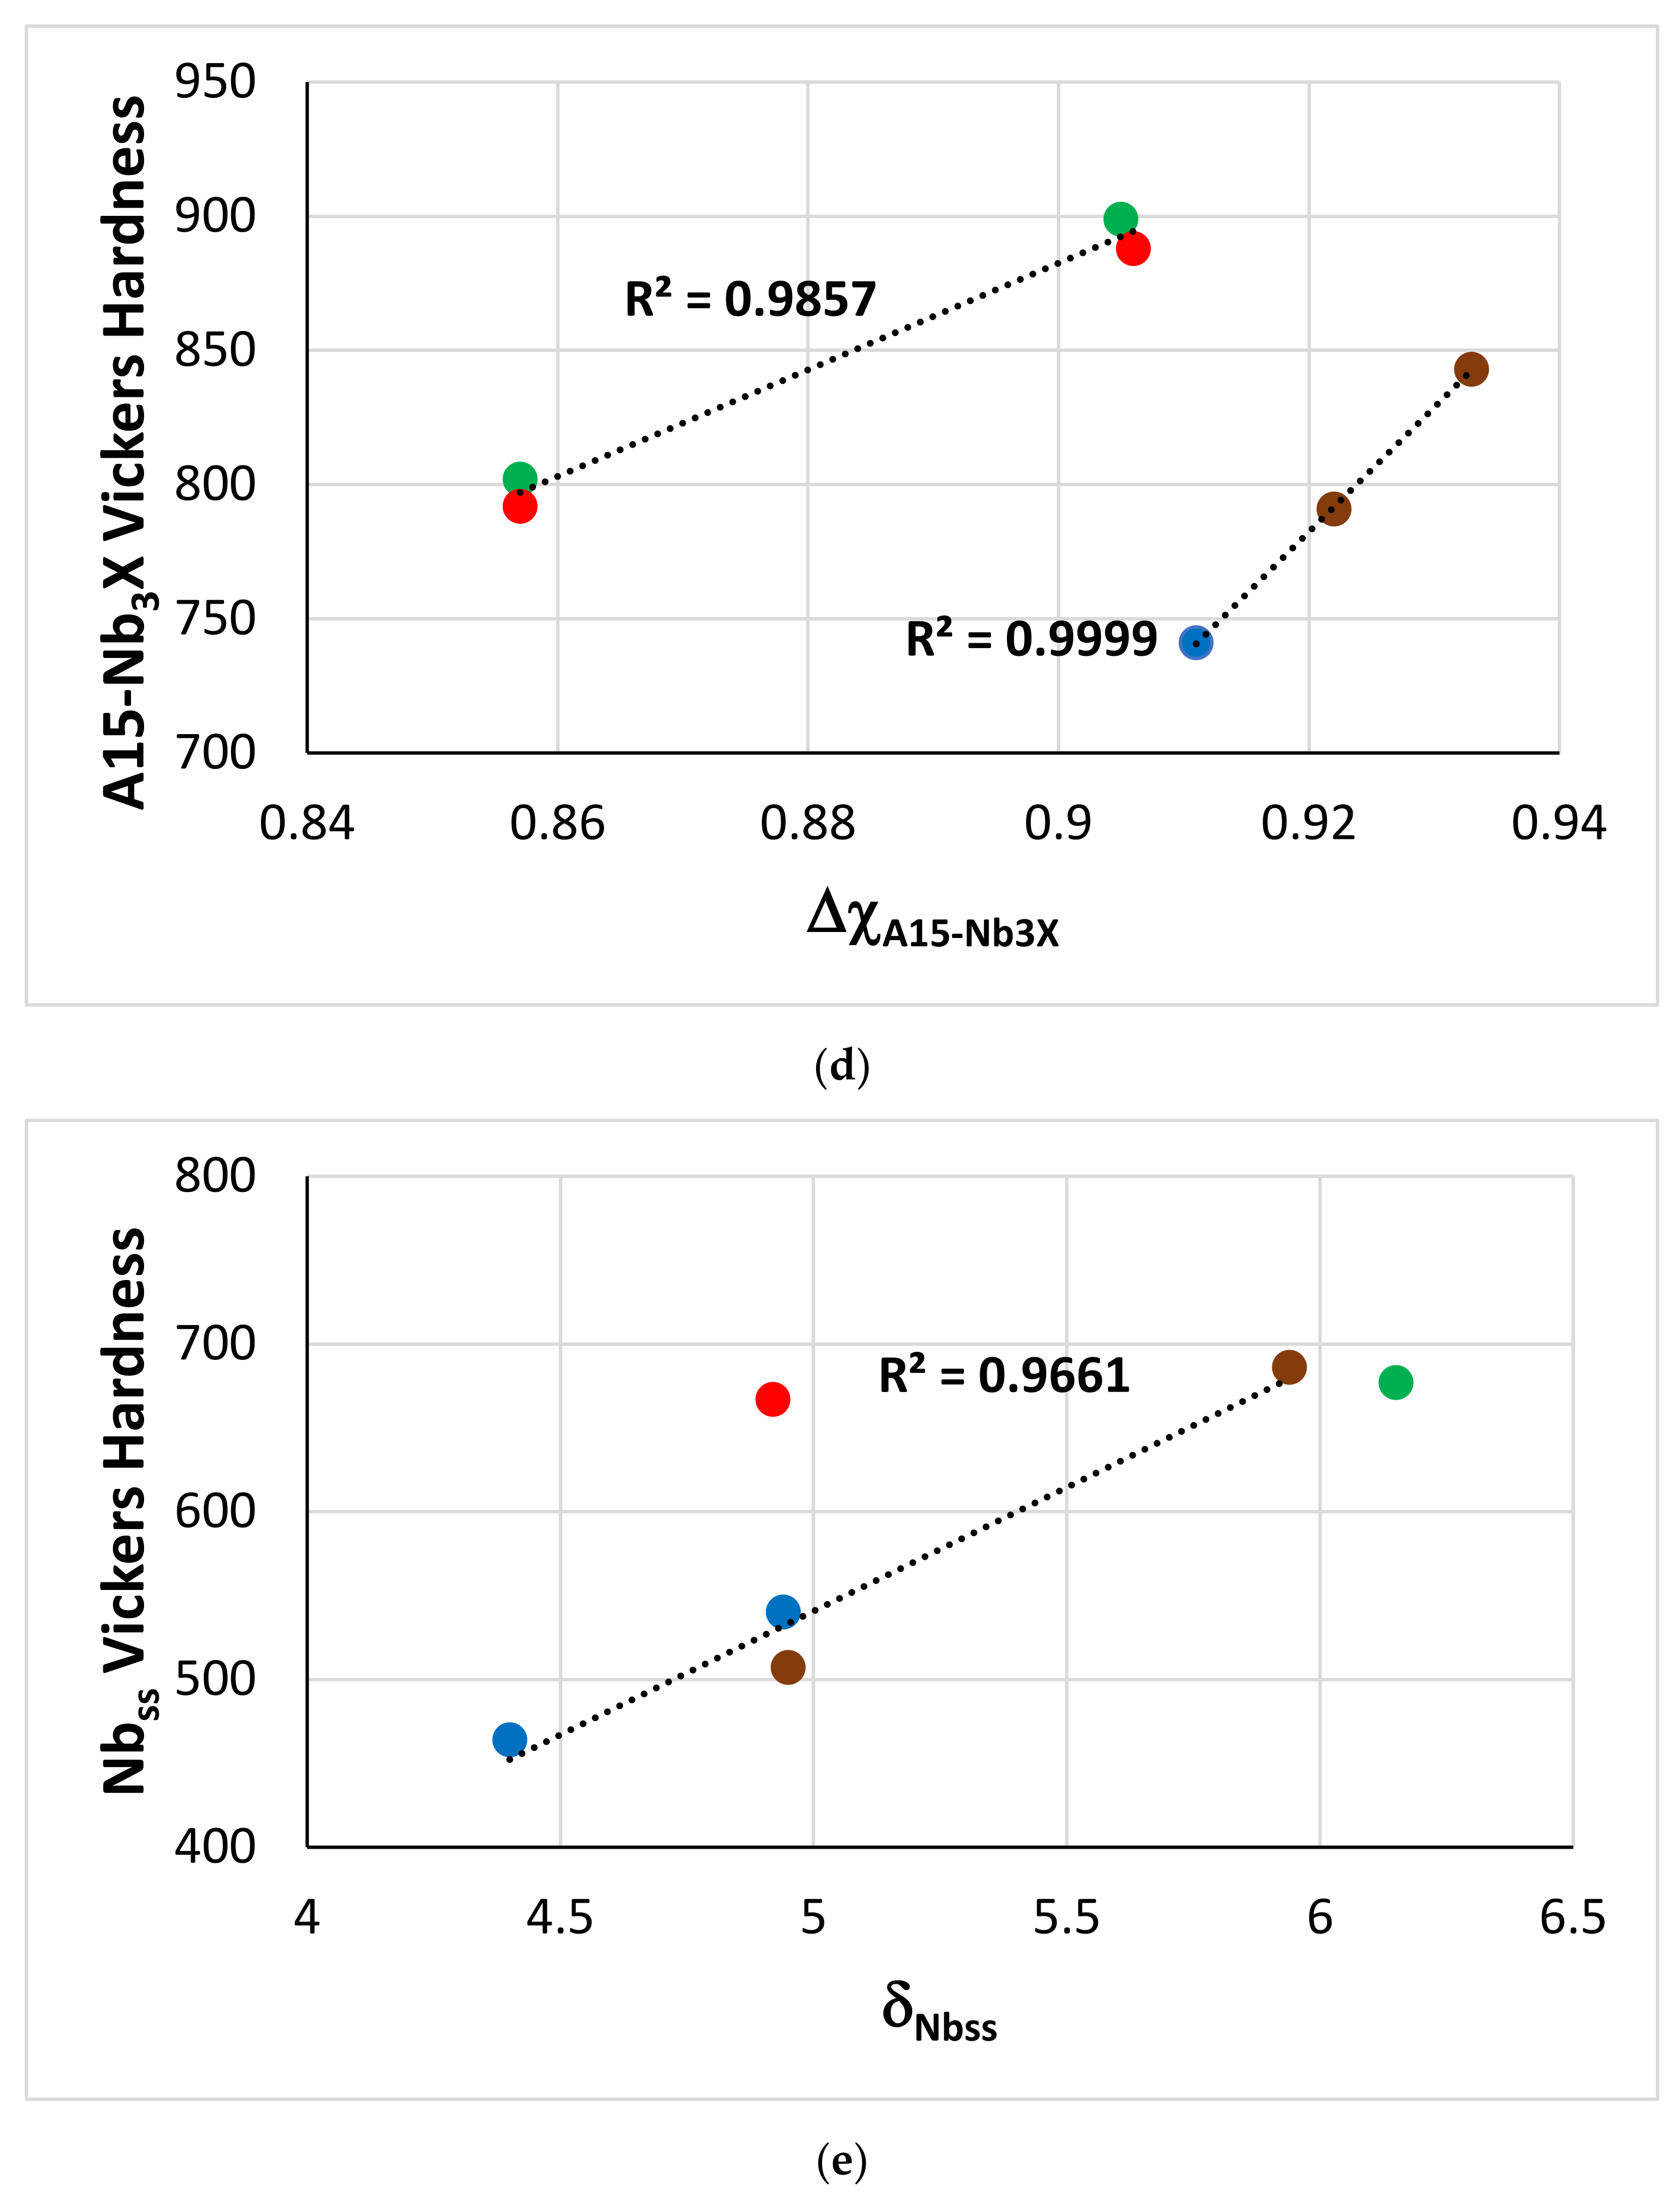
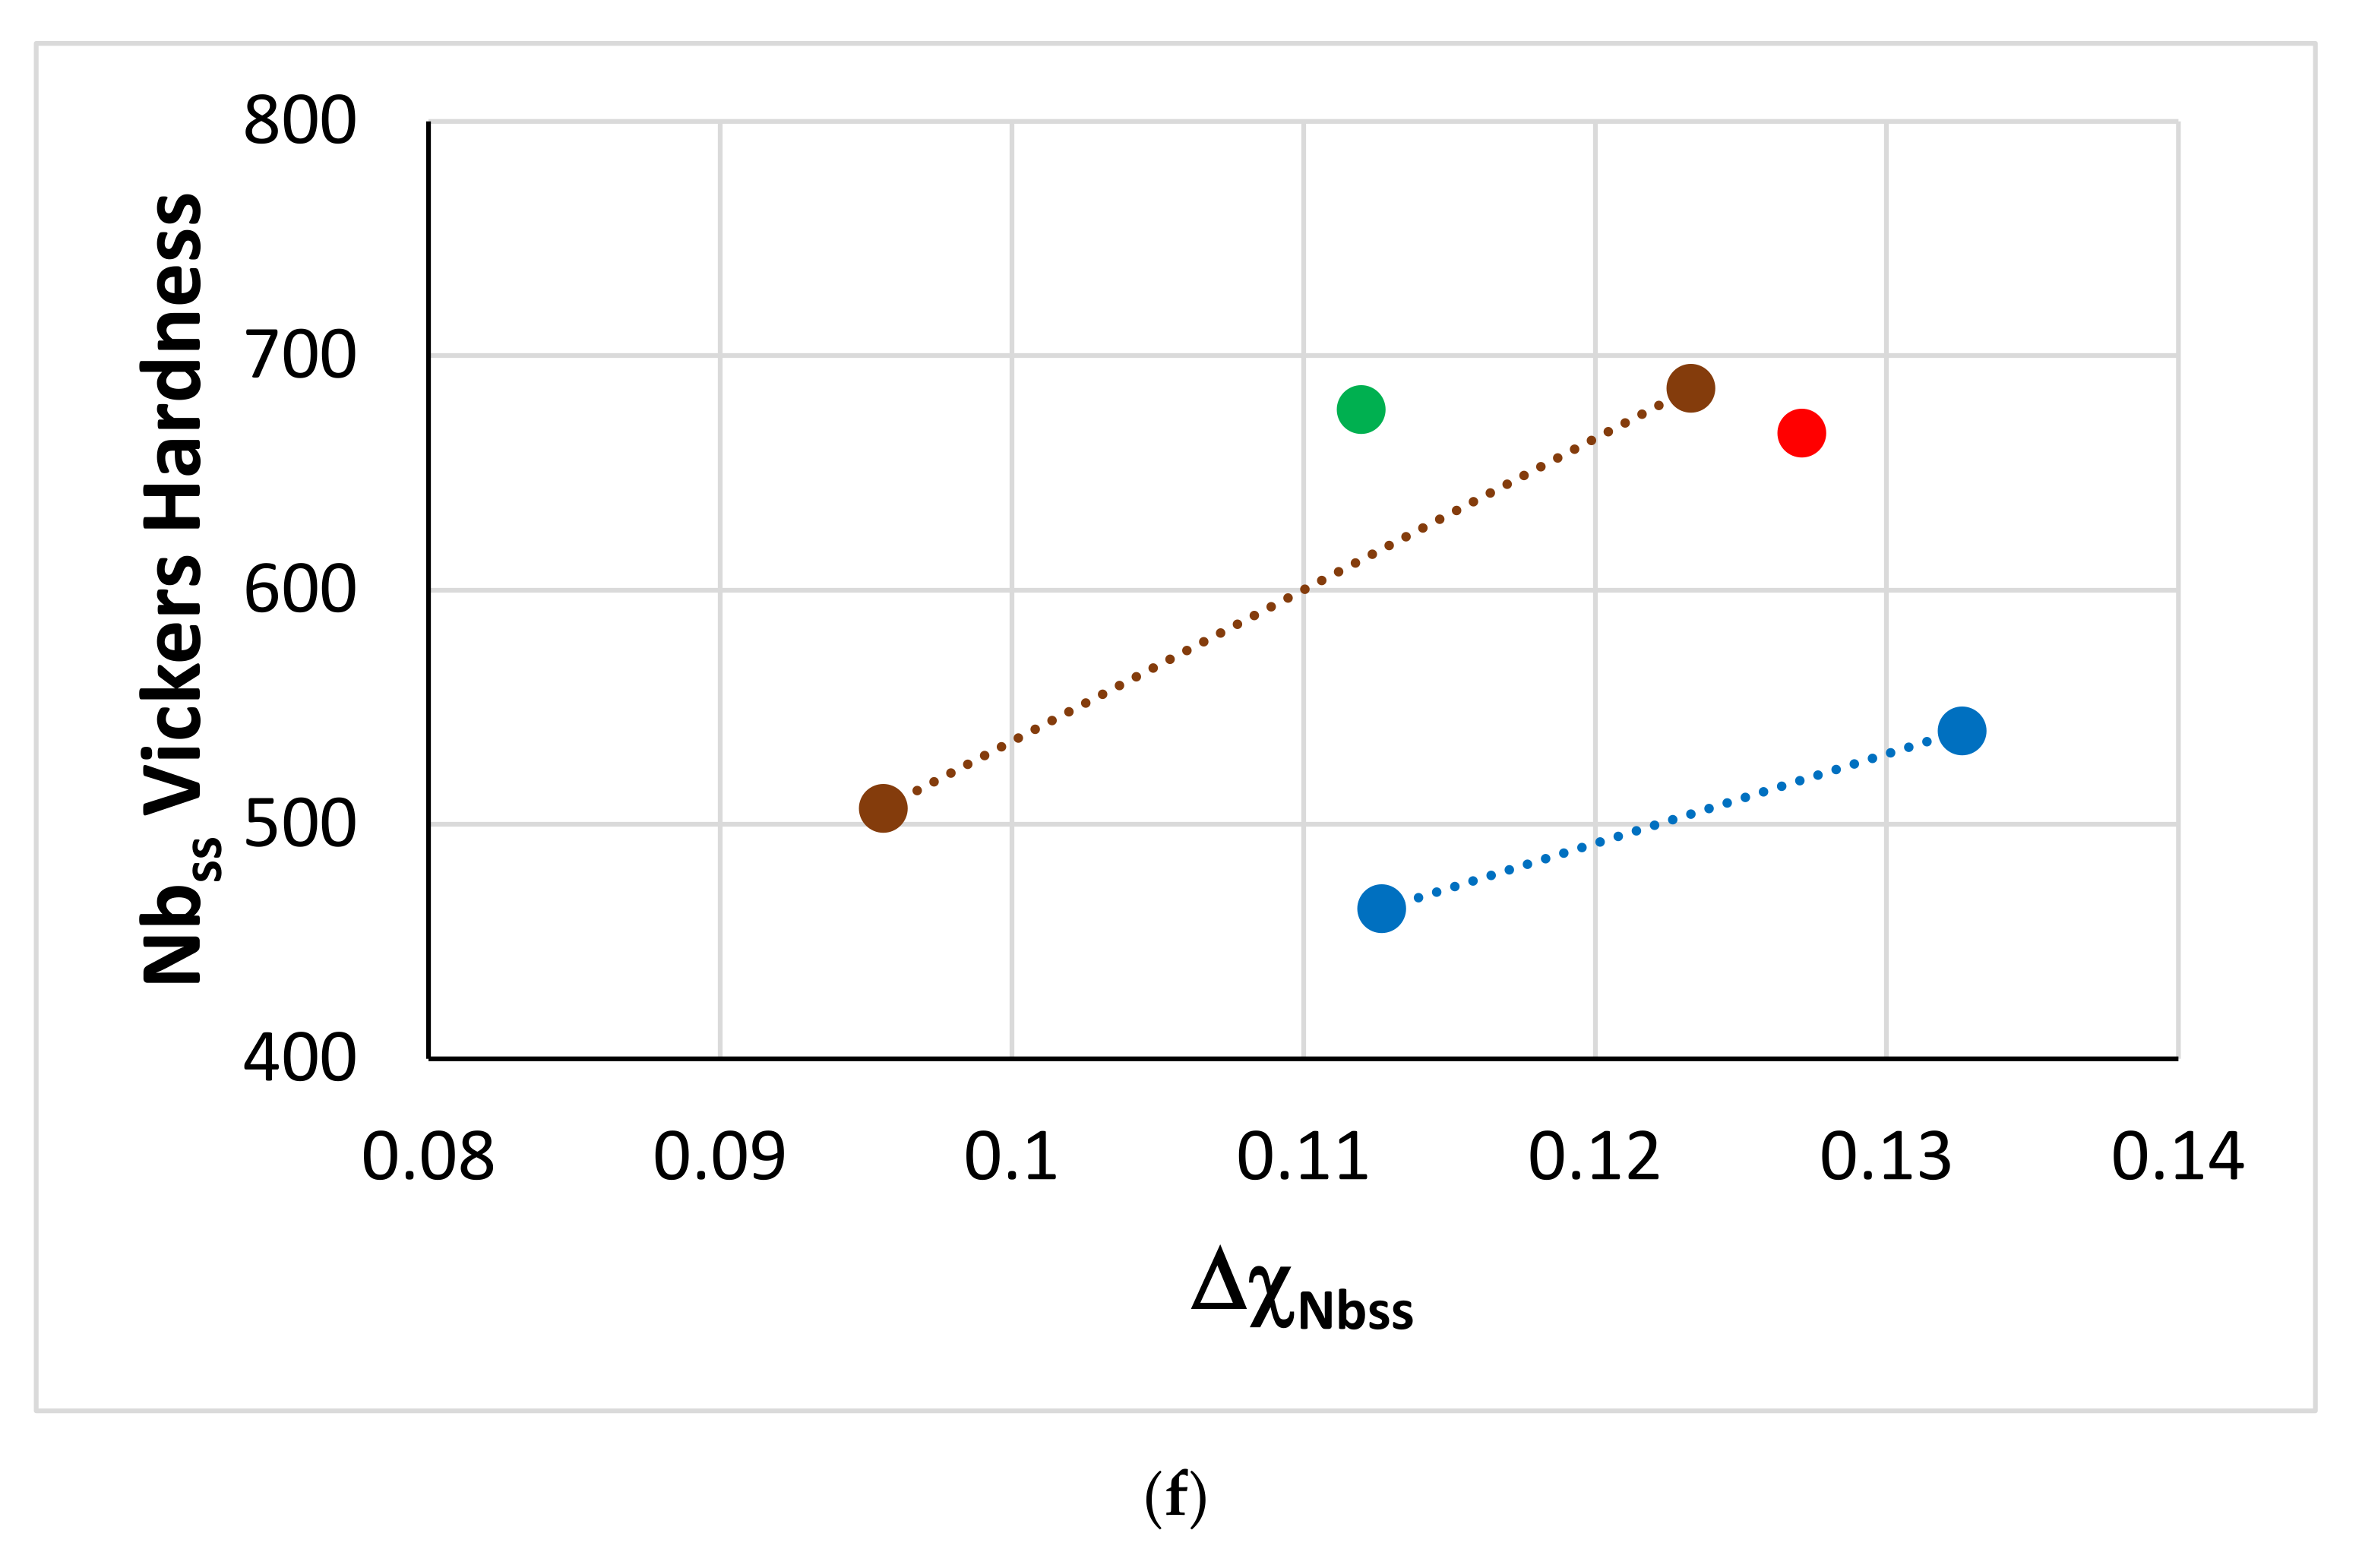
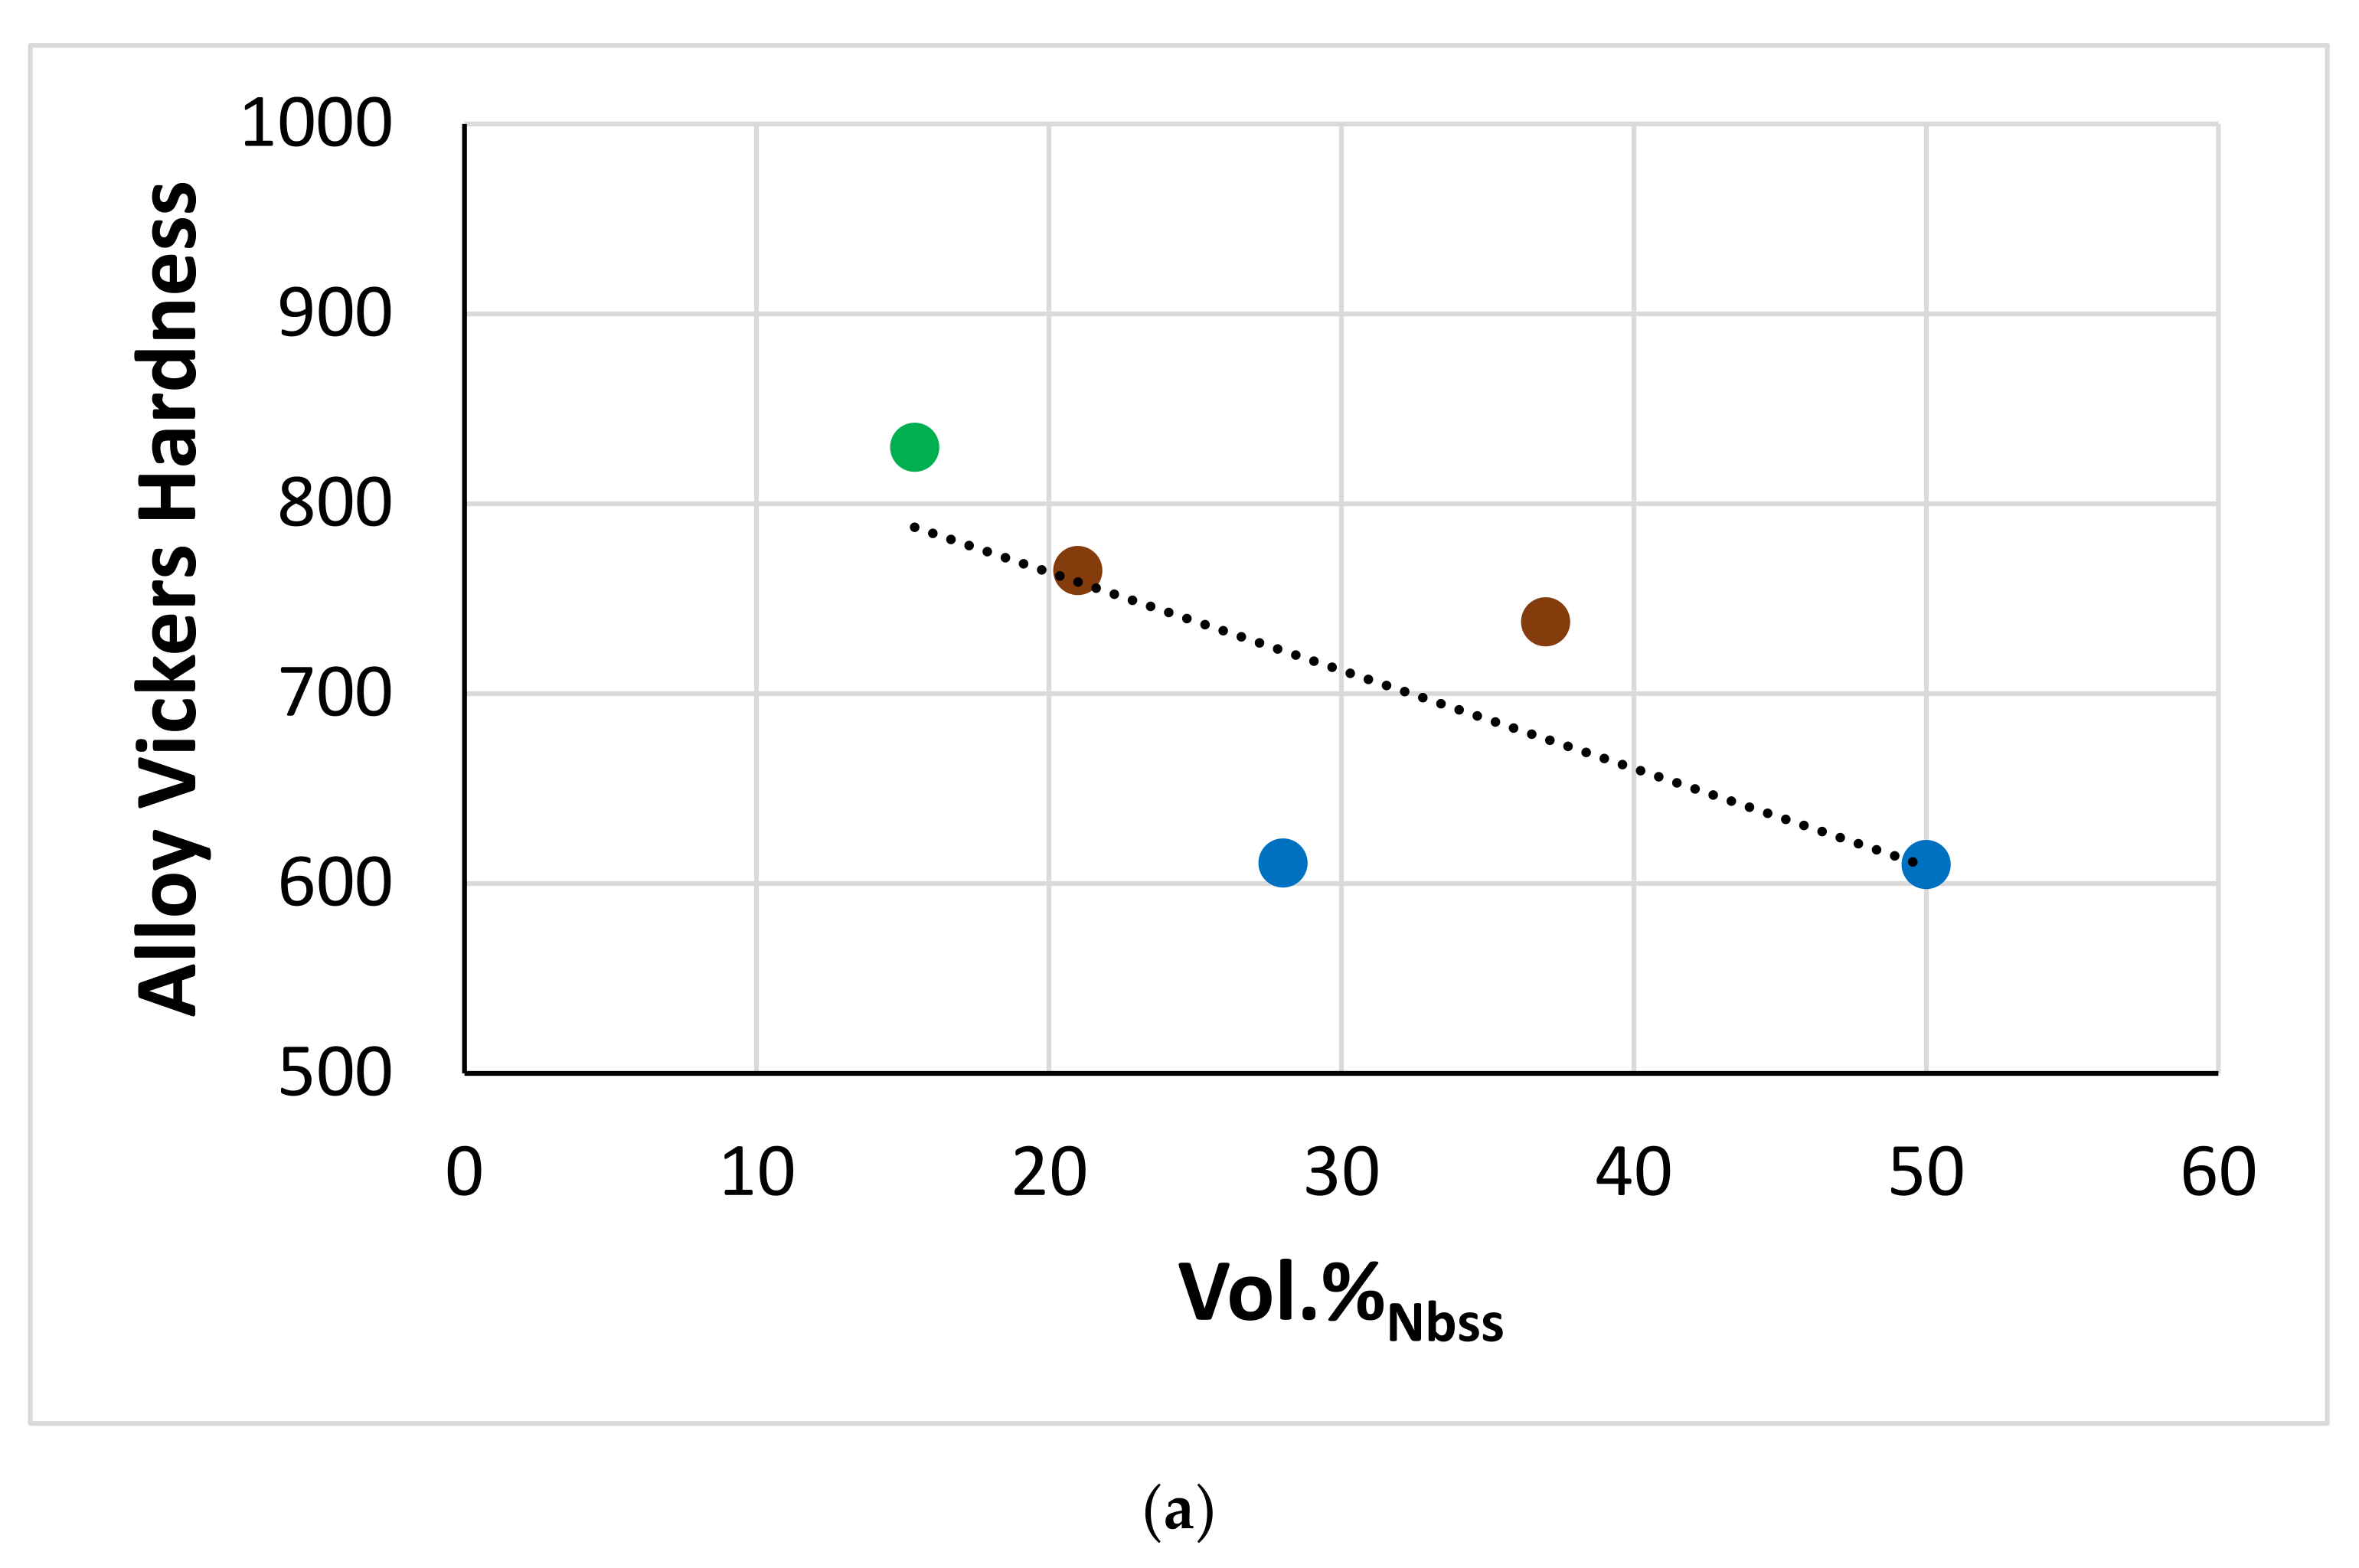
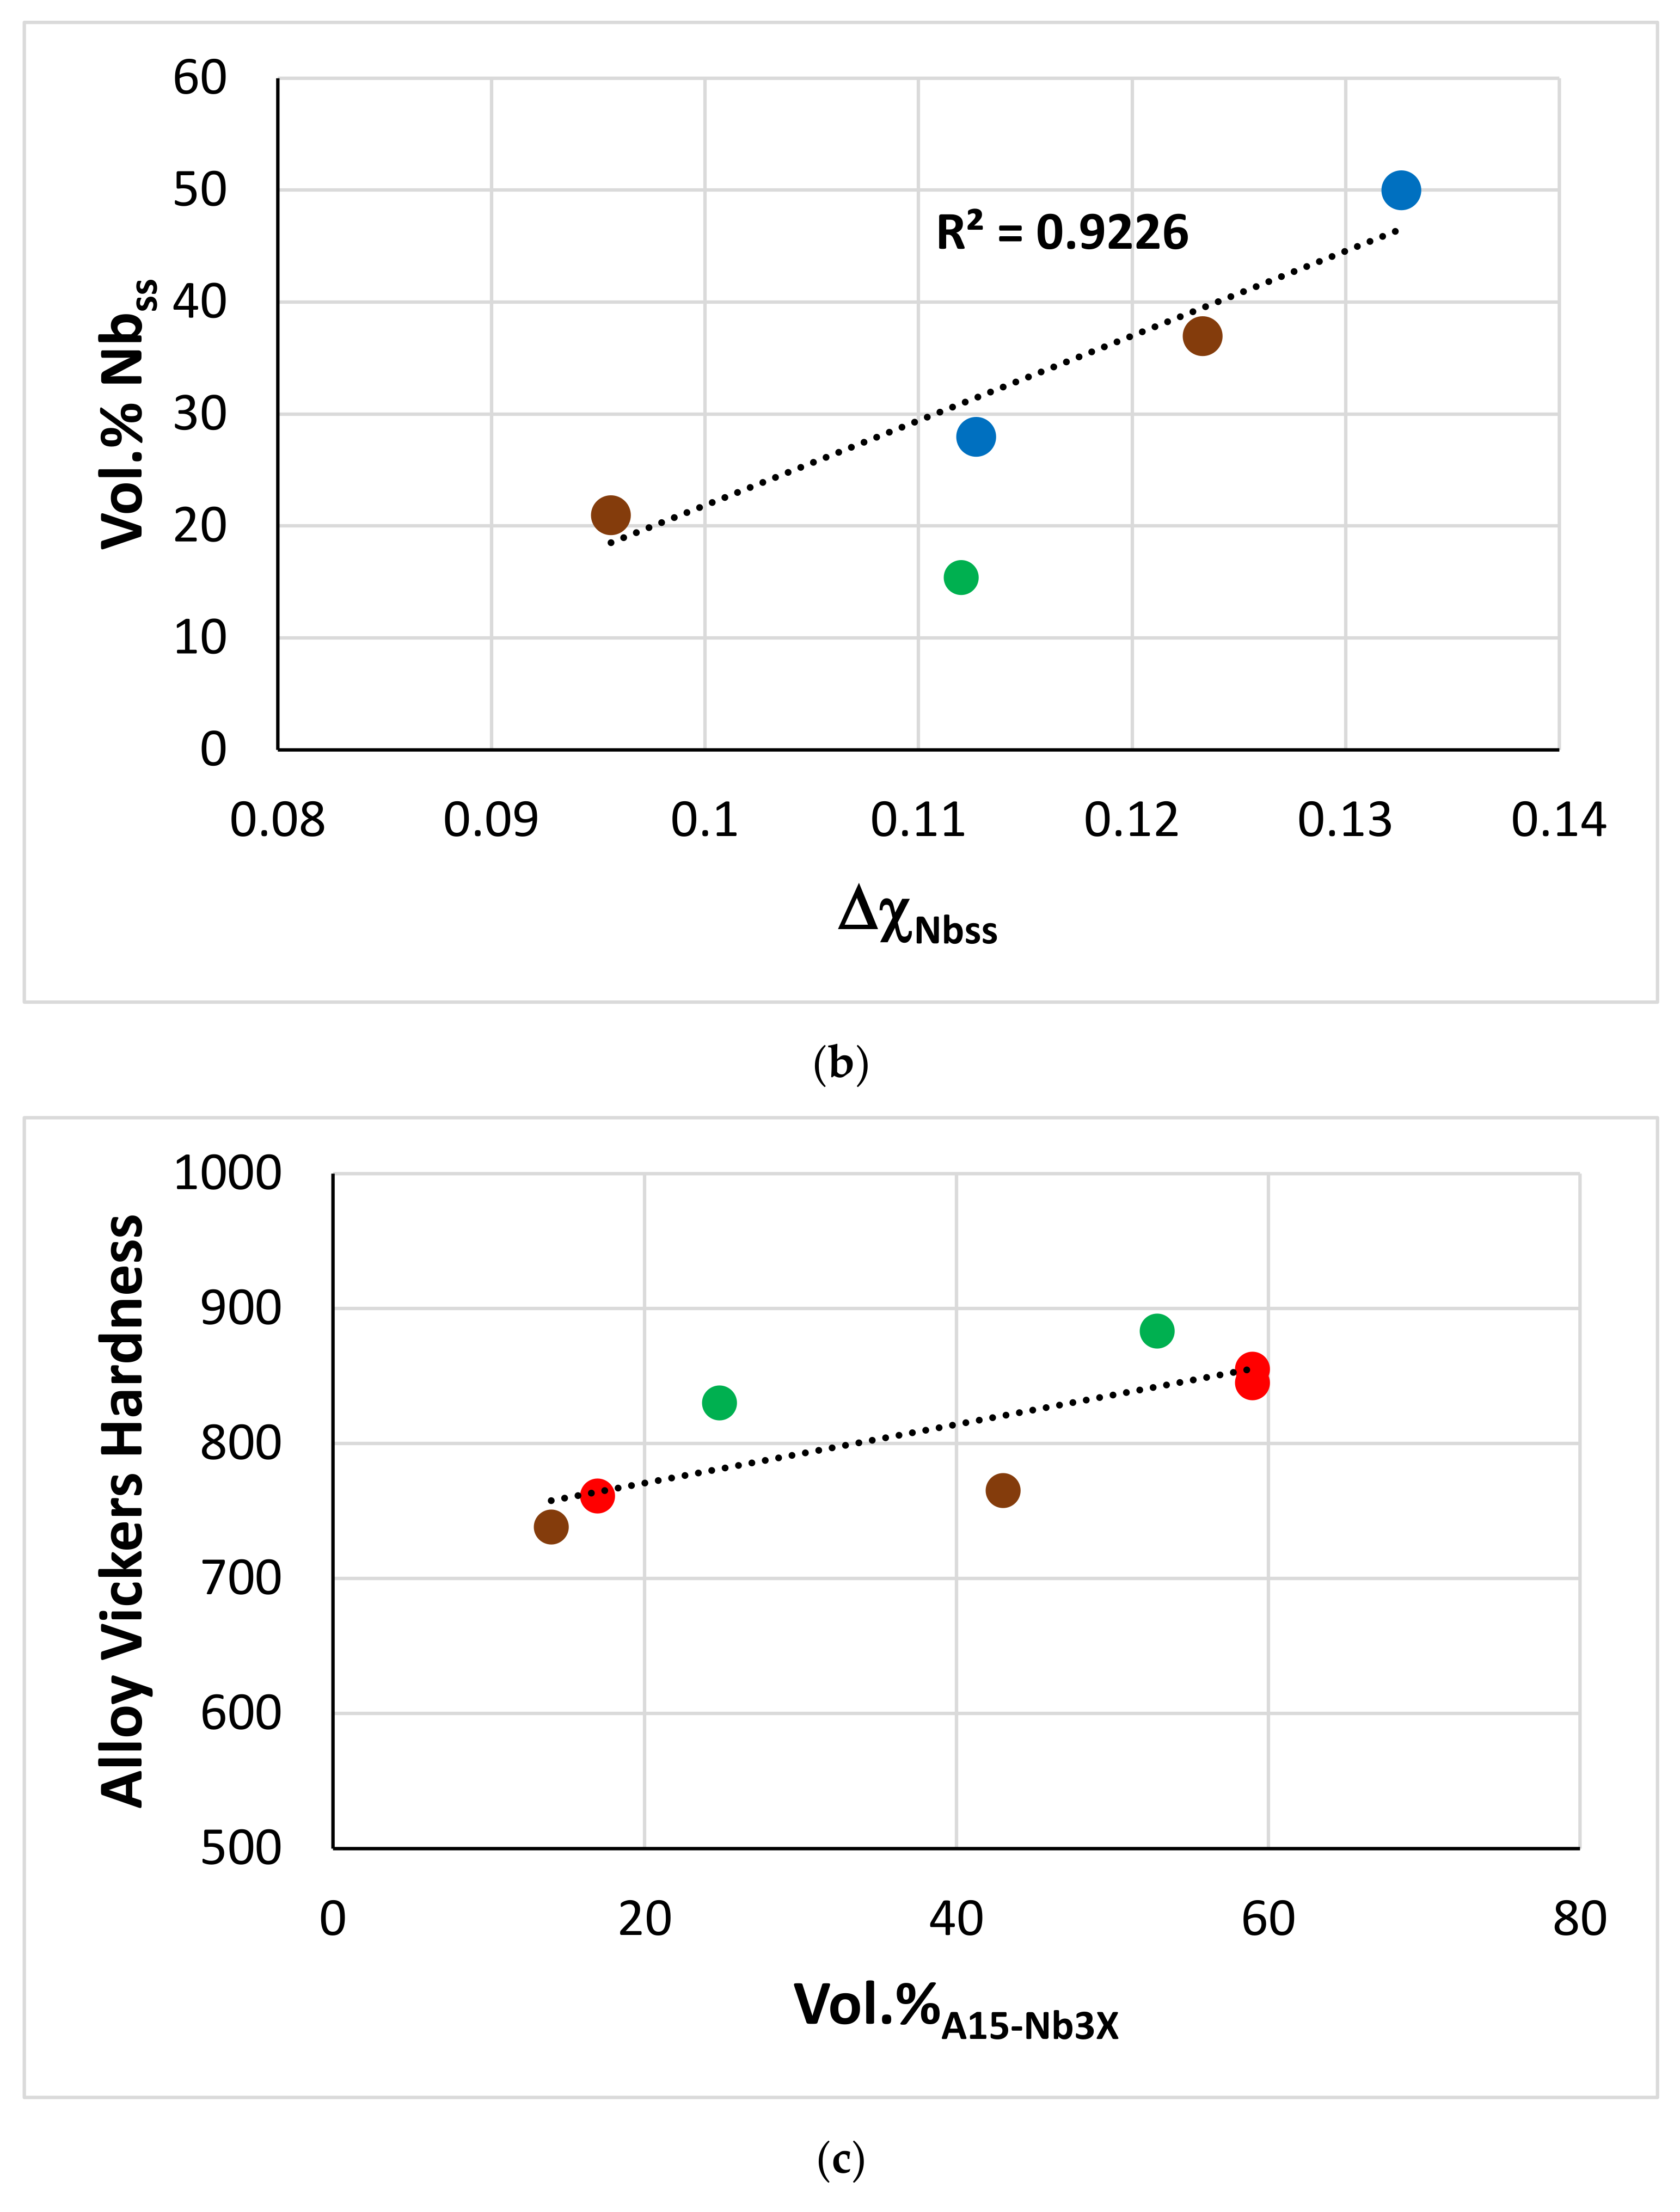
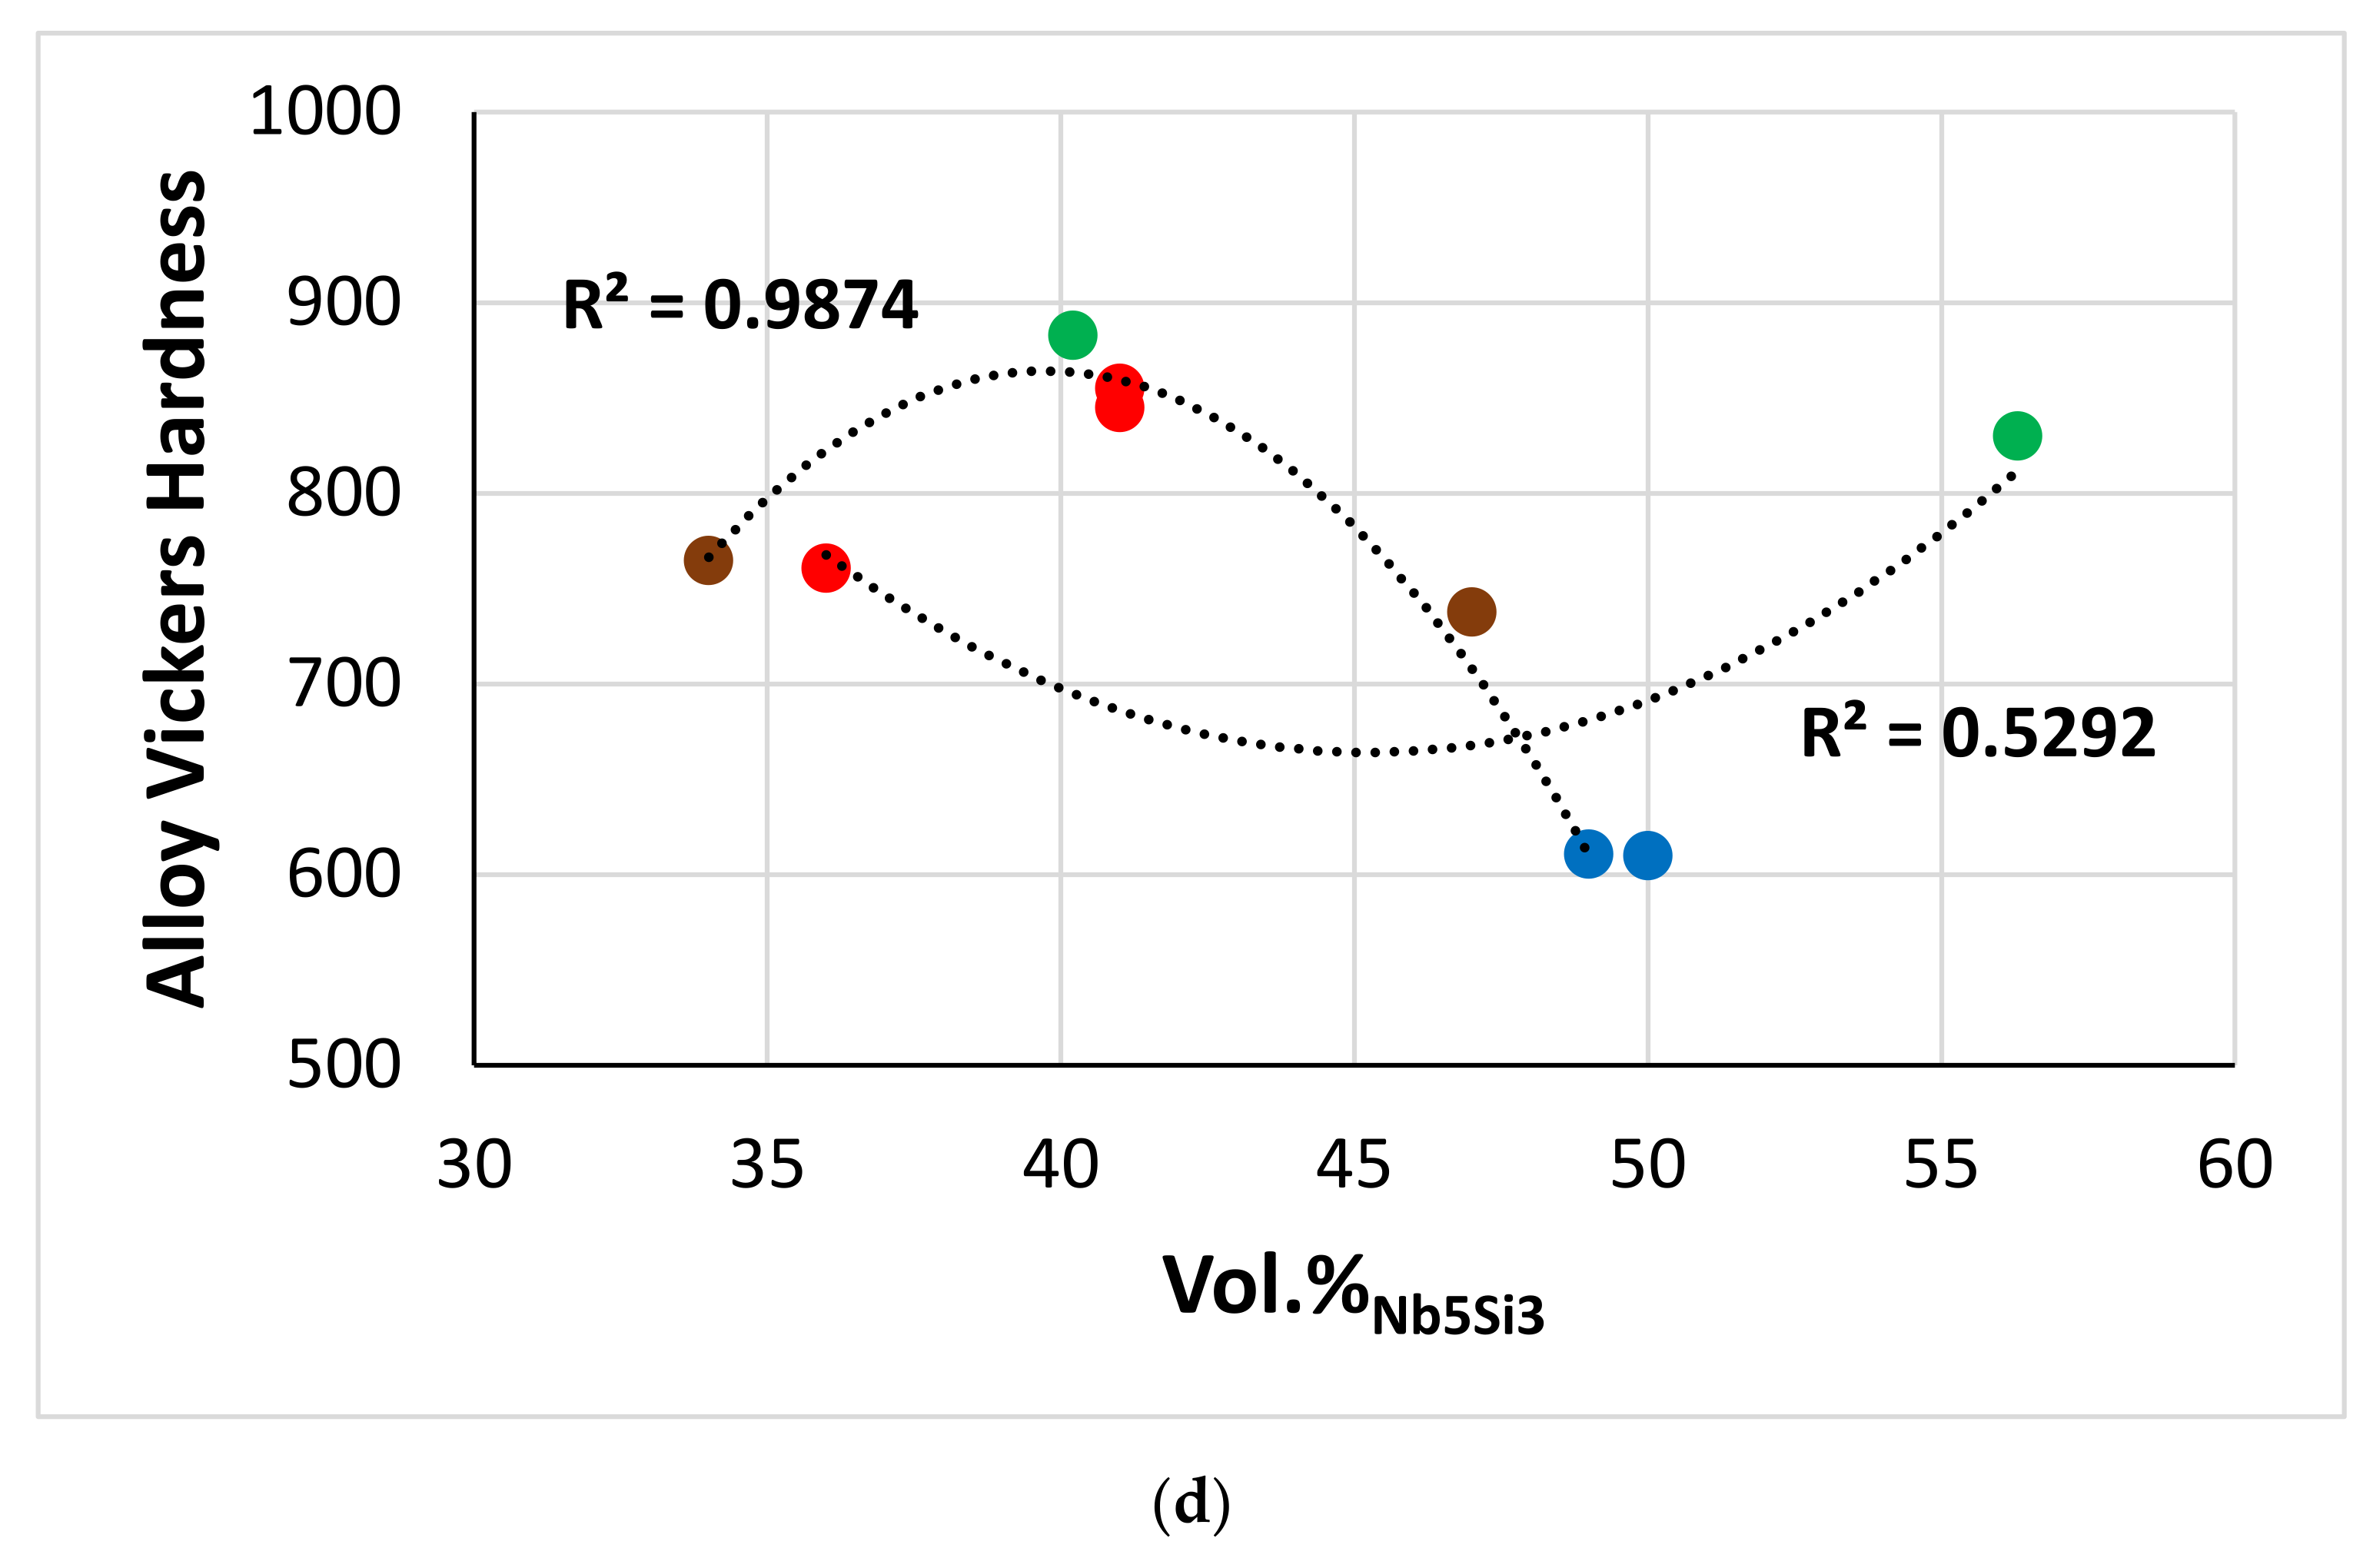
In the heat-treated alloys EZ5 and EZ8, in which the Nbss was not a stable phase (Table 3), the A15-Nb3X precipitated in Nb5Si3 grains (Figure 4 and Figure 11). Both alloys contained Al and Ti. In the Ti-free and Al-containing alloys EZ4 and EZ7 [26], where the Nbss also was not a stable phase, no precipitates were observed in Nb5Si3. Thus, the precipitation of A15-Nb3X in EZ5-HT and EZ8-HT was attributed to the synergy of Al and Ti in said alloys. Precipitation of Nbss in Nb5Si3 has been reported by our research group in the Al- and Ti-containing but Sn-free heat-treated RM(Nb)ICs KZ2 (Nb-24Ti-18Si-8Cr-4Al), KZ5, and KZ7 [21], where it was attributed to the phase transformation βNb5Si3 → Nbss + αNb5Si3.
Modelling of the properties of metallic UHTMs, for example their toughness and creep (e.g., [56,58,59]), should not ignore the presence of microstructure A and/or precipitates of a second phase that can form respectively around or inside the Nb5Si3 after exposure to high temperature(s), as well as the change of properties at the interface between Nbss and Nb5Si3 [31].

4.2.13. Hardness

The hardness of alloys and their phases as a function of alloy or phase parameters and volume fraction of phases is considered in Figure 21 and Figure 22. The hardness and room-temperature-specific strength calculated from hardness (σy = HV/(3ρ), where HV is alloy hardness and ρ is alloy density, see Table 1, [60]) of the alloys of this work increased with decreasing VECalloy, in agreement with [1]. Figure 21c shows (1) that there is a correlation between the alloy parameter VEC and the hardness of Nb5Si3 (note that also there are relationships between VECalloy and VECNb5Si3 and VECalloy and ΔχNb5Si3 for RM(Nb)ICs and RM(Nb)ICs/RCCAs, see [3]) and (2) that the hardness of the Nb5Si3 increased with the parameter VECalloy for the alloys of this work.
The hardness of the A15-Nb3X increased with its parameter Δχ and was higher for the alloys EZ5 and EZ8 (Figure 21d). The hardness of the Nbss increased with its parameters δ and Δχ (Figure 21e,f). The trend in Figure 21f is in agreement with previous work for RM(Nb)ICs and RM(Nb)ICs/RCCAs [3]. Compared with the alloy EZ2, the addition of Al and/or Cr in EZ5, EZ6, and EZ8 increased the hardness significantly. The hardness was highest for the as-cast alloys EZ5, EZ6, and EZ8.
Note the following: (i) the remarkable fit of data in Figure 21d, where the trend is in agreement with [13]; (ii) for the alloys where the Nbss was not stable, namely the alloys EZ5 and EZ8, the hardness of the Nbss was essentially similar, even though the δNbss and ΔχNbss changed (Figure 21e,f); and (iii) the δNbss was highest for the Nbss in EZ8-AC. The specific strength of the alloys was in the range 271.7 to 416.5 MPa cm3g−1. The specific strength of the alloys EZ5 and EZ8 (i.e., the two Al-containing alloys of this work), was higher than the room-temperature-specific strength of RCCAs and RHEAs reviewed in [2]. Furthermore, the specific strength of EZ8 was higher than that of B containing RM(Nb)ICs and RM(Nb)ICs/RCCAs [1,36,61].
The hardness of the alloys increased and decreased with increasing vol.% of A15-Nb3X and Nbss, respectively (Figure 22). Note that the vol.% Nbss increased with increasing ΔχNbss. The trend of the hardness of the AC and HT alloys versus their vol.% Nb5Si3 exhibited, respectively, a minimum and maximum, which correspond to about 45% and 40% Nb5Si3, respectively. The alloy EZ8-HT, in which the Nbss was not stable and the Nb5Si3 had the lowest hardness of the alloys of this work (Table 4), had the highest hardness and room-temperature-specific strength with vol.% Nb5Si3 = 40%, vol.% A15-Nb3X = 53%, and with VECalloy = 4.435 and ΔχA15-Nb3X = 0.905.

4.2.14. Comparison of the Synergy of Hf with B, Ge, or Sn in RM(Nb)ICs/RCCAs

In this section, we compare the effects of the synergy of solute additions, namely Al, Cr, Hf, Si, and Ti (group A elements), with each of the metal/metalloid elements B, Ge, or Sn (group B elements), which the alloy designer can use to design/select metallic UHTMs with a balance of properties. The comparison uses data for the alloys EZ8, ZF9 [35], and TT7 [36] (see Table 10). Note that all three alloys are RM(Nb)ICs/RCCAs and are based on the RM(Nb)IC alloy KZ5 (Nb-24Ti-18Si-5Al-5Cr [21]), with Hf plus one of the group B elements, namely Hf plus B or Hf plus Ge or Hf plus Sn addition, respectively, in TT7, ZF9, and EZ8.
  • Note that with the aforementioned solute elements, it is possible to have metallic UHTM RM(Nb)ICs/RCCAs (a) with density less than 7 g/cm3 and (b) with room-temperature-specific strength higher than that of the RCCAs and RHEAs reviewed in [2] (with the exception of the specific strength of TT7-HT).
  • Notice (c) that the Nbss, which is a key phase for meeting specific property goals (namely fracture toughness, creep, and oxidation) or having a balance of properties, can be “controlled” (regarding stability and volume fraction) with synergies of specific solutes. For example, only that with the addition of Sn the Nbss was not stable (EZ8).
  • Note (d) that in metallic UHTM RM(Nb)ICs/RCCAs with the group A elements plus one of the group B elements, hexagonal Nb5Si3 can be stable together with the tetragonal α and β Nb5Si3. Indeed, as shown in Table 10, in all three alloys, tetragonal α and β Nb5Si3 and hexagonal γNb5Si3 were stable: the α, β, and γNb5Si3 in EZ8 and ZF9, and the tetragonal T2 (isomorphous with αNb5Si3) and hexagonal D88 (isomorphous with γNb5Si3) silicides in TT7. Note that properties (e.g., Young’s modulus, CTE anisotropy, hardness, creep) of said silicides differ significantly and depend on alloying [34,62], and they change with the precipitation of a second phase in the silicide (see 7).
  • Notice (e) that in metallic UHTM RM(Nb)ICs/RCCAs with the group A elements plus Ge or Sn, the Nb3Si cannot be used to “engineer” the alloy microstructure, and that the same was the case with B addition [36].
  • Note (f) that for the alloys with the group A elements plus Sn, (i) the A15-Nb3X and C14-NbCr2 Laves phase, both of which play a key role in oxidation, can be stable, and (ii) the C14-NbCr2 can form a eutectic with the Nbss (data for EZ8).
  • Notice (g) that the chemical inhomogeneity of the microstructure can be significant in cast alloys depending on the choice of the group B solute element; (i) that with Sn, the MACSi is highest and MACX (X = Al,Hf,Sn) low; (ii) that with Ge, the MACSi is decreased, but MACTi and MACAl increased, while MACGe is low and similar to MACSn; and (iii) that with boron, the MACX (X = Cr,Si,Ti) is lowest, but MACB is increased compared with MACGe and MACSn. In other words, (iv) with boron as the group B solute element, chemical inhomogeneity in cast alloys is significantly reduced compared with Ge or Sn, even though the characterisation of the microstructure can be challenging with each of the group B elements [35,36].
  • Note (h) that mechanical properties and the oxidation of Nb5Si3 can be affected by the precipitation of second phase in Nb5Si3 when the chosen group B element is Sn or Ge, the second phase being A15-Nb3X with the former and Nbss with the latter addition (see data for EZ8 and ZF9 in Table 10).
  • Notice (i) that in metallic UHTM RM(Nb)ICs/RCCAs with the group A elements plus one of the group B elements, pest oxidation and scale spallation in the pest oxidation regime can be prevented, and (vi) that only with the choice of boron as a group B element was the scale spallation at 1200 °C avoided.
Table 10. Comparison of the RM(Nb)ICs/RCCAs EZ8, ZF9 (38Nb-24Ti-18Si-5Al-5Ge-5Hf-5Cr [35,63]), and TT7 (38Nb-24Ti-17Si-5Al-6B-5Cr-5Hf [36]).
Phase or PropertySoluteEZ8-ACEZ8-HTZF9-ACZF9-HTTT7-ACTT7-HT
Nbss X-XXXX
Ti rich Nbss ----X-
Nb5Si3 X (t,h) **X (t,h)X (t,h)X (t,h)X (t,h)X (t,h)
Ti rich Nb5Si3 XXXXX-
Nb3Si ----X-
A15-Nb3X XX----
Laves XXX---
ρ (g/cm3) 6.89 6.96 6.8
Vol.% Nbss 15-23 *20 *1037
MACX
(at.%)
Si7.7 3.1 1.7
Ti2.9 3.4 2.4
Al1.1 2 -
Cr2.3 2.1 2.2
Hf1.1 - -
B- - 2.8
Ge- 1.1 -
Sn1.4 - -
HValloy 830883801779776658
HVNb5Si3 12581150149513911340 (T2)1200 (T2)
y/ρ)RT
(MPa cm3g−1)
393.8416.5376365.6373315
Precipitation in silicide X
Nb3X
X
Nbss
-
Pesting and scale spallation NoNoNoNoNoNo
Scale spallation at 1200 °C XXXXNoNo
* Calculated, ** t = tetragonal, h = hexagonal.
Furthermore, note that our research group has shown that the synergy of B and Sn, and Ge and Sn in KZ5-based but Hf-free alloys prevented both pest oxidation and scale spallation in the pest temperature range and scale spallation at high temperatures in the RM(Nb)ICs/RCCAs TT6 (Nb-24Ti-18Si-4Al-6B-5Cr-4Sn [36]) and OHS1 (Nb-24Ti-18Si-5Al-5Cr-5Ge-5Sn [41]).

5. Conclusions

A systematic study of the as-cast and heat-treated microstructures of three RM(Nb)ICs, namely the alloys EZ2, EZ5, and EZ6, and one RM(Nb)IC/RCCA, namely the alloy EZ8, and the hardness of alloys and phases was presented in this work. The four alloys were Nb-24Ti-18Si-based and had additions of Hf, Sn, and Ti that were in synergy simultaneously on their own (alloy EZ2) or with Al (EZ5) or Cr (EZ6) or Al and Cr (EZ8). All four alloys had density less than 7.3 g/cm3. The Nbss was stable in EZ2 and EZ6 and the C14-NbCr2 Laves phase in EZ6 and EZ8. In all four alloys, the A15-Nb3X (X = Al,Si,Sn), and tetragonal and hexagonal Nb5Si3 were stable. Eutectics of Nbss + Nb5Si3 and Nbss + C14-NbCr2 formed respectively in the cast alloys without and with Cr addition. In all four alloys, Nb3Si was not formed. In the heat-treated alloys EZ5 and EZ8, in which the Nbss was not stable, A15-Nb3X precipitated in Nb5Si3 grains. The chemical compositions of Nbss + C14-NbCr2 eutectics and some Nb5Si3 silicides and lamellar microstructures corresponded to high-entropy or complex concentrated phases (compositionally complex phases).
Microstructures and properties were considered from the perspective of the alloy design methodology NICE. The vol.% Nbss increased with increasing ΔχNbss. The hardness of the alloys increased and decreased with increasing vol.% of A15-Nb3X and Nbss, respectively. The hardness of the A15-Nb3X increased with its parameter Δχ, and the hardness of the Nbss increased with its parameters δ and Δχ. The room-temperature-specific strength of the alloys was in the range 271.7 to 416.5 MPa cm3g−1, and for EZ5 and EZ8, was higher than that of RCCAs and RHEAs. The effect of the synergy of Hf and Sn, or Hf and B or Hf and Ge on the macrosegregation of solutes, microstructures, and properties of RM(Nb)ICs/RCCAs was compared.
Comparison of the microstructures of the alloys of this work with those of alloys studied previously would suggest (i) that in RM(Nb)ICs and RM(Nb)ICs/RCCAs with Al, Cr, Hf, Si, Sn, and Ti addition, phase transformations that employ the Nb3Si silicide to engineer the microstructure cannot be used; (ii) that in Nb-18Si based RM(Nb)ICs where Hf, Sn, and Ti were in synergy, the vol.% of the Nbss + Nb5Si3 eutectic was controlled by Sn; (iii) that the synergy of Al with Sn in the presence of Hf made the formation of the Nbss+Nb5Si3 eutectic sensitive to solidification conditions; (iv) that in the presence of Hf, the dominant elements that controlled the partitioning of solutes between the Nb5Si3 and the melt were Al and Ti, of which the former was the most potent; (v) that the synergy of Sn with Hf and Ti promoted the stability of the hexagonal Nb5Si3; and (vi) that regarding the stability of Nbss, (a) Hf was part of the cause, (b) the concentration of Sn in the alloy was important in alloys where Al, Sn, and Ti were in synergy, and (c) the effect of the synergy of Al, Hf, and Sn with/without Ti on the stability of the Nbss could not be reversed with the addition of Cr.

Supplementary Materials

The following supporting information can be downloaded at: https://www.mdpi.com/article/10.3390/ma15134596/s1. Table S1: EPMA data (at%) of the as-cast and heat-treated alloy EZ2, Table S2: EPMA data (at%) of the as-cast and heat-treated alloy EZ5, Table S3: EPMA data (at%) of the as-cast and heat-treated alloy EZ6, Table S4: EPMA data (at%) of the as-cast and heat-treated alloy EZ8, Figure S1: X-ray diffractograms of the as-cast and heat-treated alloy EZ2, Figure S2: X-ray diffractograms of the as-cast and heat-treated alloy EZ5, Figure S3: X-ray diffractograms of the as-cast and heat-treated alloy EZ6, Figure S4: X-ray diffractograms of the as-cast and heat-treated alloy EZ8.

Author Contributions

Data curation, E.Z. and C.U.; Formal analysis, E.Z.; Funding acquisition, P.T.; Investigation, E.Z.; Project administration, P.T.; Supervision, P.T.; Writing—original draft, E.Z.; Writing—review & editing, C.U. and P.T. All authors have read and agreed to the published version of the manuscript.

Funding

This work was supported by the University of Sheffield, Rolls-Royce plc, and EPSRC (EP/H500405/1, EP/L026678/1).

Informed Consent Statement

Not applicable.

Data Availability Statement

All the data for this work is given in the paper, other data cannot be made available to the public.

Acknowledgments

The support of this work by the University of Sheffield, Rolls-Royce plc, and EPSRC (EP/H500405/1, EP/L026678/1) is gratefully acknowledged. For the purpose of open access, the author has applied a “Creative Commons Attribution (CC BY)” license to any author-accepted manuscript version arising.

Conflicts of Interest

The authors declare no conflict of interest.

References

  1. Tsakiropoulos, P. Alloys for application at ultra-high temperatures: Nb-silicide in situ composites. Prog. Mater. Sci. 2020, 123, 100714. [Google Scholar] [CrossRef]
  2. Senkov, O.N.; Miracle, D.B.; Chaput, K.J. Development and exploration of refractory high entropy alloys-A review. J. Mater. Res. 2018, 33, 3092–3128. [Google Scholar] [CrossRef] [Green Version]
  3. Tsakiropoulos, P. Refractory Metal (Nb) Intermetallic Composites, High Entropy Alloys, Complex Concentrated Alloys and the Alloy Design Methodology NICE: Mise-en-scène Patterns of Thought and Progress. Materials 2021, 14, 989. [Google Scholar] [CrossRef] [PubMed]
  4. Pickering, E.J.; Jones, N.G. High-Entropy Alloys: A Critical Assessment of Their Founding Principles and Future Prospects. Int. Mater. Rev. 2016, 61, 183–202. [Google Scholar] [CrossRef] [Green Version]
  5. Murty, B.S.; Yeh, J.-W.; Ranganathan, S.; Bhattacharjee, P.P. High-Entropy Alloys; Elsevier: Amsterdam, The Netherlands, 2019. [Google Scholar]
  6. Cantor, B.; Chang, I.T.H.; Knight, P.; Vincent, A.J.B. Microstructural development in equiatomic multicomponent alloys. Mater. Sci. Eng. A 2004, 375–377, 213–218. [Google Scholar] [CrossRef]
  7. Yeh, J.-W.; Chen, S.K.; Lin, S.-J.; Gan, J.-Y.; Chin, T.-S.; Shun, T.-T.; Tsau, C.-H.; Chang, S.-Y. Nanostructured High-Entropy Alloys with Multiple Principal Elements: Novel Alloy Design Concepts and Outcomes. Adv. Eng. Mater. 2004, 6, 299–303. [Google Scholar] [CrossRef]
  8. Shah, D.M. MoSi2 and Other Silicides as High Temperature Structural Materials; Antolovich, S.D., Stusrud, R.W., MacKay, R.A., Anton, D.L., Khan, T., Kissinger, R.D., Klastrom, D.L., Eds.; Superalloys; TMS (The Minerals, Metals & Materials Society): Pittsburgh, PA, USA, 1992; pp. 409–422. [Google Scholar]
  9. Hemker, K.J.; Dimiduk, D.M.; Clemens, H.; Darolia, R.; Inui, H.; Larsen, J.M.; Sikka, V.K.; Thomas, M.; Whittenberger, J.D. (Eds.) Structural Intermetallics; TMS: Warrendale, PA, USA, 2001; ISBN 0-87339-511-5. [Google Scholar]
  10. Defining Pathways for Realizing the Revolutionary Potential of High Entropy Alloys, A Study Organised by The Minerals, Metals & Materials Society (TMS). 2021; ISBN 978-0-578-96594-9. Available online: www.tms.org/HEApathways(accessed on 8 December 2021). [CrossRef]
  11. Tsakiropoulos, P. Refractory metal intermetallic composites, High entropy alloys and Complex concentrated alloys: A route to selecting substrate alloys, and bond coat alloys for environmental coatings. Materials 2022, 15, 2832. [Google Scholar] [CrossRef]
  12. Tsakiropoulos, P. On Nb Silicide Based Alloys: Alloy Design and Selection. Materials 2018, 11, 844. [Google Scholar] [CrossRef] [Green Version]
  13. Tsakiropoulos, P. Alloying and properties of C14-NbCr2 and A15-Nb3X (X = Al, Ge, Si, Sn) in Nb-silicide based alloys. Materials 2018, 11, 395. [Google Scholar] [CrossRef] [Green Version]
  14. Vellios, N.; Tsakiropoulos, P. The role of Fe and Ti additions in the microstructure of Nb–18Si–5Sn silicide-based alloys. Intermetallics 2007, 15, 1529–1537. [Google Scholar] [CrossRef]
  15. Vellios, N.; Tsakiropoulos, P. Study of the role of Fe and Sn additions in the microstructure of Nb–24Ti–18Si–5Cr silicide based alloys. Intermetallics 2010, 18, 1729–1736. [Google Scholar] [CrossRef]
  16. Knittel, S.; Mathieu, S.; Vilasi, M. Effect of tin addition on Nb–Si-based in situ composites. Part I: Structural modifications. Intermetallics 2014, 47, 36–42. [Google Scholar] [CrossRef]
  17. Li, X.; Chen, H.; Sha, J.; Hu, Z. The effects of melting technologies on the microstructures and properties of Nb–16Si–22Ti–2Al–2Hf–17Cr alloy. Mater. Sci. Eng. A 2010, 527, 6140–6152. [Google Scholar] [CrossRef]
  18. Yuan, S.; Jia, L.; Su, L.; Ma, L.; Zhang, H. The microstructure evolution of directionally solidified Nb-22Ti-14Si-4Cr-2Al-2Hf alloy during heat treatment. Intermetallics 2013, 38, 102–106. [Google Scholar]
  19. Fei, D.; Lina, J.; Sainan, Y.; Linfen, S.; Junfei, W.; Hu, Z. Microstructure evolution of a hypereutectic Nb–Ti–Si–Cr–Al–Hf alloy processed by directional solidification. Chin. J. Aeronaut. 2014, 27, 438–444. [Google Scholar]
  20. Nelson, J.; Ghadyani, M.; Utton, C.; Tsakiropoulos, P. A Study of the Effects of Al, Cr, Hf, and Ti Additions on the Microstructure and Oxidation of Nb-24Ti-18Si Silicide Based Alloys. Materials 2018, 11, 1579. [Google Scholar] [CrossRef] [Green Version]
  21. Zelenitsas, K.; Tsakiropoulos, P. Study of the role of Cr and Al additions in the microstructure of Nb-Ti-Si in situ composites. Intermetallics 2005, 13, 1079–1095. [Google Scholar] [CrossRef]
  22. Xu, Z.; Utton, C.; Tsakiropoulos, P. A study of the effect of 2 at.% Sn on the microstructure and isothermal oxidation at 800 and 1200 °C of Nb-24Ti-18Si based alloys with Al and/or Cr additions. Materials 2018, 11, 1826. [Google Scholar] [CrossRef] [Green Version]
  23. Xu, Z.; Utton, C.; Tsakiropoulos, P. A study of the effect of 5 at.% Sn on the microstructure and isothermal oxidation at 800 and 1200 °C of Nb-24Ti-18Si based alloys with Al and/or Cr additions. Materials 2020, 13, 245. [Google Scholar] [CrossRef] [Green Version]
  24. Bewlay, B.P.; Sitzman, S.D.; Brewer, L.N.; Jackson, M.R. Analyses of eutectoid phase transformations in Nb-silicide in-situ composites. Microsc. Microanal. 2004, 10, 470–480. [Google Scholar] [CrossRef]
  25. Grammenos, I.; Tsakiropoulos, P. Study of the role of Al, Cr and Ti additions in the microstructure of Nb-18Si-5Hf silicide based alloys. Intermetallics 2010, 18, 242–253. [Google Scholar] [CrossRef]
  26. Zacharis, E.; Utton, C.; Tsakiropoulos, P. A study of the effects of Hf and Sn on the microstructure, hardness and oxidation of Nb-18Si silicide based alloys without Ti addition. Materials 2018, 11, 2447. [Google Scholar] [CrossRef] [PubMed] [Green Version]
  27. Jackson, M.R.; Bewlay, B.P.; Zhao, J.-C. Niobium Silicide Based Composites Resistant to Low Temperature Pesting. U.S. Patent 6,419,765, 16 July 2002. [Google Scholar]
  28. Geng, J.; Tsakiropoulos, P.; Shao, G. A Study of the Effects of Hf and Sn Additions on the micro-structure of Nbss/Nb5Si3 based in situ composites. Intermetallics 2007, 15, 69–76. [Google Scholar] [CrossRef]
  29. Cheng, G.; He, L. Microstructure evolution and room temperature deformation of a unidirectionally solidified Nb-22Ti-16Si-3Ta-2Hf-7Cr-3Al-0.2Ho (at.%) alloy. Intermetallics 2011, 19, 196–201. [Google Scholar] [CrossRef]
  30. Kang, Y.; Qu, S.; Song, J.; Huang, Q.; Han, Y. Microstructure and mechanical properties of Nb–Ti–Si–Al–Hf–xCr–yV multi-element in situ composite. Mater. Sci. Eng. A 2012, 534, 323–328. [Google Scholar] [CrossRef]
  31. Vellios, N.; Keating, P.; Tsakiropoulos, P. On the Microstructure and Properties of the Nb-23Ti-5Si-5Al-5Hf-5V-2Cr-2Sn (at.%) Silicide-Based Alloy—RM(Nb)IC. Metals 2021, 11, 1868. [Google Scholar] [CrossRef]
  32. Bewlay, B.P.; Jackson, M.R.; Gigliotti, M.F.X. Niobium Silicide High Temperature In Situ Composites. In Intermetallic Compounds—Principles and Practice; Wiley: New York, NY, USA, 2002; Volume 3, pp. 541–560. [Google Scholar]
  33. Jackson, M.R.; Bewlay, B.P.; Briant, C.L. Creep Resistant Nb-Silicide Based Two Phase Composites. U.S. Patent 6,447,623 B1, 10 September 2002. [Google Scholar]
  34. Tsakiropoulos, P. On the Alloying and Properties of Tetragonal Nb5Si3 in Nb-Silicide Based Alloys. Materials 2018, 11, 69. [Google Scholar] [CrossRef] [Green Version]
  35. Li, Z.; Tsakiropoulos, P. On the microstructure and hardness of the Nb-24Ti-18Si-5Al-5Cr-5Ge and Nb-24Ti-18Si-5Al-5Cr-5Ge-5Hf (at.%) silicide based alloys. Materials 2019, 12, 2655. [Google Scholar] [CrossRef] [Green Version]
  36. Thandorn, T.; Tsakiropoulos, P. On the microstructure and properties of Nb-Ti-Cr-Al-B-Si-X (X = Hf, Sn, Ta) refractory complex concentrated alloys. Materials 2021, 14, 7615. [Google Scholar] [CrossRef]
  37. Cullity, B.D. Elements of X-ray Diffraction, 2nd ed.; Addison-Wesley: London, UK, 1978. [Google Scholar]
  38. Schlesinger, M.E.; Okamoto, H.; Gokhale, A.B.; Abbaschian, R. The Nb-Si (Niobium-Silicon) System. J. Phase Equilibria 1993, 14, 502–509. [Google Scholar] [CrossRef]
  39. Vellios, N.; Tsakiropoulos, P. The role of Sn and Ti additions in the microstructure of Nb–18Si base alloys. Intermetallics 2007, 15, 1518–1528. [Google Scholar] [CrossRef]
  40. Tsakiropoulos, P. On the macrosegregation of silicon in niobium silicide based alloys. Intermetallics 2014, 55, 95–101. [Google Scholar] [CrossRef]
  41. Hernandez-Negrete, O.; Tsakiropoulos, P. On the microstructure and isothermal oxidation at 800 and 1200 °C of the Nb-24Ti-18Si-5Al-5Cr-5Ge-5Sn (at.%) silicide based alloy. Materials 2020, 13, 722. [Google Scholar] [CrossRef] [PubMed] [Green Version]
  42. Subramanian, P.R.; Mendiratta, M.G.; Dimiduk, D.M. Microstructures and mechanical behaviour of Nb-Ti base beta + silicide alloys. Mat. Res. Soc. Symp. Proc. 1994, 322, 491–502. [Google Scholar] [CrossRef]
  43. Liang, H.; Chang, Y.A. Thermodynamic modelling of the Nb-Si-Ti ternary system. Intermetallics 1999, 7, 561–570. [Google Scholar] [CrossRef]
  44. Geng, T.; Li, C.; Bao, J.; Zhao, X.; Du, Z.; Guo, C. Thermodynamic assessment of the Nb-Si-Ti system. Intermetallics 2009, 17, 343–357. [Google Scholar] [CrossRef]
  45. Gigolotti, J.C.J.; Coelho, G.C.; Nunes, C.A.; Suzuki, P.A.; Joubert, J.-M. Experimental evaluation of the Nb Si Ti system from as-cast alloys. Intermetallics 2017, 82, 76–92. [Google Scholar] [CrossRef]
  46. Hunt, C.R.; Raman, A. Alloy chemistry of SIGMA-BETA-U-related phases. PT. 1. Extension of μ and occurrence of μ prime-phases in the ternary systems Nb-Ta-X-Al (X equals Fe, Co, Ni, Cu, Cr, Mo). Z. Metallkd. 1968, 59, 701–707. [Google Scholar]
  47. McCaughey, C.; Tsakiropoulos, P. Type of Primary Nb5Si3 and Precipitation of Nbss in αNb5Si3 in a Nb-8.3Ti-21.1Si-5.4Mo-4W-0.7Hf (at.%) Near Eutectic Nb-Silicide-Based Alloy. Materials 2018, 11, 967. [Google Scholar] [CrossRef] [Green Version]
  48. Zhao, J.; Utton, C.; Tsakiropoulos, P. On the Microstructure and Properties of Nb-12Ti-18Si-6Ta-5Al-5Cr-2.5W-1Hf (at.%) Silicide-Based Alloys with Ge and Sn Additions. Materials 2020, 13, 3719. [Google Scholar] [CrossRef]
  49. Zhao, J.; Utton, C.; Tsakiropoulos, P. On the Microstructure and Properties of Nb-18Si-6Mo-5Al-5Cr-2.5W-1Hf Nb-Silicide Based Alloys with Ge, Sn and Ti Additions (at.%). Materials 2020, 13, 4548. [Google Scholar] [CrossRef] [PubMed]
  50. Geng, J.; Tsakiropoulos, P. A study of the microstructures and oxidation of Nb-Si-Cr-Al-Mo in-situ composites alloyed with Ti, Hf and Sn. Intermetallics 2007, 15, 382–395. [Google Scholar] [CrossRef]
  51. Jackson, M.R. NbTiAlCrHf Alloys and Structures. U.S. Patent 5,366,565, 22 November 1994. [Google Scholar]
  52. Davidson, D.L.; Chan, K.S. The fatigue and fracture resistance of a Nb-Cr-Ti-Al alloy. Met. Mater. Trans. A 1999, 30, 2007–2018. [Google Scholar] [CrossRef]
  53. Davidson, D.L.; Chan, K.S.; Loloee, R.; Crimp, M.A. Fatigue and fracture toughness of a Nb-Ti-Cr-Al-X single-phase alloy at ambient temperature. Met. Mater. Trans. A 2000, 31, 1075–1084. [Google Scholar] [CrossRef]
  54. Murayama, Y.; Hanada, S. High temperature strength, fracture toughness and oxidation resistance of Nb-Si-Al-Ti multiphase alloys. Sci. Technol. Adv. Mater. 2002, 3, 145–156. [Google Scholar] [CrossRef] [Green Version]
  55. Bewlay, B.P.; Jackson, M.R.; Zhao, J.-C.; Subramanian, P.; Mendiratta, M.G.; Lewandowski, J. Ultrahigh-Temperature Nb-Silicide-Based Composites. MRS Bull. 2003, 28, 646–653. [Google Scholar] [CrossRef]
  56. Chan, K.S. The fracture toughness of niobium-based,in situ composites. Met. Mater. Trans. A 1996, 27, 2518–2531. [Google Scholar] [CrossRef]
  57. Cheng, G.; Tian, Y.; He, L.; Guo, J. Orientation relationship and interfacial structure betweenα-Nb5Si3and Nb solid solution in the eutectic lamellar structure. Philos. Mag. 2009, 89, 2801–2812. [Google Scholar] [CrossRef]
  58. Chan, K.S. Modelling creep behaviour of niobium silicide in-situ composites. Mater. Sci. Eng. A 2002, 337, 59–66. [Google Scholar] [CrossRef]
  59. Henshall, G.A.; Subramanian, P.R.; Strum, M.J.; Mendiratta, M.G. Continuum predictions of deformation in composites with two creping phases–II: Nb5Si3/Nb composites. Acta Mater. 1997, 45, 3135–3142. [Google Scholar] [CrossRef]
  60. Galanov, B.A.; Milman, Y.V.; Chugunova, S.I.; Goncharova, I.V.; Voskoboinik, I.V. Application of the Improved Inclusion Core Model of the Indentation Process for the Determination of Mechanical Properties of Materials. Crystals 2017, 7, 87. [Google Scholar] [CrossRef] [Green Version]
  61. Thandorn, T.; Tsakiropoulos, P. The effect of Boron on the microstructure and properties of refractory metal intermetallic composites (RM(Nb)ICs) based on Nb-24Ti-xSi (x = 16, 17 or 18 at.%) with additions of Al, Cr or Mo. Materials 2021, 14, 6101. [Google Scholar] [CrossRef]
  62. Papadimitriou, I.; Utton, C.; Tsakiropoulos, P. The impact of Ti and temperature on the stability of Nb5Si3 phases: A first-principles study. Sci. Technol. Adv. Mater. 2017, 18, 467–479. [Google Scholar] [CrossRef] [PubMed] [Green Version]
  63. Li, Z.; Tsakiropoulos, P. The Effect of Ge Addition on the Oxidation of Nb-24Ti-18Si Silicide Based Alloys. Materials 2019, 12, 3120. [Google Scholar] [CrossRef] [PubMed] [Green Version]
Figure 1. BSE images of EZ2-AC (ac) and EZ2-HT (d). (a) Top, (b) bulk, and (c) bottom of button/ingot. The A15-Nb3X is shown as Nb3Sn in (d). In (c,d), the Nb3Sn is the phase with brighter contrast than the Nbss (grey contrast phase). In (d), the Hf-rich Nb5Si3 exhibits contrast slightly darker than the Nbss and less dark than the large faceted Nb5Si3.
Materials 15 04596 g001aMaterials 15 04596 g001bMaterials 15 04596 g001c
Figure 2. (a,b) show details of the microstructure in some parts of the bulk of the ingot of EZ2-AC. See text for numbers.
Materials 15 04596 g002
Figure 3. BSE images of EZ5-AC: (a) top, (b) and (c) bulk, and (d) and (e) bottom of the ingot. Note that contrast has been enhanced in (a,b,d,e) to show different phases, in particular the Nbss and the Hf-rich Nb5Si3 (numbers 1, 2 in (e)). See text for numbers.
Materials 15 04596 g003aMaterials 15 04596 g003bMaterials 15 04596 g003c
Figure 4. BSE images of the heat-treated alloy EZ5, (a) EZ5-HT1, and (b) EZ5-HT2. In (b), the numbers 1 and 2 indicate A15-Nb3X.
Materials 15 04596 g004aMaterials 15 04596 g004b
Figure 5. BSE images of the microstructure of EZ6-AC: (a) bulk and (b) bottom of ingot. Contrast has been enhanced to show all phases. The A15-Nb3X compound is shown as Nb3Sn. See Figure 6 for further details of the microstructure.
Materials 15 04596 g005
Figure 6. BSE images showing details of the microstructure of EZ6-AC: (a) top, (bd) bulk, and (e) bottom of the ingot. Numbers 1 and 2 show Ti-rich Nbss; numbers 3, 4, and 5 show Ti- and Hf-rich Nb5Si3. The NbCr2 Laves phase is indicated with L, and the A15-Nb3X is shown as Nb3Sn.
Materials 15 04596 g006aMaterials 15 04596 g006bMaterials 15 04596 g006c
Figure 7. BSE image of the microstructure of EZ6-HT1. The Hf-rich Nb5Si3 is indicated with the number 1, and thin strips of Laves phase at the interface between Nbss and the aforementioned silicide are shown with L. Bright phase on the left-hand side of number 1 in the bottom left-hand corner is HfO2. The A15-Nb3X is shown as Nb3Sn.
Materials 15 04596 g007
Figure 8. (ad) BSE images of the microstructure of EZ6-HT2. In (ad), the Laves phase is indicated with L. In (b), the Hf-rich Nb5Si3 and the A15-Nb3X are indicated with the numbers 1 and 2, respectively, while (c) shows details of the microstructure near the large Nb5Si3 grain in (b). For A in (bd), see text. In (bd), the contrast has been enhanced to show the microstructure A.
Materials 15 04596 g008aMaterials 15 04596 g008bMaterials 15 04596 g008c
Figure 9. BSE images (a) of the bulk and (b) of the bottom of the as cast ingot of EZ8. Laves phase is indicated with L.
Materials 15 04596 g009aMaterials 15 04596 g009b
Figure 10. BSE images of the top (a,b), bulk (c,d), and bottom (e,f) of the ingot of EZ8-AC showing details of the microstructure. The Laves phase is indicated with L, and the Nbss with ss. The A15-Nb3X is shown as Nb3Sn. In (a), the Nb3Sn is shown with the numbers 1, 6, and 7; the Ti- and Hf-rich Nb5Si3 with the numbers 3, 4, 5, 8, and 9; and the Laves phase with 2. In (b), the Nb3Sn is shown with the number 1, and the Ti- and Hf-rich Nb5Si3 with 3. In (c), the Nb3Sn is shown with the number 1, and the Ti- and Hf-rich Nb5Si3 with 3. In (d), the Nbss is shown with the number 4; Nb3Sn with 3, 5, and 6; Nb5Si3 with 1; Ti- and Hf-rich Nb5Si3 with 7 and 8; the Laves phase with 2; and HfO2 is the very bright phase on the left-hand side of the number 5. In (e), Nb3Sn is shown with the numbers 1, 3, 4, and 5; the Nbss with 6; and the Nb5Si3 with 2. In (f), the Nb3Sn is shown with the numbers 1, 2, 3, and 6; the Laves phase with 4; and the Ti- and Hf-rich Nb5Si3 with 5. For the areas A in (bd) and the area B in (f), see text.
Materials 15 04596 g010aMaterials 15 04596 g010bMaterials 15 04596 g010cMaterials 15 04596 g010d
Figure 11. BSE images of the microstructure of EZ8-HT. In (a,b) the Laves phase is indicated with L. The A15-Nb3X is shown as Nb3Sn. In (b) the Laves phases is shown with the number 1, the Nb3Sn with 2, 7, the Nb5Si3 with 3, 6, 9, the Hf-rich Nb5Si3 with 4, 5, 8. The brighter contrast areas to the left of number 4 are Hf-rich Nb5Si3 with Nb/(Ti + Hf) = 0.6.
Materials 15 04596 g011
Figure 12. The Nb versus Ti + Hf map for the Nb5Si3 in the alloys of this work. Blue data for “normal” Nb5Si3, red data for Hf-rich Nb5Si3. For all data R2 = 0.9962. Diamonds for the RM(Nb)IC/RCCA alloy EZ8.
Materials 15 04596 g012
Figure 13. (a) The Ti versus Hf map and (b) the Nb versus Ti/Hf map for the Nb5Si3 in the alloys of this work. Blue data for “normal” Nb5Si3, red data for Hf-rich Nb5Si3. Diamonds for the RM(Nb)IC/RCCA alloy EZ8. In (a,b), the data for EZ8 have, respectively, R2 = 0.9956 and R2 = 0.9936. For all data in (a,b), the R2 value is 0.8938 and 0.8544, respectively.
Materials 15 04596 g013
Figure 14. Change of lattice parameter of Nbss in (a) AC and (b) HT Nb-18Si-based RM(Nb)ICs. Note that Ti was present in all alloys with the exception of the alloy EZ1. For nominal alloy compositions and the lattice parameter data, see the Table 5. Green color is used for the ΔαNbss of alloys for which there is data for the AC and HT conditions. In (a), from left to right, alloy comparisons are as follows: KZ3-AC vs. KZ7-AC (i.e., ΔαNbss = αKZ3 − αKZ7), EZ2-AC vs. EZ5-AC, KZ3-AC vs. KZ4-AC, EZ2-AC vs. EZ6-AC, NV6-AC vs. EZ2-AC, KZ3-AC vs. NV6-AC, KZ7-AC vs. EZ5-AC synergy with Al, KZ4-AC vs. EZ6-AC synergy with Cr, and EZ1-AC vs. EZ2-AC. In (b), from left to right, alloy comparisons are as follows: KZ3-HT vs. KZ4-HT, EZ2-HT vs. EZ6-HT, NV6-HT vs. EZ2-HT, KZ3-HT vs. NV6-HT, KZ4-HT vs. EZ6-HT synergy with Cr, and EZ1-HT vs. EZ2-HT.
Materials 15 04596 g014aMaterials 15 04596 g014b
Figure 15. (a) Nb versus Ti + Hf, (b) Ti versus Hf, (c) Hf versus Si, and (d) Hf versus Si + Sn concentration in the Nbss in the alloys of this work.
Materials 15 04596 g015aMaterials 15 04596 g015b
Figure 16. Trends in solute addition concentrations in A15-Nb3X in the alloys of this work: (a) Ti vs. Hf, (b) Hf vs. Sn, (c) Ti vs. Sn, (d) Ti vs. Si+Sn, and (e) Nb vs. Ti/Hf. Colors are as follows: EZ2 green, EZ5 brown, EZ6 red, EZ8 blue.
Materials 15 04596 g016aMaterials 15 04596 g016bMaterials 15 04596 g016c
Figure 17. Data for the C14-NbCr2 Laves phase in the alloys of this work: (a) VEC versus Cr content and (b) R<Nb>/R<Cr> versus <R> = R<Nb> + R<Cr>, where R<Nb> = ∑inCi(r<Nb>)i, where Ci and (r<Nb>)i are, respectively, the concentration (at.%) and atomic radius of Nb and element i substituting Nb in the Laves phase; and R<Cr> = ∑inCi(r<Cr>)i, where Ci and (r<Cr>)i are, respectively, the concentration (at.%) and atomic radius of Cr and element i substituting Cr in the Laves phase.
Materials 15 04596 g017aMaterials 15 04596 g017b
Figure 18. Correlation of the volume fraction of the phases in RM(Nb)ICs with/without Ti addition with the parameter VEC of the alloys that were studied in [26] and this work: (a) Nbss, (b) Nb5Si3, (c) A15-Nb3X, and (d) C14-NbCr2 Laves phase. Colors and symbols as follows: red for as-cast alloys, blue for HT alloys, circles for Ti-free alloys, and triangles for Ti-containing alloys. In (ac), the black arrow indicates the effect of Ti addition. In (a,d), the dotted lines are given to “guide the eye”.
Materials 15 04596 g018aMaterials 15 04596 g018b
Figure 19. Average solute concentrations from Nb5Si3 towards the Nbss (a) for the lamellar microstructure in EZ2-AC and (b) the microstructure A in EZ6-HT2. In (b), BCHS = bright contrast hexagonal silicide. The data in this figure is not from a line scan; instead, it is quantitative analysis data from microstructures like those in the Figure 2 and Figure 8. The A15-Nb3X is shown as Nb3Sn.
Materials 15 04596 g019
Figure 20. Ratios or sums of solutes based on average solute concentrations from Nb5Si3 towards the Nbss (a) for the lamellar microstructure in EZ2-AC and (b) the microstructure A in EZ6-HT2. In (b), BCHS = bright contrast hexagonal silicide. The data in this figure is not from a line scan; instead, it is quantitative analysis data from microstructures like those in the Figure 2 and Figure 8. The A15-Nb3X is shown as Nb3Sn.
Materials 15 04596 g020
Figure 21. Hardness of (a) alloys, (c) Nb5Si3, (d) A15-Nb3X, (e) and (f) Nbss, and (b) room-temperature-specific strength of the alloys of this work versus (ac) the alloy parameter VEC, (d) the parameter Δχ of the A15-Nb3X, and (e) the parameter δ and (f) the parameter Δχ of Nbss. In (e), the R2 value is for the data for the alloys EZ2 and EZ6, where the Nbss is a stable phase. Colors as follows: blue alloy EZ2, red EZ5, brown EZ6, and green EZ8. In (af), the dotted line is to “guide the eye”.
Materials 15 04596 g021aMaterials 15 04596 g021bMaterials 15 04596 g021cMaterials 15 04596 g021d
Figure 22. Alloy Vickers hardness versus vol.% (a) of Nbss, (c) of A15-Nb3X, and (d) of Nb5Si3, and (b) vol.% Nbss versus ΔχNbss. In (d), R2 = 0.5292 for the as-cast alloys and R2 = 0.9874 for the heat-treated alloys. In (b), the R2 value is for the alloys where the Nbss is a stable phase. Colors as follows: blue alloy EZ2, red EZ5, brown EZ6, and green EZ8. In (a,c), the dotted line is given to “guide the eye”.
Materials 15 04596 g022aMaterials 15 04596 g022bMaterials 15 04596 g022c
Table 1. Data for the density, hardness, and % area of phases for the alloys EZ2, EZ5, EZ6, and EZ8.
Alloy and ConditionDensity (g/cm3)Hardness
(HV10)
% Area
Nb5Si3Nb3SnNbssEutecticNbCr2
EZ2-AC7.34 ± 0.02
7.31–7.36
610 ± 27
570–653
50 ± 2-50 ± 2--
EZ2-HT7.34 ± 0.01
7.32–7.35
611 ± 20
579–645
49 ± 323 ± 528 ± 2--
EZ5-AC *6.9 ± 0.01
6.85–6.96
761 ± 19
740–792
36 ± 217 ± 2-46 ± 3-
EZ5-HT1 *7.12 ± 0.03
7.08–7.17
845 ± 21
819–870
41 ± 259 ± 2---
EZ5-HT2 *7.09 ± 0.02
7.07–7.15
855 ± 27
821–897
41 ± 259 ± 2---
EZ6 AC7.17 ± 0.01
7.14–7.20
738 ± 57
634–813
47 ± 214 ± 137 ± 2-2 ± 1
EZ6 HT1 *7.29 ± 0.02
7.26–7.31
723 ± 48
661–802
-----
EZ6 HT2 *7.30 ± 0.01
7.29–7.33
765 ± 13
743–787
34 ± 143 ± 121 ± 1-2 ± 1
EZ8-AC6.89 ± 0.01
6.84–6.92
830 ± 79
799–894
56.3 ± 2.424.8 ± 0.915.4 ± 2.1-3.5 ± 0.2
EZ8-HT6.93 ± 0.01
6.89–7.03
883 ± 37
803–939
40.2 ± 1.152.9 ± 1.3--6.9 ± 0.2
* see text.
Table 2. Macrosegregation (at.%) MACX of addition X (X = Al, Cr, Hf, Si, Sn, Ti) in the AC alloys EZ2, EZ5, EZ6, and EZ8.
AlloyMACX
AlCrHfSiSnTi
EZ2---512.9
EZ5---3.711.3
EZ6-3.81.37-6.8
EZ81.12.31.17.71.42.9
Table 3. Summary of phases in the AC and HT alloys EZ2, EZ5, EZ6, and EZ8. Note that α, β, and γ refer to the structure of Nb5Si3 [38]: α and β, tetragonal Nb5Si3; γ, hexagonal Nb5Si3.
As-Cast Alloys
PhaseEZ2EZ5EZ6EZ8
NbssXXXX
Ti rich NbssX-X-
A15-Nb3X (X = Al,Si,Sn)XXXX
Nb5Si3X, α, βX, α, β, γX, α, β, γX, α, β, γ
Hf-rich Nb5Si3XXXX
Nbss + Nb5Si3 eutecticXX--
C14-NbCr2 Laves--XX
Nbss + NbCr2 eutectic--XX
Heat-Treated alloys
PhaseEZ2-HTEZ5-HT1 *EZ6-HT1 *EZ8-HT
NbssX-X-
A15-Nb3X (X = Al,Si,Sn)XXXX
Nb5Si3X, α, β, γX, α, β, γX, α, β, γX, α, β, γ
Hf-rich Nb5Si3XXXX
C14-NbCr2 Laves--XX
EZ5-HT2 *EZ6-HT2 *
Nbss--X-
A15-Nb3X (X = Al,Si,Sn)-XX-
Nb5Si3-X, α, β, γX, α, β, γ-
Hf-rich Nb5Si3-XX-
C14-NbCr2 Laves--X-
* See text.
Table 4. Hardness data of the phases in the alloys EZ2, EZ5, EZ6, and EZ8.
Alloy and
Condition
Phase
Nb5Si3A15-Nb3XNbss
EZ2-AC1269 ± 53
1123–1422
-540 ± 26
519–582
EZ2-HT1230 ± 46
1106–1394
741 ± 48
644–814
464 ± 31
395–511
EZ5-AC1197 ± 41
1157–1247
792 ± 38
723–839
667 ± 78
543–720
EZ5-HT11230 ± 92
1037–1425
897 ± 25
849–930
-
EZ5-HT21242 ± 73
1058–1390
888 ± 21
843–915
-
EZ6 AC1372 ± 68
1231–1552
791 ± 25
764–830
686 ± 14
648–713
EZ6 HT21299 ± 41
1128–1368
843 ± 21
804–895
507 ± 12
480–533
EZ8-AC1258 ± 37
1190–1370
802 ± 25
764–830
677 ± 9
651–710
EZ8-HT1150 ± 41
1089–1368
899 ± 21
816–930
-
Table 5. Lattice parameter (Å) of the bcc Nbss in Nb-18Si silicide-based alloys.
Alloy, Condition, and HT TemperatureLattice Parameter (Å)
EZ1 AC (Nb-18Si-5Hf-5Sn) [26]3.299
EZ1 HT1 1500 °C3.325
EZ1 HT2 1500 °C3.310
KZ3-AC (Nb-24Ti-18Si) [21]3.253
KZ3-HT 1500 °C3.296
NV6-AC (Nb-24Ti-18Si-5Sn) [39]3.295
NV6-HT 1200 °C3.293
EZ2-AC (Nb-24Ti-18Si-5Hf-5Sn)3.292
EZ2-HT 1500 °C3.287
KZ7 AC (Nb-24Ti-18Si-5Al) [21]3.273
EZ5 AC (Nb-24Ti-18Si-5Al-5Hf-5Sn)3.284
KZ4 AC (Nb-24Ti-18Si-5Cr) [21]3.251
KZ4 HT 1500 °C3.257
EZ6 AC (Nb-24Ti-18Si-5Cr-5Hf-5Sn)3.256
EZ6 HT2 1200 °C3.228
Table 6. Effect of alloying addition(s) (nominal composition, at.%) on the macrosegregation of Si (MACSi = CSimax − CSimin, at.% [40]) in as-cast Nb-18Si silicide-based alloys with/without Ti addition.
Nominal CompositionAlloyMACSiReference
Nb-18Si-24Ti-5Al-5Cr-5SnZX810[23]
Nb-18Si-24Ti-5Al-5Cr-5Hf-5SnEZ87.7This work
Nb-18Si-24Ti-5Cr-5SnZX47.3[23]
Nb-18Si-24Ti-5SnNV67.1[39]
Nb-18Si-24Ti-5Cr-5Hf-5SnEZ67This work
Nb-18Si-24Ti-5Al-2Sn
Nb-18Si-24Ti-5Al-5Sn
ZX5
ZX6
5.5
5.5
[22]
[23]
Nb-18Si-24Ti-5Hf-5SnEZ25This work
Nb-18Si-5Cr-5Hf-5SnEZ34.1[26]
Nb-18Si-24Ti-5Al-5Cr-5HfJN14[20]
Nb-18Si-5Al-5Hf-5SnEZ43.9[26]
Nb-18Si-24Ti-5Al-5Hf-5SnEZ53.7This work
Nb-18Si-24Ti-5Cr-2SnZX33.6[22]
Nb-18Si-24Ti-5HfYG33.3[25]
Nb-18Si-24Ti-5Al-5Cr-2SnZX73[22]
Nb-18Si-5Hf-5Sn
Nb-18Si-5Al-5Hf
EZ1
YG2
2.8
2.8
[26]
[25]
Nb-18Si-5Al-5Sn
Nb-18Si-5Sn
Nb-18Si-5Cr-5Hf
EZ7
NV9
YG1
2.5
2.5
2.5
[26]
[39]
[25]
Nb-18Si-24Ti-5AlKZ72.3[21]
Nb-18Si-24Ti-5CrKZ41.9[21]
Nb-18Si-24Ti-5Al-5CrKZ51.4[21]
Table 7. Effect of the different alloying elements on the formation and composition (at.%) of Nbss + Nb5Si3 eutectic or Nbss + NbCr2 Laves phase eutectic in various as-cast RM(Nb)ICs.
Alloy Designation and Nominal CompositionArea of the AC Ingot Where
Eutectic Formed
Composition of the Eutectic *
TopBulkBottom
Nbss + Nb5Si3
NV9 (Nb-18Si-5Sn) [41]XXX79.5M-20.5(Si + Sn)
NV6 (Nb-24Ti-18Si-5Sn) [39]XXX79.5M-20.5(Si + Sn)
YG1 (Nb-18Si-5Cr-5Hf) [25]--X75.4M-24.6Si
YG2 (Nb-18Si-5Al-5Hf) [25]XXX79M-21(Si + Al)
YG3 (Nb-24Ti-18Si-5Hf) [25]-X-79M-21(Si + Sn)
EZ1 (Nb-18Si-5Hf-5Sn) [26]XXX78.7M-21.3(Si + Sn)
EZ2 (Nb-24Ti-18Si-5Hf-5Sn)XXX78.3M-21.7(Si + Sn)
EZ4 (Nb-18Si-5Al-5Hf-5Sn) [26]XX-78.3M-21.7(Si + Sn + Al)
EZ5 (Nb-24Ti-18Si-5Al-5Hf-5Sn)-X-76.7M-23.2(Si + Sn + Al)
Nbss + NbCr2
EZ3 (Nb-18Si-5Cr-5Hf-5Sn) [26]XXX50.4M-49.6(Cr + Si + Sn)
EZ6 (Nb-24Ti-18Si-5Cr-5Hf-5Sn)XX-54M-46(Cr + Si + Sn)
EZ8 (Nb-24Ti-18Si-5Al-5Cr-5Hf-5Sn)XXX50.9M-49.1(Cr + Si + Sn)
* M represents the total concentration of transition and refractory metals in the alloy.
Table 8. Comparison of compositions (at.%) of Nbss, A15-Nb3X, Sn-rich A15-Nb3X, Nb5Si3, and Hf-rich Nb5Si3 in different as-cast Nb silicide-based alloys. For alloy nominal compositions and references, see the Table 6.
PhaseSolute FunctionAlloy
EZ1EZ2EZ3EZ4EZ5EZ6EZ7EZ8NV9
NbssSi/Sn0.30.30.3 0.3 0.3
Si/(Sn + Al) 0.20.2 0.2
A15-Nb3XSi + Sn (at.%)17.218.818.2 18.6 18.2
Si + Sn + Al 19.520.4 19.620.9
Sn rich A15-Nb3XSi + Sn + Al 19.9
Nb5Si3Si + Sn38.43838.6 37.8 36.8
Si + Sn + Al 37.737.4 38.437.2
Hf-rich Nb5Si3Si + Sn38.438.538.8 38.2
Si + Sn + Al 38.337 37.5
Nbss + Nb5Si3 eutecticSi + Sn21.321.2 20.5
Si + Sn + Al 21.723.2
Table 9. Effect of the different alloying elements on the formation and composition (at.%) of the A15- Nb3X compound in various as-cast RM(Nb)ICs.
Alloy Designation and Nominal CompositionArea of the AC Ingot where the A15-Nb3X FormedComposition of the A15-Nb3X *
TopBulkBottom
NV9 (Nb-18Si-5Sn) [39]XXX82.2M-17.8 (Si + Sn)
NV6 (Nb-24Ti-18Si-5Sn) [39]XXX81.8M-18.2 (Si + Sn)
EZ1 (Nb-18Si-5Hf-5Sn) [26]-XX-82.6M-17.4 (Si + Sn)
81.9M-18.1 (Si + Sn)
EZ2 (Nb-24Ti-18Si-5Hf-5Sn)--X81.2M-18.8 (Si + Sn)
EZ3 (Nb-18Si-5Cr-5Hf-5Sn) [26]XXX81.8M-18.2 (Si + Sn)
EZ4 (Nb-18Si-5Al-5Hf-5Sn) [26]XXX80.5M-19.5 (Si + Sn + Al)
EZ5 (Nb-24Ti-18Si-5Al-5Hf-5Sn)-XX79.6M-20.4 (Si + Sn + Al)
EZ6 (Nb-24Ti-18Si-5Cr-5Hf-5Sn)XXX81.4M-18.6 (Si + Sn + Al)
EZ7 (Nb-18Si-5Al-5Sn) [26]XXX80.4M-19.6 (Si + Sn + Al)
EZ8 (Nb-24Ti-18Si-5Al-5Cr-5Hf-5Sn)XXX79.1M-20.9 (Si + Sn + Al)
* M is the total concentration of transition and refractory metals in the alloy.
Publisher’s Note: MDPI stays neutral with regard to jurisdictional claims in published maps and institutional affiliations.

