1. Introduction
Porous structures are a universal term used to describe the size, distribution, and morphology of pores of the materials. They can be classified by porosity types (closed and open pores) and by the arrangement of elementary cells (stochastic and non-stochastic) [
1]. Traditional manufacturing methods of porous structures are controlled powder sintering, polymeric sponge replication, molding and sintering of short metal fibers, and solid-state foaming by an expansion of argon-filled pores. These techniques have many limitations, such as contamination, impurity phases, or limited and predetermined part geometries. However, the biggest challenge is limited control over pore size, shape, volume fraction, and their spatial distribution [
1,
2,
3]. Additive manufacturing (AM) may overcome these limitations. Moreover, with a wide range of available technologies, it is possible to produce porous structures from various materials, including thermoplastics, resin, ceramics, metals, and alloys.
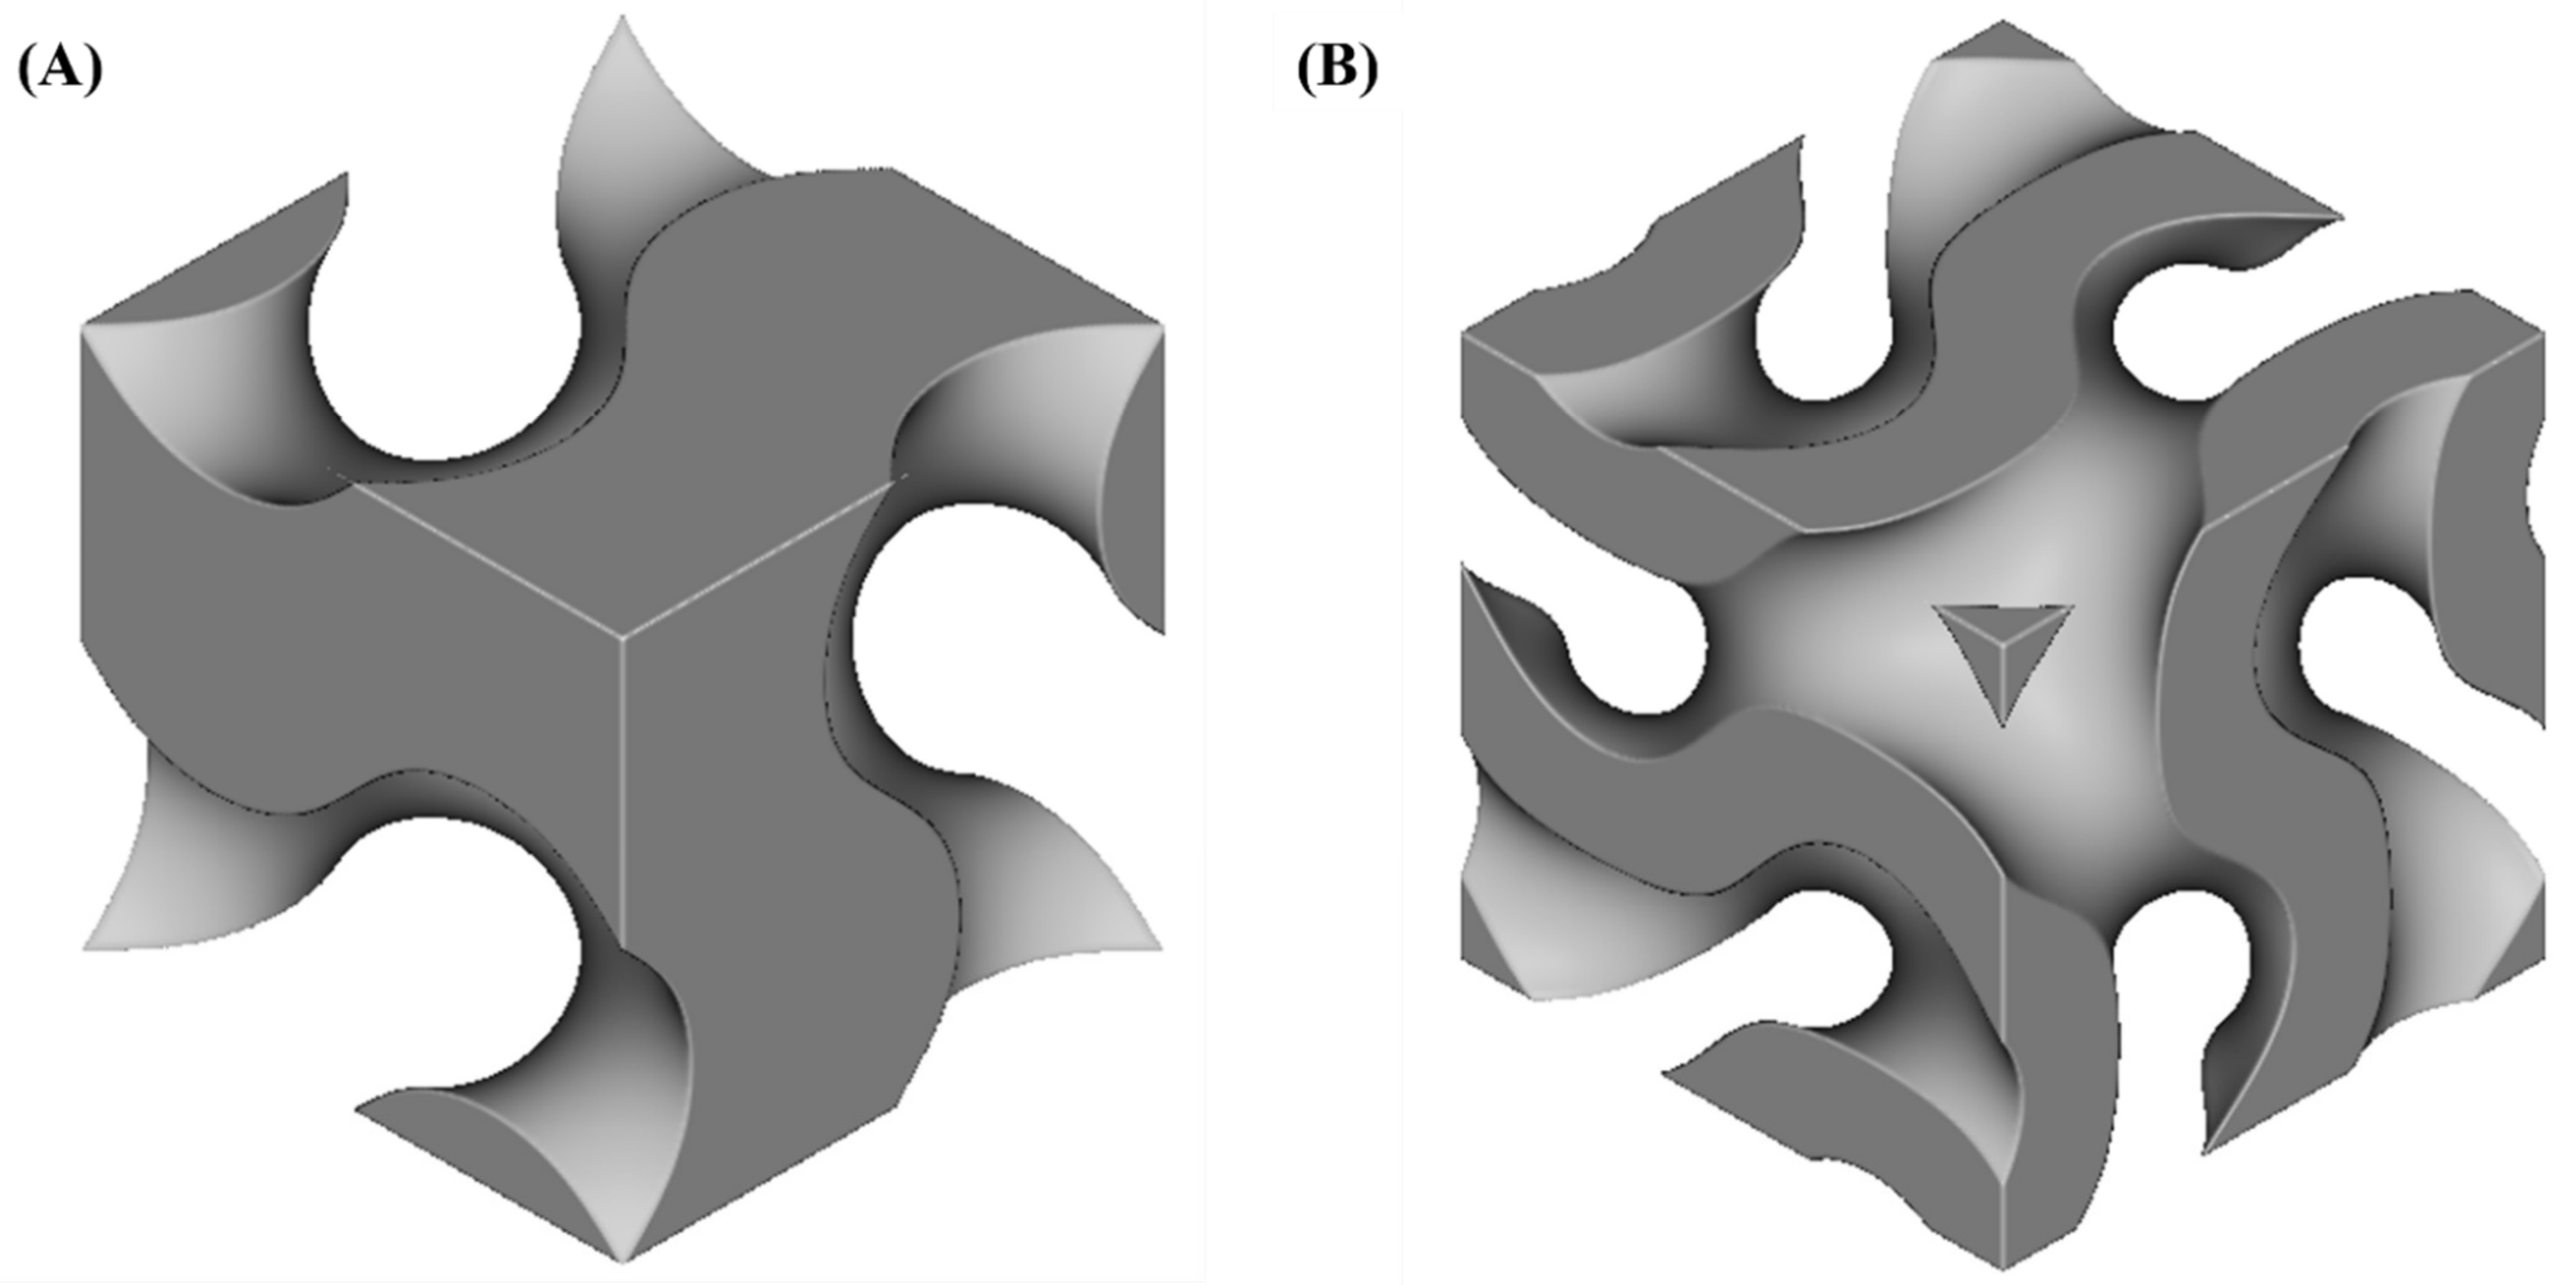
Recently, there has been increased interest in additively manufacturing porous structures based on triply periodic minimal surfaces (TPMS) topology. The TPMS are naturally inspired structures with periodically, infinite continuous non-self-intersecting surfaces with zero mean curvature in three independent directions. Porous architectures with the TPMS topology are constructed by repeating elements, so-called unit cells [
4,
5,
6]. The main advantages of TPMS-type structures are elimination of the effect stress concentration at nodal points due to the continued curvature of the cells walls [
7], relatively large surface area, continuous internal channels [
4], and self-supported architecture [
8]. Moreover, by changing parameters such as relative density, porosity, pore size, or wall thickness, it is possible to design structures with expected mechanical properties. TPMS structures also have a good fatigue behavior [
9]. Therefore, the TPMS structures are potential candidates for energy absorption [
10,
11,
12,
13], heat dissipation [
14], biomedical [
3,
15,
16,
17,
18,
19], and vibration control applications [
20].
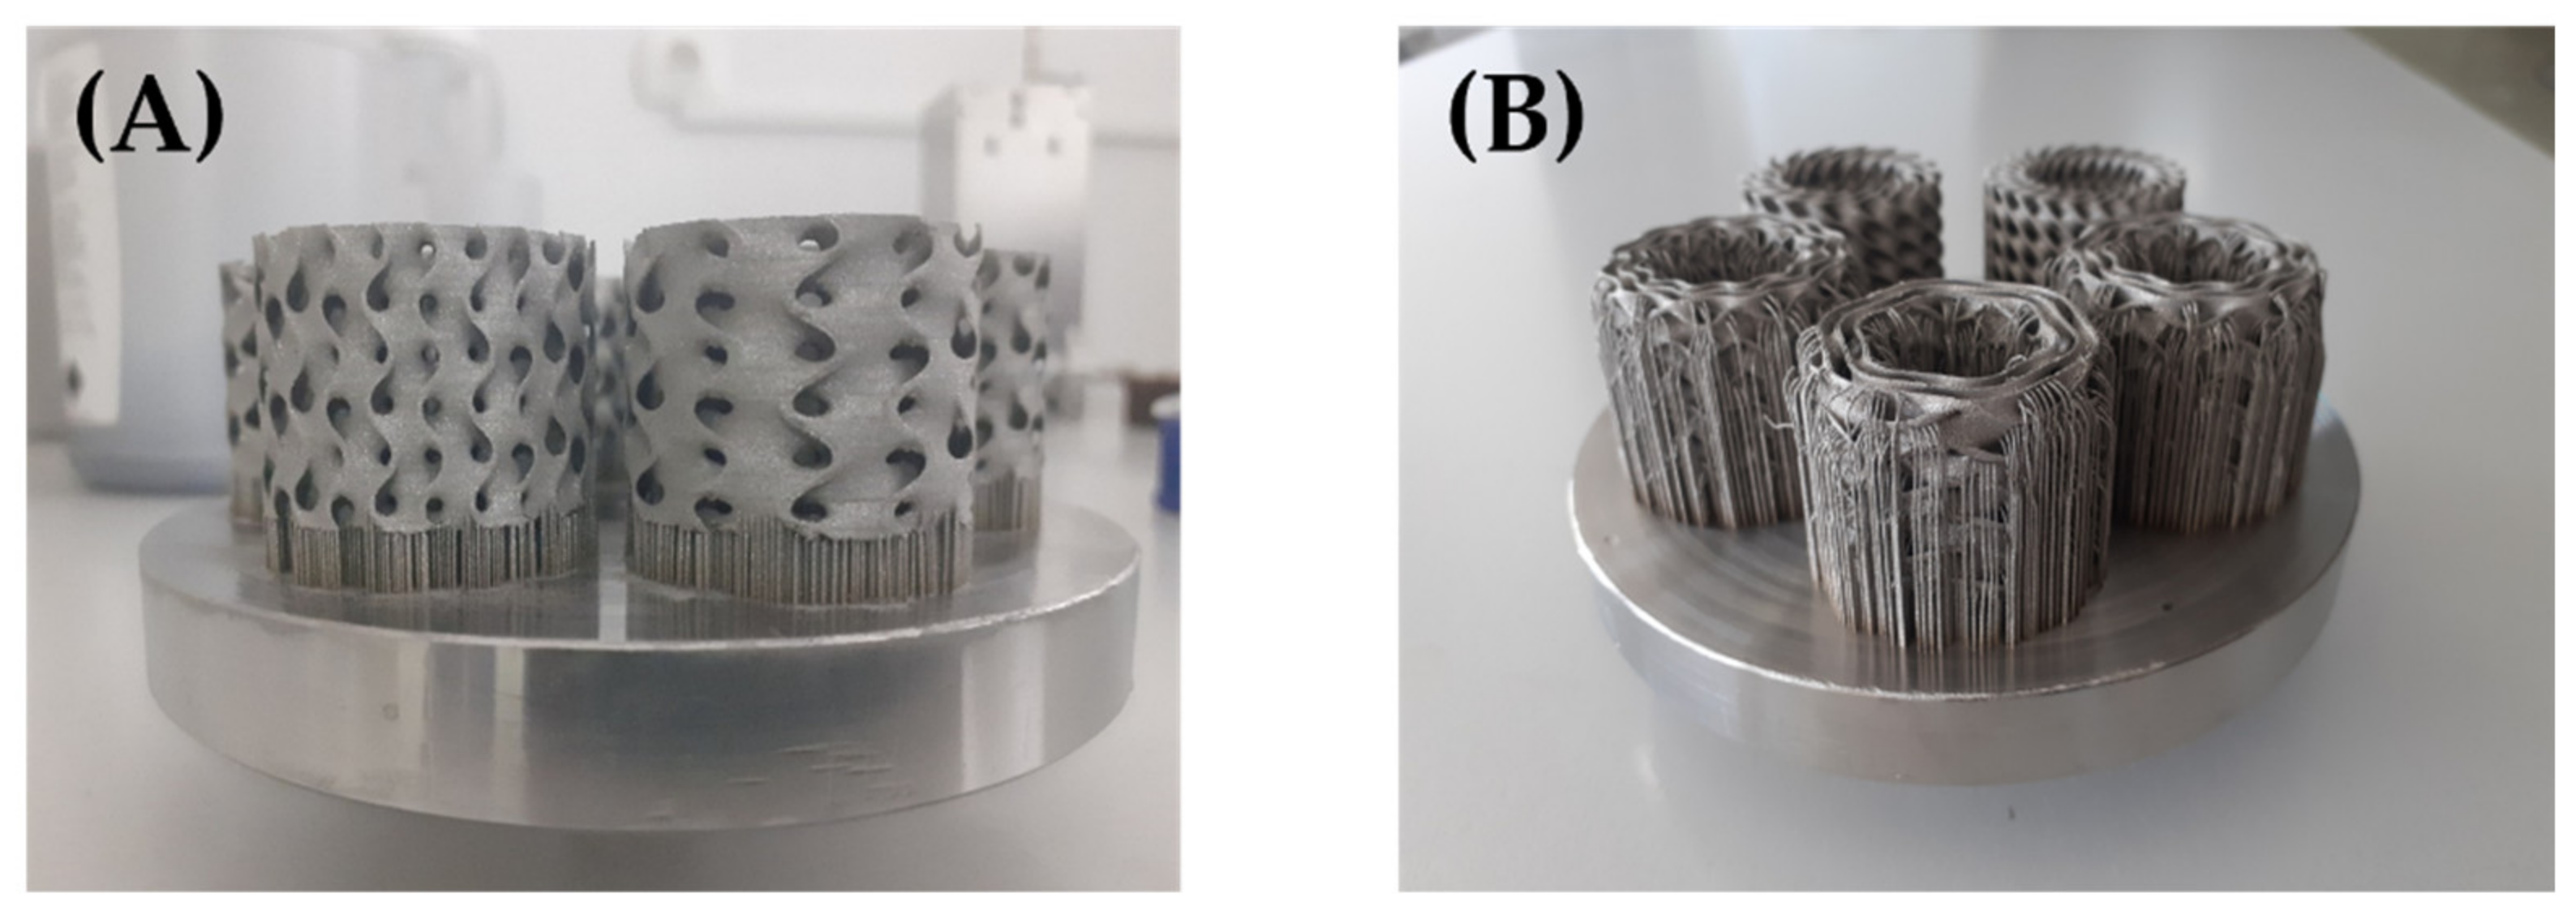
Due to of complex architecture of TPMS structures, its fabrication using powder bed fusion techniques (such as selective laser melting or electron beam melting) is a challenge. The process parameters and design should be selected taking into account manufacturing constraints such as printing resolution, removal of necessary supports, and internal powder entrapment [
21,
22,
23].
The properties of TPMS lattice structures are of interest to many researchers. According to Mahmoud et al. [
24], the factors affecting the mechanical properties of lattice structures can be categorized into manufacturing and design-related factors. Most authors focus on the impact of the design-related factors, such as relative density (volume fraction), porosity, pore size, and cell type on mechanical behavior and energy absorption capacity under compressive loading conditions, by comparing different types of structures with uniform or graded morphology. The theoretical basis for describing the mechanical response of porous (lattice) structures under compressive load was developed by Gibson et al. [
25].
Zaharin et al. [
1] investigated the influence of unit cell type (cube and gyroid) and pores size (range of 300 to 600 µm) on porosity, and mechanical behavior additively manufactured Ti6Al4V porous structure. Research showed that the elastic modulus and yield strength of the analyzed samples decrease with an increase its porosity. The obtained values for gyroids were similar to human bones, which confirms the usefulness of these TPMS structures in applications in bone tissue engineering and orthopedics. Yan et al. [
8] indicated that Young’s modulus and yield strength of gyroid cellular lattice structures increases with the increase in its volume fraction (relative density).
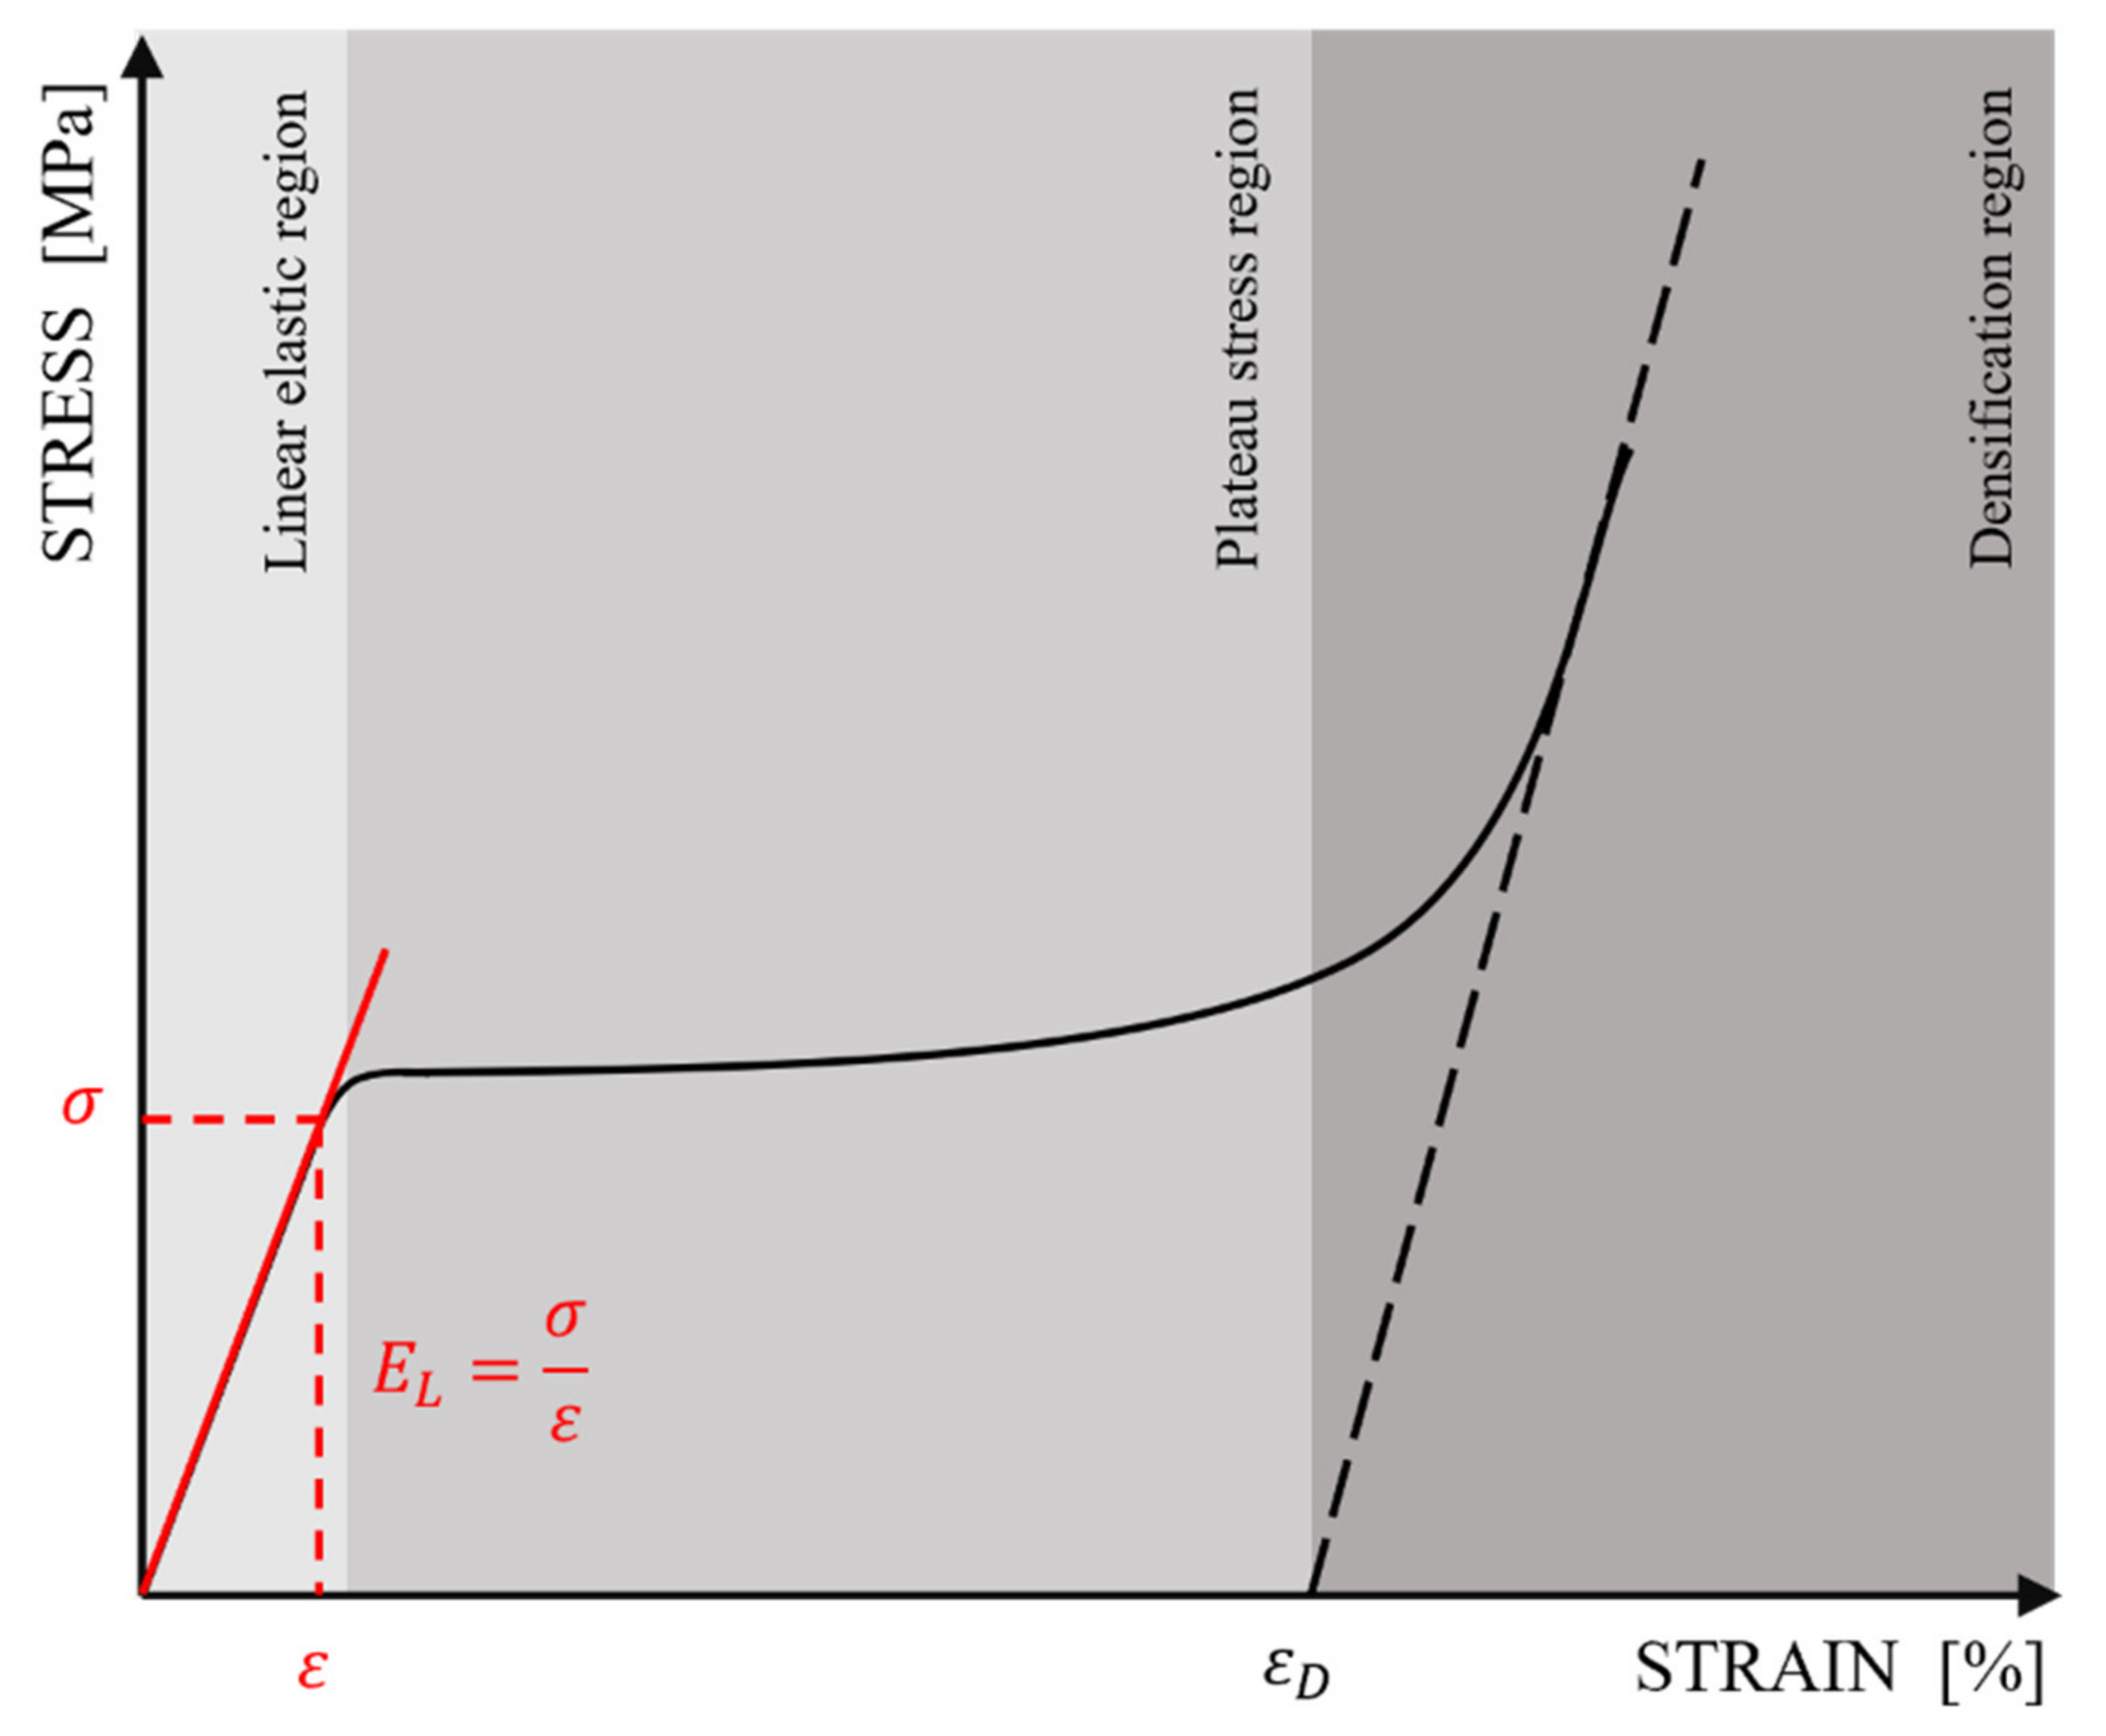
Maskery et al. [
26] accentuate that the deformation mode and the related stress–strain curve (especially the long and flat plateau) determine the suitability of the structure in energy absorption applications. They investigated the failure models in double (matrix phases) gyroid structures made of Al-Si10-Mg alloy and fabricated using selective laser melting technology. The samples differed in unit cell size, respectively, 3, 4.5, 6, and 9 mm, while maintaining the same relative density (volume fraction). The tested samples showed three types of failure under compressive load: “layer-by-layer” mode, brittle fracturing of the cell walls mode with the propagation of a crack (or cracks) through the lattice structure, and diagonal shear mode. The failure mode depends on the cell size. Moreover, they showed that a way to change deformation behavior in the case of Al-Si10-Mg samples is post-manufacture heat treatment.
Special attention should also be noted to the works that evaluated the mechanical properties, failure resistance, and permeability of different types of TPMS structures. Yanez et al. [
27] investigated the diamond and gyroid structures that were fabricated using electron beam melting (EBM) technology from Ti-6Al-4V alloy and observed that specific strength (compressive strength against density) for gyroid structures is correlated with strut (wall) angle. Decreasing the strut angle increased the modulus of elasticity and compressive strength. Moreover, they concluded that the gyroid structures showed better strength to weight ratios in comparison with other TPMS structures. Bobber et al. [
28] evaluated the three types of TPMS structures, primitive, diamond, and gyroid, fabricated using laser selective melting technology from Ti-6Al-4V alloy. For every unit cell, the porosity and surface area decreases with increasing wall thickness. The tested samples also showed exceptionally high resistance to fatigue and a unique combination of relatively low modulus of elasticity and high yield point. The mechanical properties of primitive, diamond, and gyroid structures were also investigated by Maskery et al. [
29]. TPMS lattice structures were fabricated using selective laser sintering from polyamide. Research shows that the sample’s deformation process, failure mode, and mechanical properties depend on cell geometry. The primitive lattice structure shows the highest elastic modulus, but the deformation process was characterized by structural bucking and low failure strain. The authors indicate that this may be related to stretching-dominated deformation. In turn, the gyroid and diamond structures showed quite similar mechanical responses typical for a structure in which the deformation process is dominated by bending. These conclusions were also reflected in the research conducted by Yang et al. [
5]. Moreover, based on numerical and experimental results, Yang et al. [
5] concluded that geometrical factors affecting on stiffness and strength of analyzed cubic gyroid samples are the number of cells, surface thickness, bulk size, and isovalue. Zhang et al. [
12] investigated the energy absorption capacity of gyroid, diamond, and primitive TPMS sheet structures. The experimental results show that the mechanical response and deformation mechanism of the tested structure depends on unit cell geometry. The primitive shape samples presented a collapse mechanism by diagonal shear after yielding, while the diamond and gyroid shapes samples presented stable collapse mechanisms due to relatively uniform stress distributions across unit cells. Based on the results authors concluded that diamond structures have the largest stiffness and energy absorption ability.
In the literature, much attention is also paid to the mechanical property of TPMS structures with uniform or graded morphology. Li et al. [
30] compared the mechanical properties and energy absorption of sheet-based (matrix phases) and strunt-based (network phases) gyroid structures with uniform and graded density fabricated using stereolithography technology. Based on numerical homogenization results, it was observed that sheet-based gyroid structures have a higher elastic modulus in comparison with strunt-based gyroids (at the same volume fraction). These observations were also confirmed by experimental results. Moreover, the samples presented the different collapse deformation models: for the uniform samples—the global collapse, and the graded samples—the layer-by-layer collapse. The result also shows that the energy absorption capacity of the graded structure is better than that of the uniform structure. Additionally, the sheet-based gyroid structure has better energy absorption than the strunt-based gyroid structure. Yang et al. [
31] investigated the mechanical properties of uniform and continuous graded gyroid cellular structures fabricated by selective laser melting. Experimental compression results indicated that the deformation process depends on the density gradient (perpendicular or parallel) to the loading direction. Moreover, the graded gyroid samples exhibit improved mechanical properties compared with uniform gyroid samples. Mahomud et al. [
9] tested the mechanical properties of gyroid samples with three different designs: uniform porosity with thin and thick walls and graded porosity. Research shows that the compressive strength of samples with graded porosity was higher than uniformly samples. Research on the mechanical properties of graded TPMS structures shows that they can be more beneficial for loading-bearing applications.
In energy absorption applications, cylindrical structures are most commonly used. In order to reduce their weight, which is important in transport, aerospace, and cosmonautics, the traditional cylindrical structures with solid materials began to be replaced by lattice structures. Cylindrical lattice structures (CLS) consist of ribs in the circumferential and helical directions, and the crossing of the ribs creates periodic patterns [
32]. These solutions show unique loads paths and are characterized by high durability, height stiffness-to-weight characteristics, and good energy absorption properties, which were demonstrated, inter alia, in the works of Shitanaka et al. [
32], Gu et al., [
33], Smeets et al. [
34], Cao et al. [
35], and Meng et al. [
36].
Thanks to additive manufacturing, the construction of straight ribs in CLS can be replaced by complicated spatial structures based on TPMS topology, as was indicated by Wang et al. [
37].
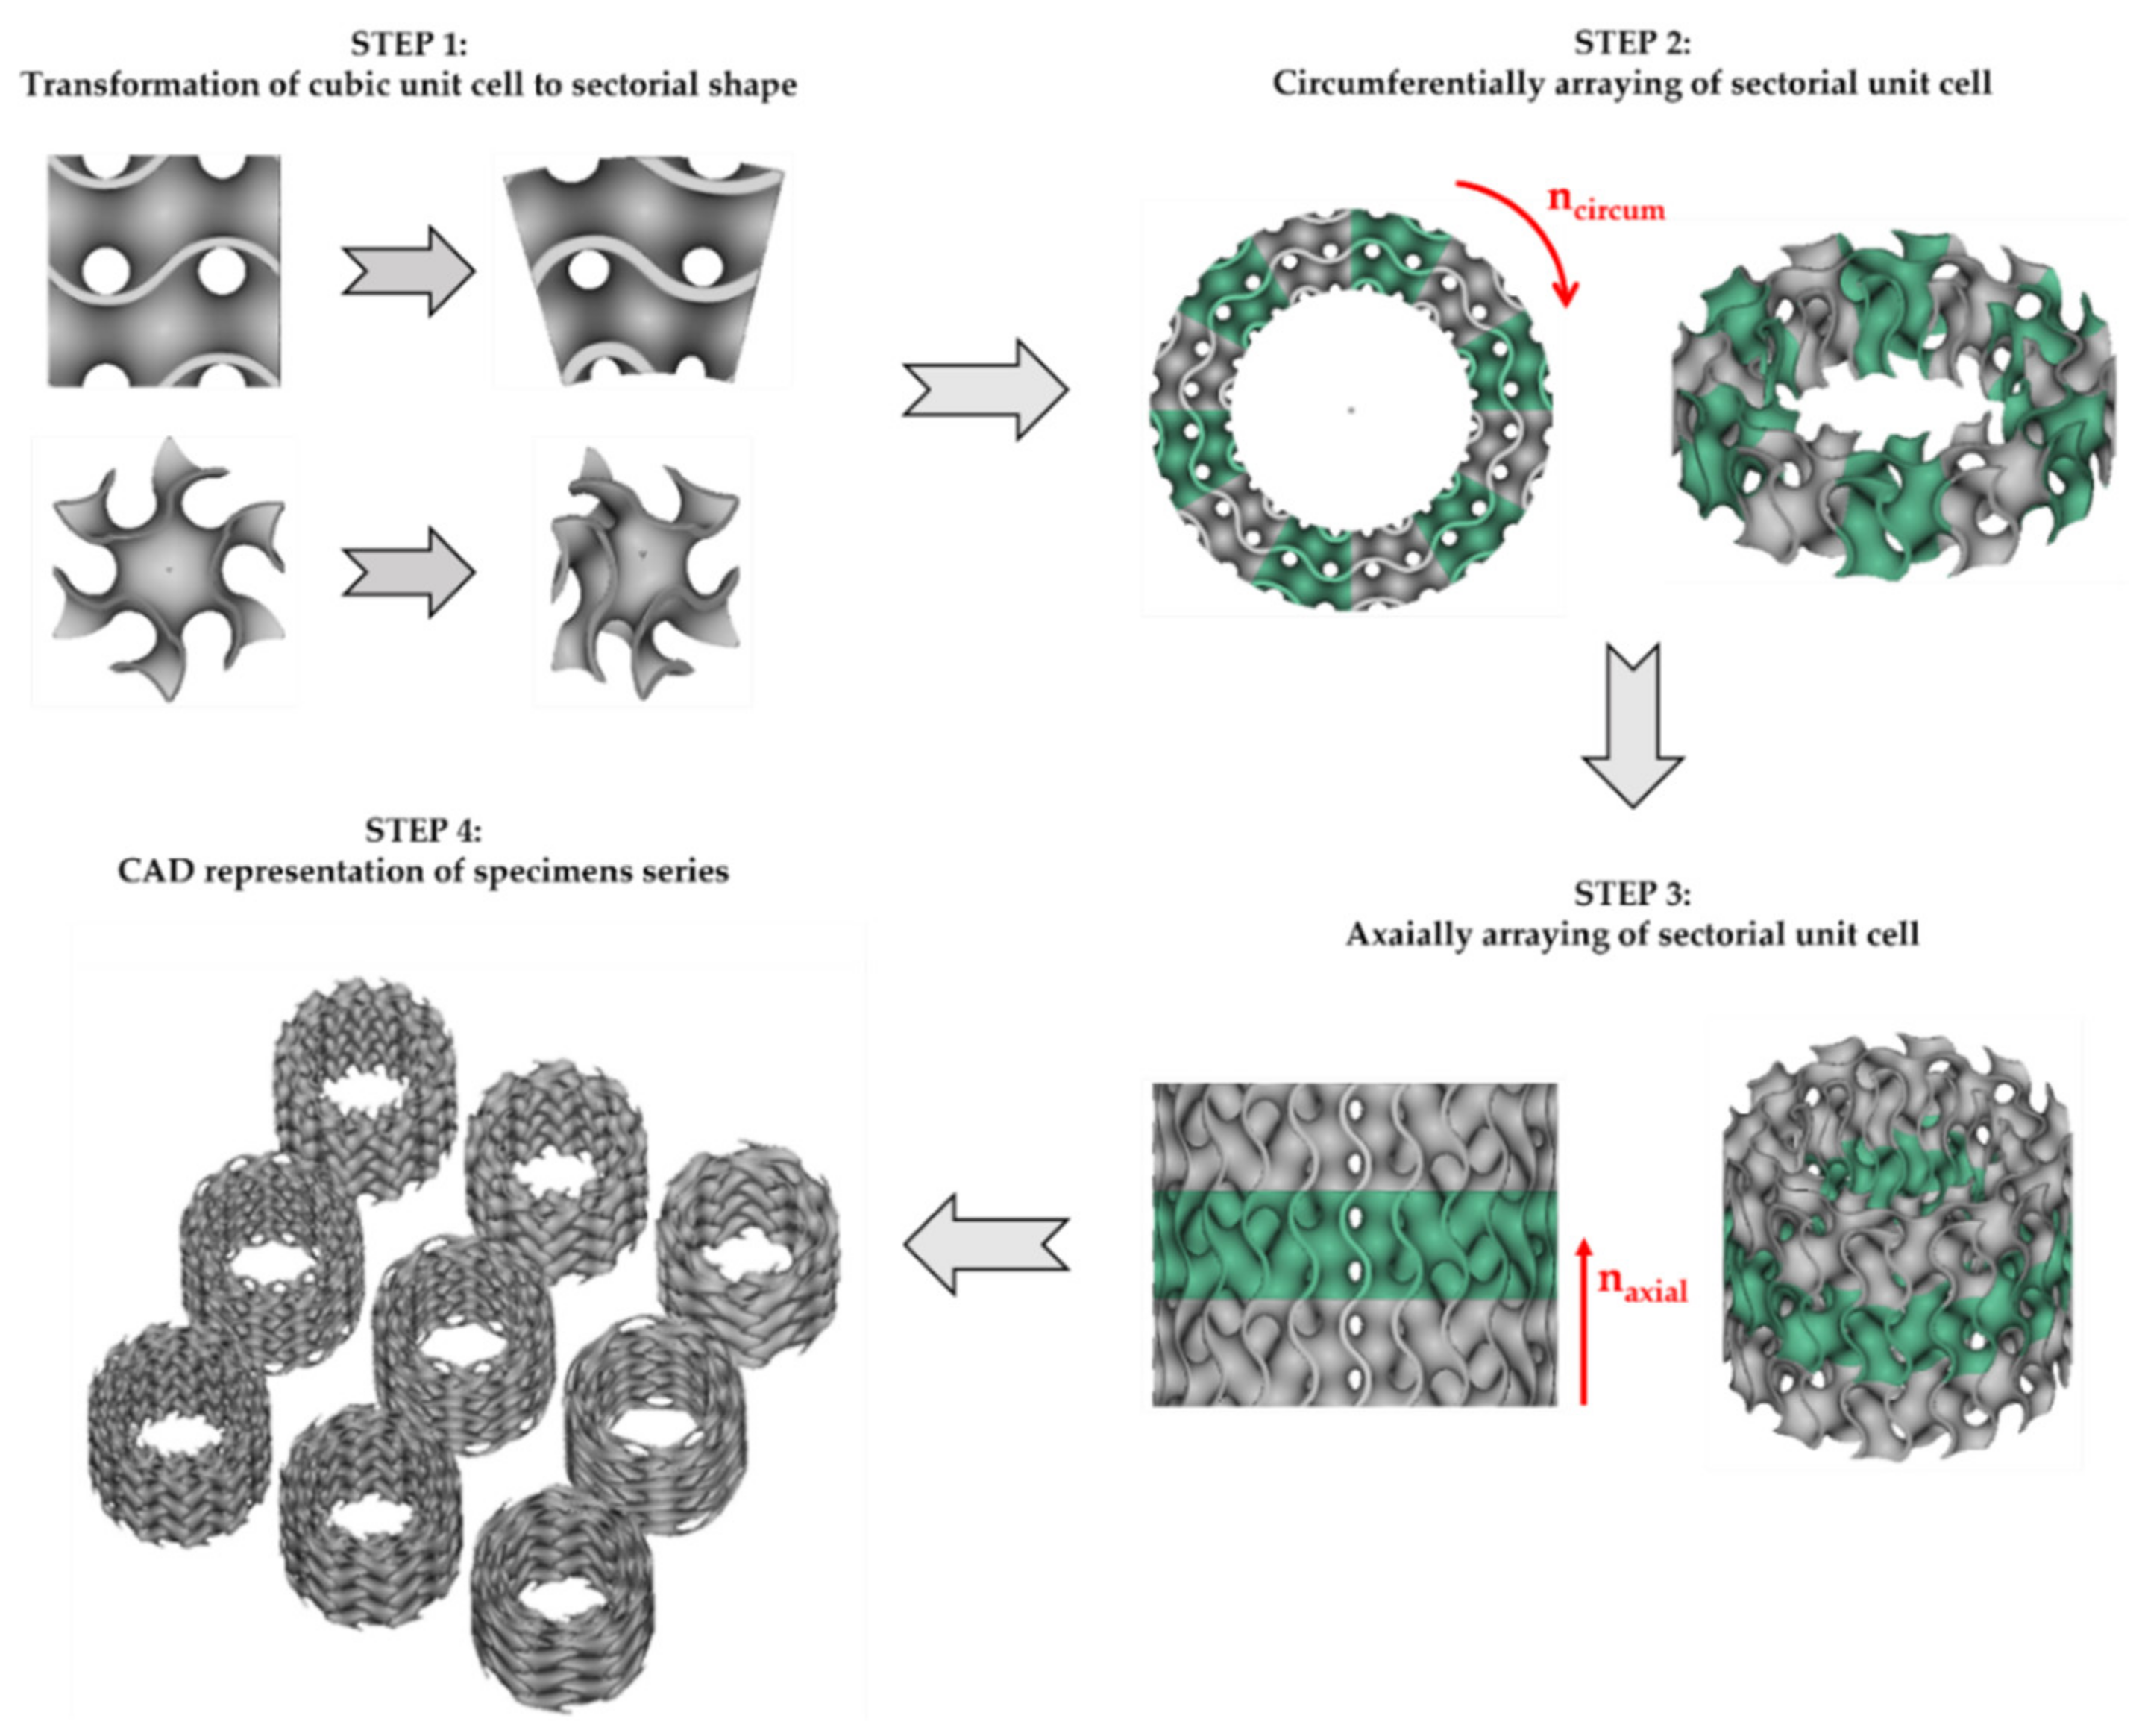
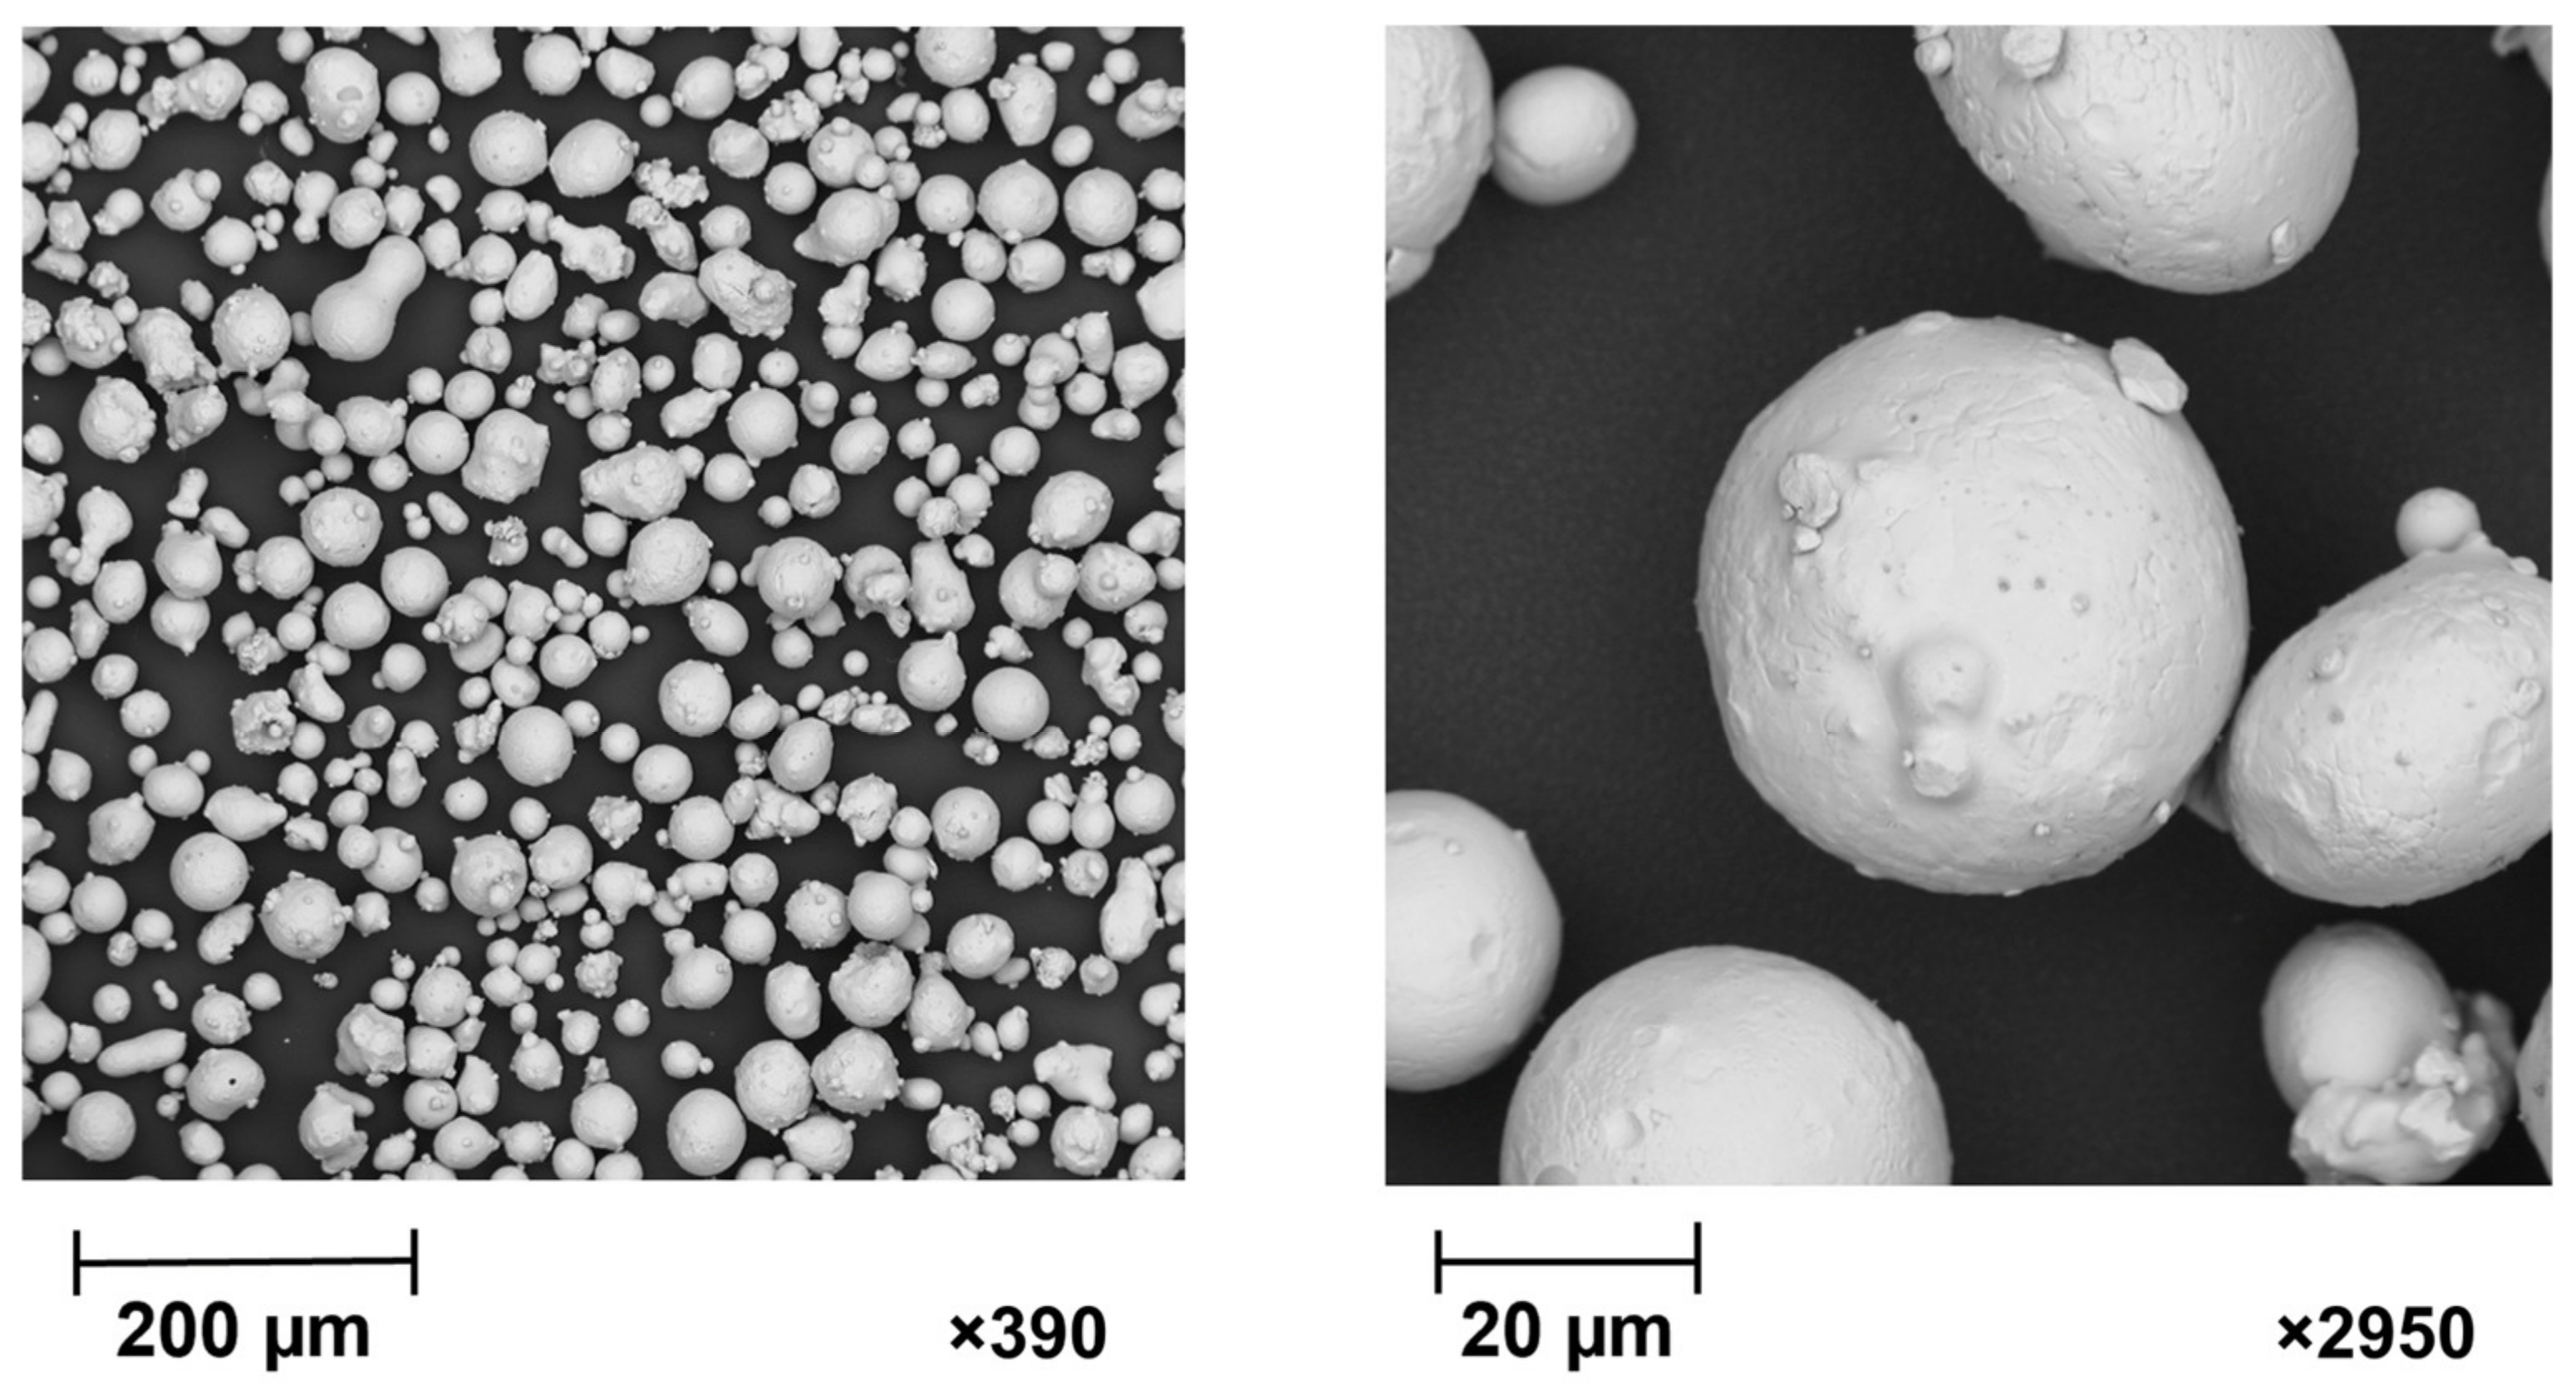
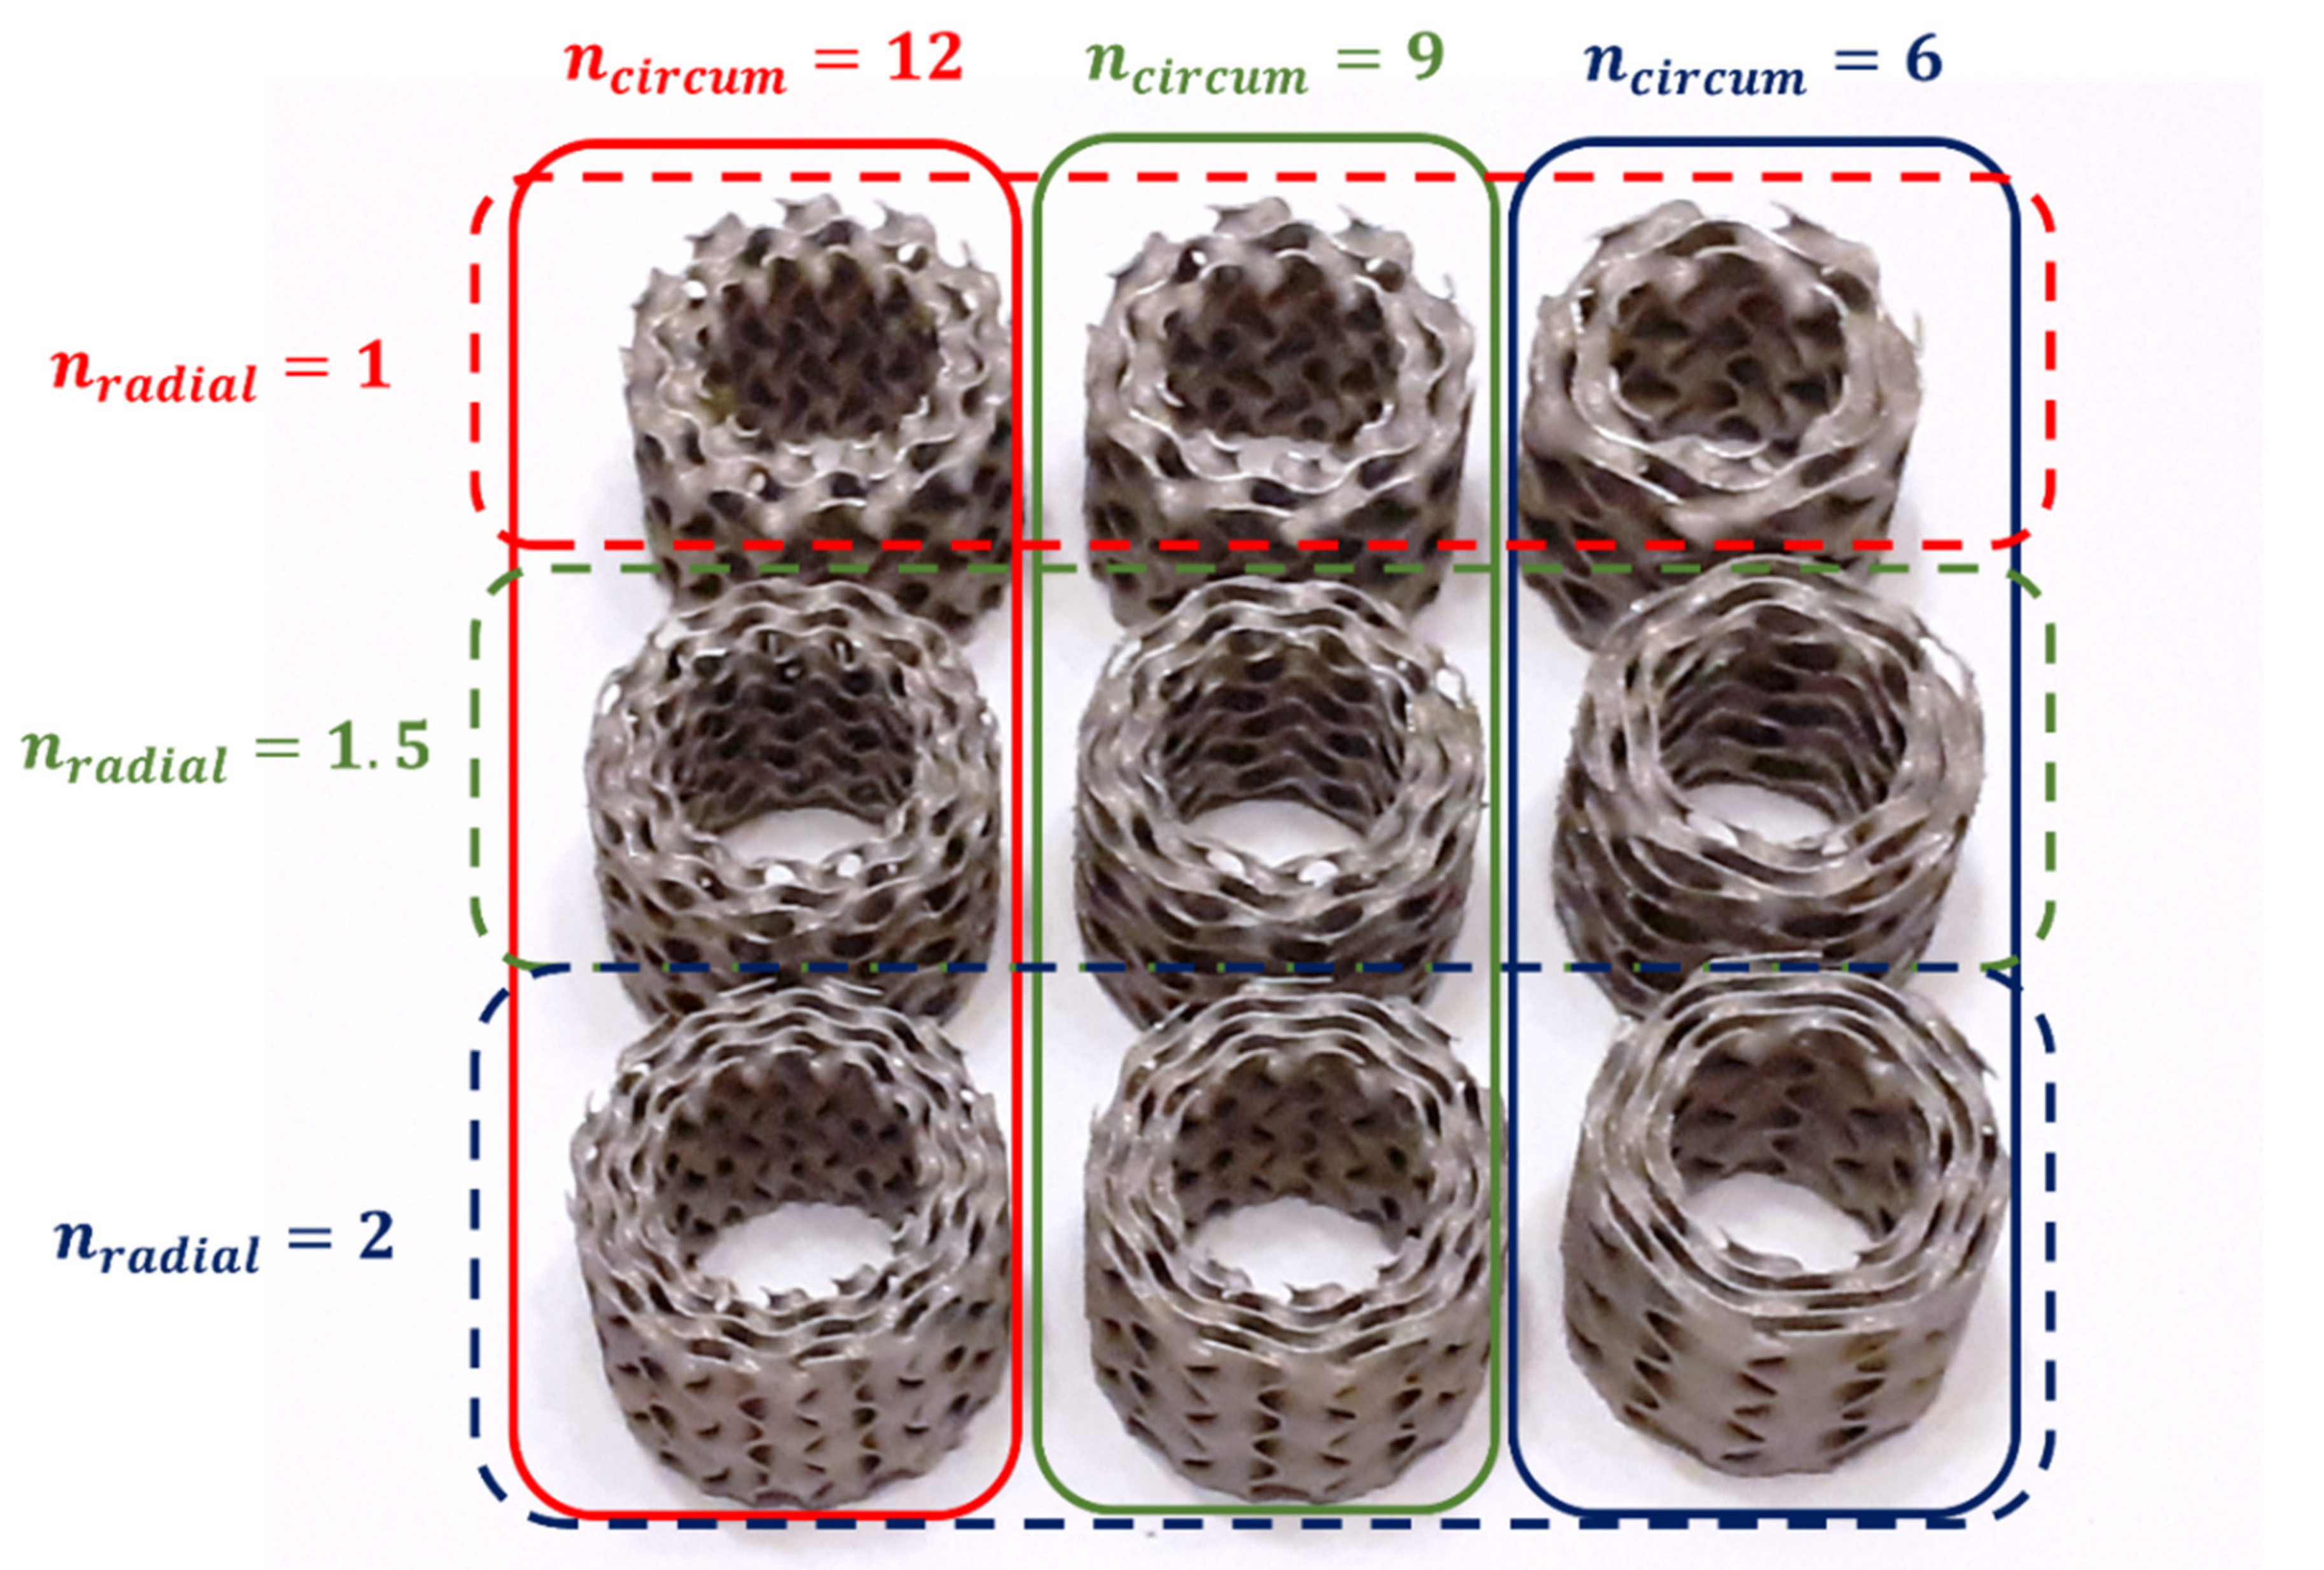
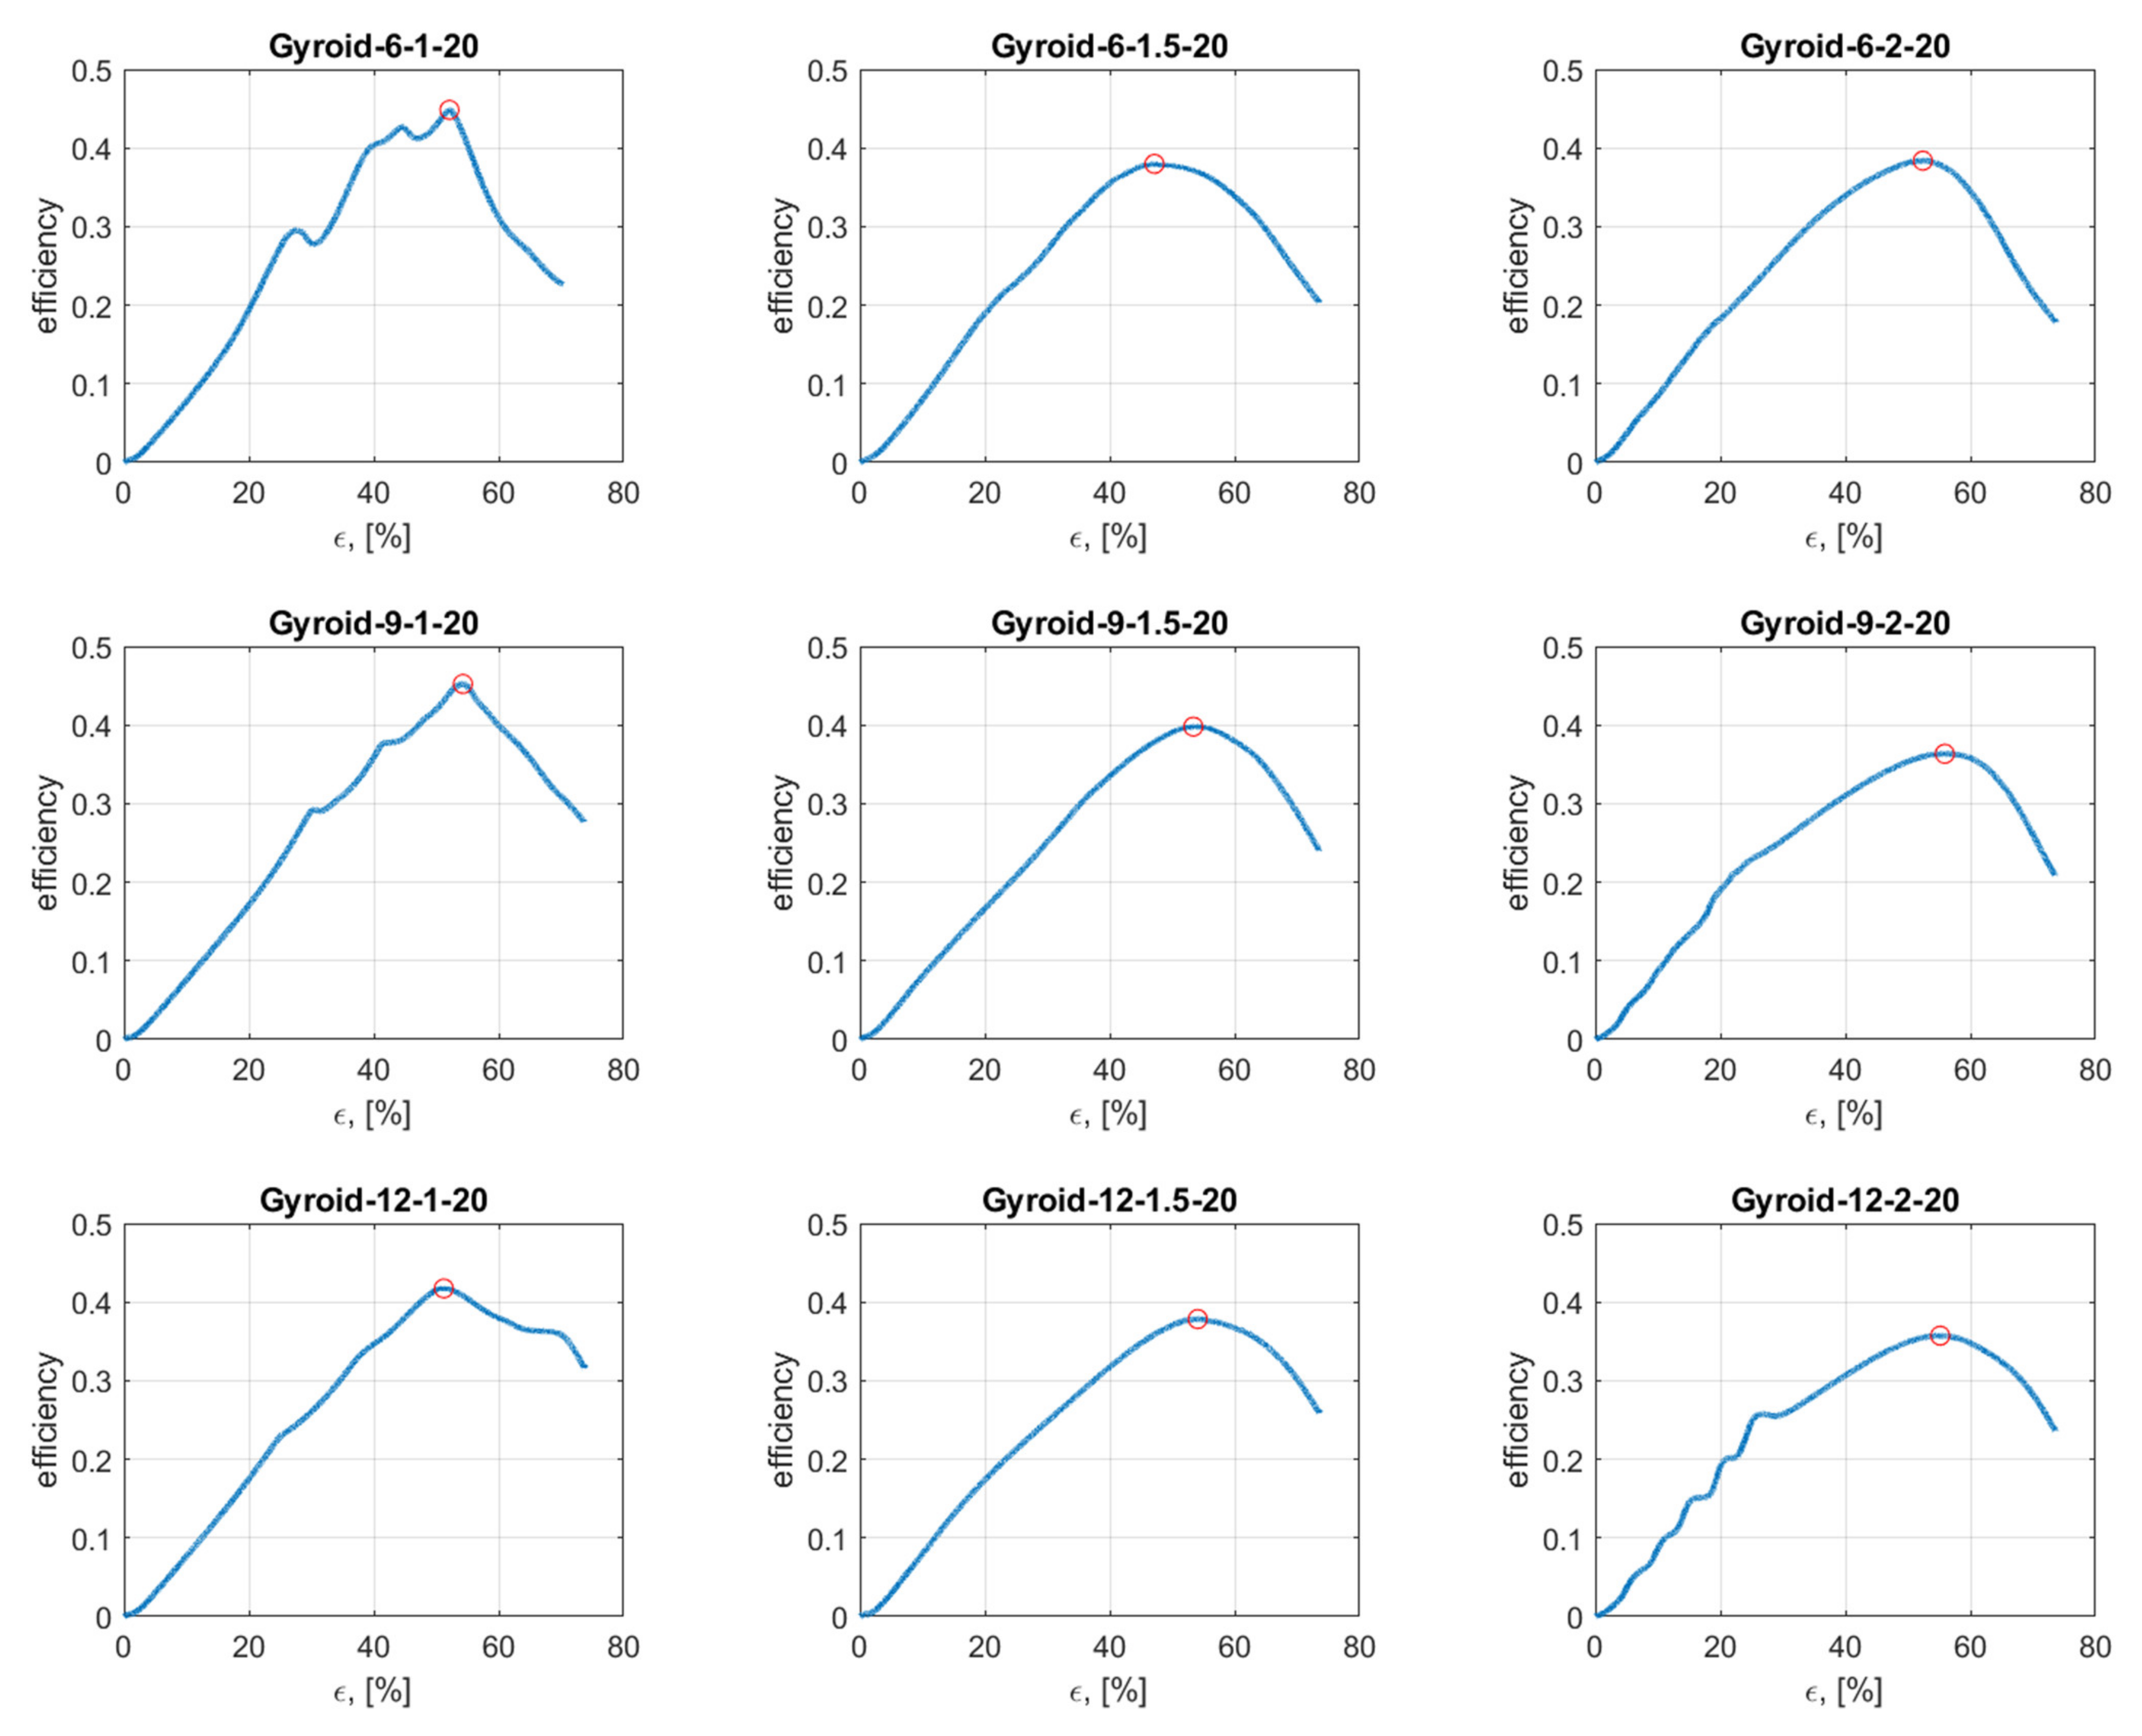
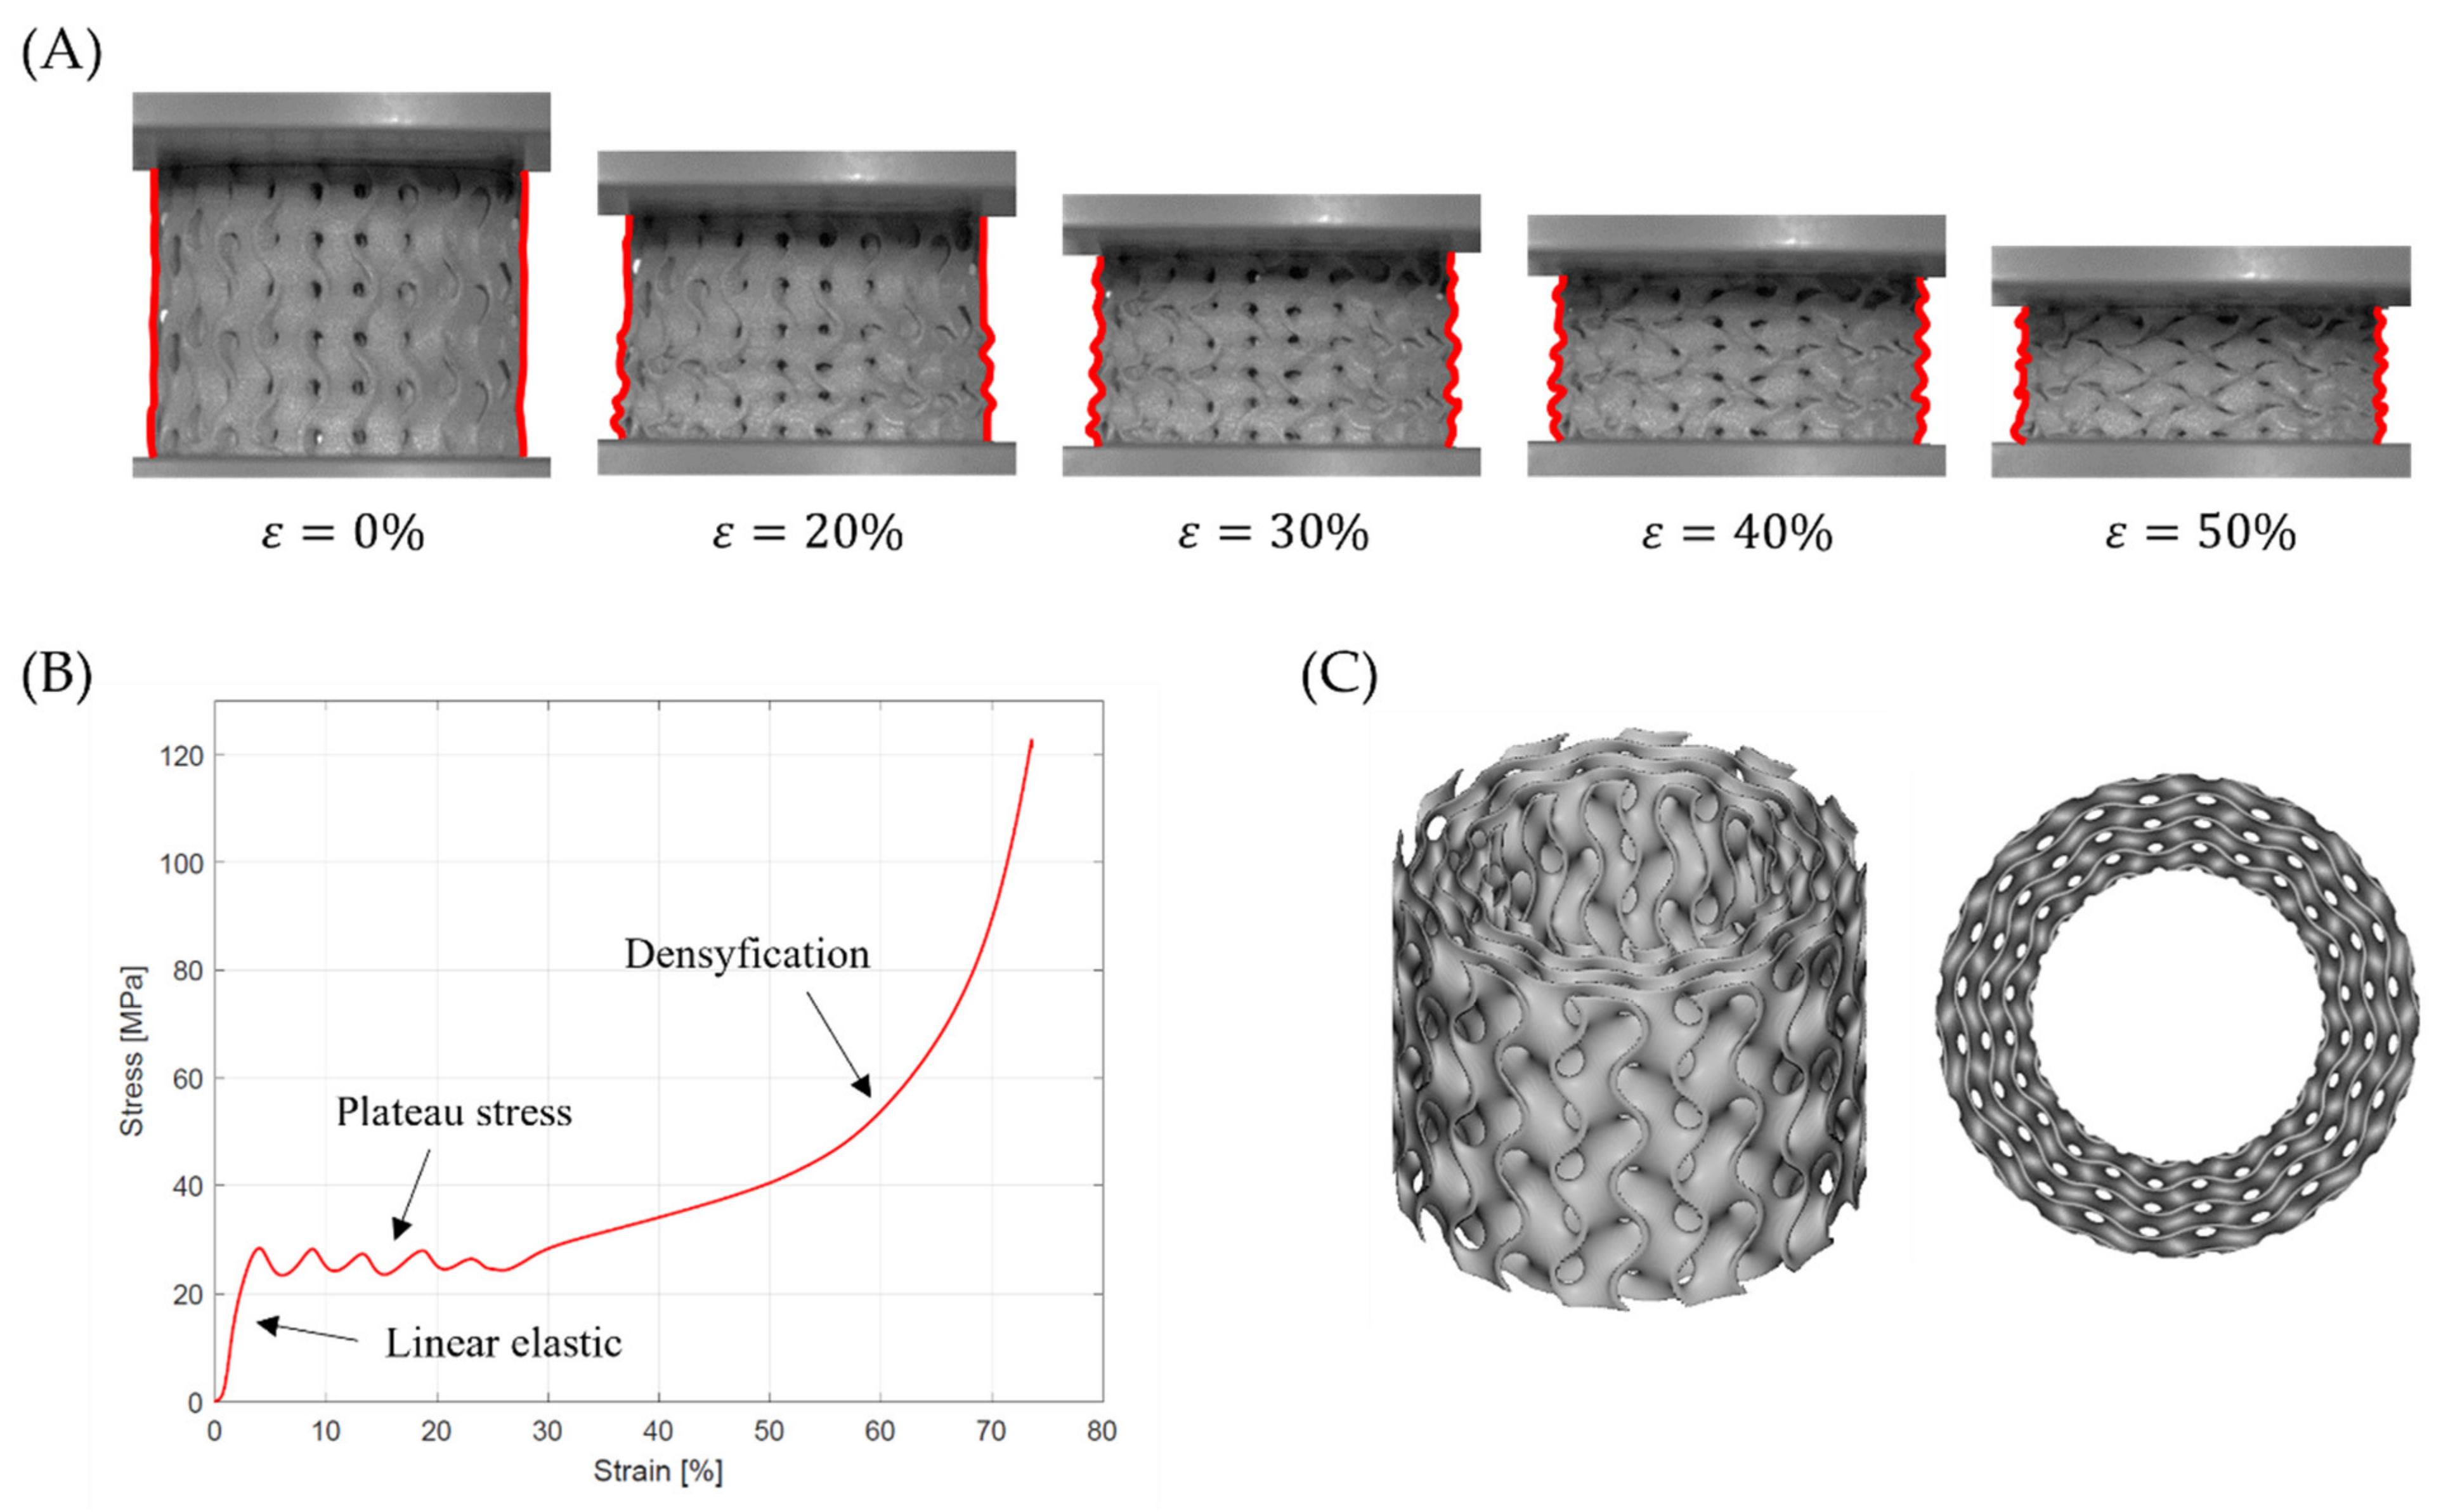
In this paper, the mechanical properties and energy absorption abilities of cylindrical mapped TPMS structures with shell gyroid unit cells fabricated by selective laser melting (SLM) with 316L stainless steel under compression loading were investigated. The aim of the research was to find the relationship between design parameters of the sample structure and elastic modulus, yield strength, plateau stress, and total energy absorption per unit volume. An attempt was also made to analyze the deformation modes and correlate them with the course of the stress–strain curve and the efficiency–strain curve.
4. Conclusions
In this paper, the mechanical properties and energy absorption abilities of cylindrical mapped TPMS structures with shell gyroid unit cells fabricated by selective laser melting (SLM) from 316L stainless steel under compression loading were investigated. The conducted experiment is an extension of the experimental work carried out by Wang et al. [
37].
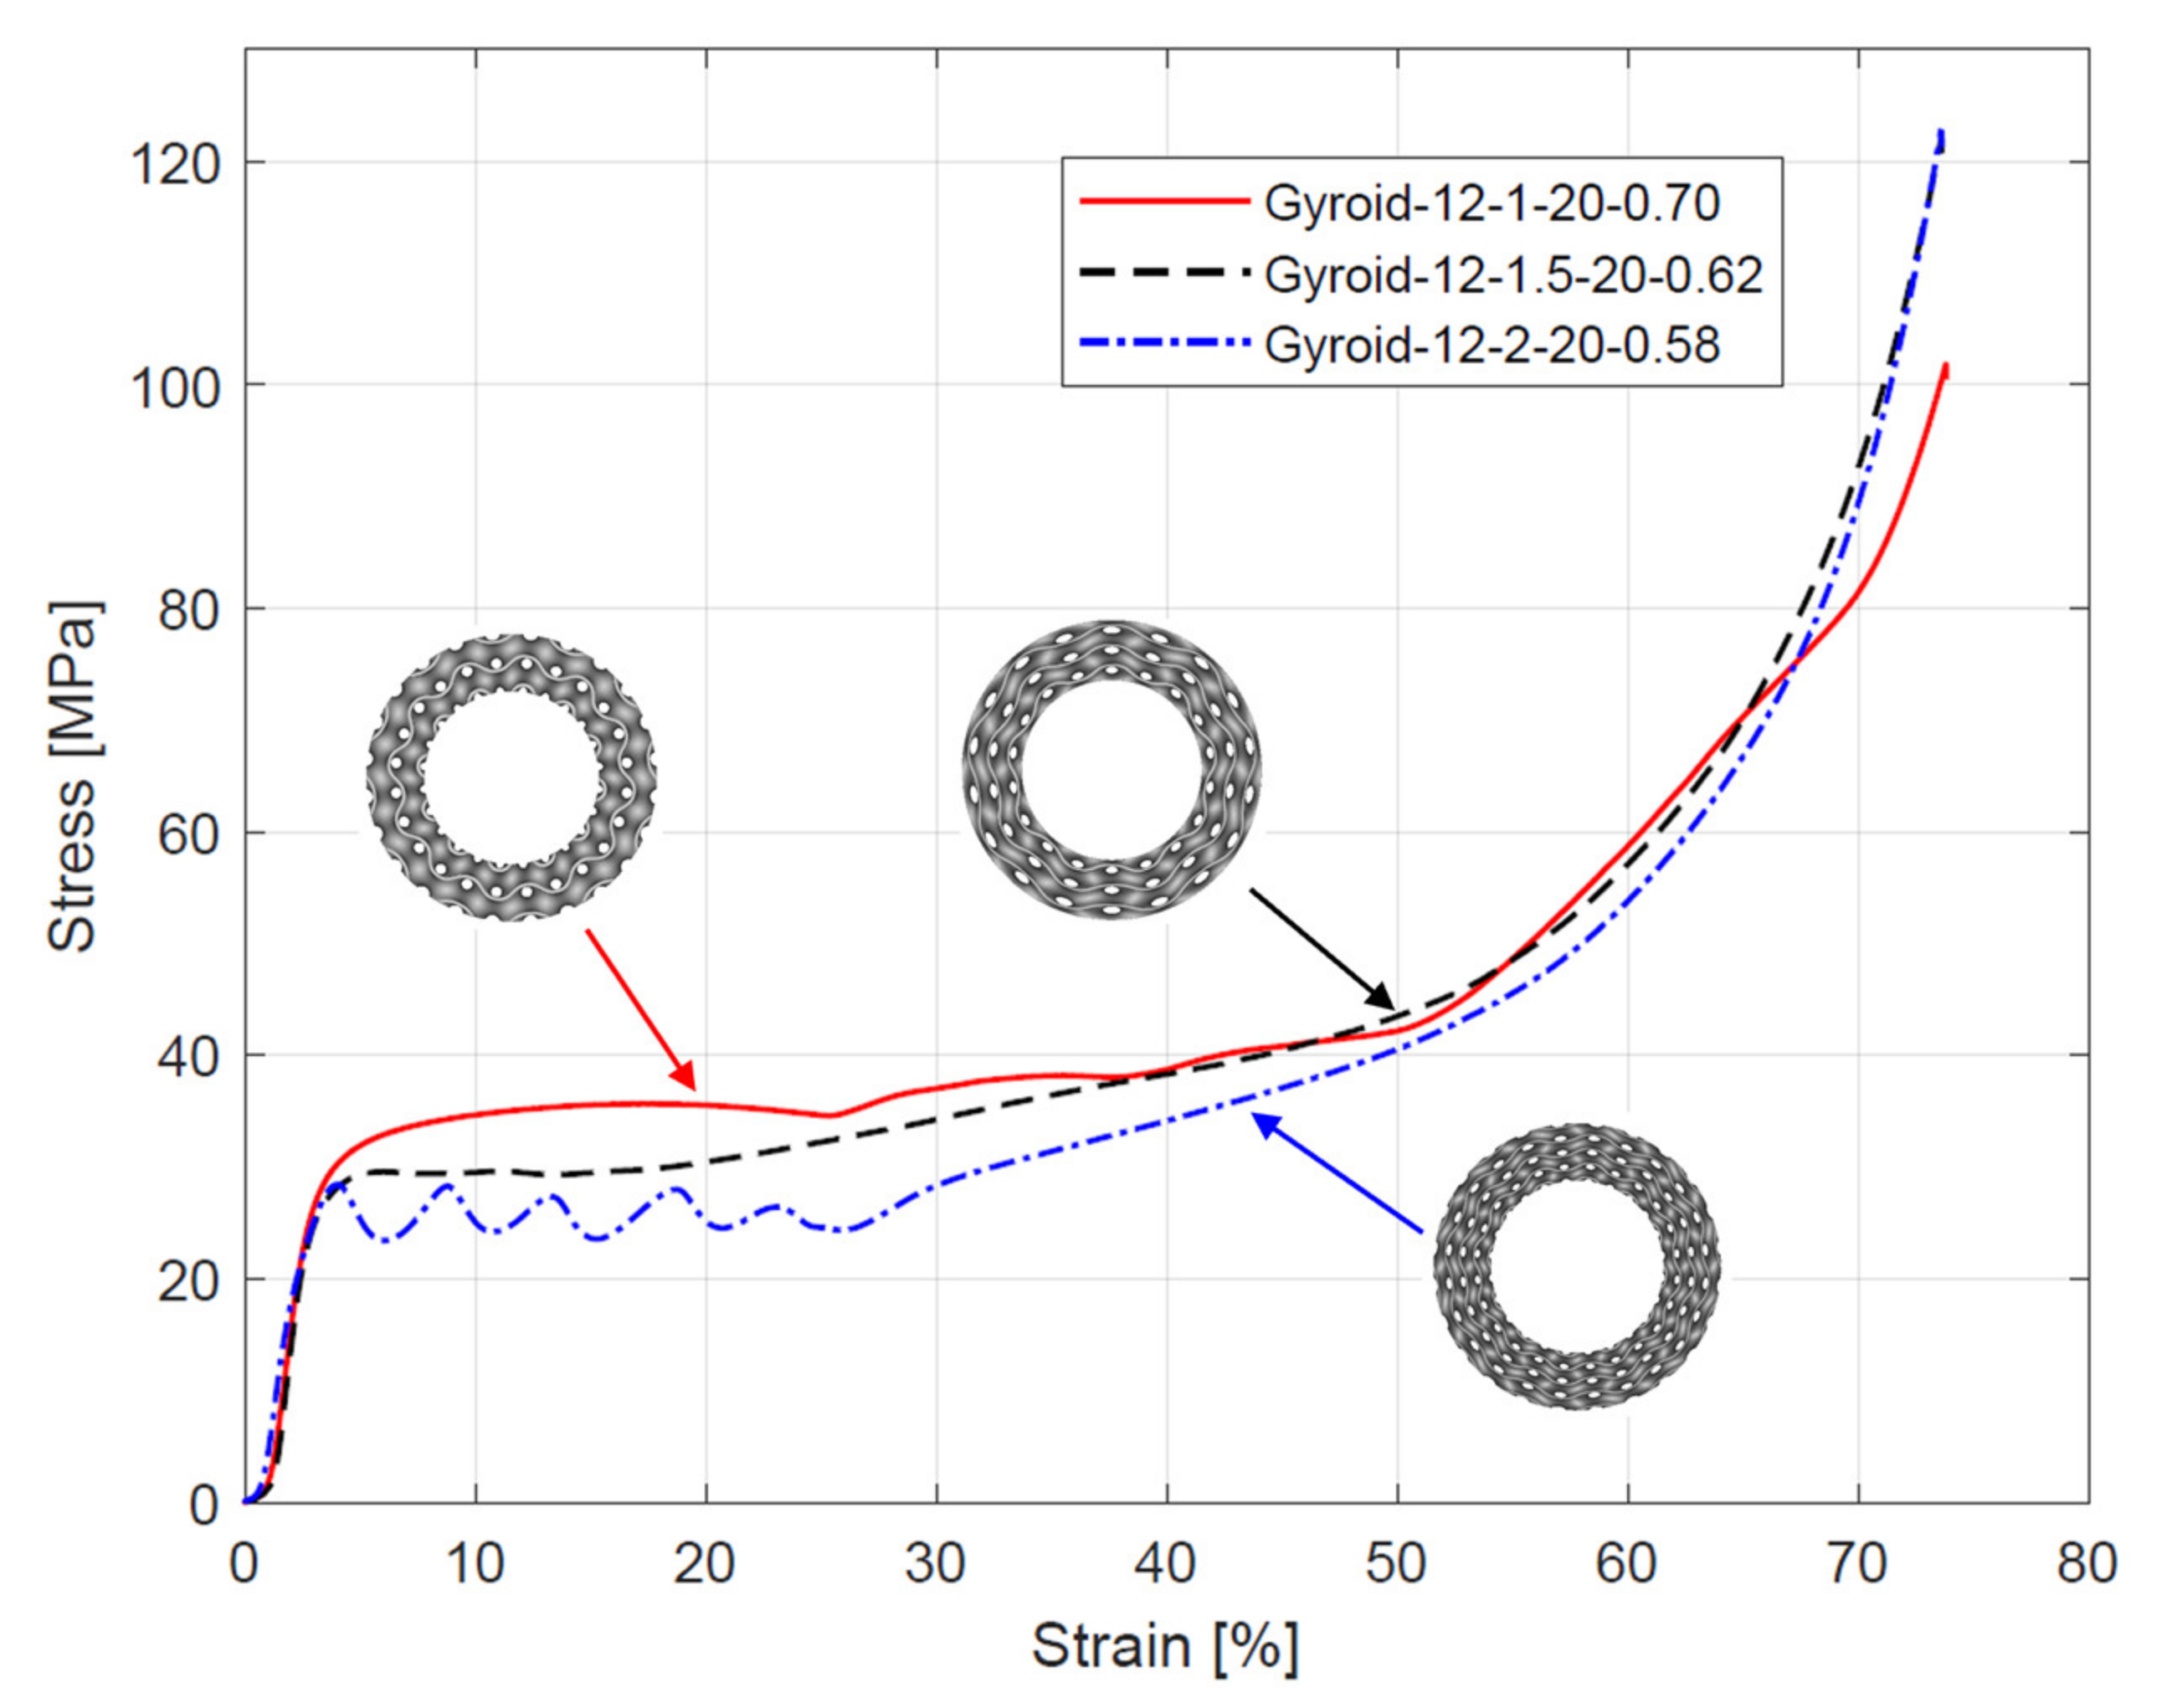
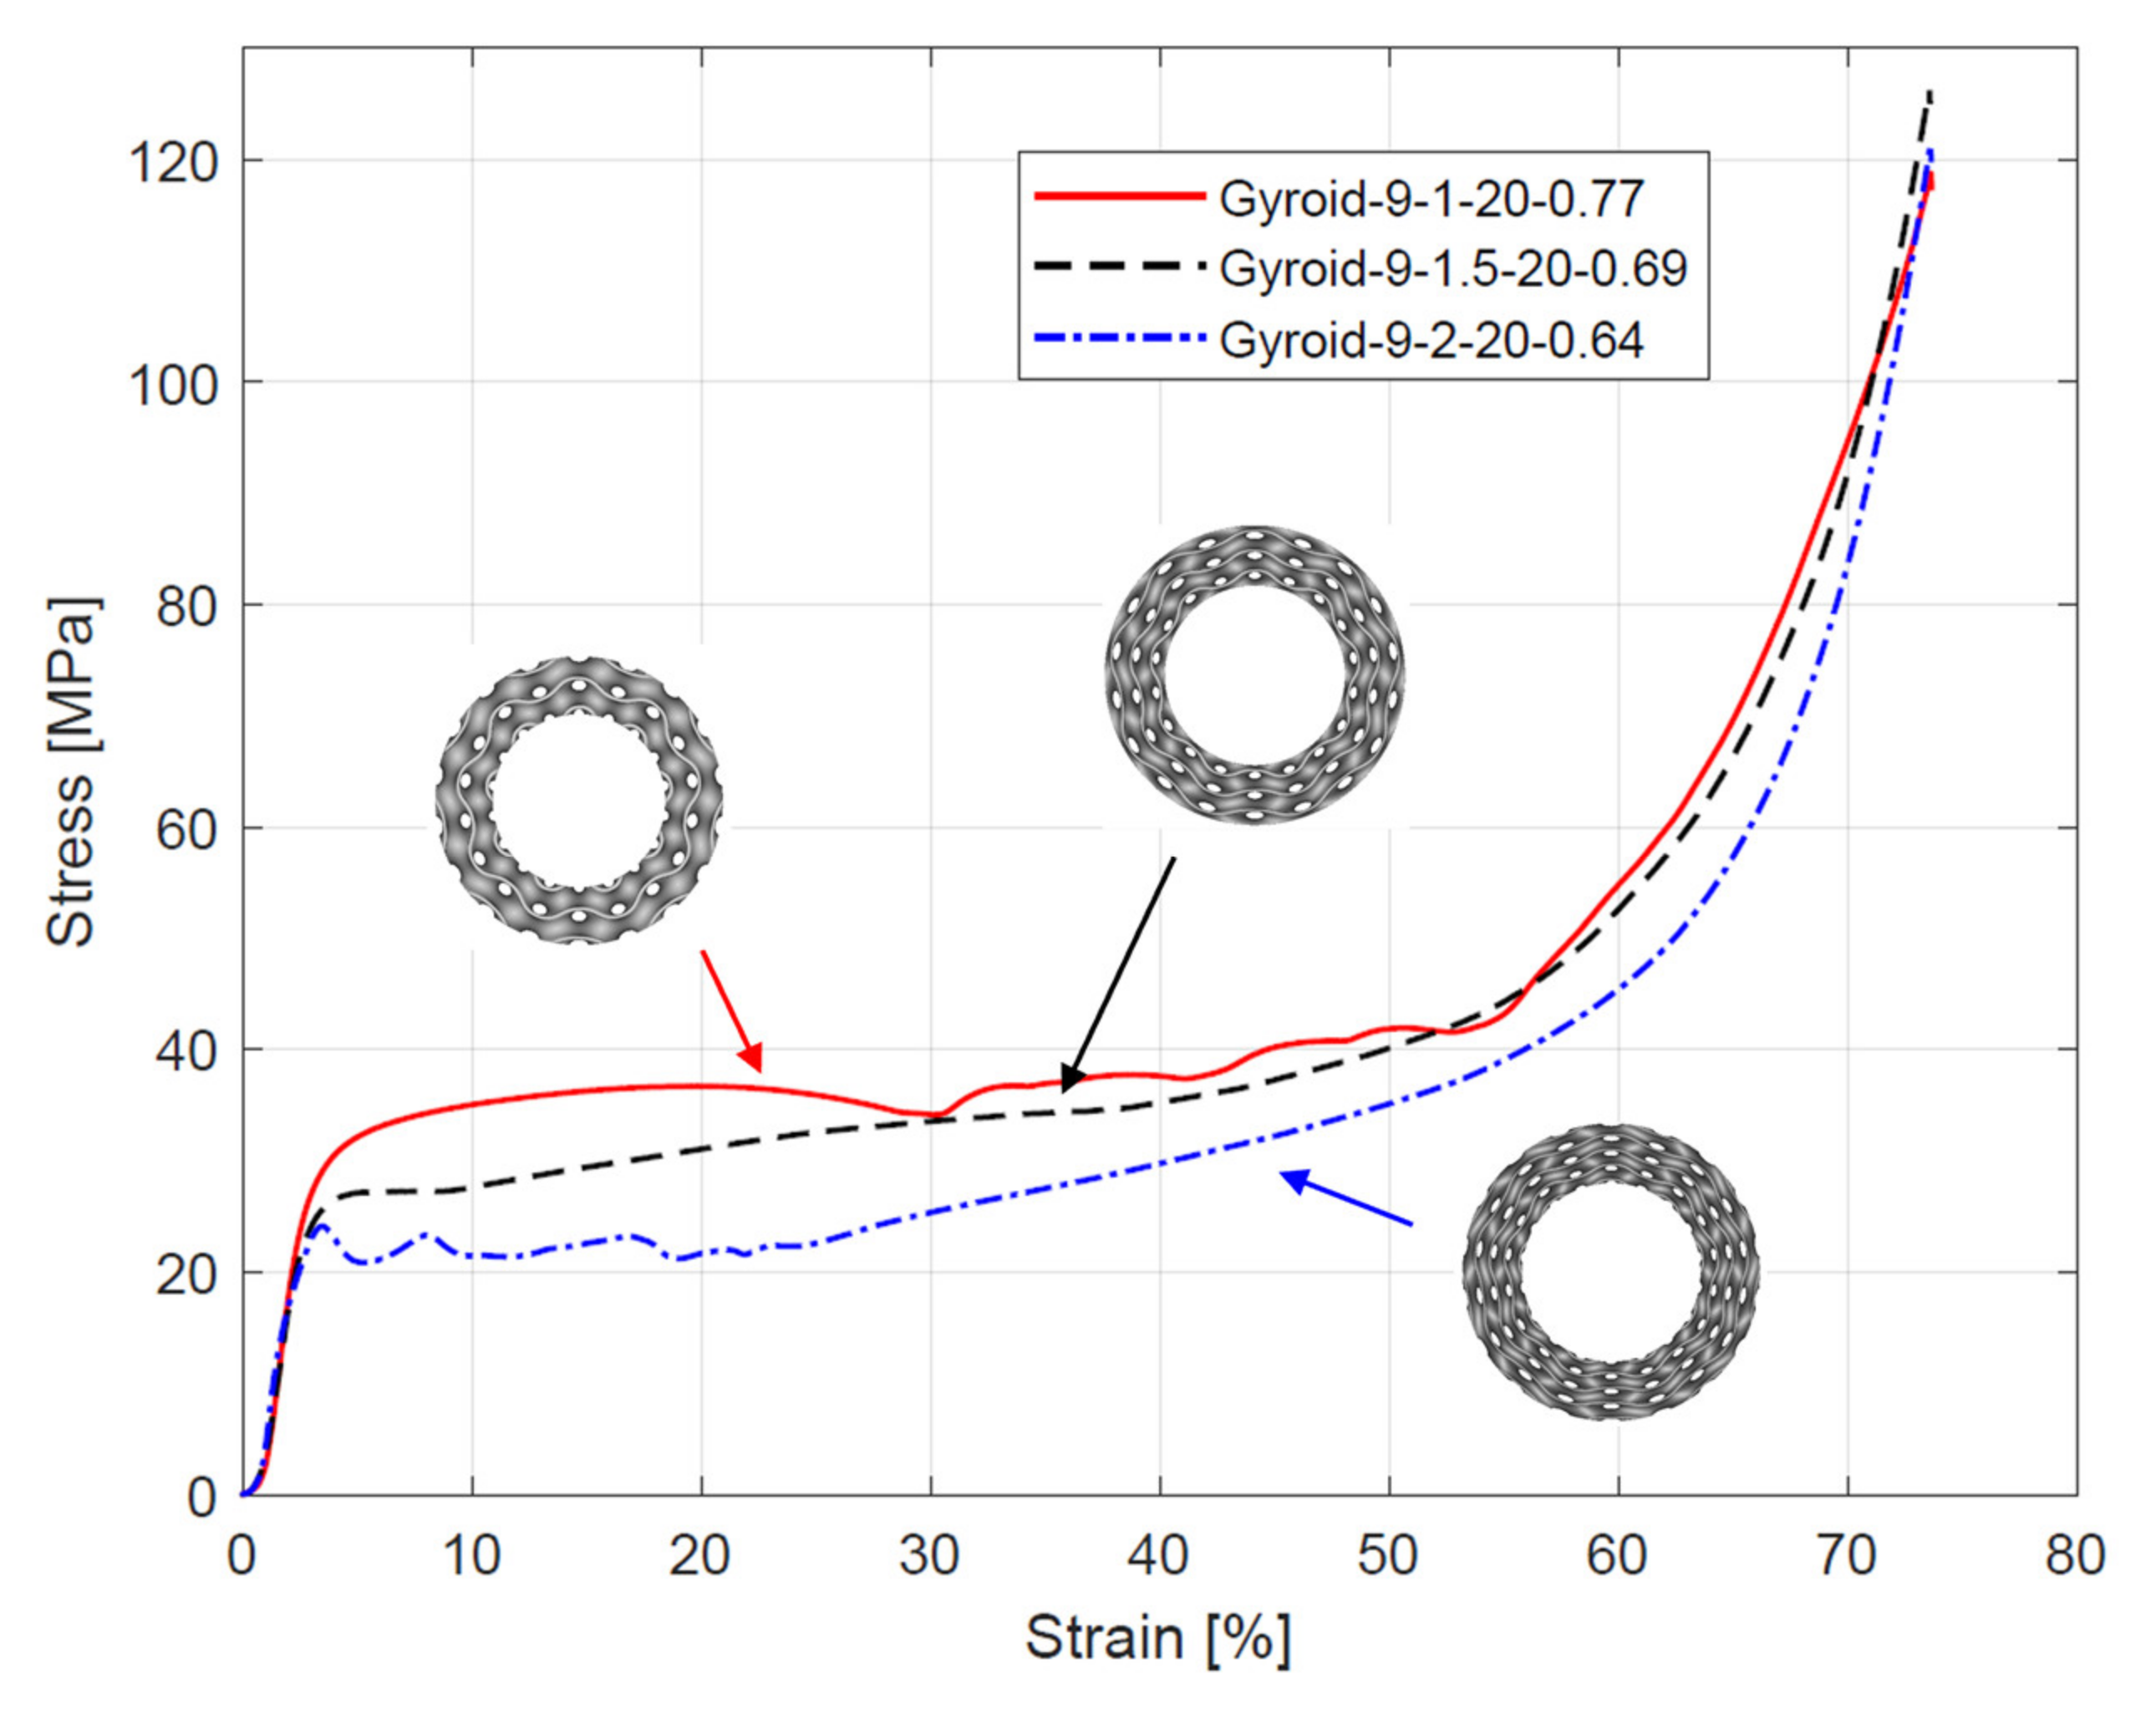
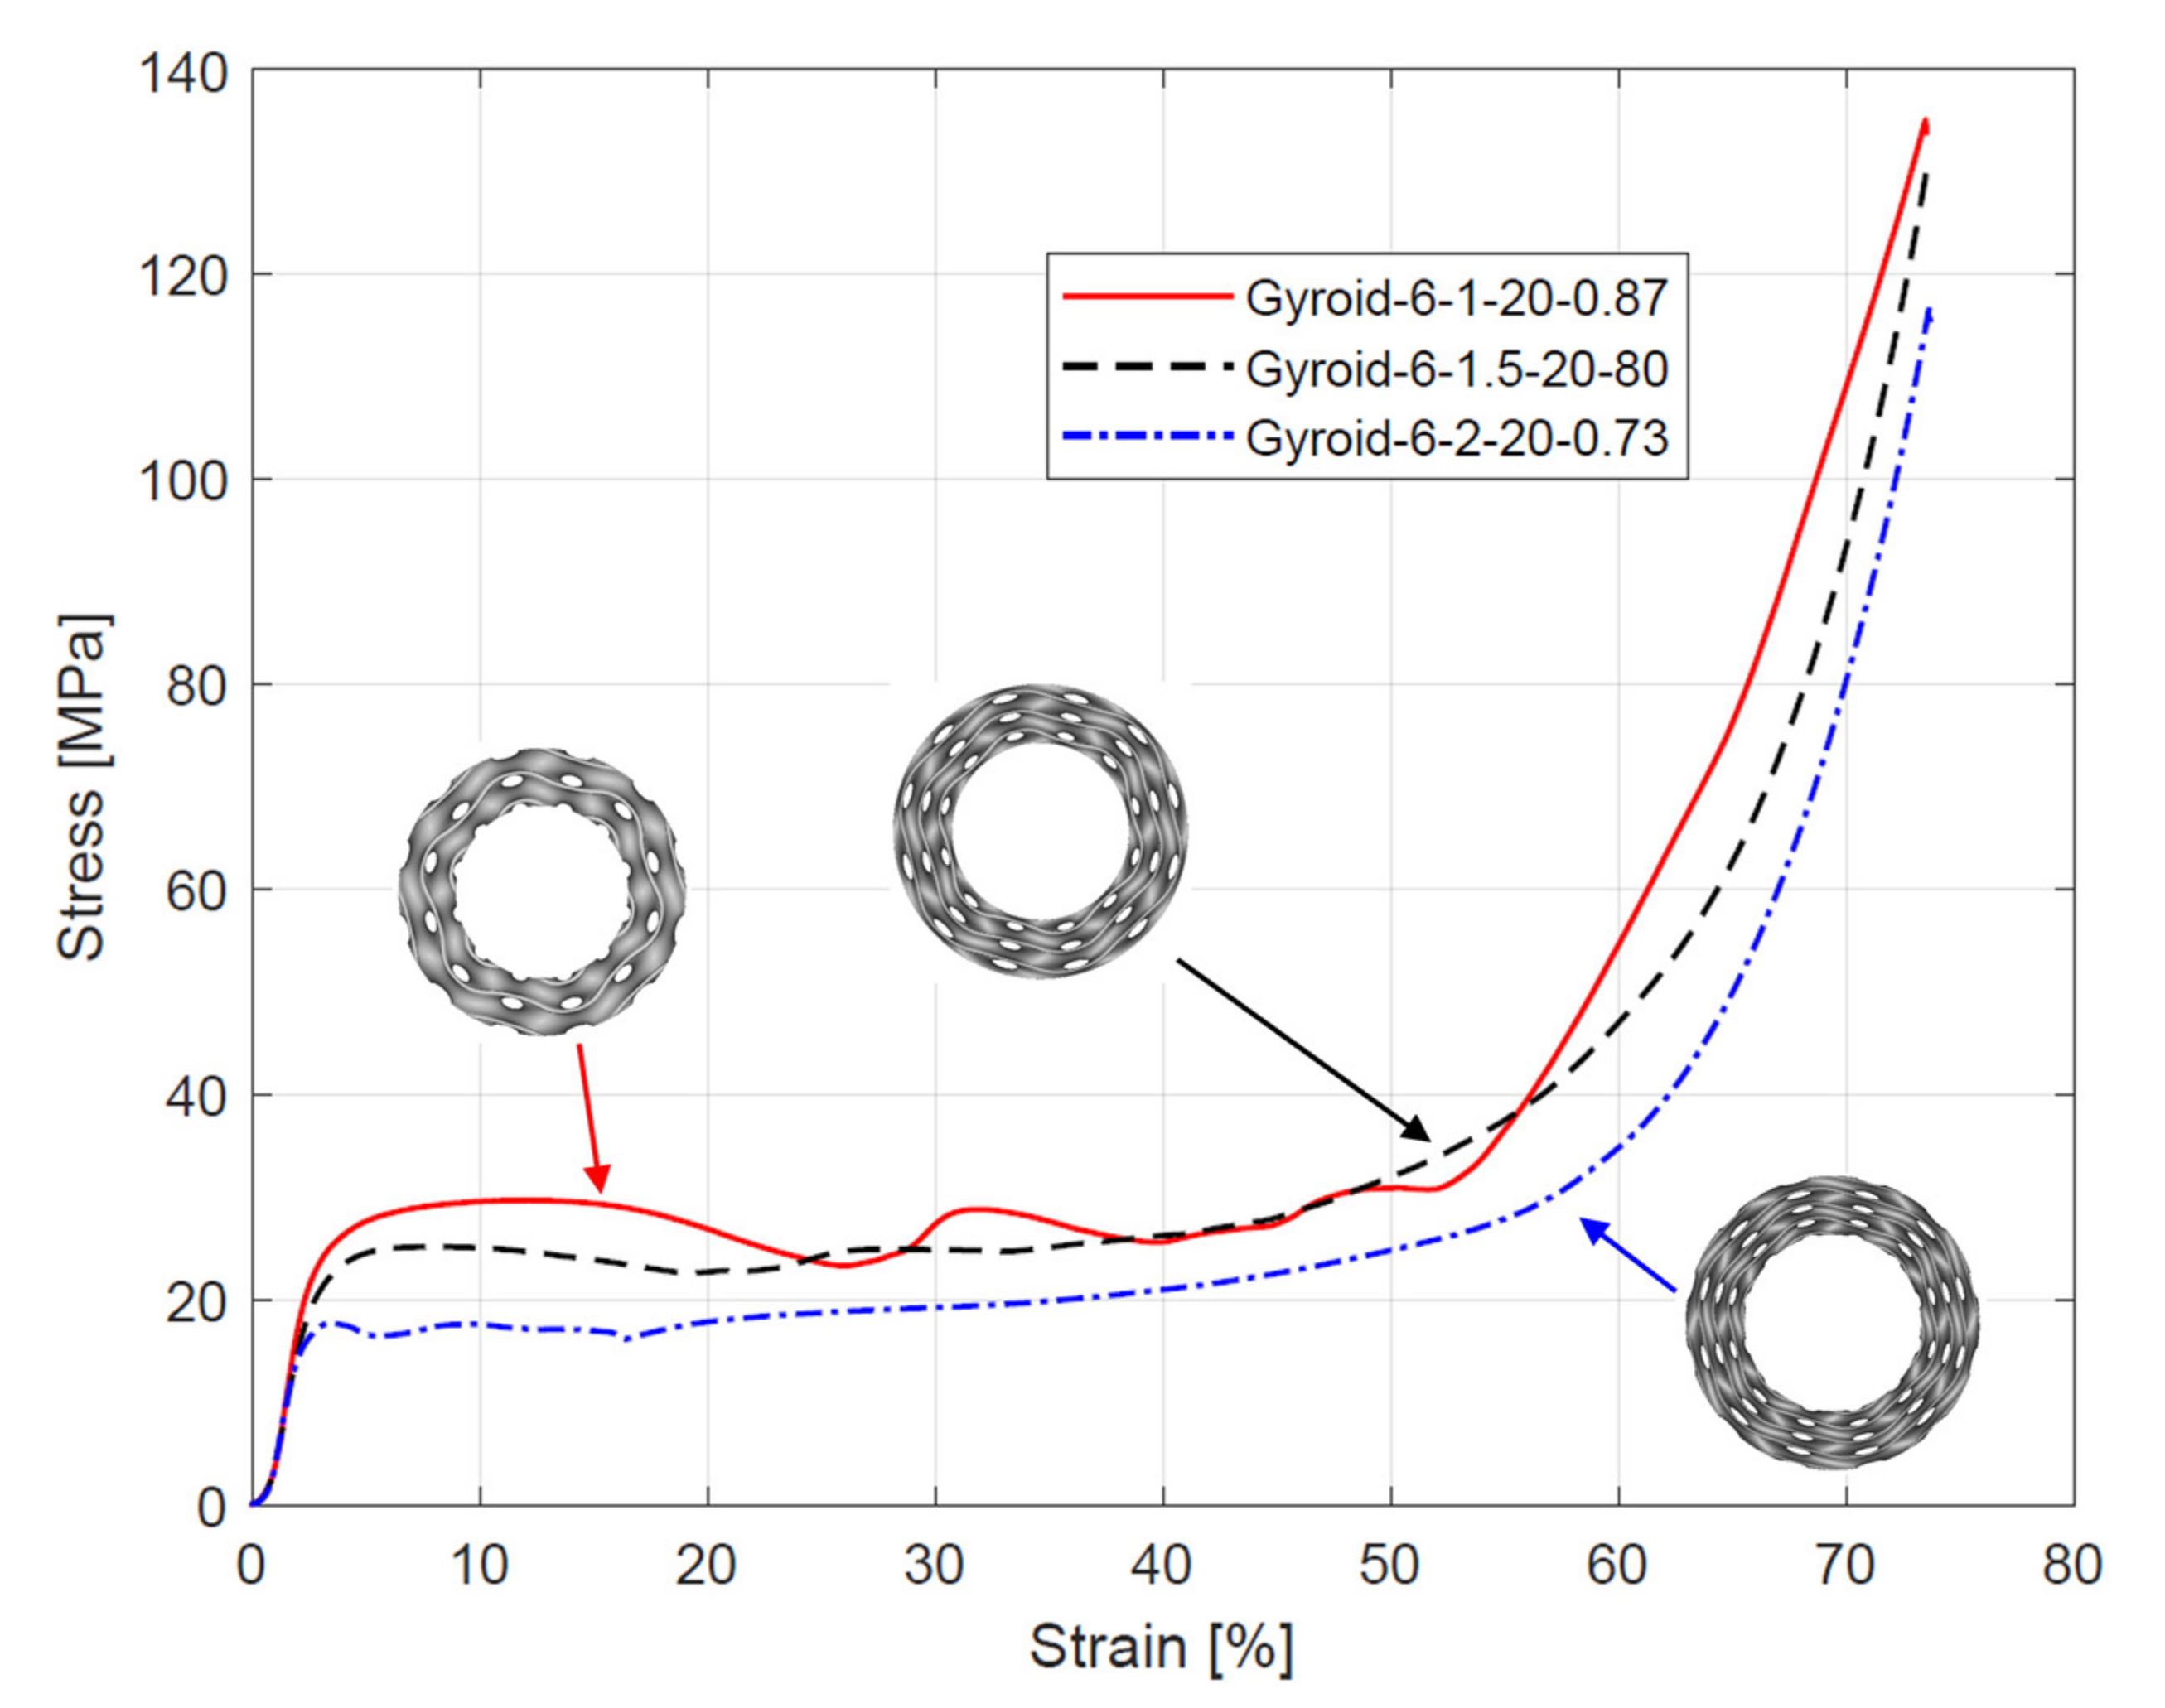
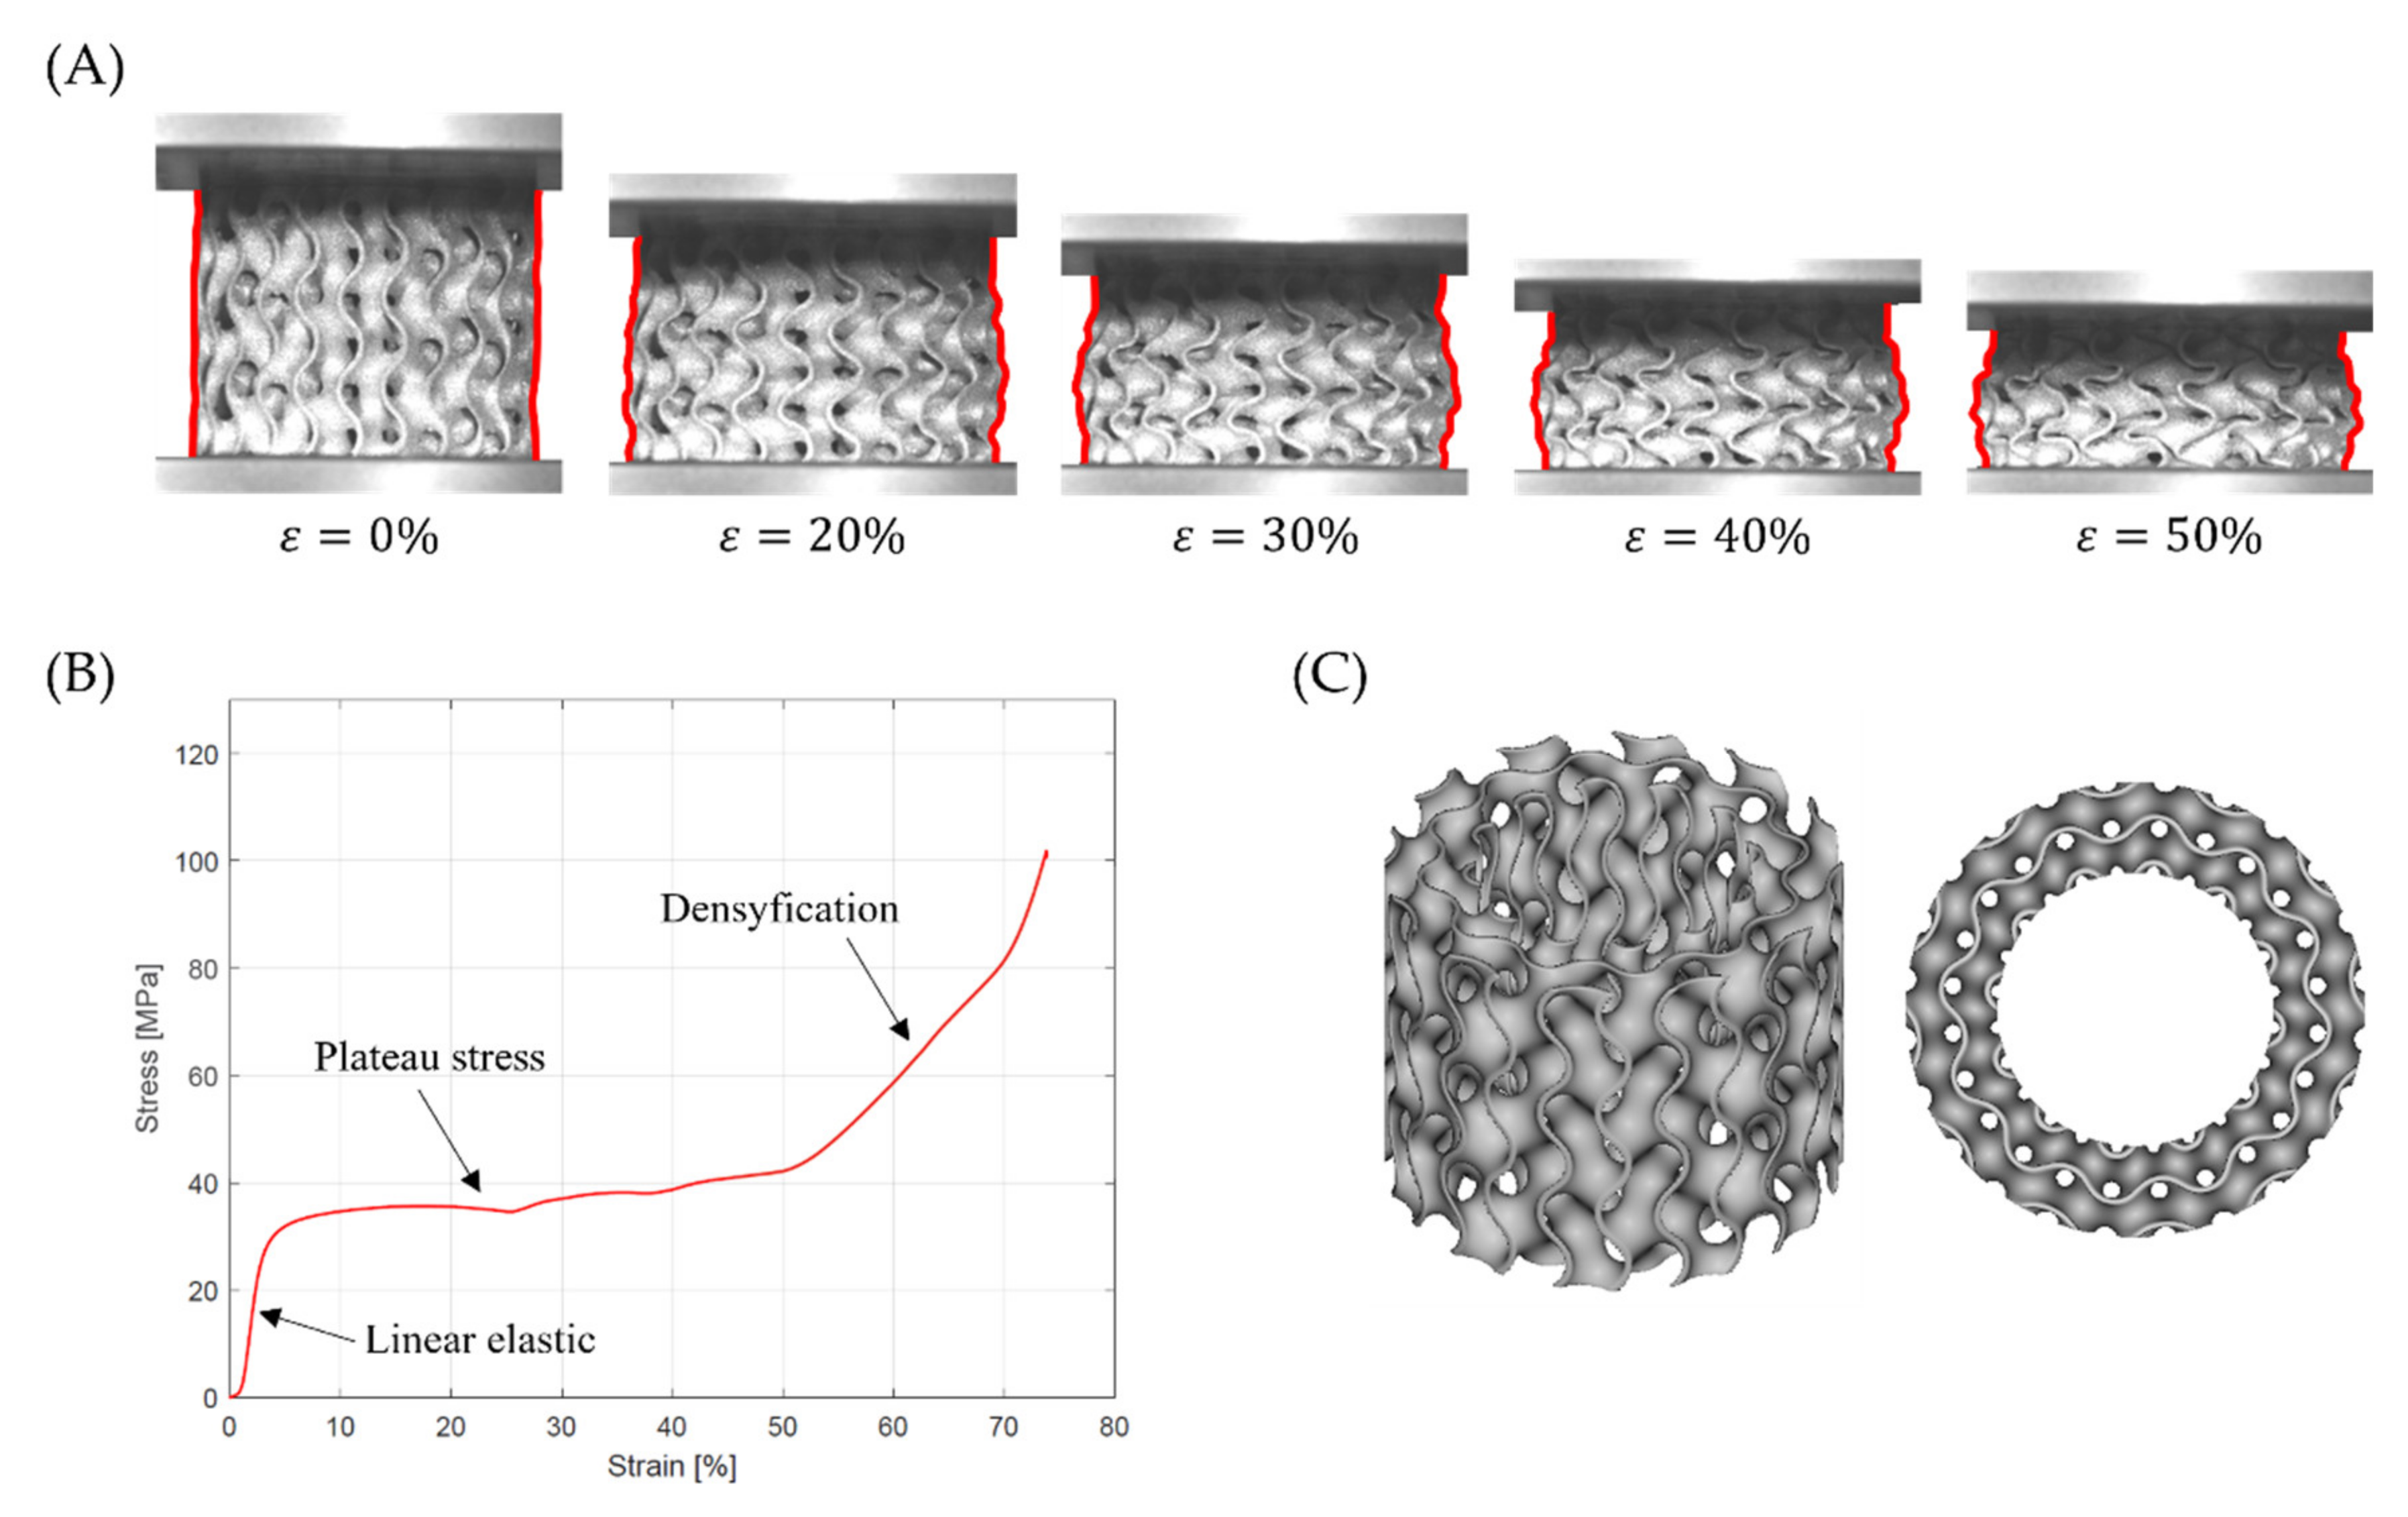
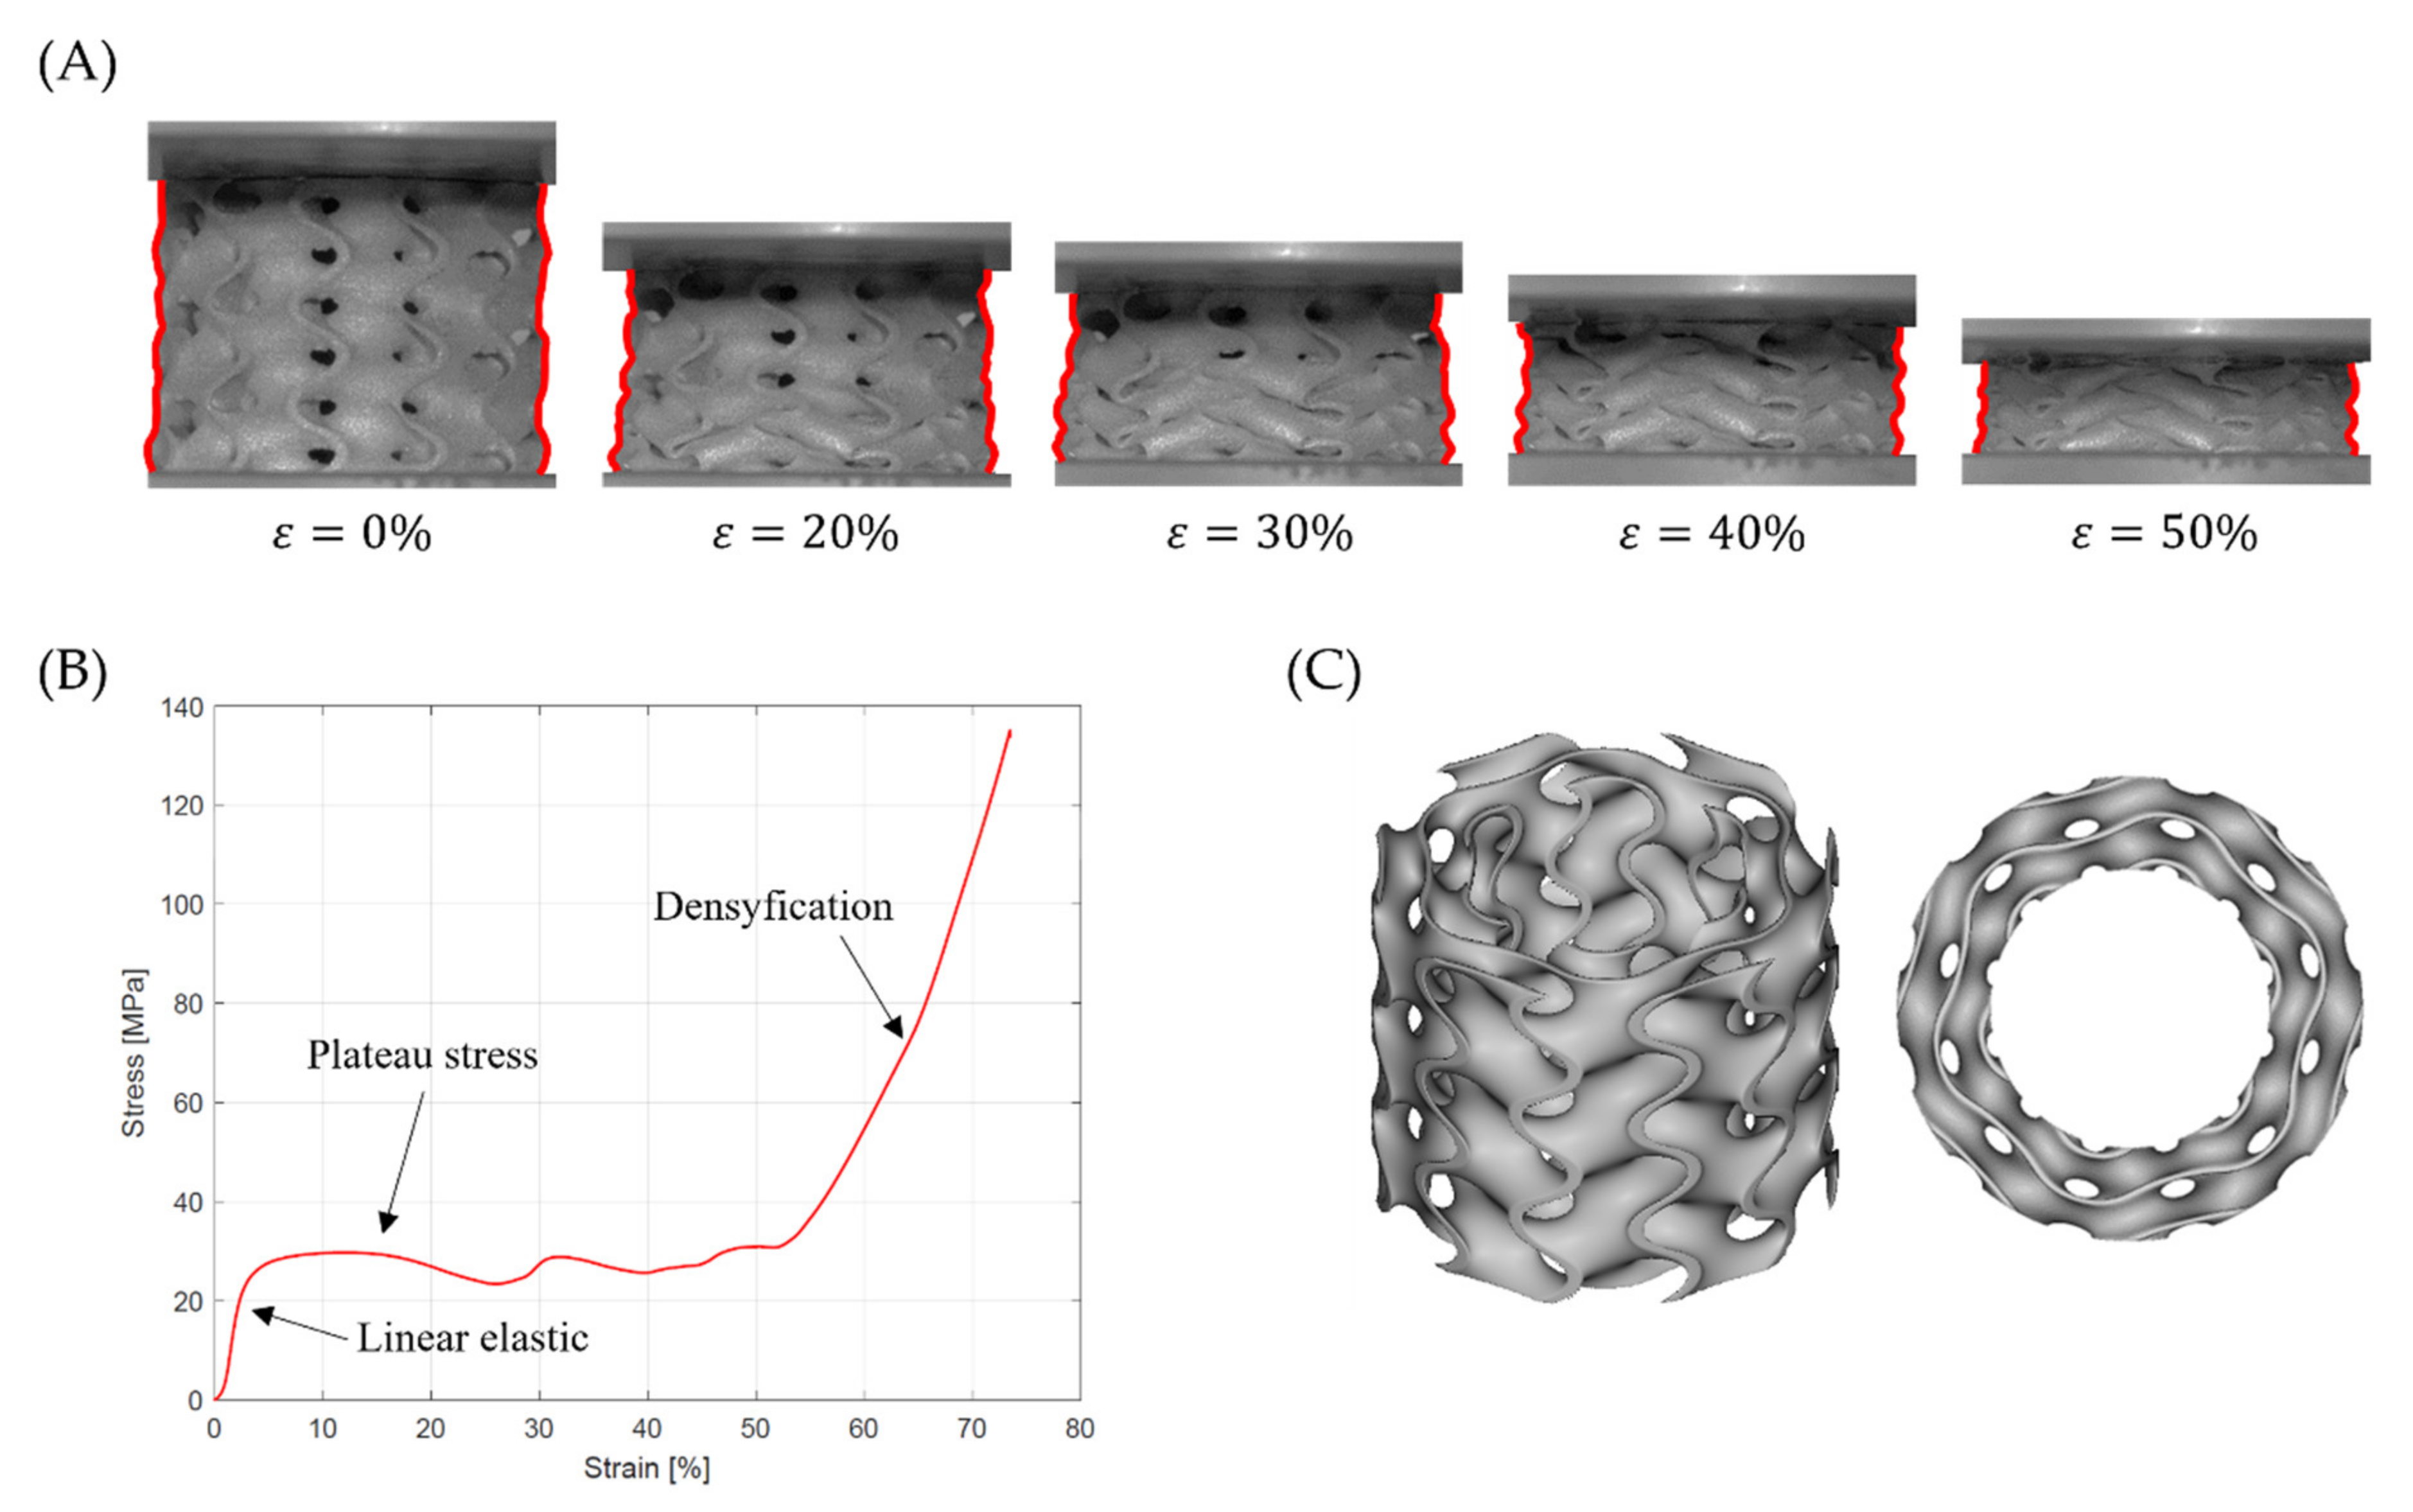
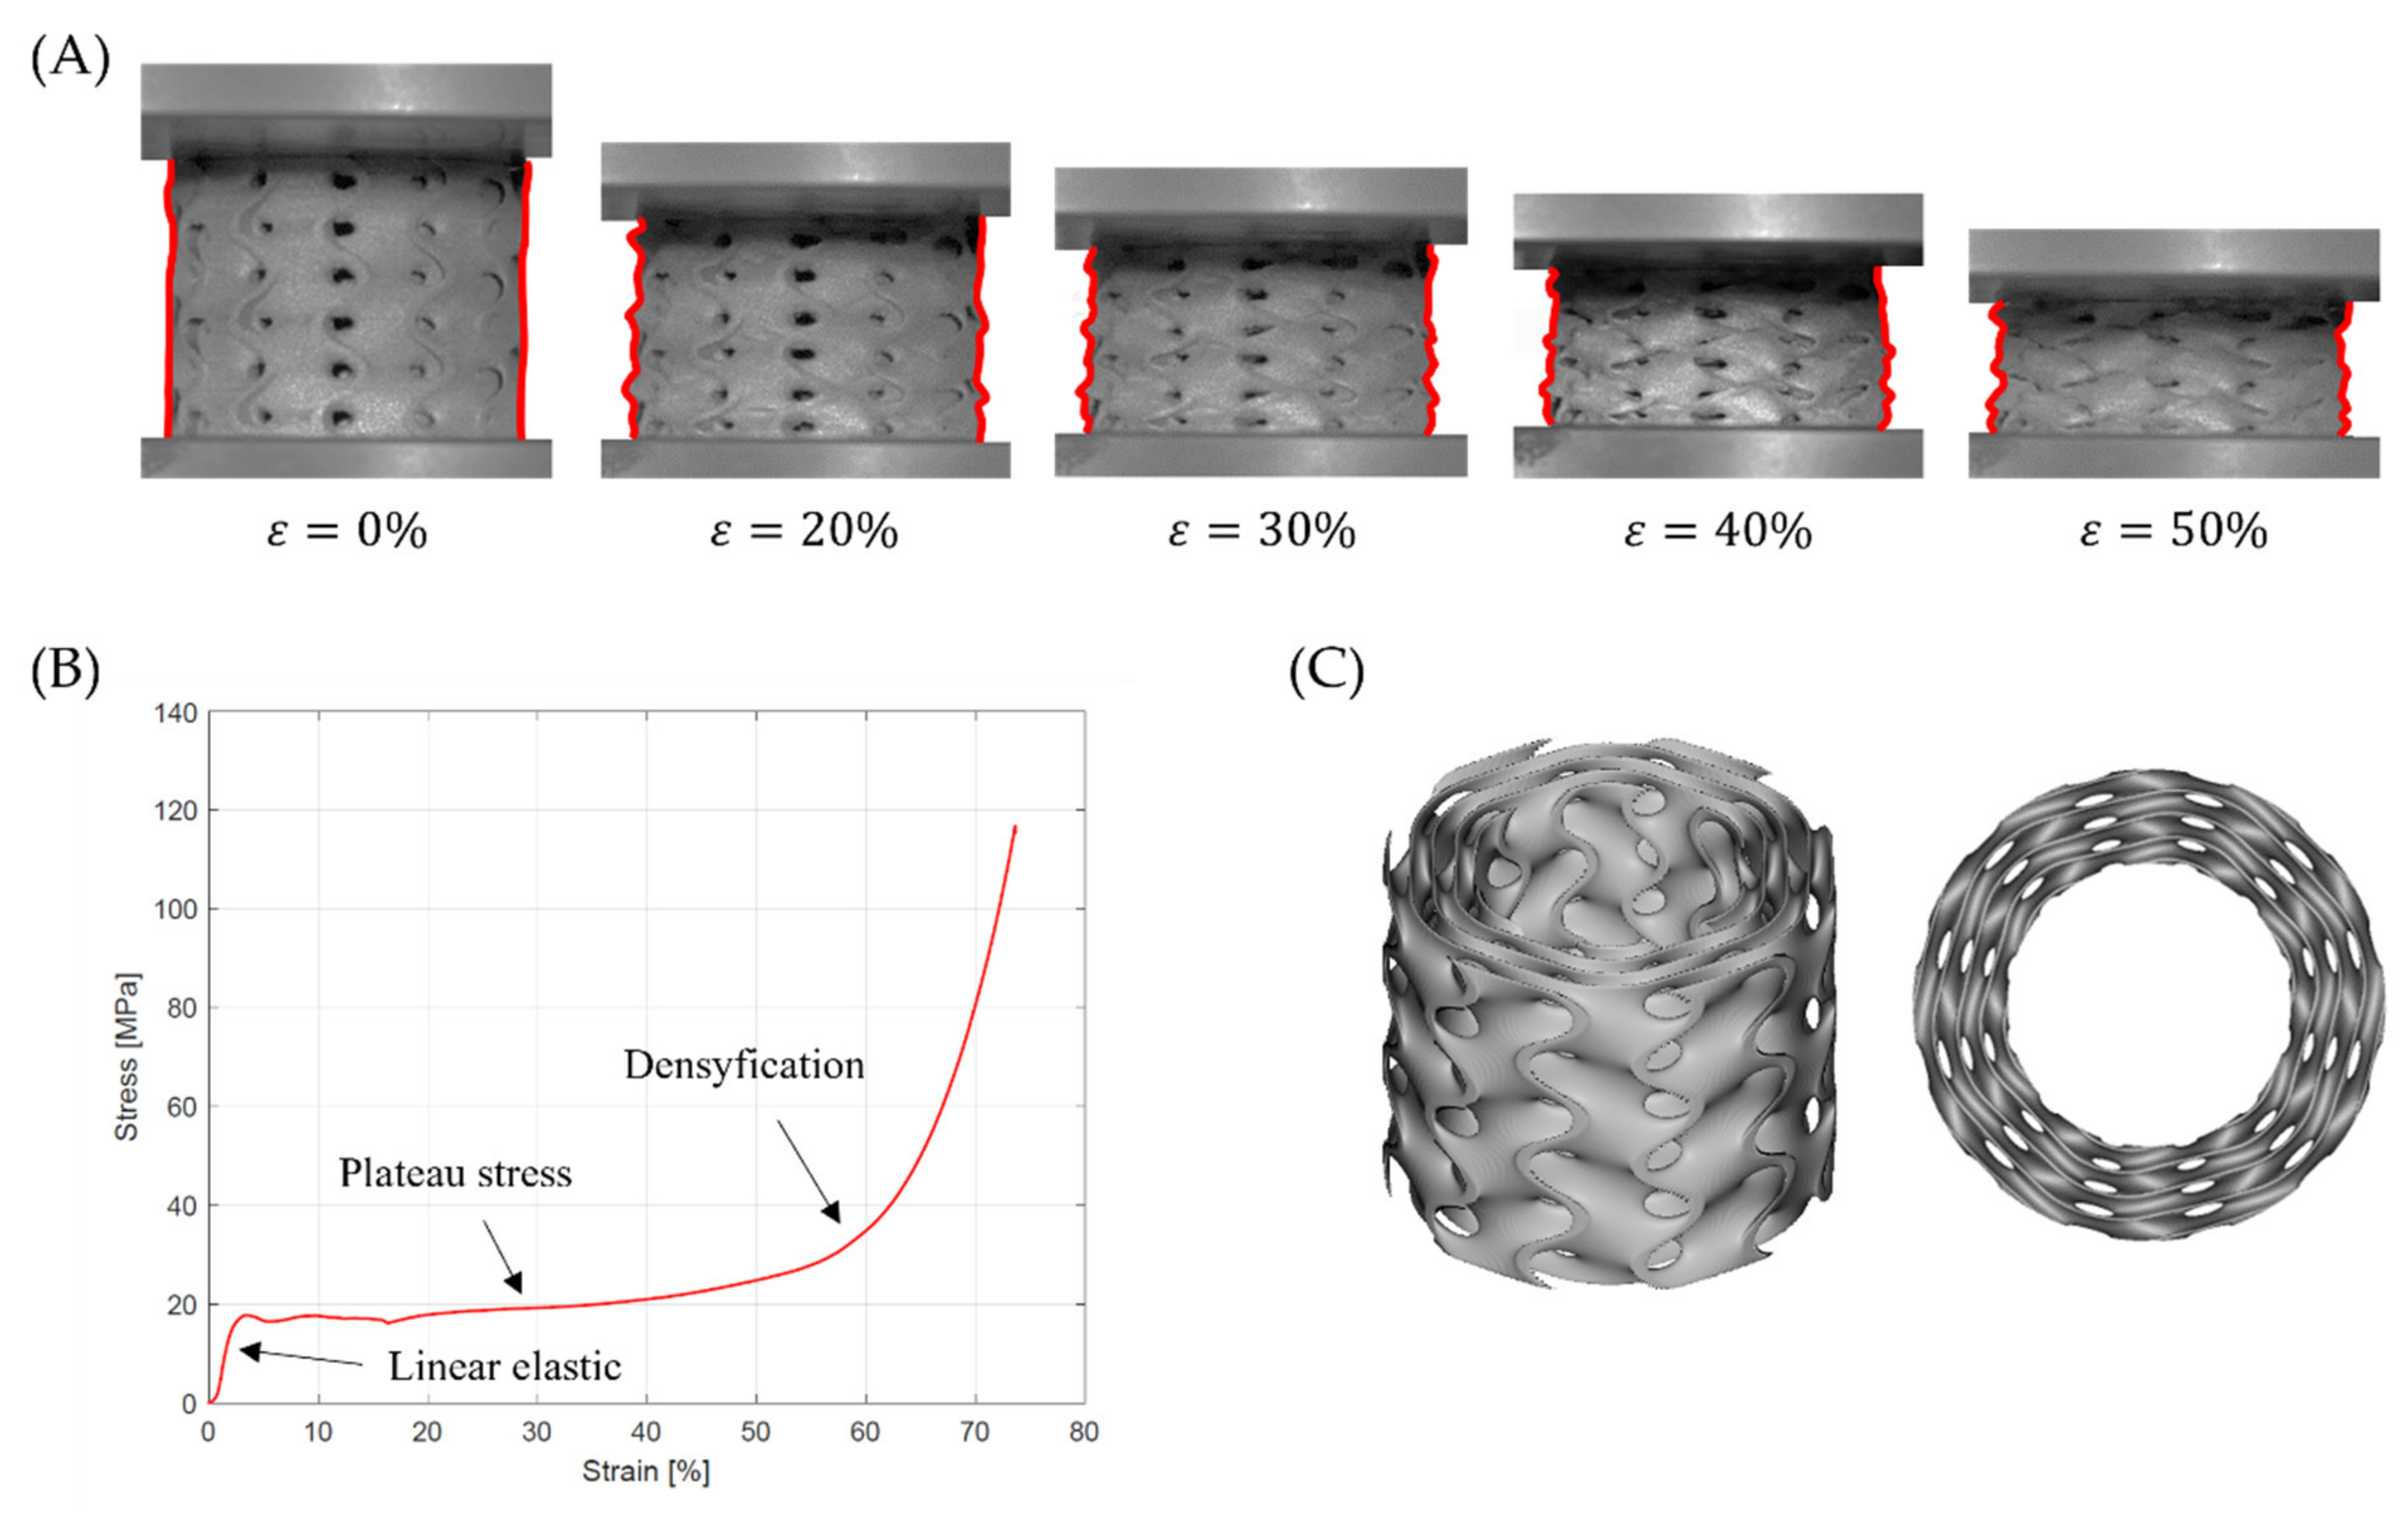
Based on the stress–strain curve, the following relationships between the design parameters of the samples and the course of the plateau area were observed:
An increase in the number of unit cells in the radial direction (nradial) causes appearances oscillations in the plateau region;
For samples with nradial = 2, reducing the number of unit cells in circumference direction (ncircum) and thus increasing the wall thickness (T) causes a decrease in the amount and intensity of the oscillations;
for samples with nradial = 1 and nradial = 1.5, a relatively flat course of the plateau area was observed.
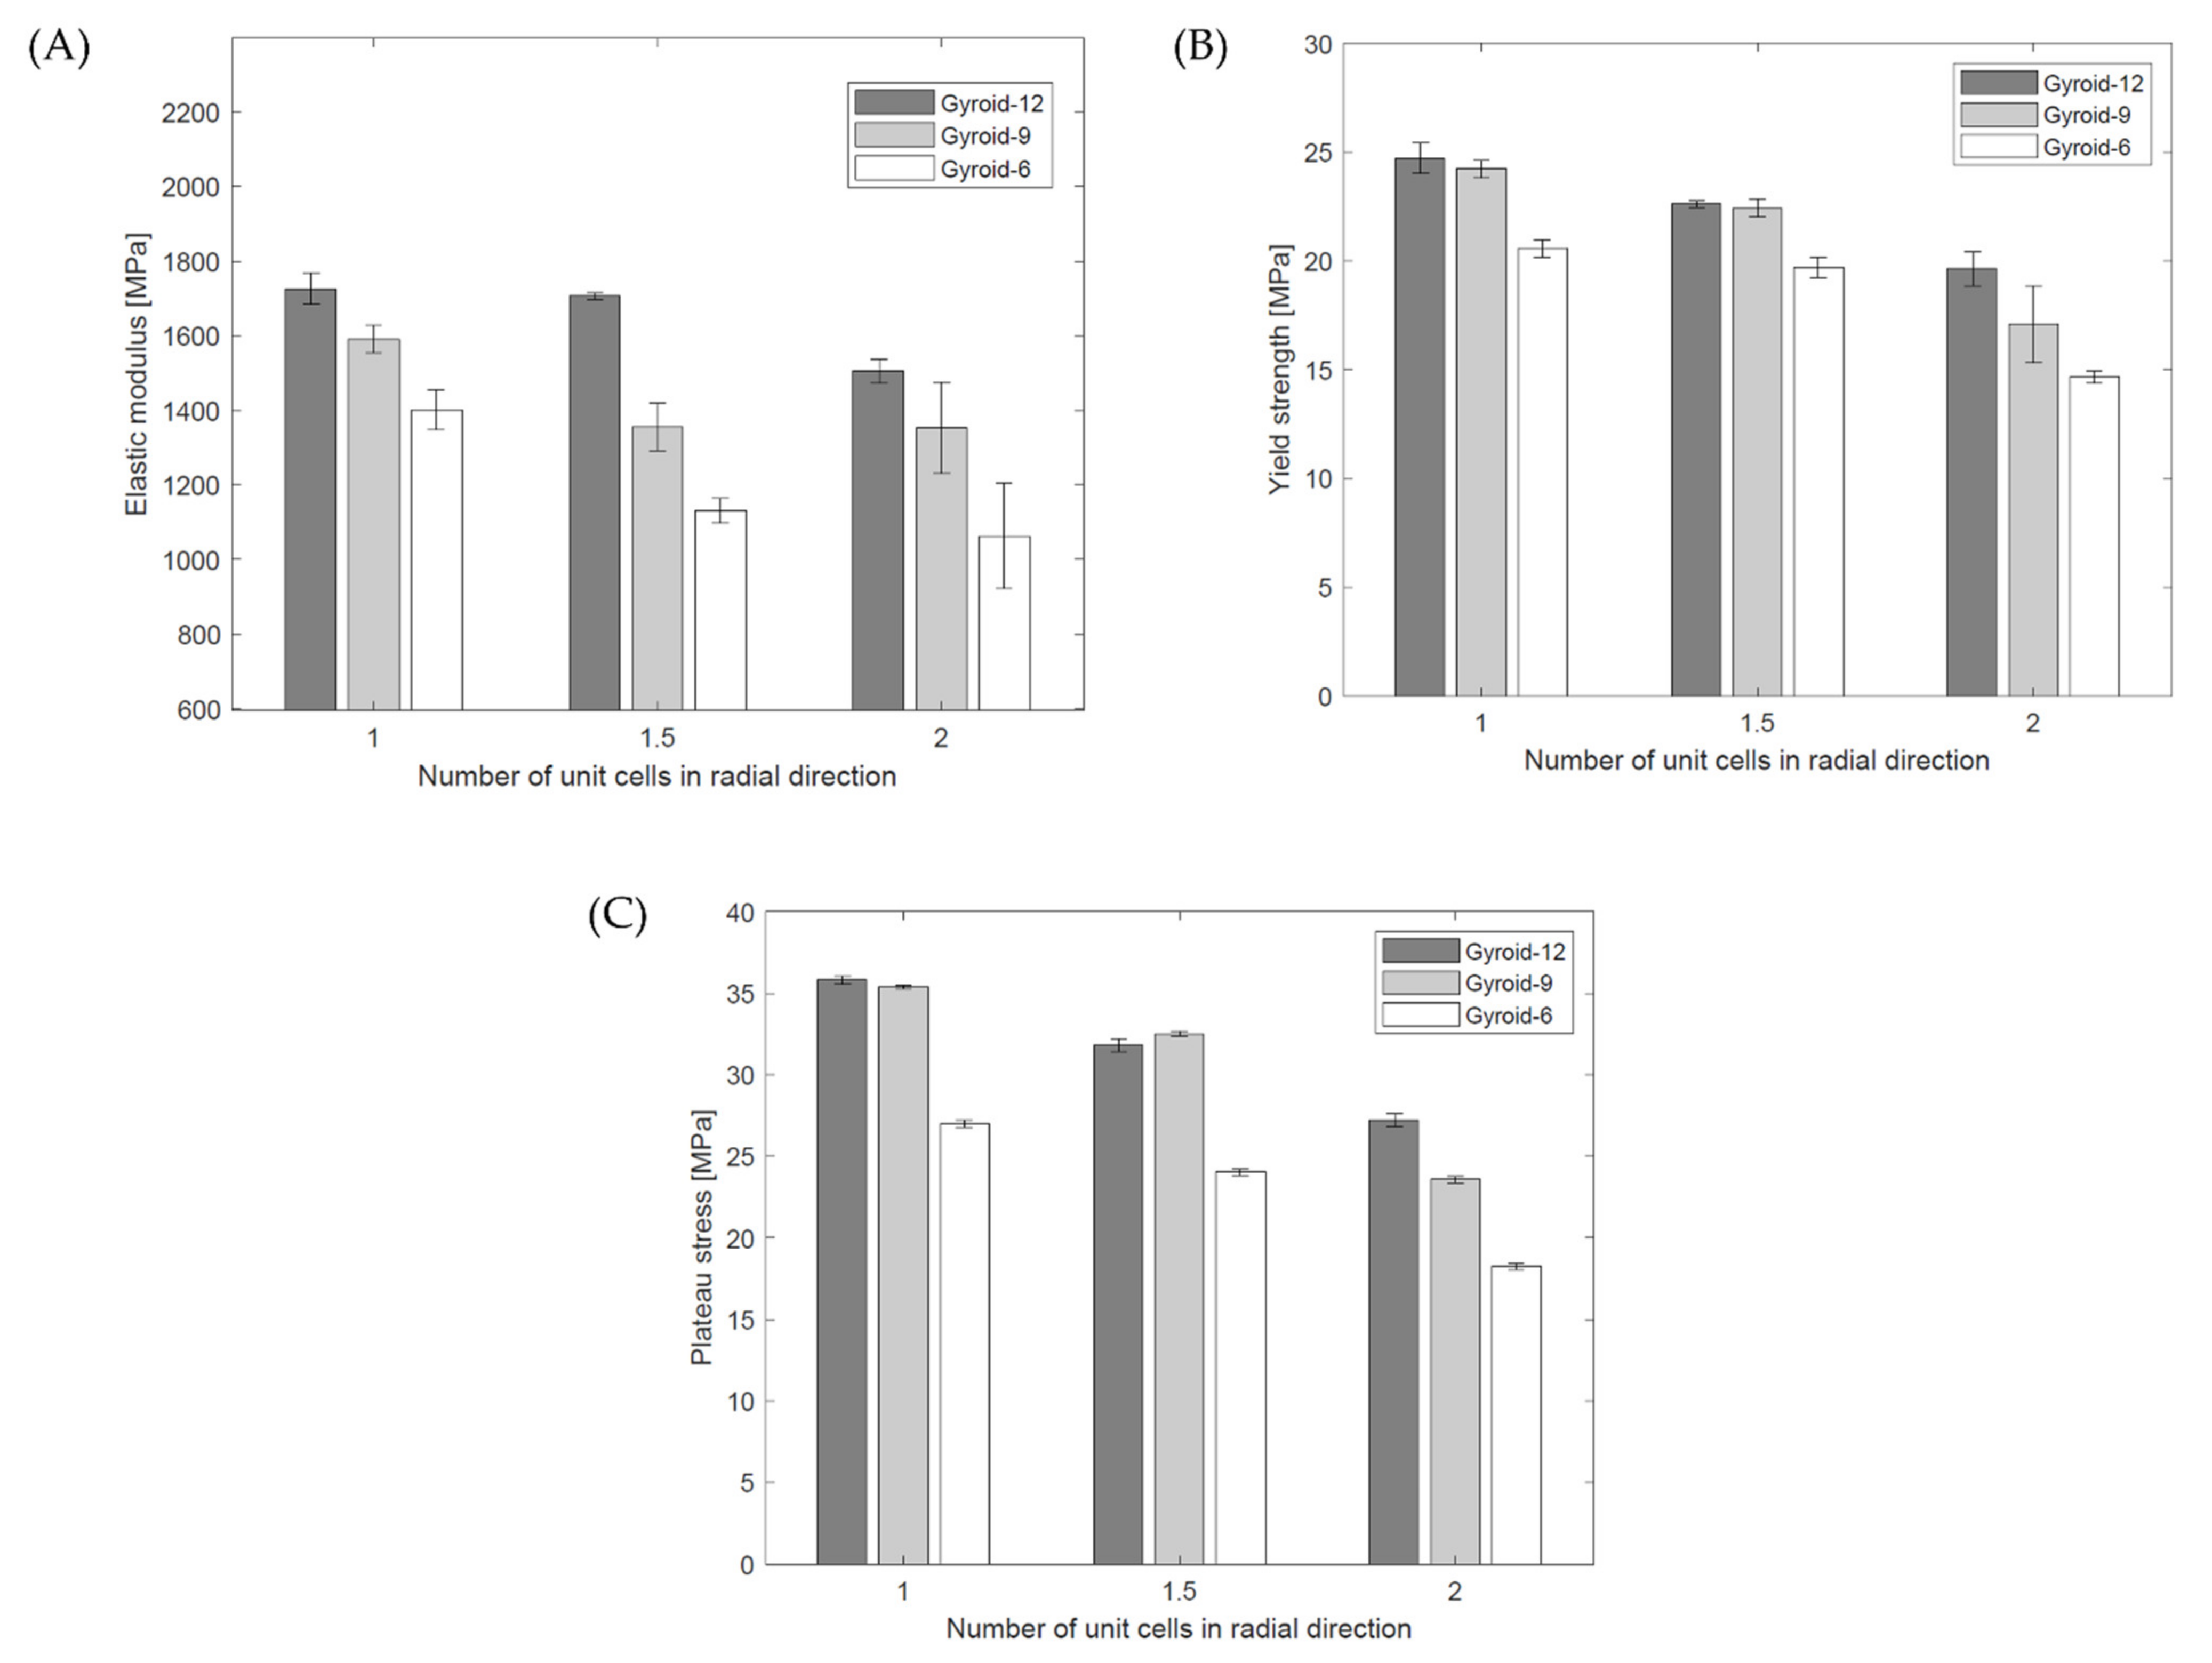
It was observed that the value of elastic modulus, yield strength, and plateau stress of tested samples also depends on the design parameters:
An increase in the number of unit cells in the circumferential direction (ncircum) causes an increase in the value of EL, σy, σL;
A decrease in the number of unit cells in the radial direction (nradial) causes an increase in the value of EL, σy, σL.
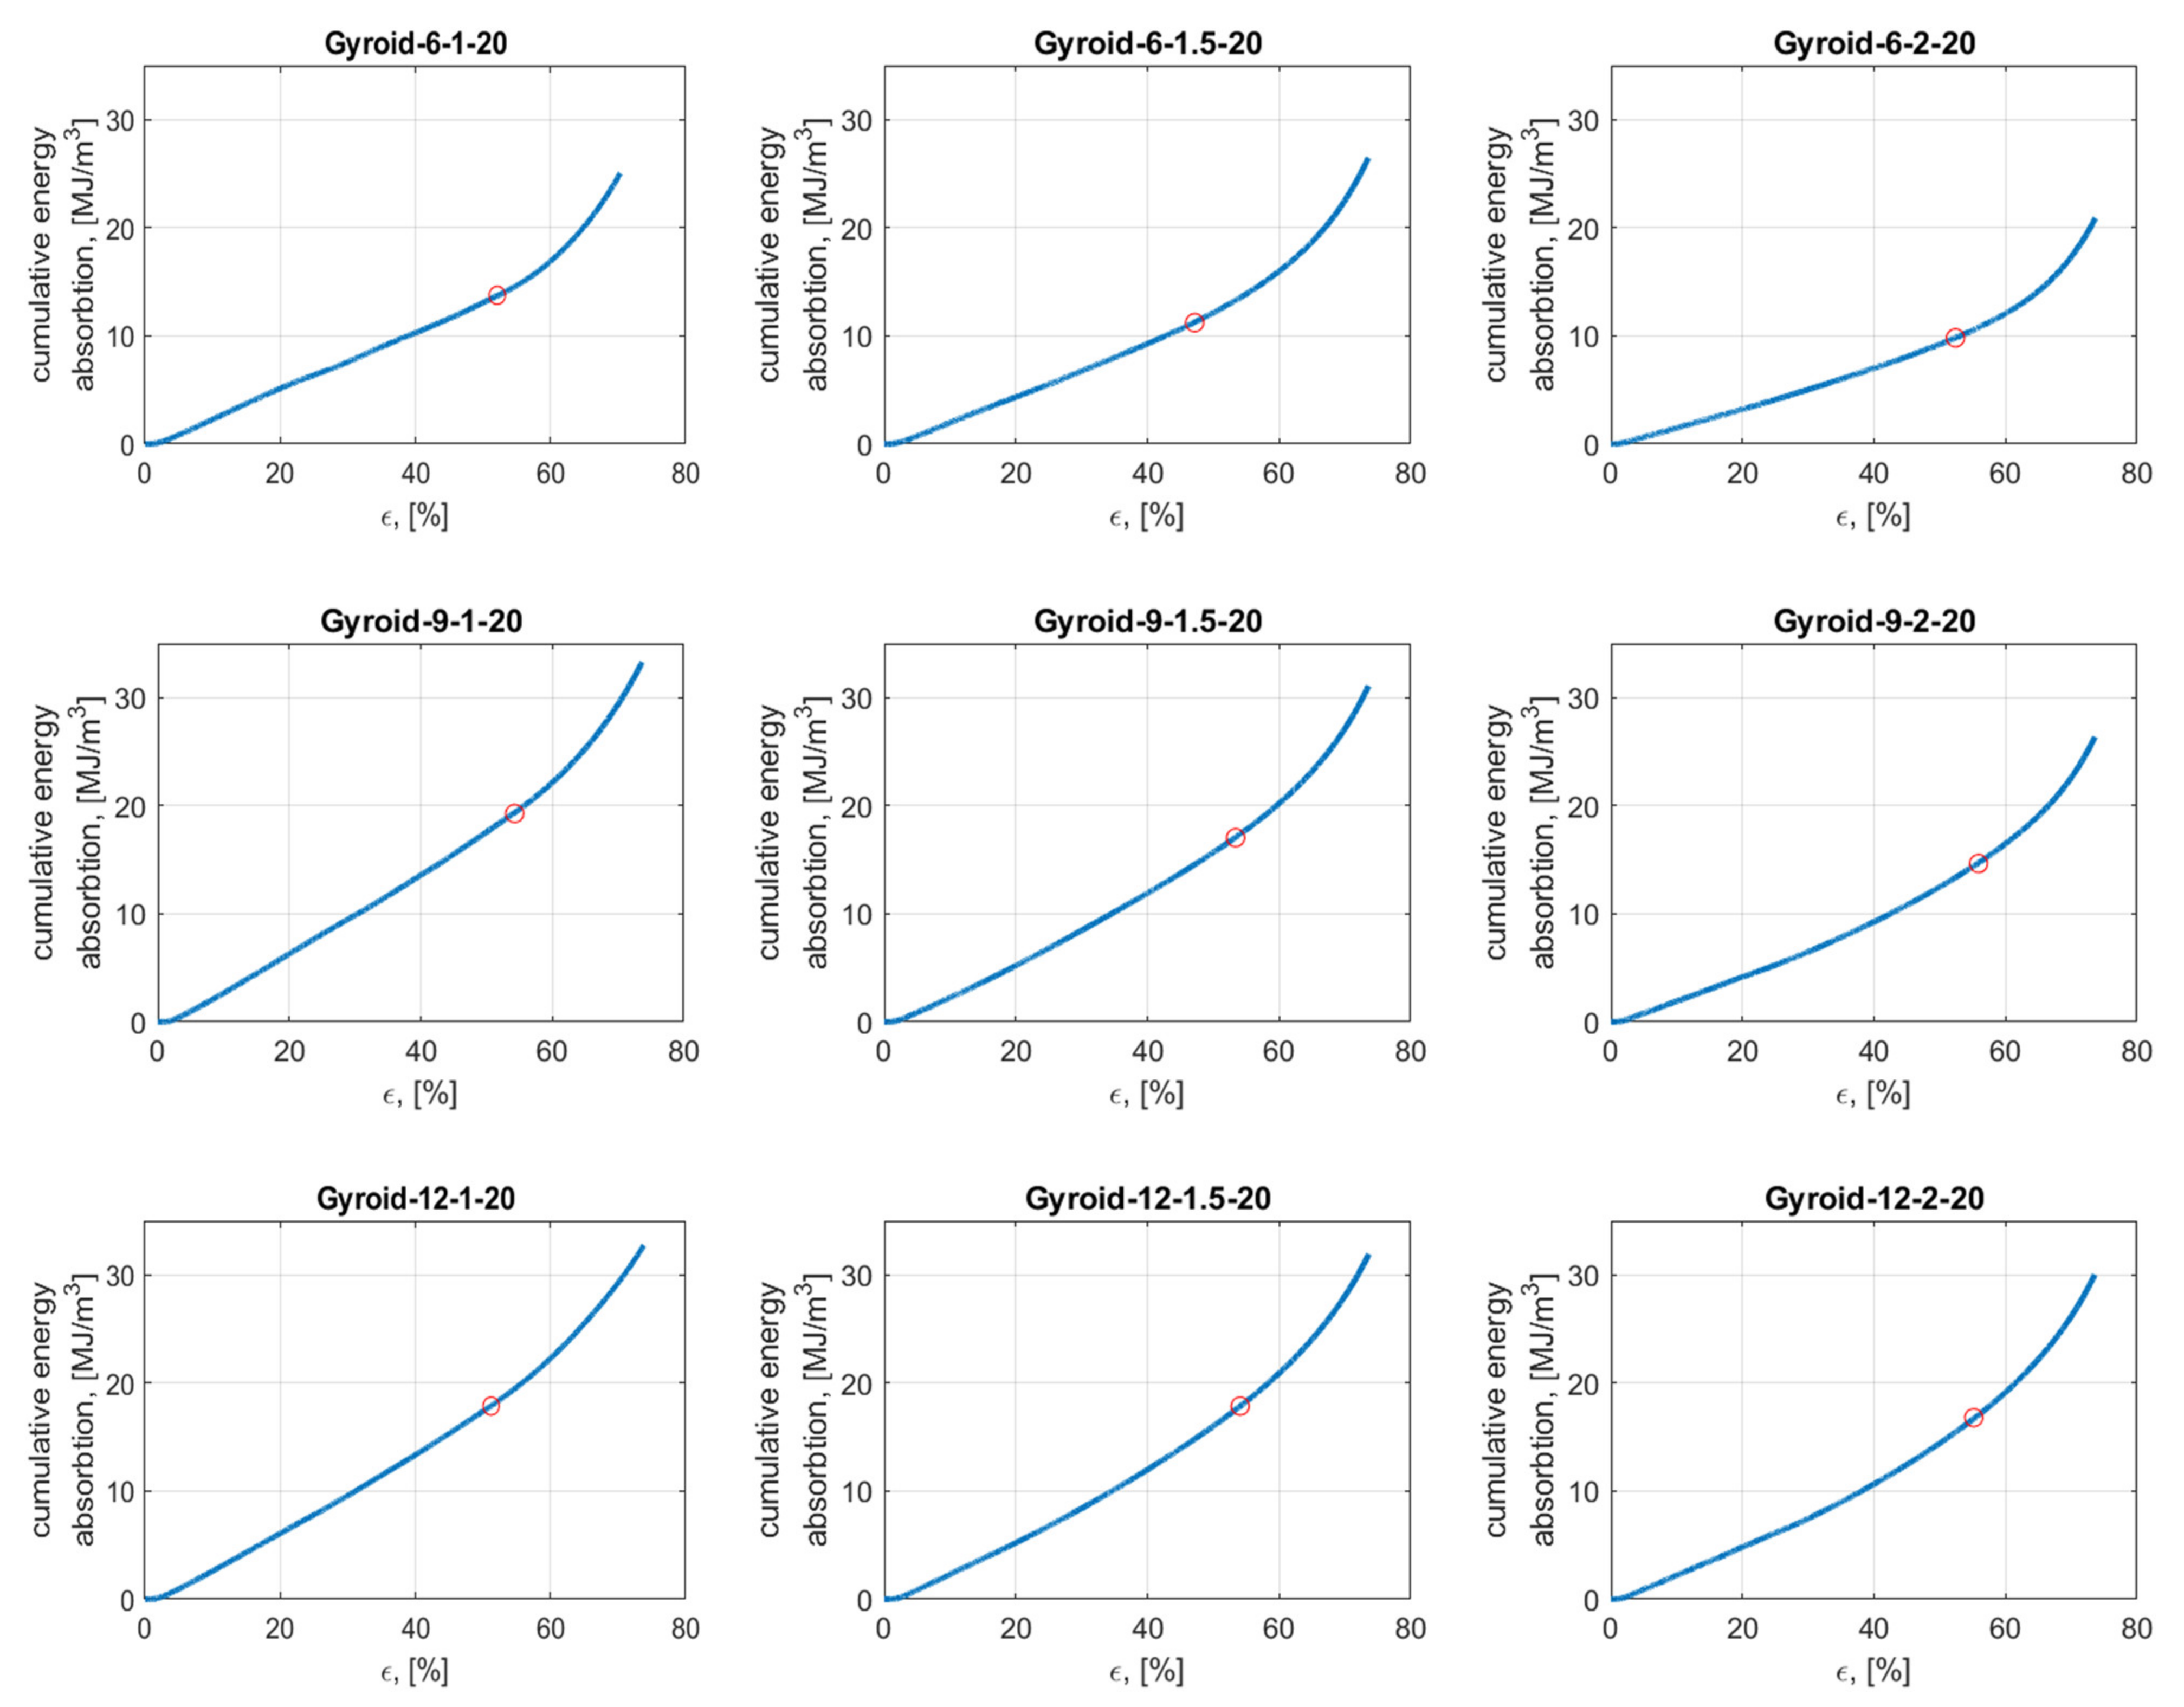
In the field of energy absorption applications, it is important to maximize the total energy absorption and densification point. Based on the data, it was noticed that:
For samples with nradial = 1.5 i nradial = 2, an increase in the number of unit cells in the circumferential direction (ncircum) causes an increase in the value of total energy absorption per unit volume up to the densification point;
for samples with nradial = 1, there is no such clear relationship; however, the sample with ncircum = 6 absorbed the least amount of energy;
for samples with ncircum = 9 and ncircum = 6, a decrease in the number of unit cells in the radial direction (nradial) causes an increase in the value of total energy absorption per unit volume up to the densification point;
for samples with ncircum = 12, there is no such clear relationship.
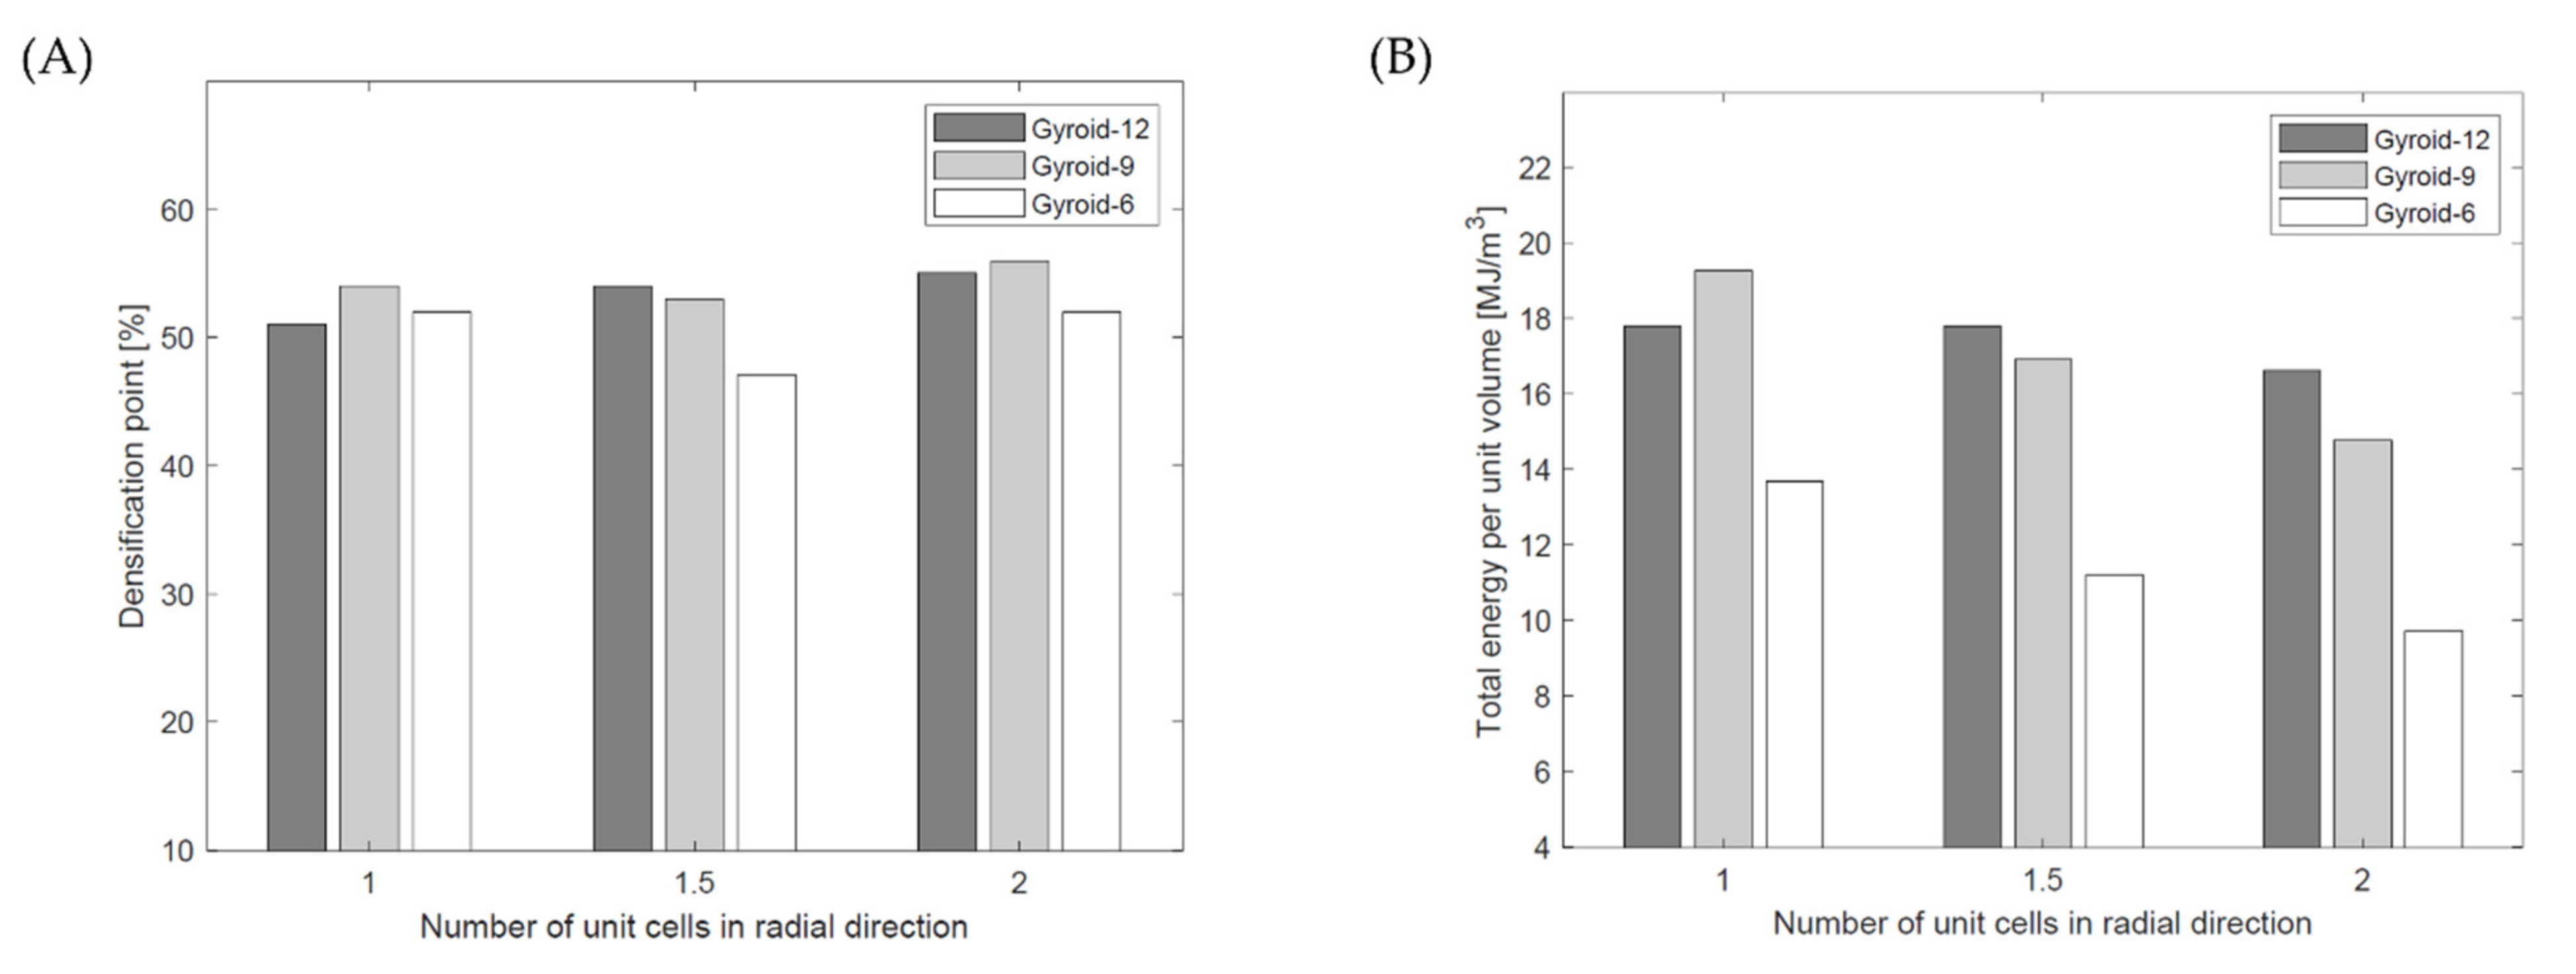
For the tested samples, the highest value of densification point (56%) was observed for the Gyroid_9_2_20_0.64 sample and the lowest (47%) for the Gyroid_6_1.5_20_0.80 sample.
The highest value of the total energy absorbed per unit volume up to the densification point (19.26 MJ/m3) was observed for the Gyroid_9_1_20_0.77 sample. This sample also had one of the highest densification point values (54%). The deformation mode of this sample was classified as global uniform. The lowest value of the total energy absorbed per unit volume up to the densification point (9.72 MJ/m3) was observed for the Gyroid_6_2_20_0.73. This sample ranks 5th in terms of the densification point value (52%). The deformation mode of this sample was classified as “layer-by-layer” with incomplete densification of collapsing layers.
In conclusion, a relationship between the design parameters (nradial i ncircum) and mechanical properties (EL, σy, σL) and energy absorption ability in the analyzed range of variability of design parameters was observed. It is difficult to indicate a clear trend of the variability of the deformation mode with the change in design parameters (nradial and ncircus). According to this, the authors of the study concluded that for a better understanding of the deformation modes phenomenon and to indicate the usefulness of the studied structures for the proposed applications (energy absorption), it would be beneficial to extend the experiment by, among others:
Increasing the range of variability of design parameters (nradial and ncircum);
Analysis of the impact of changing the internal diameter;
Analysis of the effect of changing the number of unit cells (layers) in the axial direction (naxial);
Analysis of the effect of the gradient of the wall thickness change in the axial direction.


