
Experimental Analysis of Steel Circular Hollow Section under Bending Loads: Comprehensive Study of Mechanical Performance


 , , and
Abstract
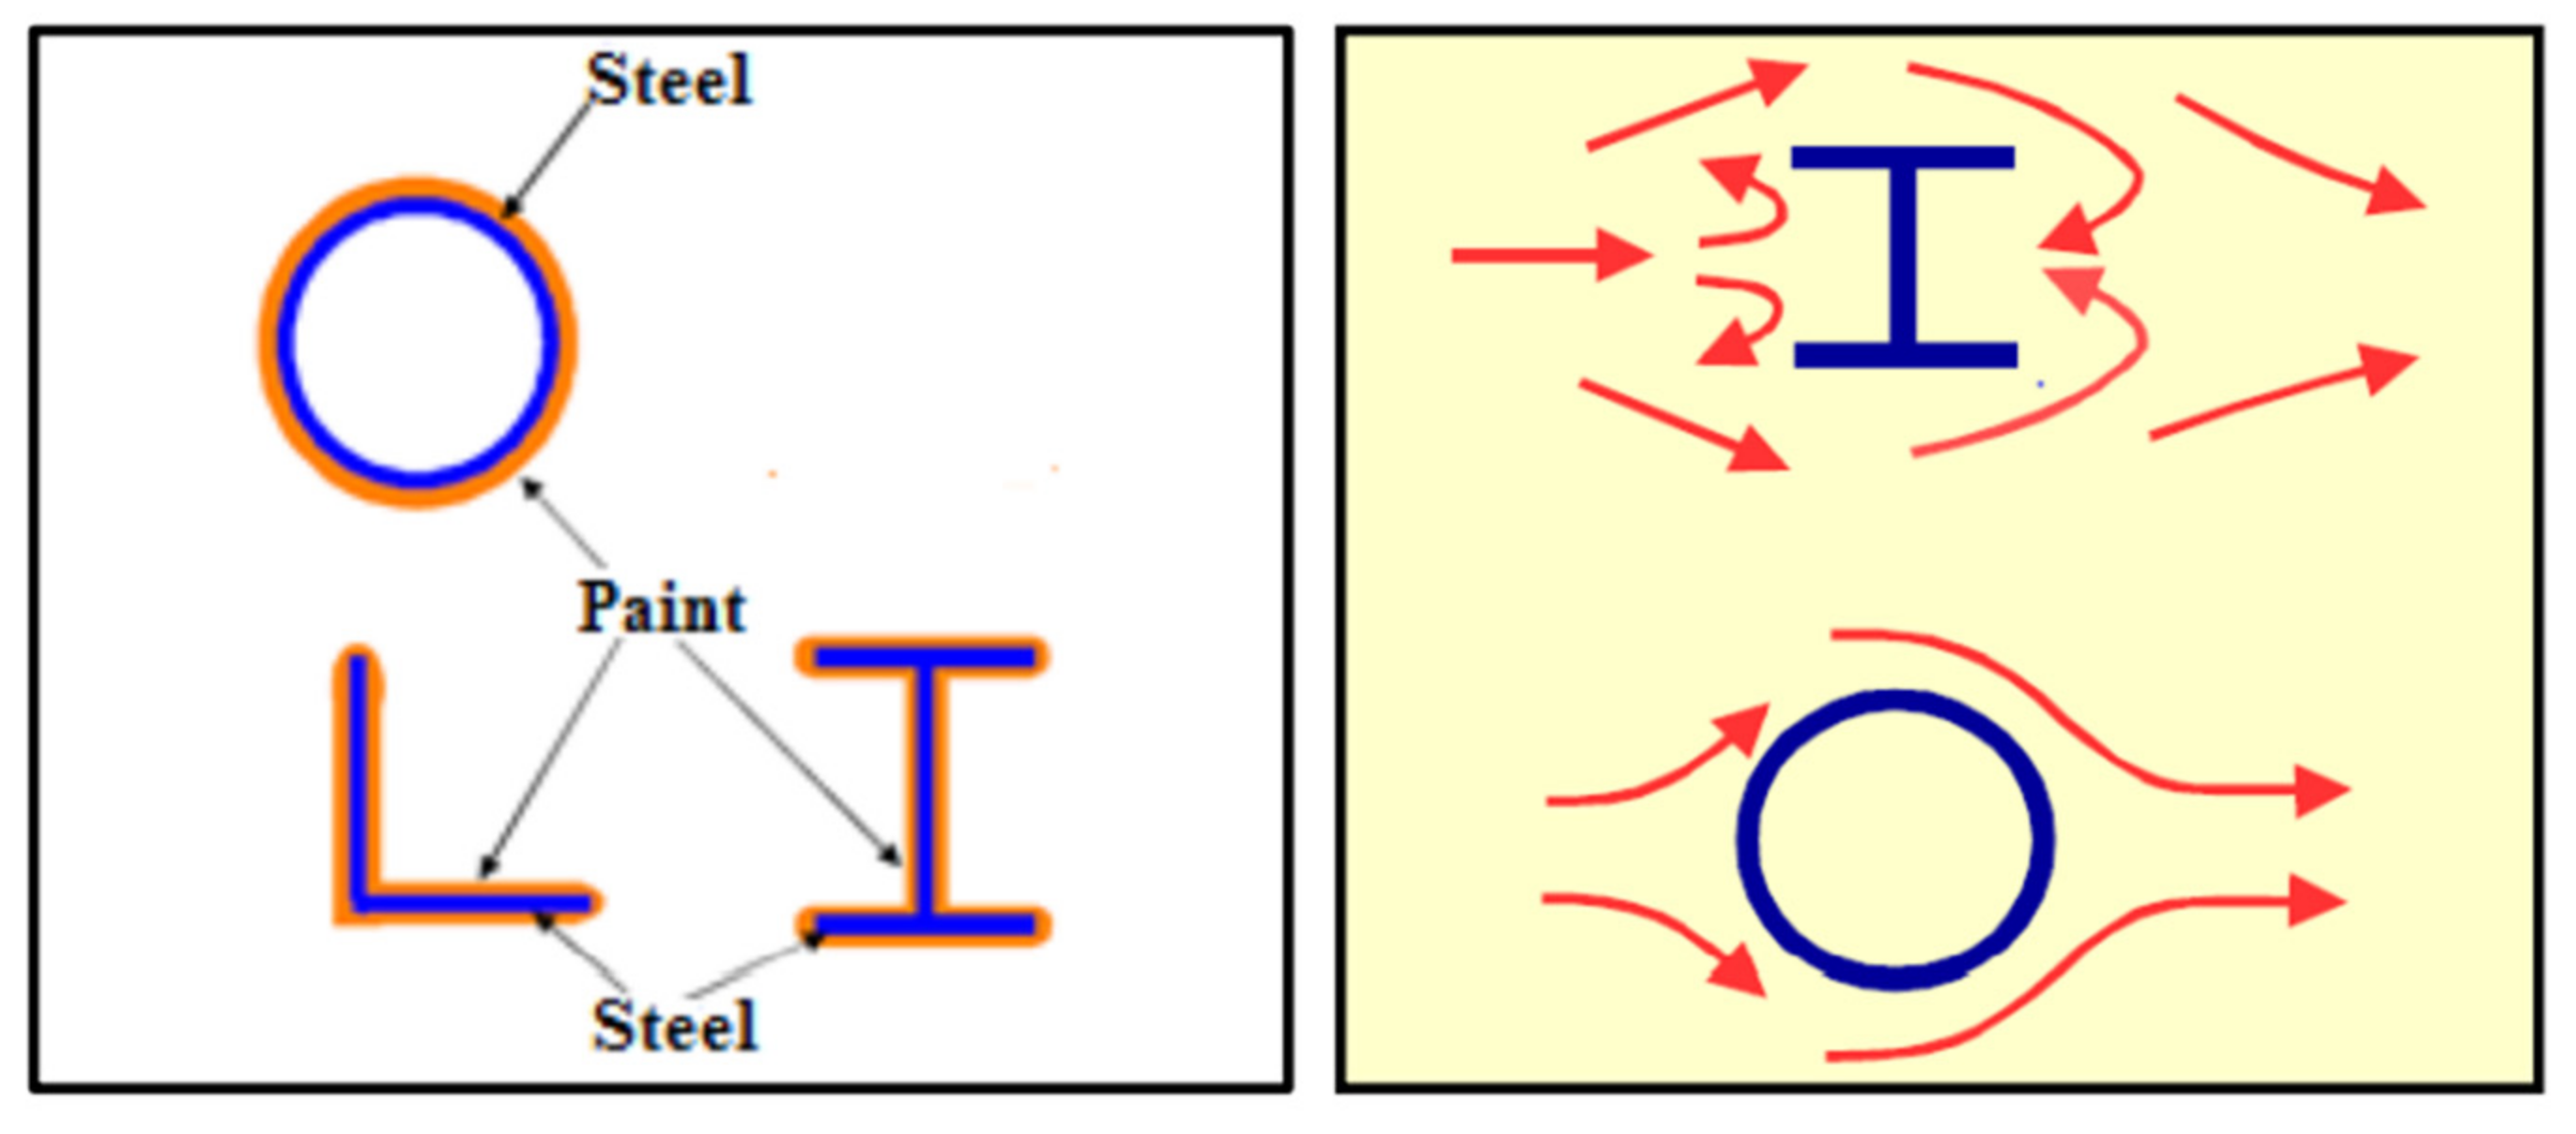
:1. Introduction
- a.
- It has high tensile strength compared to concrete;
- b.
- Structural steel has high strength, toughness, stiffness, and tensile properties;
- c.
- Steel can be developed into any shape, either welded or bolted together in construction;
- d.
- Steel construction is fast, which reduces the time required to construct the project, and it can be disassembled easily without losing the integrity of the structure.
2. Materials and Methods
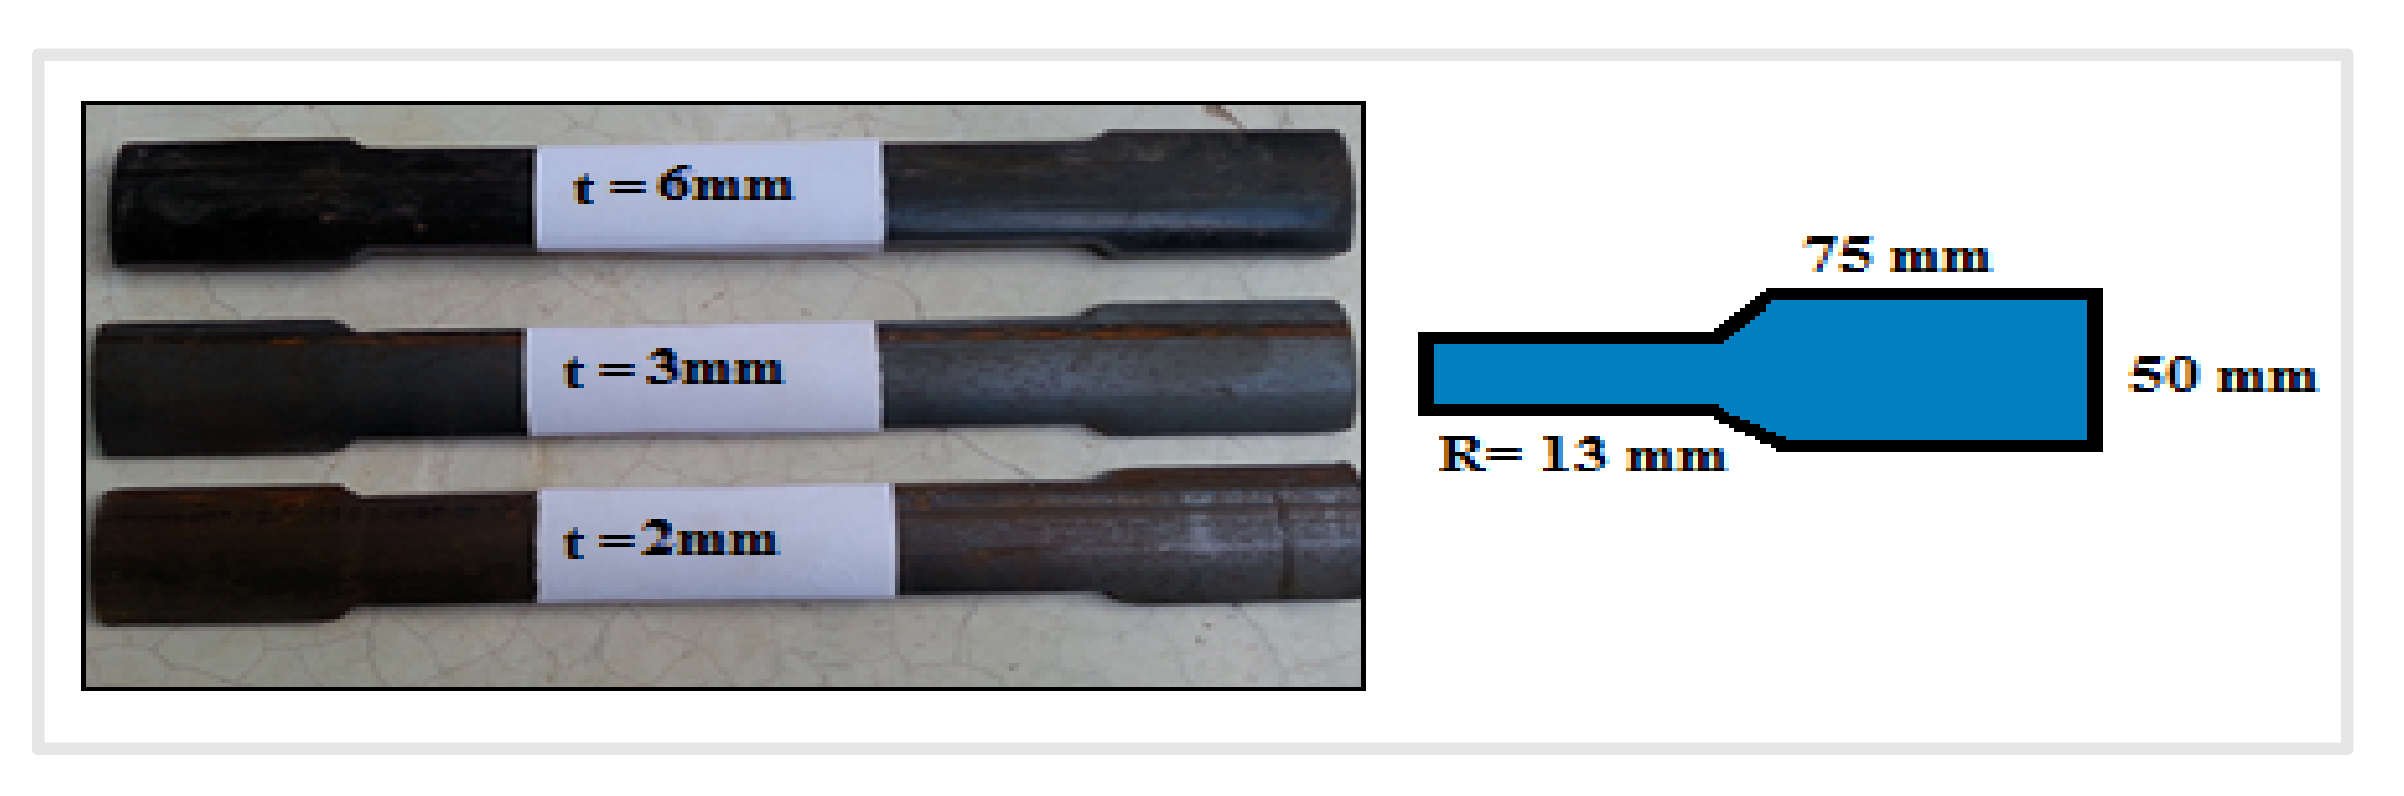
2.1. Material Properties
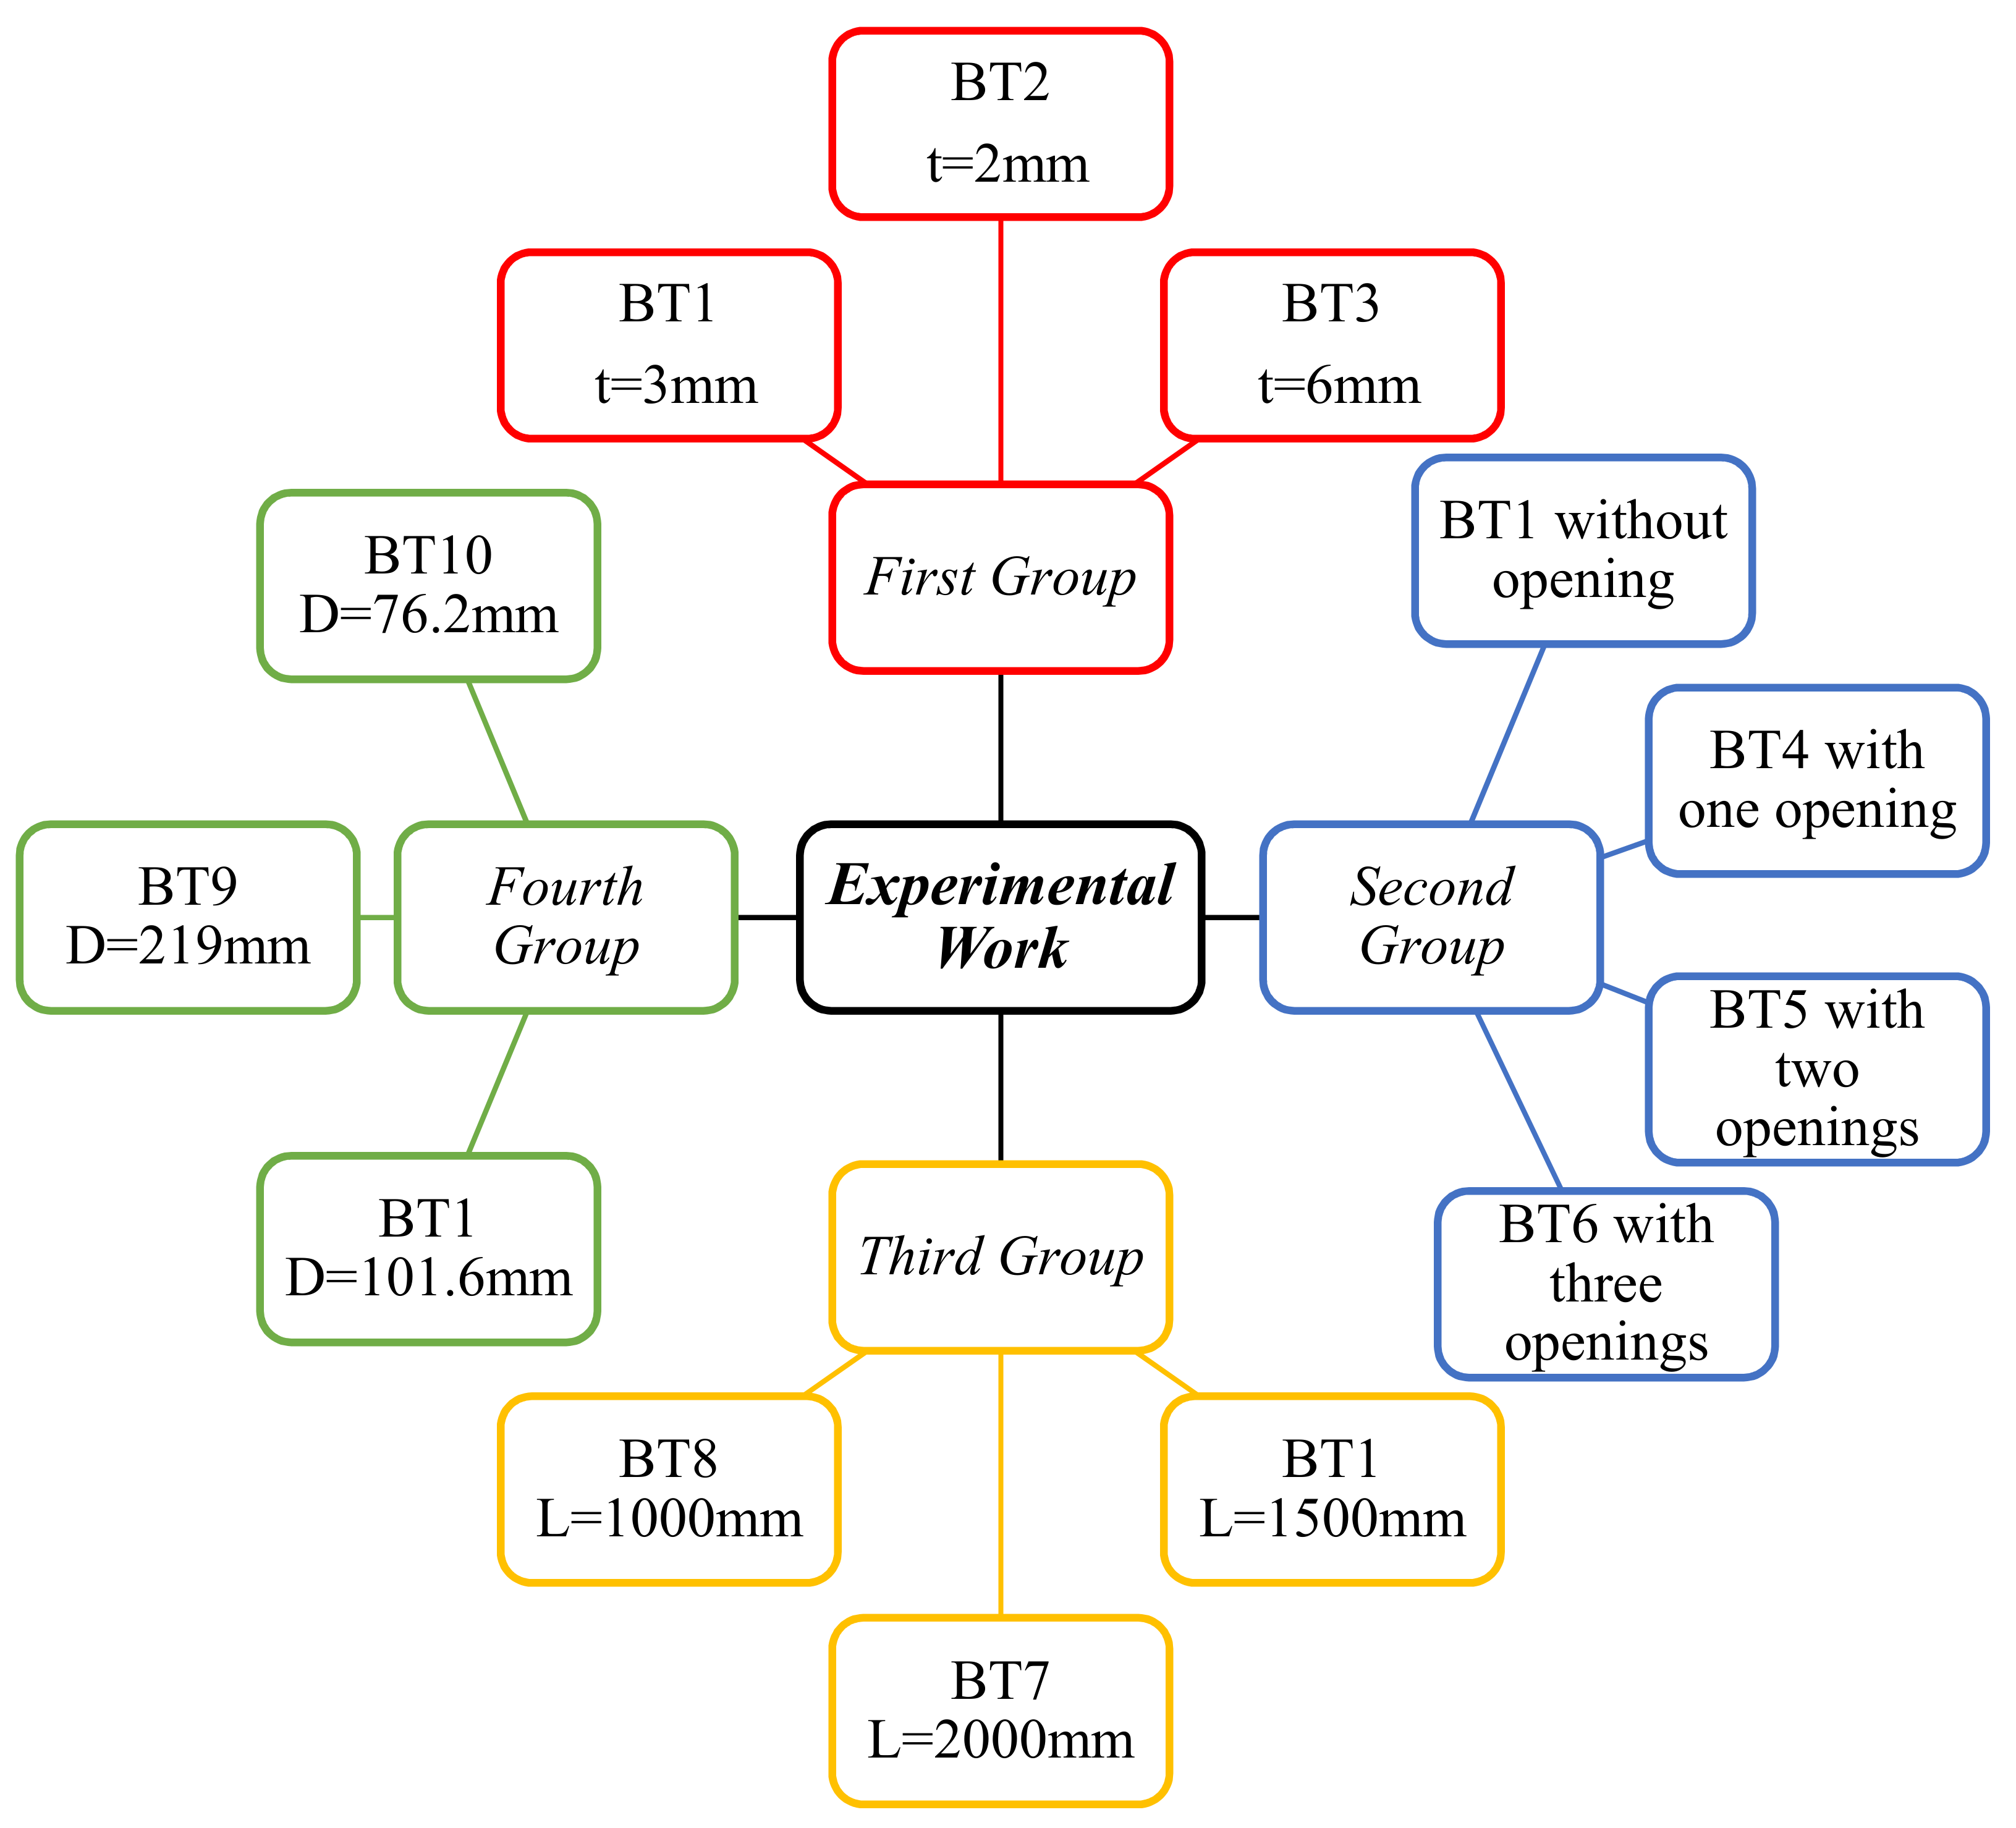
2.2. The Experimental Plan
2.2.1. The Reference Specimen
2.2.2. The Modified Specimens
The First Group
The Second Group
The Third Group
The Fourth Group
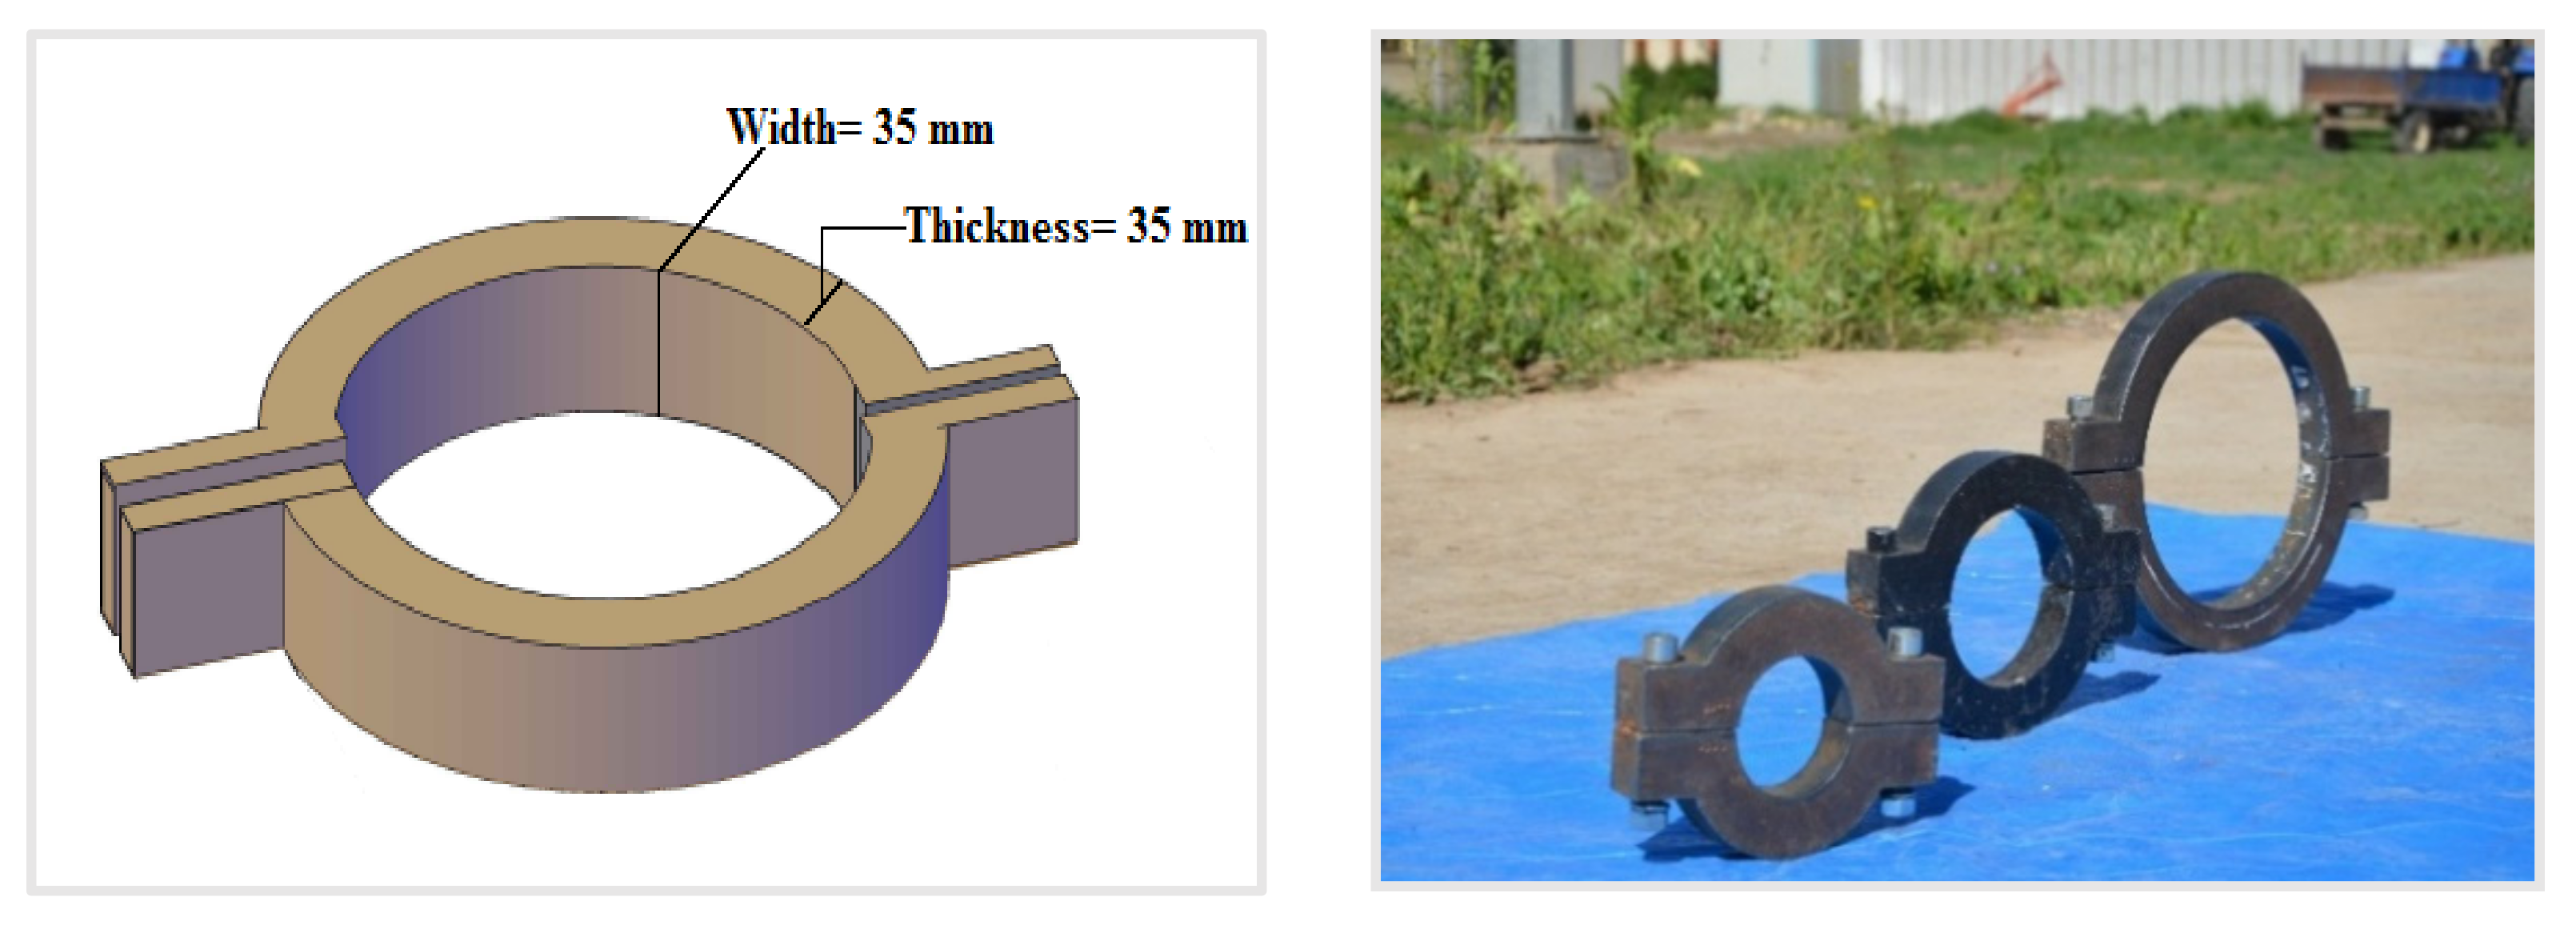
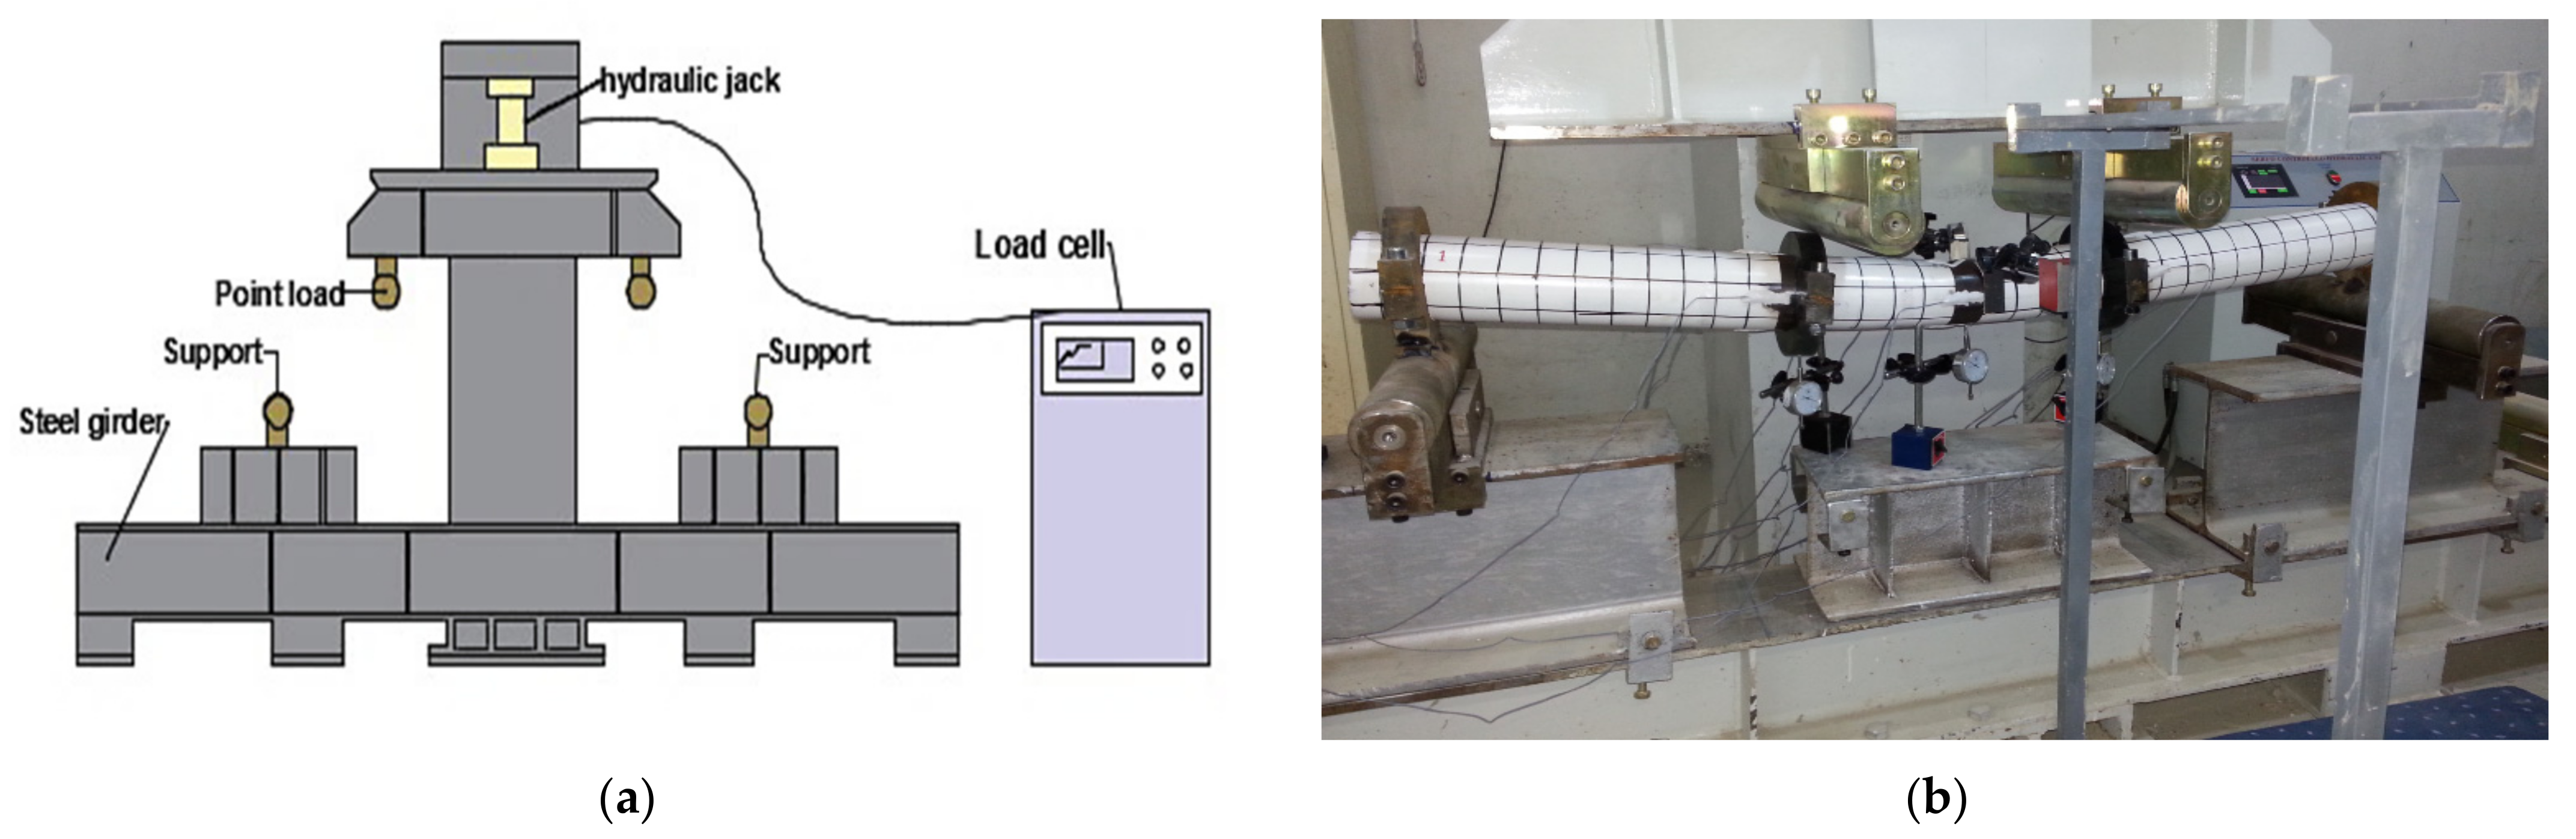
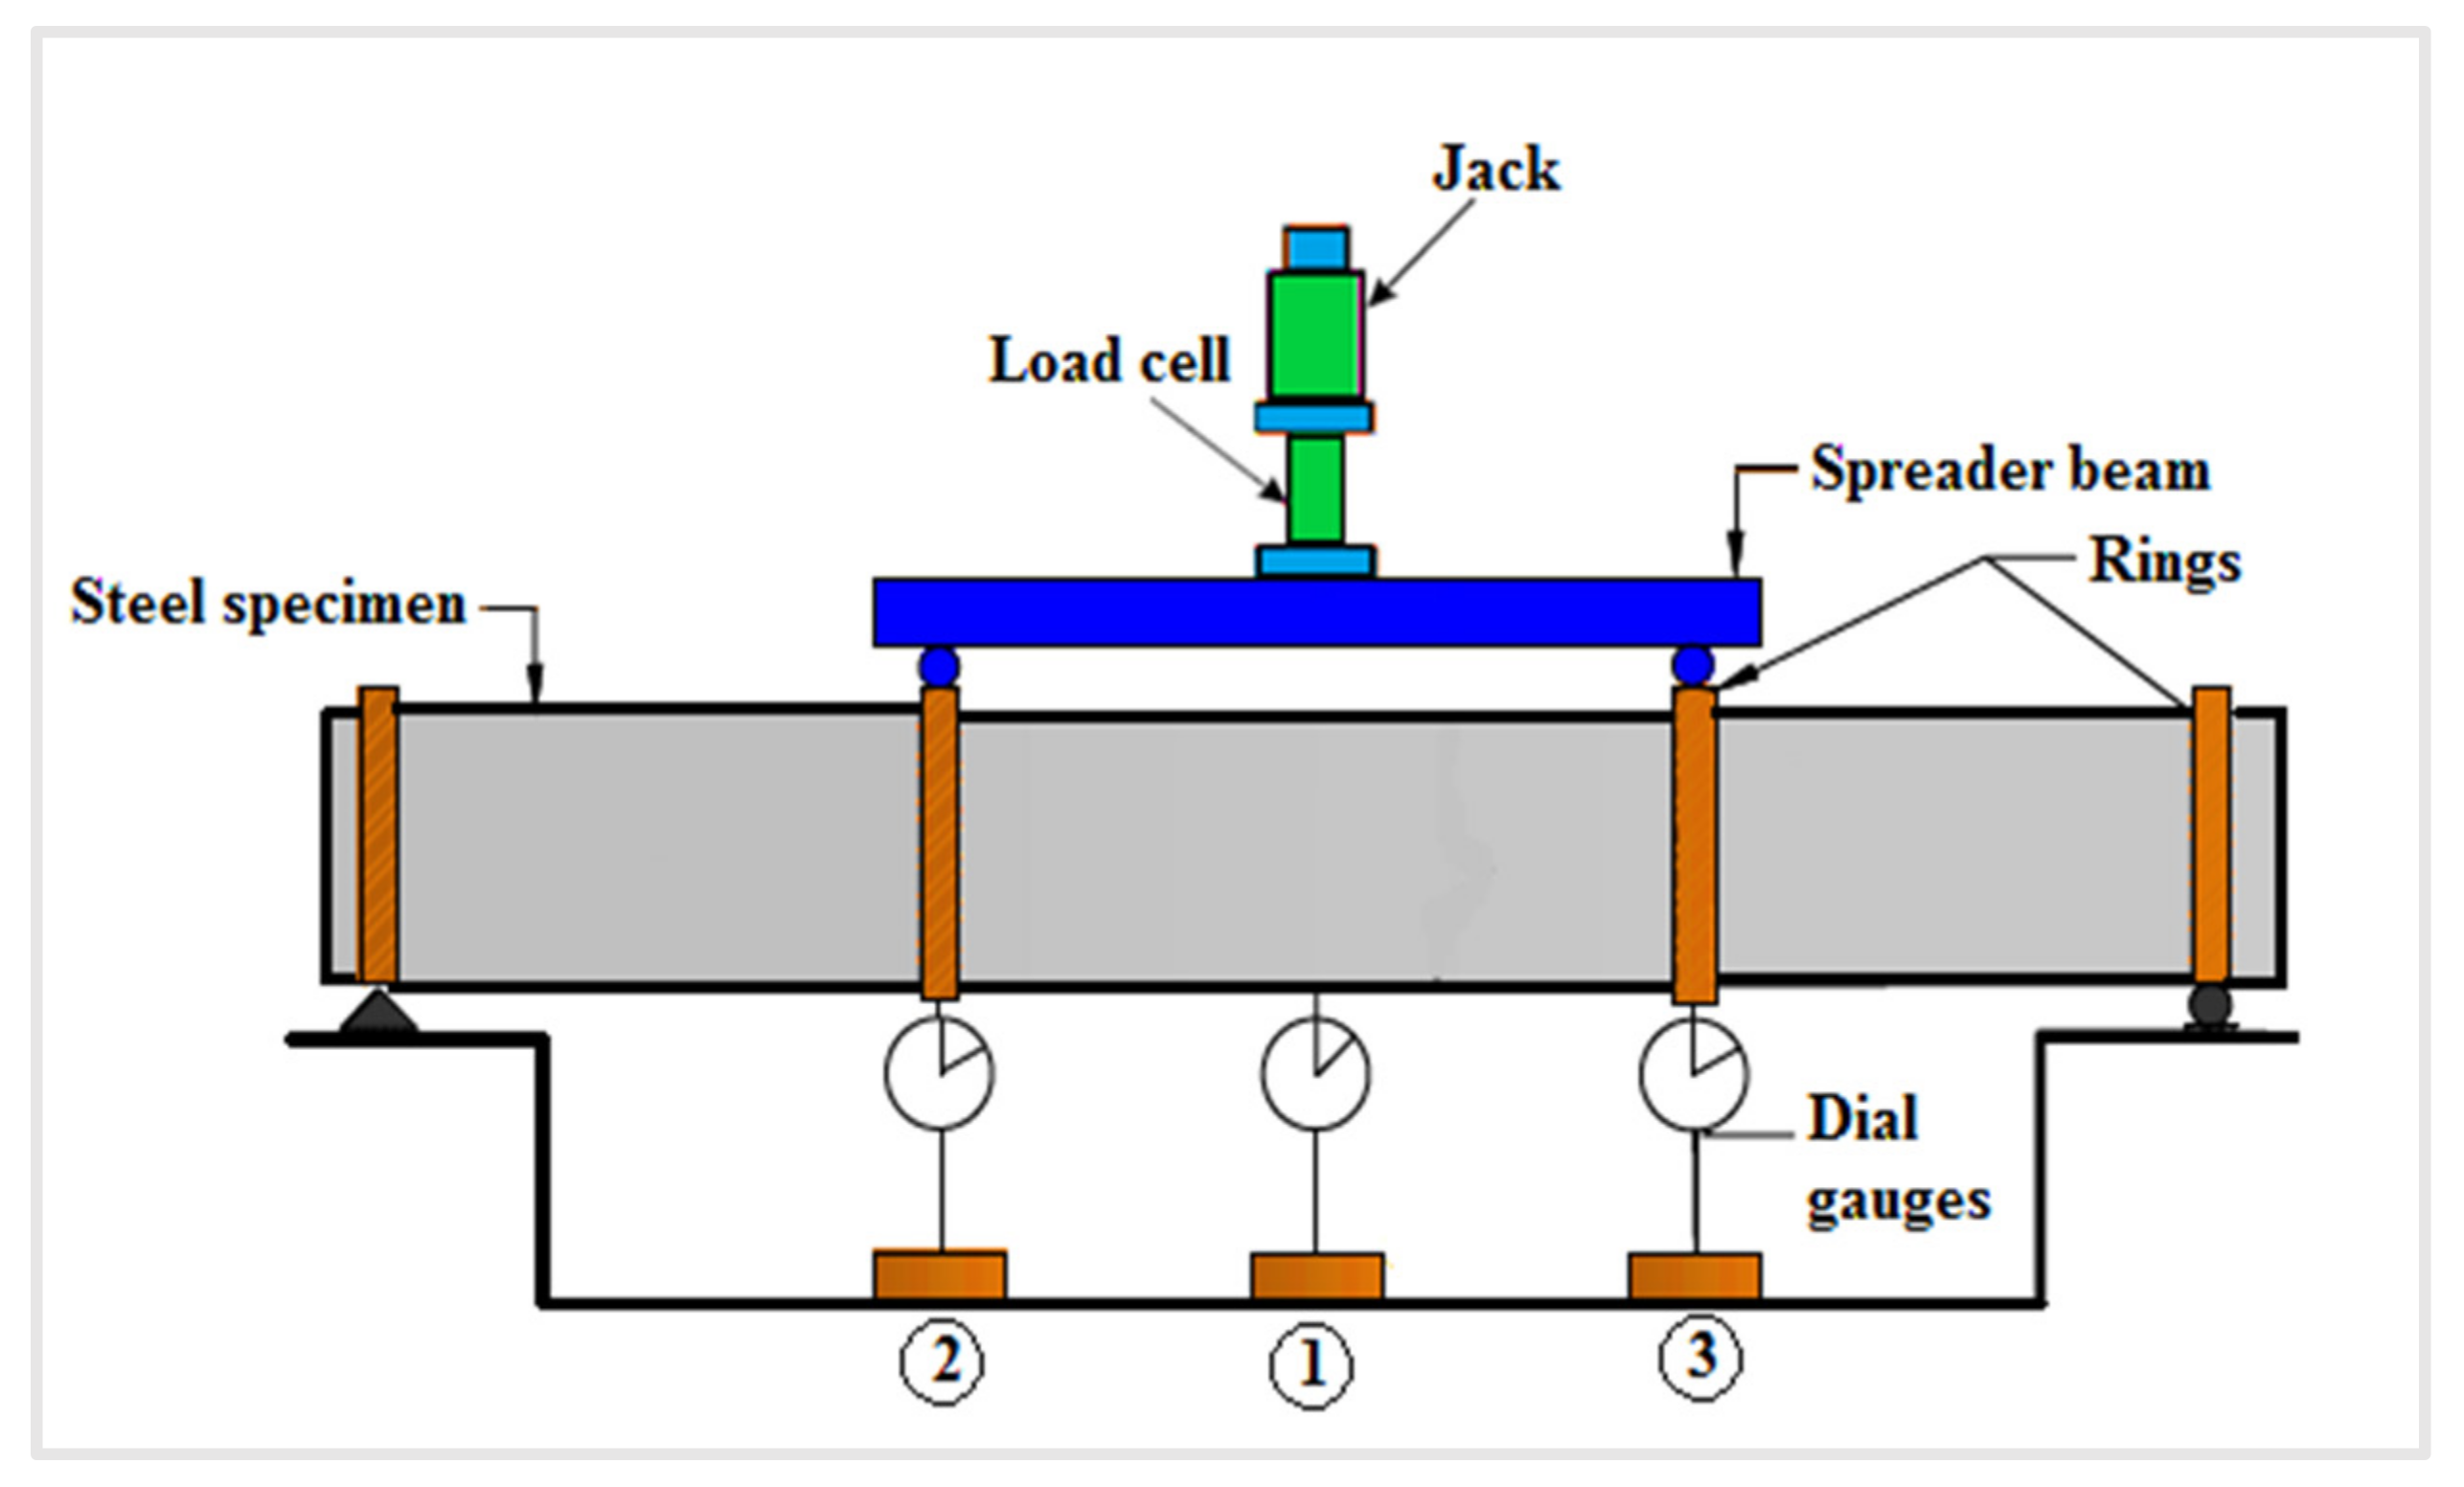
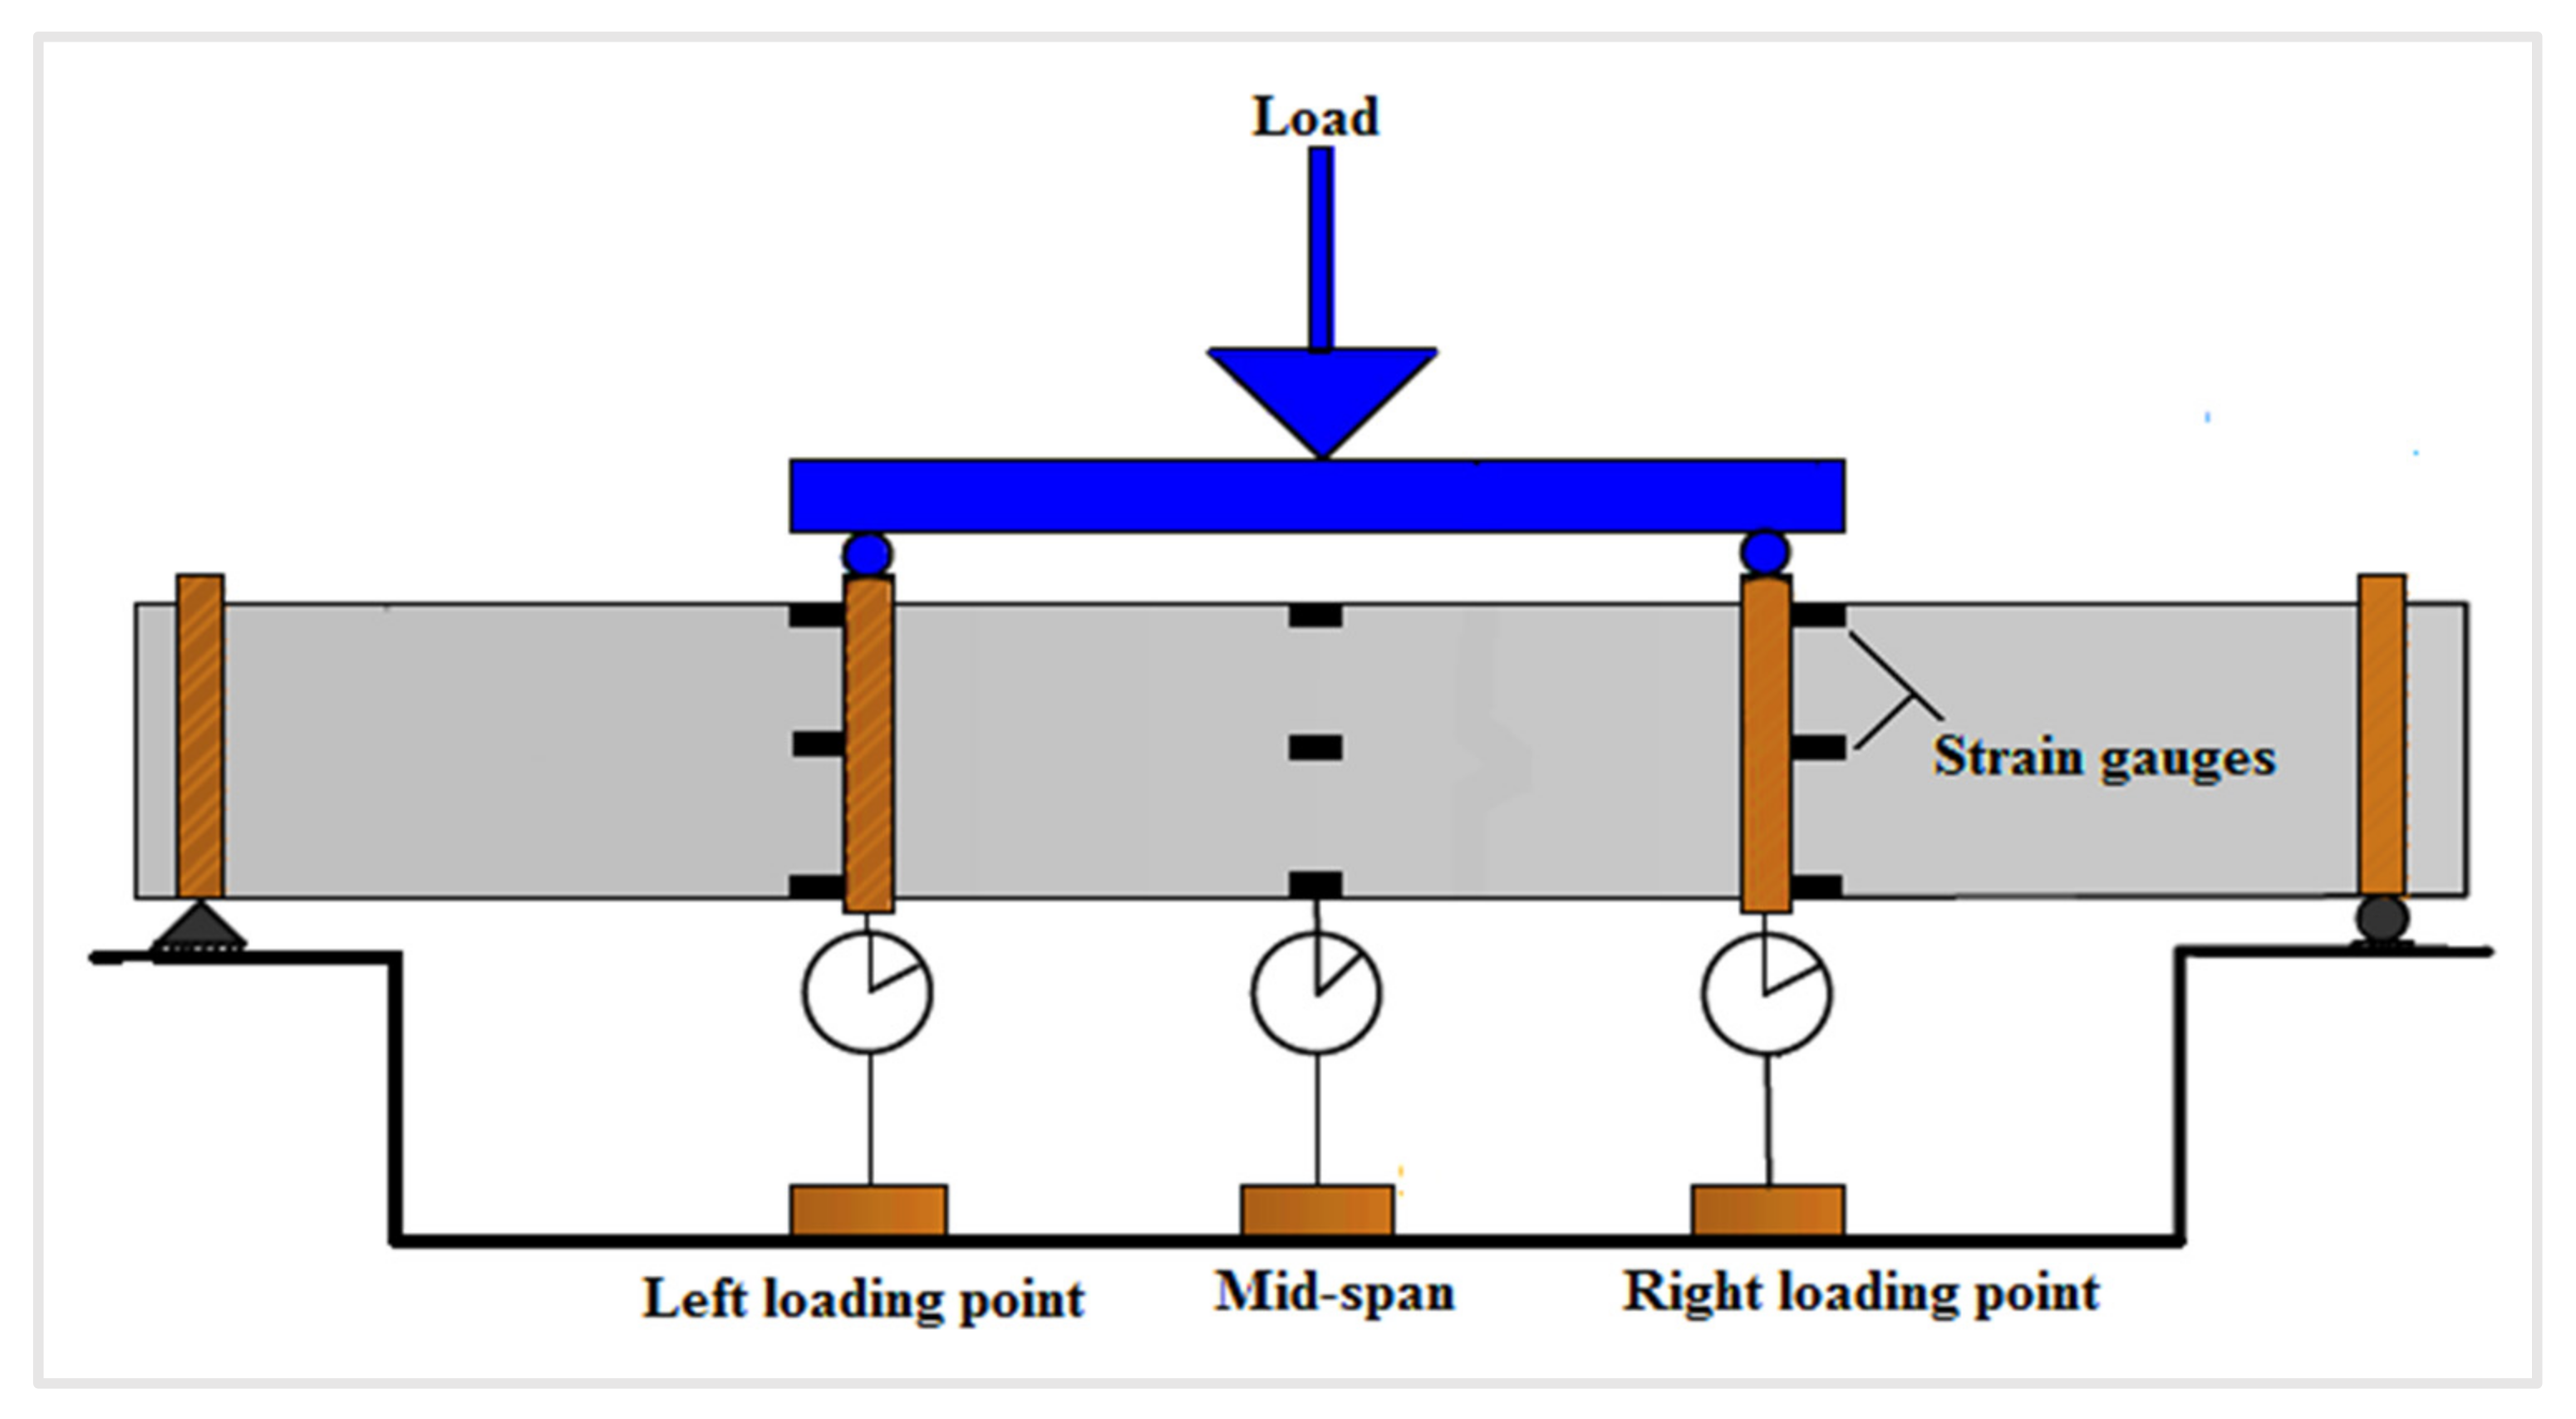
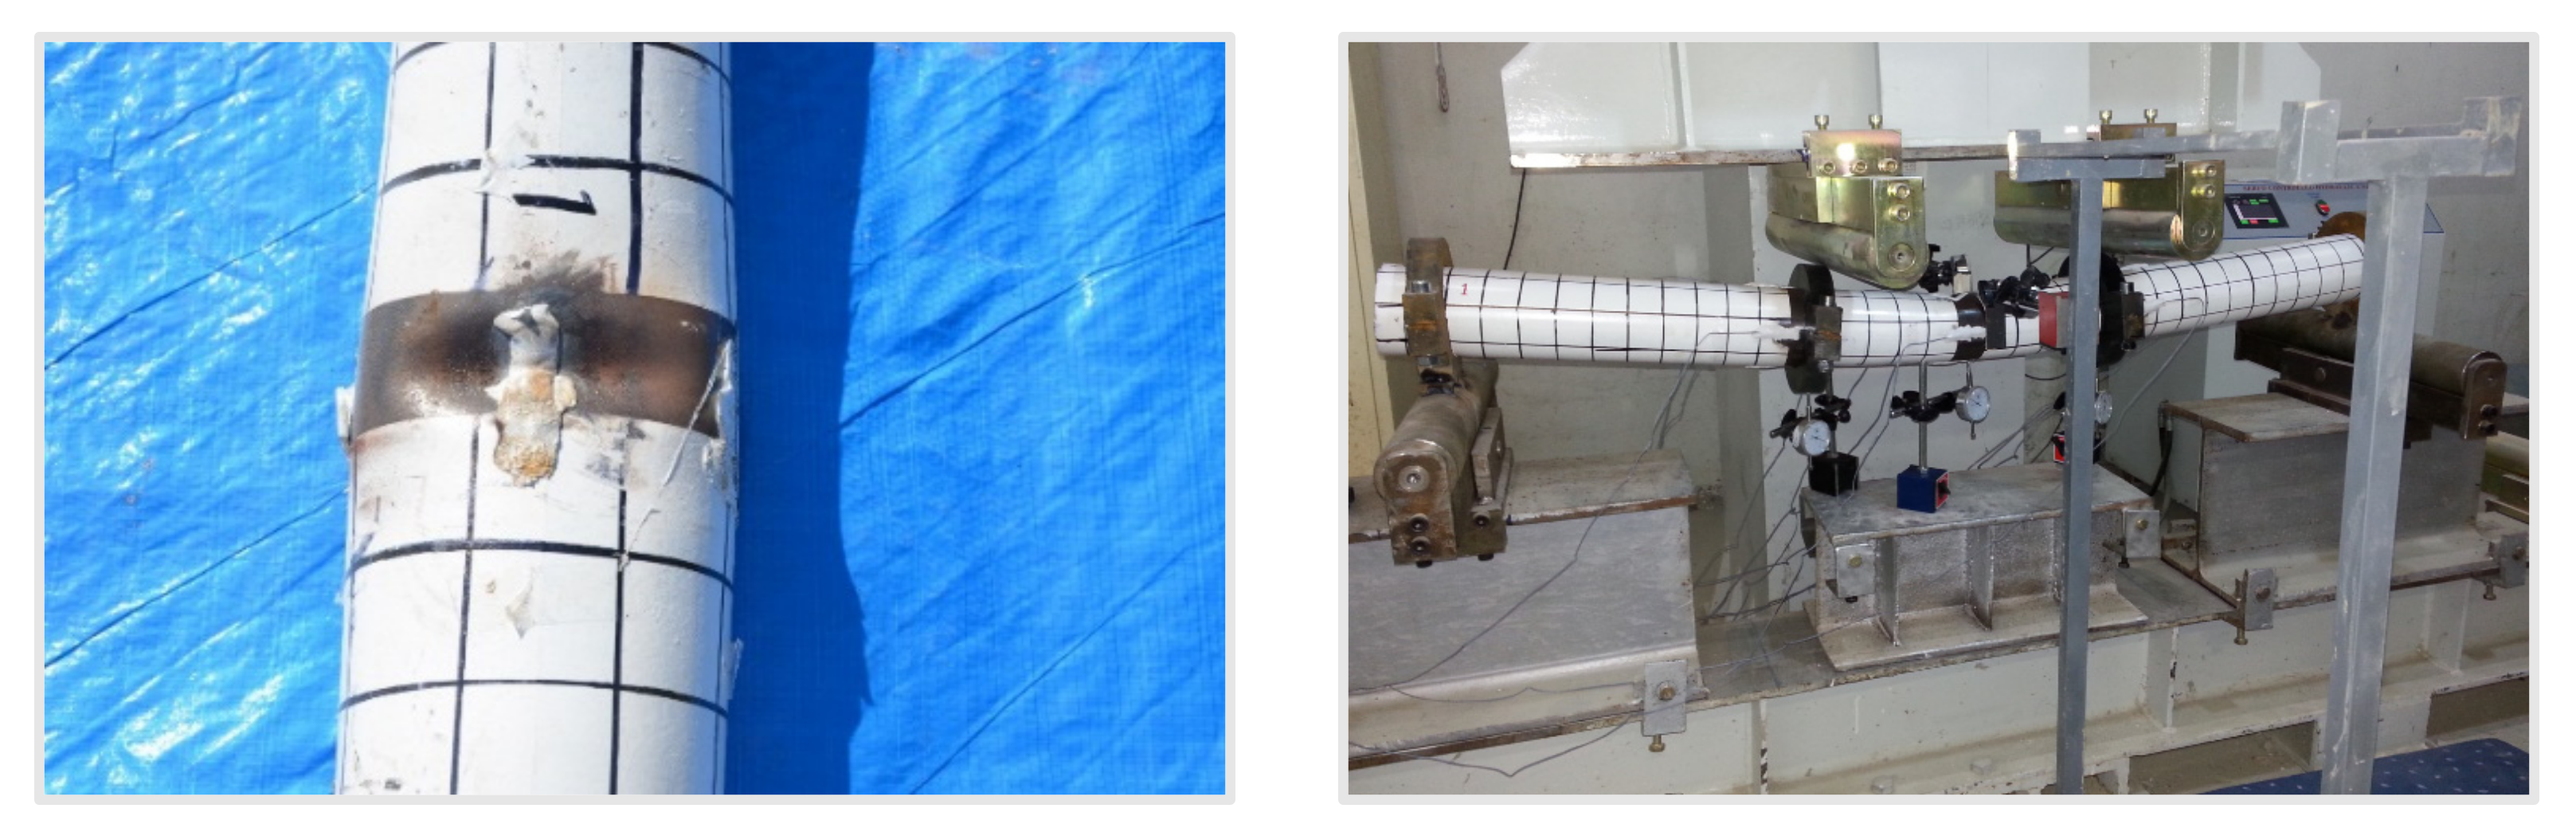
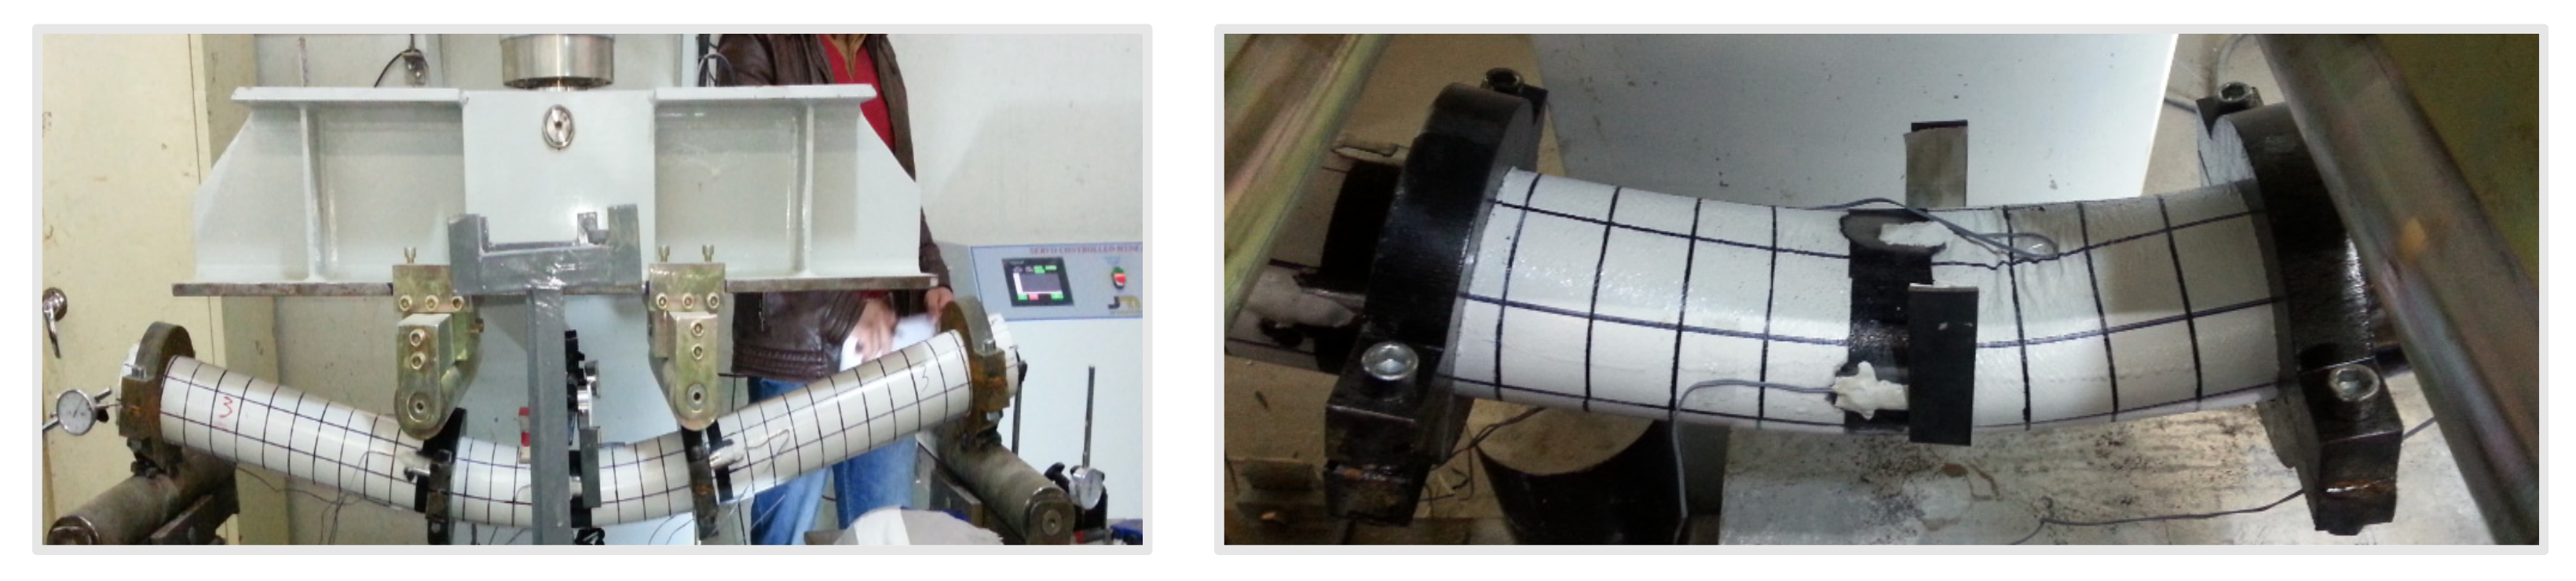
2.3. Test Procedure and Equipment Used
- To ensure that the applied load is distributed axially to avoid stress concentration at a single place;
- To support the vertical load;
- Due to the high rigidity and stiffness of these rings, radial displacement at loading locations is limited;
- The compression section of the specimen will be stiffened and supported adequately, preventing local buckling at the stress locations;
- To prevent the specimens’ sudden failure when they reach the peak load.
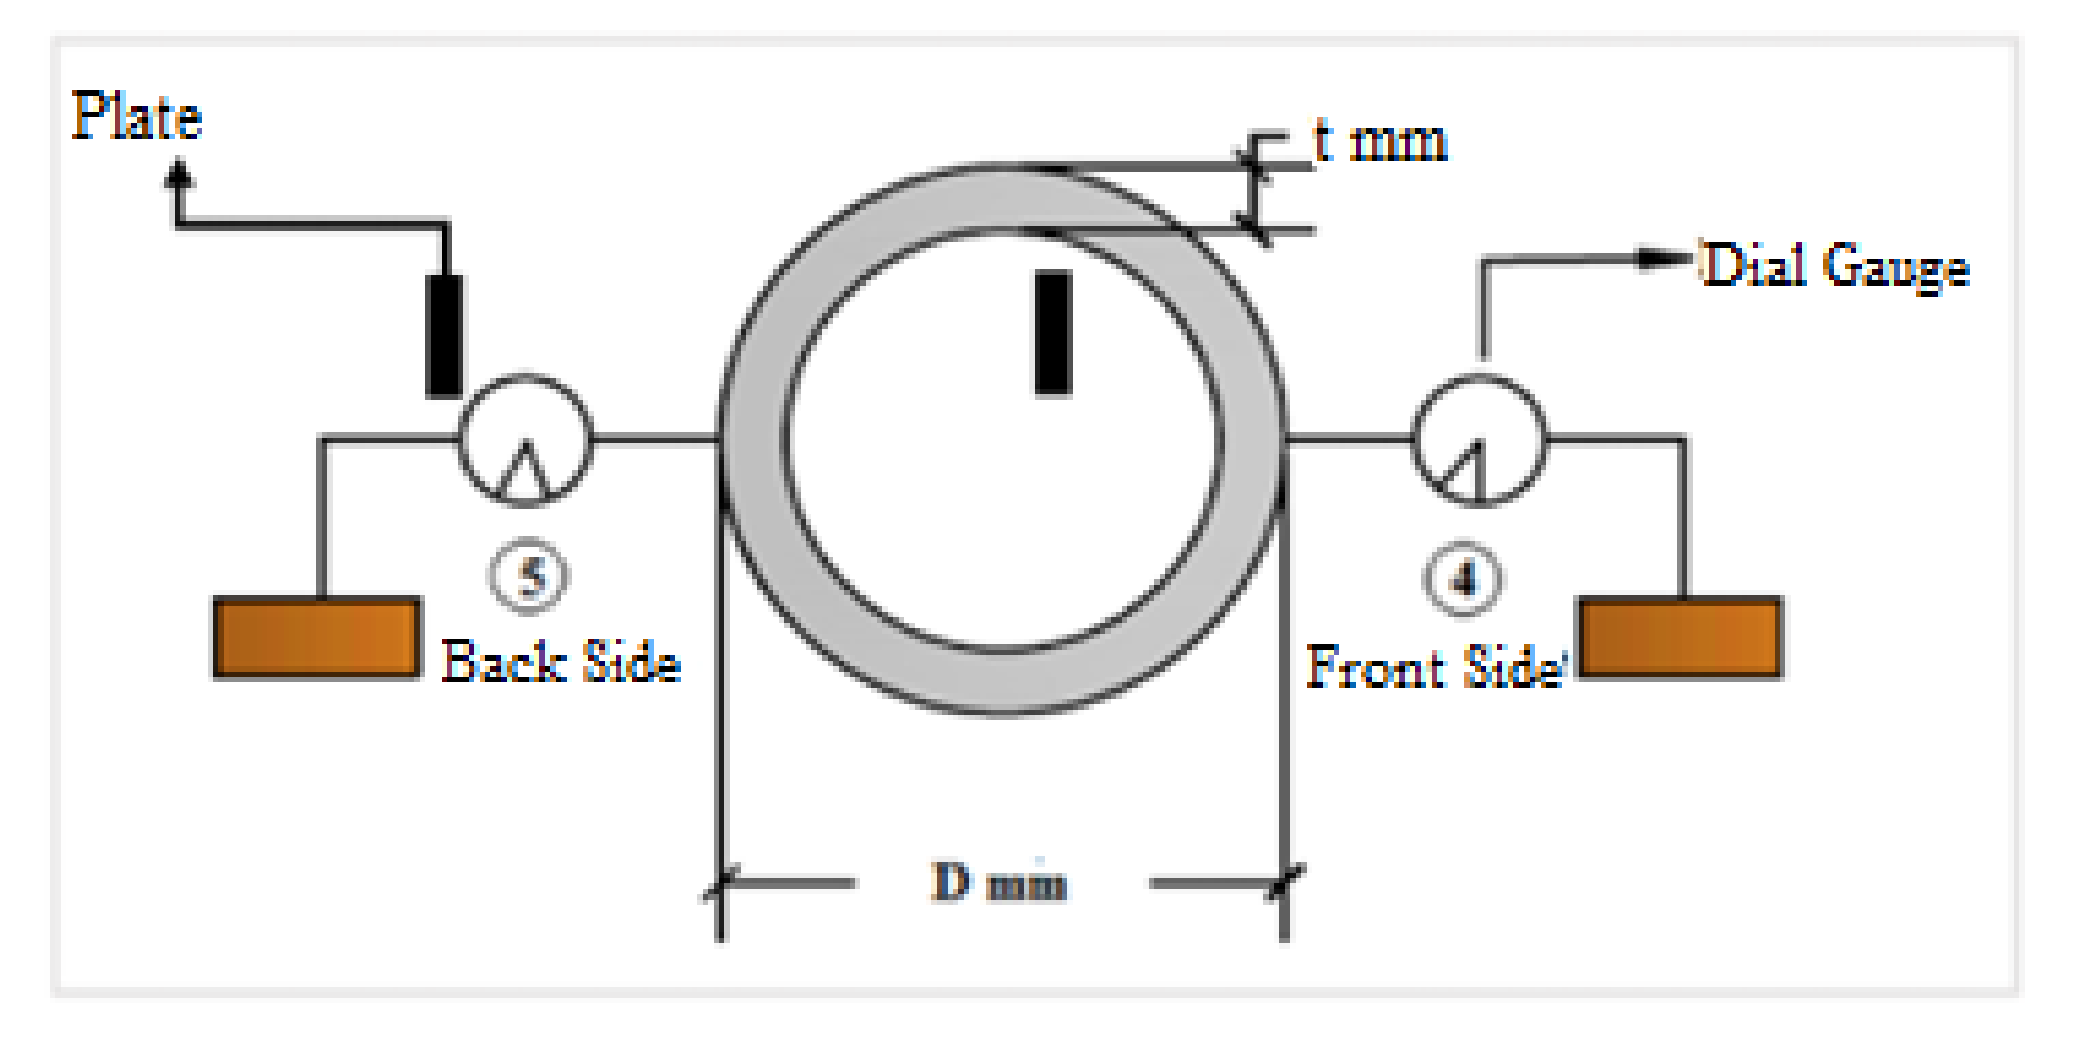
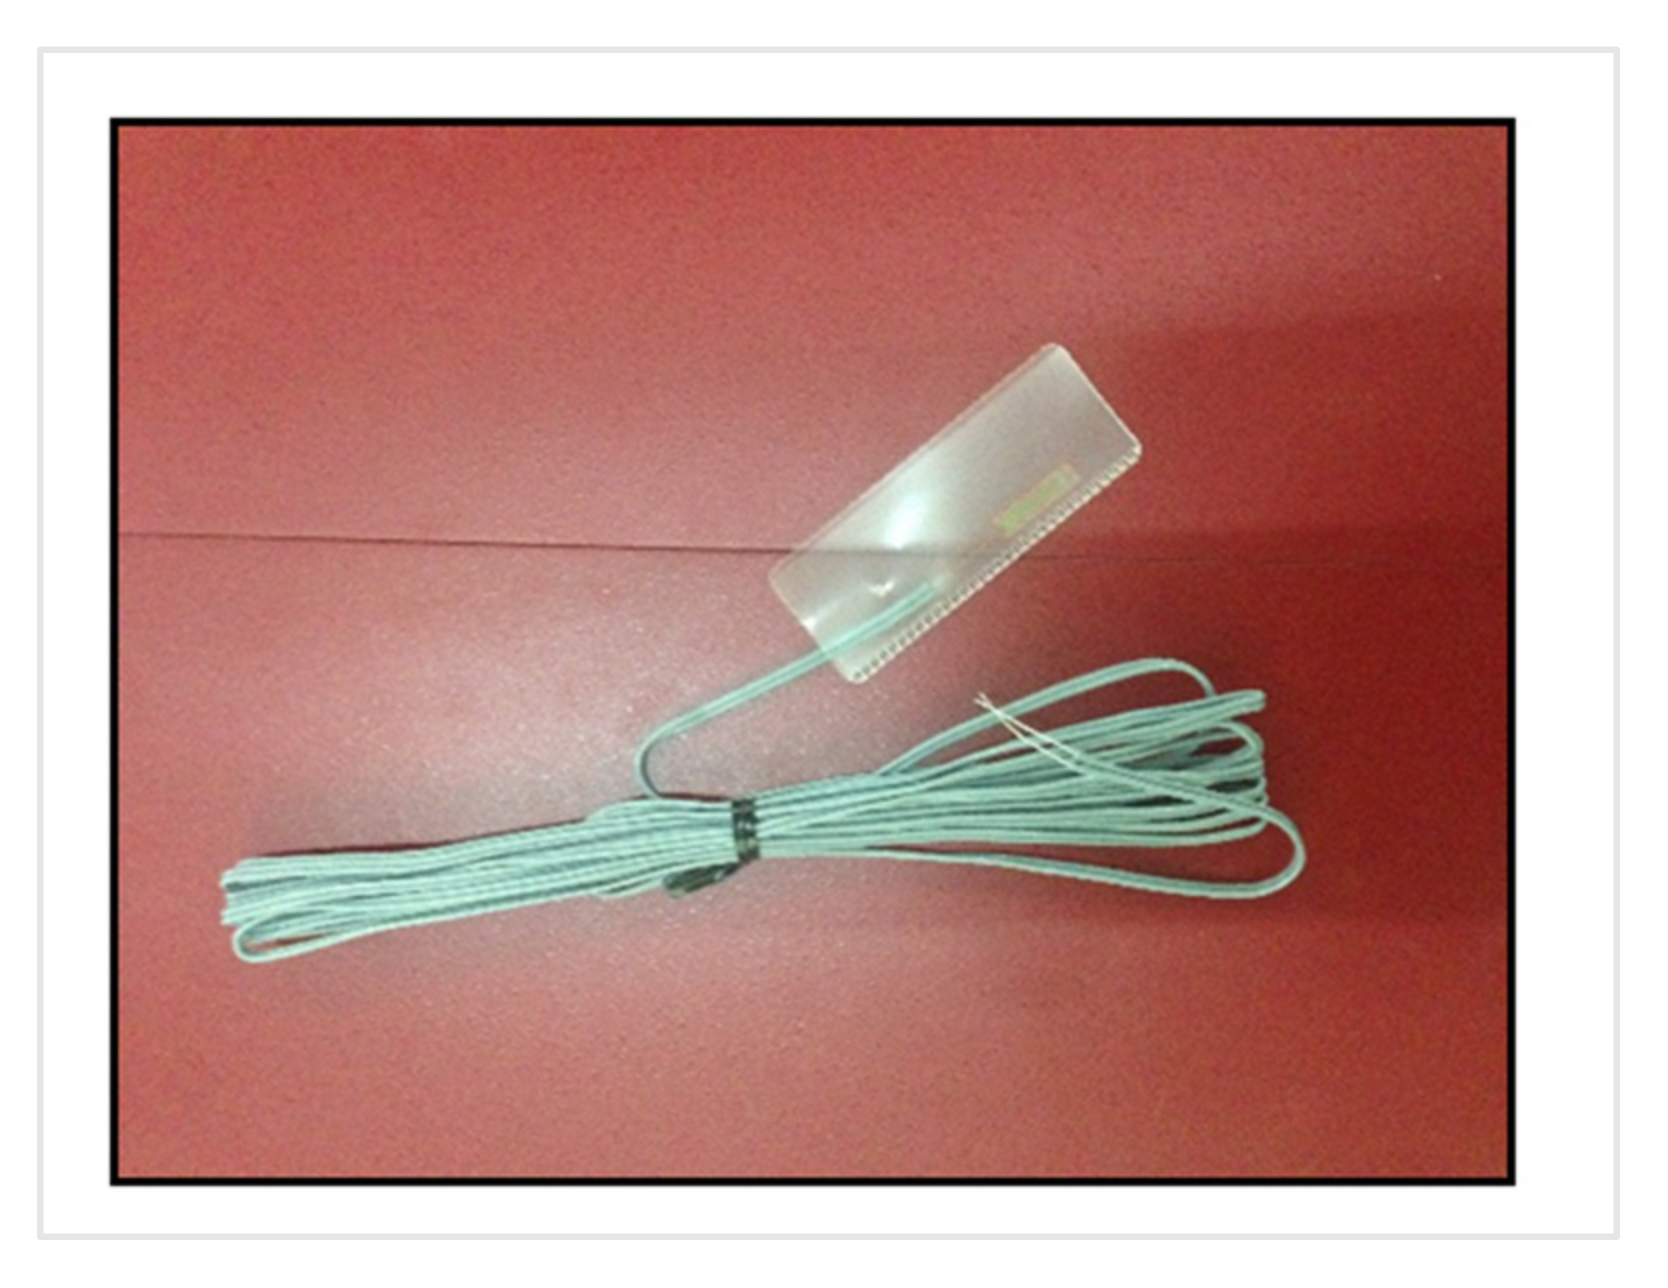
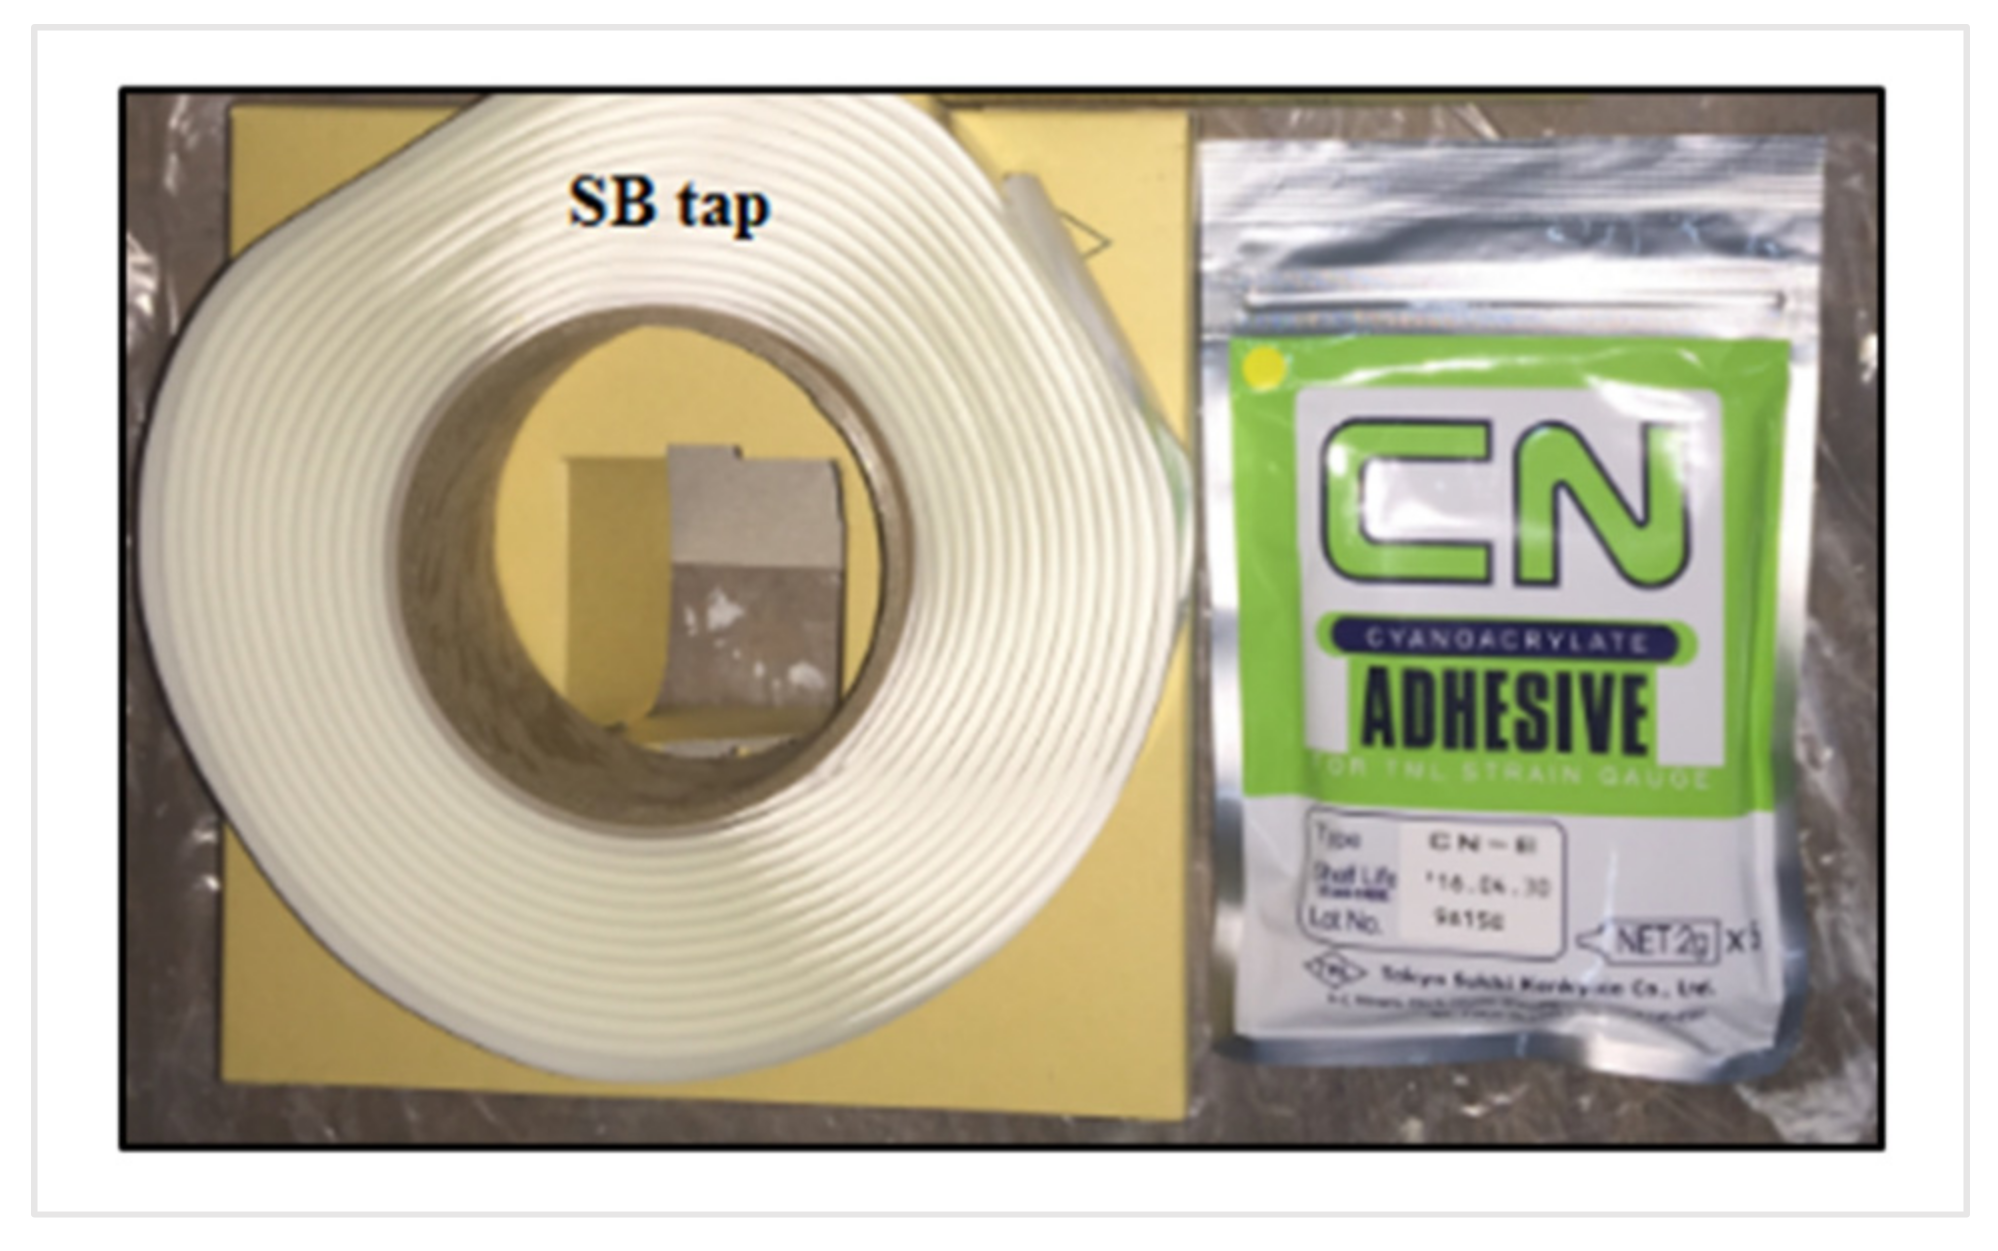
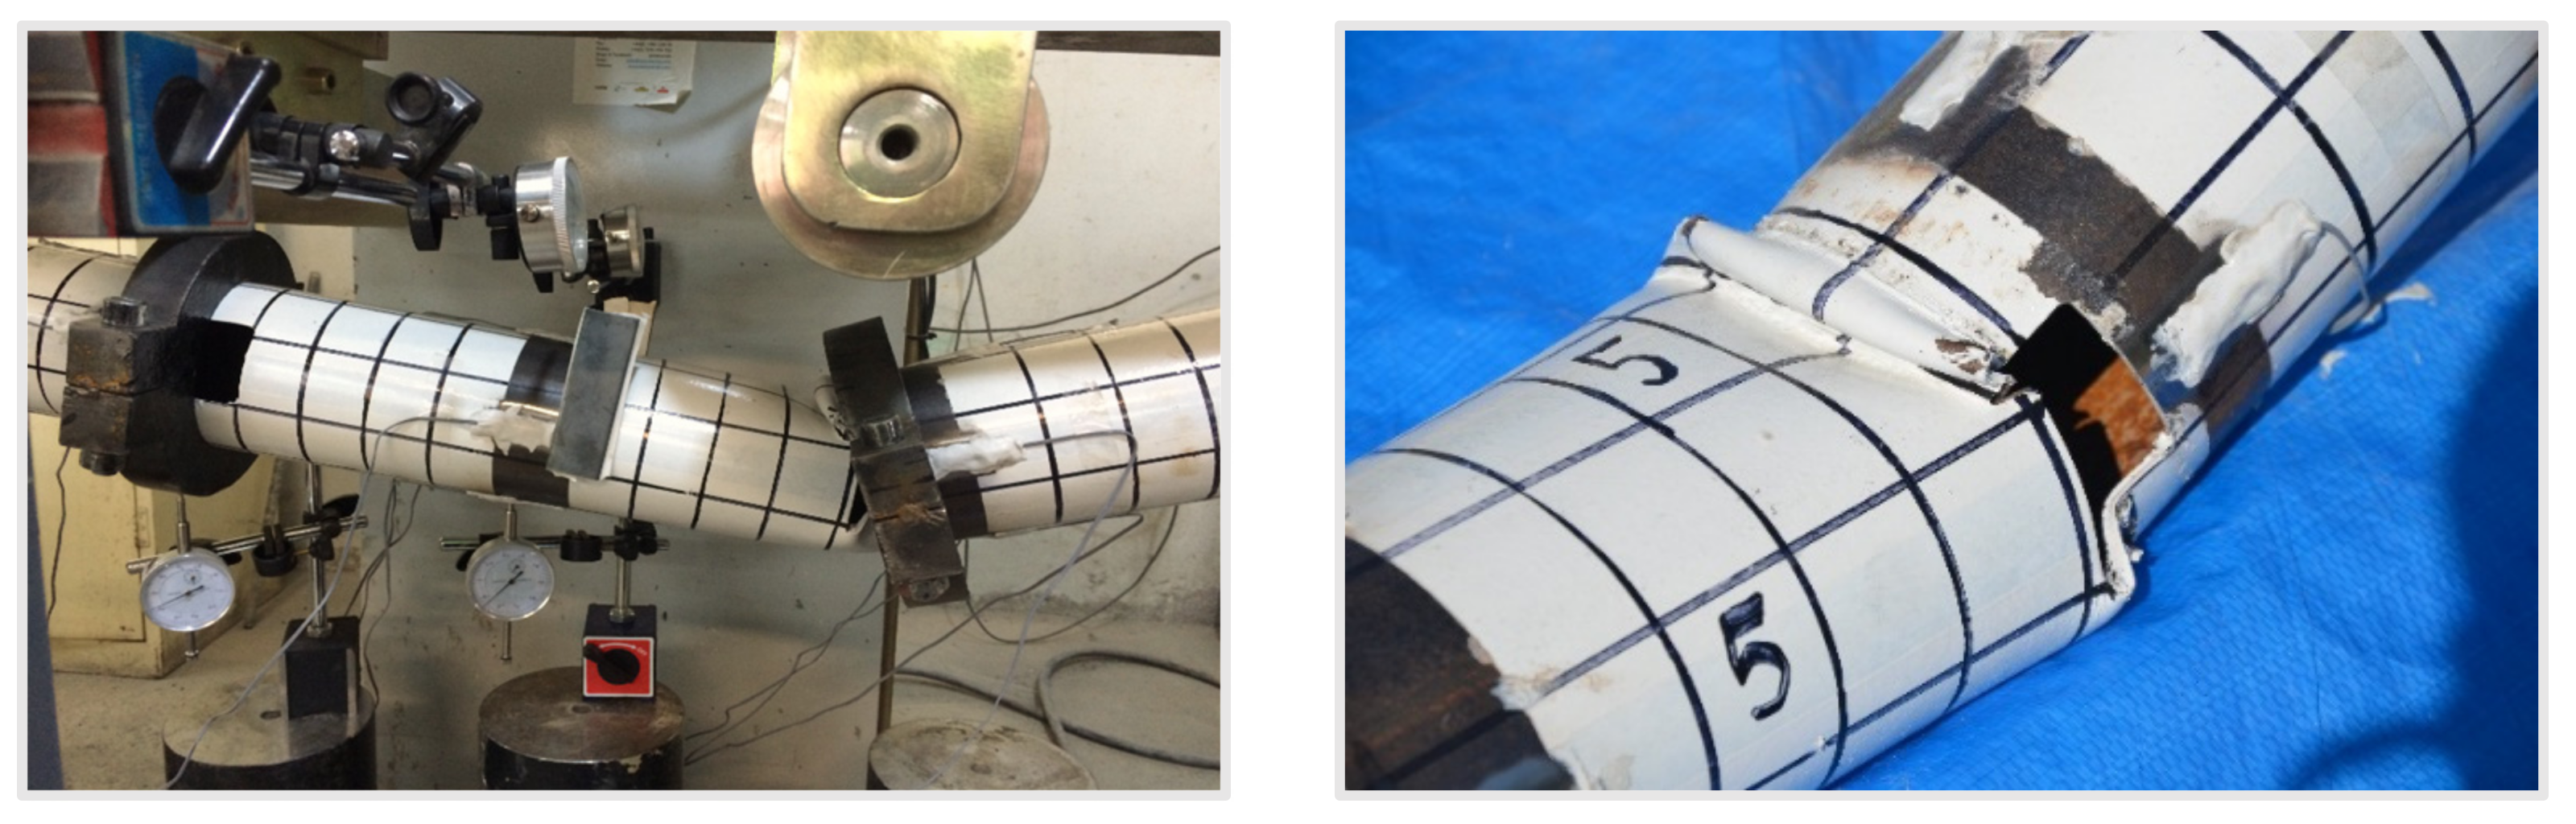
2.4. The Measurement Instruments
- Dial gauges
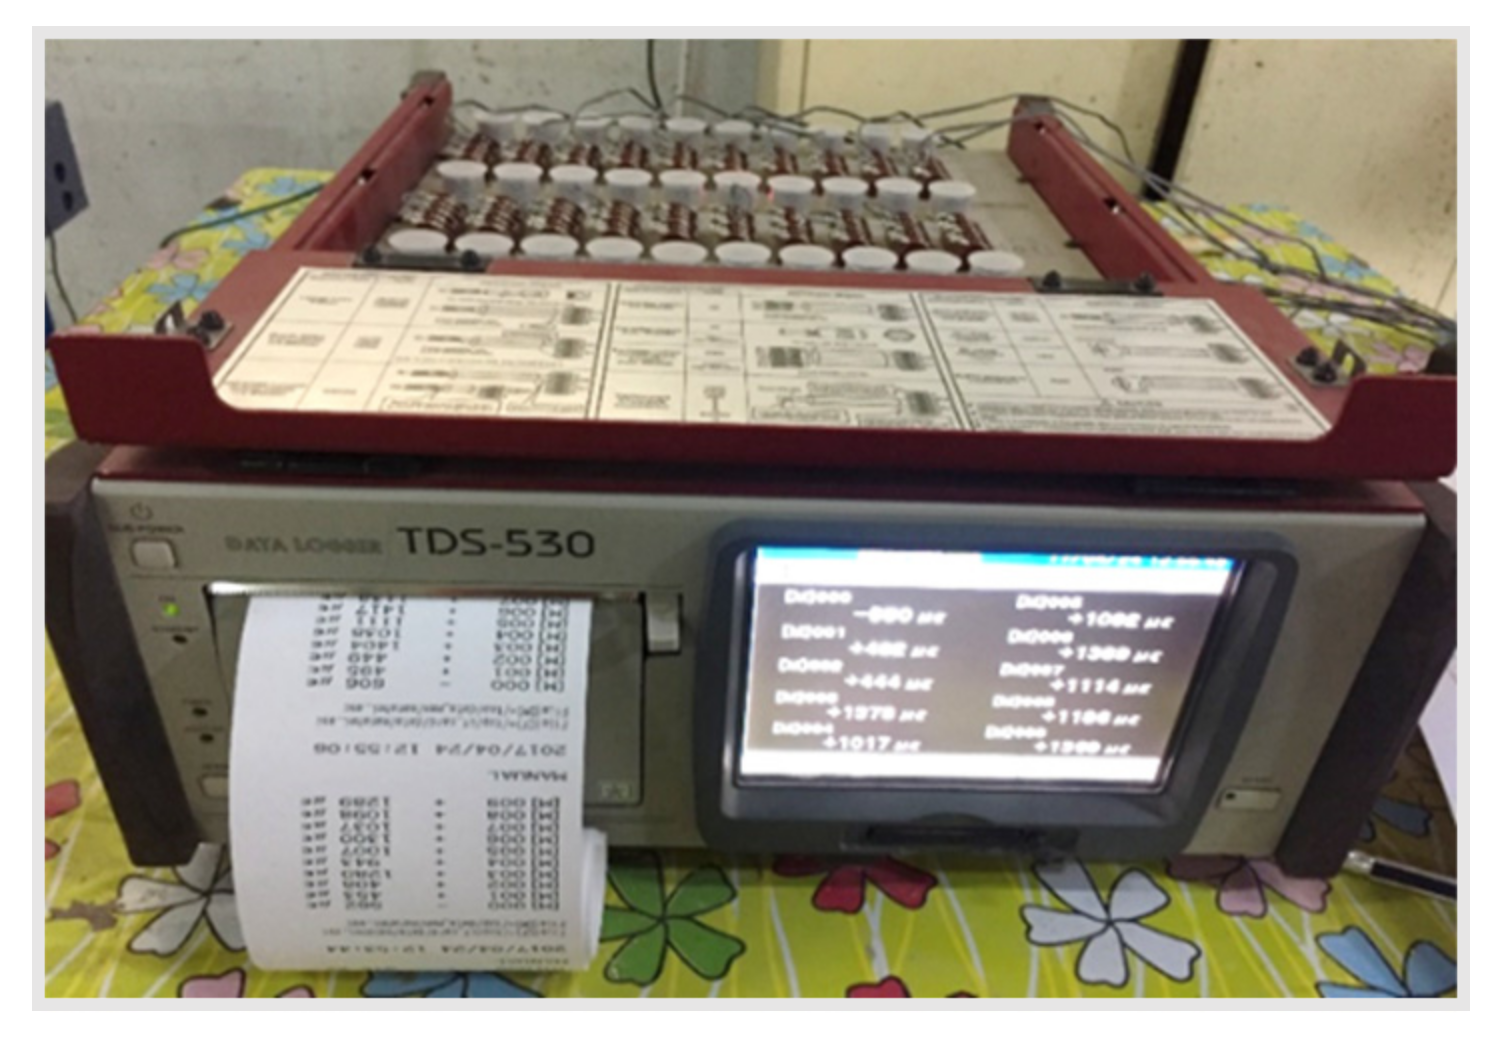
- Data logger
- Strain gauges
3. Results and Discussion
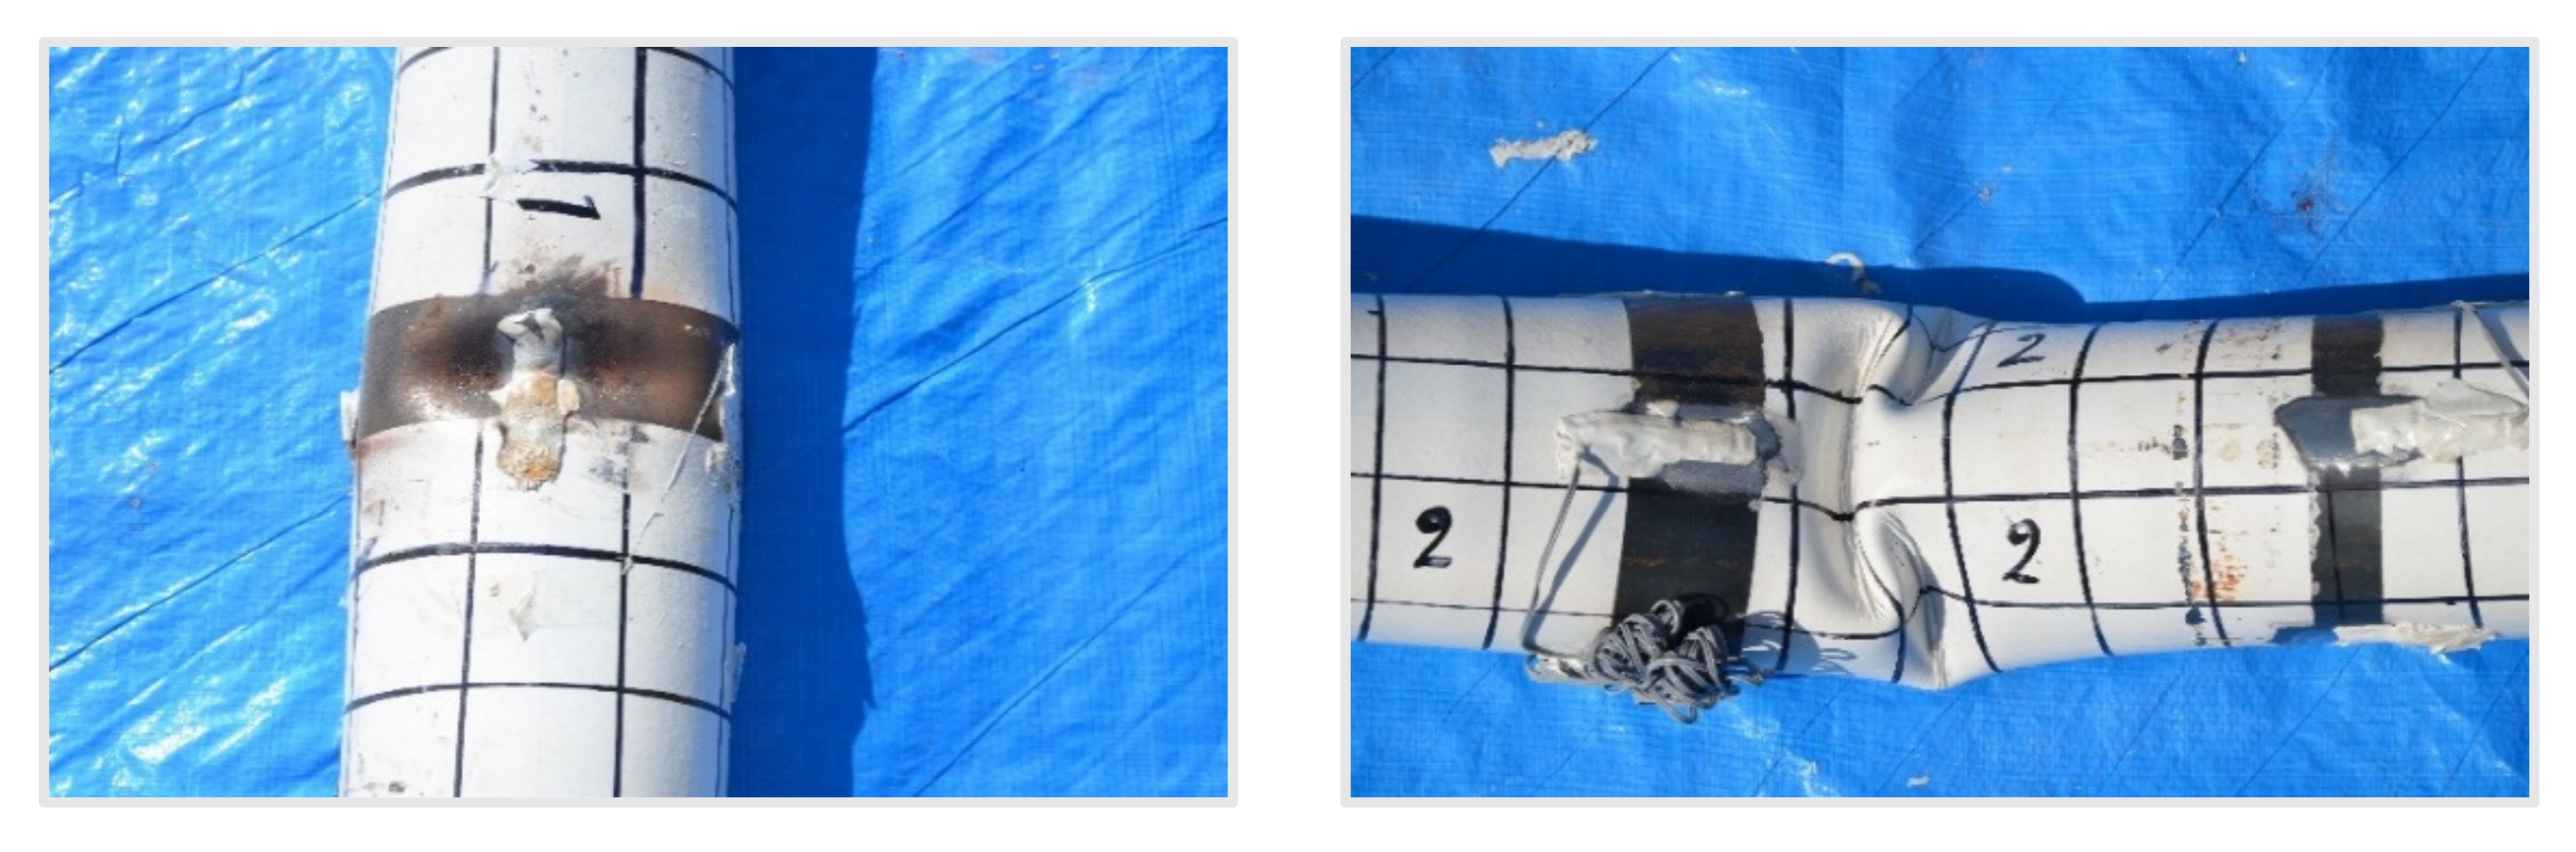
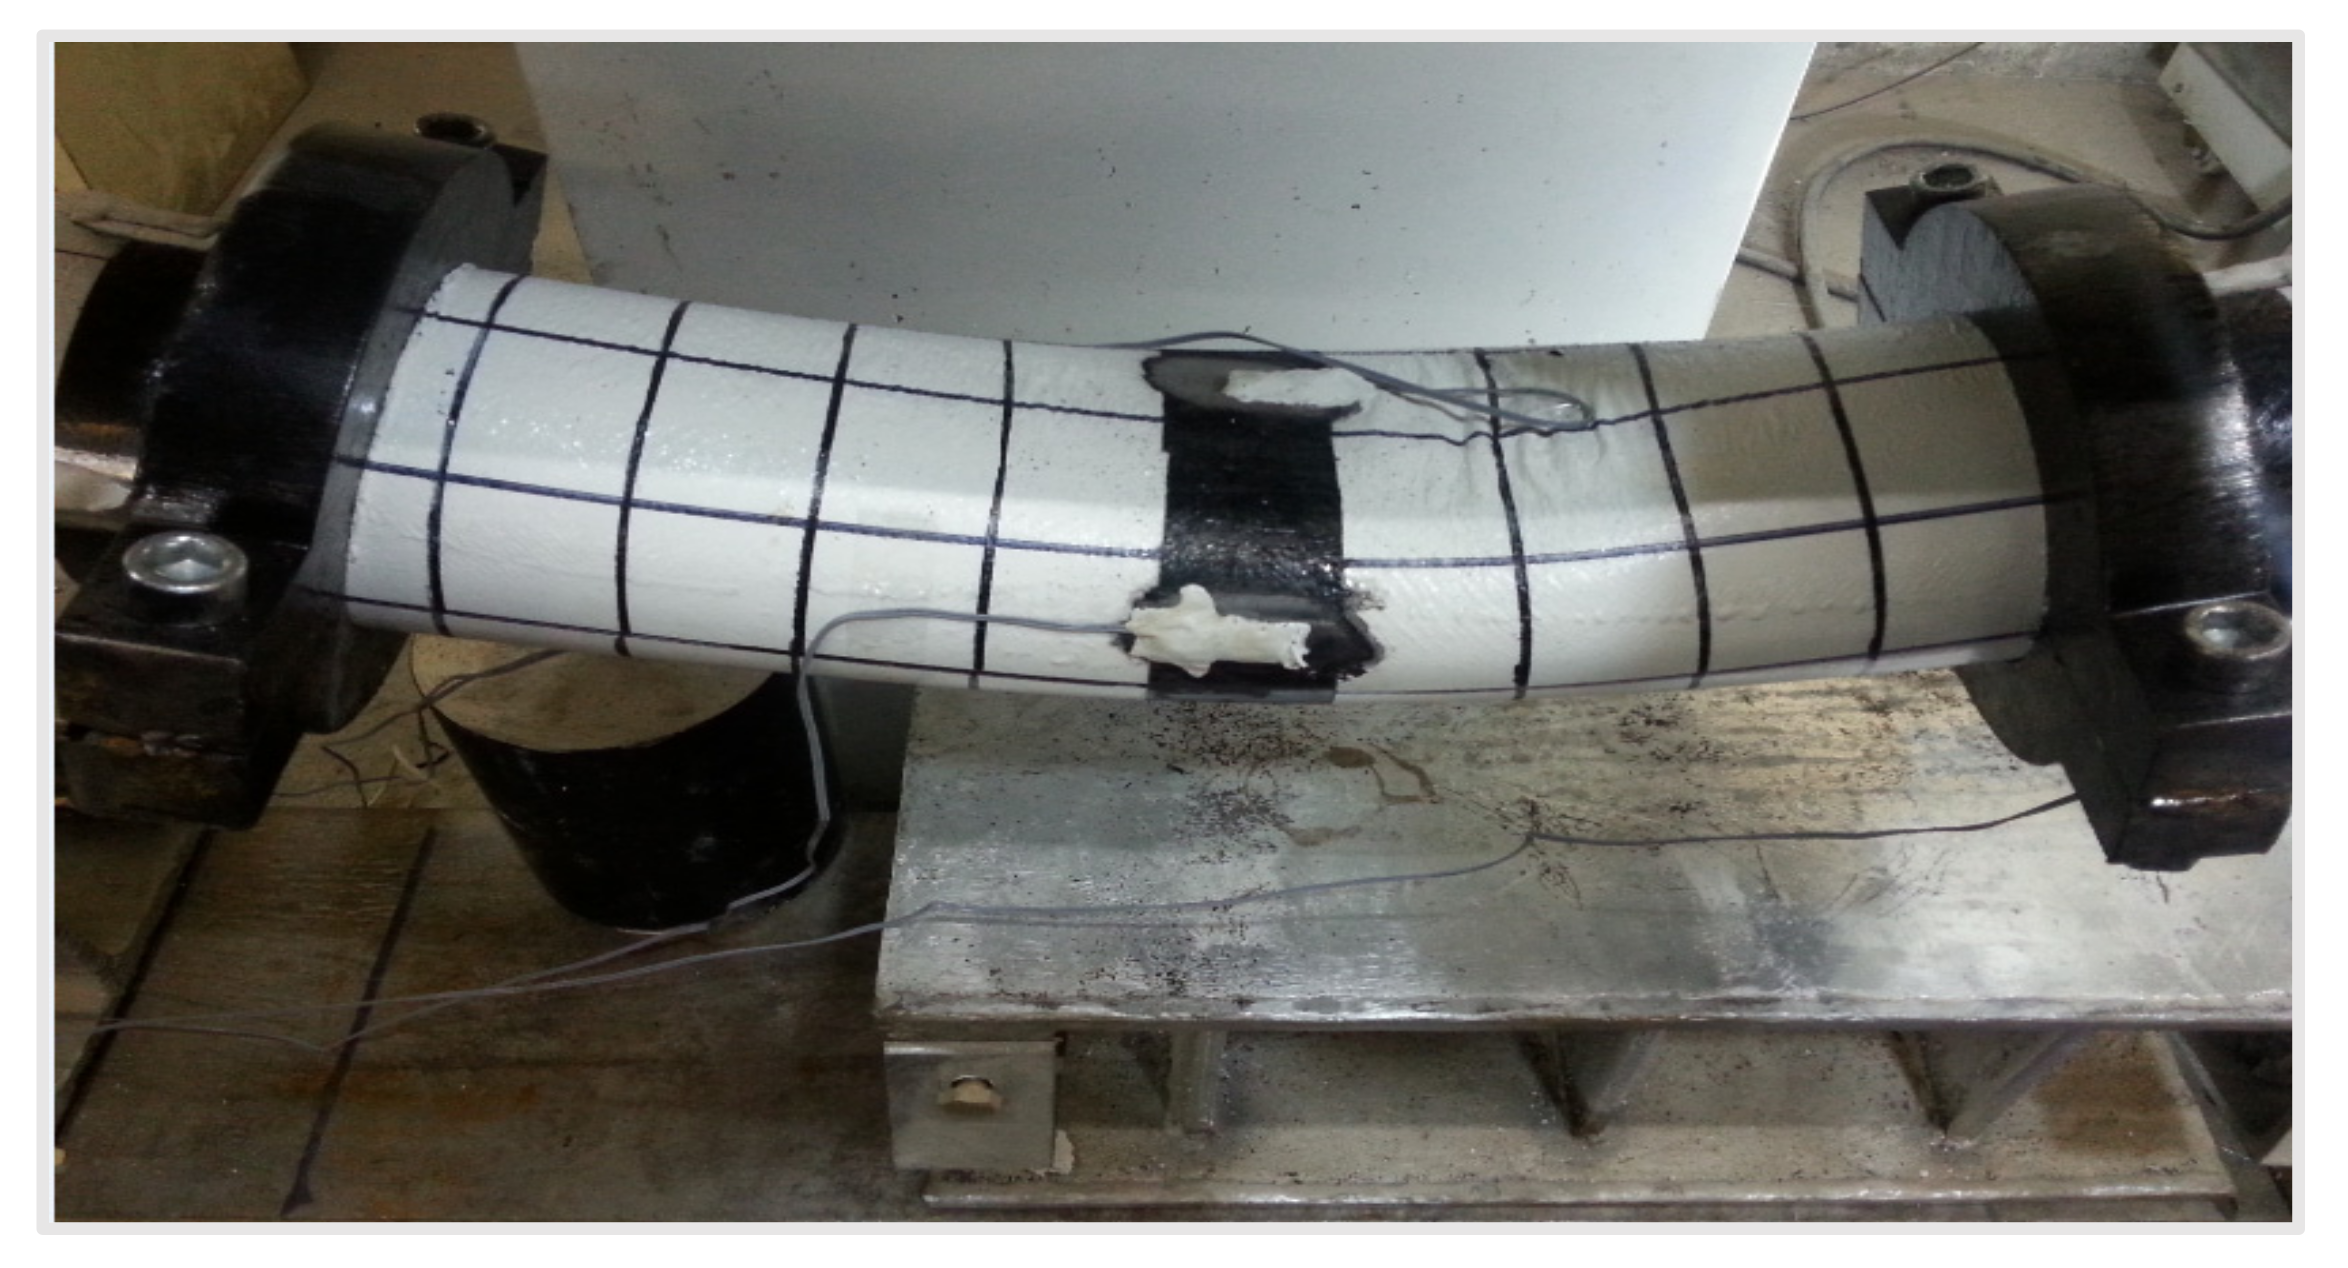
3.1. General Behavior of the Investigated Specimens under Loading
- -
- The elastic stage;
- -
- The ovalization stage;
- -
- The collapse stage.
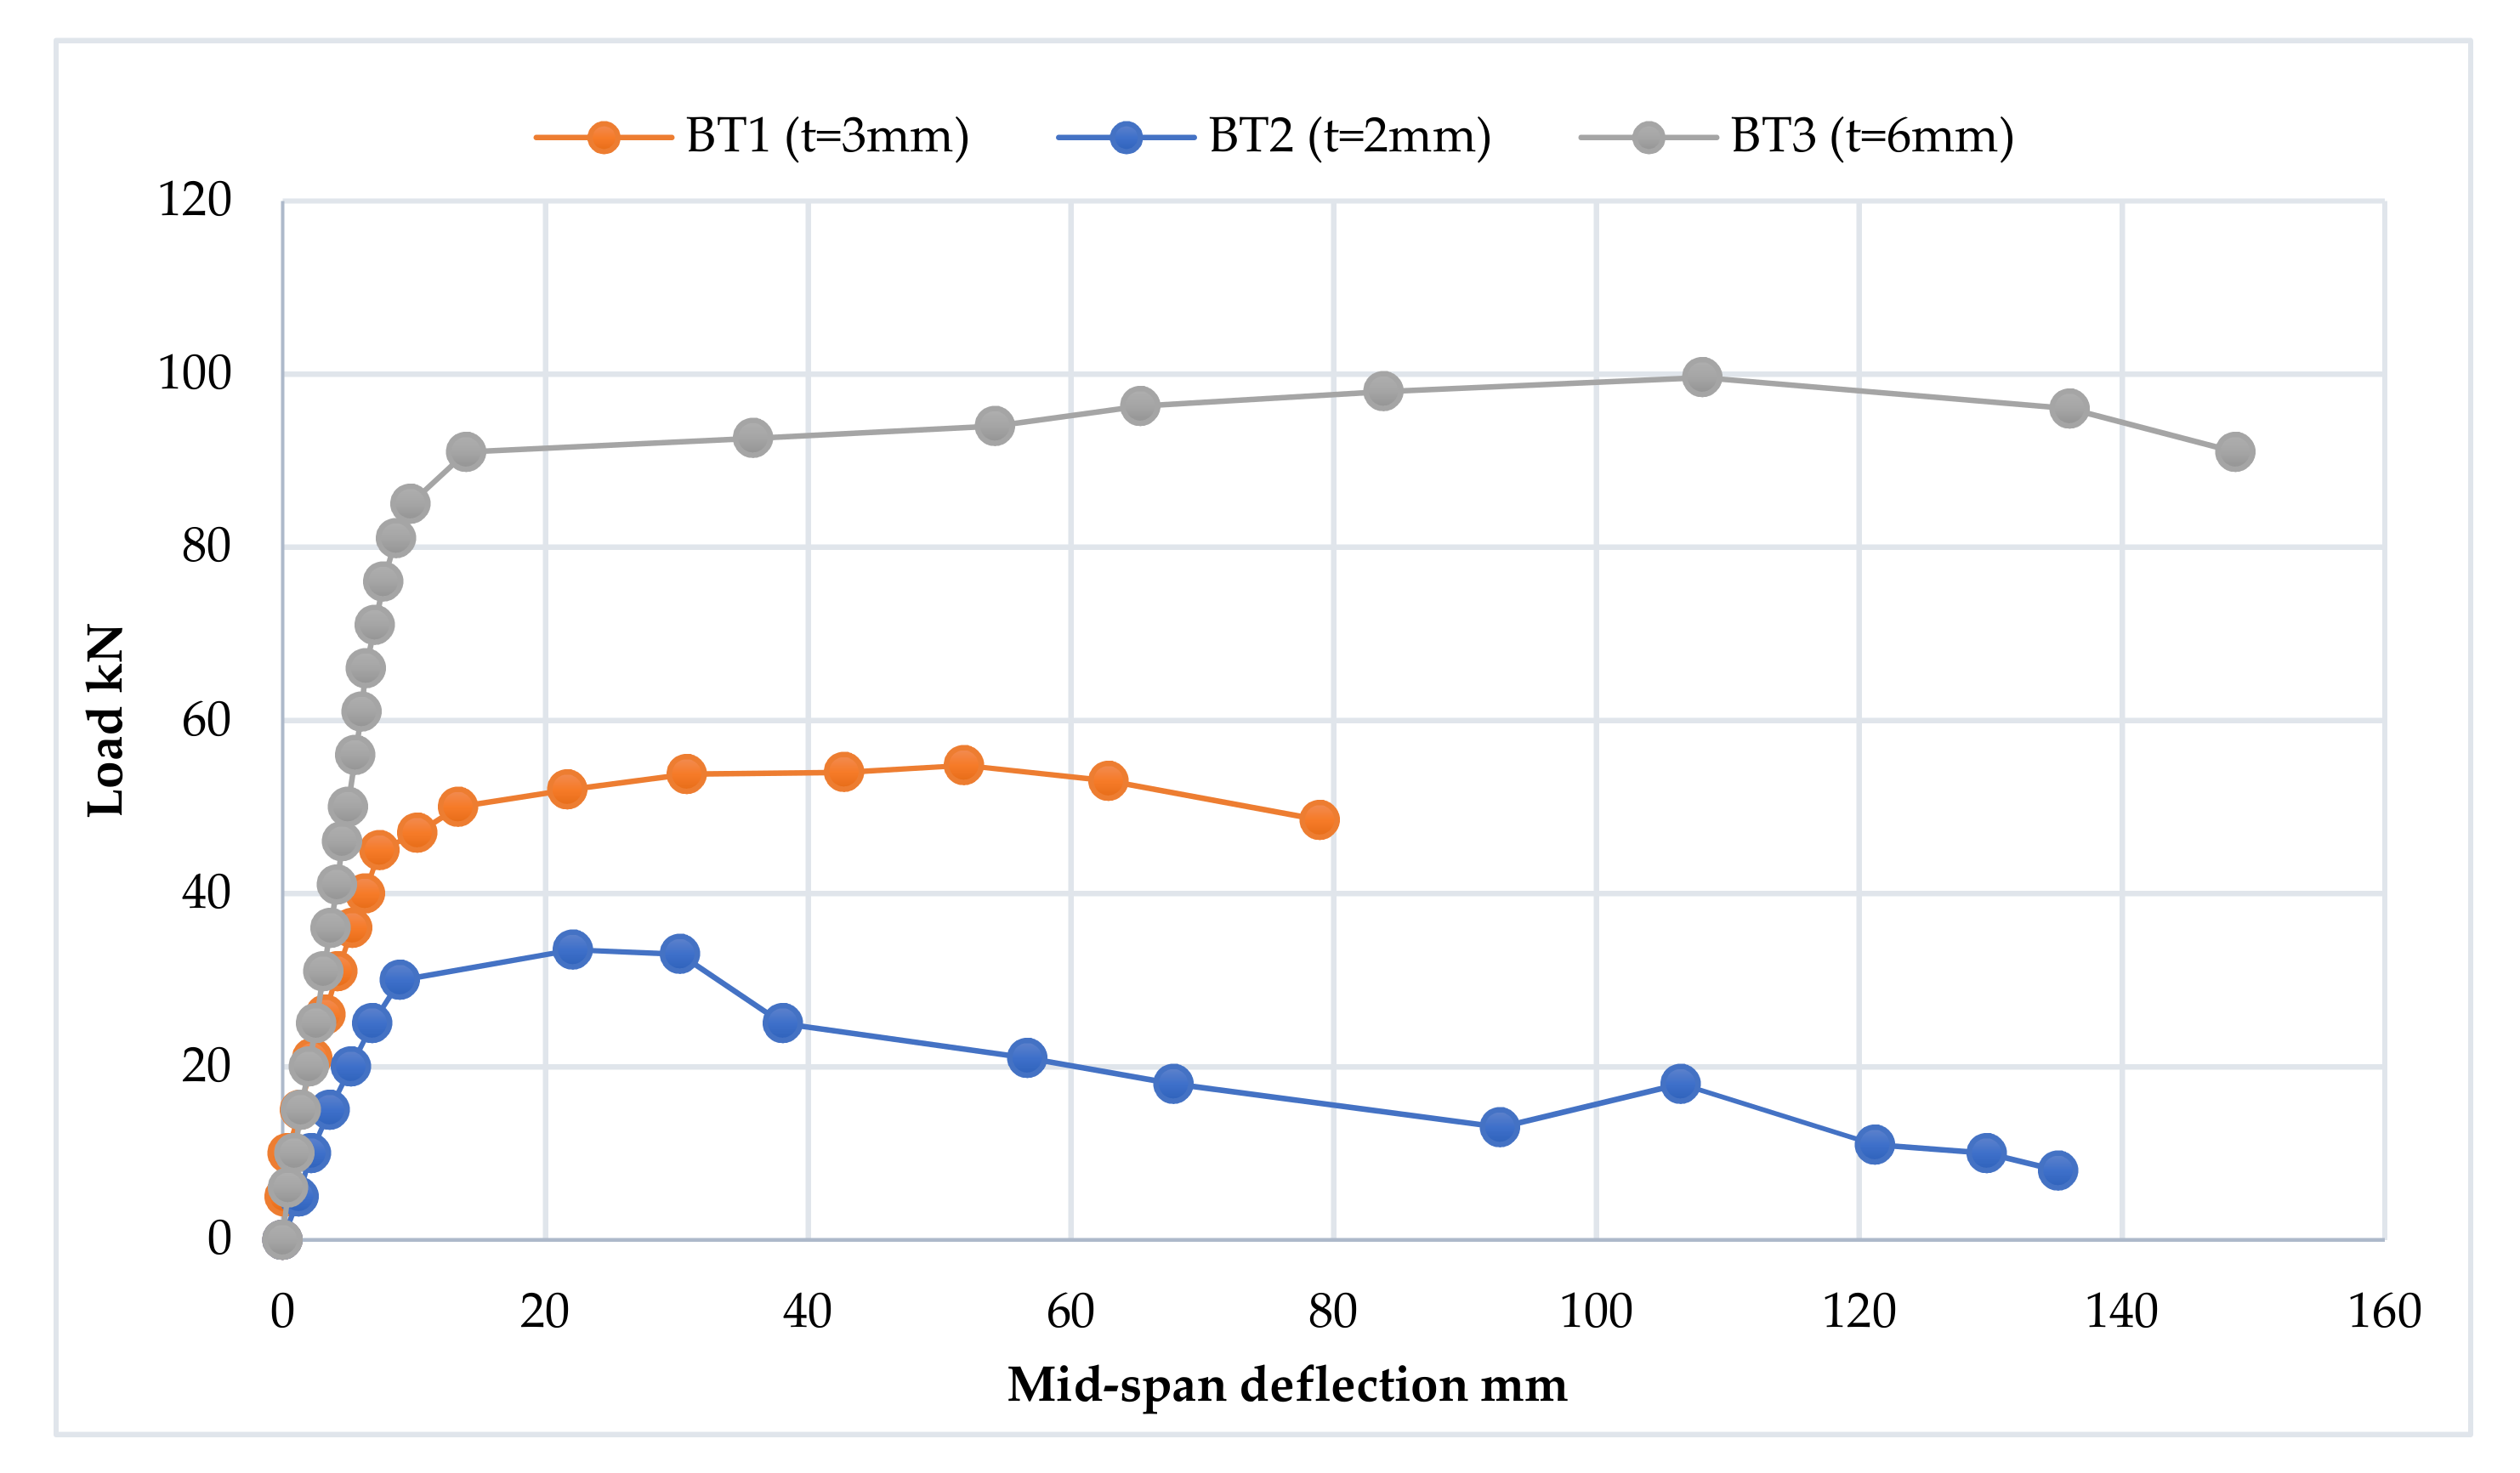
3.2. Results of the First Investigated Group
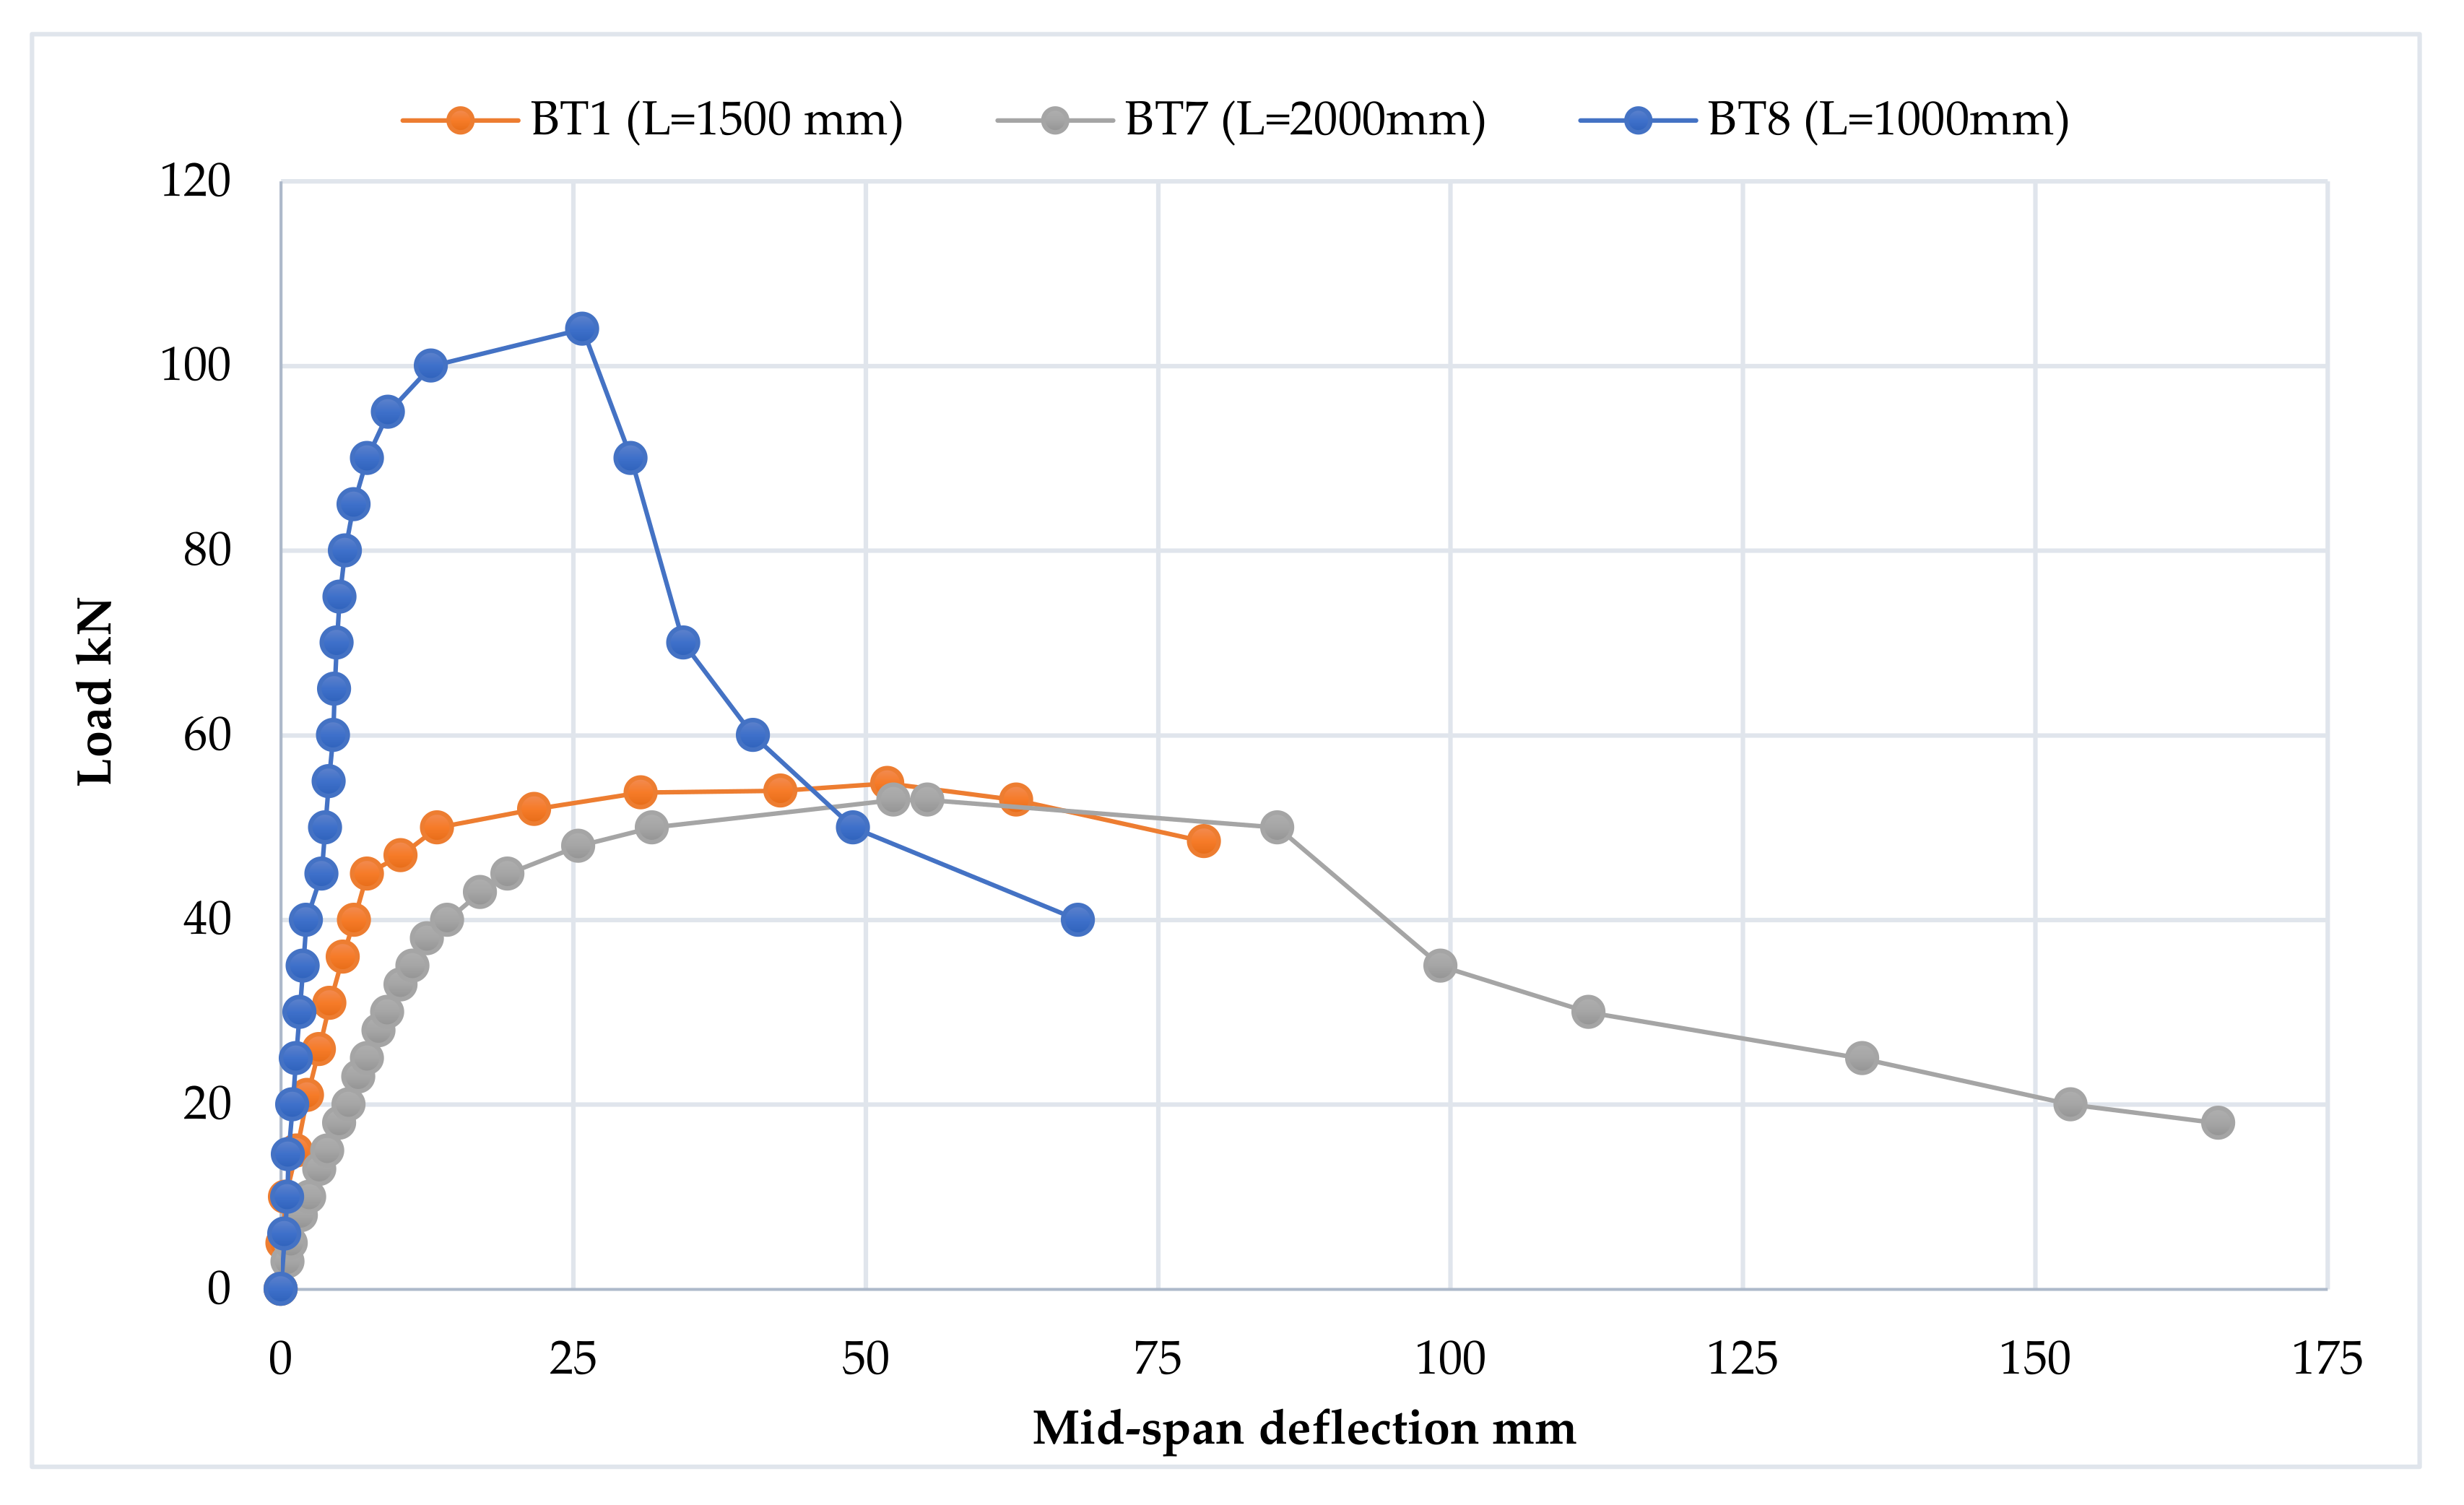
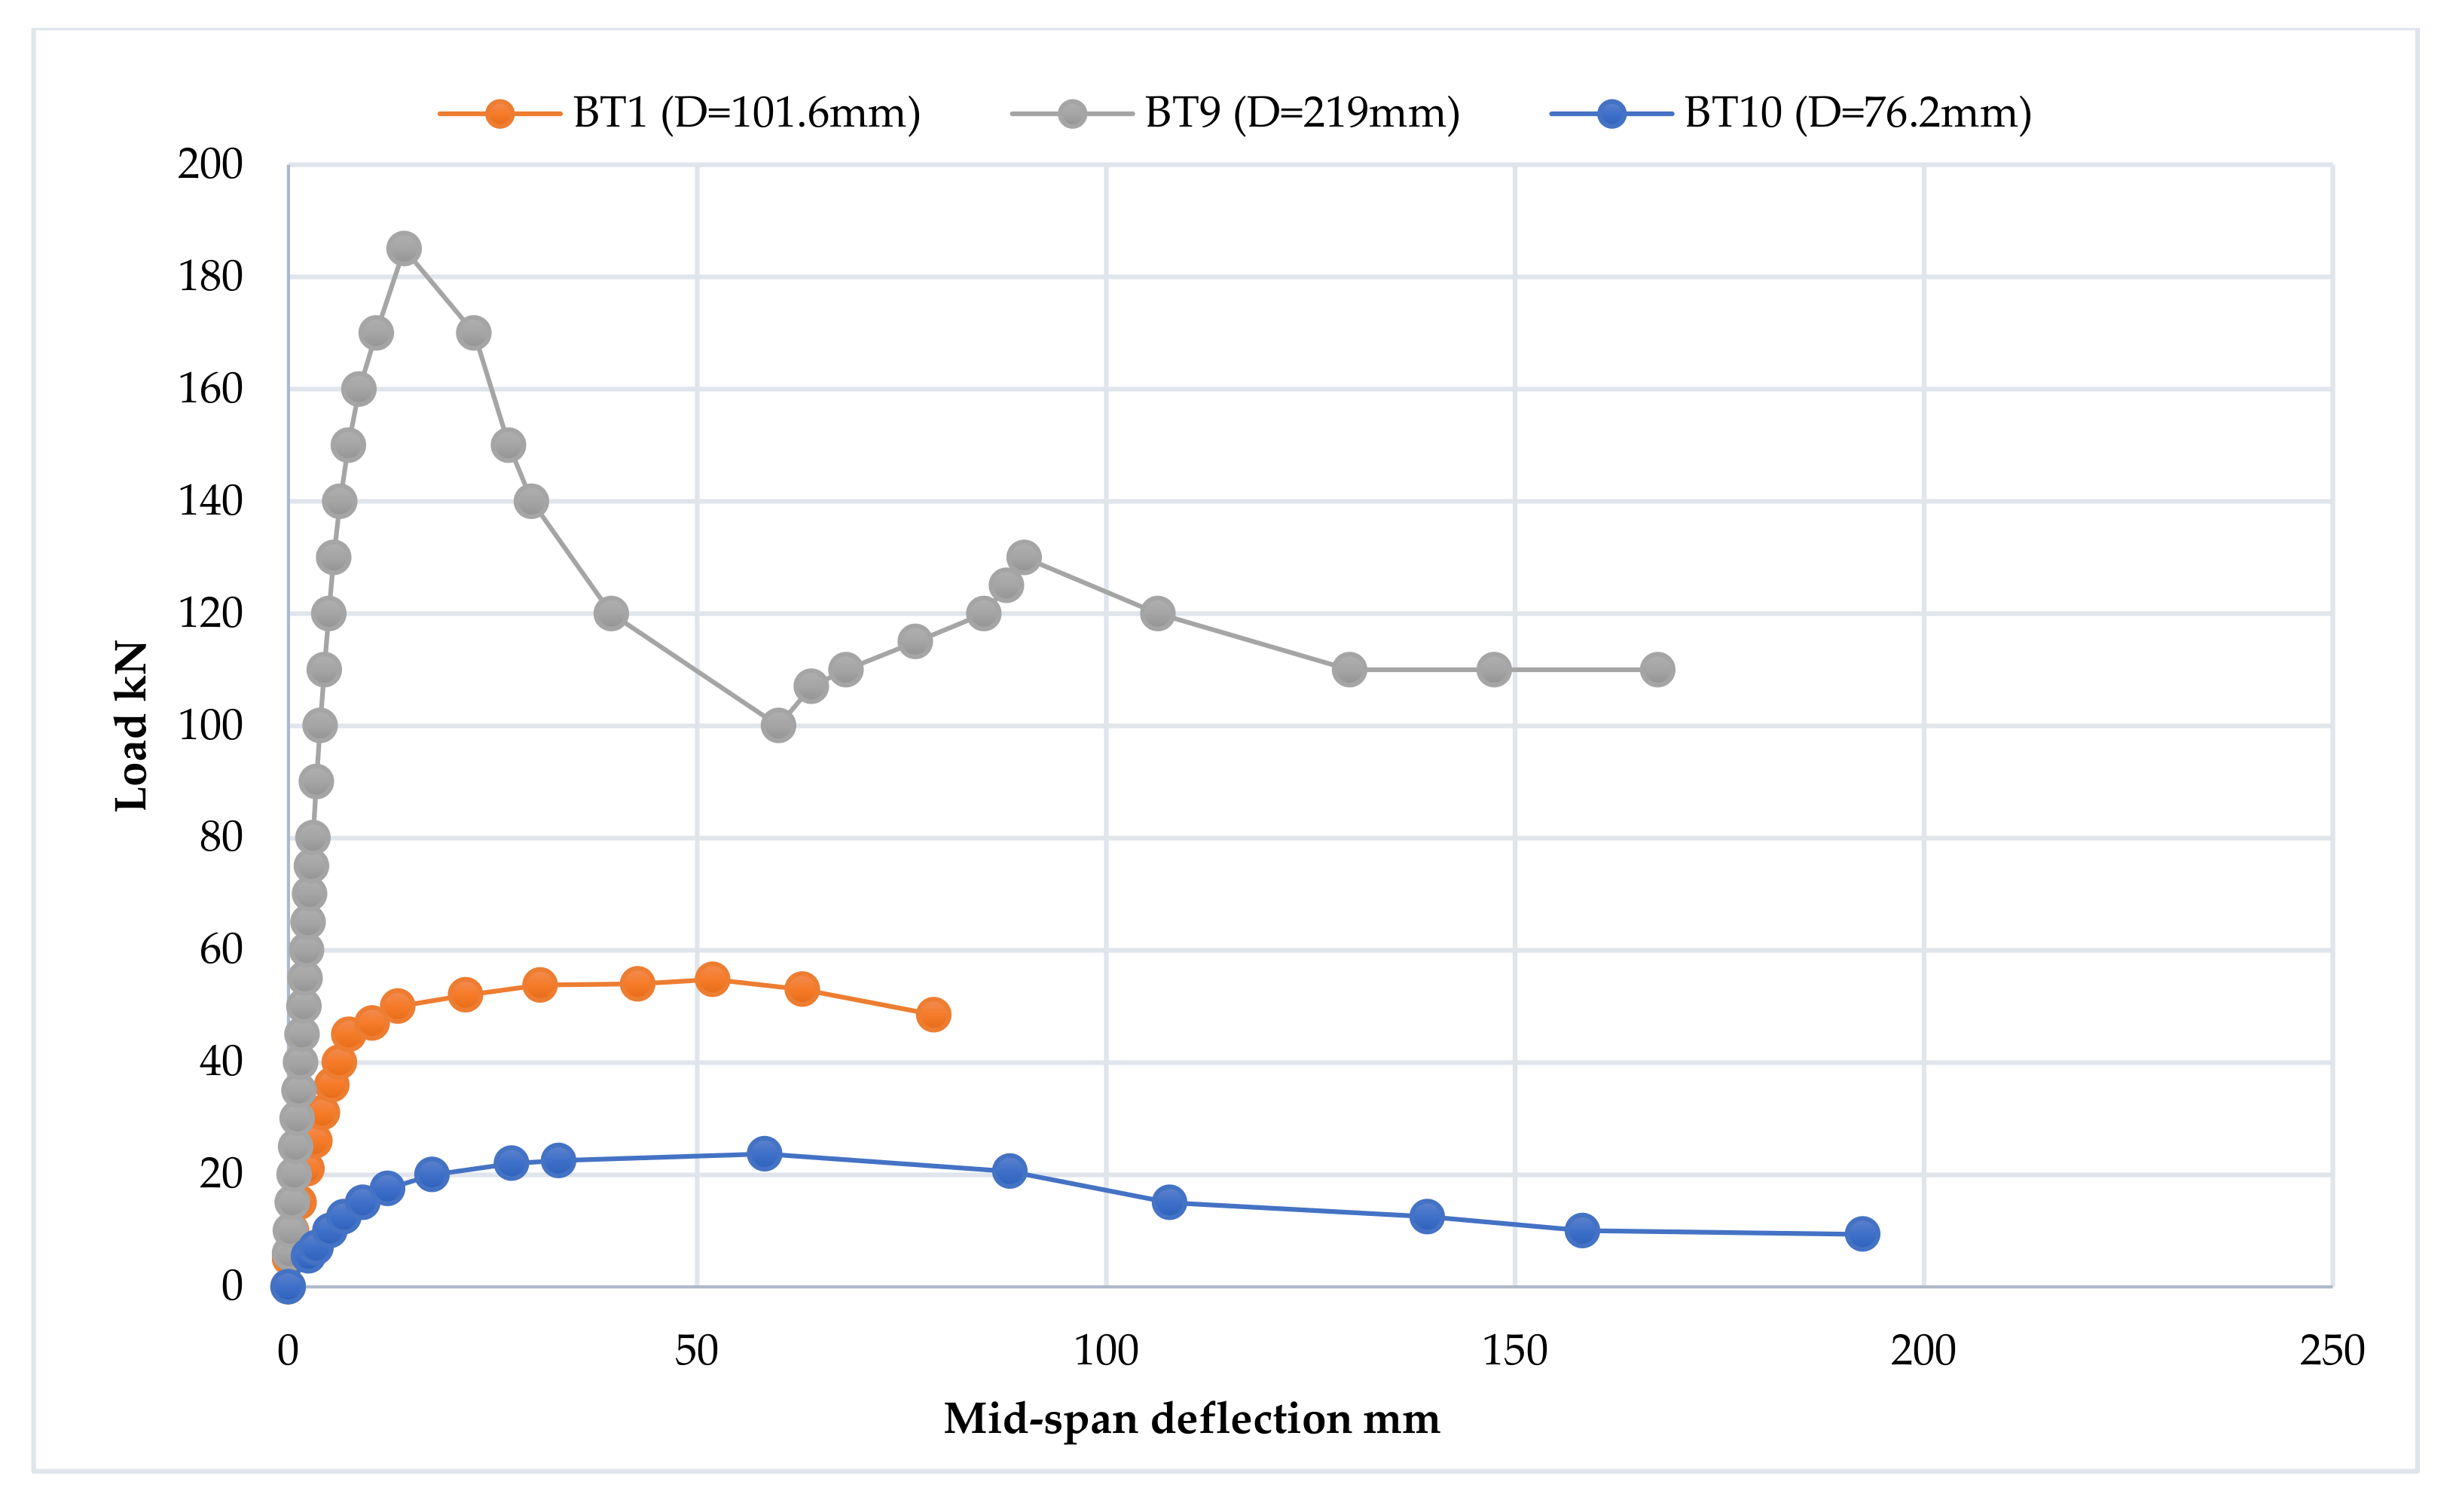
3.2.1. Load–Deflection Curve
- 1.
- The elastic stage
- 2.
- The ovalization stage
- 3.
- The failure stage
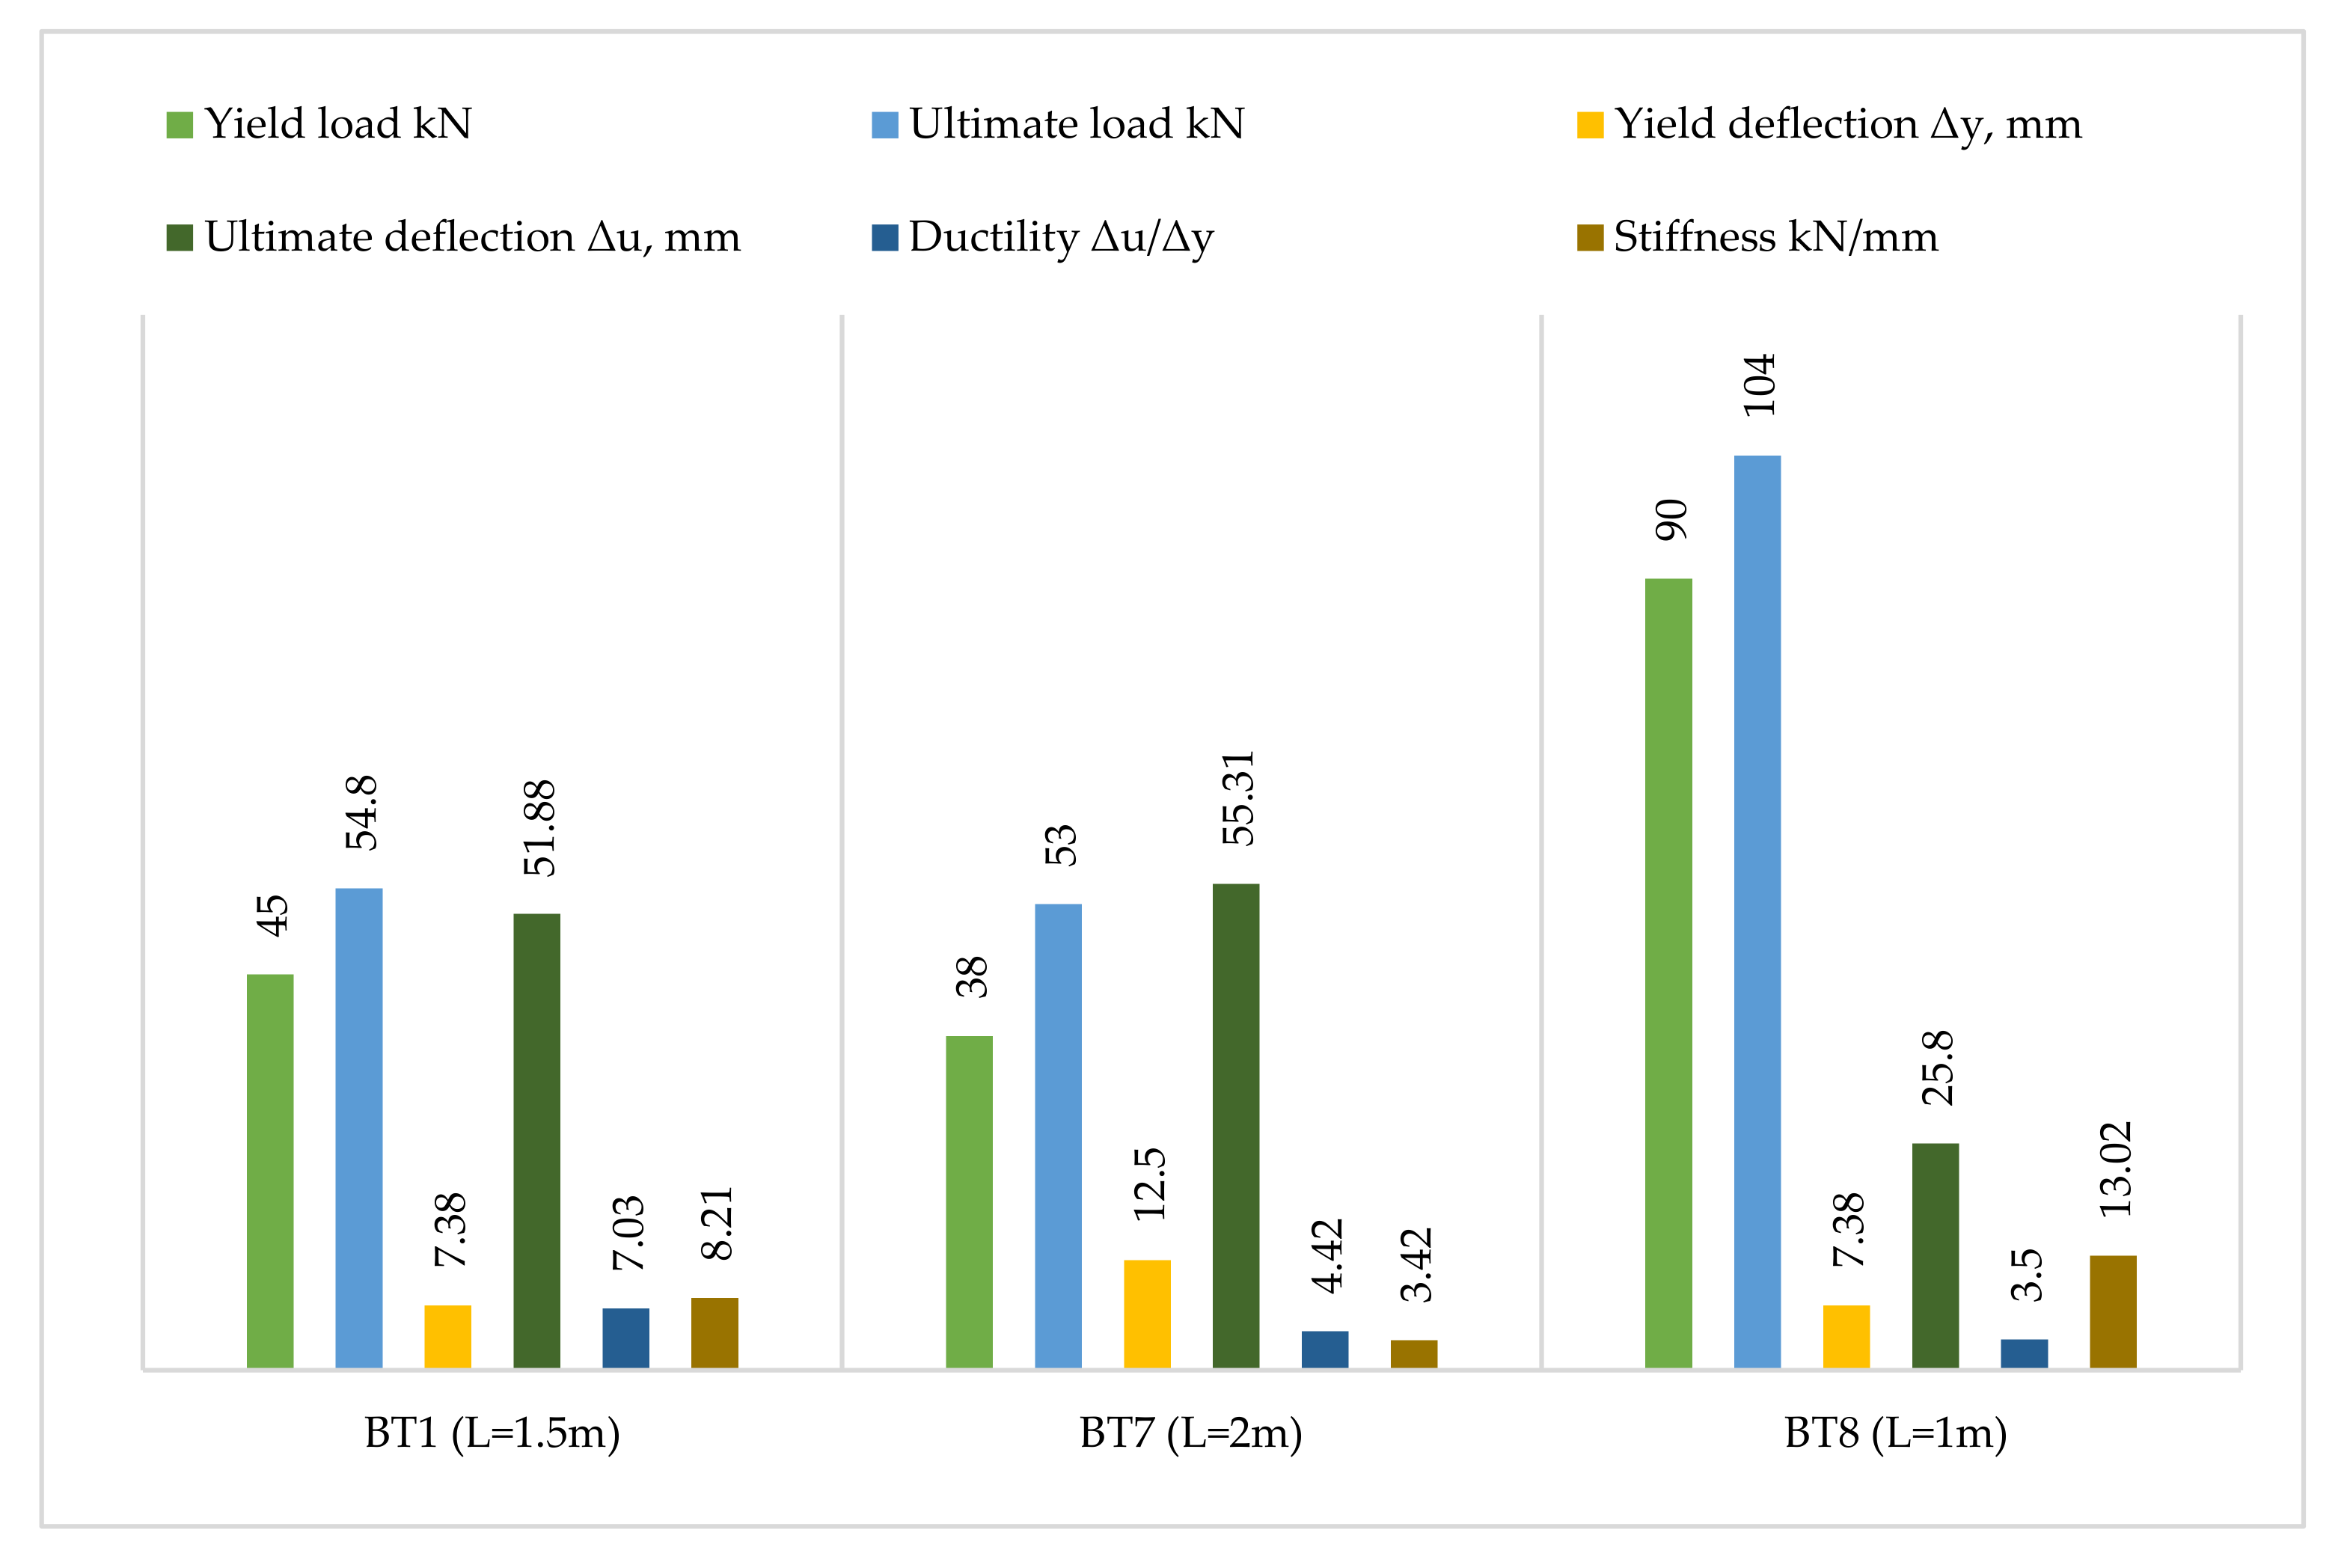
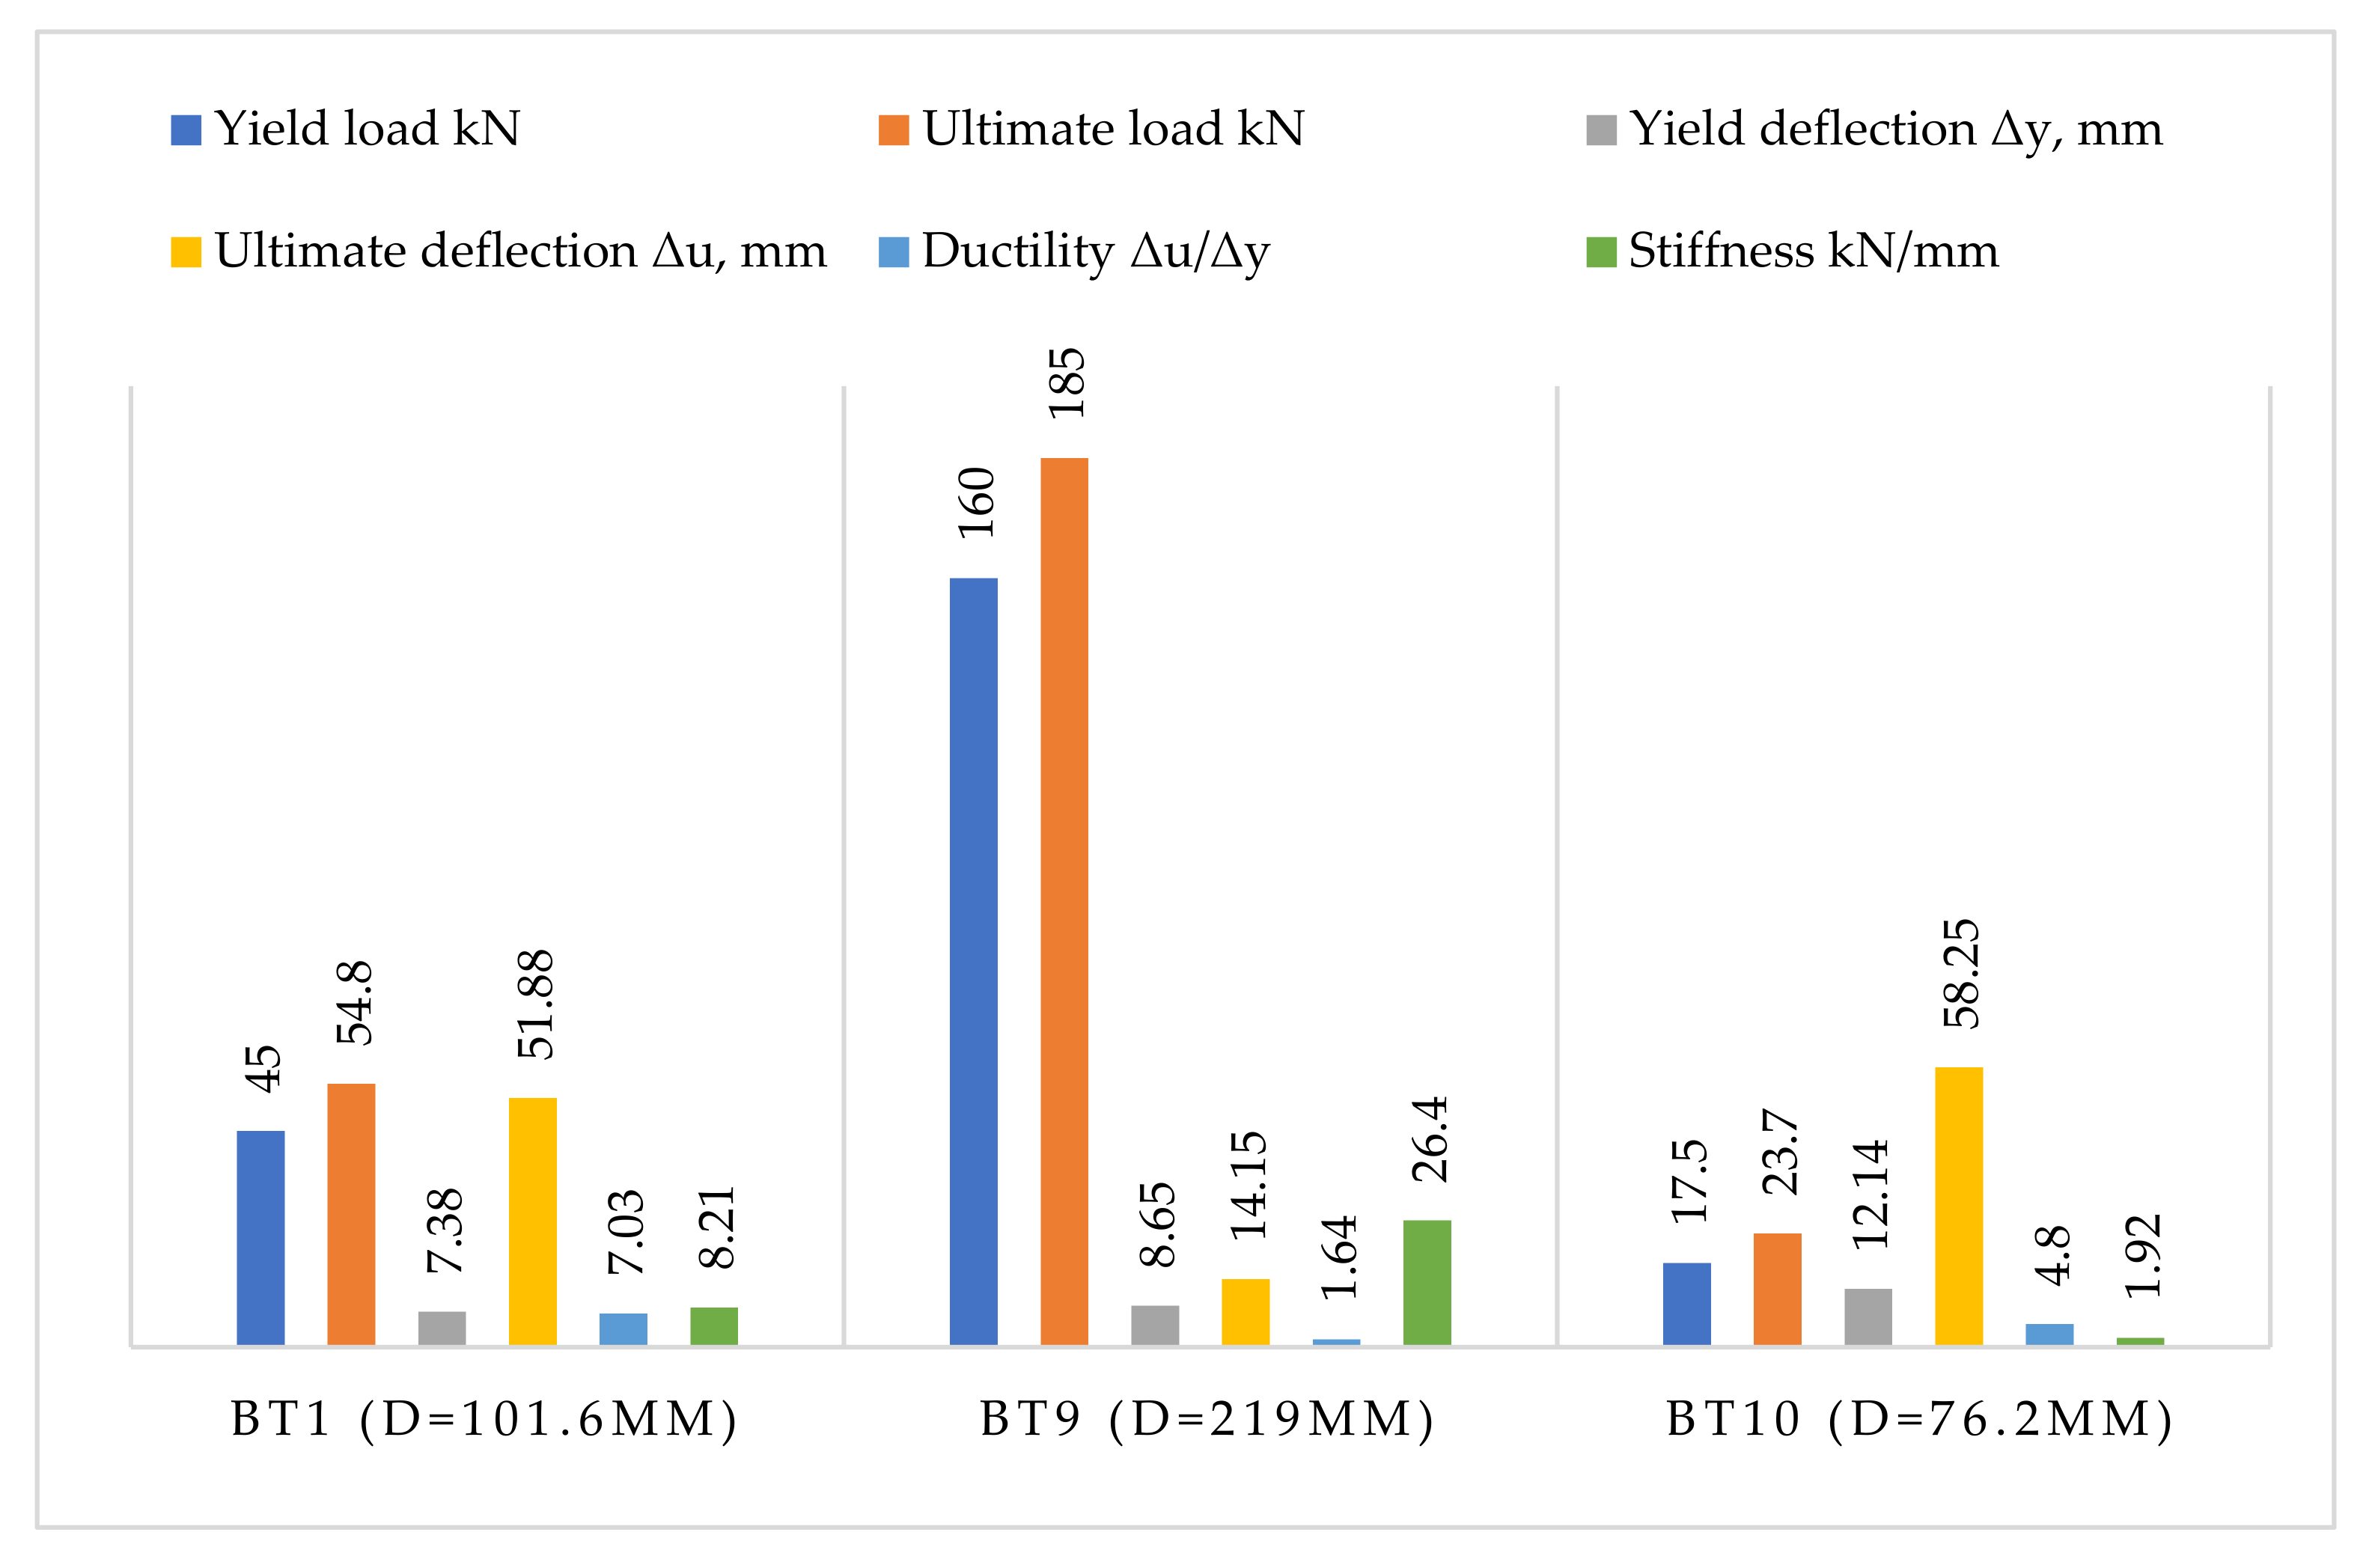
3.2.2. Ductility
3.2.3. Stiffness
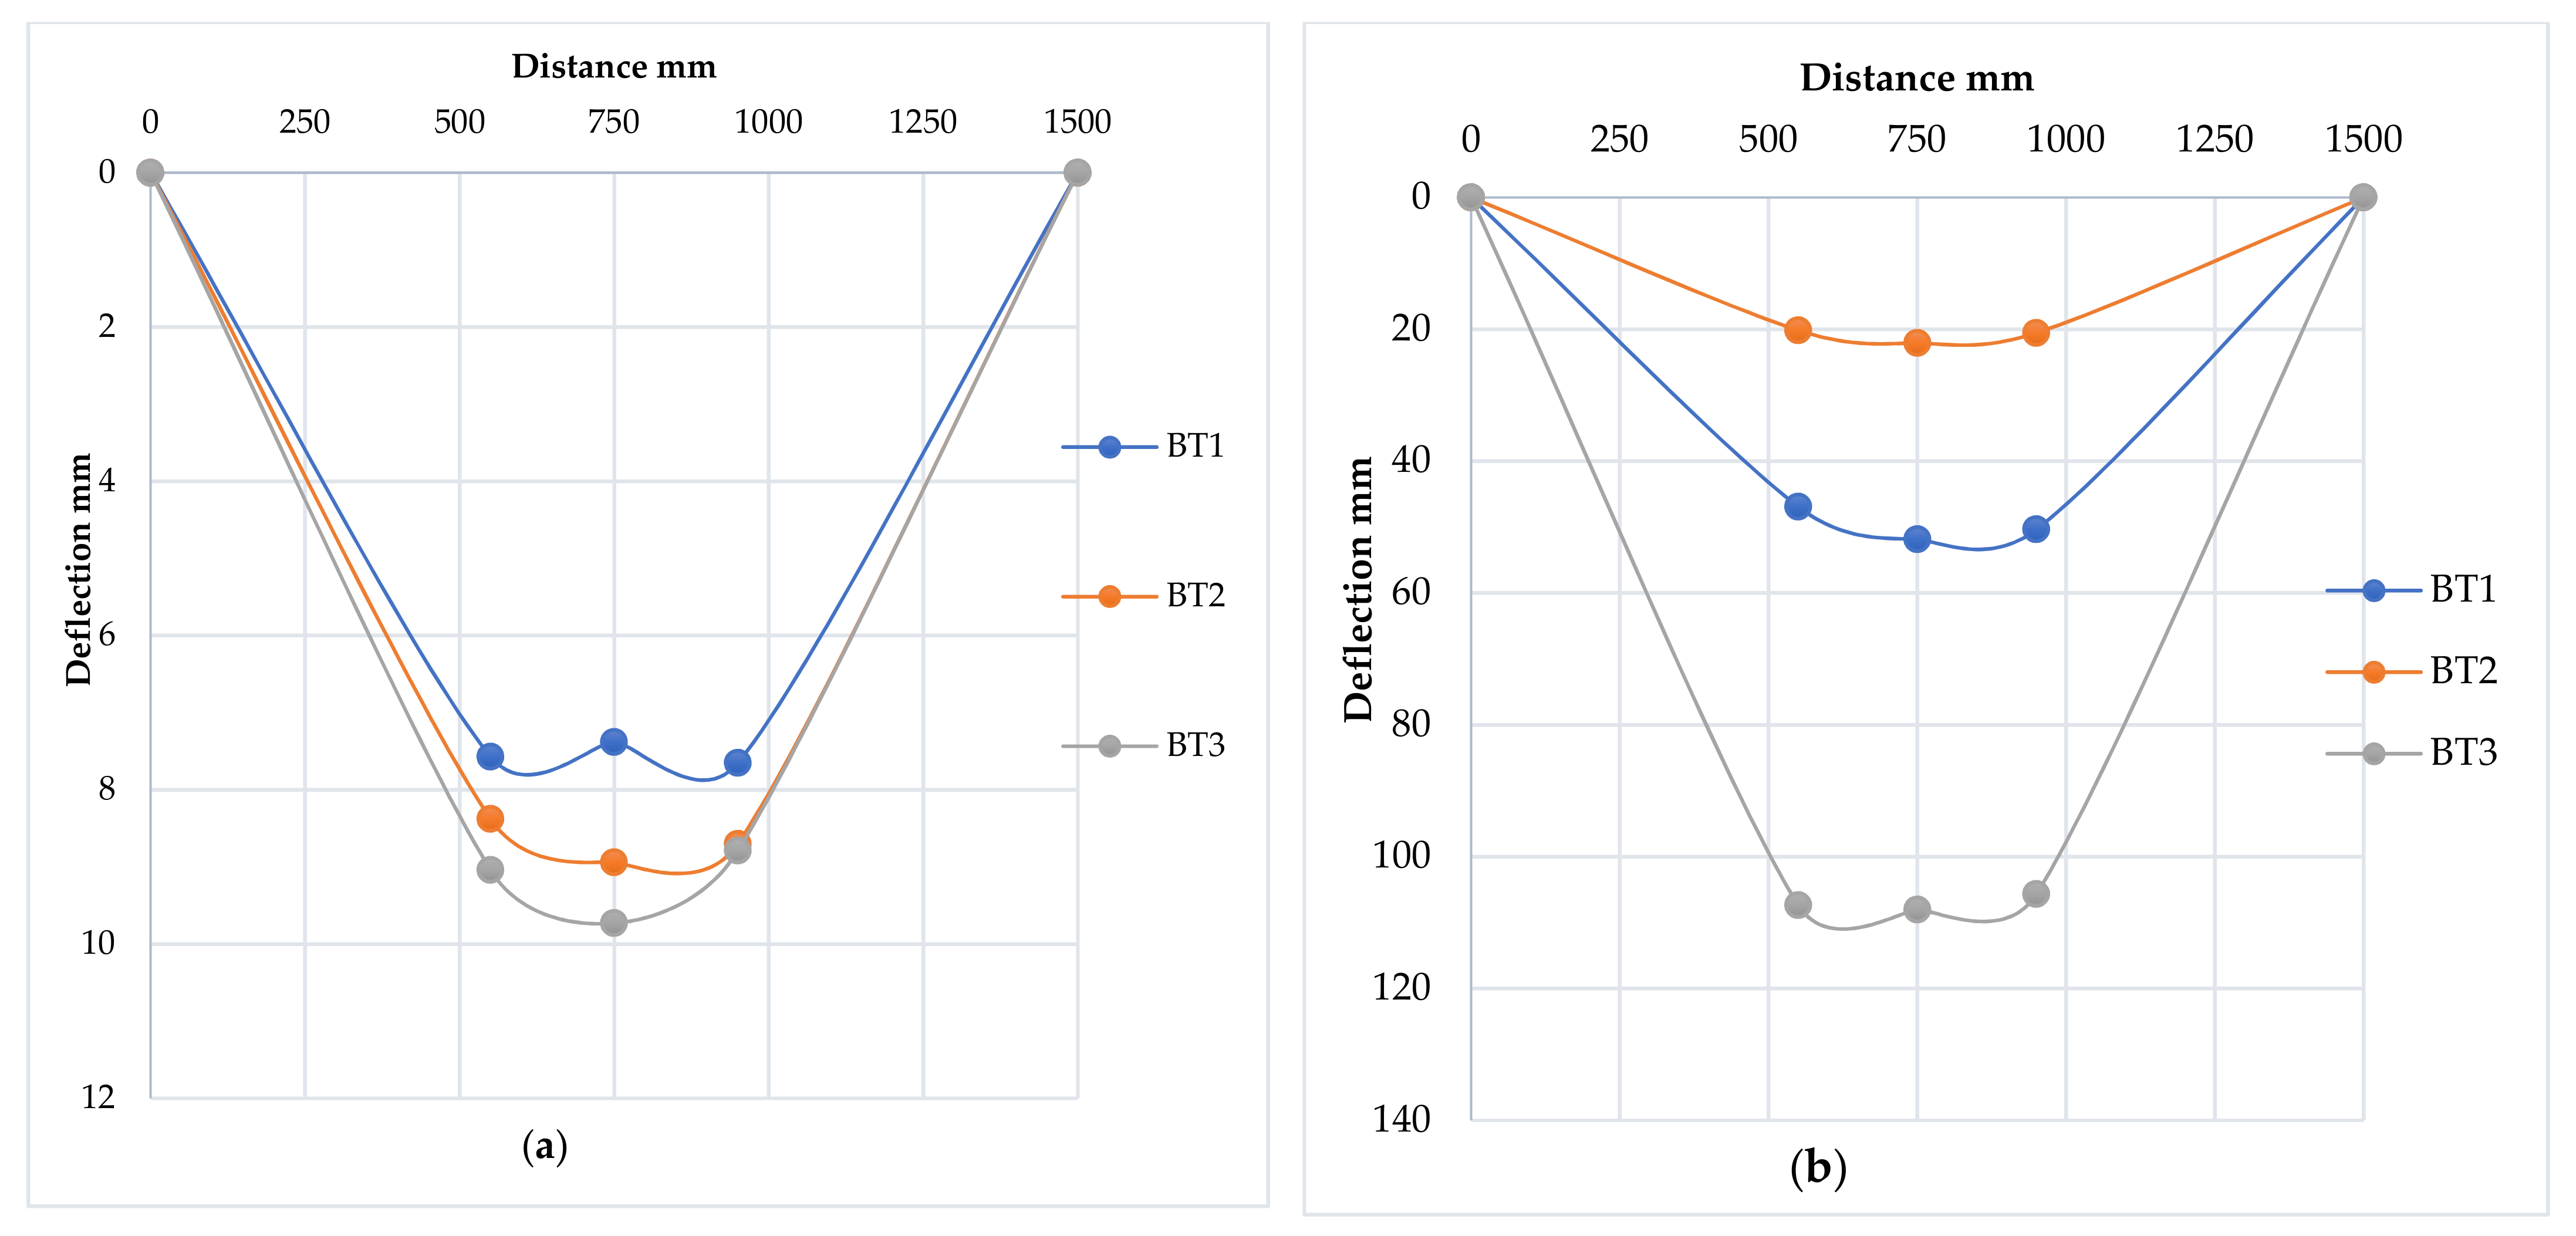
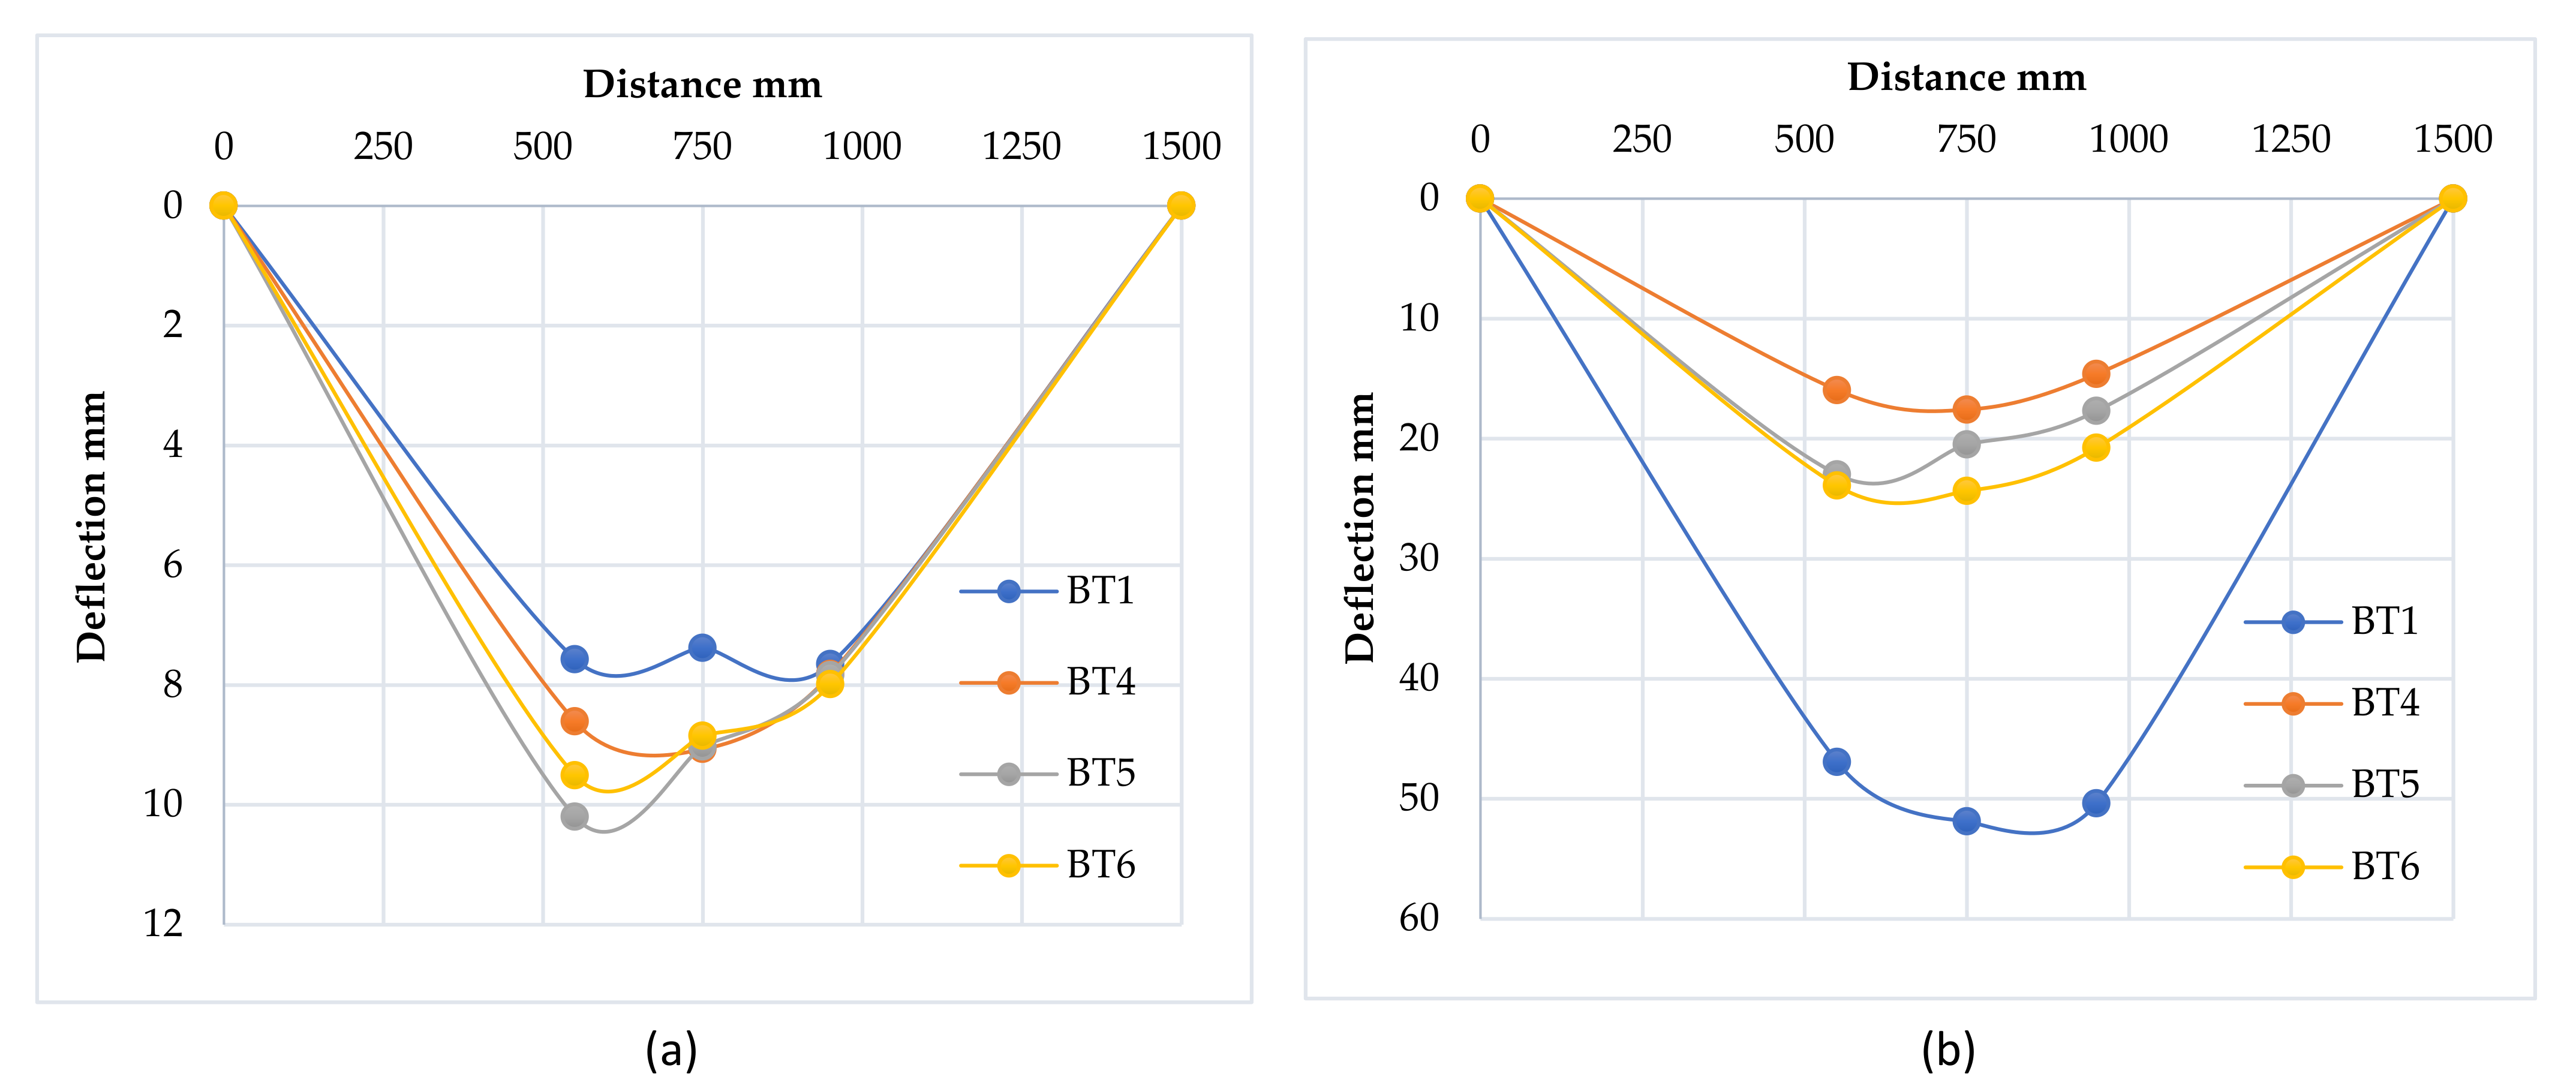
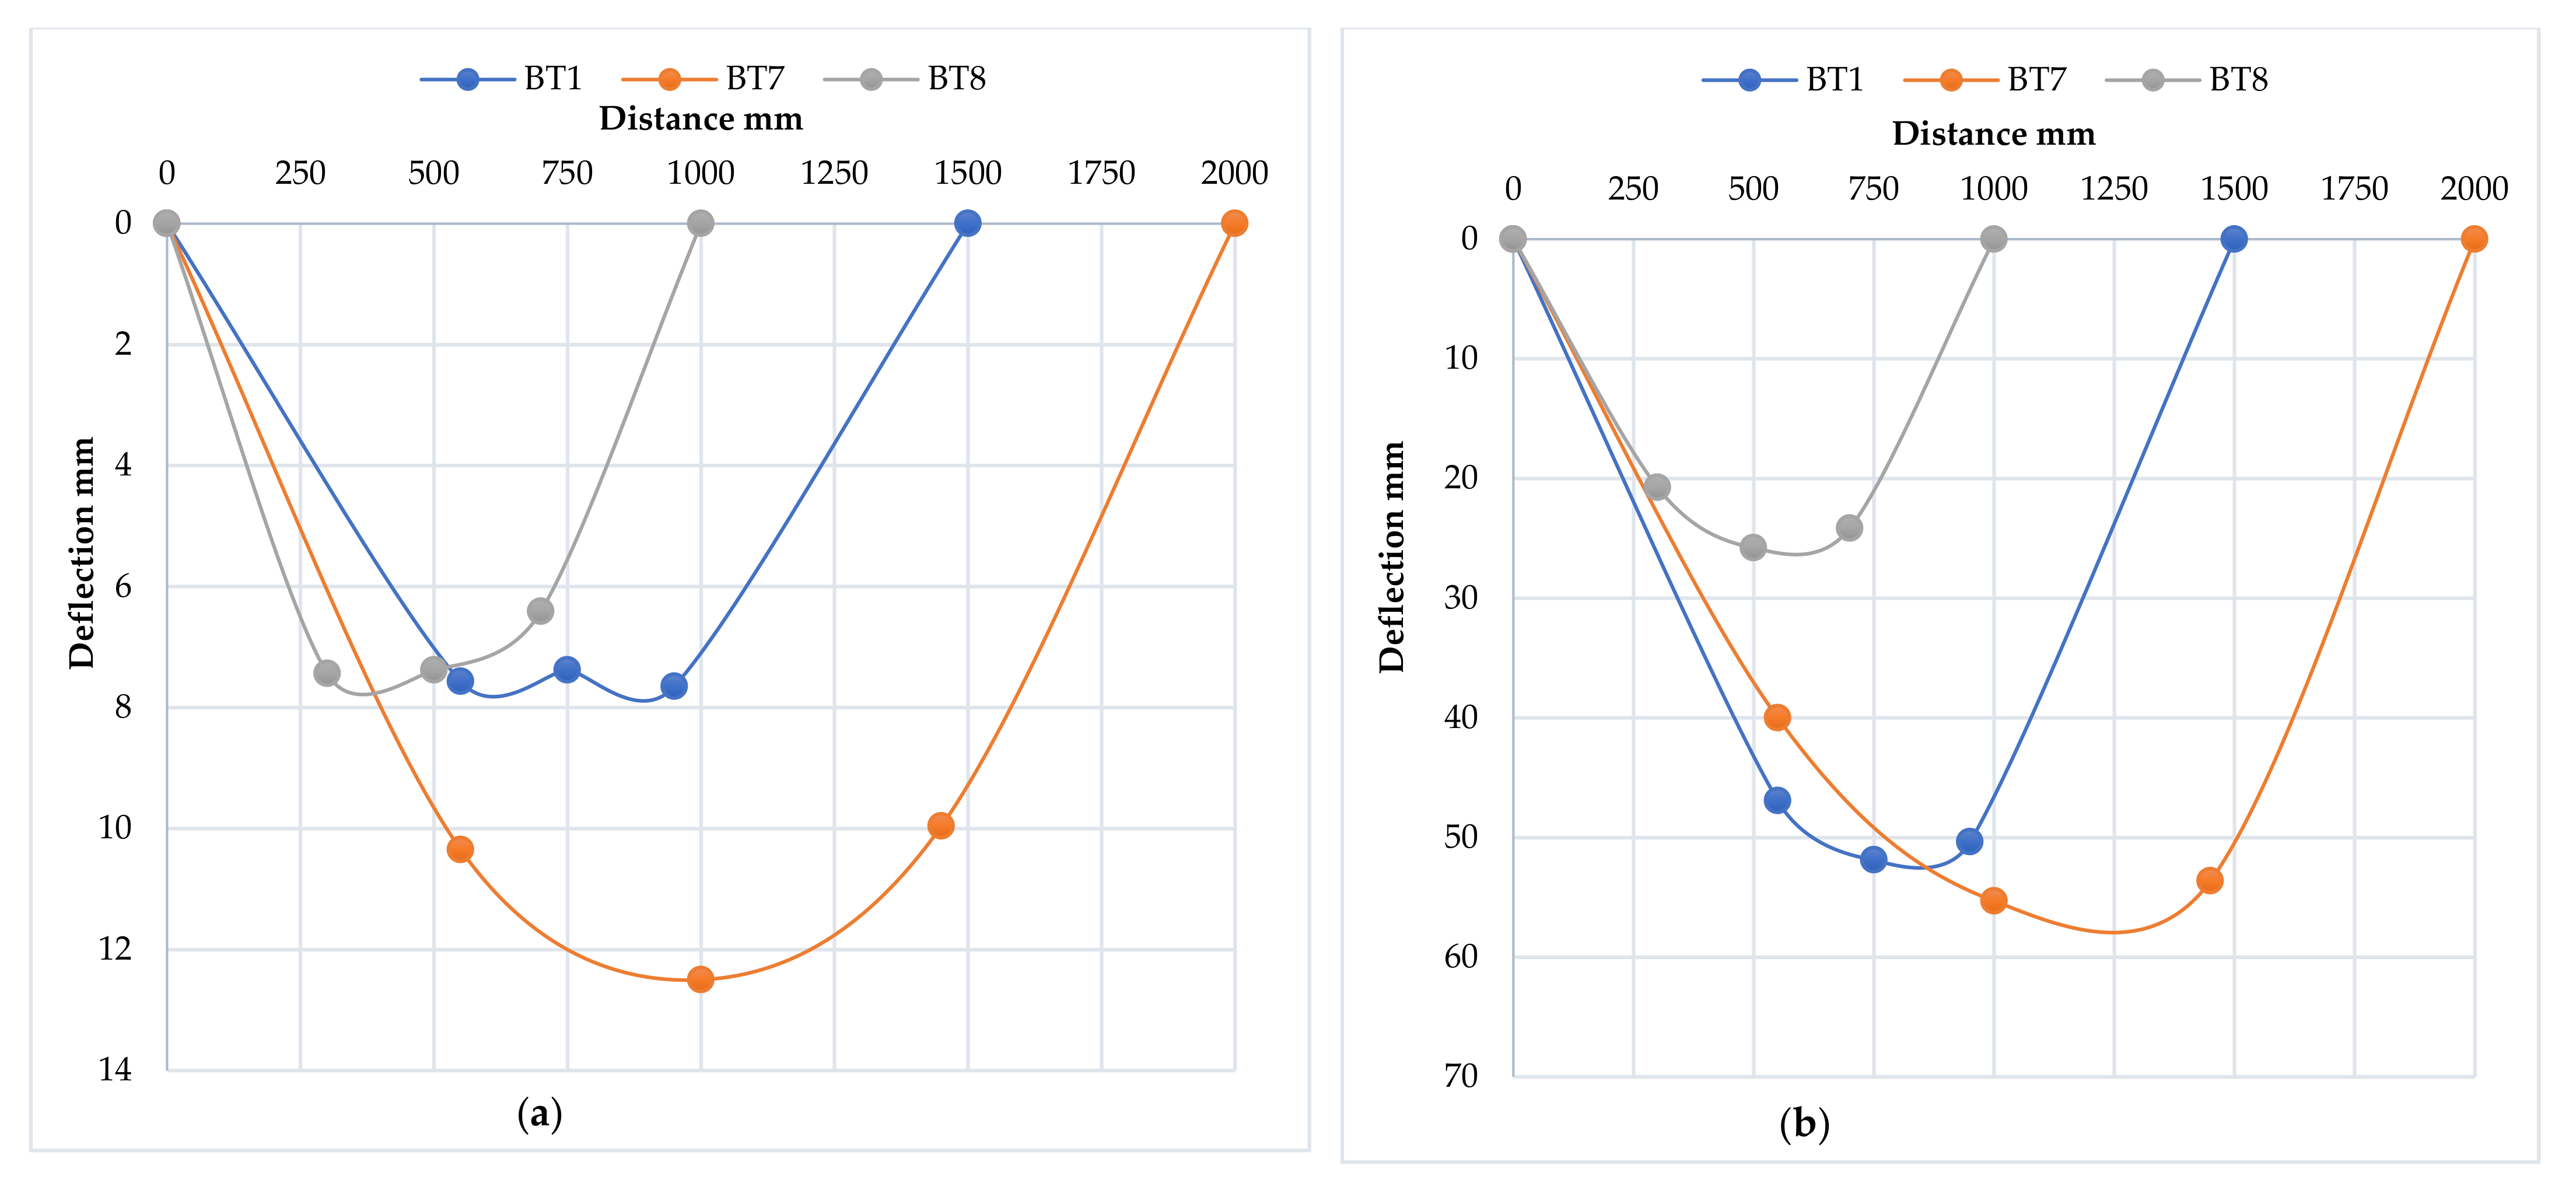
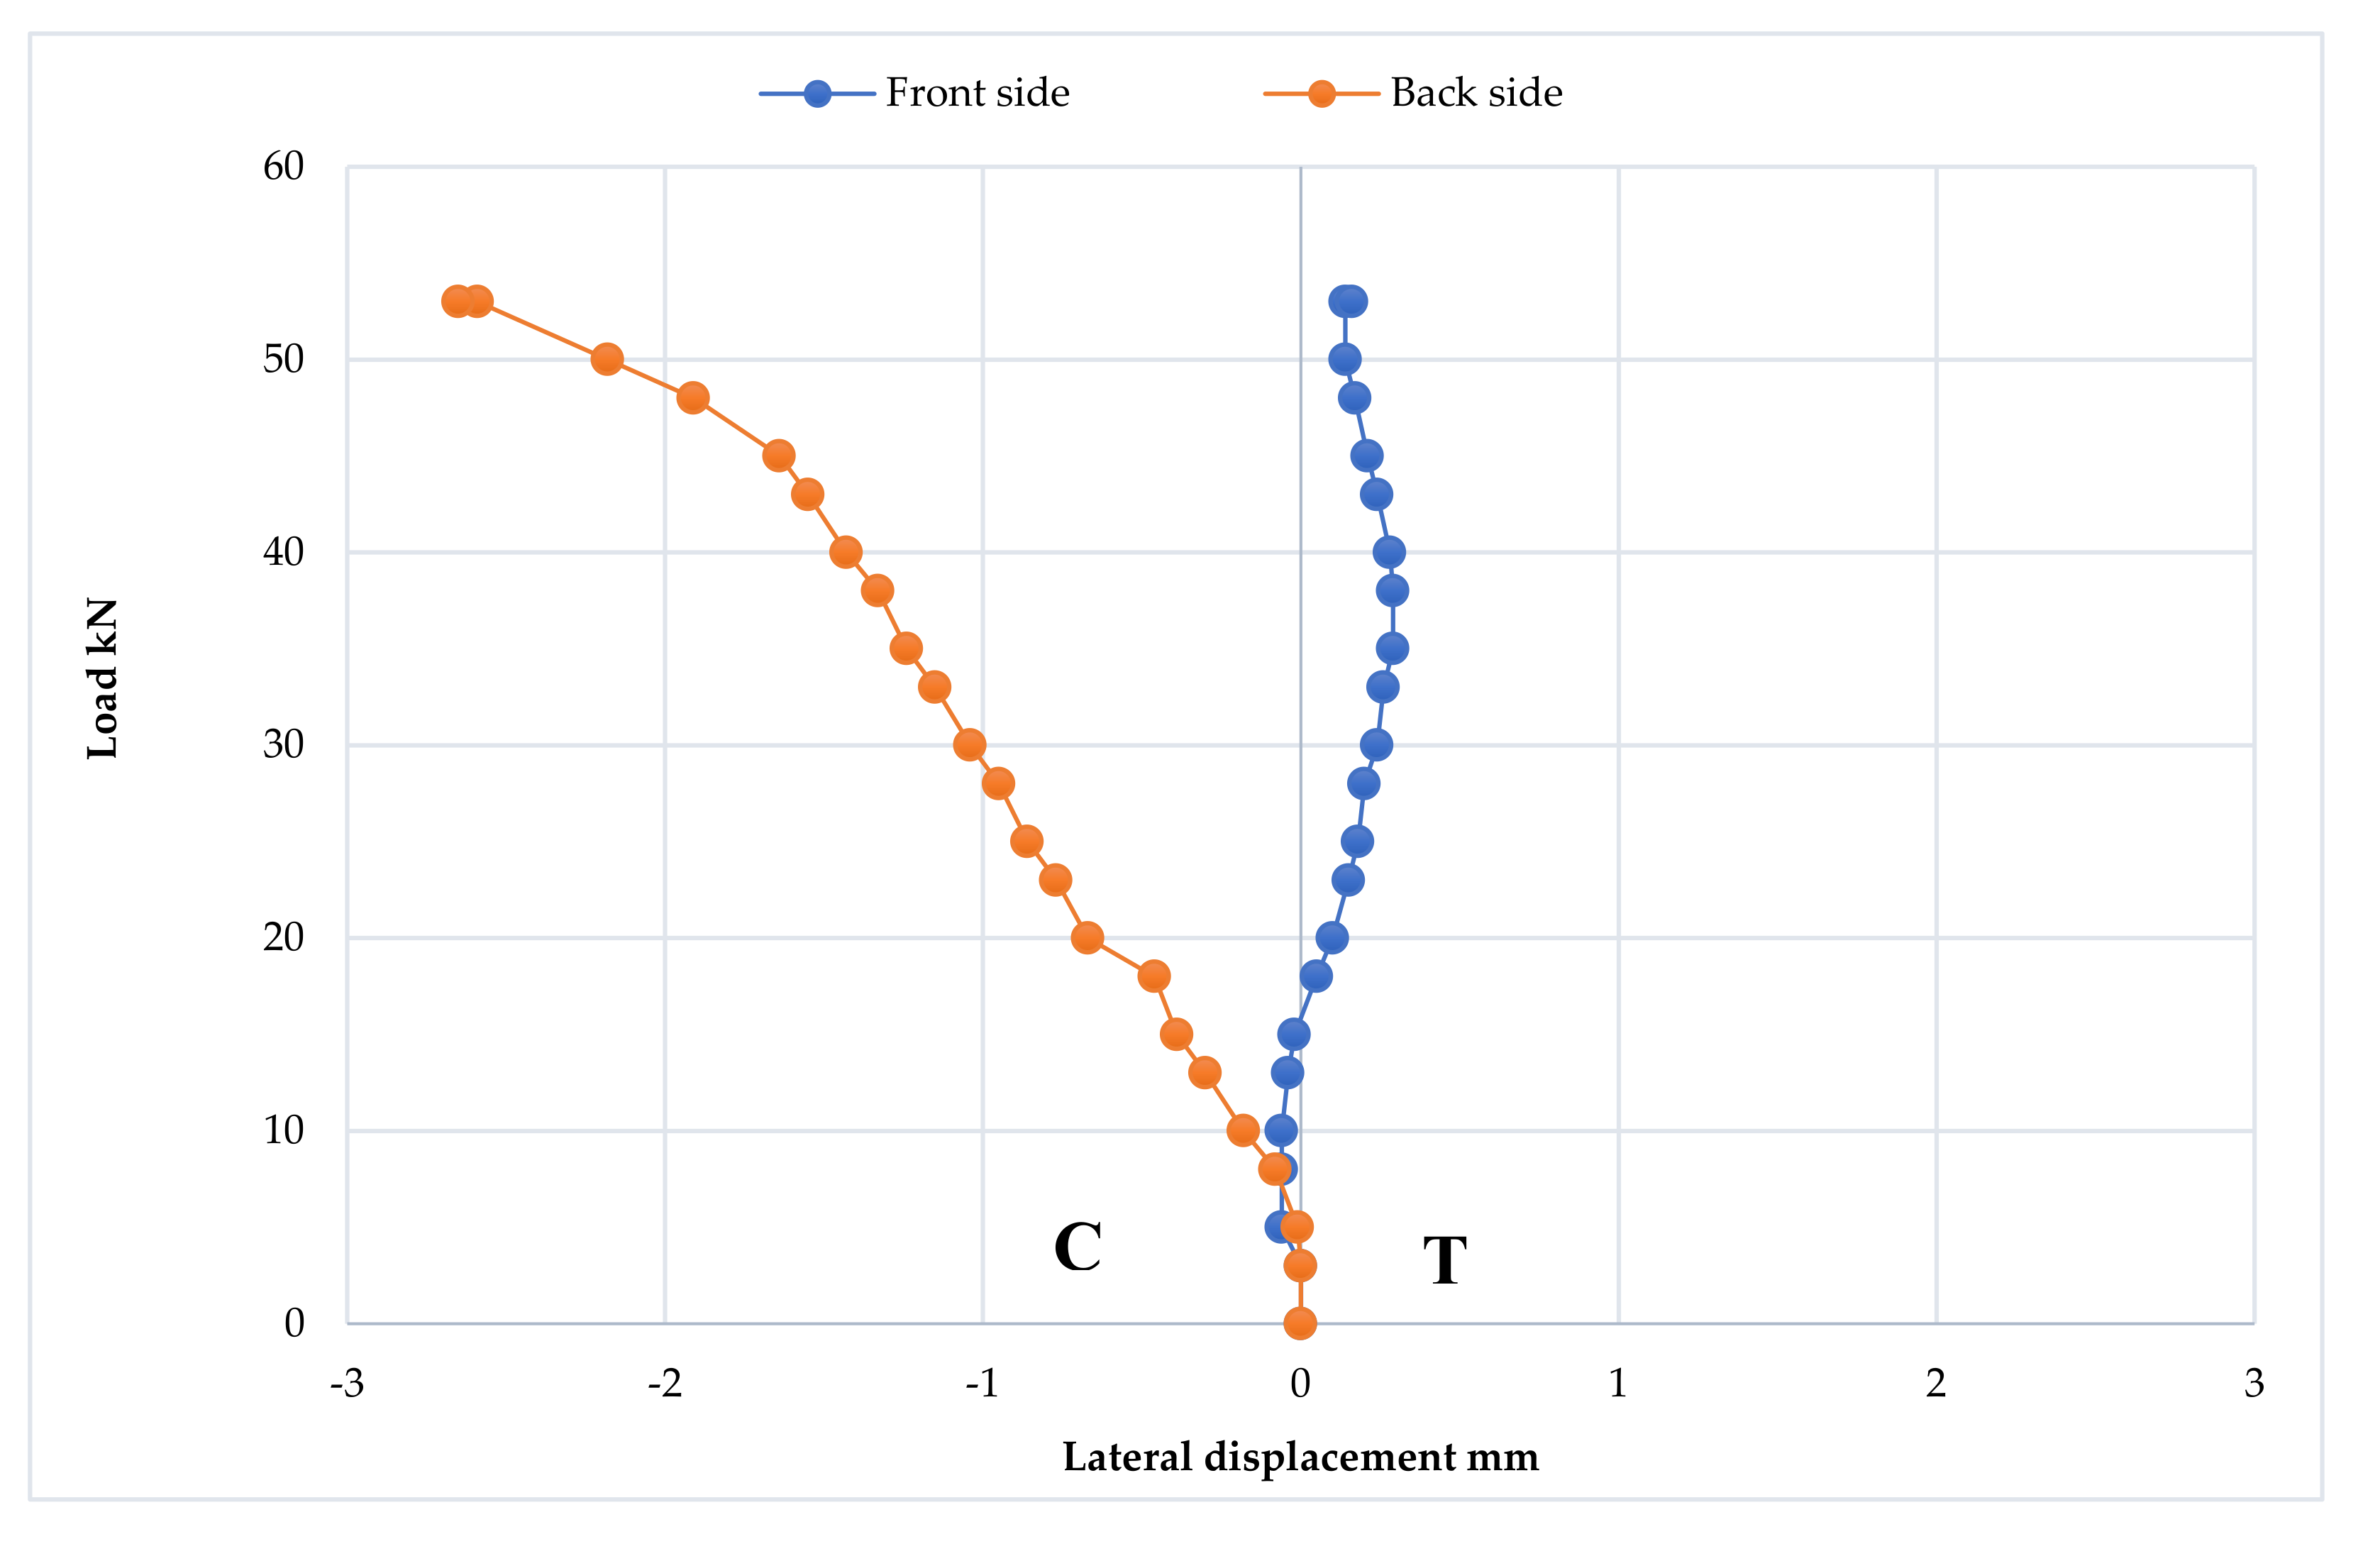
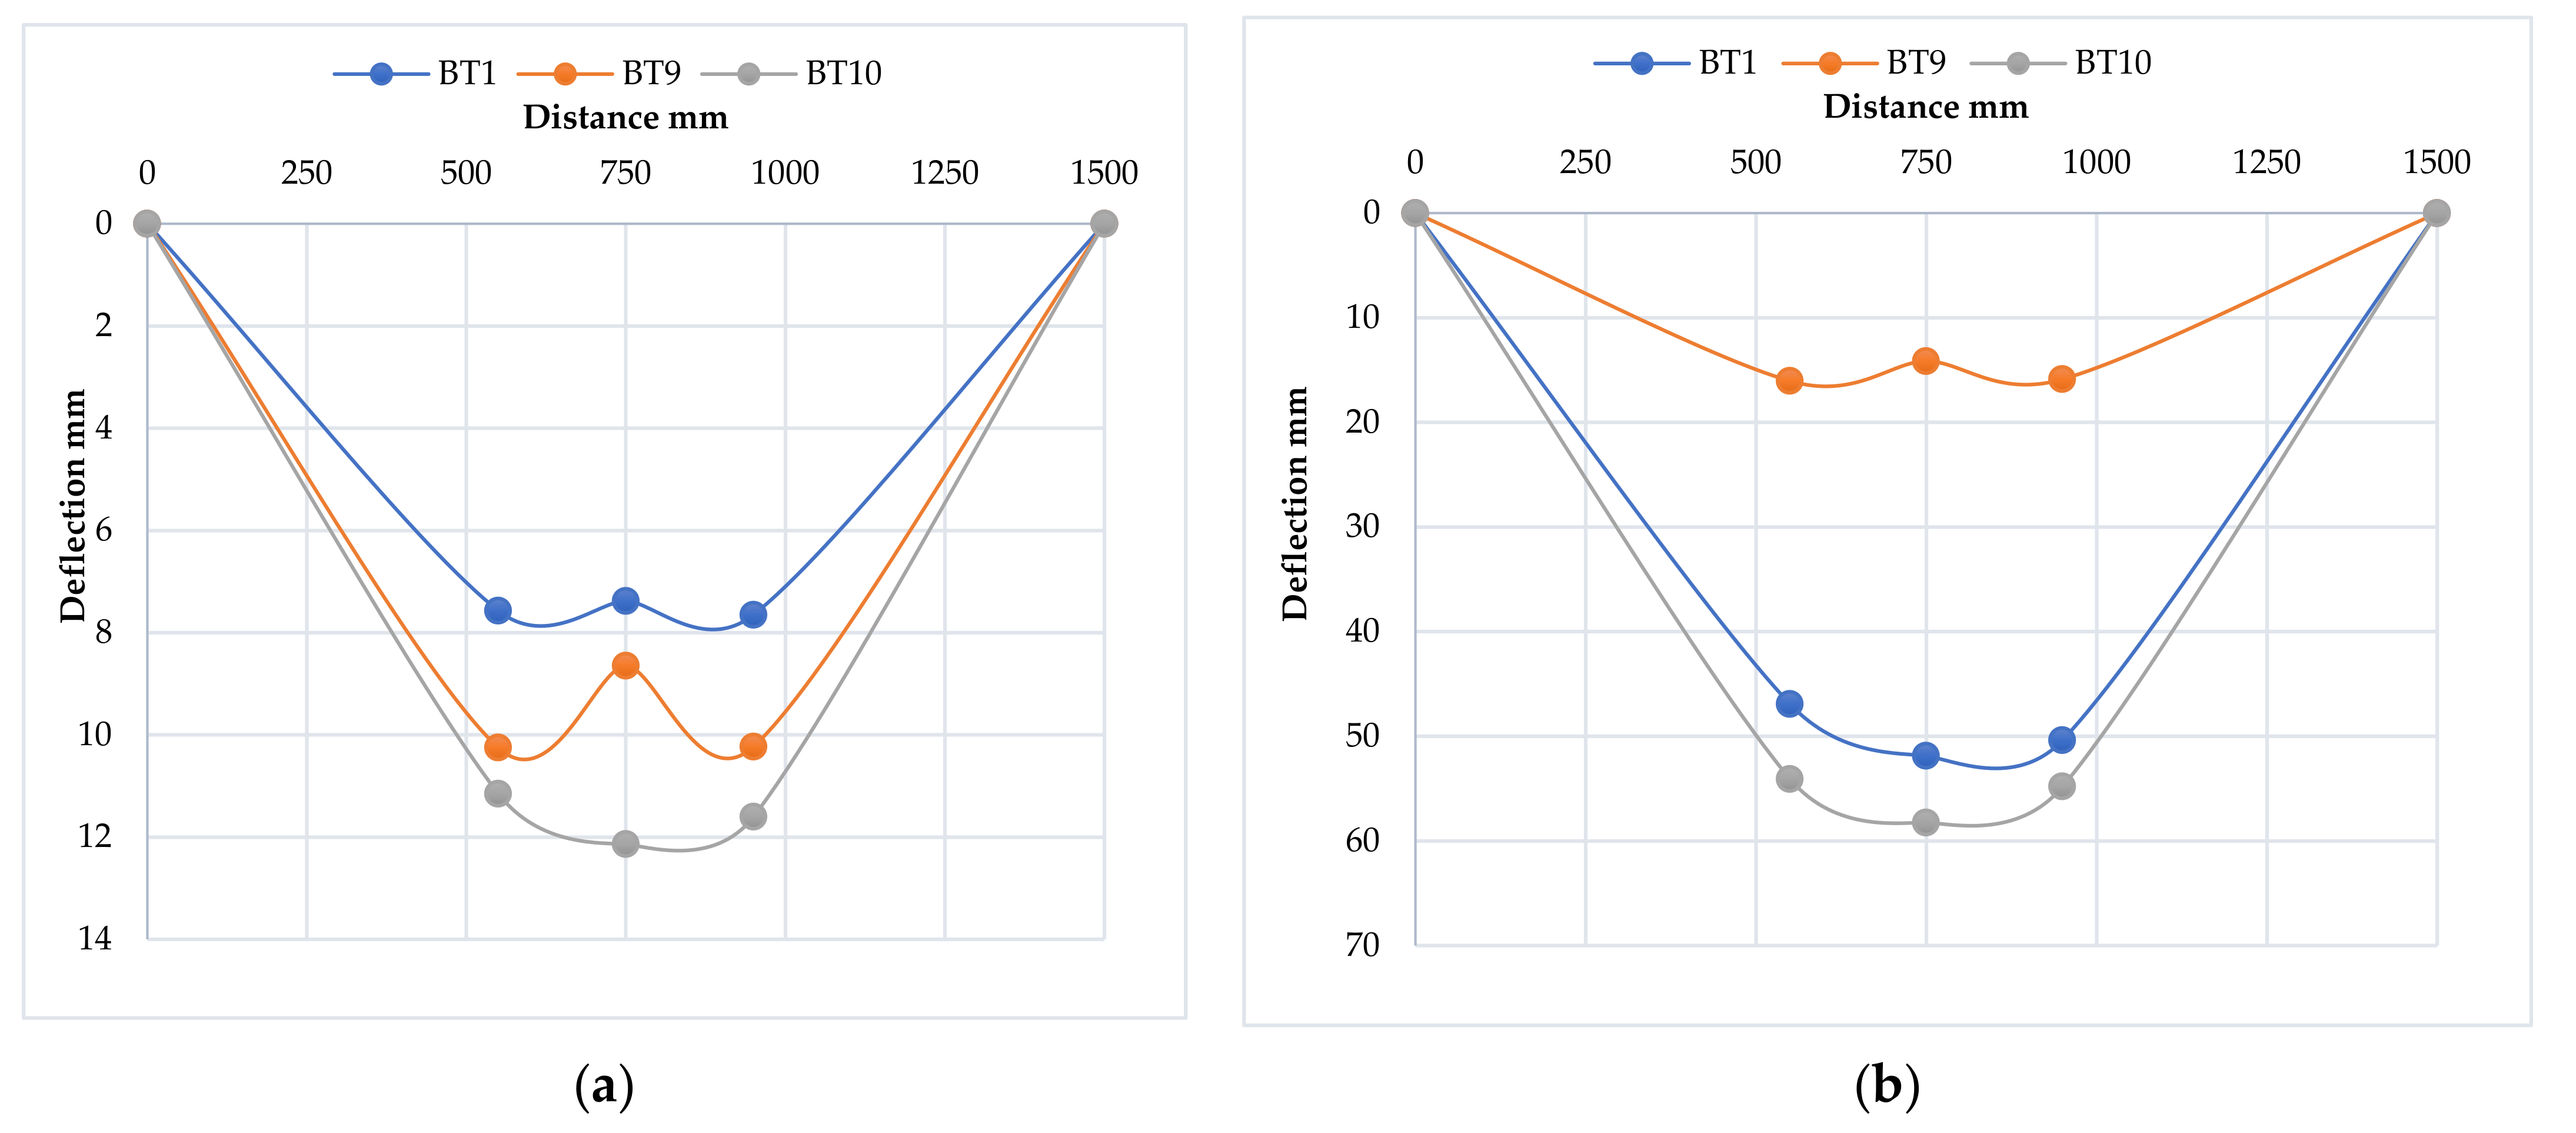
3.2.4. Deflection Profile
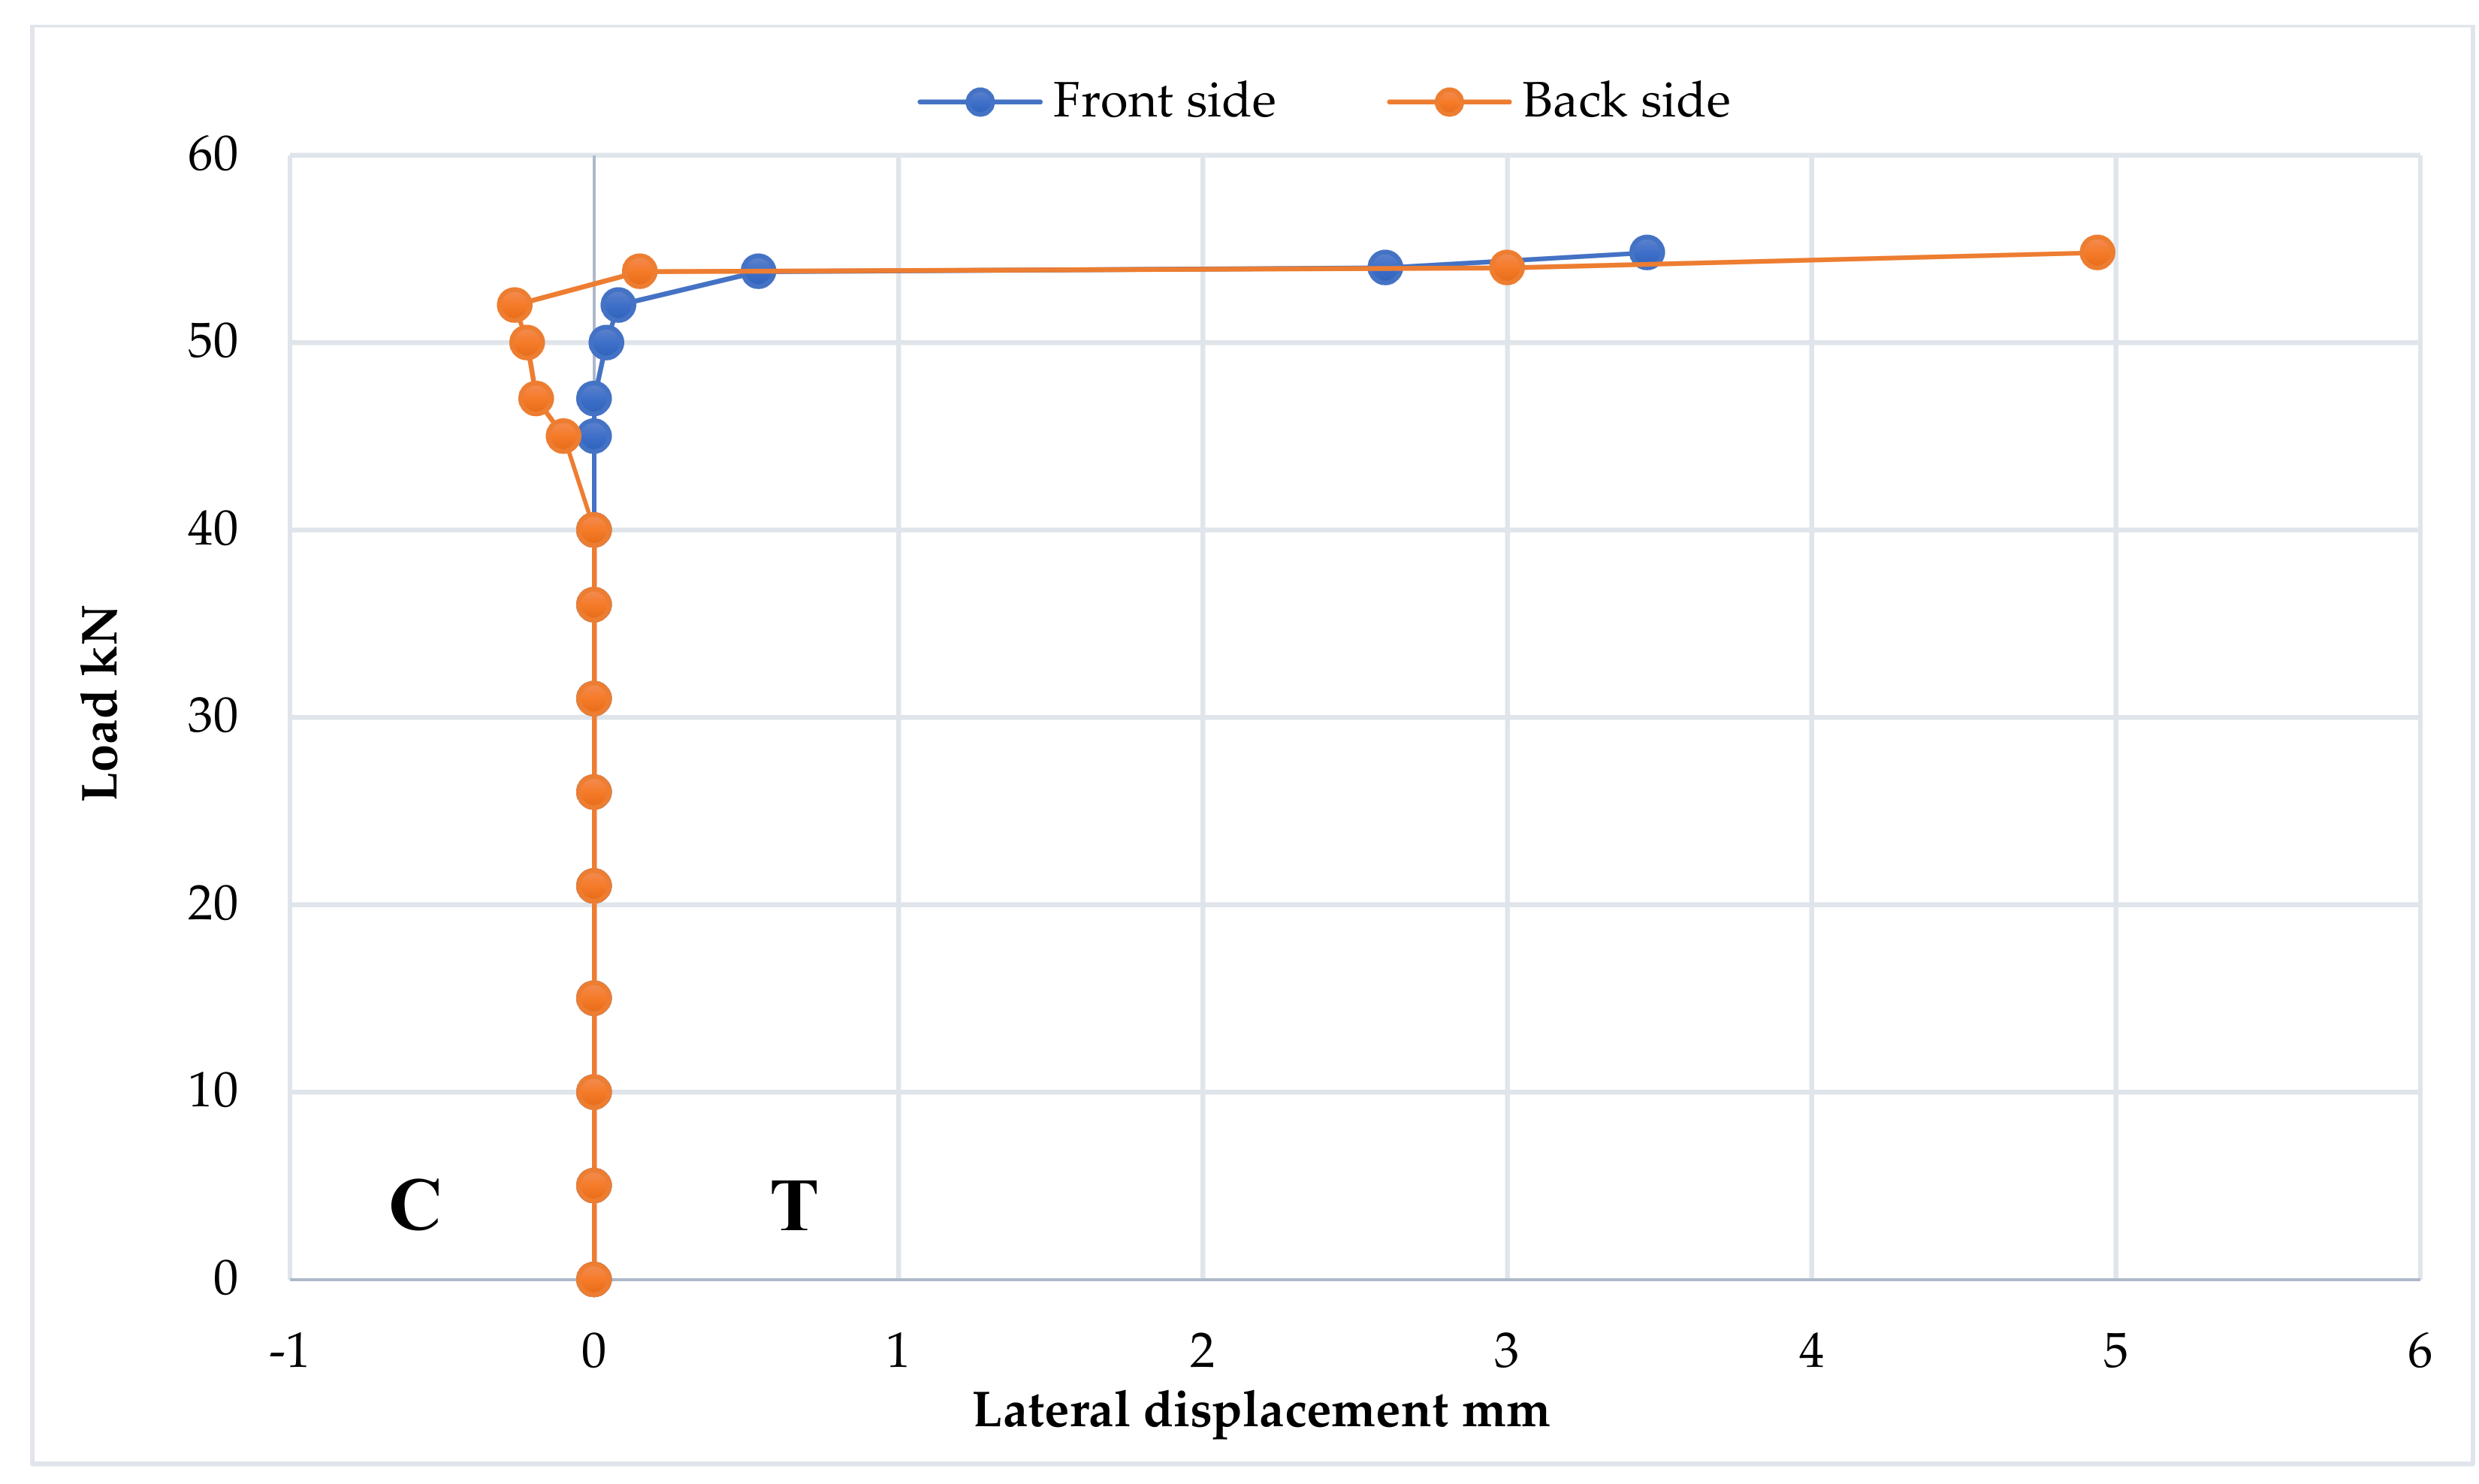
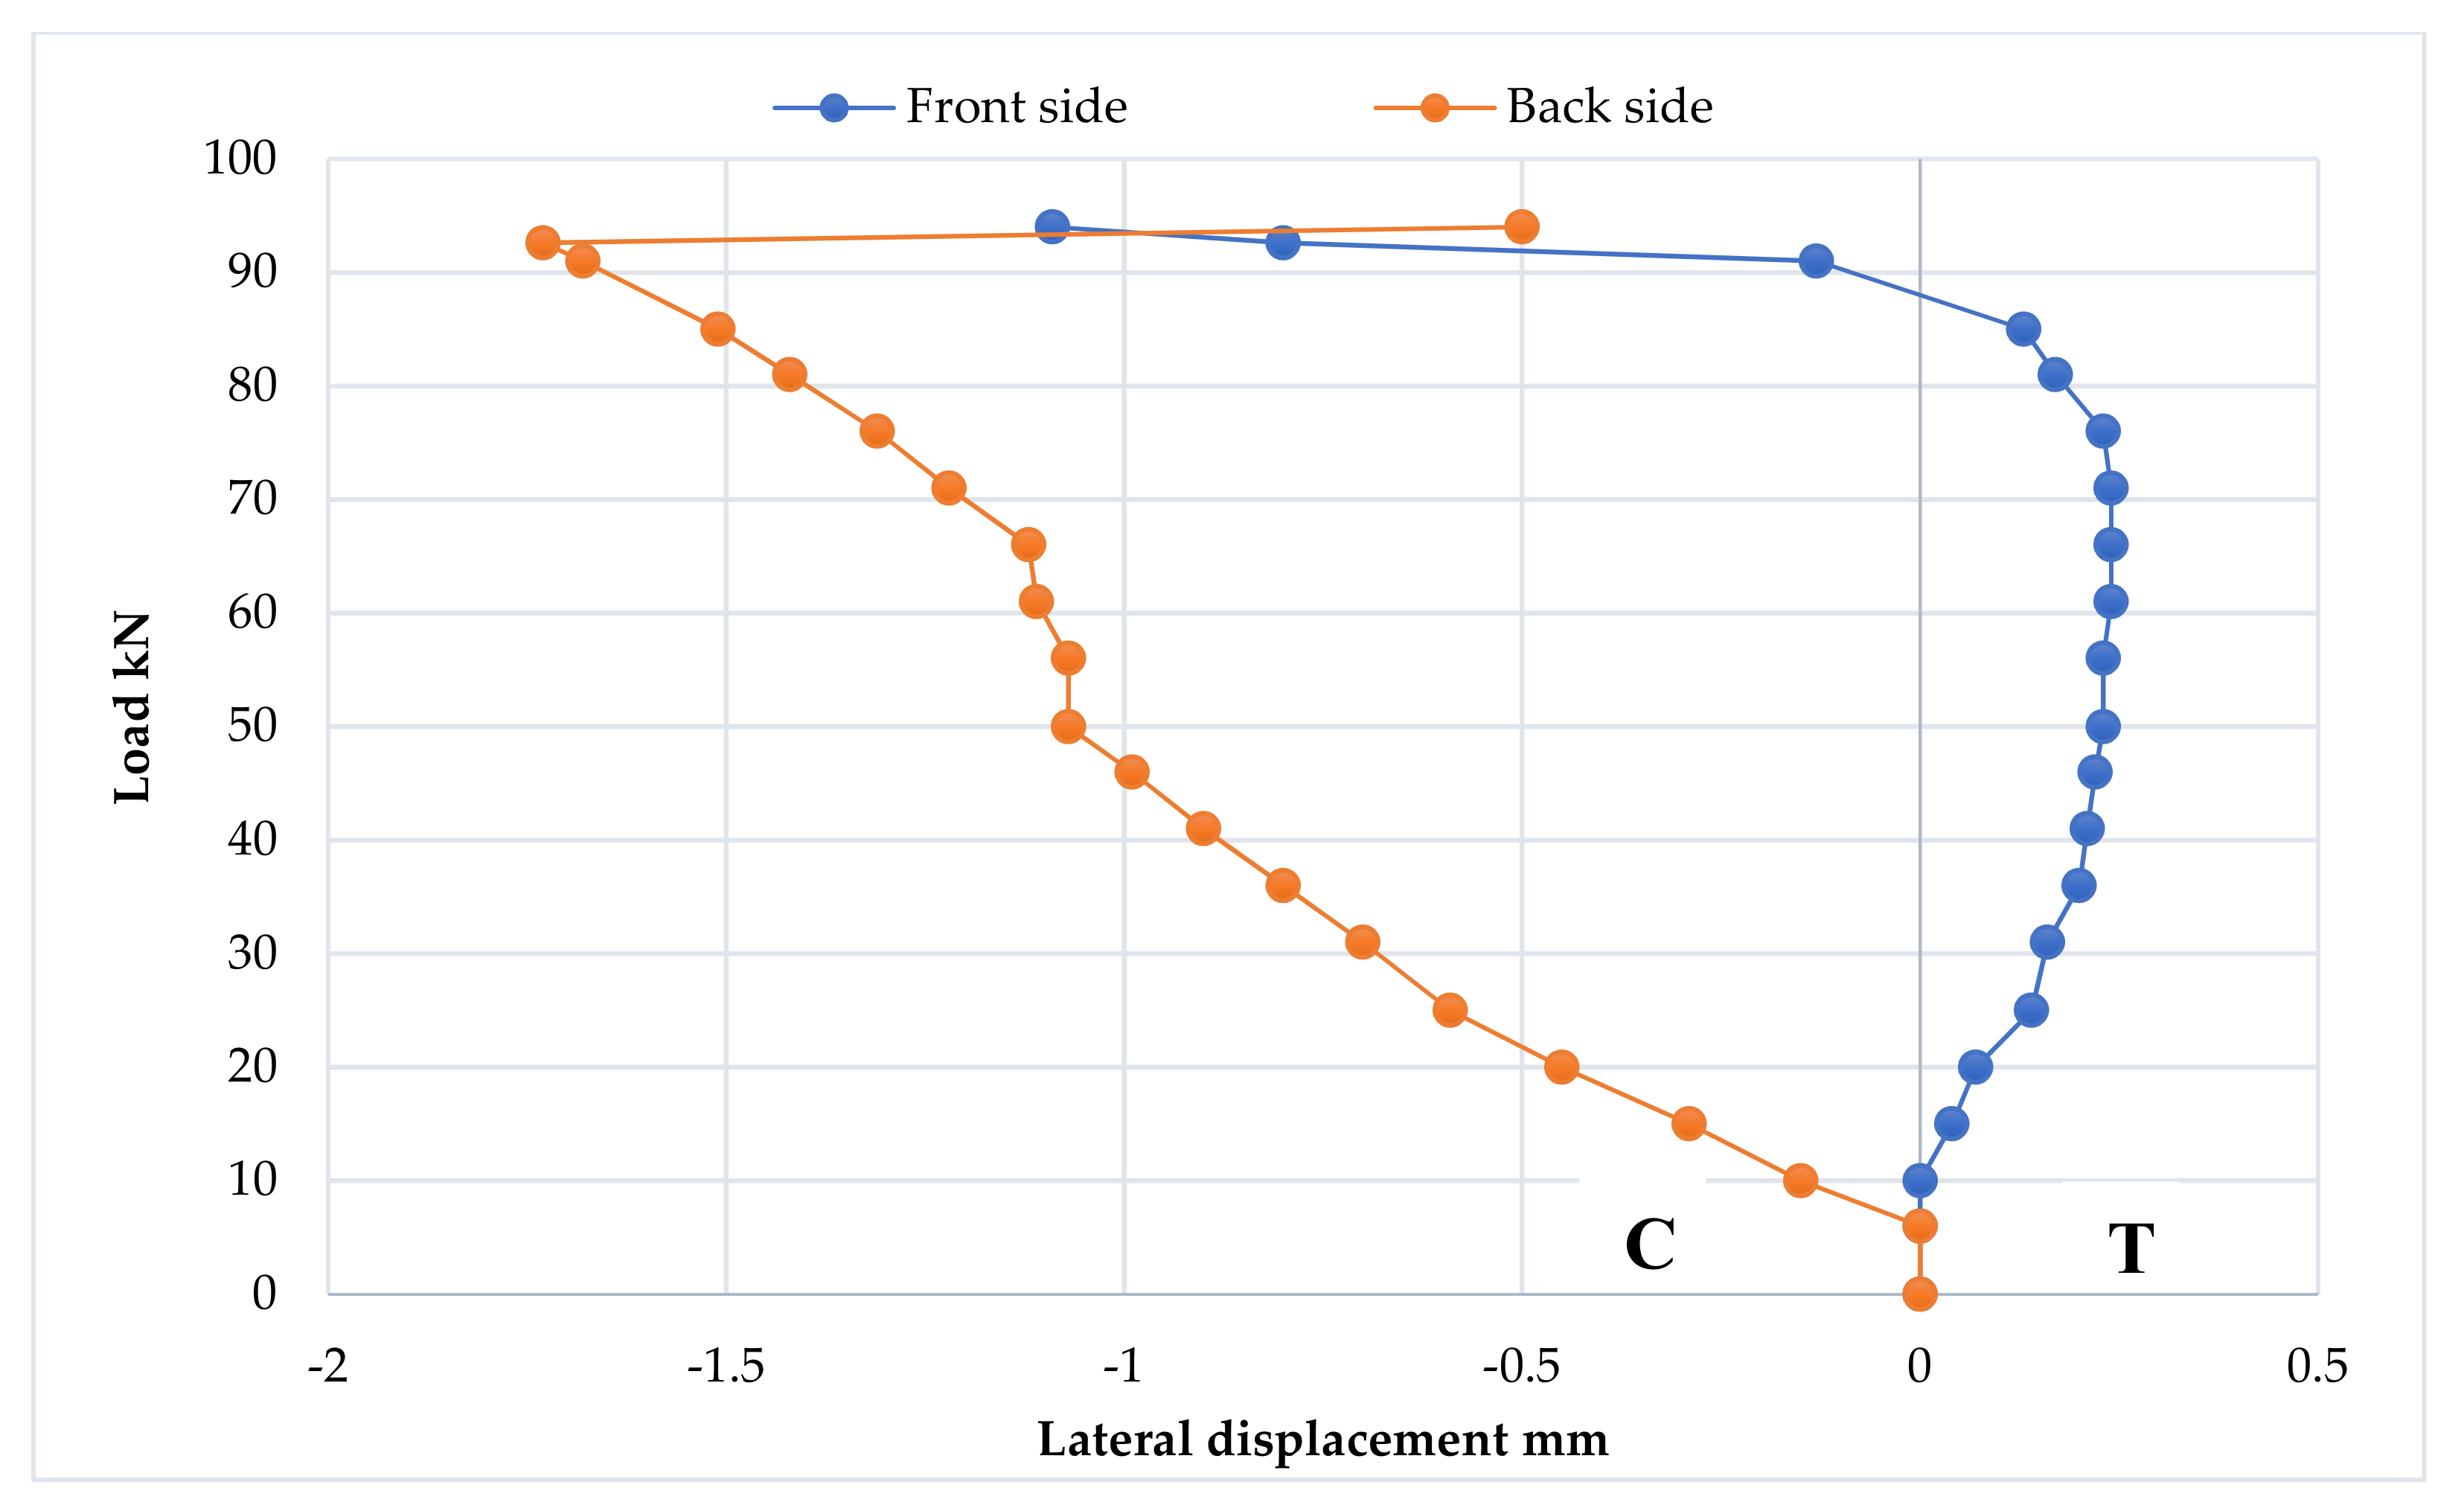
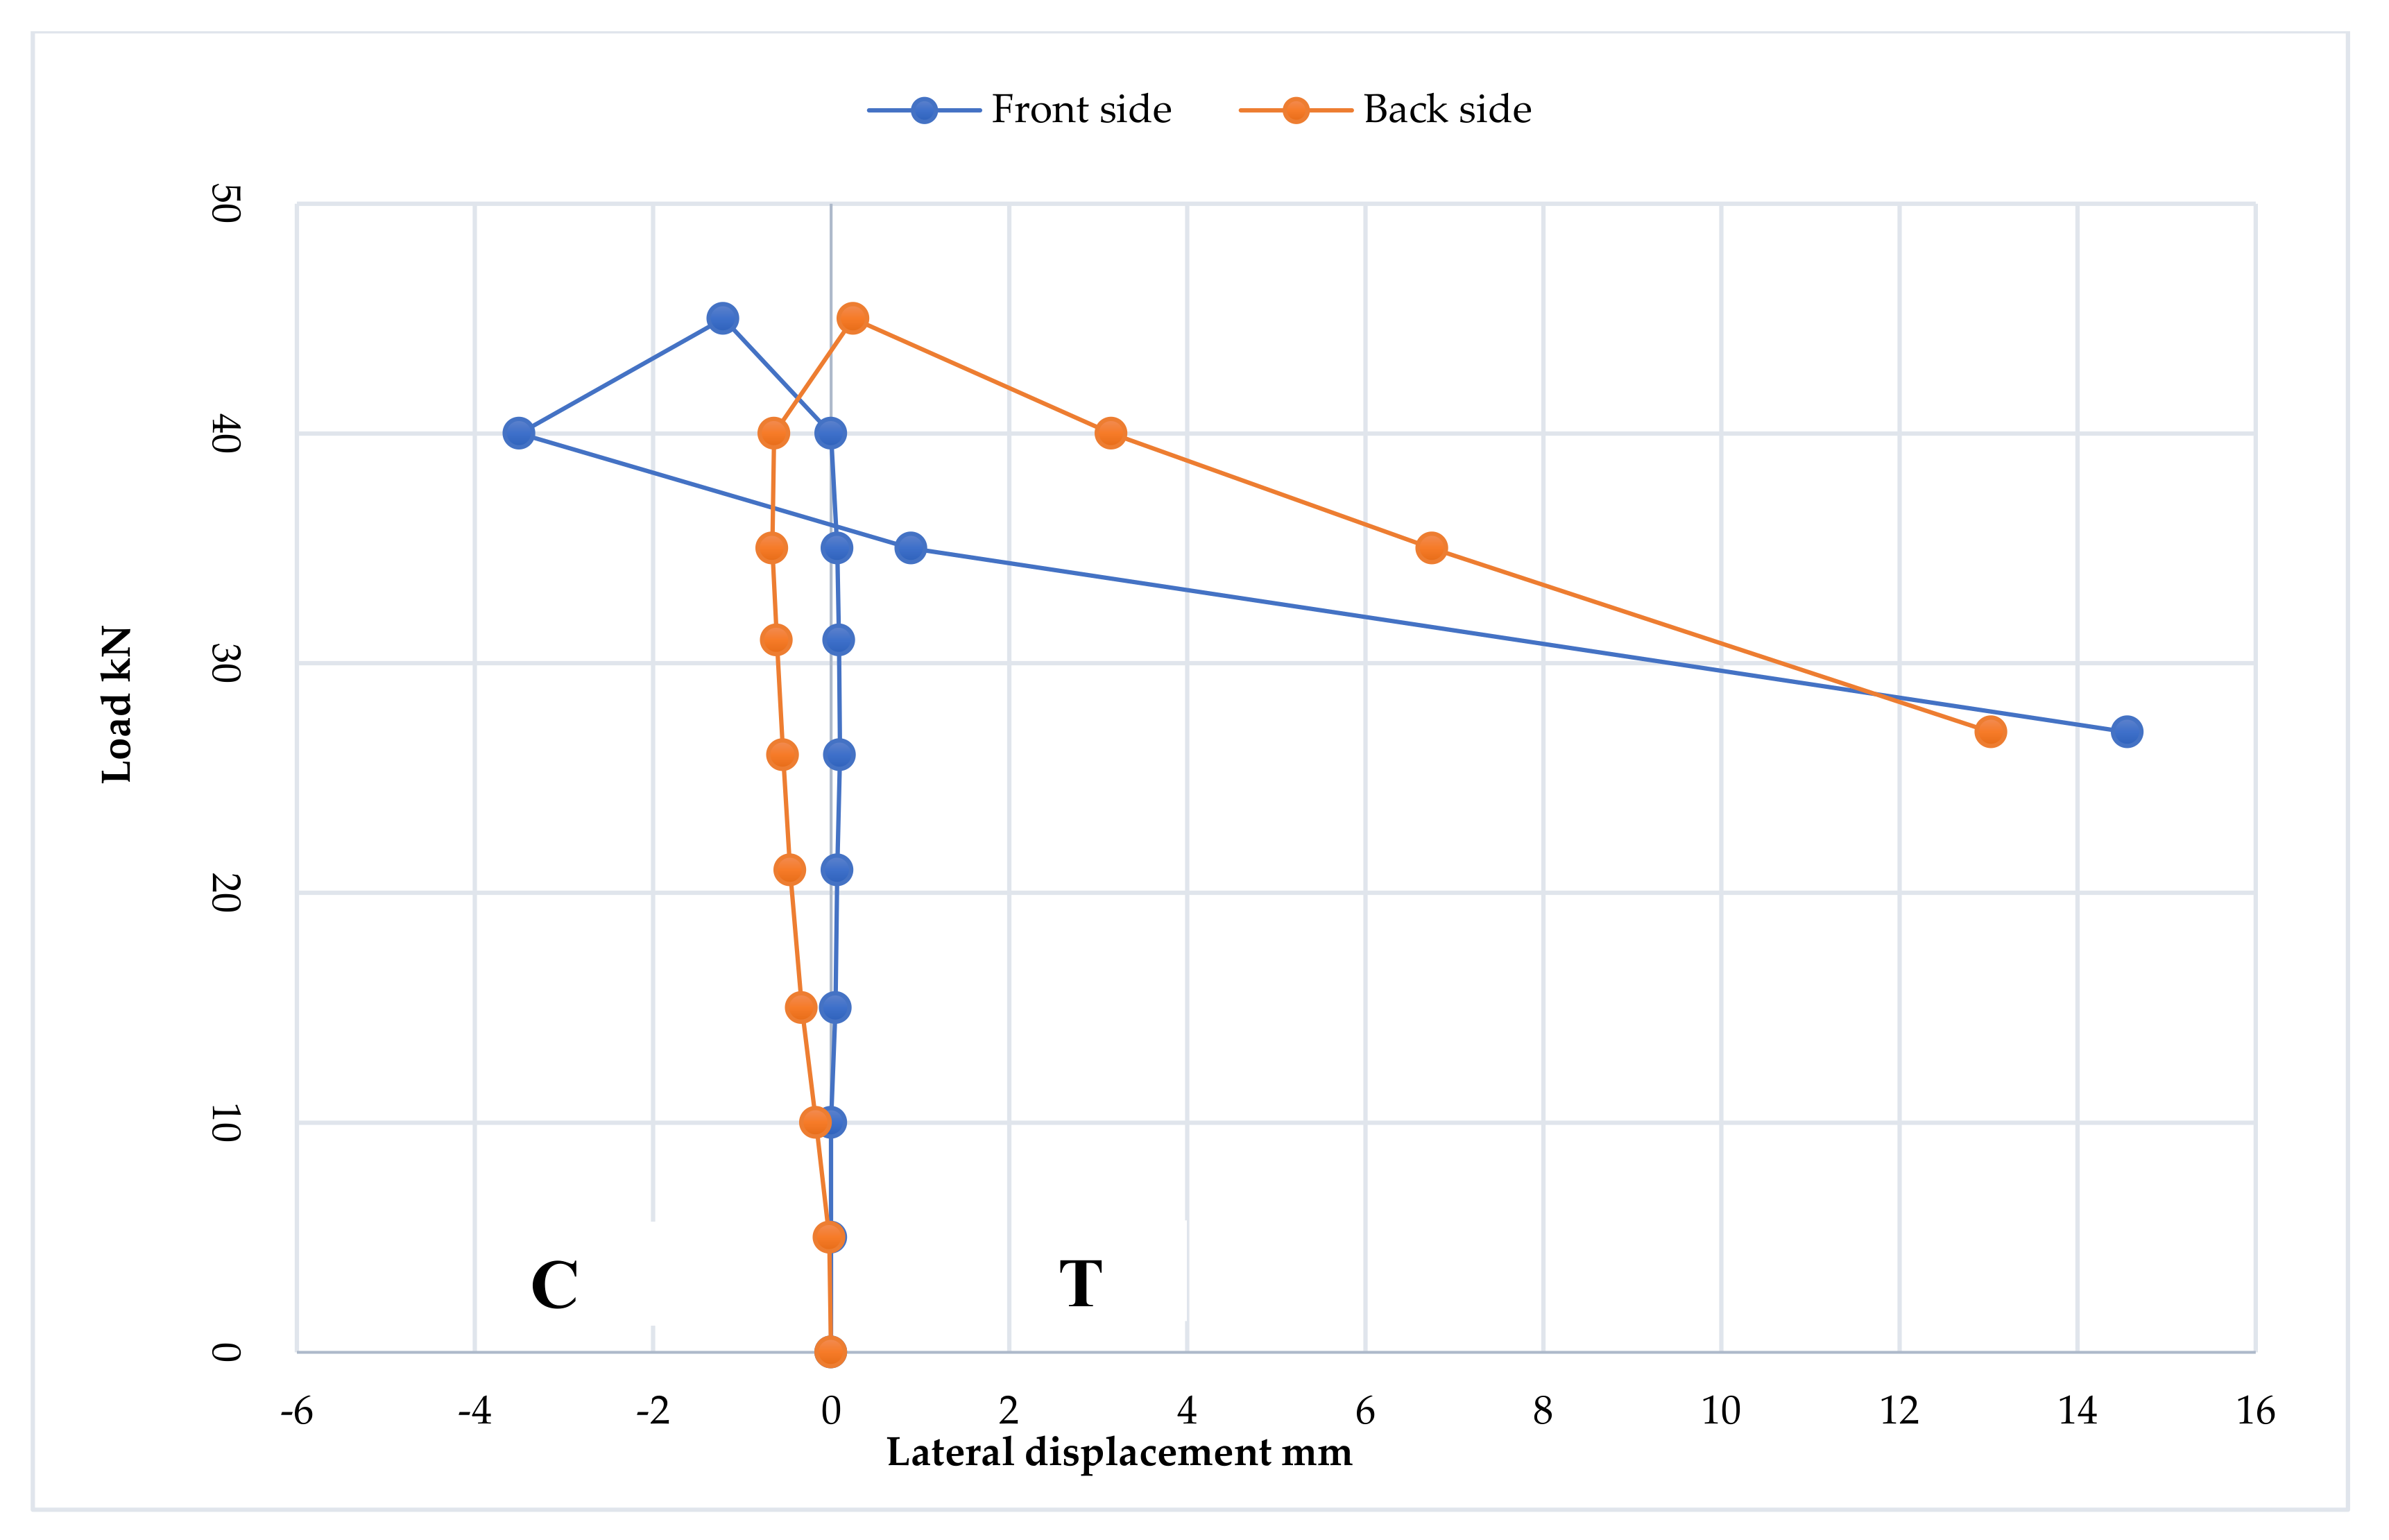
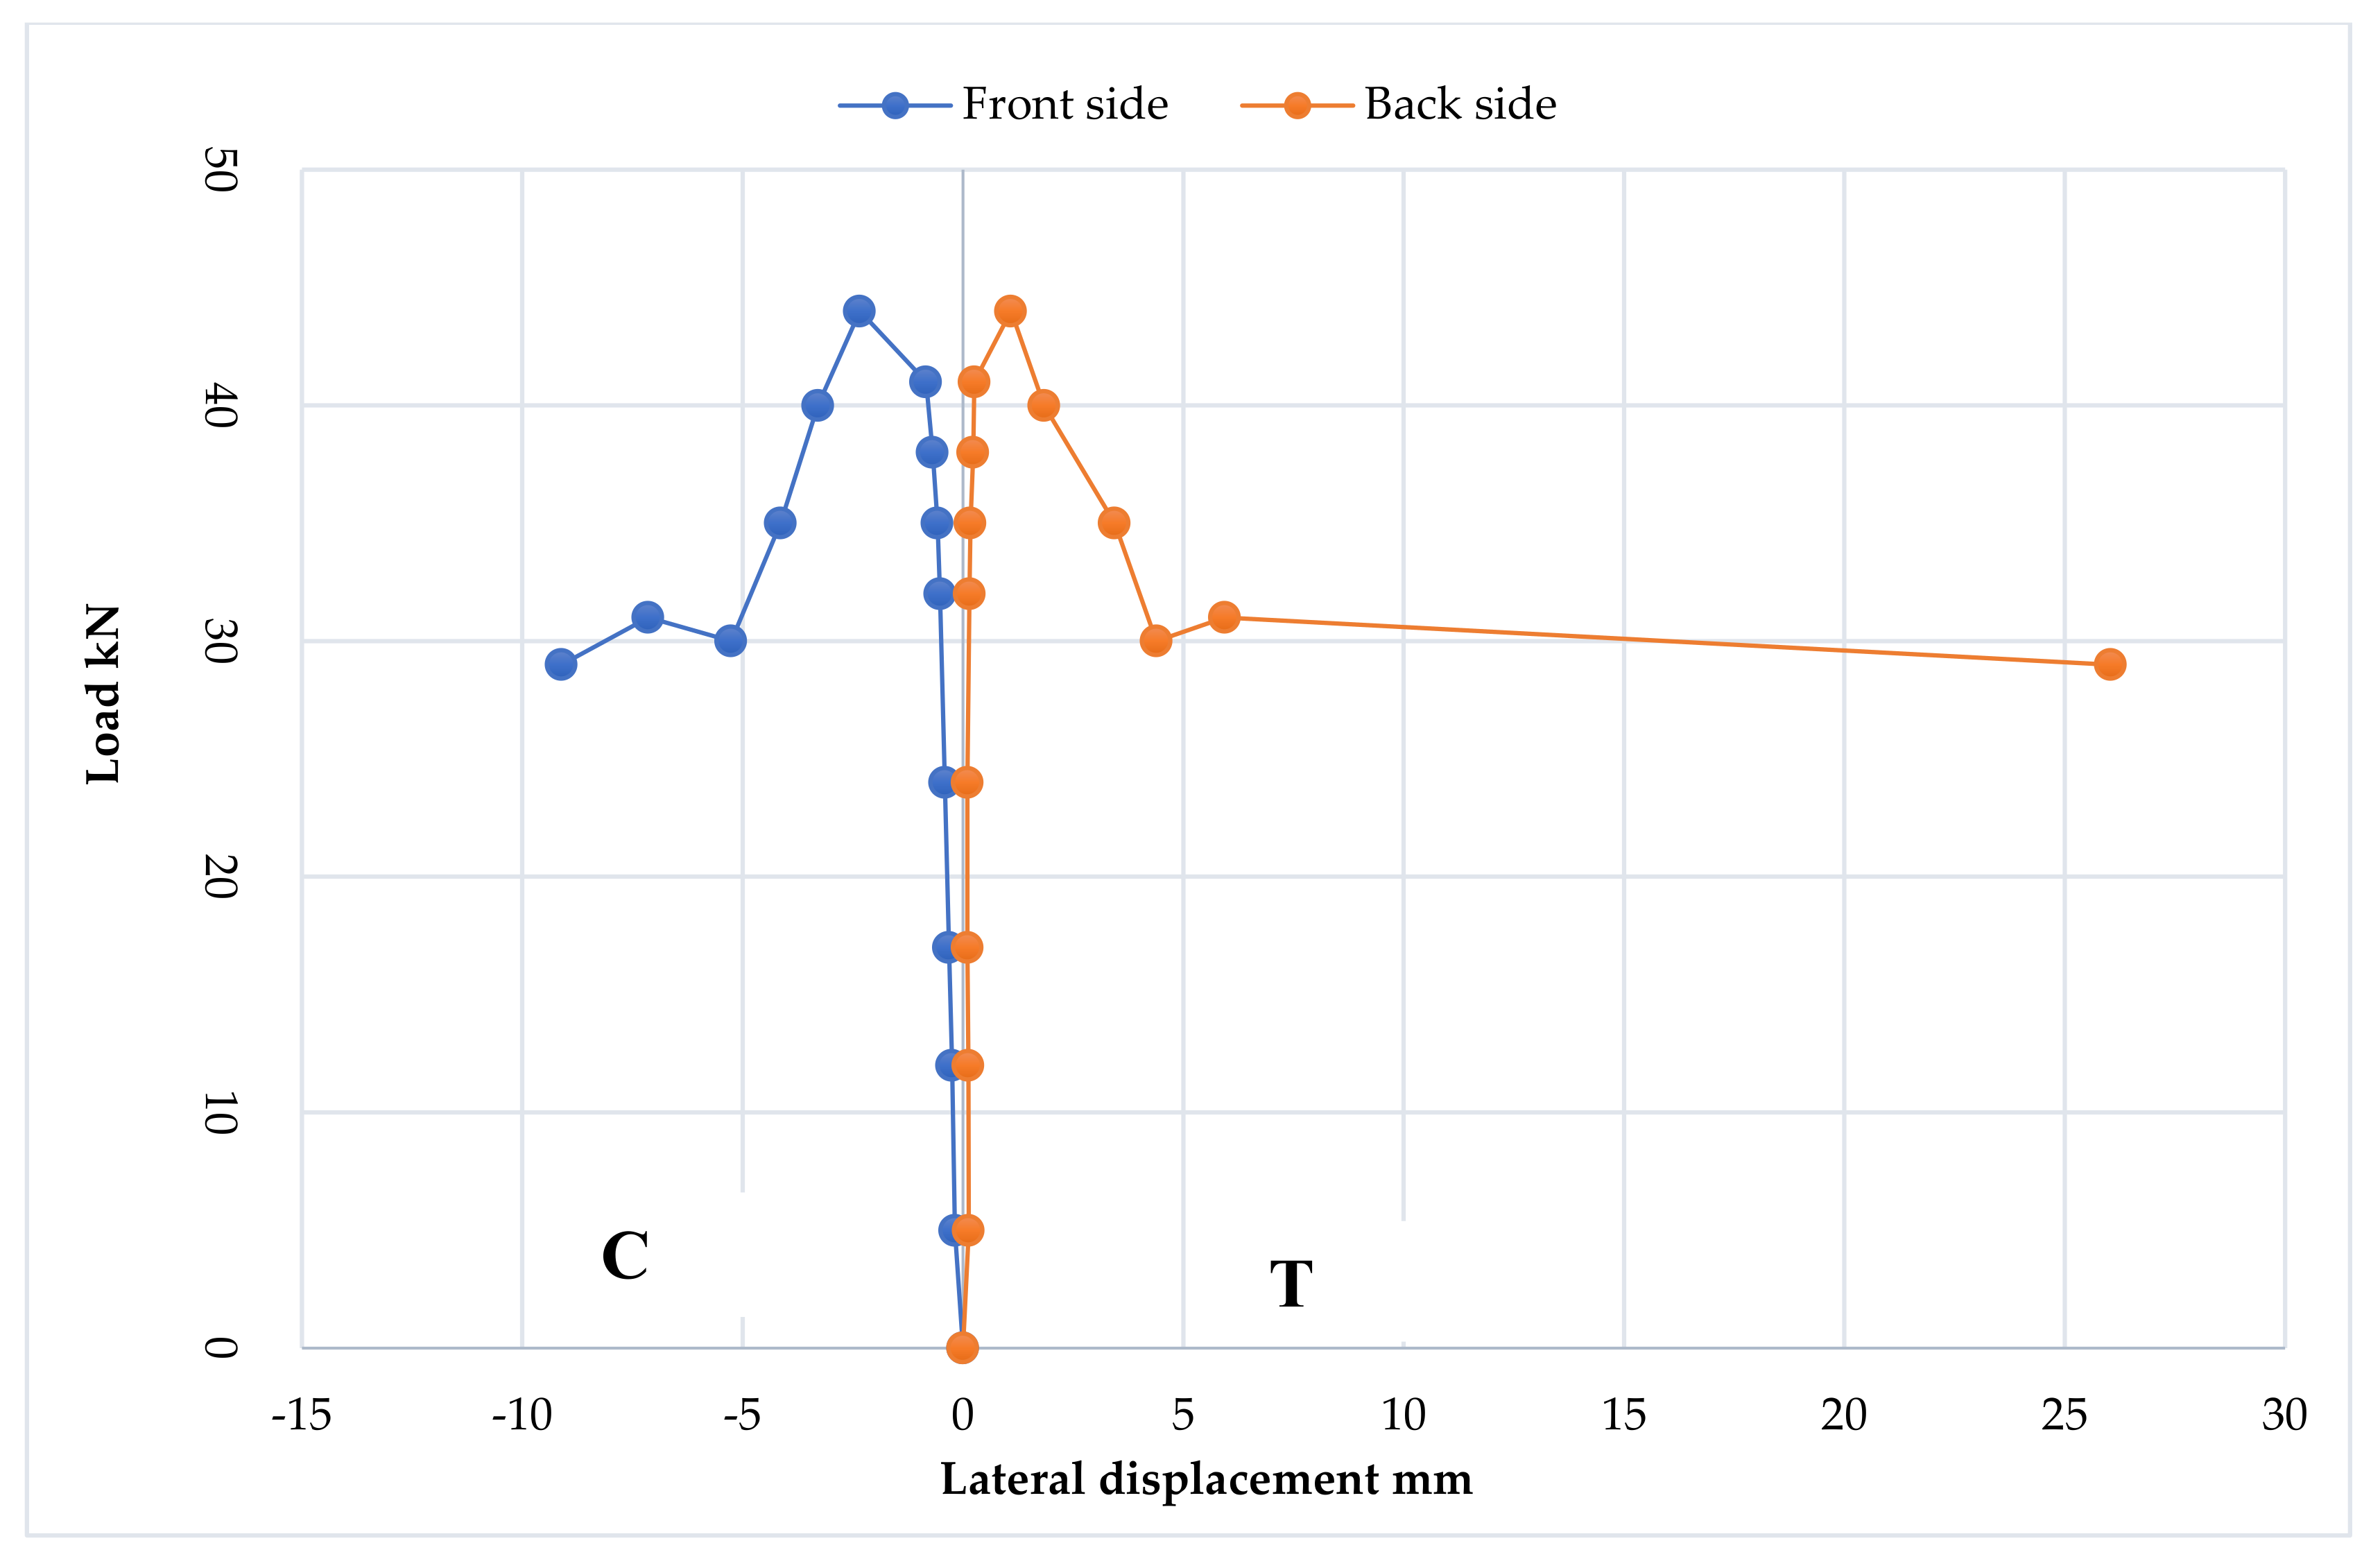
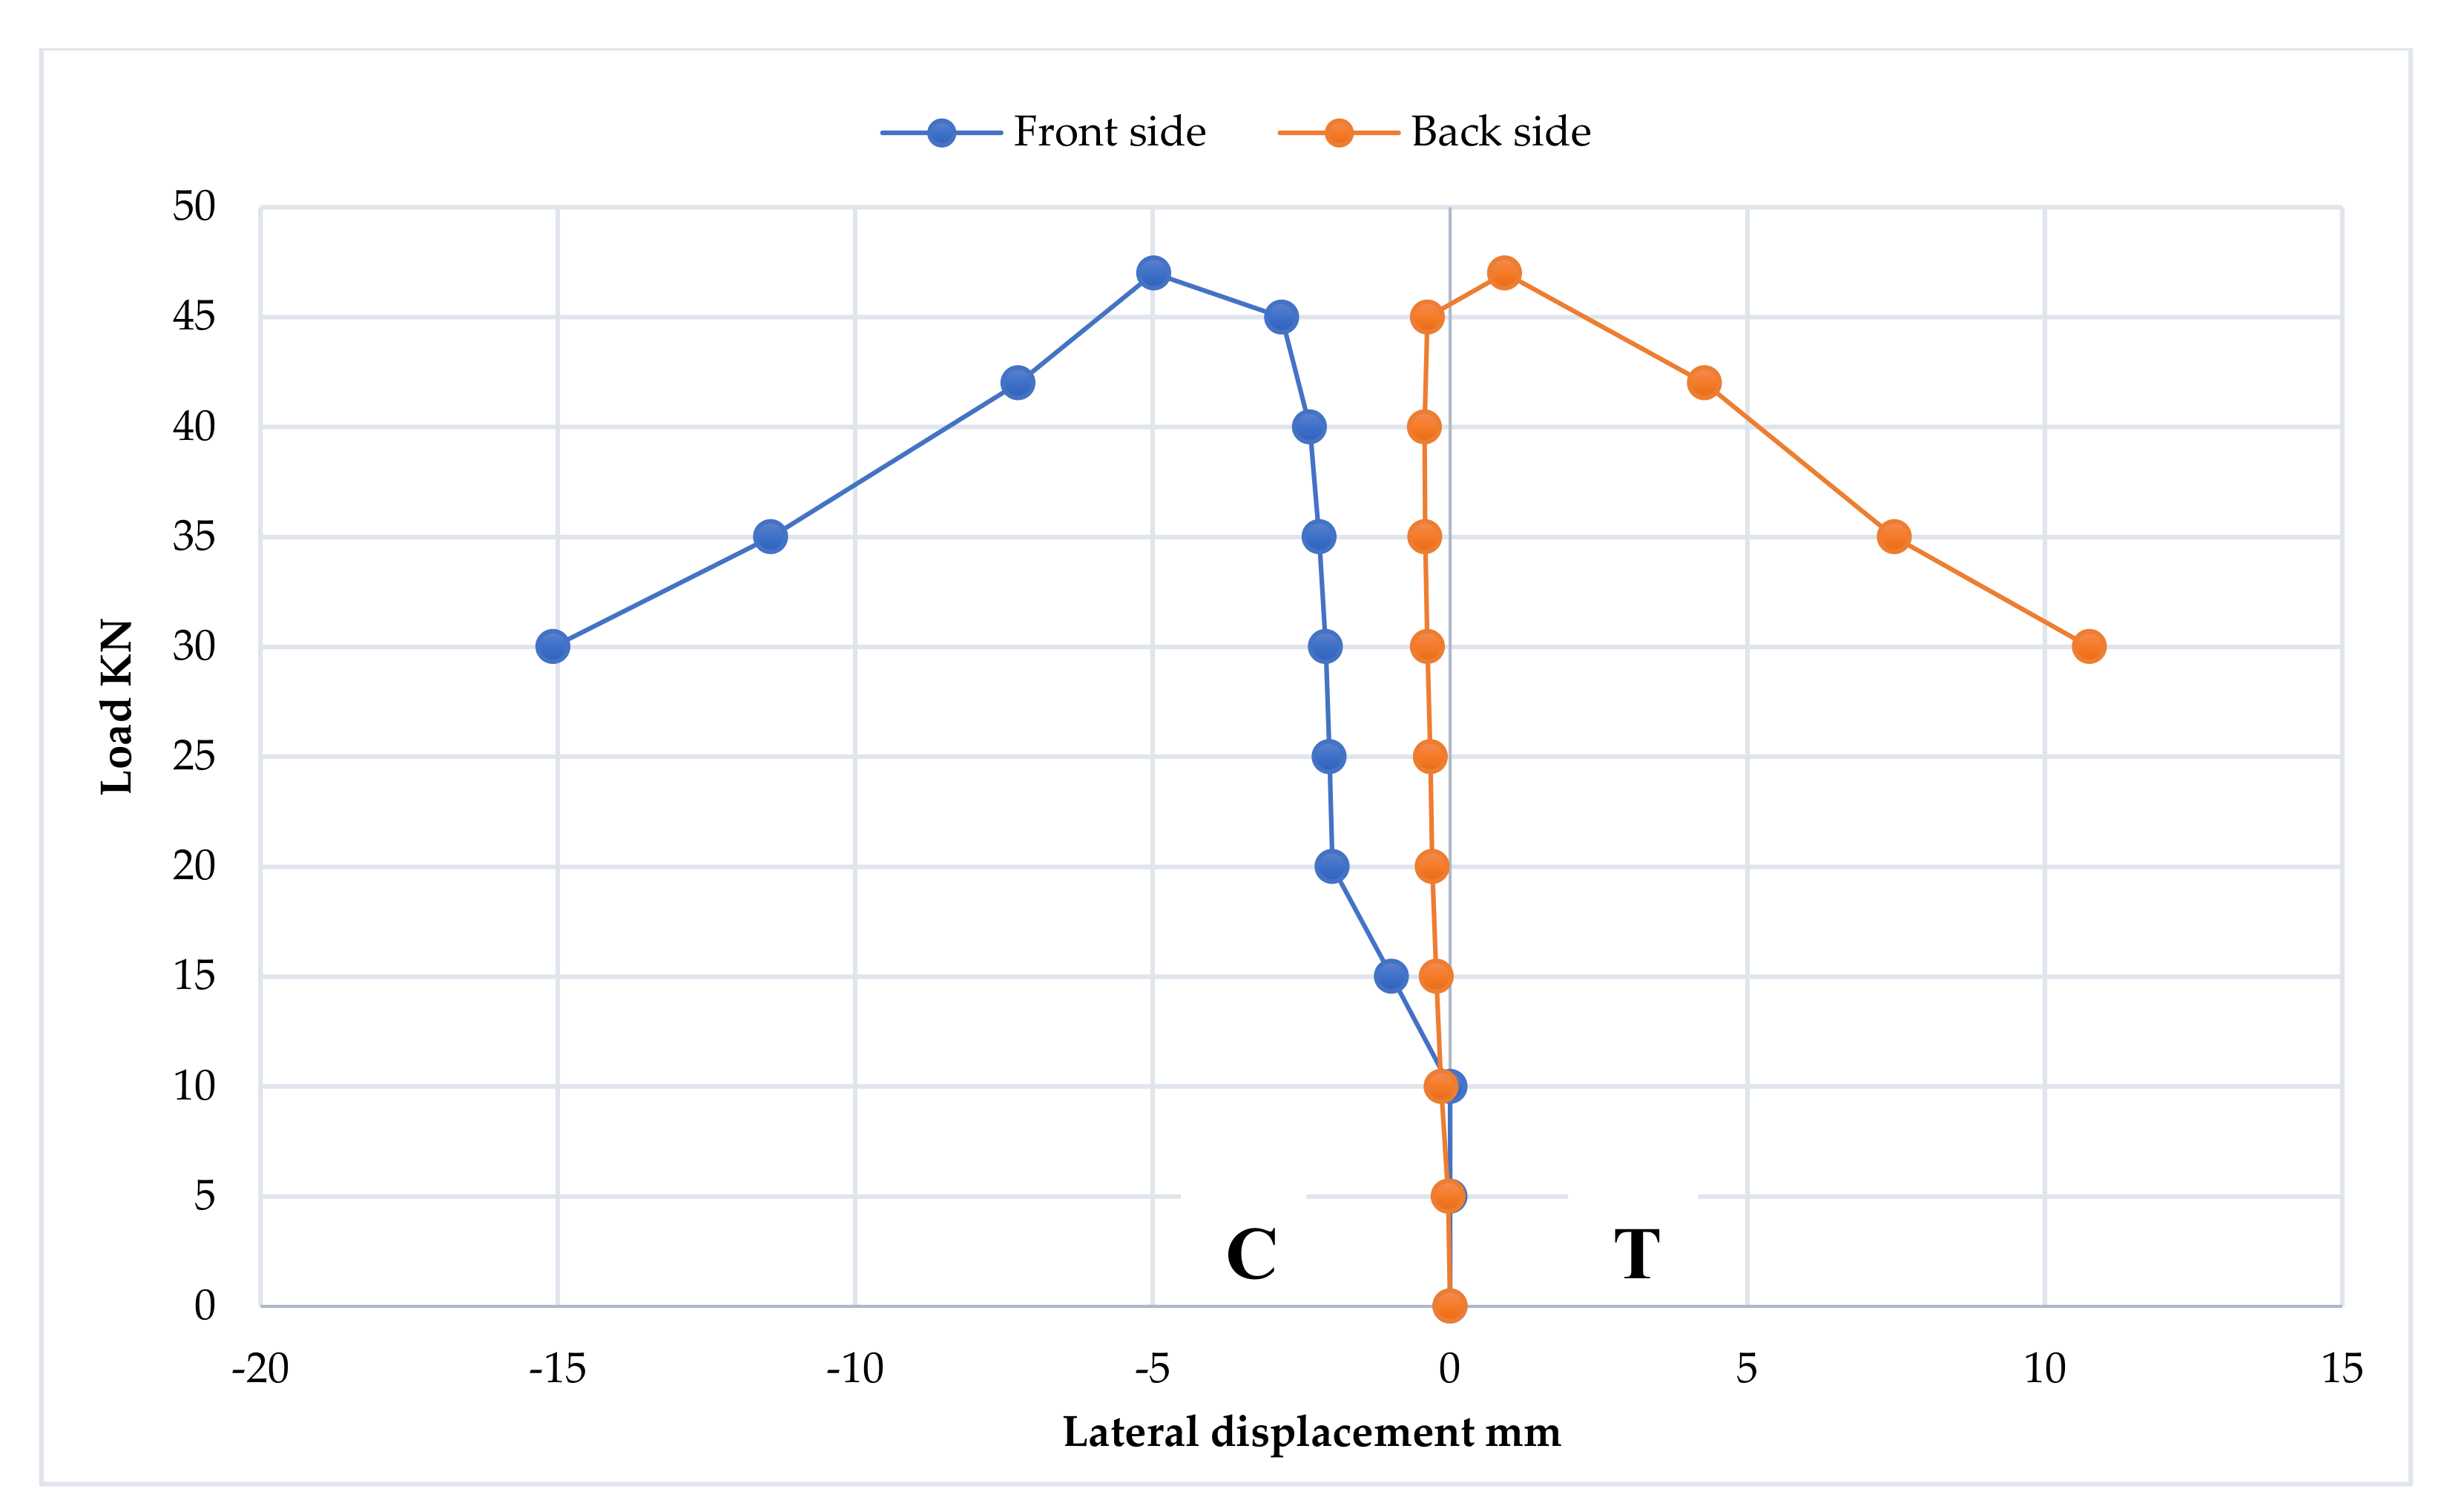
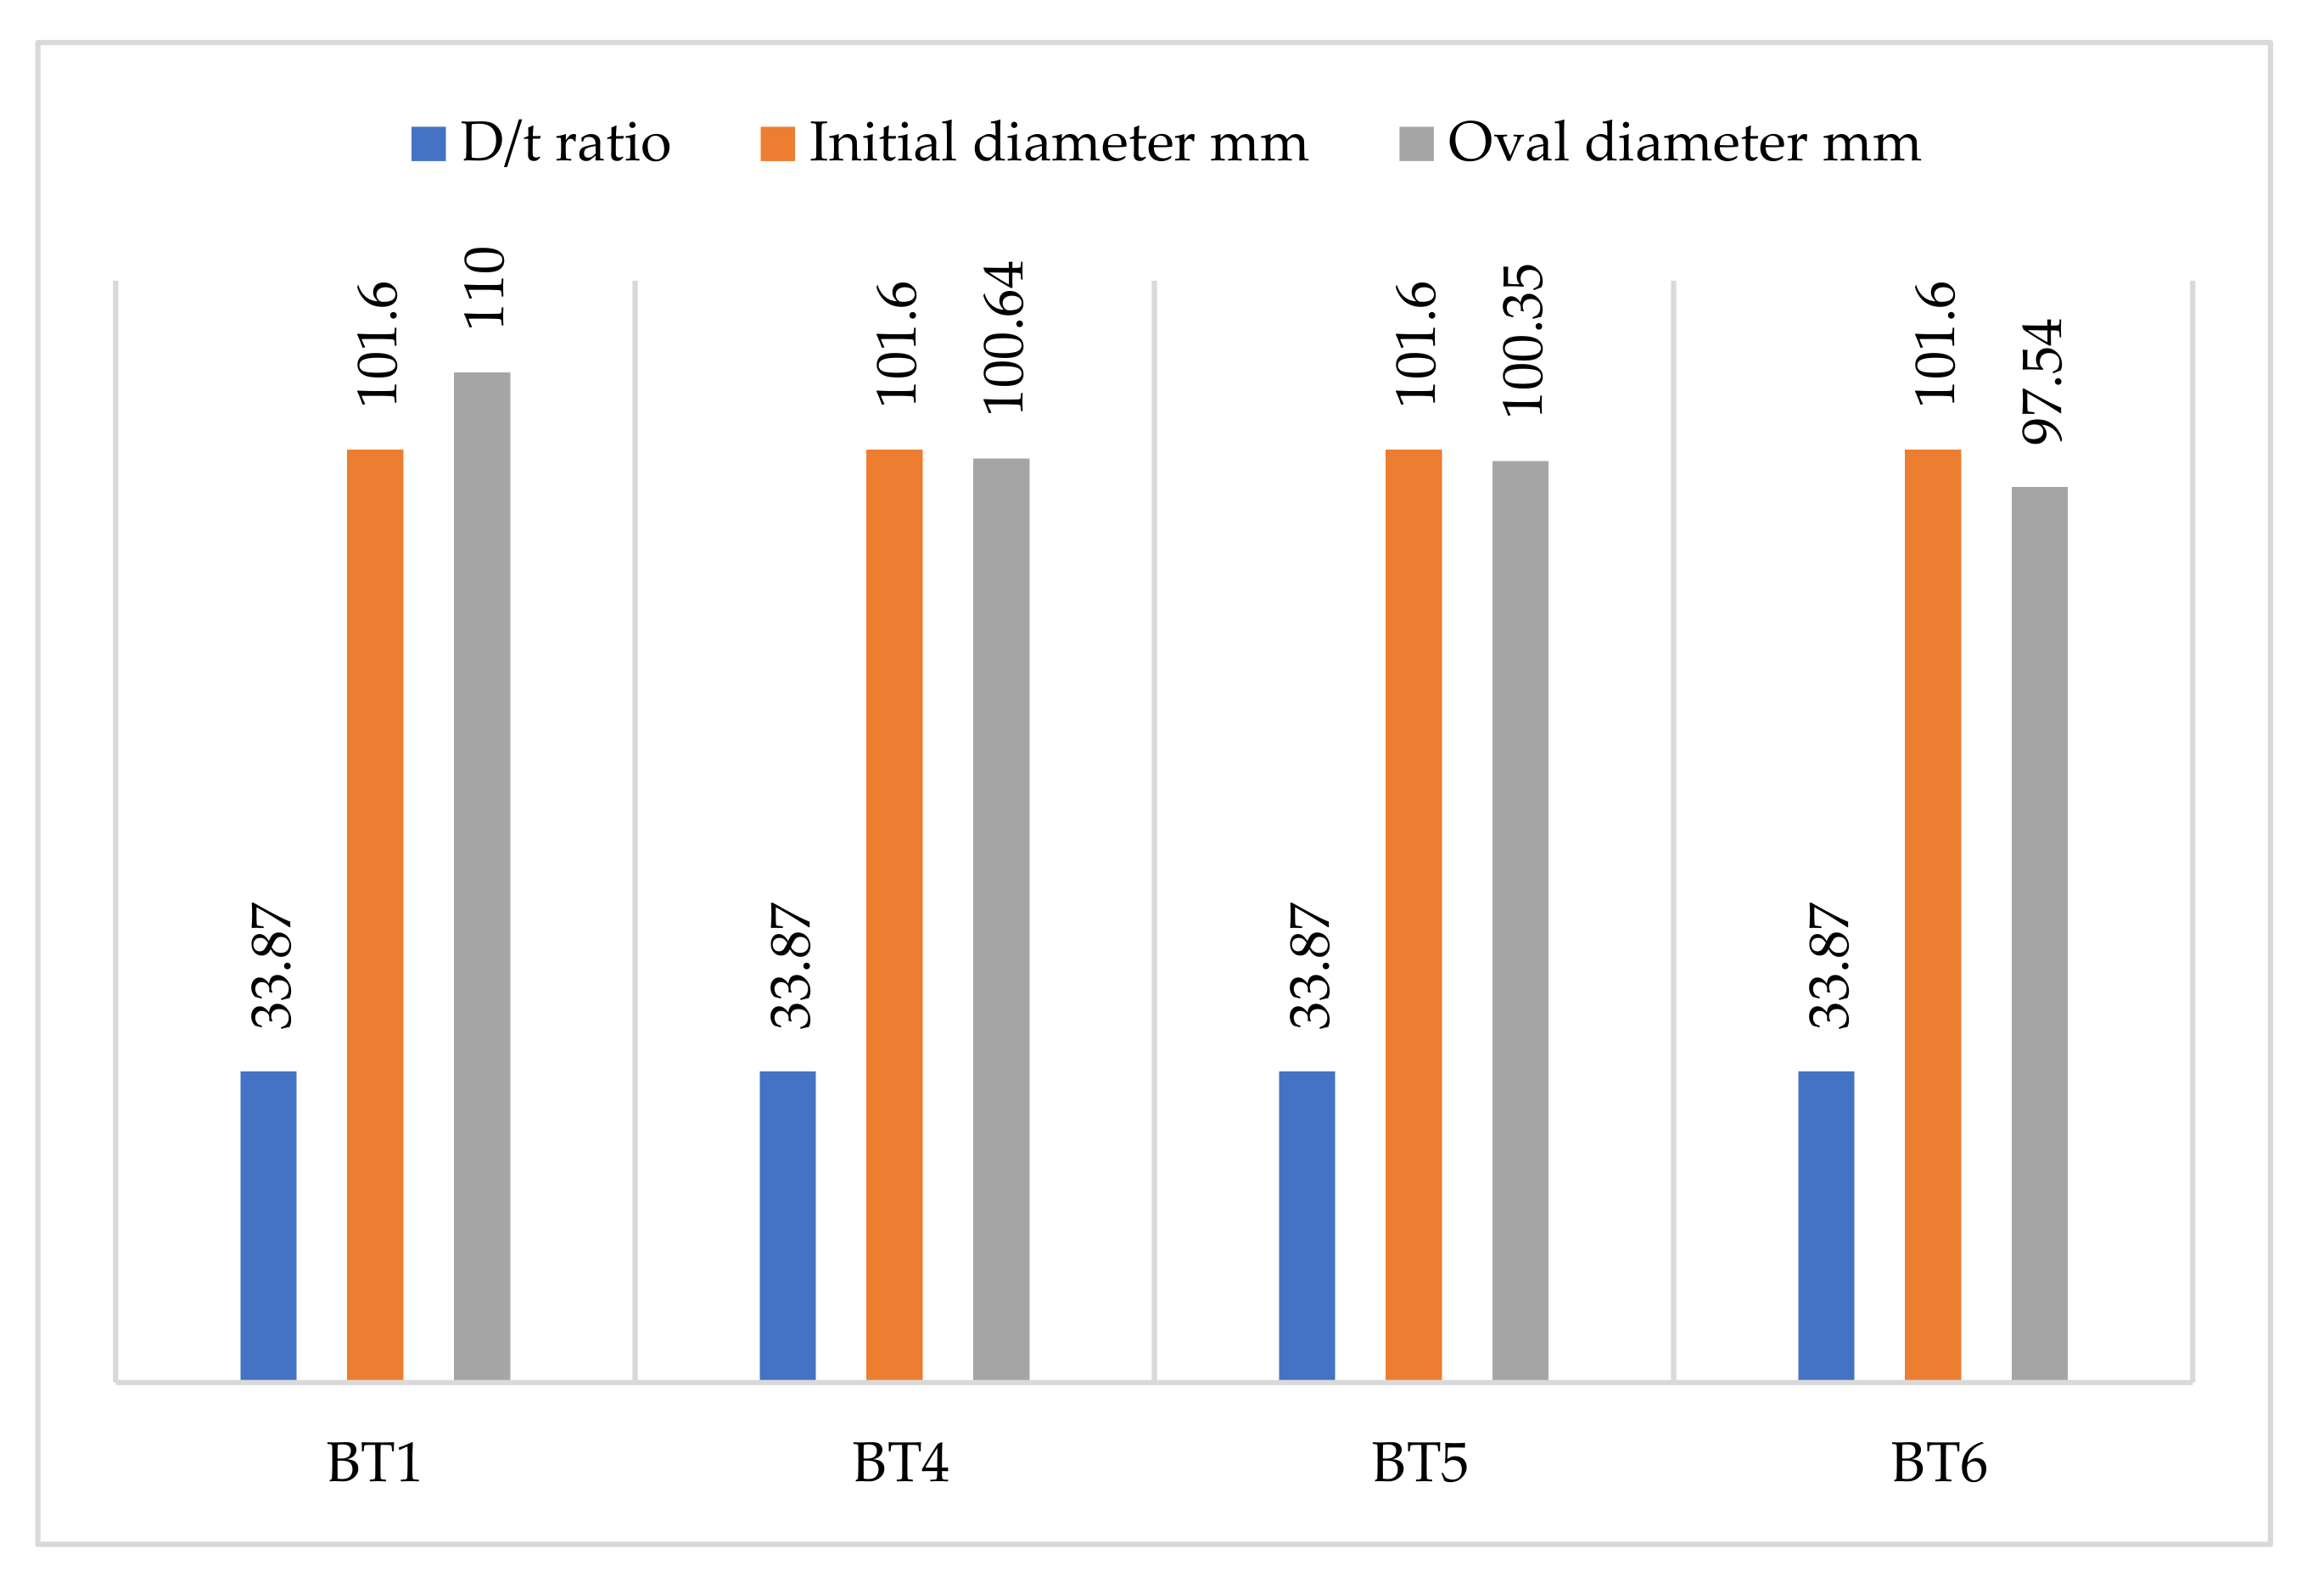
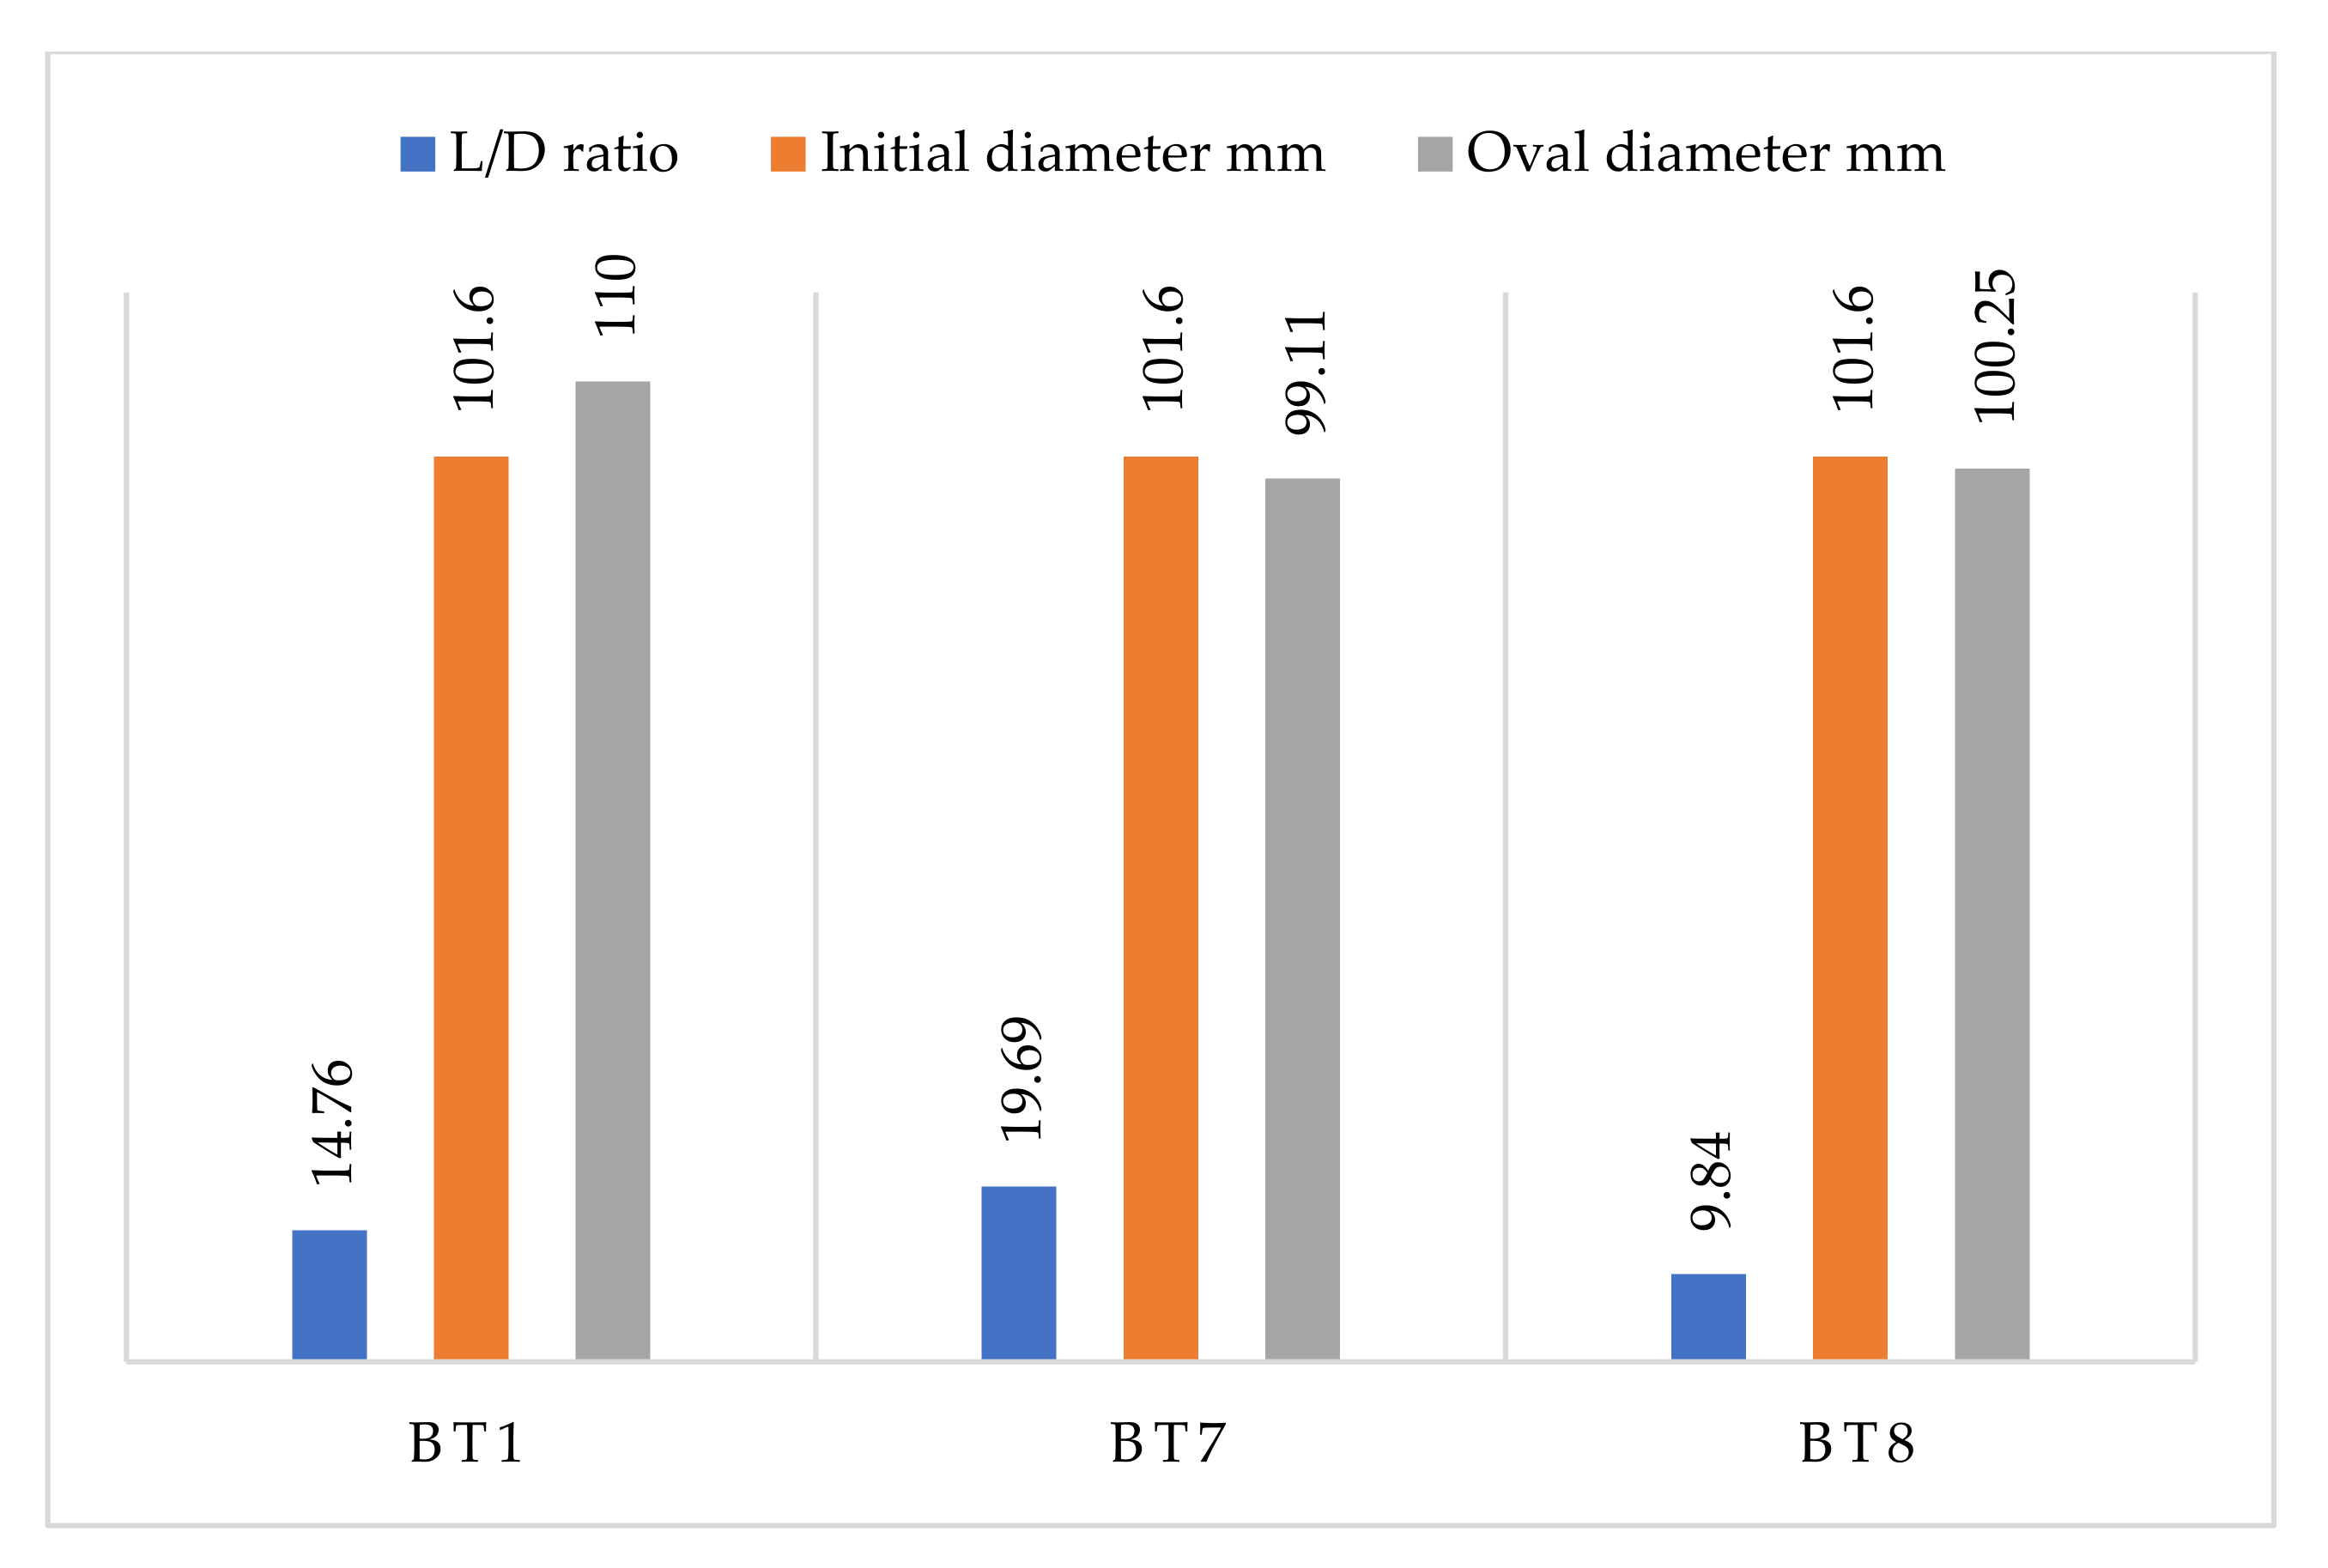
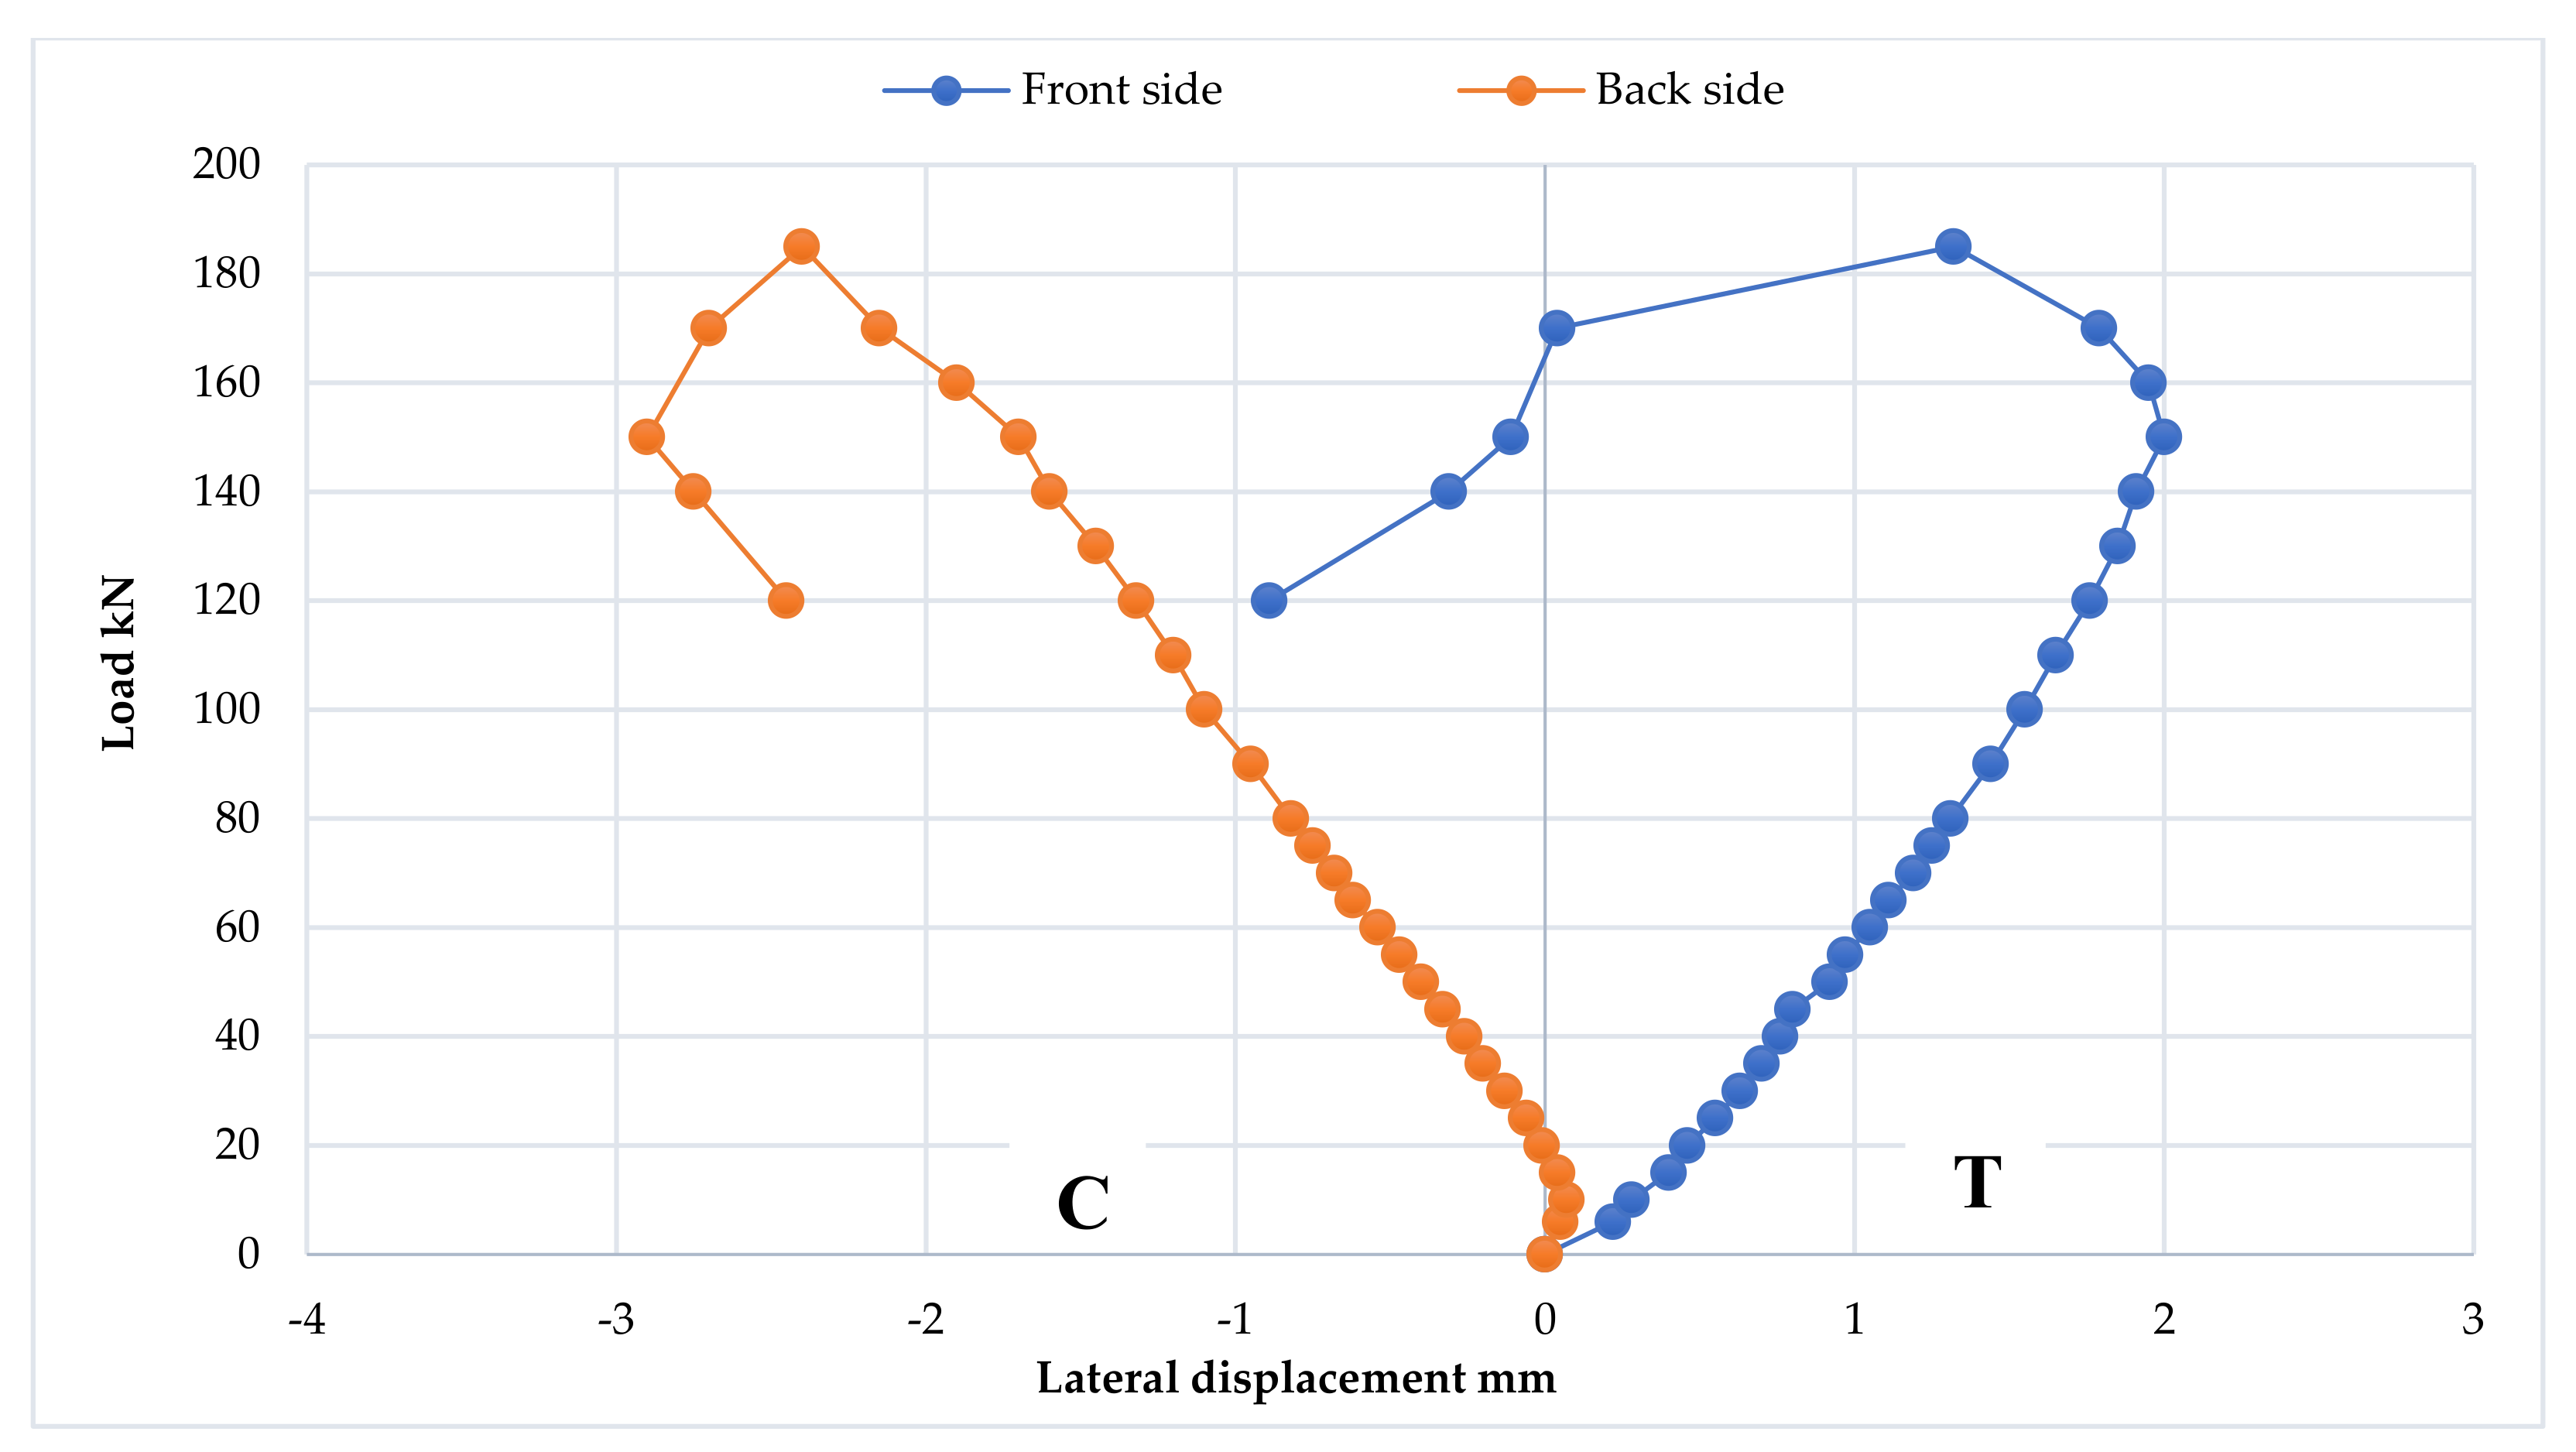
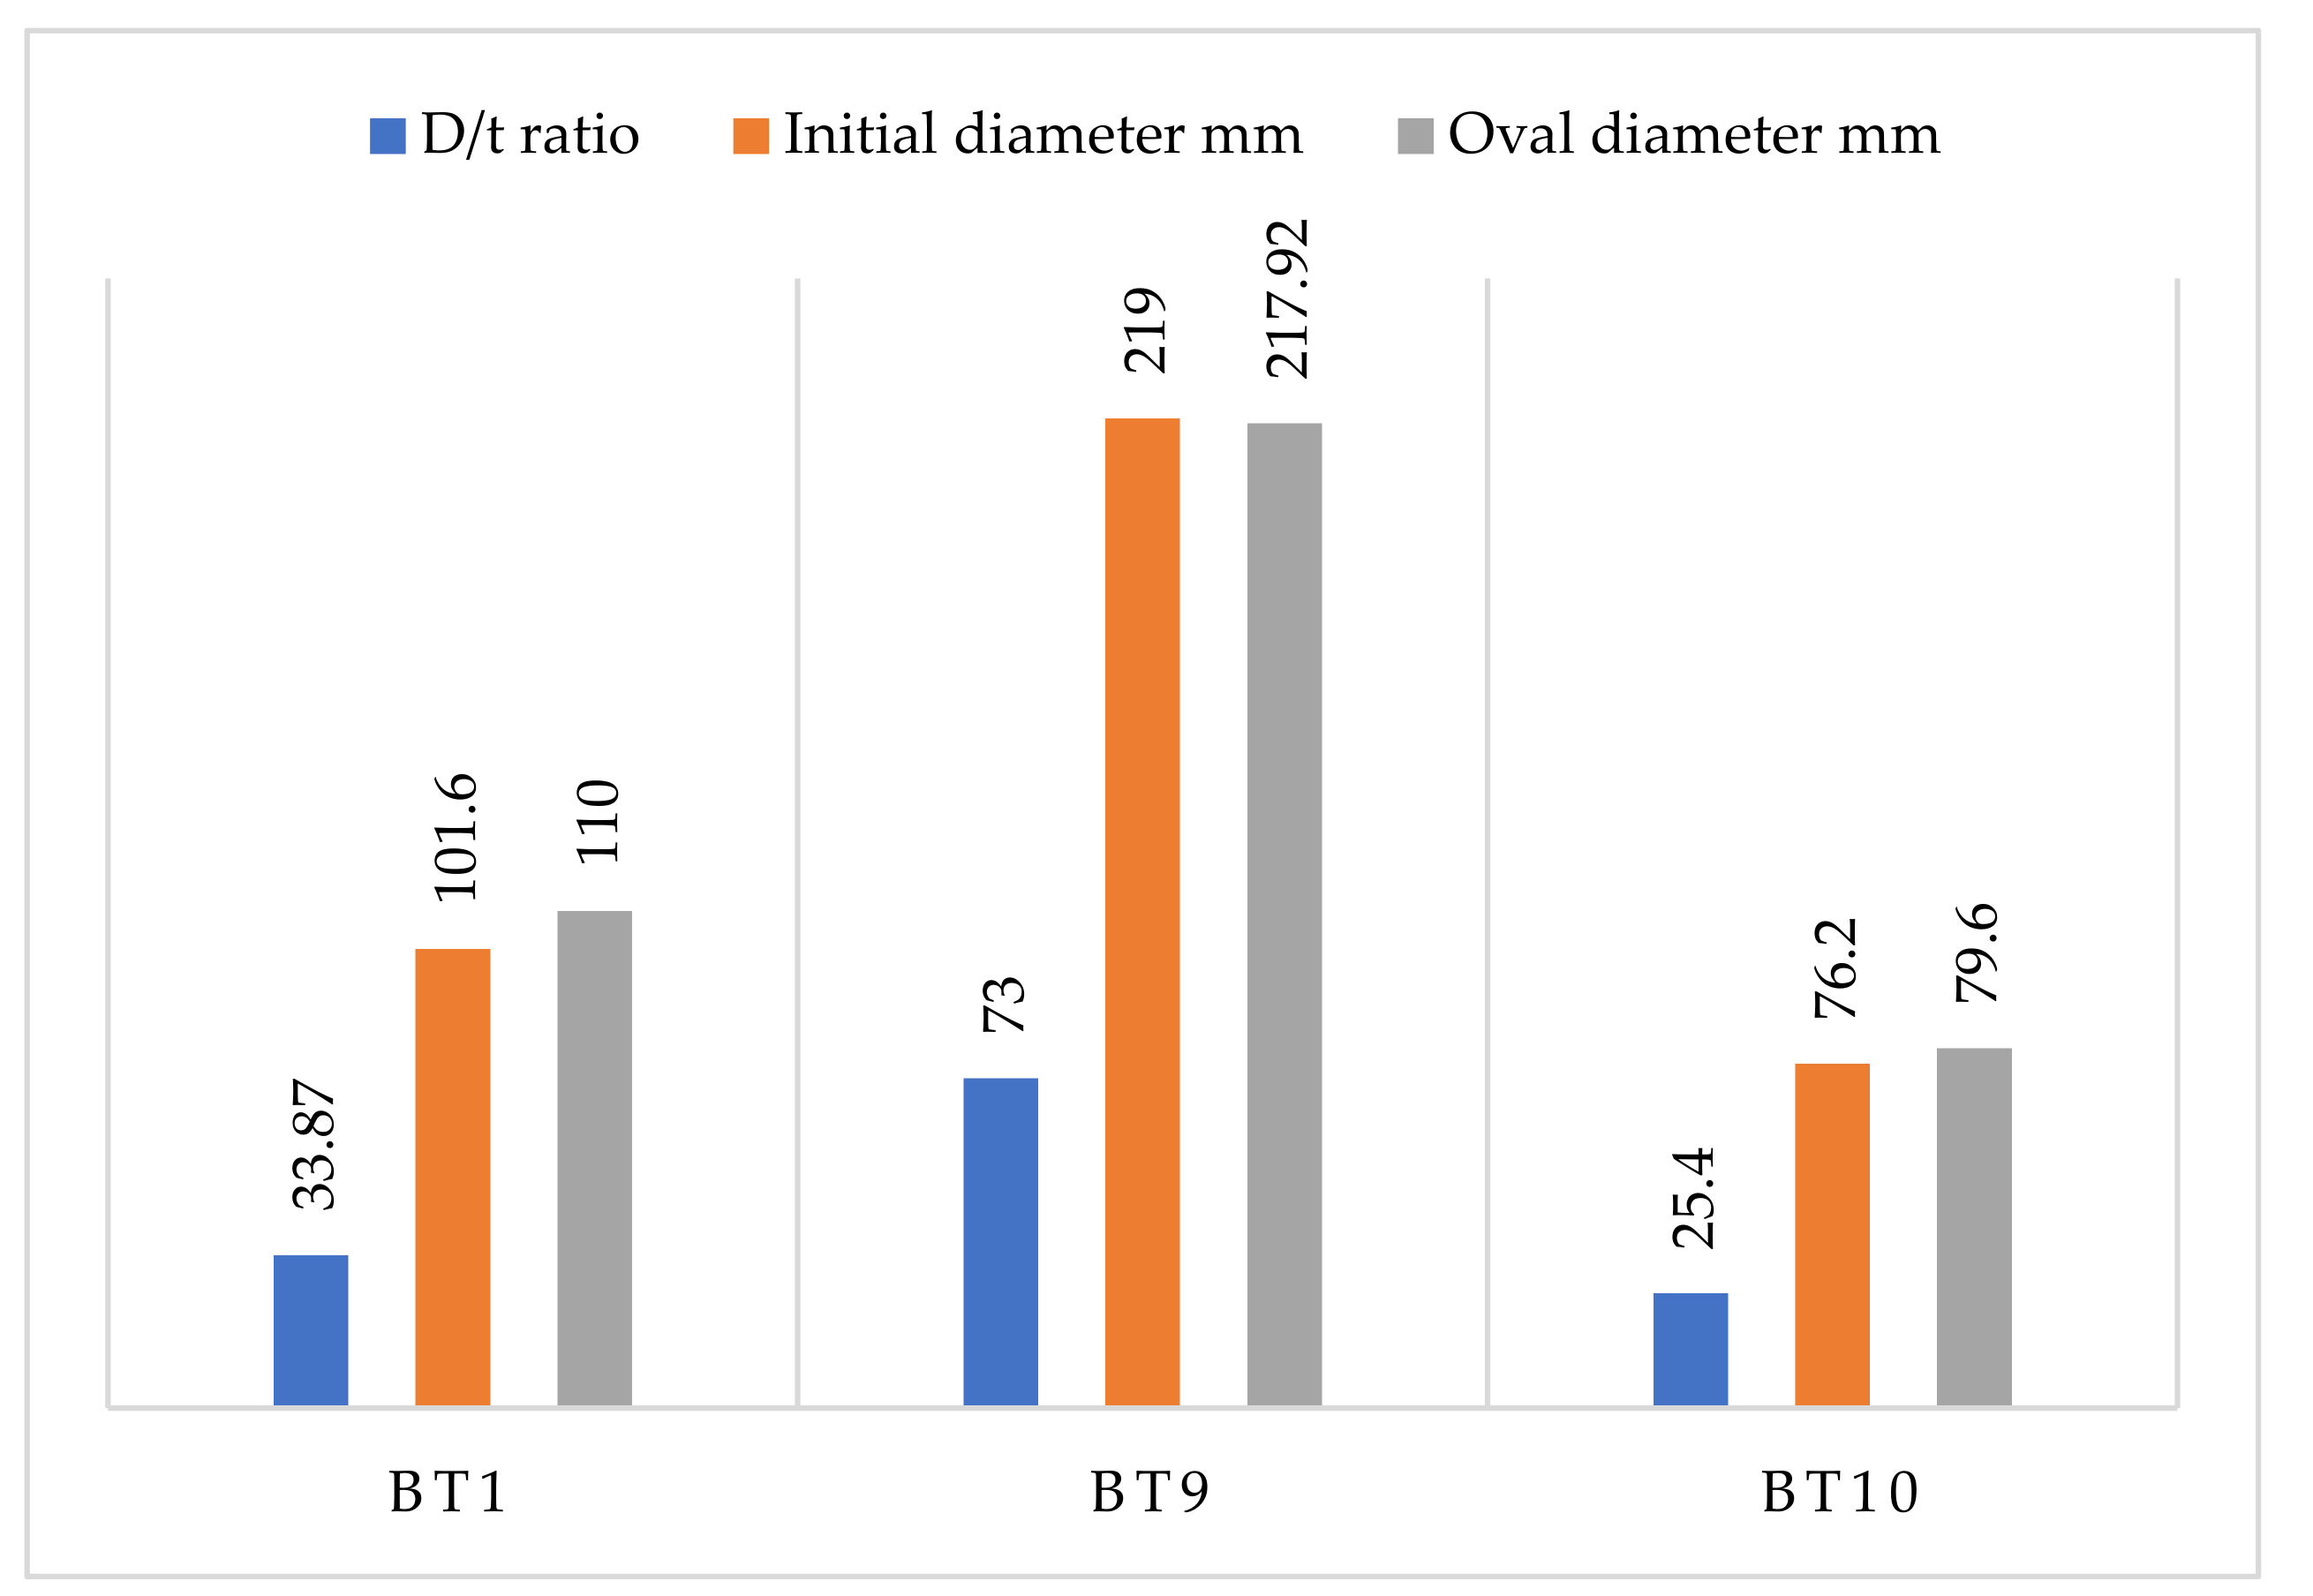
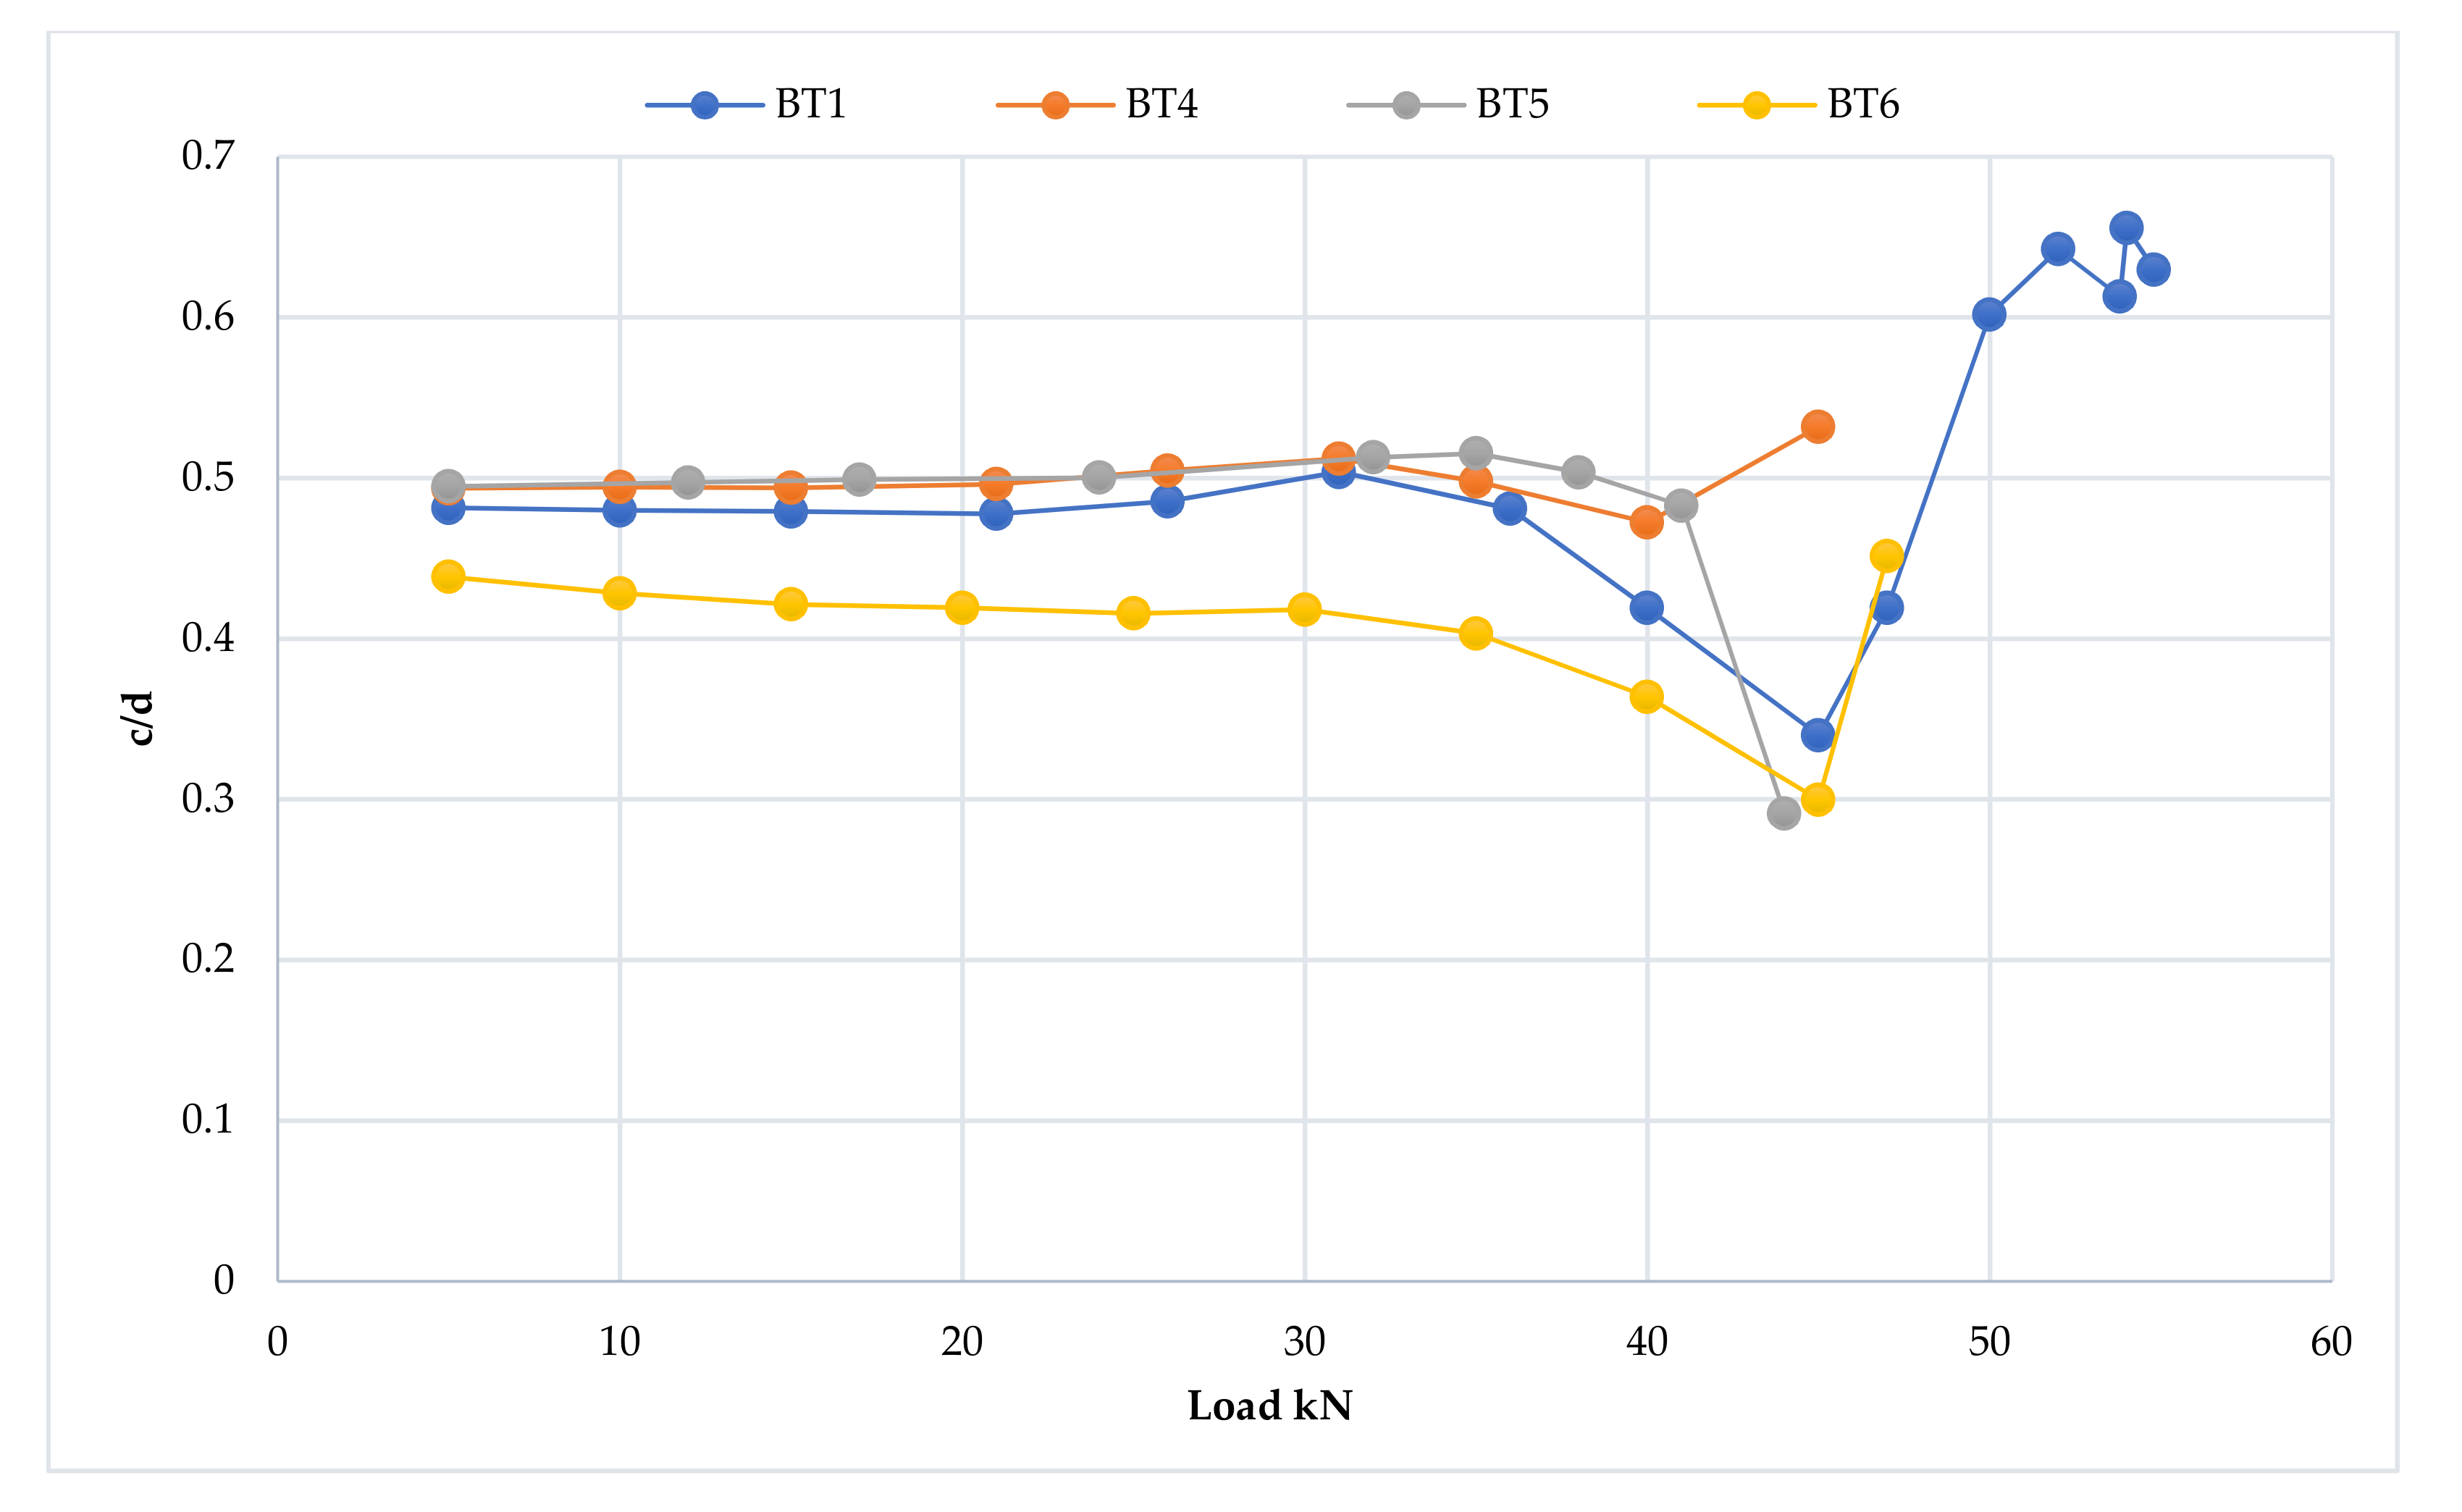
3.2.5. Cross-Section Ovalization Behavior
3.3. Results of the Second Investigated Group
3.3.1. Load–Deflection Curve
- 1.
- Elastic stage
- 2.
- The ovalization stage
- 3.
- The collapse stage
3.3.2. Ductility
3.3.3. Stiffness
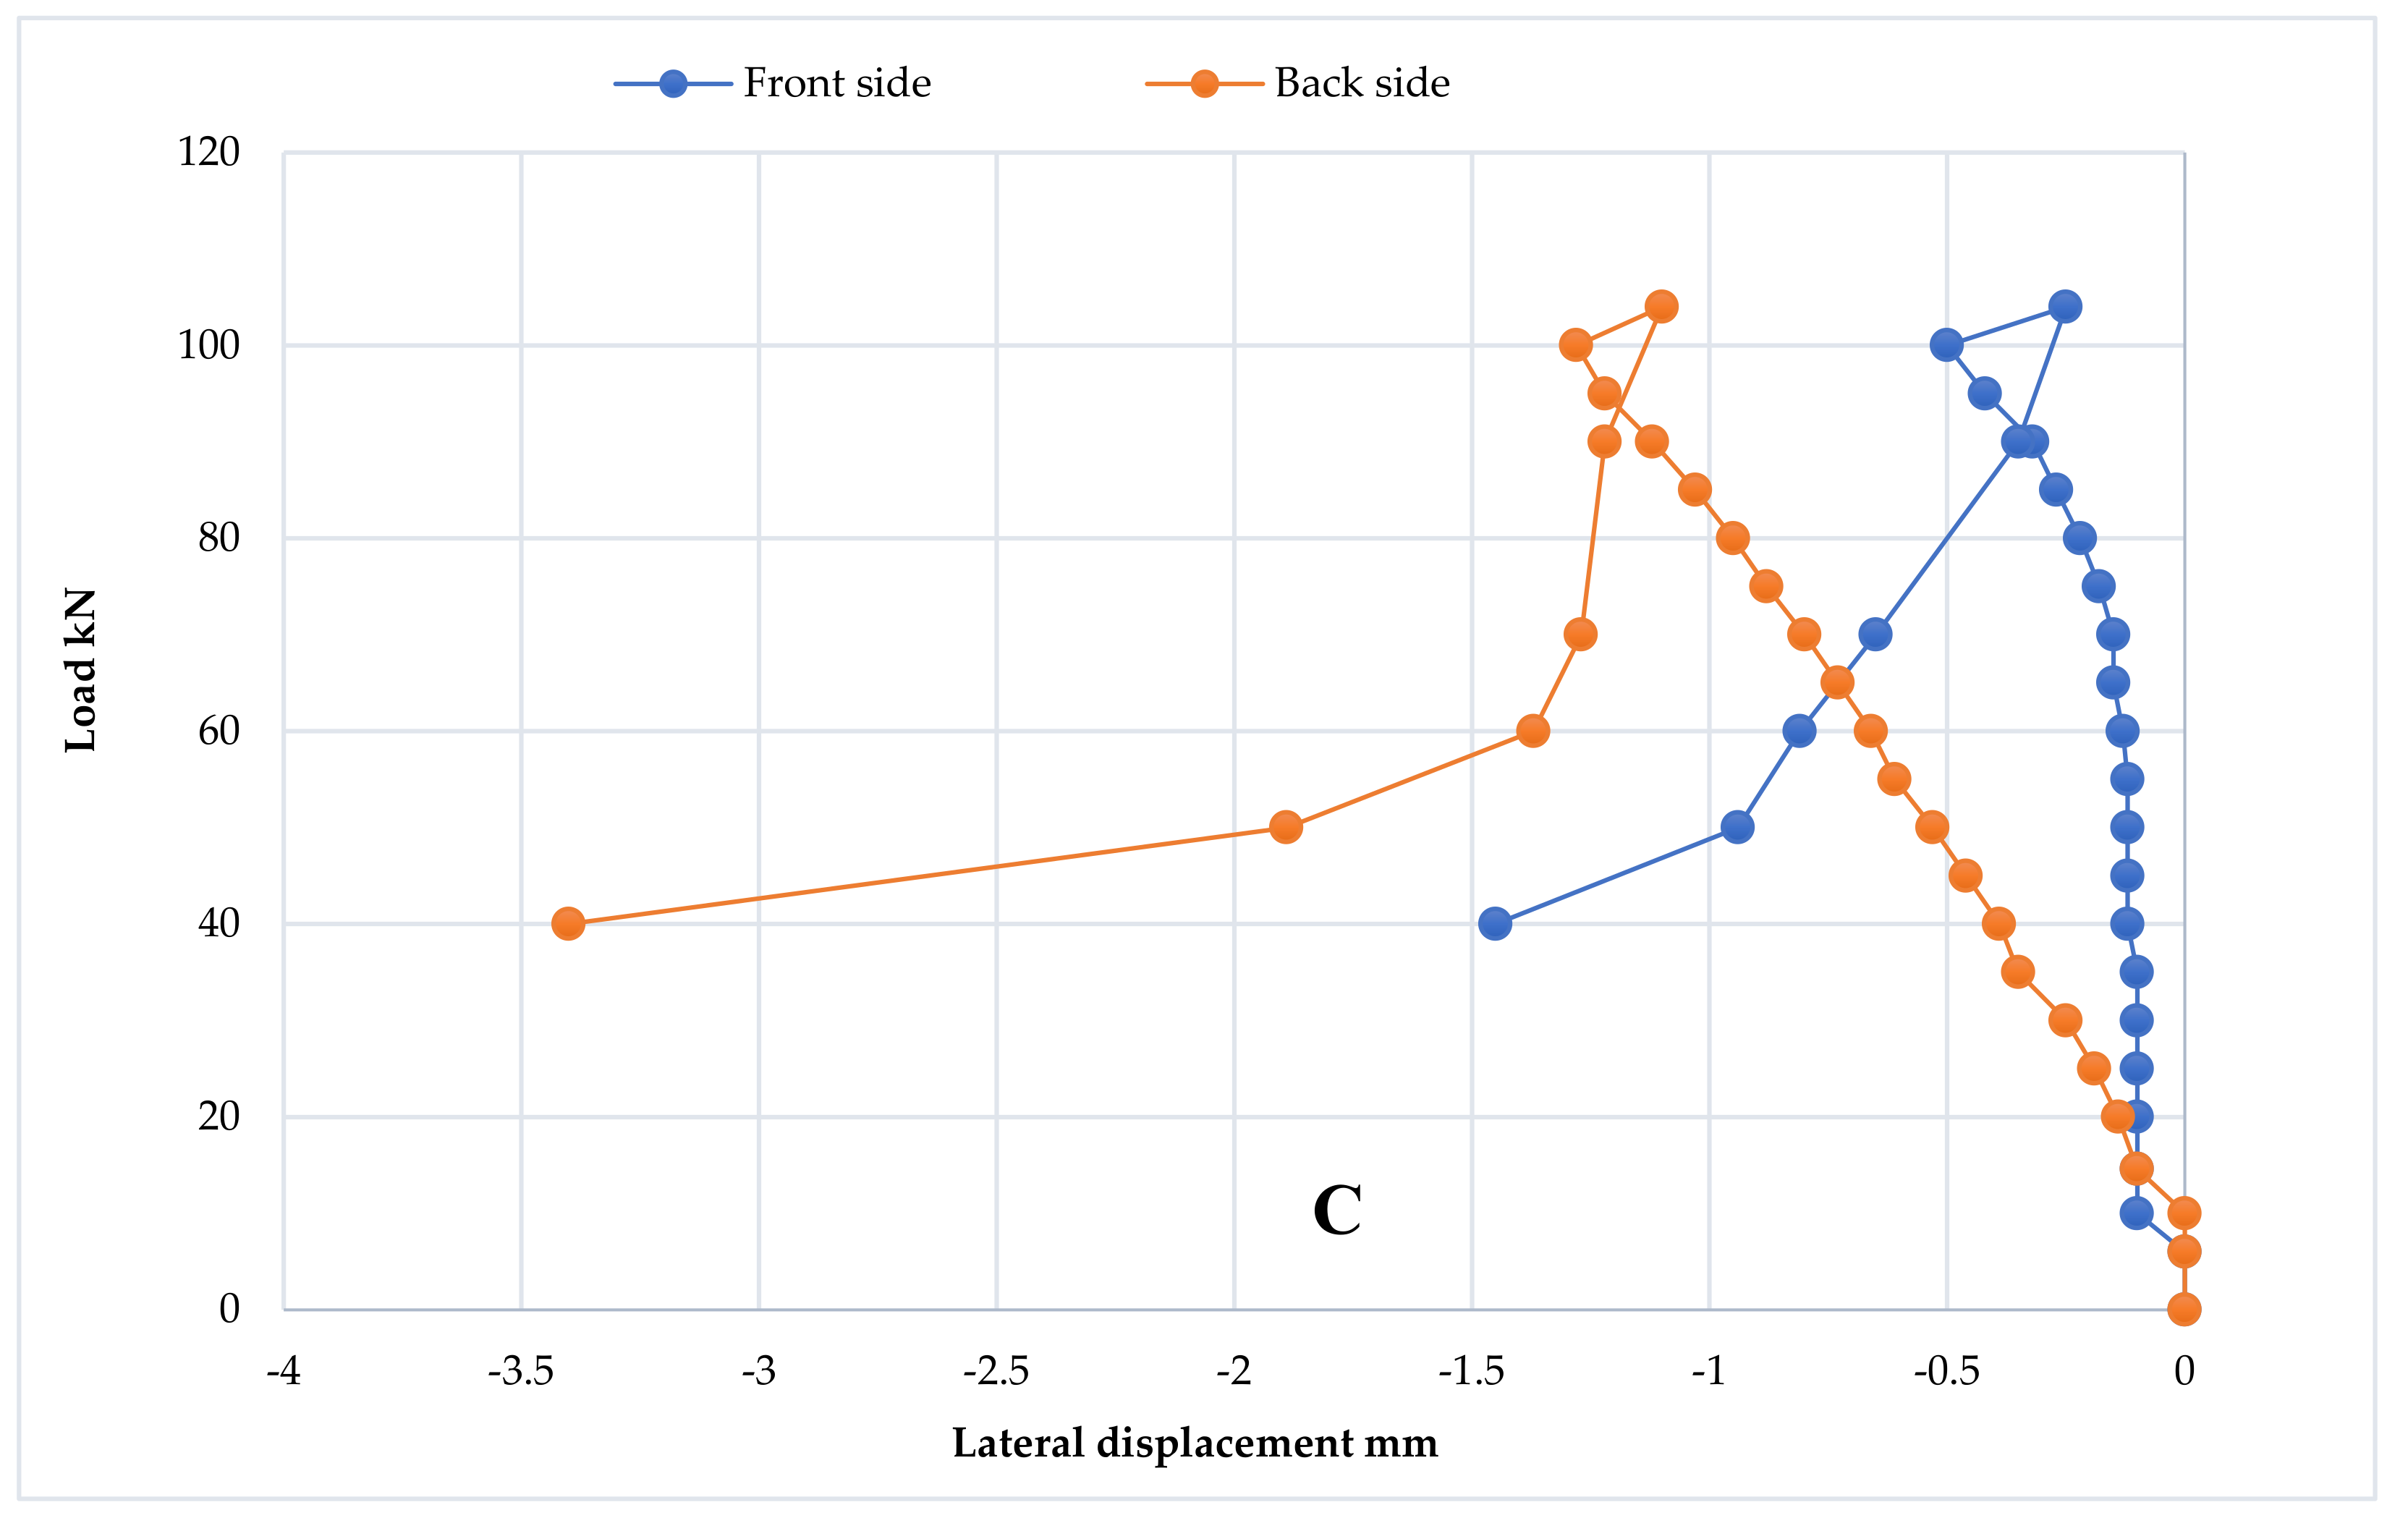
3.3.4. Deflection Profile
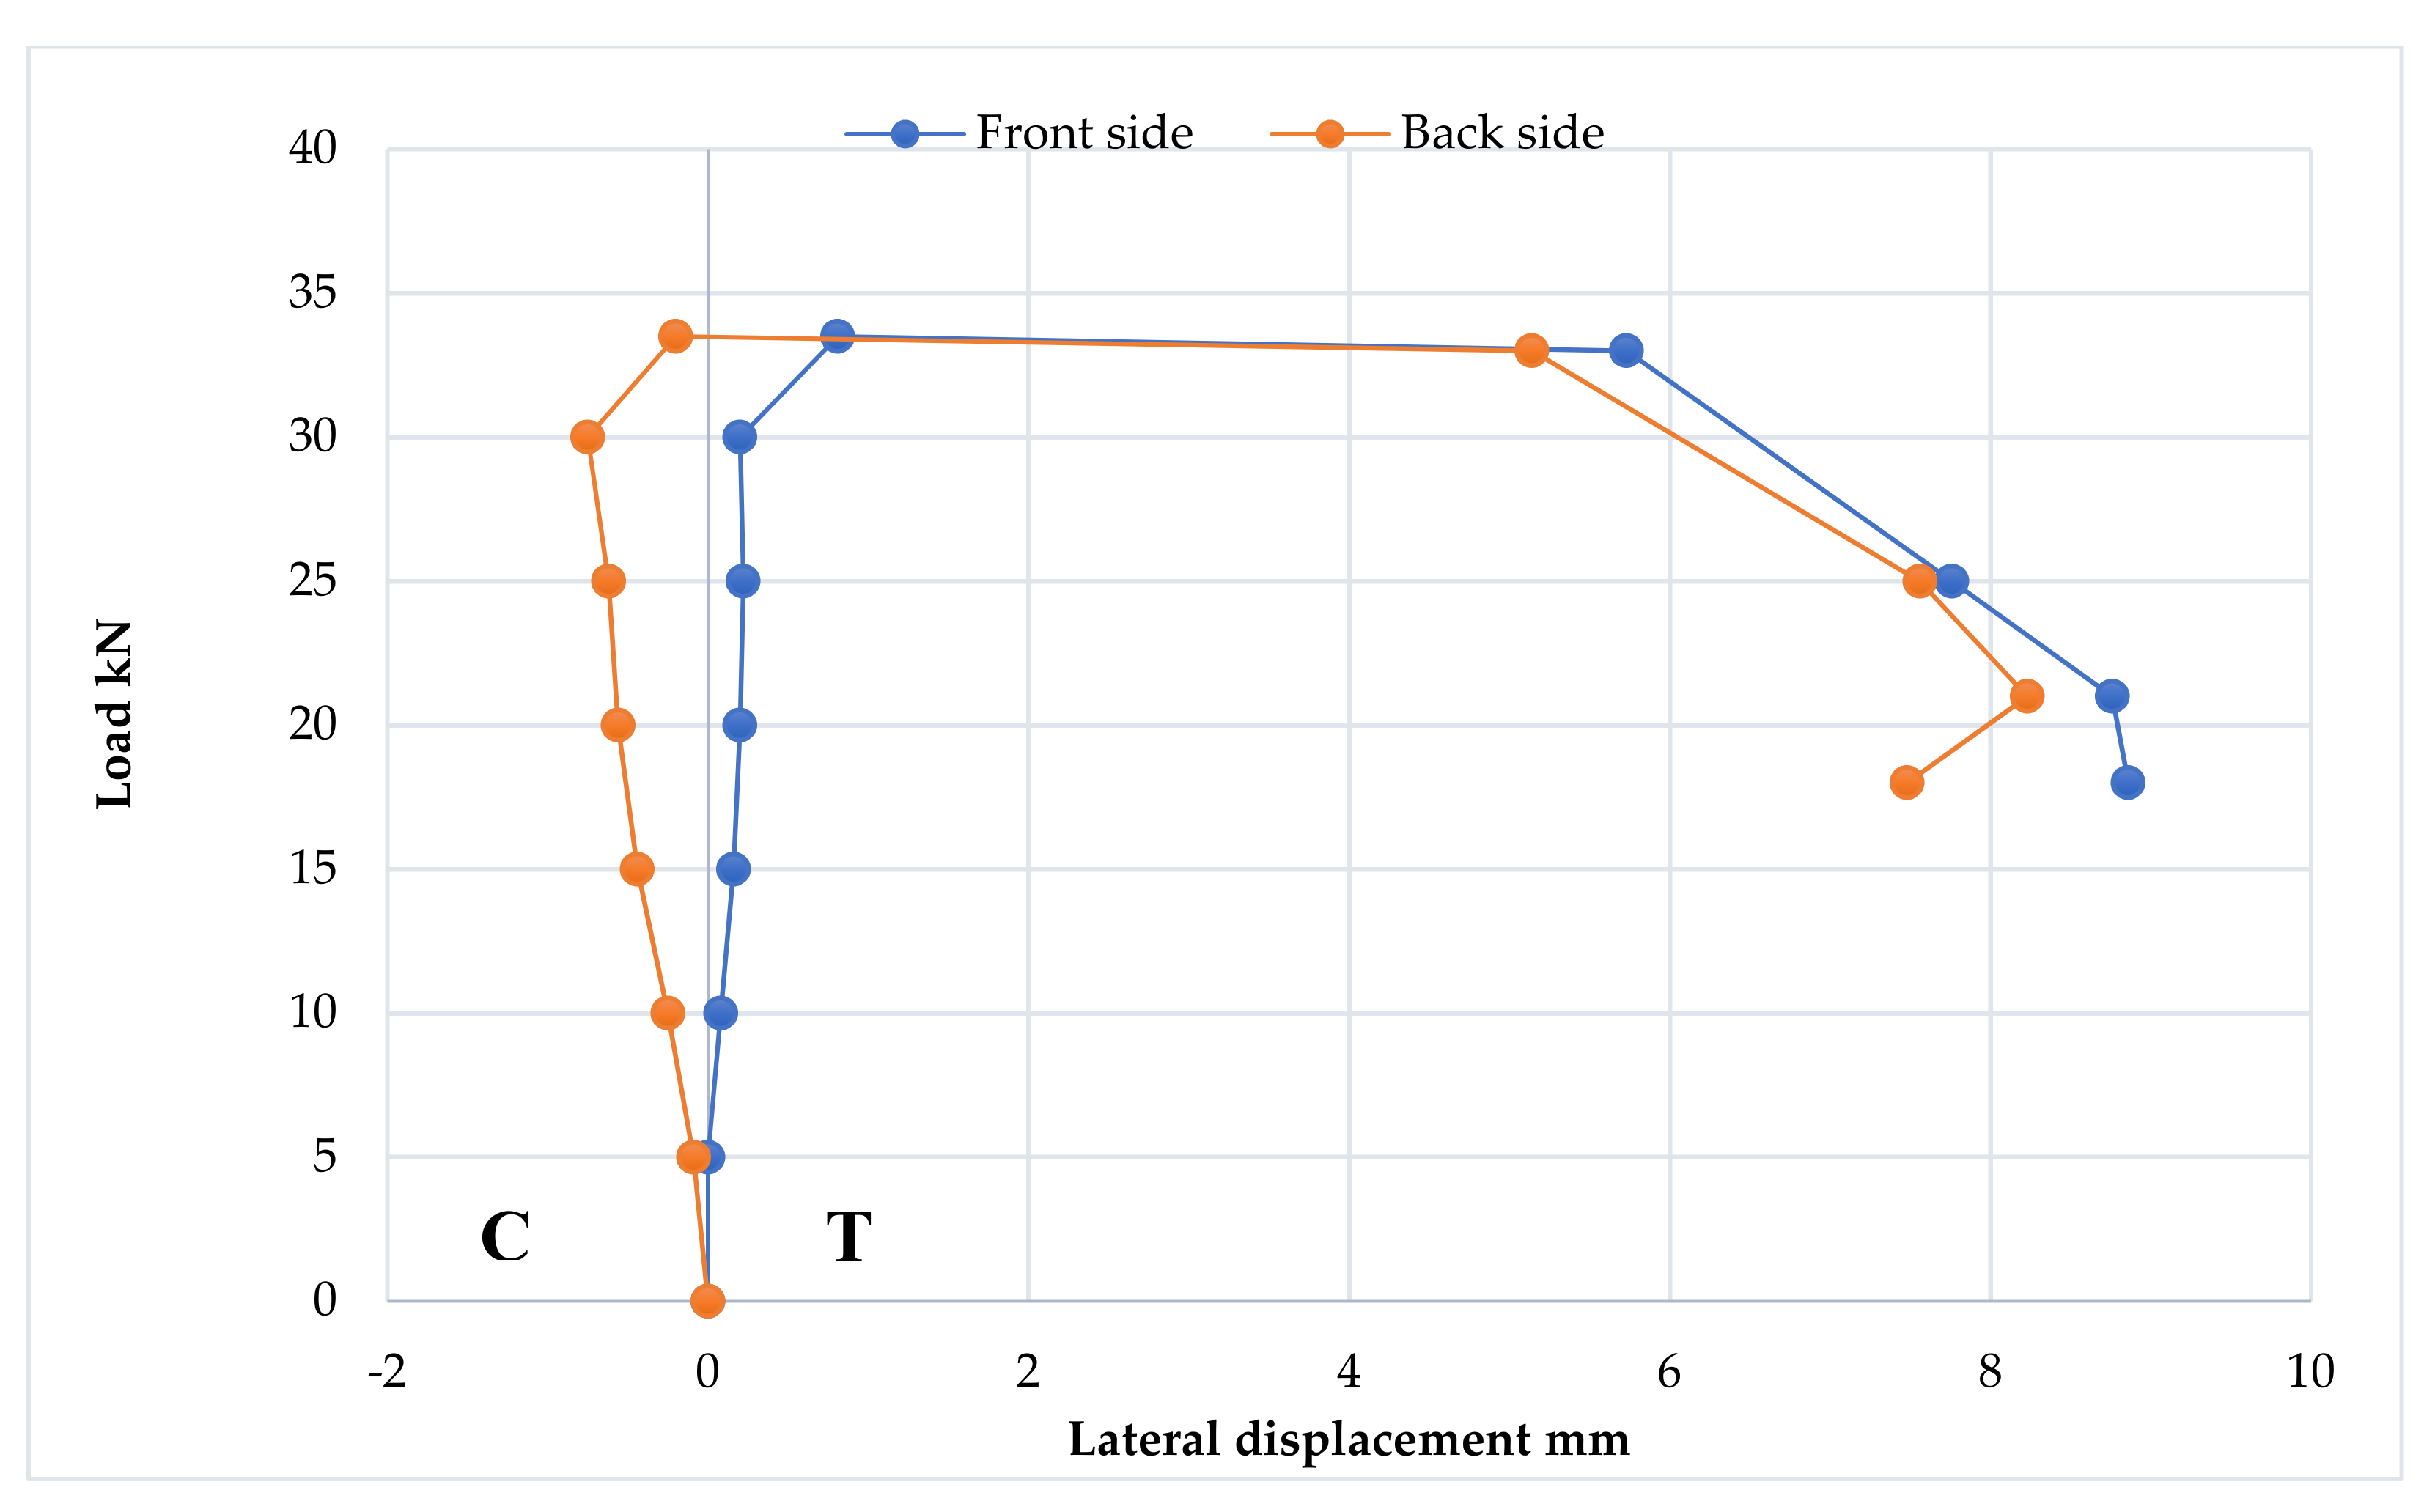
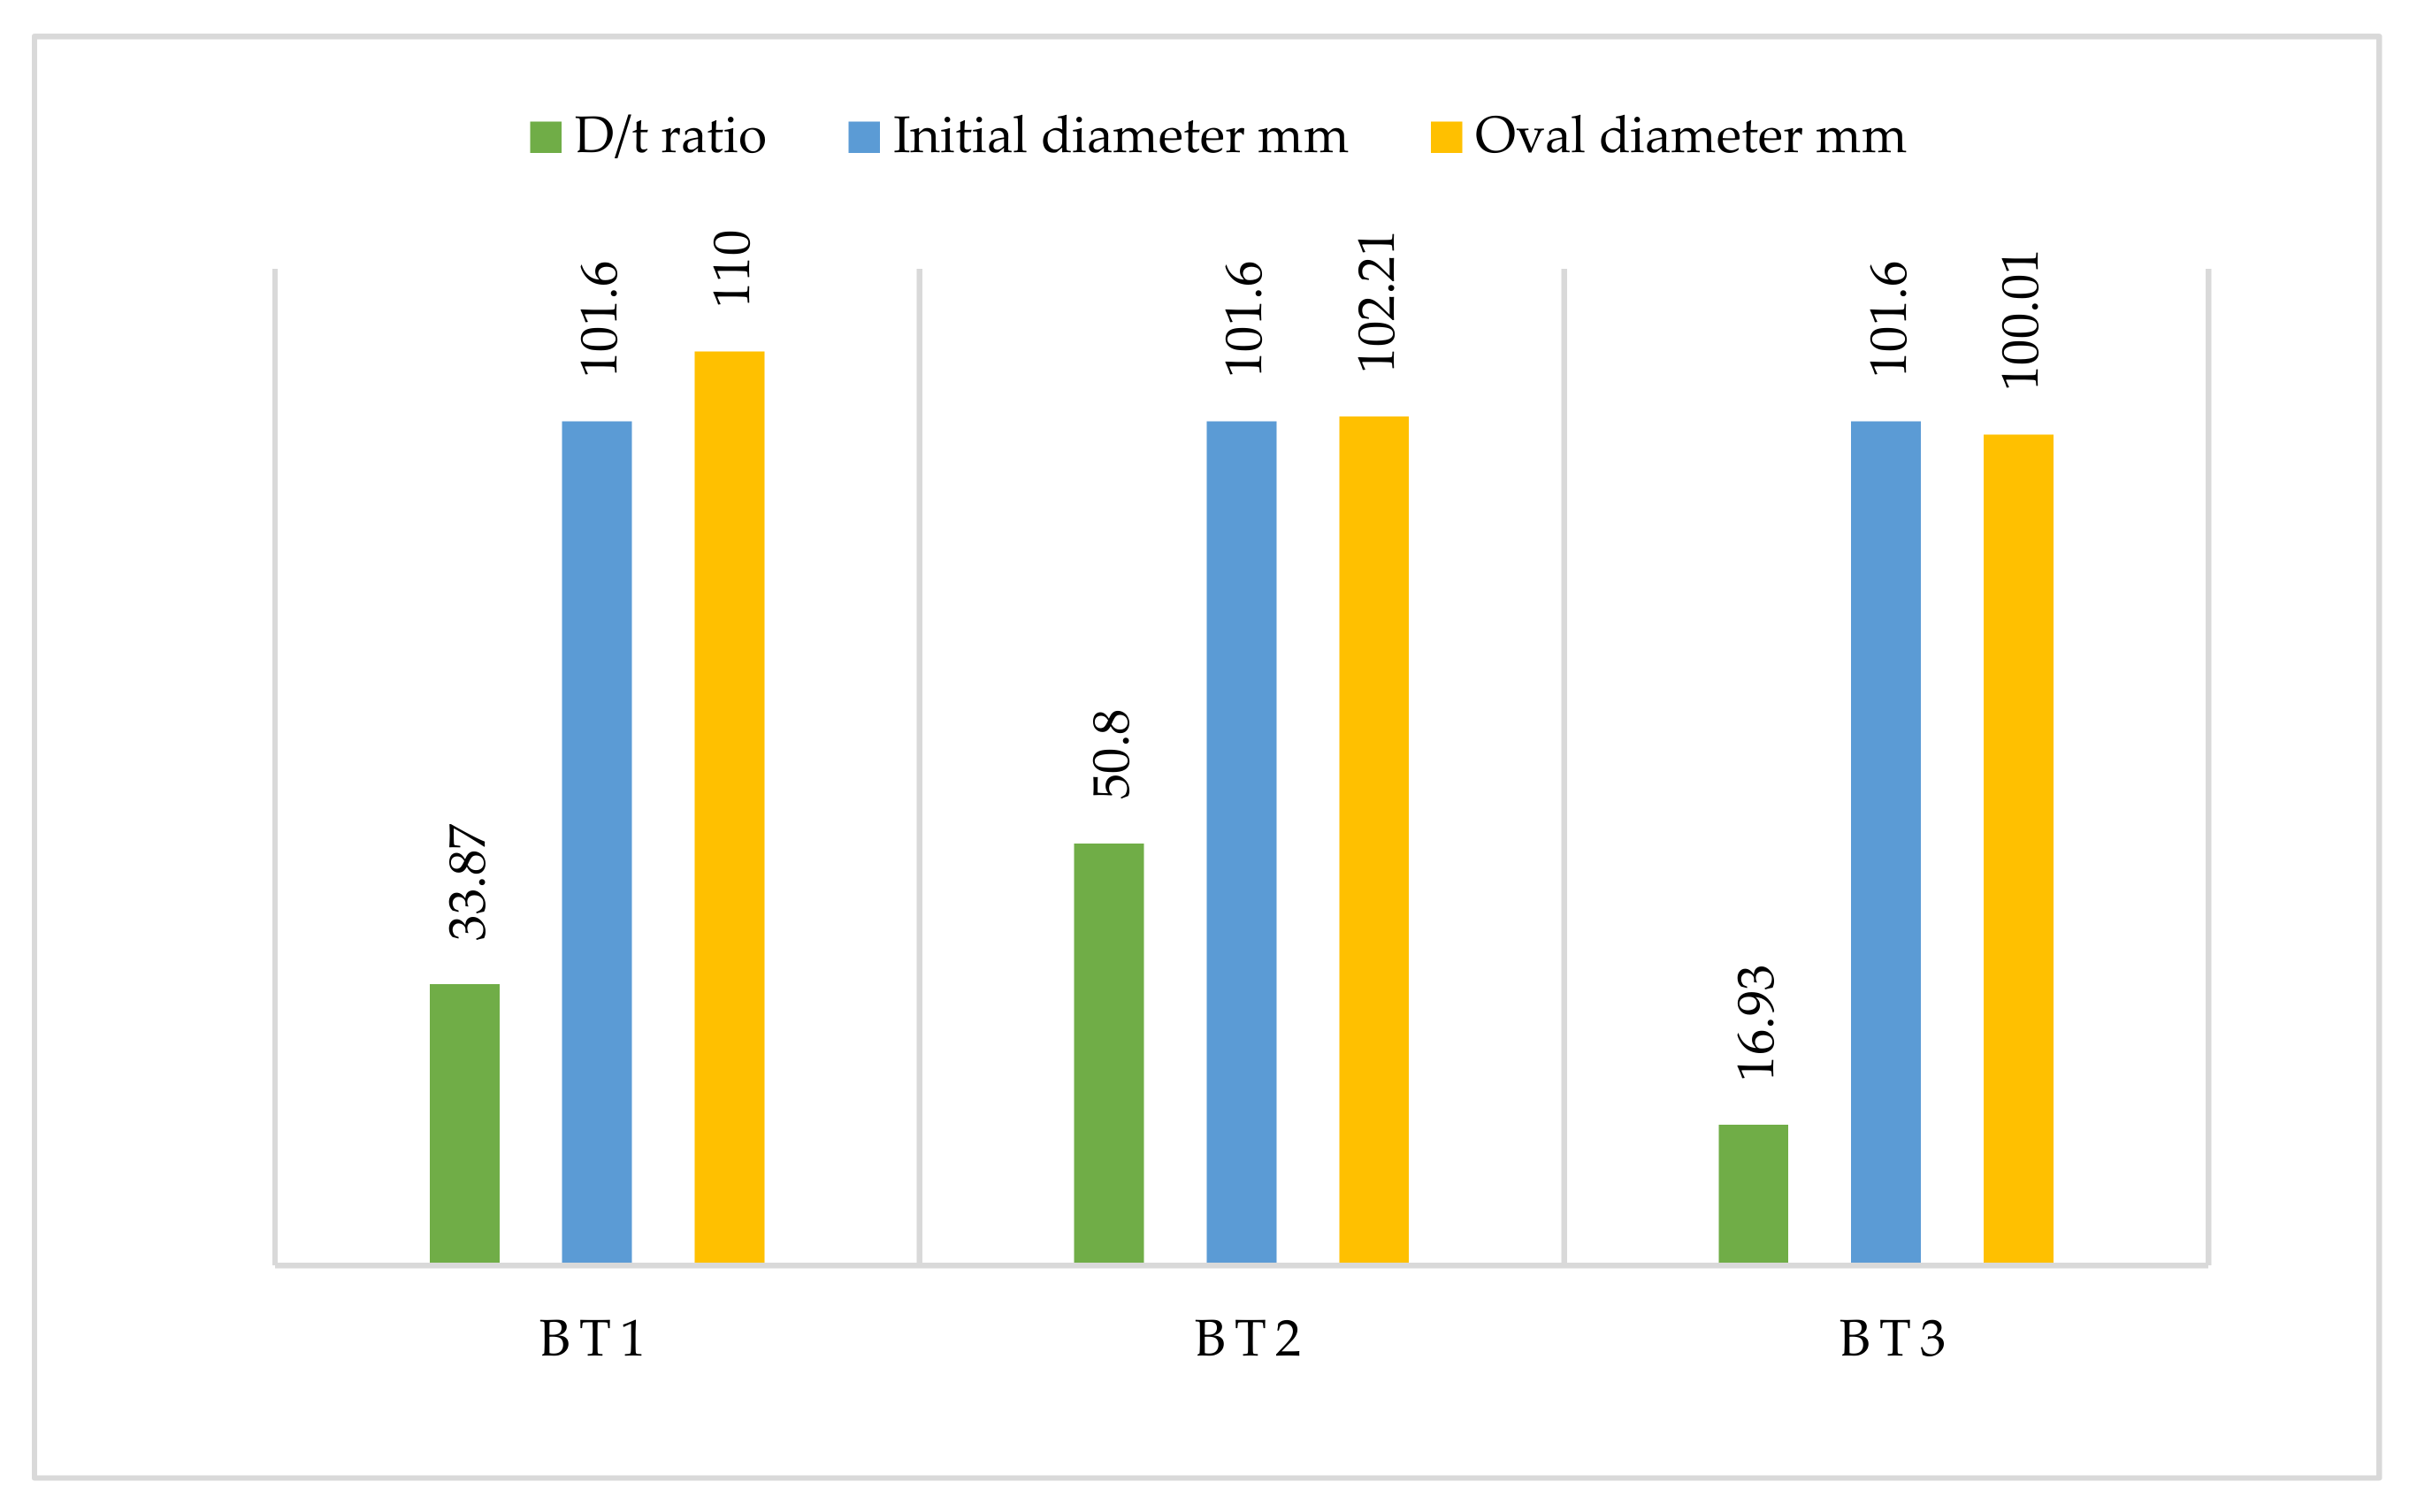
3.3.5. Cross-Section Ovalization Behavior
3.4. Results of the Third Investigated Group
3.4.1. Load–Deflection Curve
- 1.
- The elastic stage
- 2.
- The ovalization stage
3.4.2. Ductility
3.4.3. Stiffness
3.4.4. Deflection Profile
3.4.5. Cross-Section Ovalization Behavior
3.5. Results of the Fourth Investigated Group
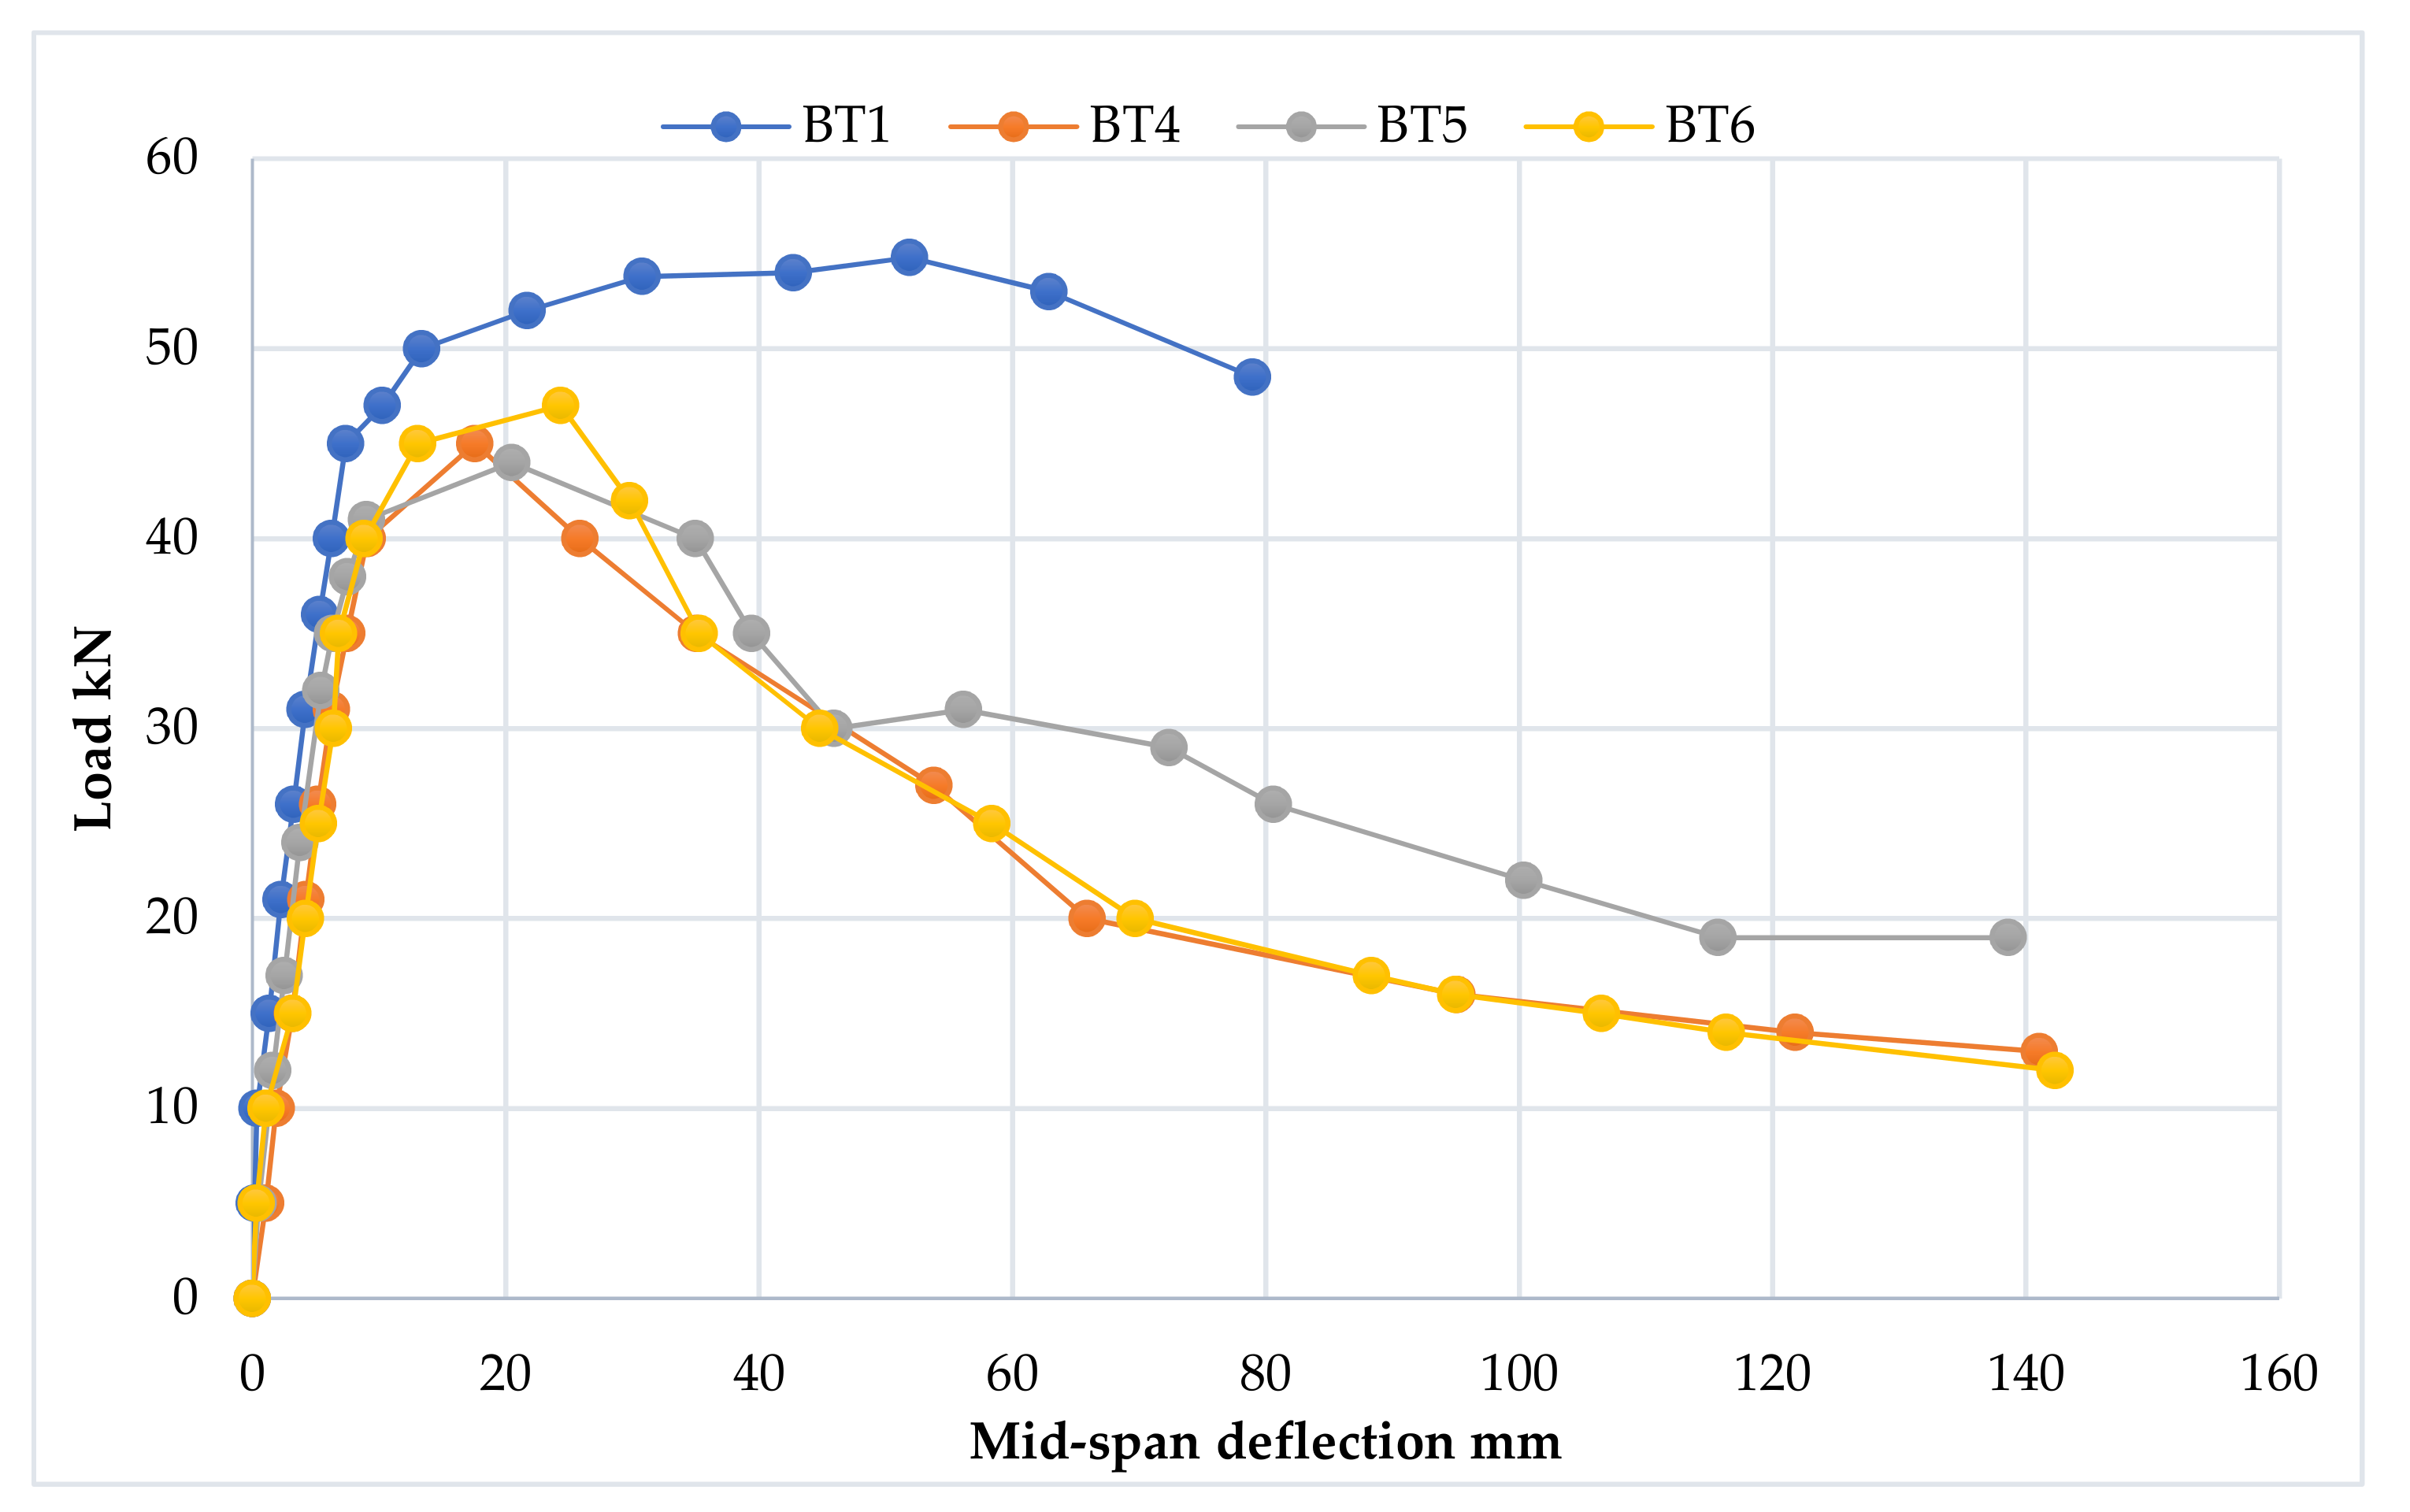
3.5.1. Load–Deflection Curve
- 1.
- The elastic stage
- 2.
- The ovalization stage
- 3.
- The failure stage
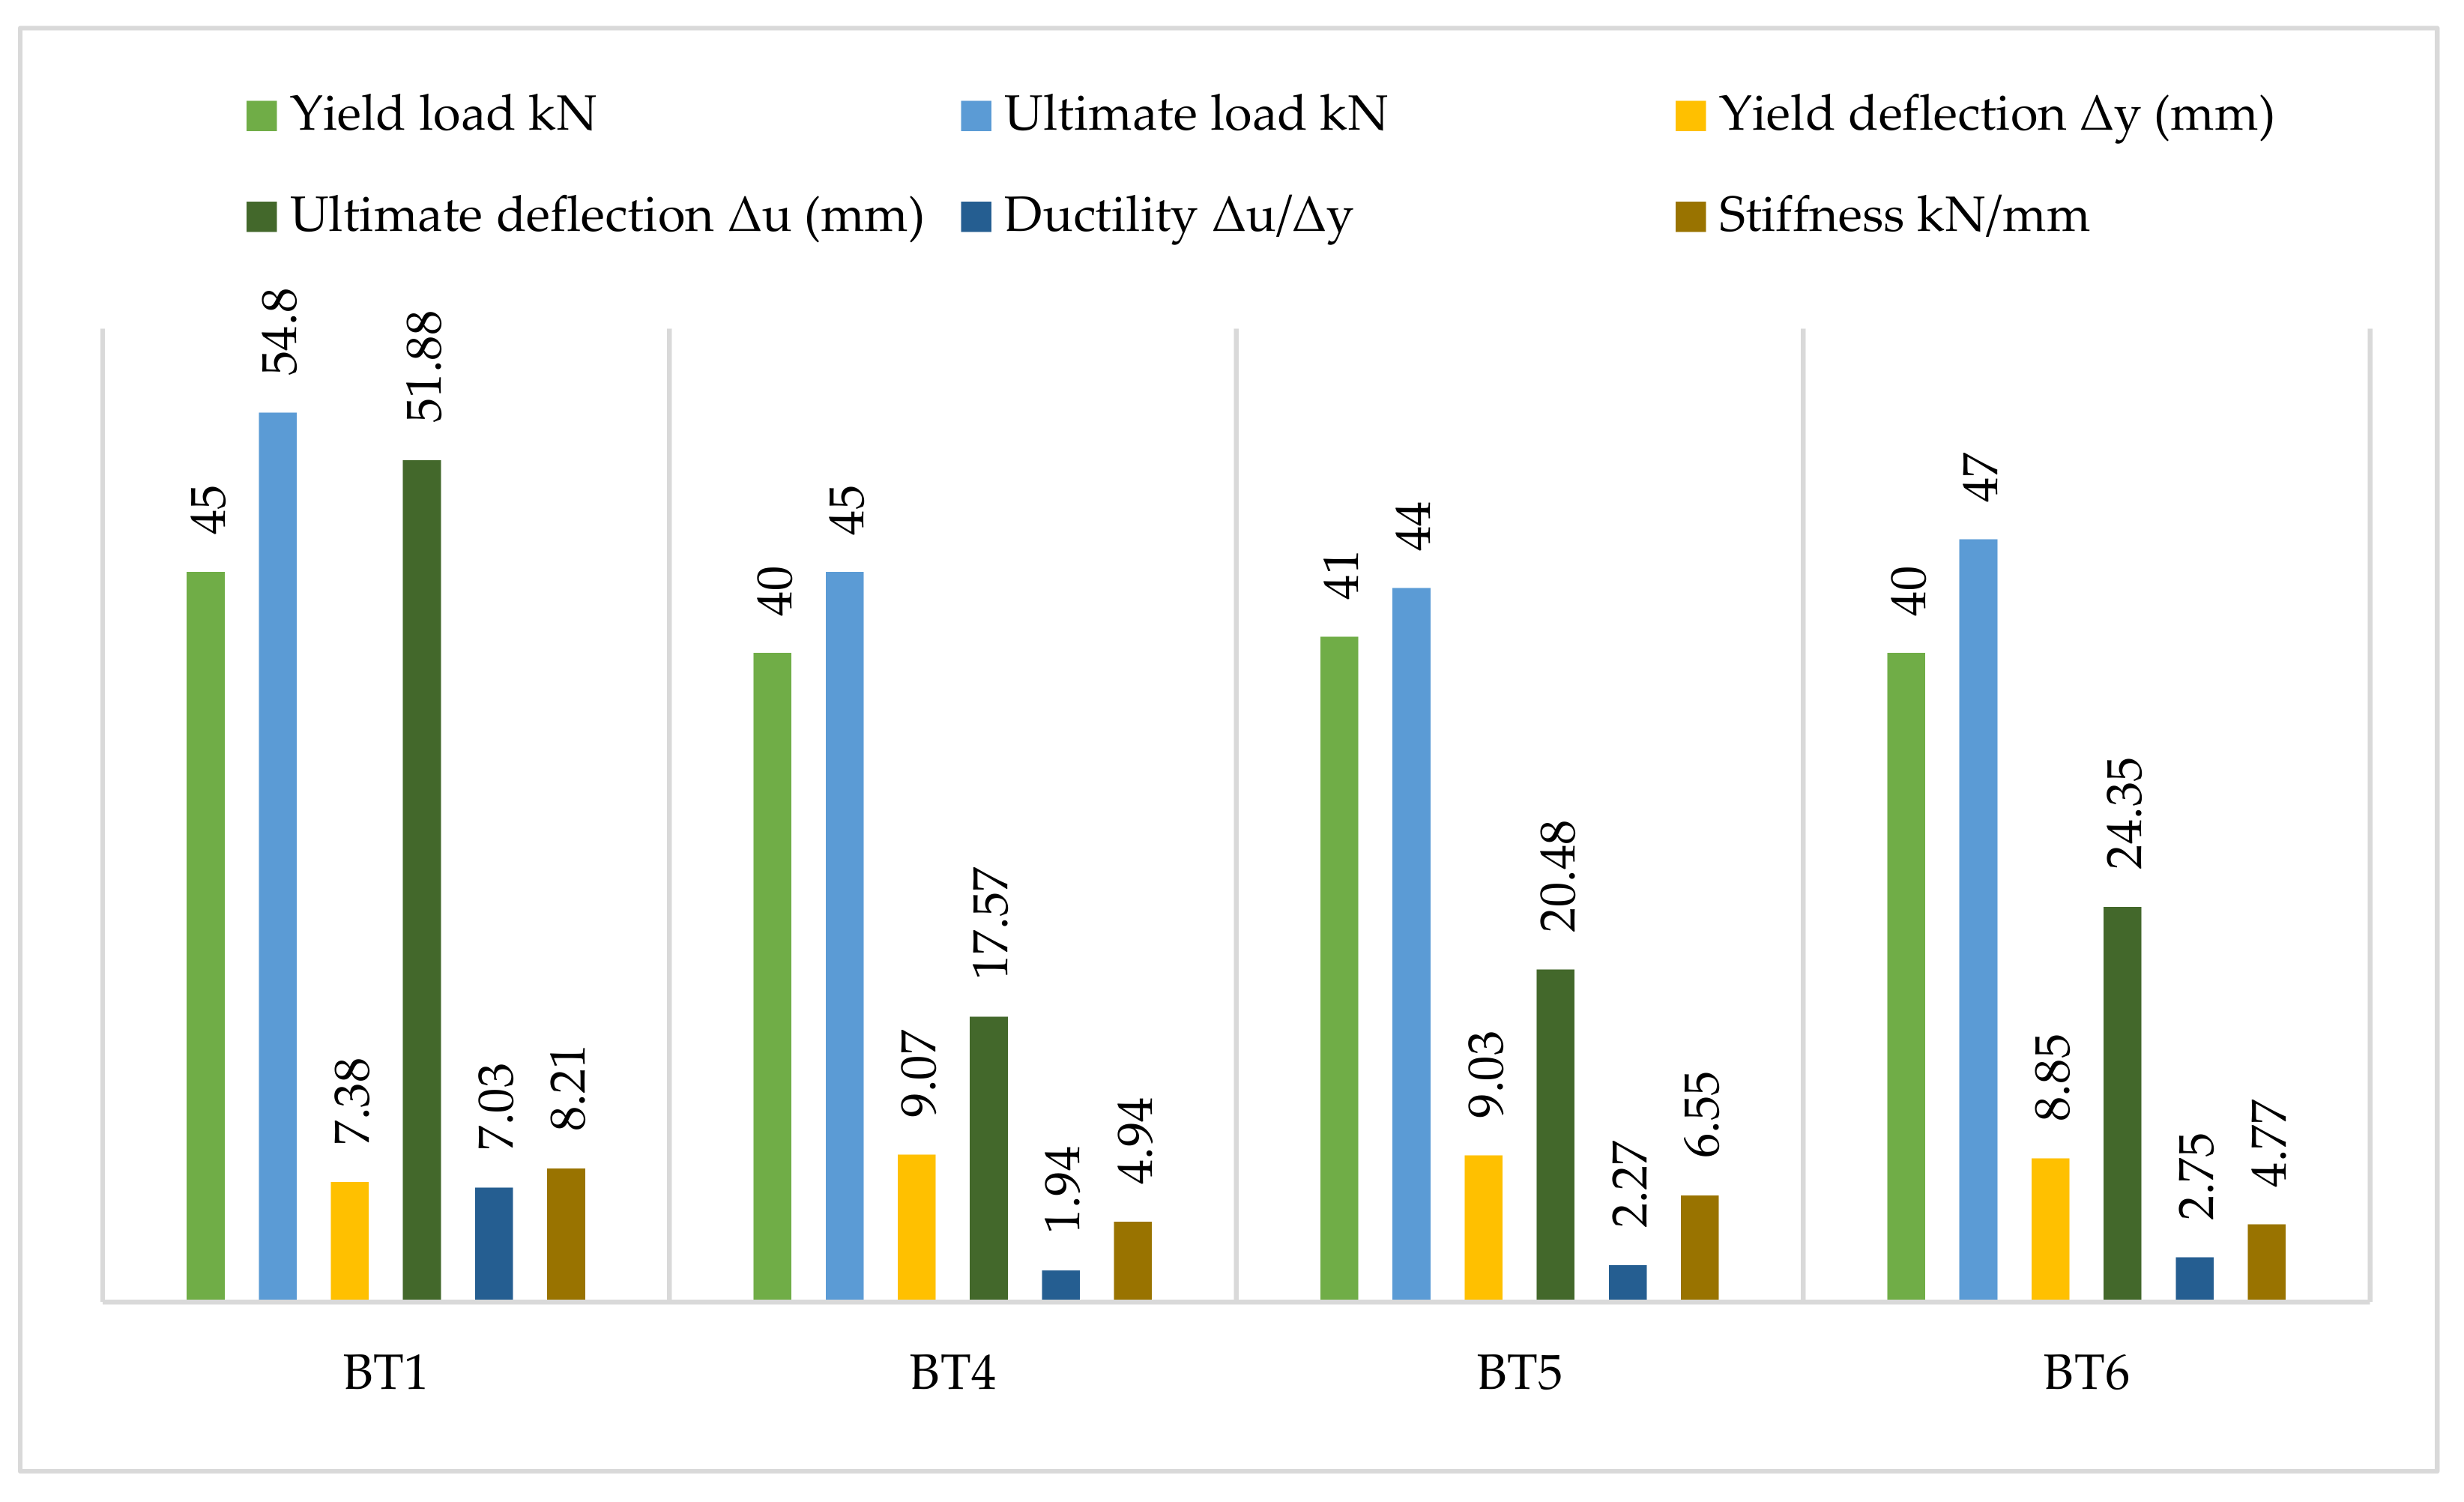
3.5.2. Ductility
3.5.3. Stiffness
3.5.4. Deflection Profile
3.5.5. Cross-Section Ovalization Behavior
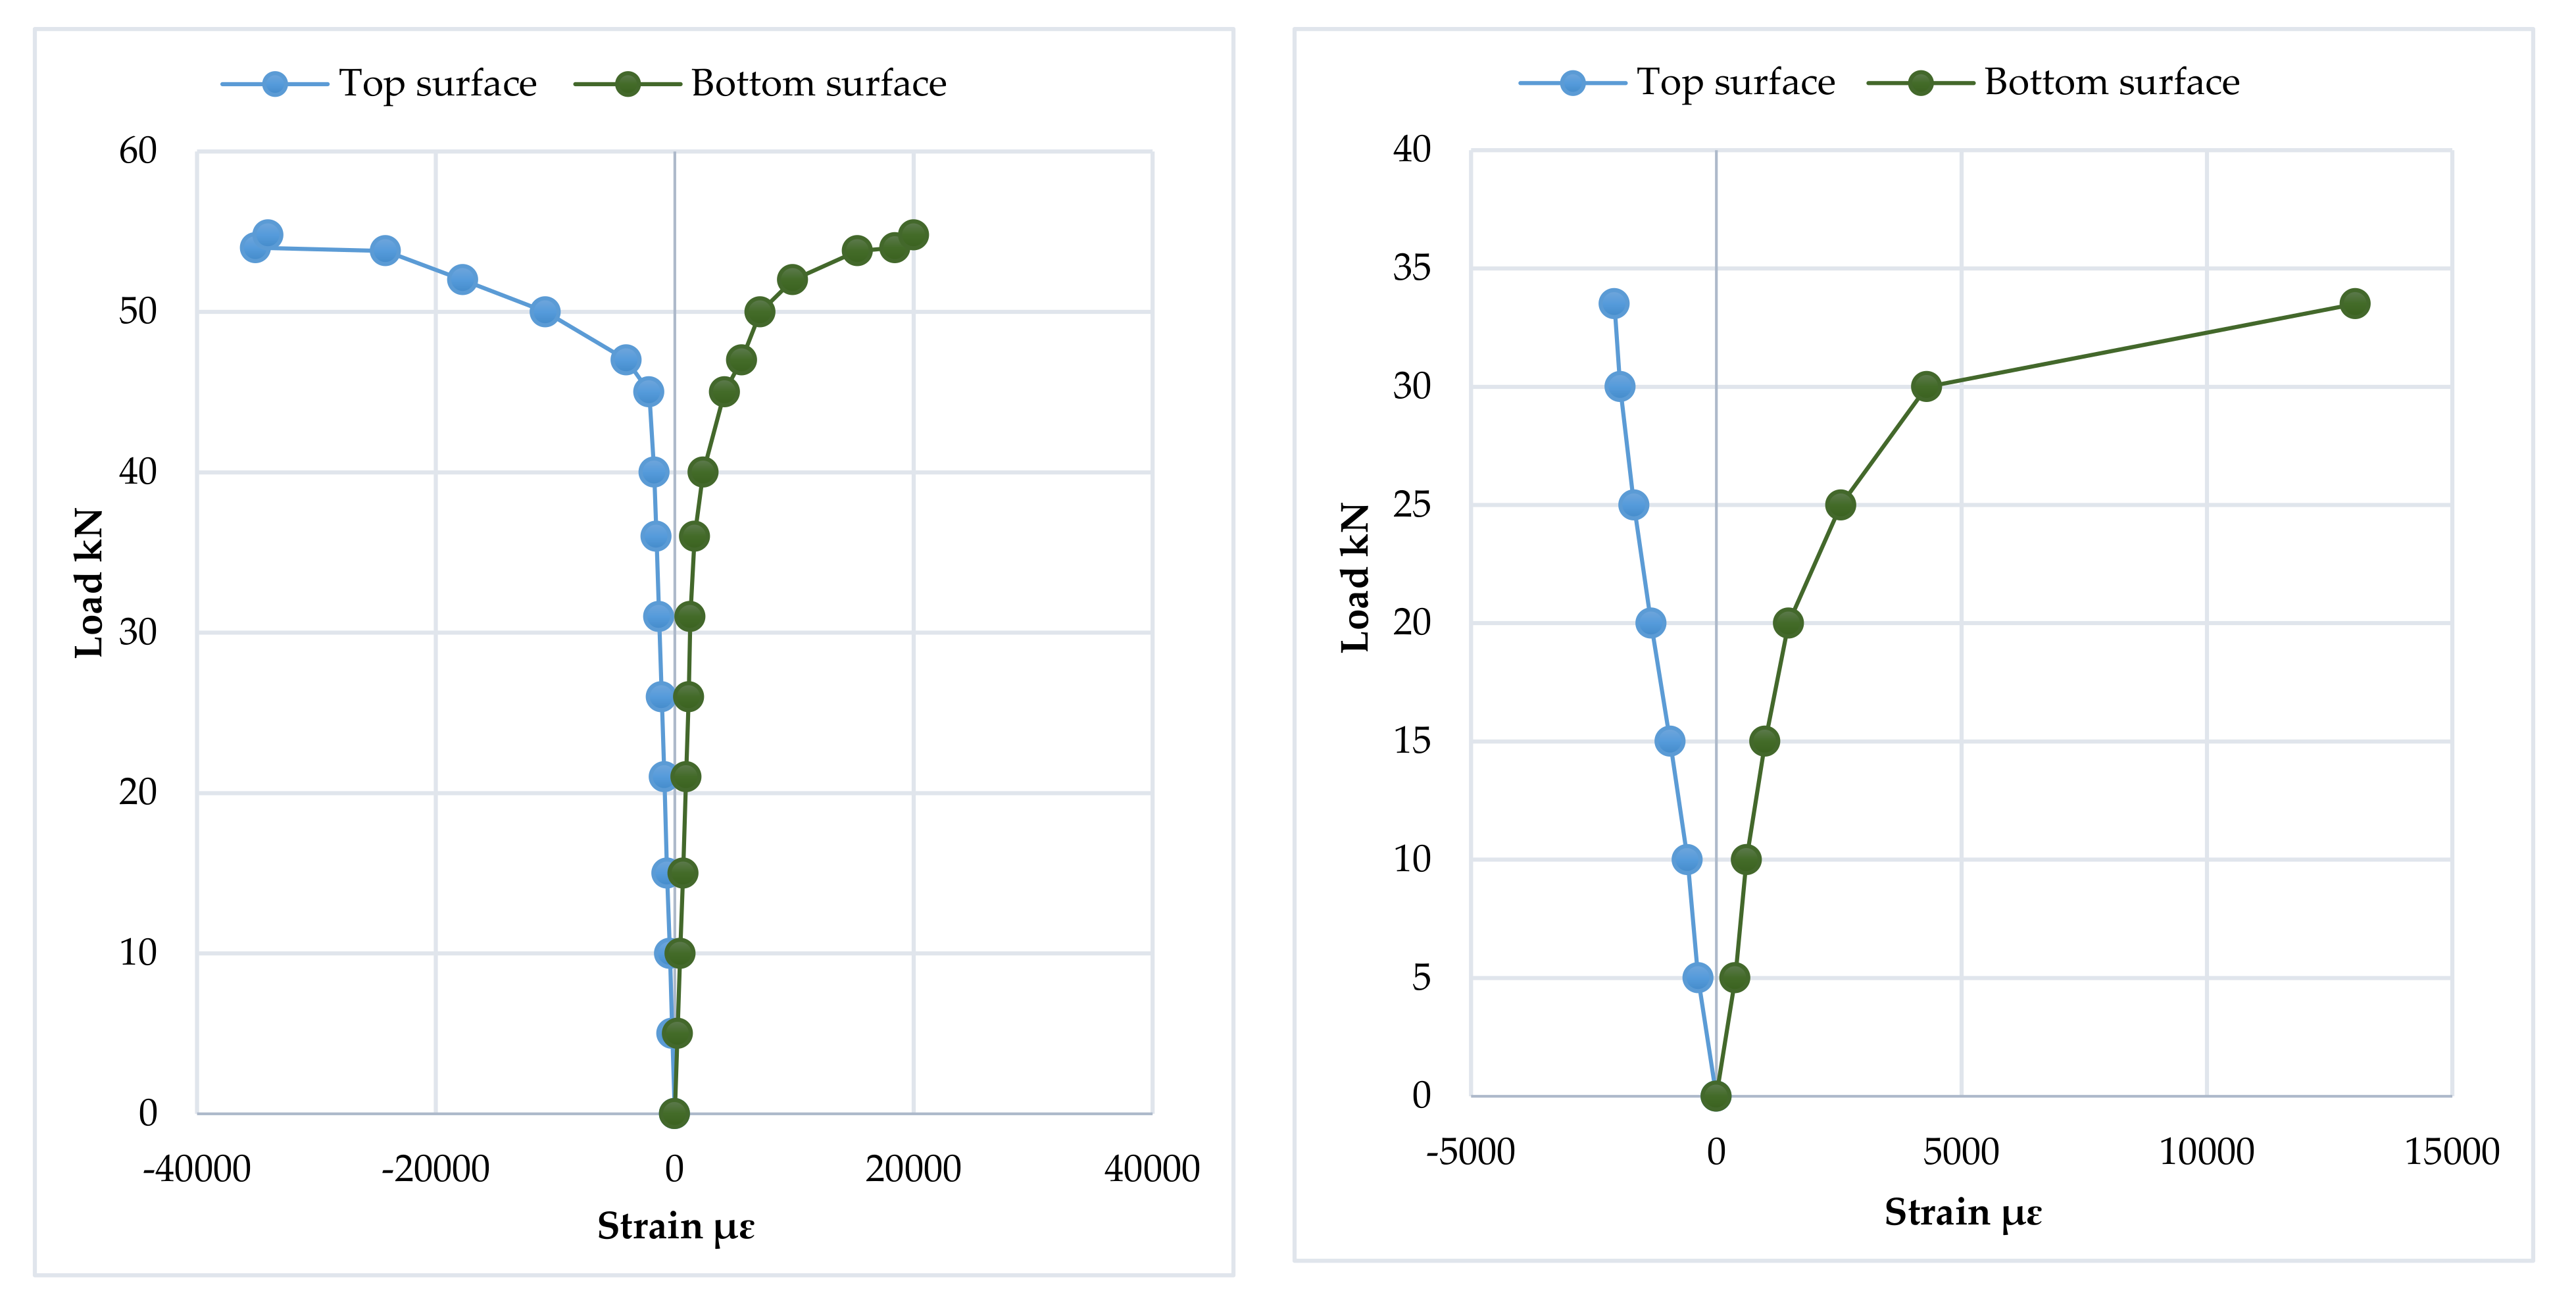
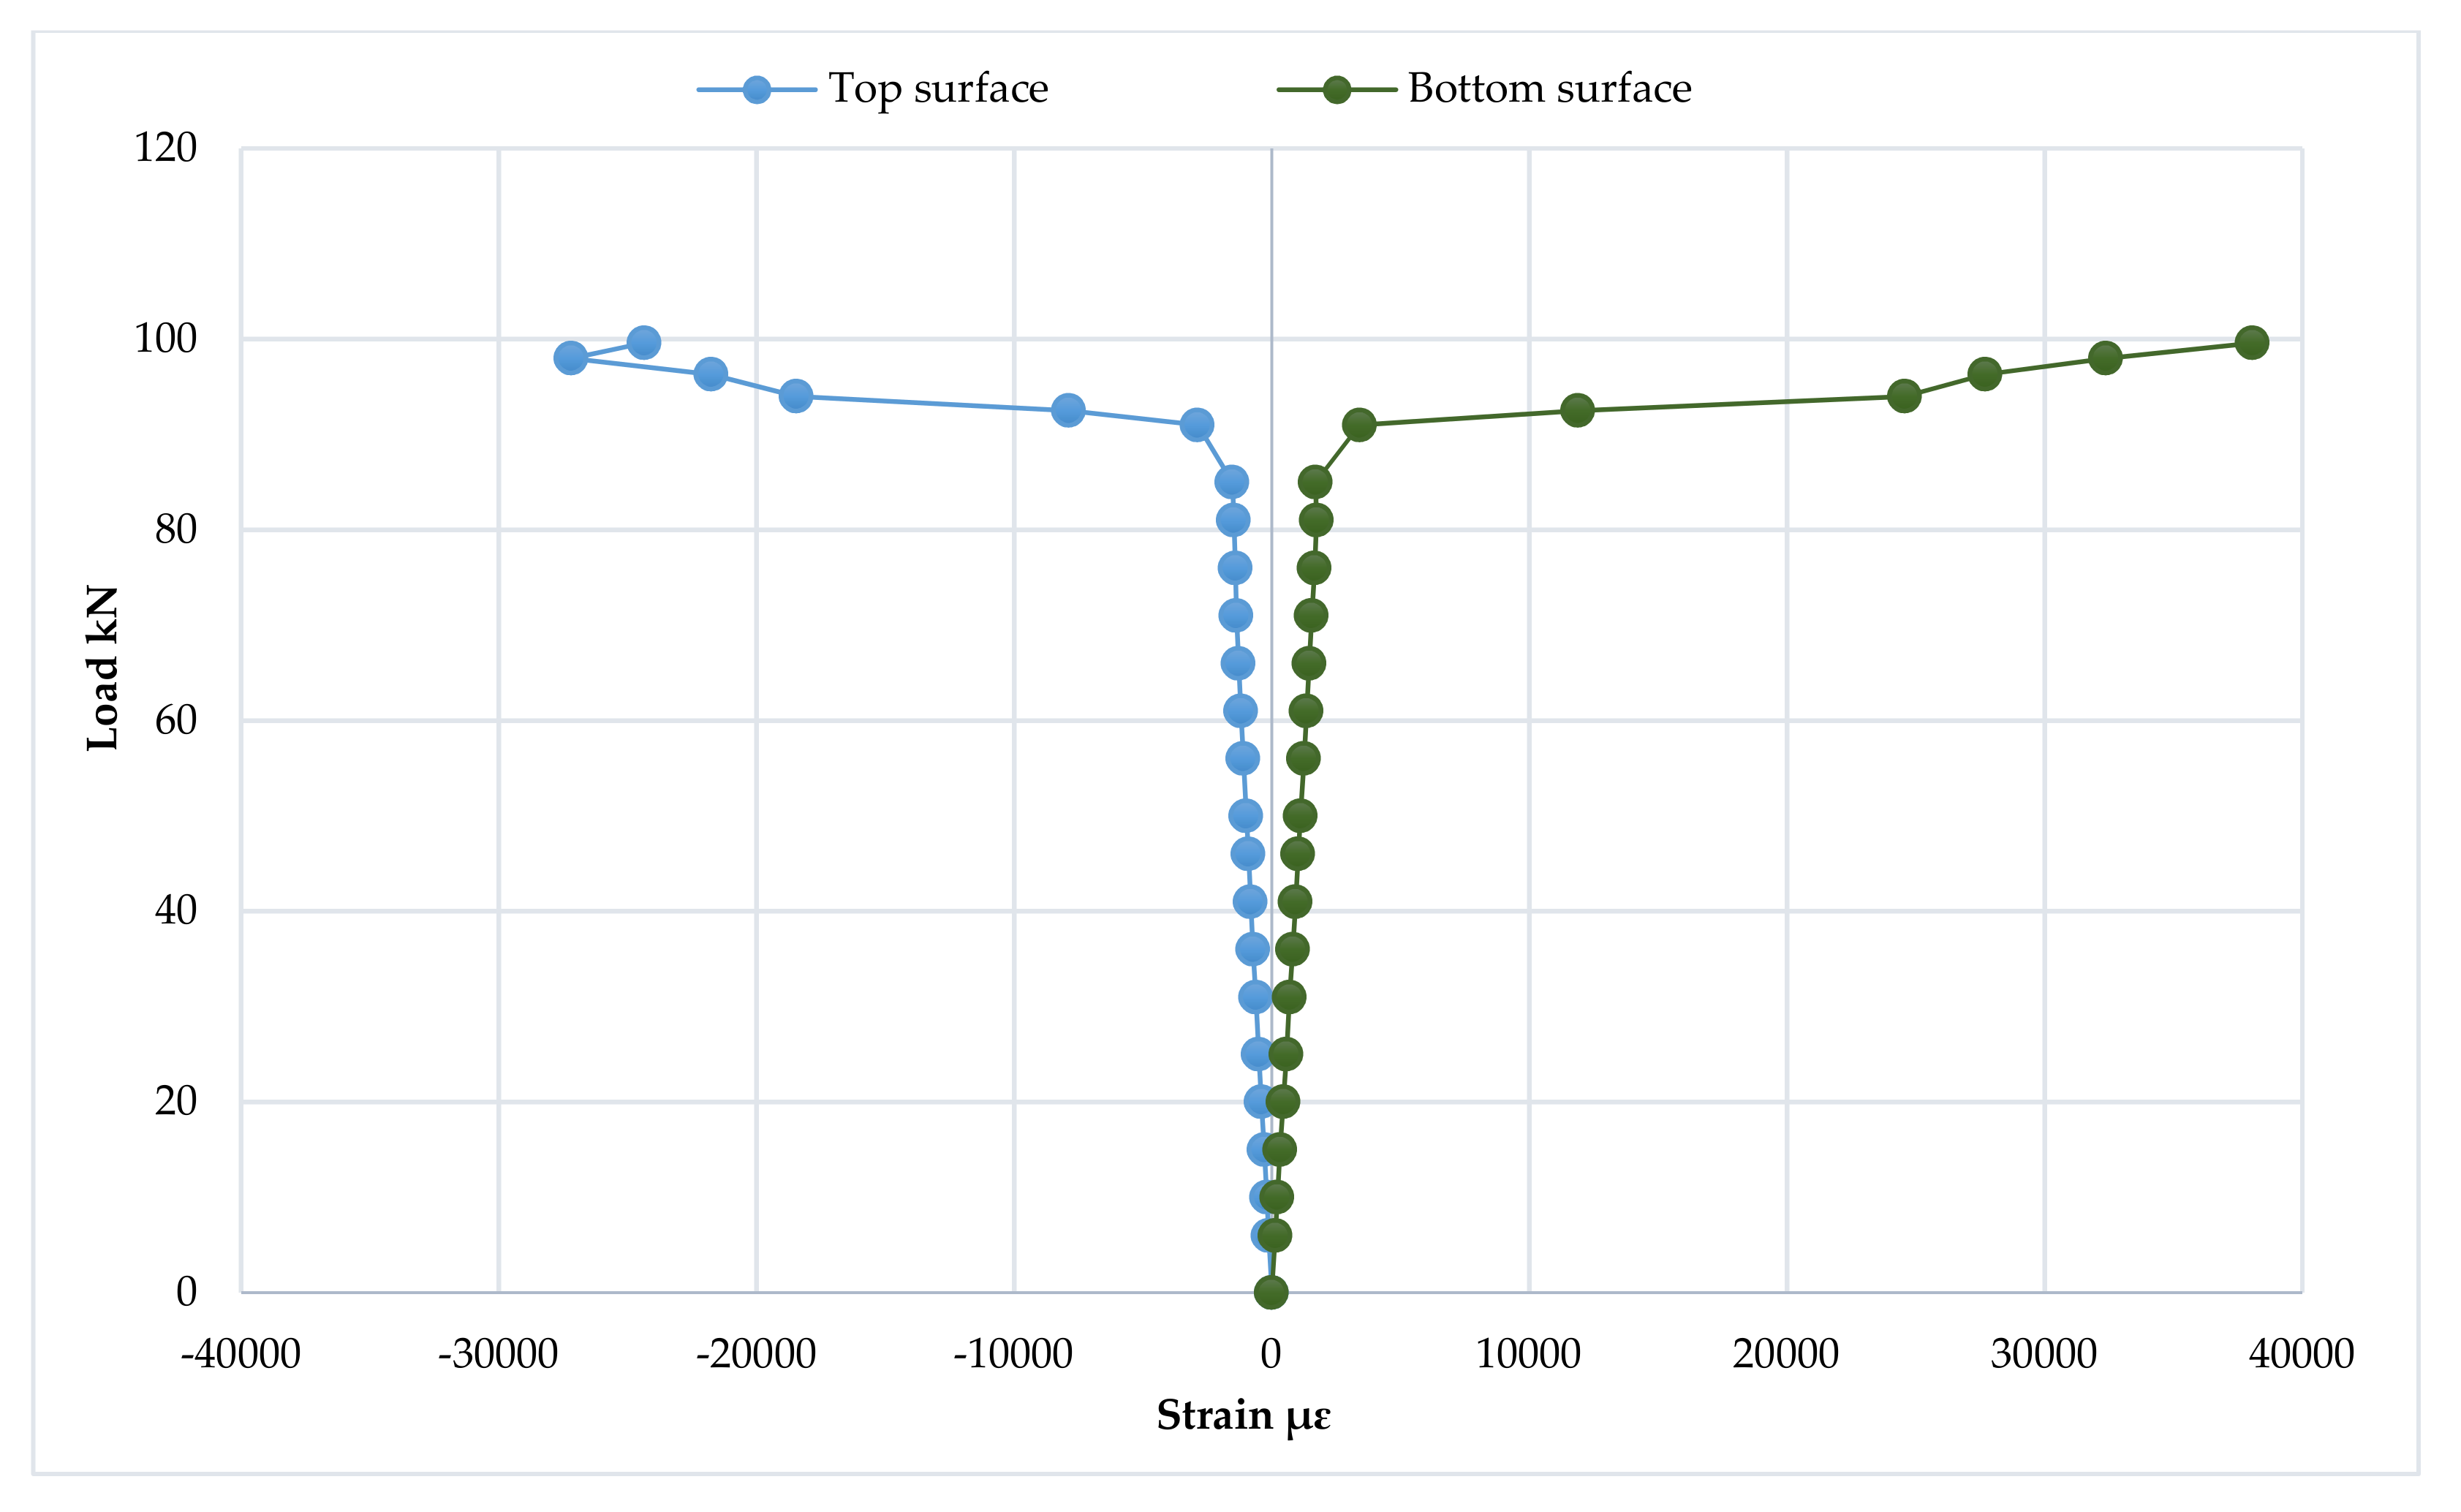
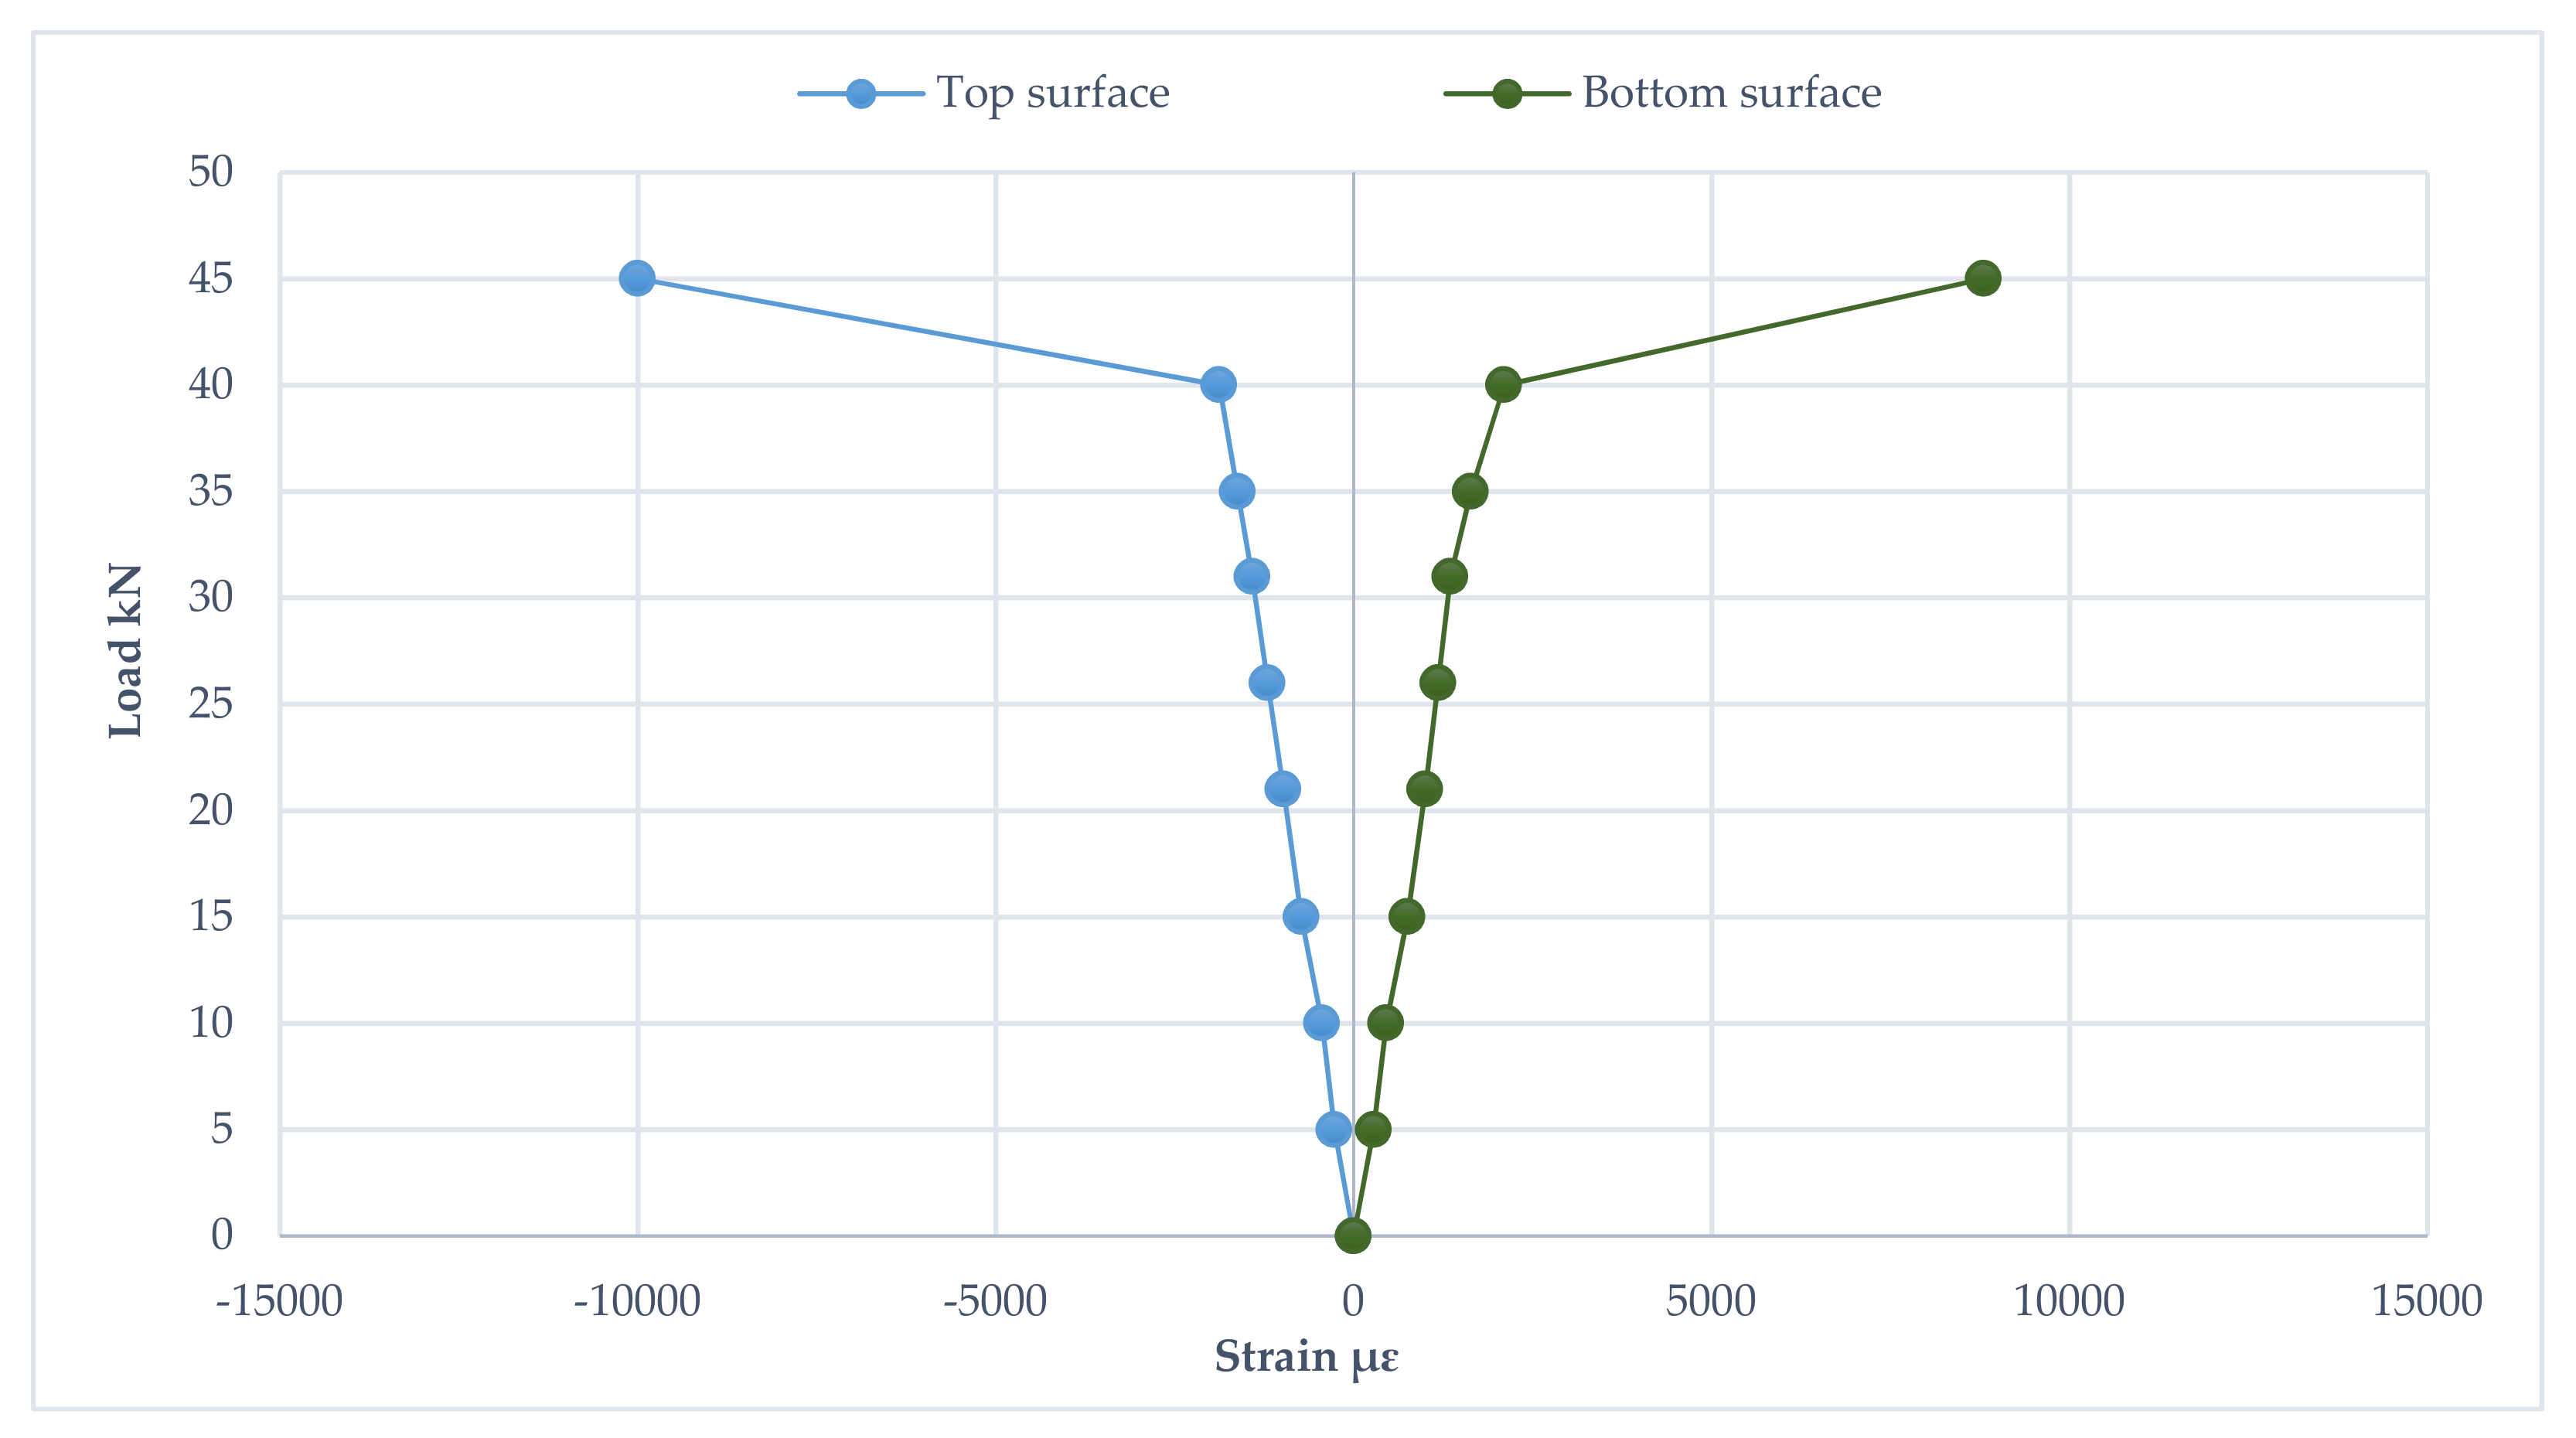
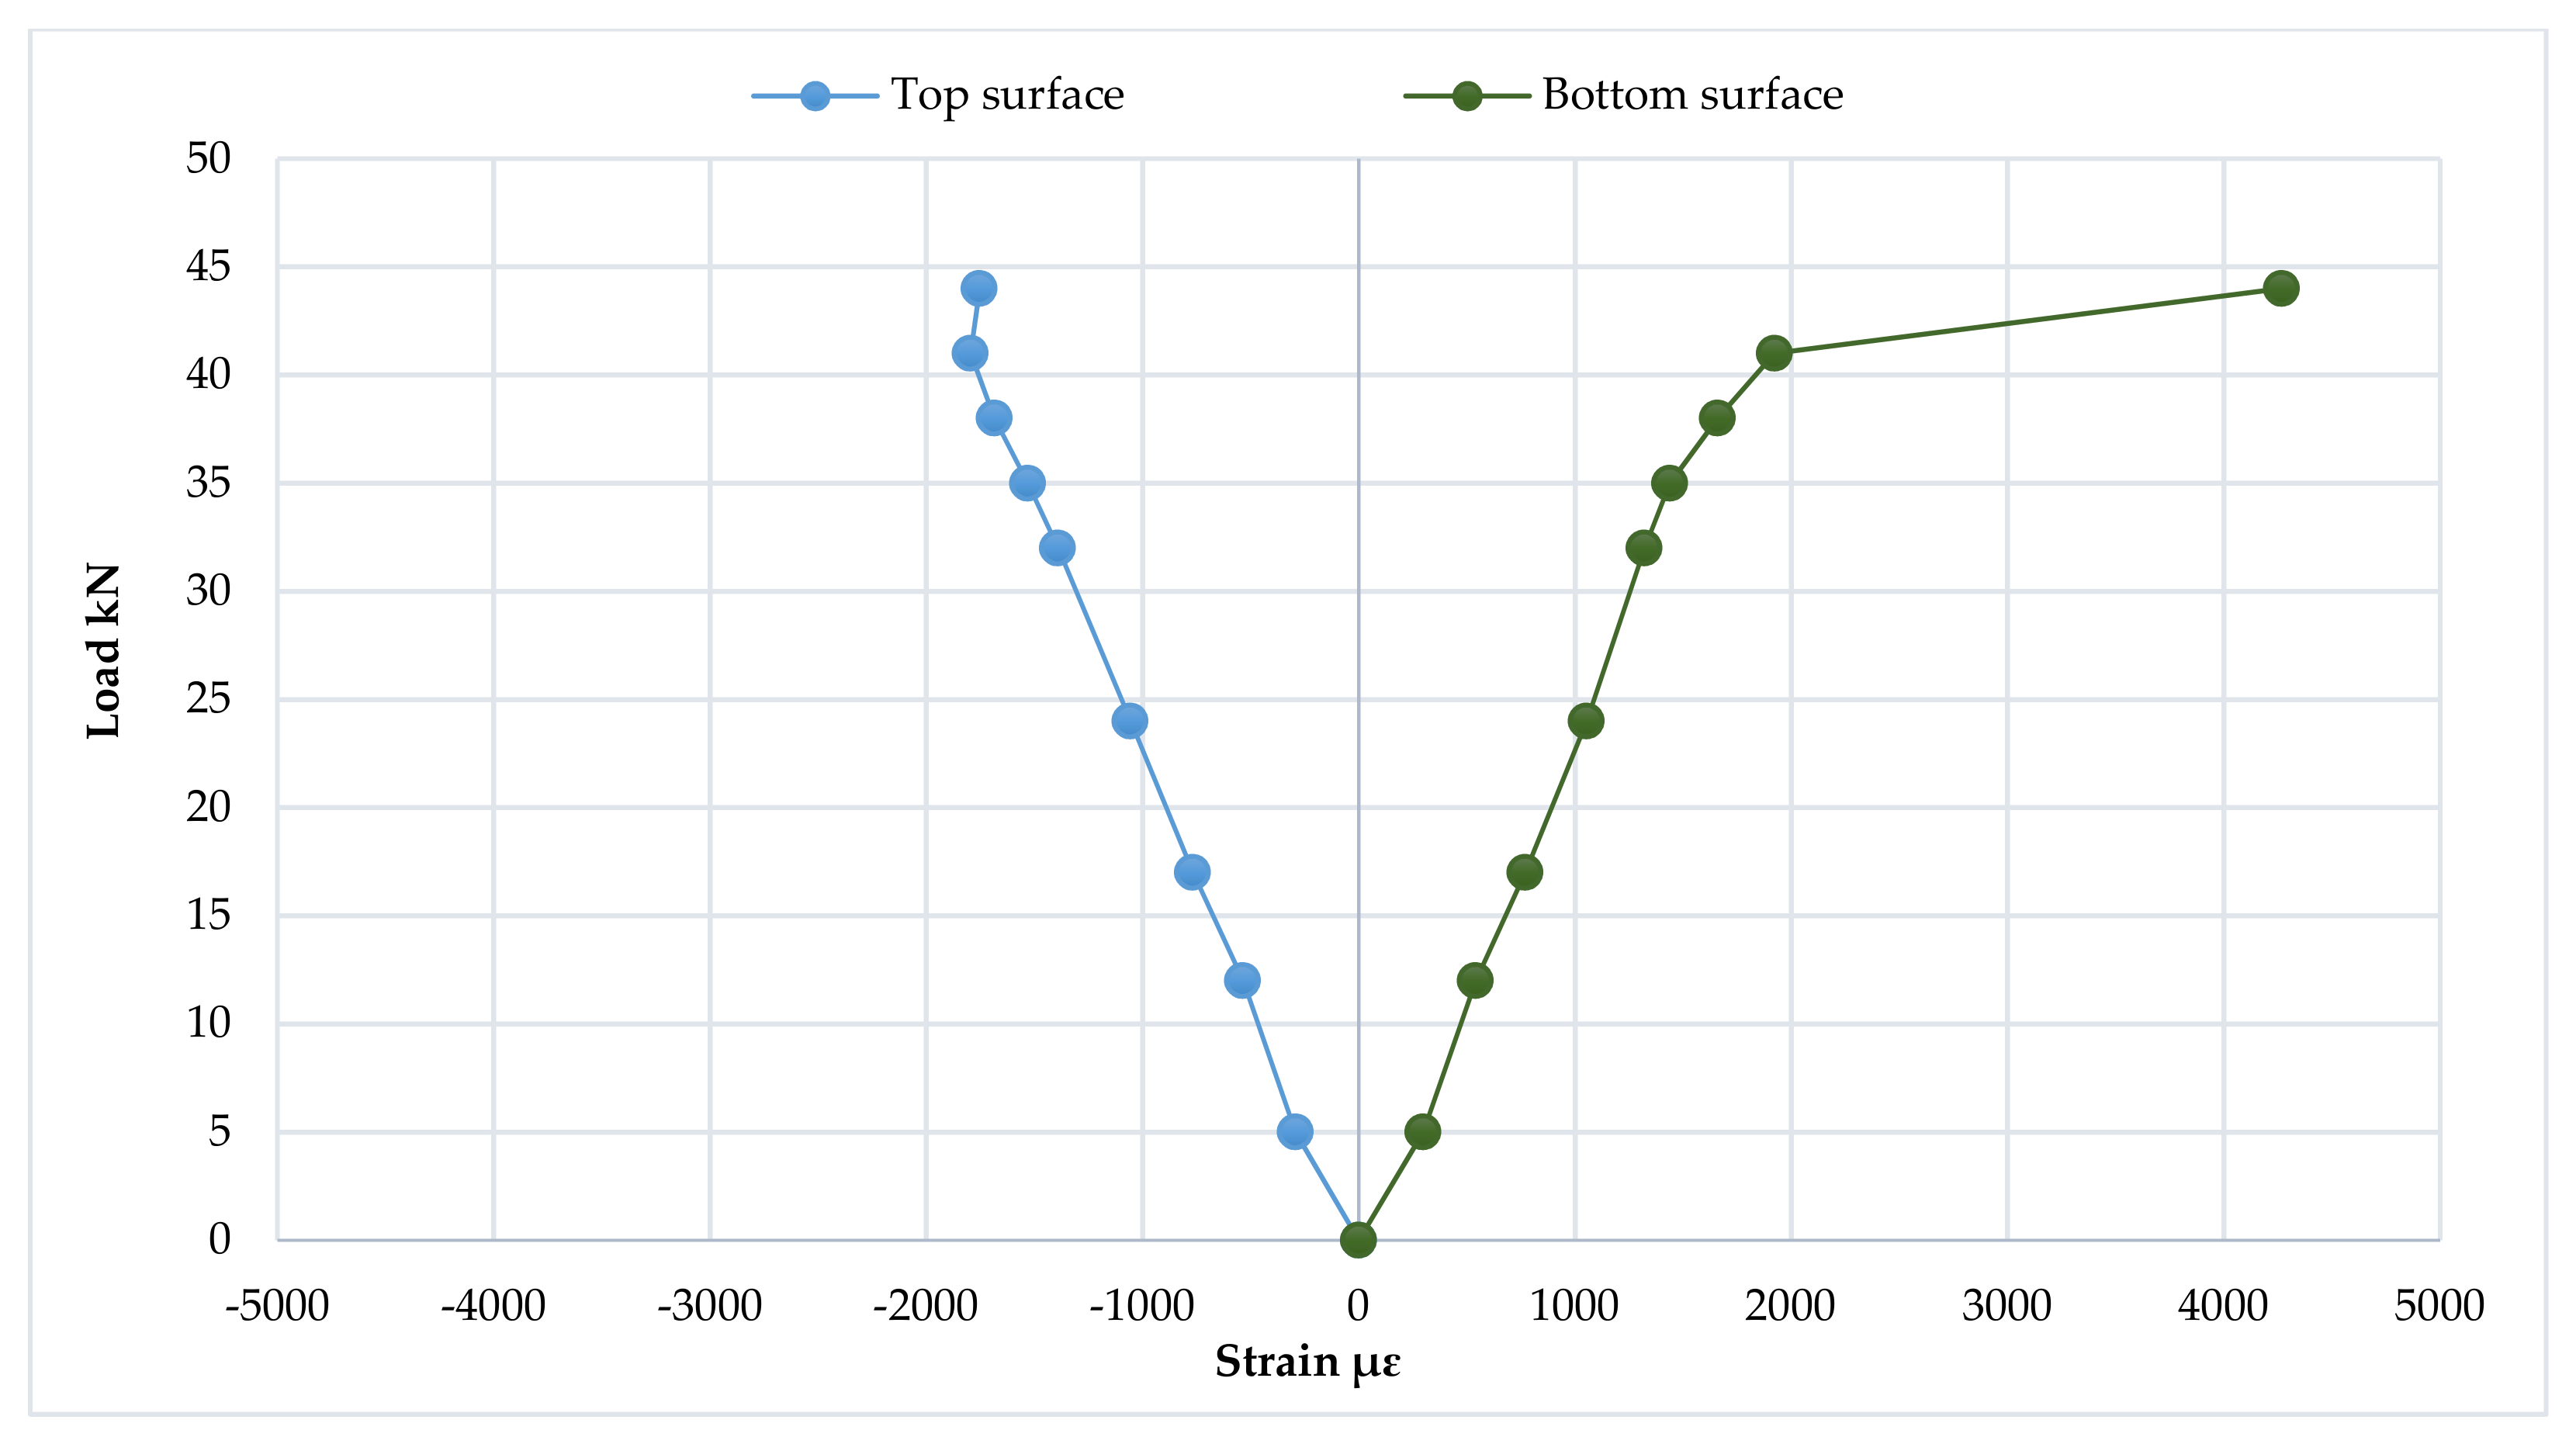
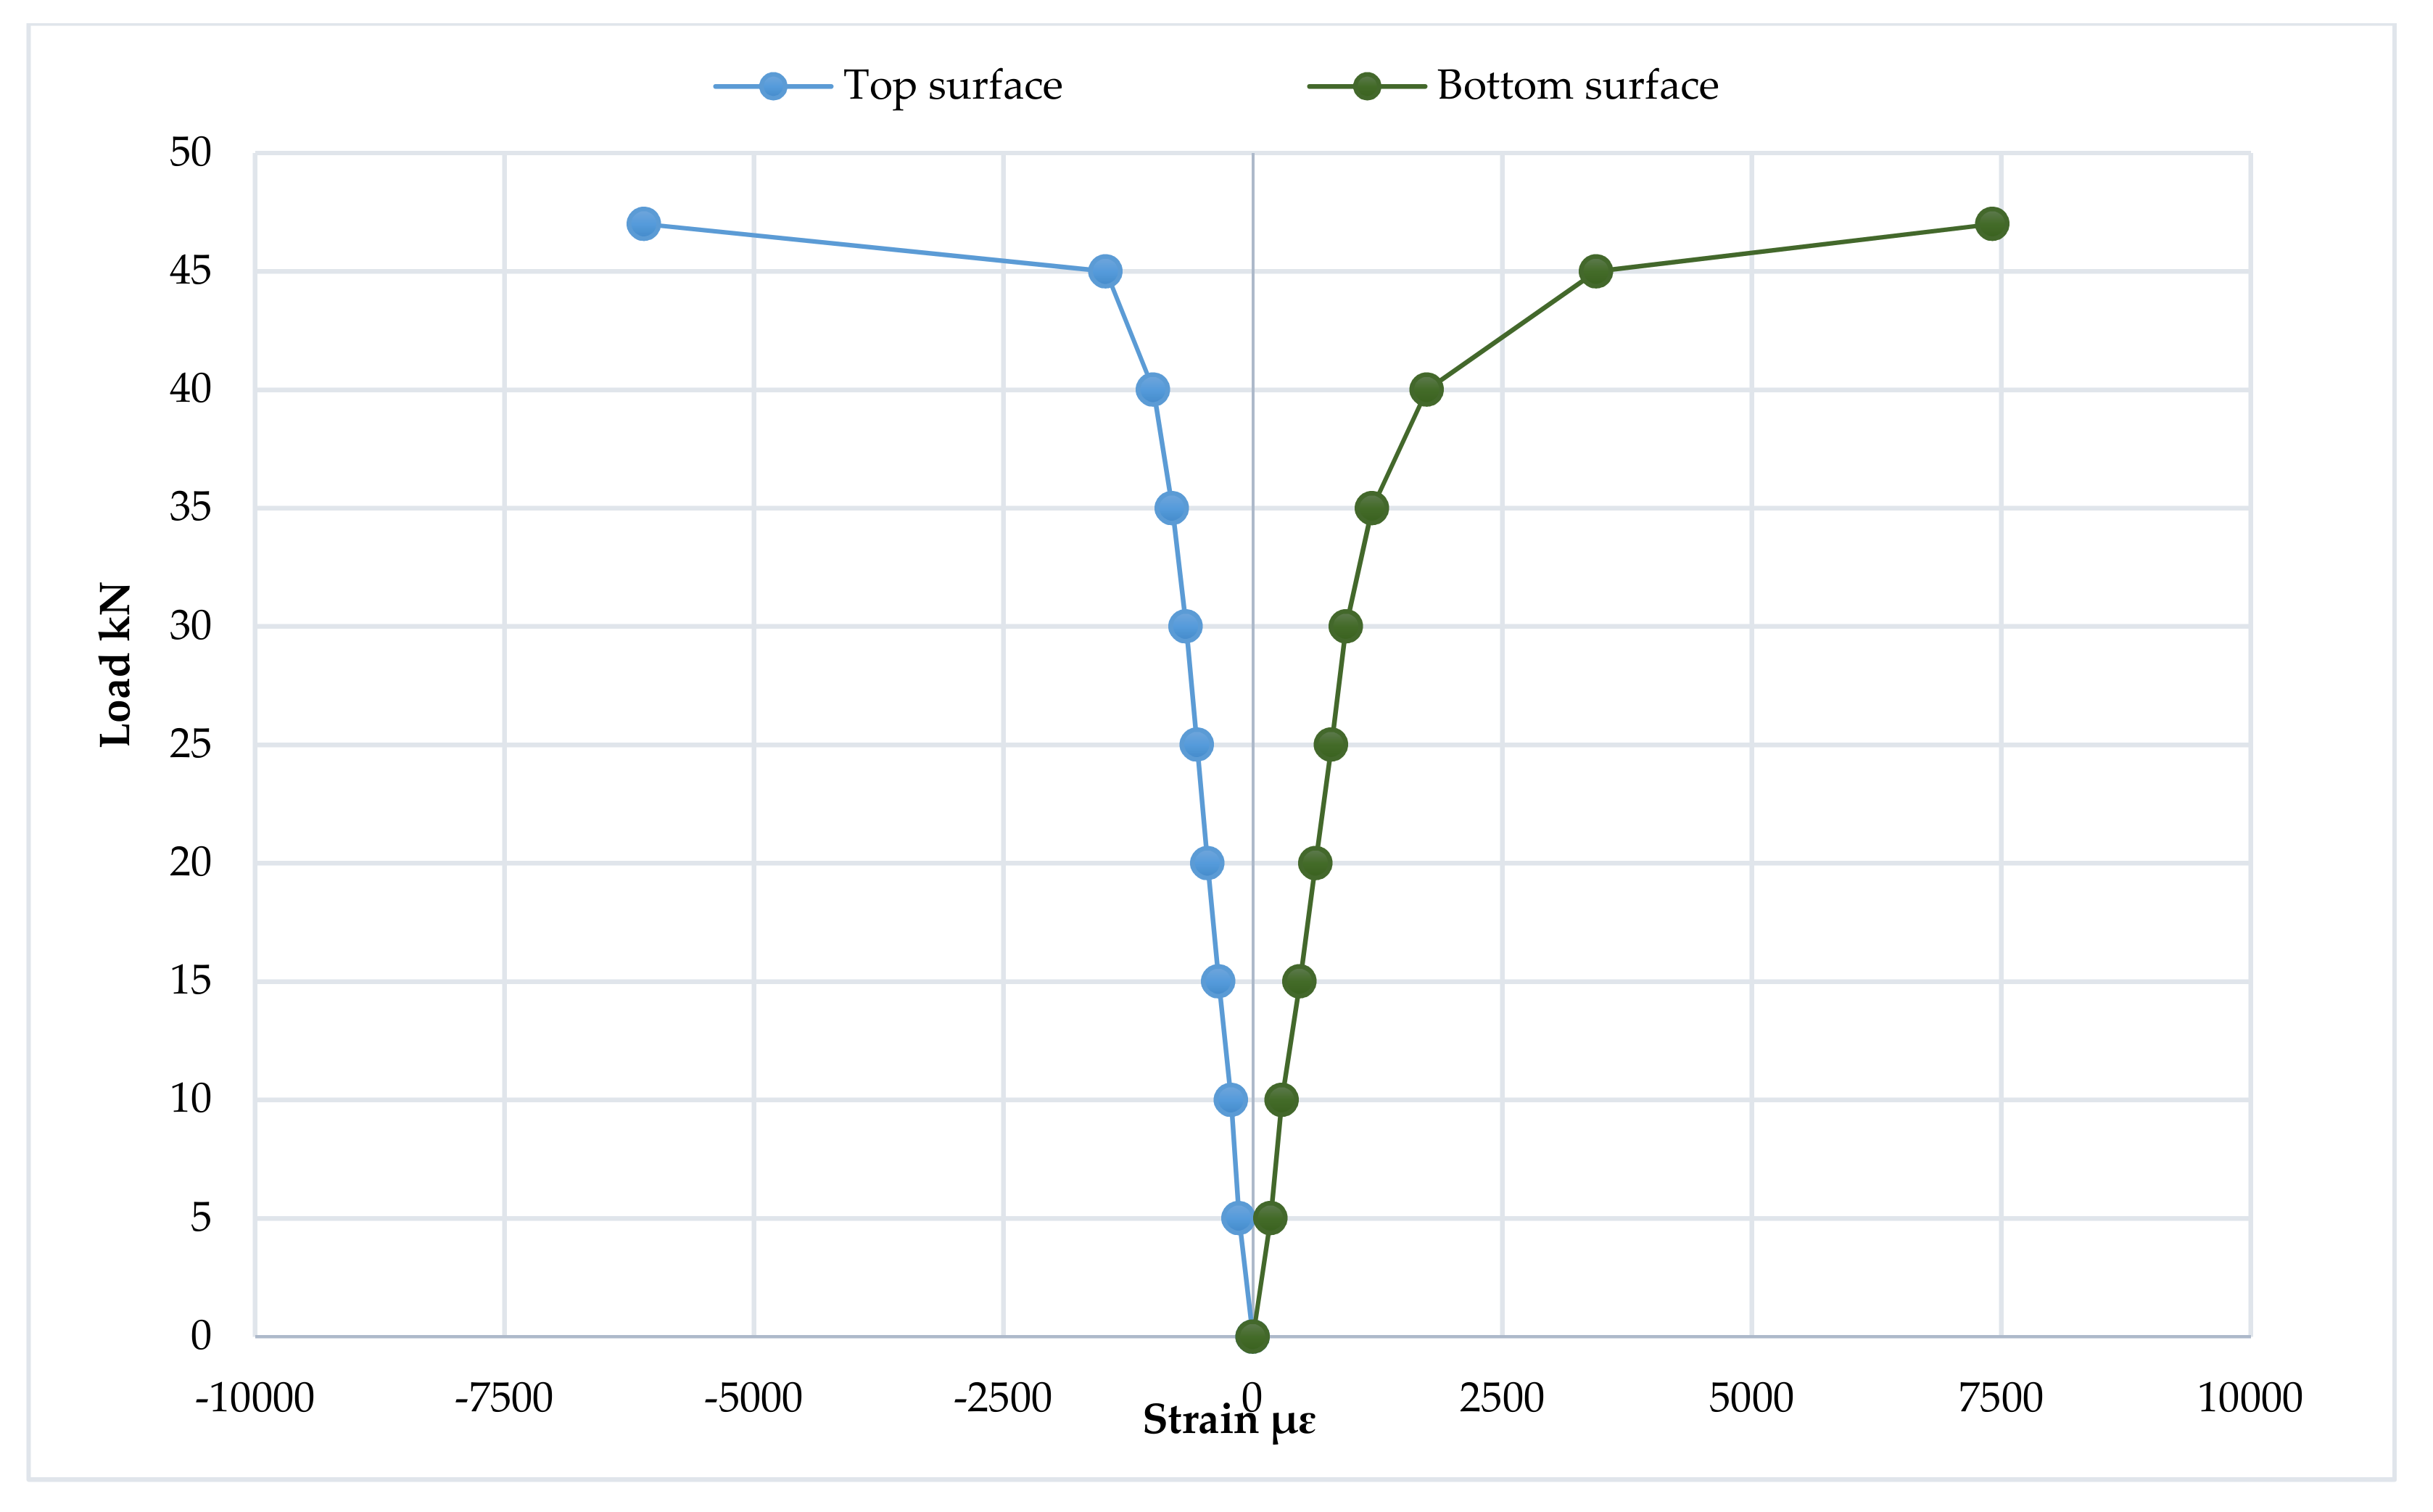
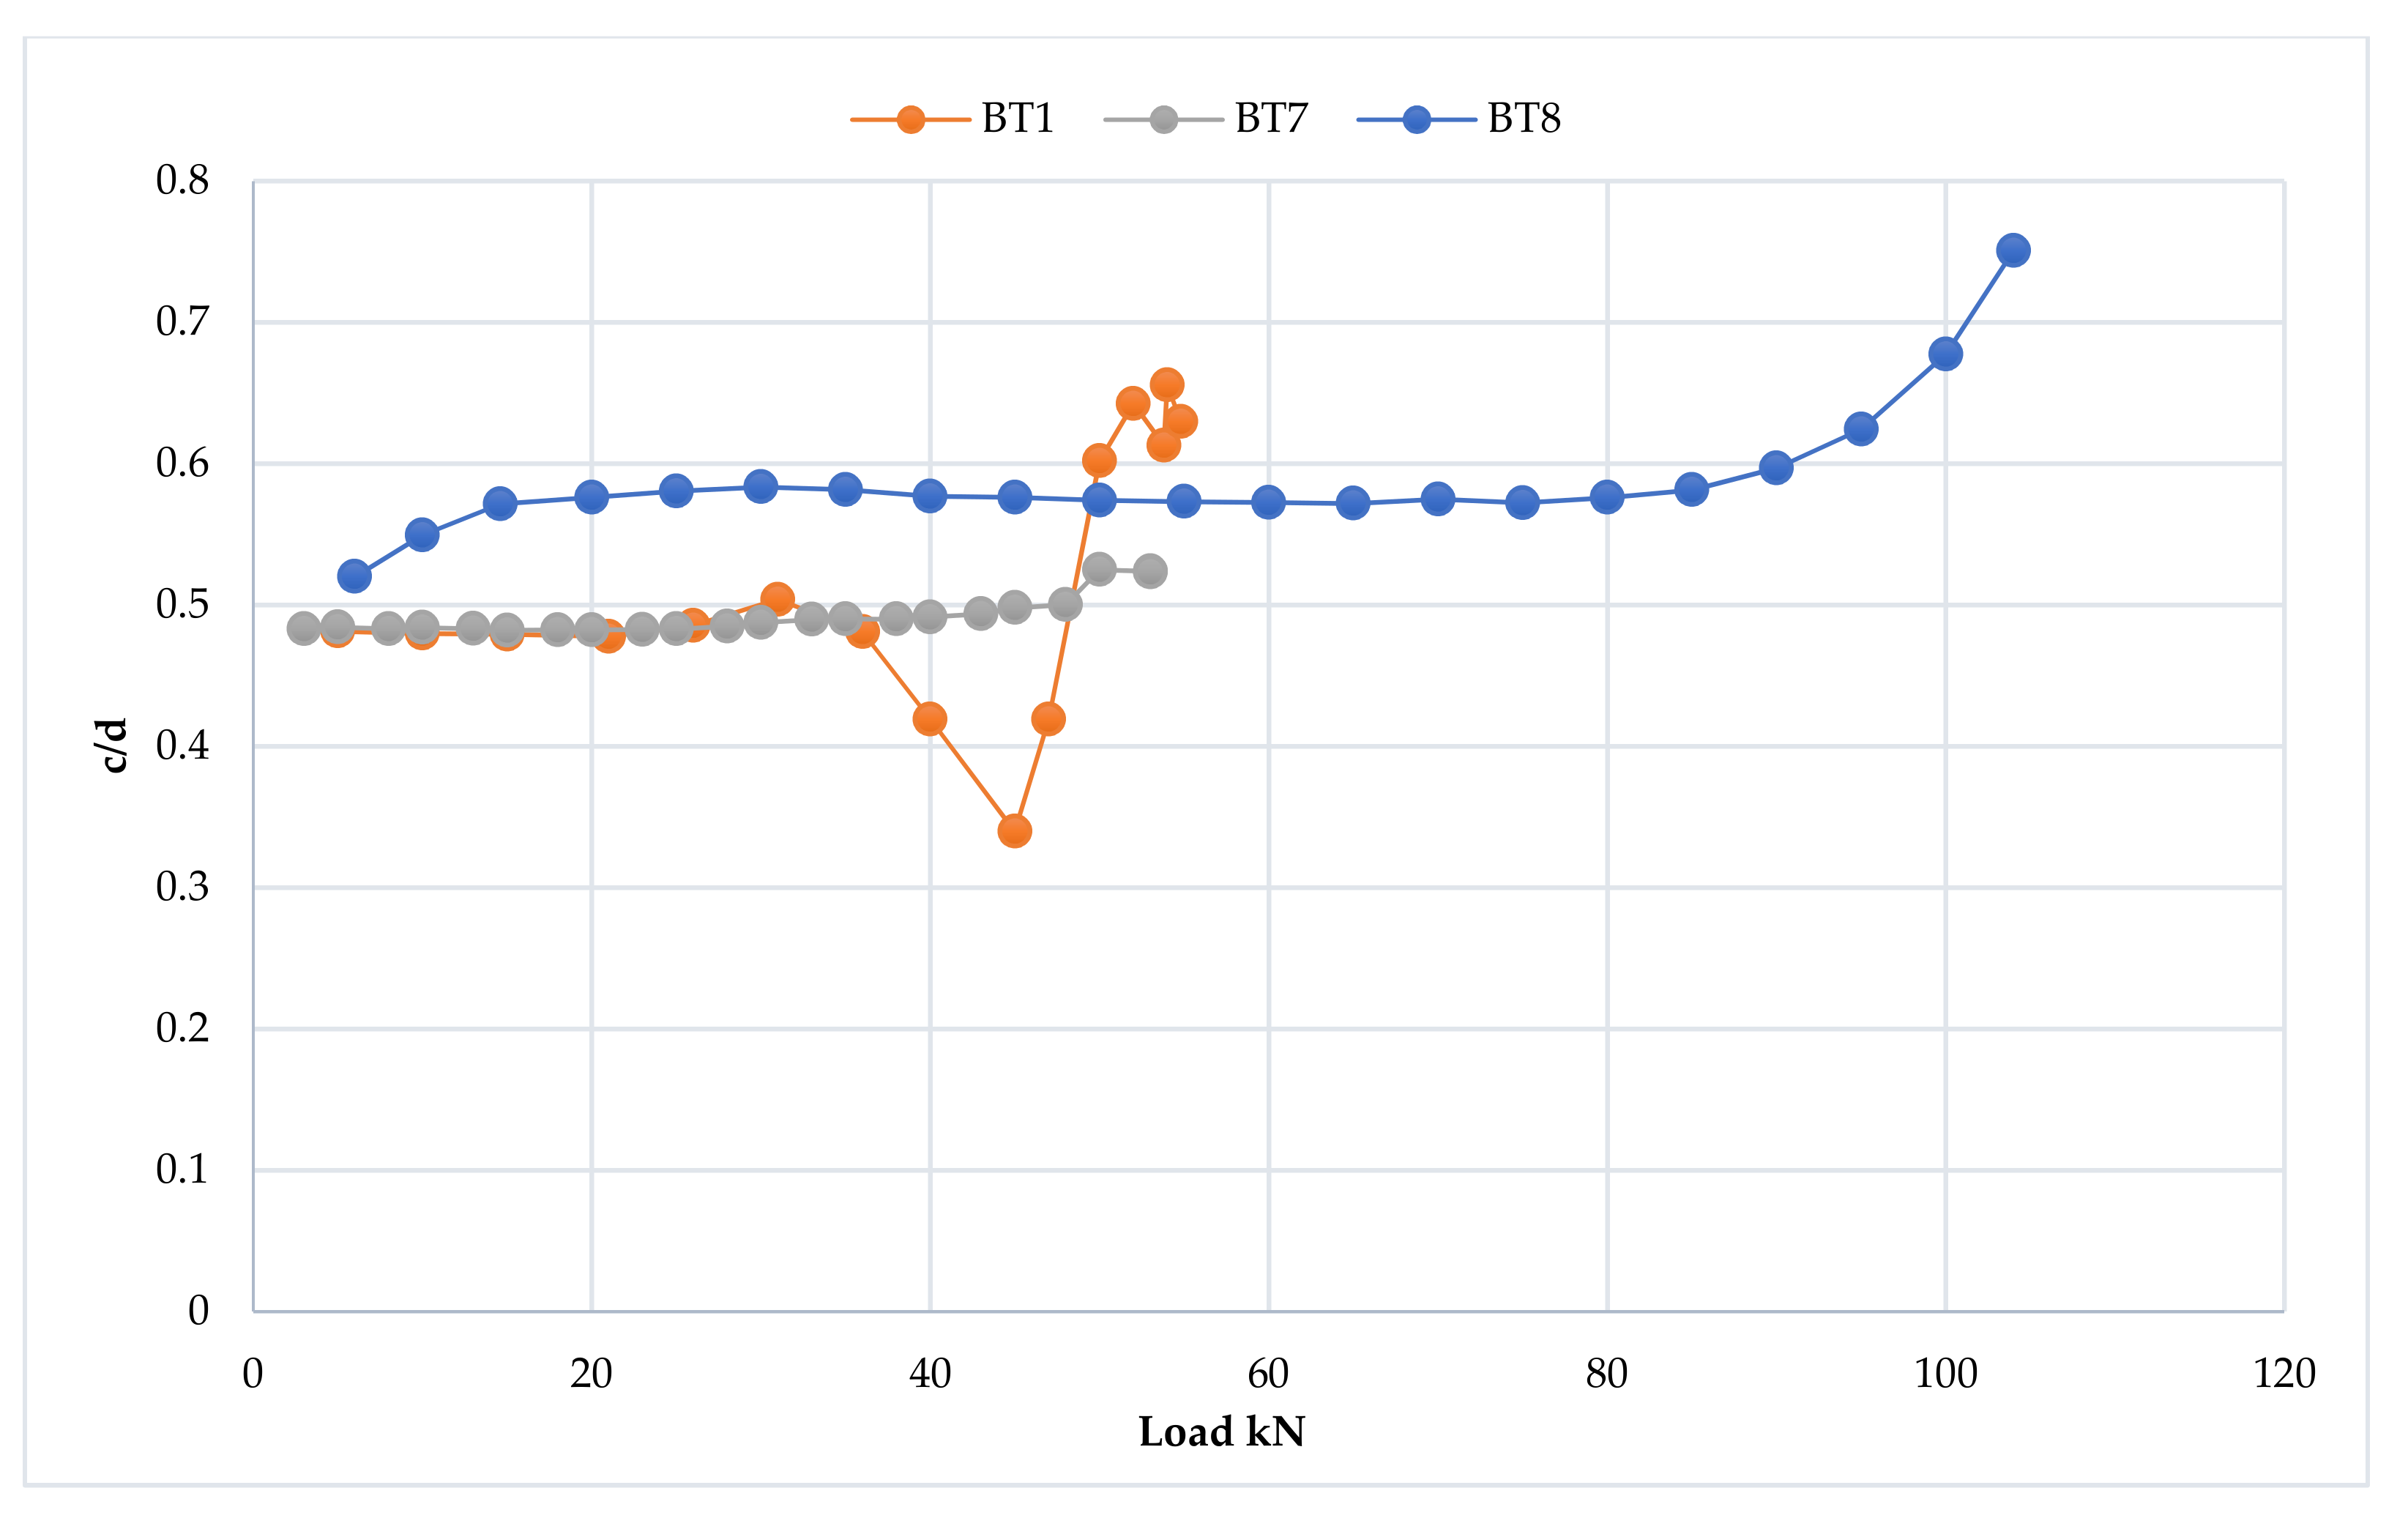
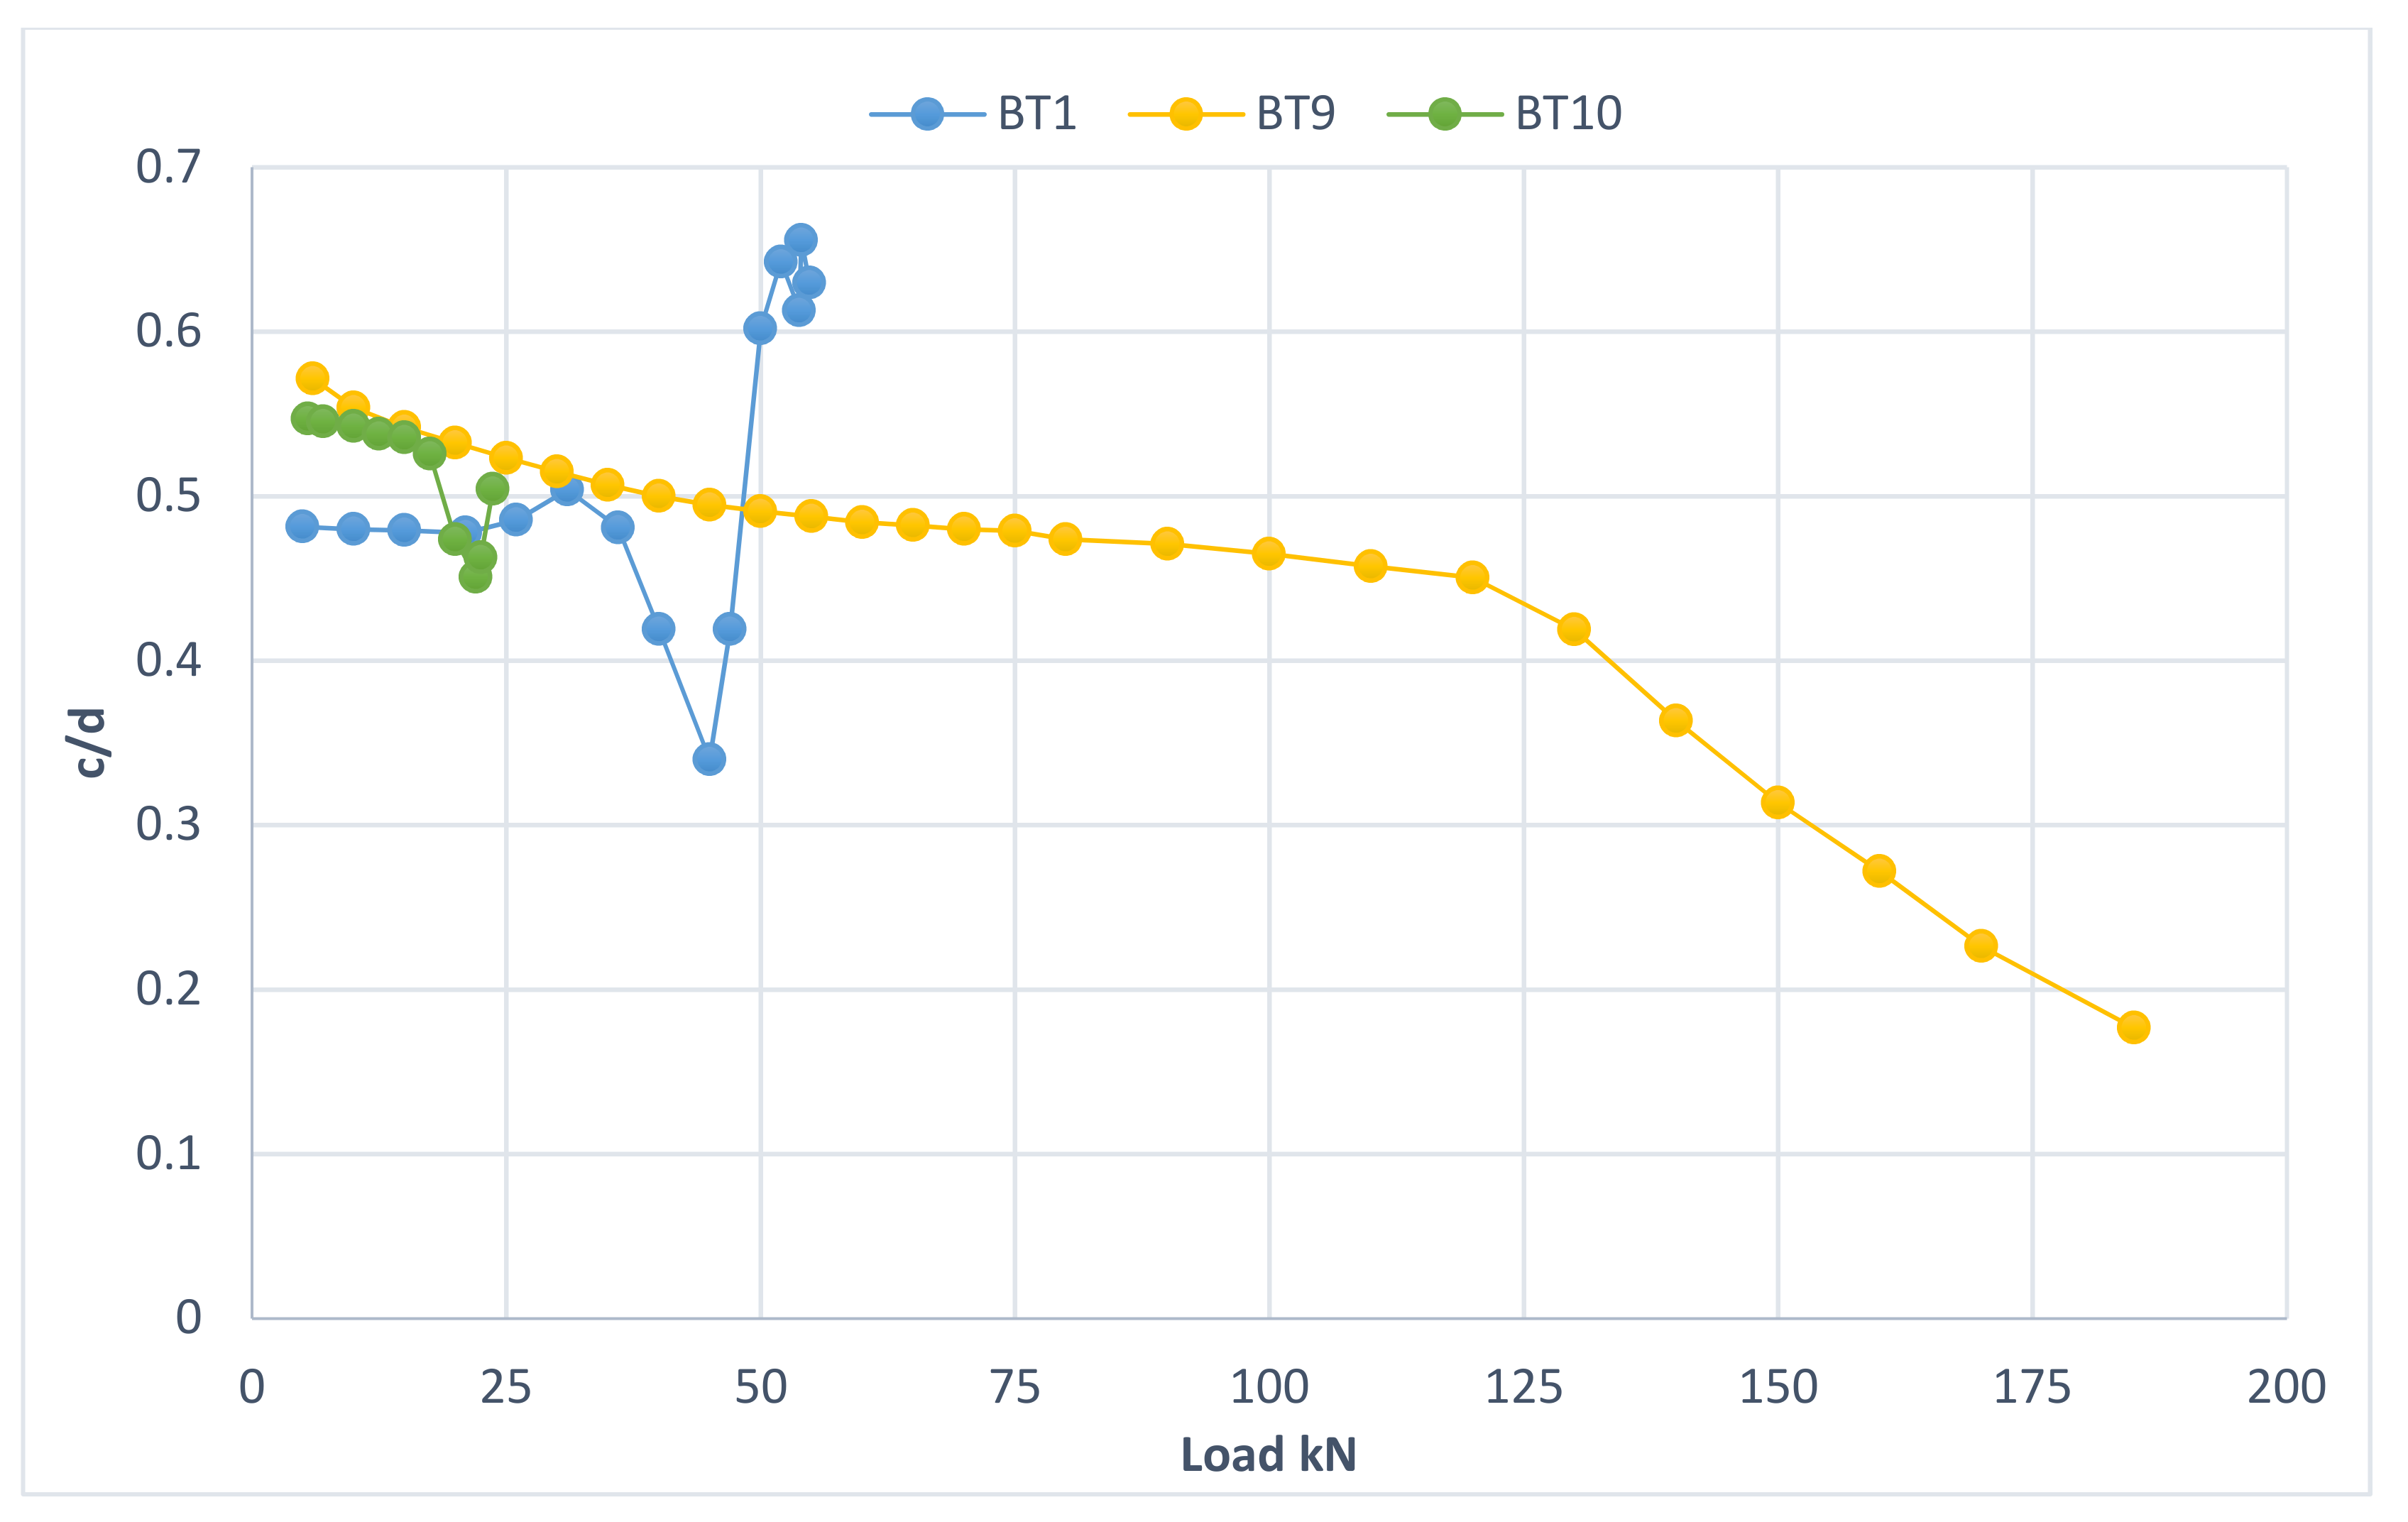
3.6. Mid-Span Strain Distribution and Progression of the Neutral Axis Depth
3.6.1. The First Group
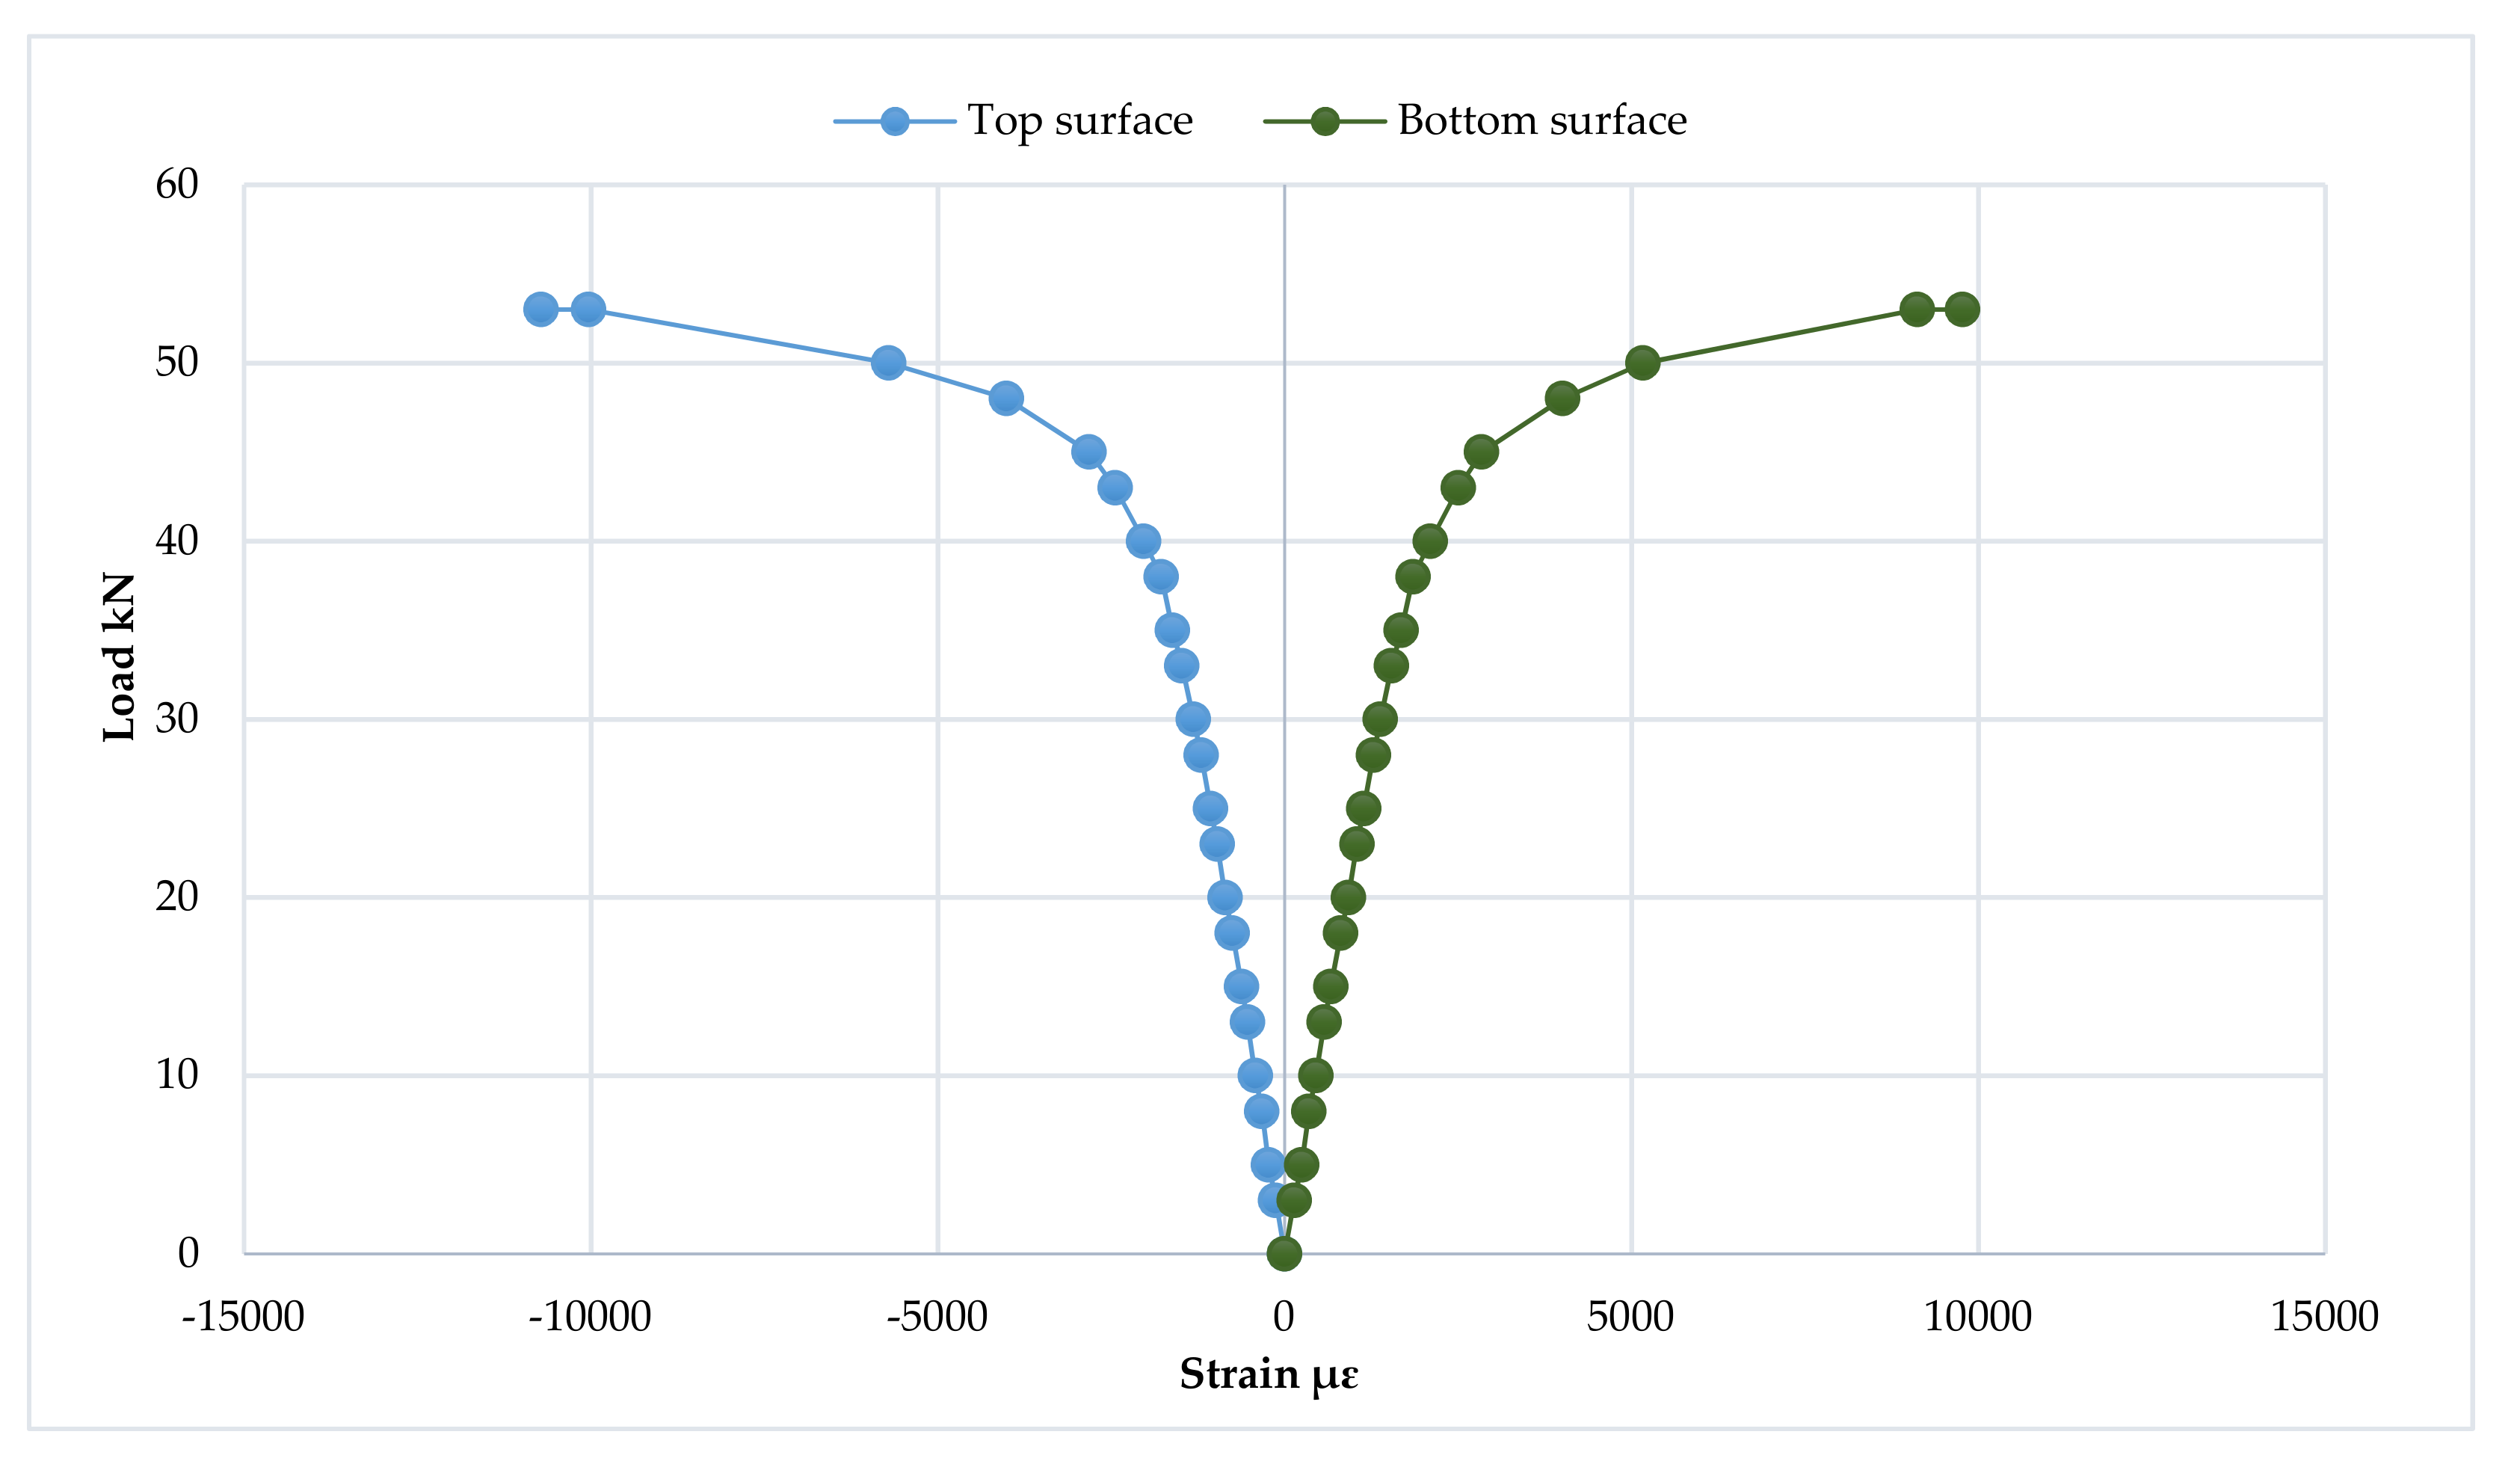
3.6.2. The Second Group
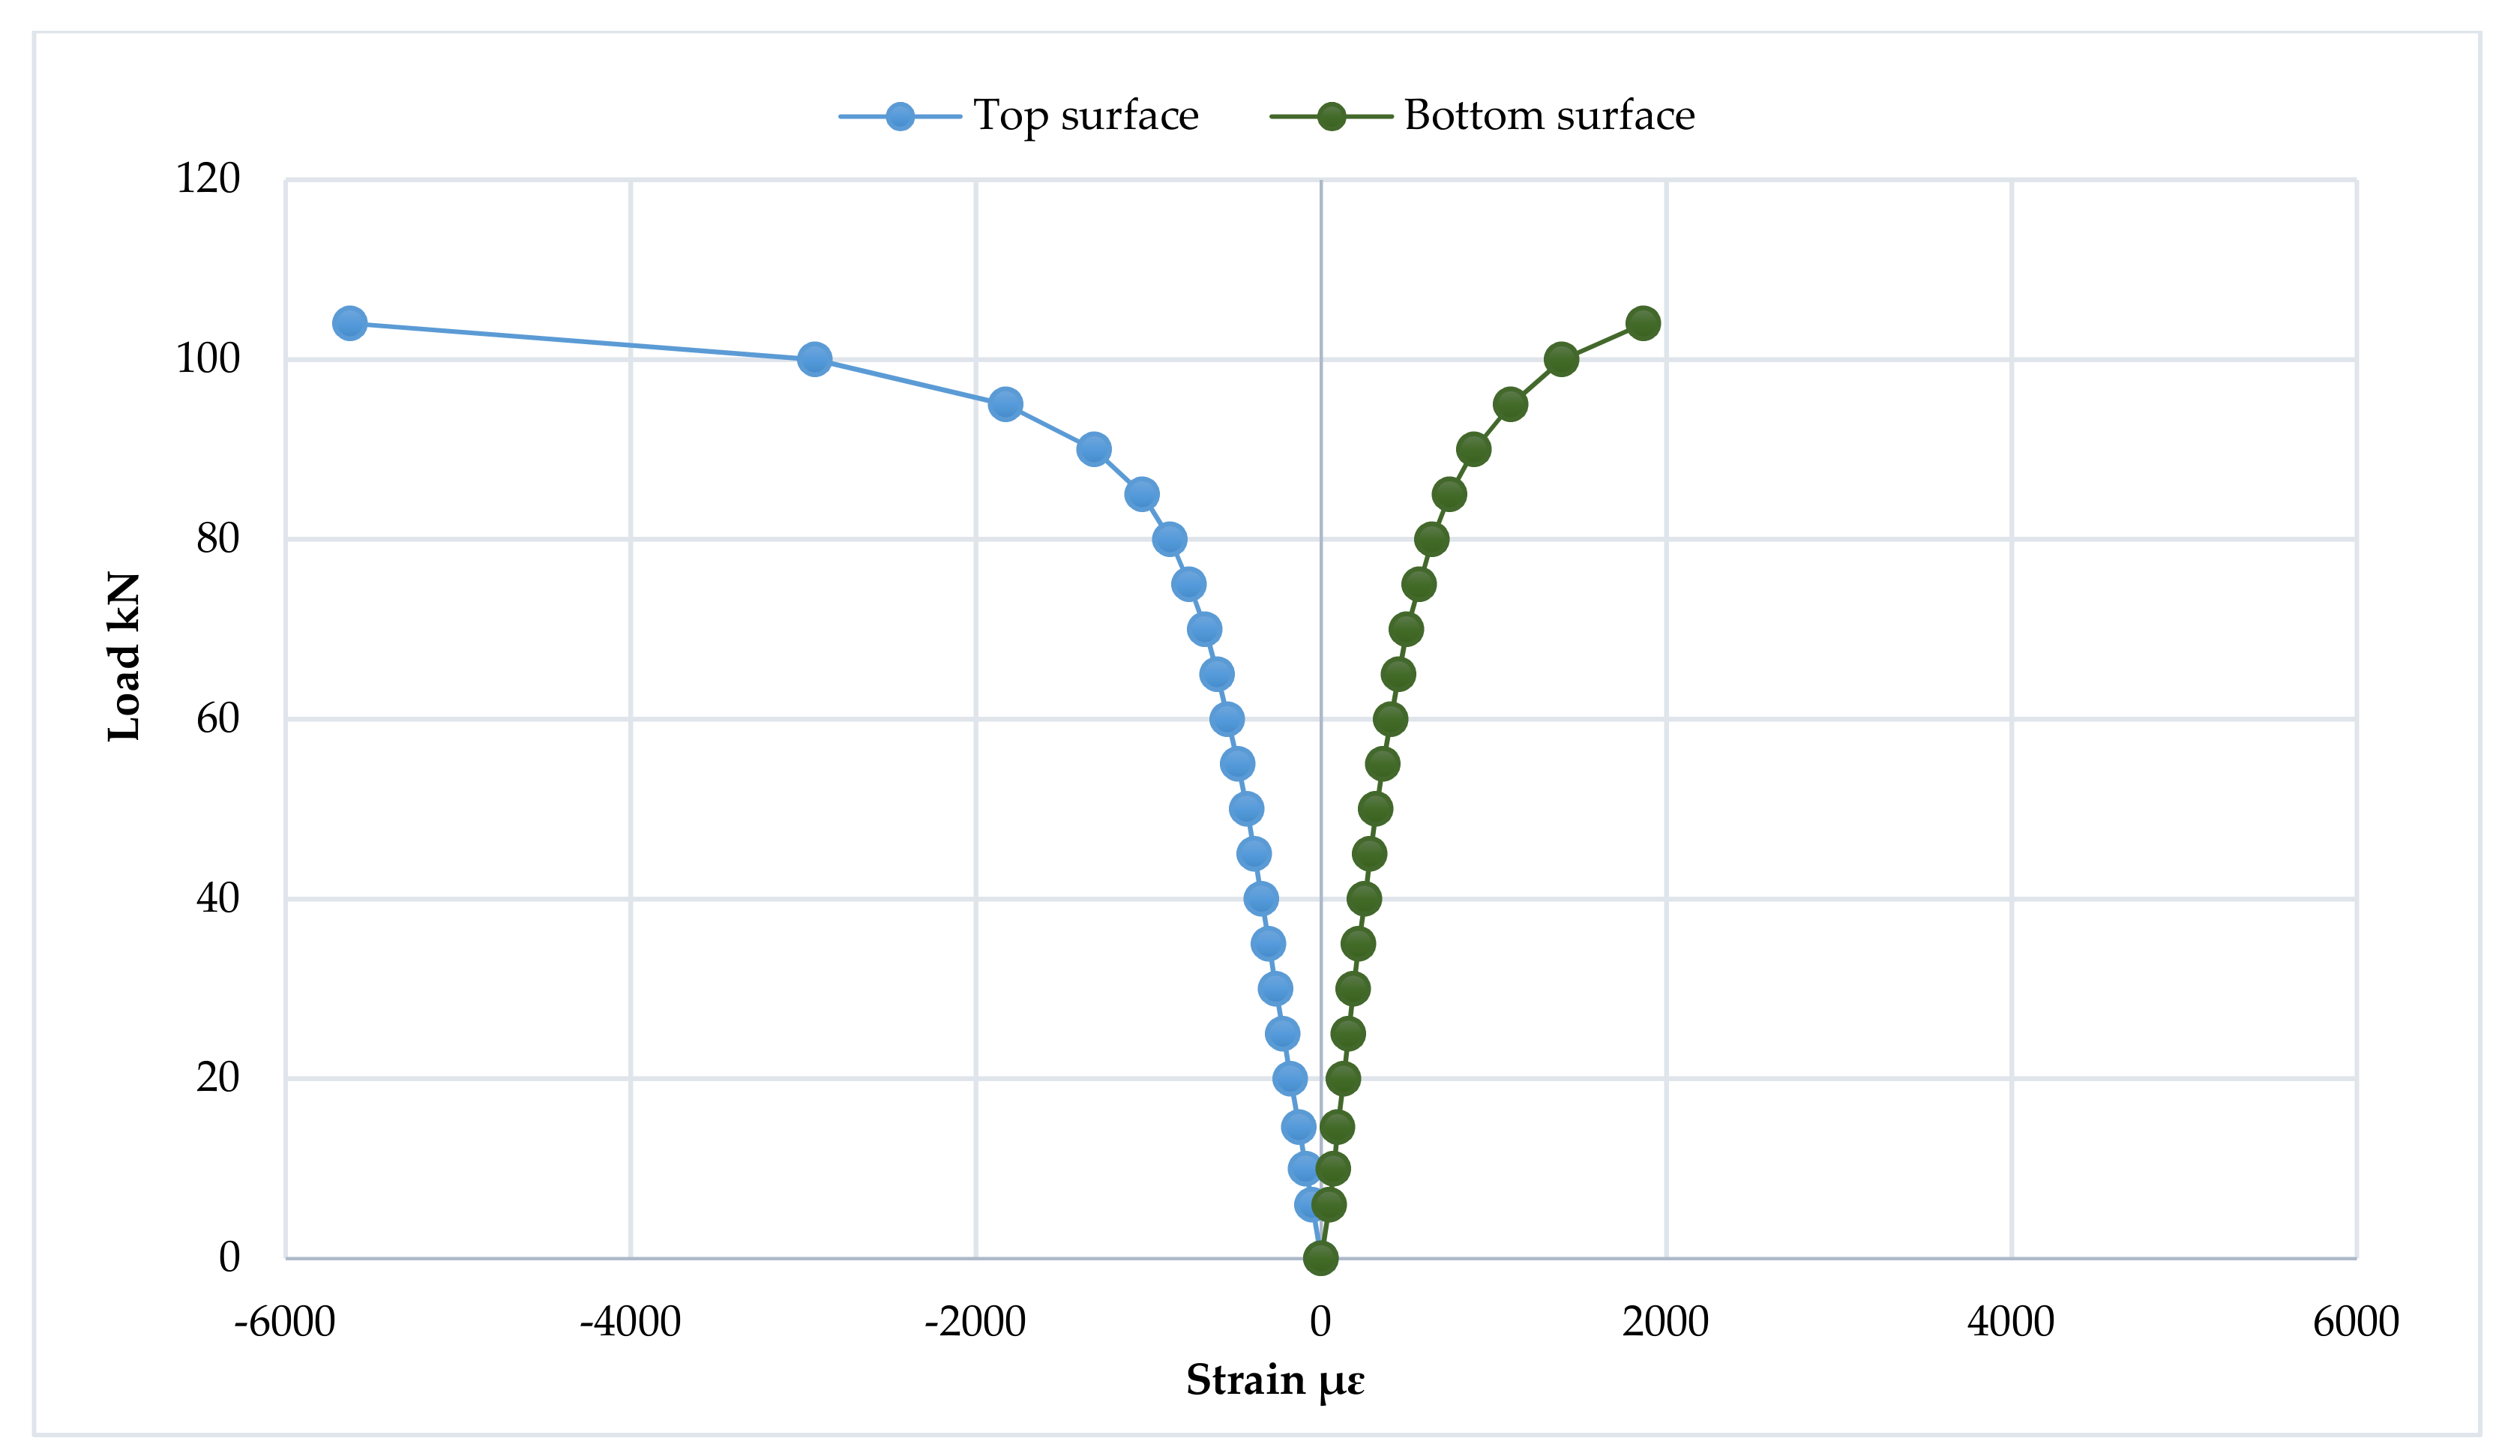
3.6.3. The Third Group
3.6.4. The Fourth Group
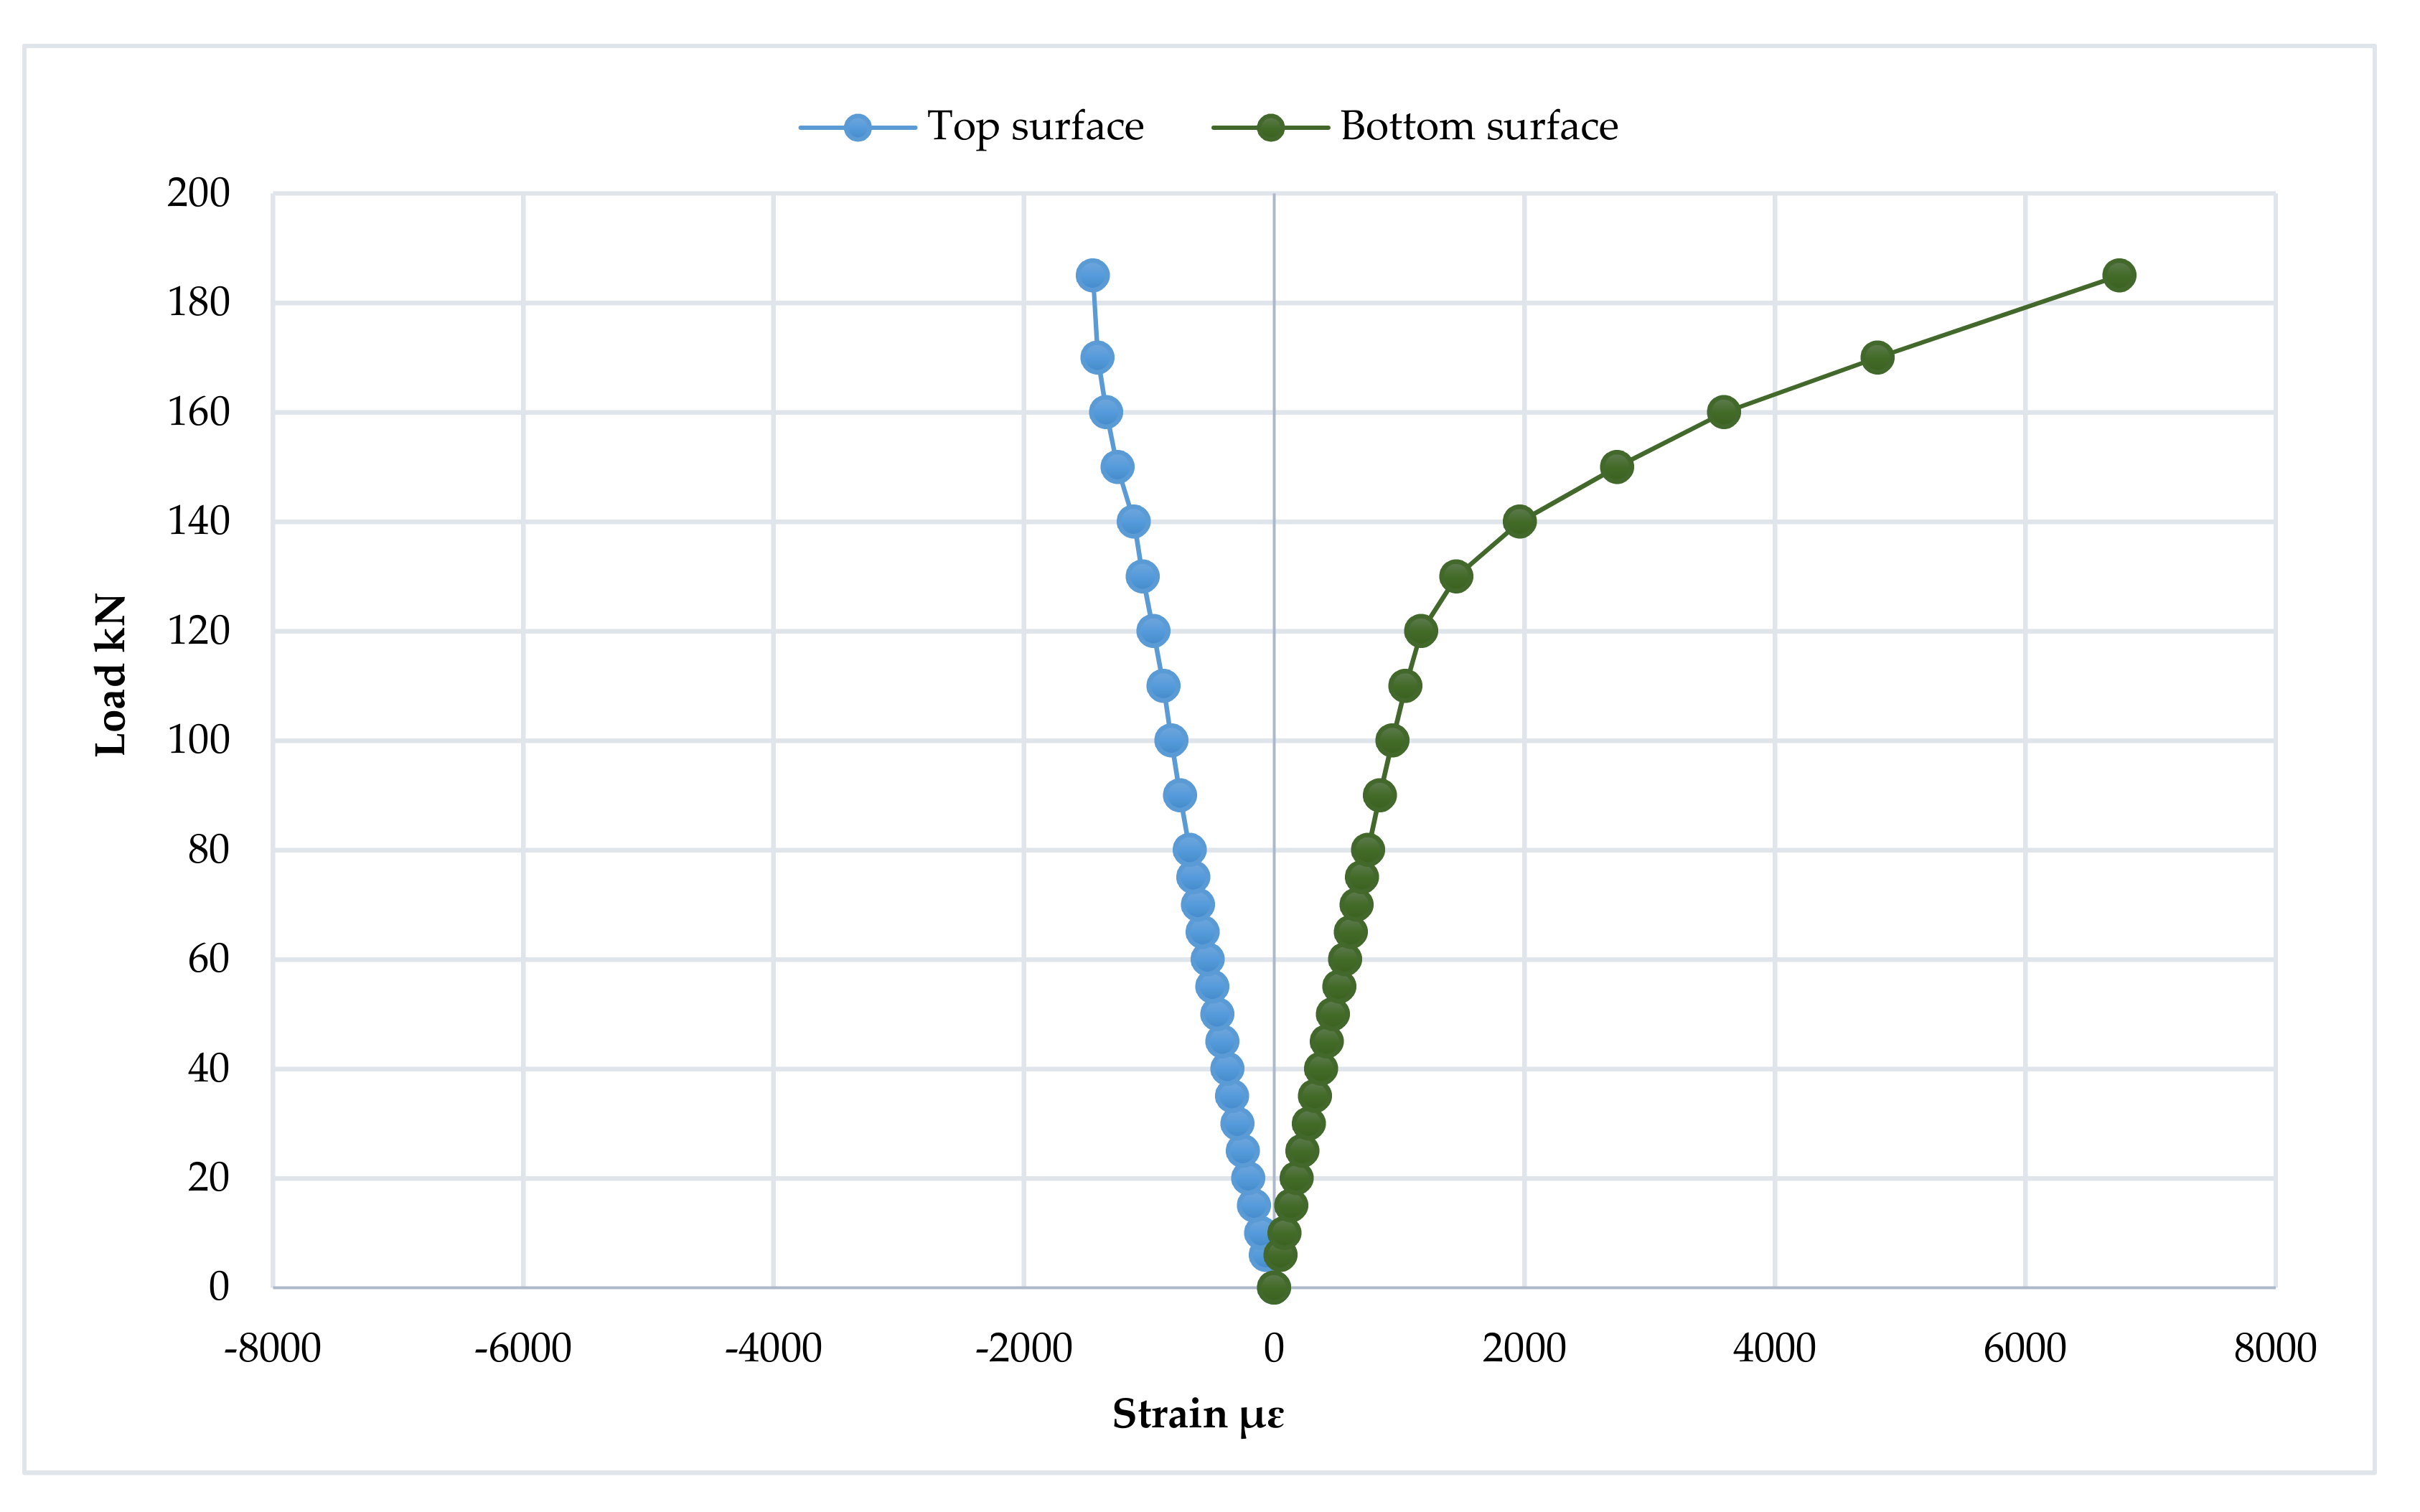
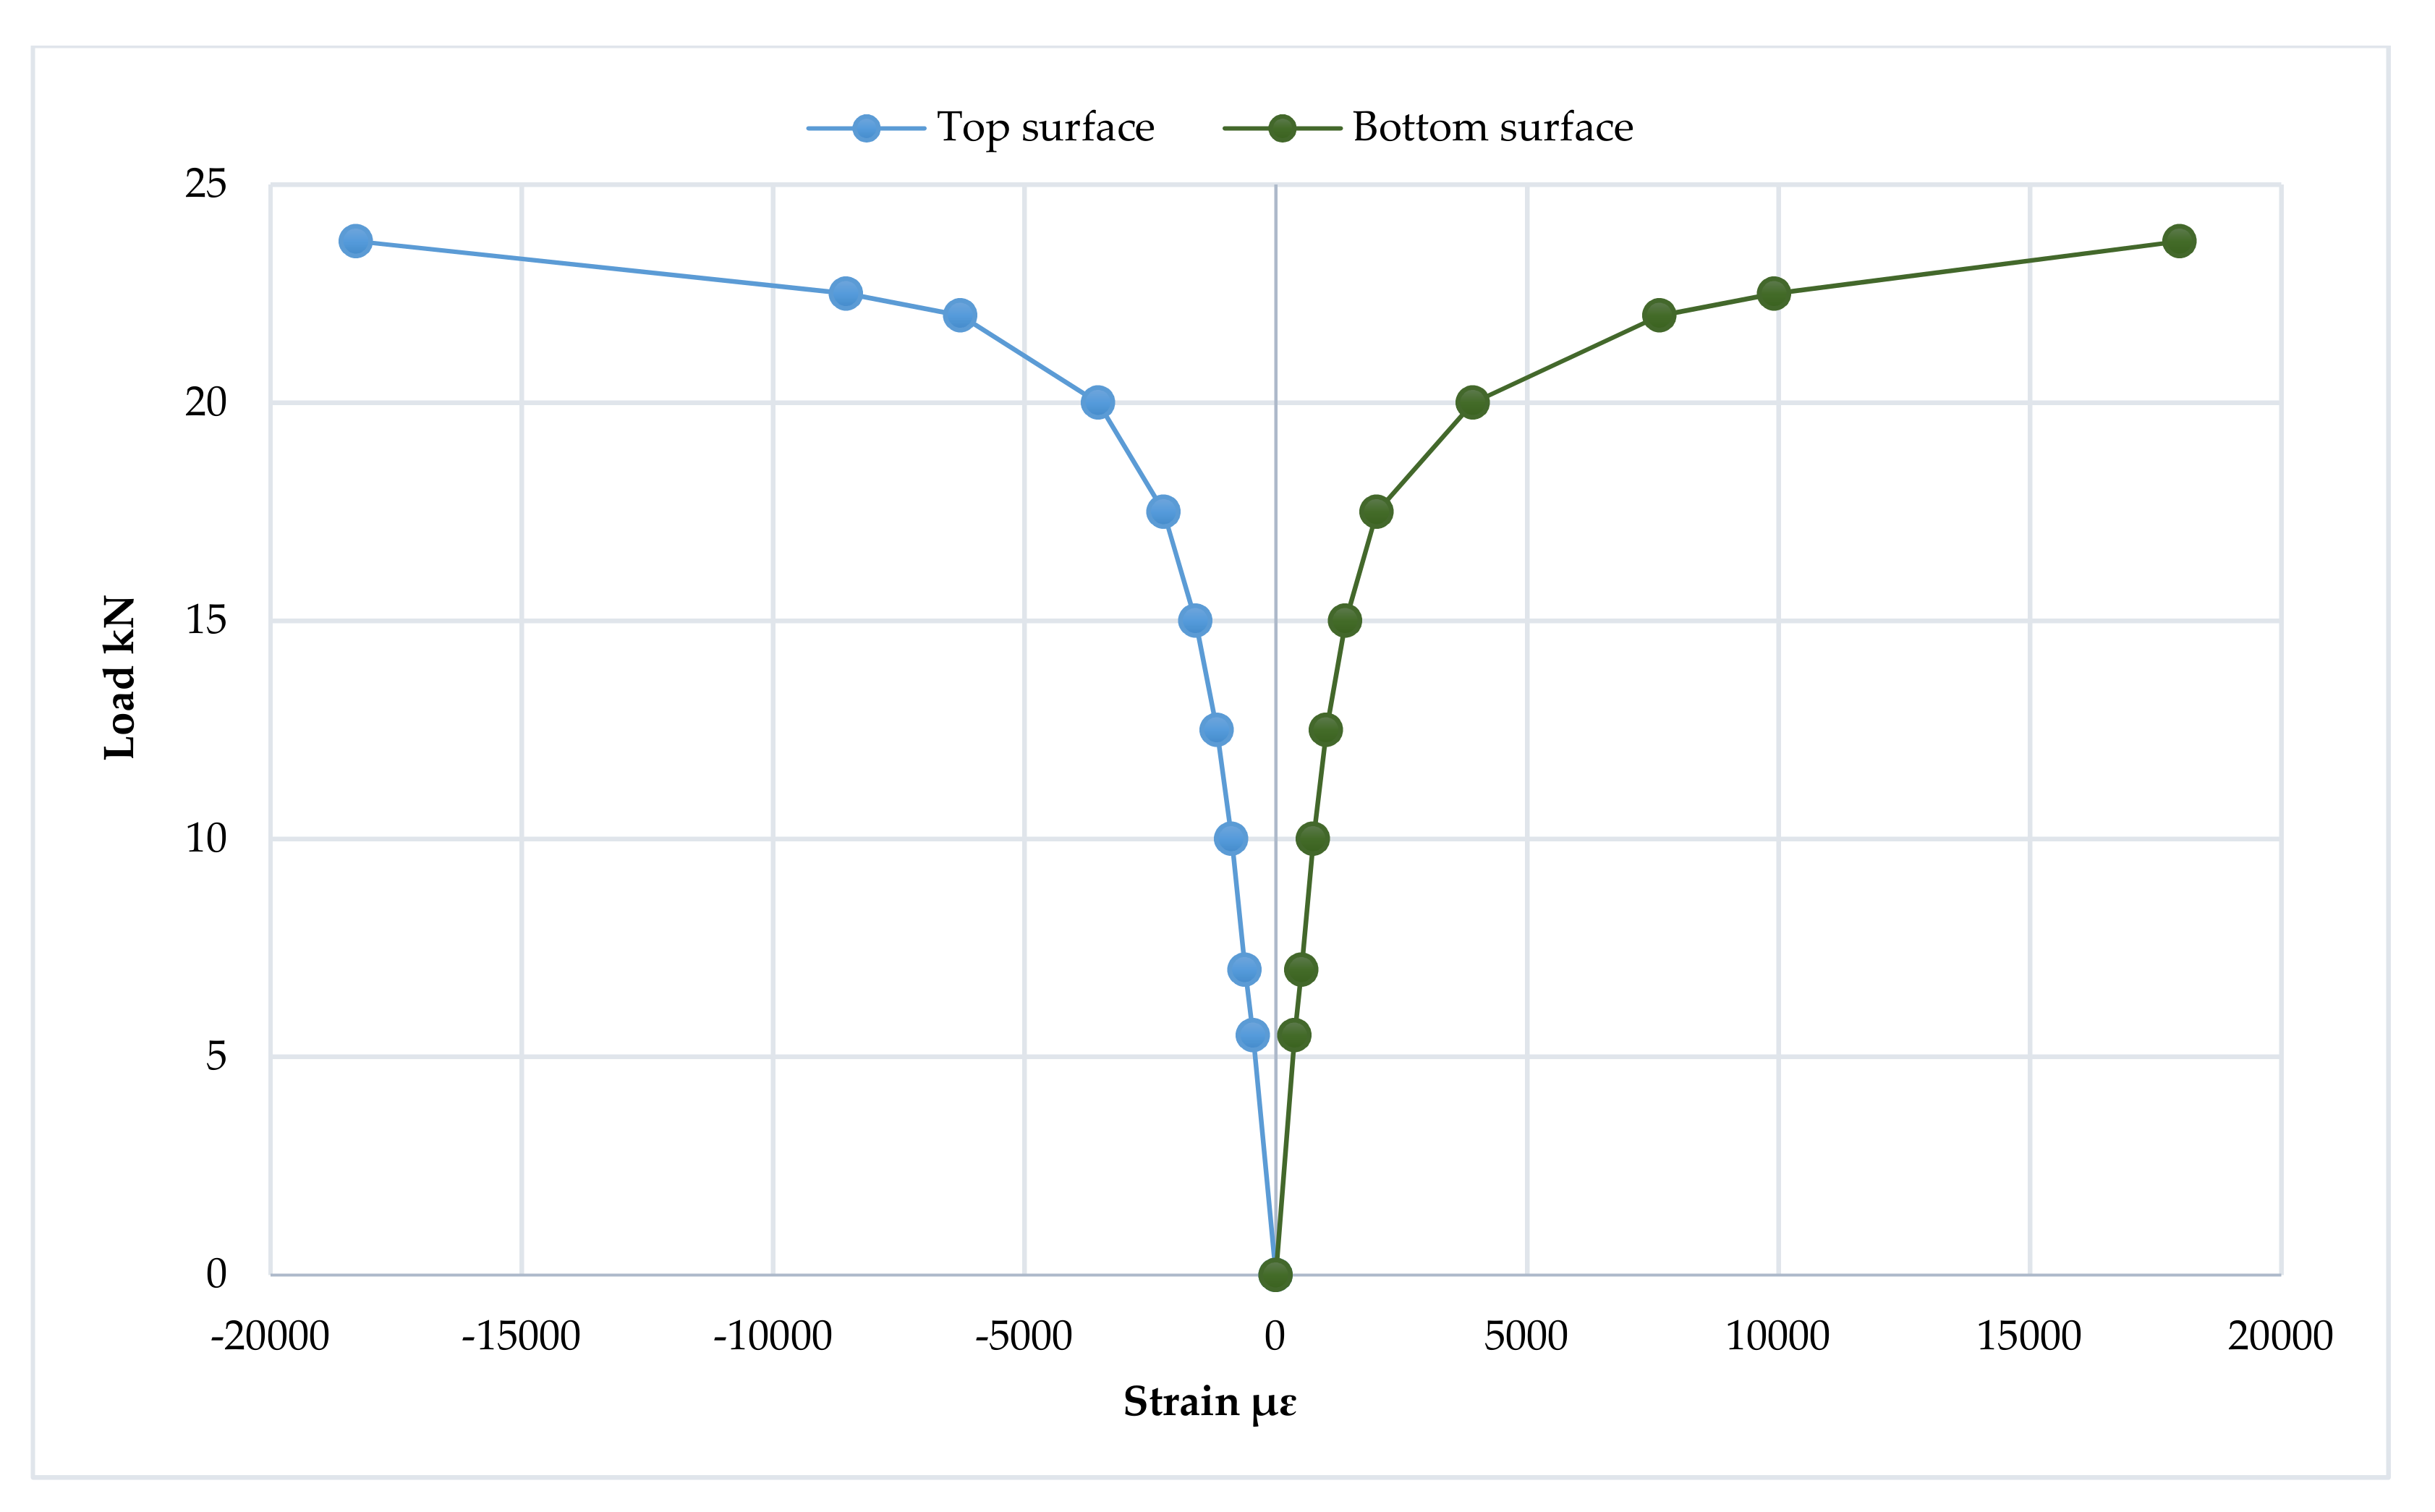
3.7. Strain Distribution at Loading Points
4. Conclusions
Author Contributions
Funding
Institutional Review Board Statement
Informed Consent Statement
Data Availability Statement
Conflicts of Interest
References
- Sabouri, G.S.; Ghol, H.M. Ductility of thin steel plate shear walls. Asian J. Civ. Eng. 2008, 9, 153–166. [Google Scholar]
- Key, P.W.; Hancock, G. A theoretical investigation of the column behaviour of cold-formed square hollow sections. Thin-Walled Struct. 1993, 16, 31–64. [Google Scholar] [CrossRef]
- Ramaji, I.J.; Memari, A.M. Identification of structural issues in design and construction of multi-story modular buildings. In Proceedings of the 1st Residential Building Design and Construction Conference, Bethlehem, PA, USA, 20 February 2013; pp. 294–303. [Google Scholar]
- Elchalakani, M.; Zhao, X.-L.; Grzebieta, R. Tests of Cold-Formed Circular Tubular Braces under Cyclic Axial Loading. J. Struct. Eng. 2003, 129, 507–514. [Google Scholar] [CrossRef]
- Nuñez, E.; Boainy, N.; González, F.; Torres, R.; Picón, R.; Guerrero, N. Cyclic Behavior of Hollow Section Beam–Column Moment Connection: Experimental and Numerical Study. Metals 2020, 10, 1608. [Google Scholar] [CrossRef]
- ASTM A500; Standard Specification for Cold-Formed Welded and Seamless Carbon Steel Structural Tubing in Rounds and Shapes. ASTM International: West Conshohocken, PA, USA, 2021.
- Lu, L.H.; Wardenier, J. The Static Strength of Uniplanar and Multiplanar Connections between I-Beams and RHS Columns Loaded by Axial Compression; No. CONF-950695-; American Society of Mechanical Engineers: New York, NY, USA, 1995. [Google Scholar]
- Lu, L.; Wardenier, J. The ultimate strength of I-beam to RHS column connections. J. Constr. Steel Res. 1998, 46, 250–251. [Google Scholar] [CrossRef]
- Hajjar, J.F. Concrete-filled steel tube columns under earthquake loads. Prog. Struct. Eng. Mater. 2000, 2, 72–81. [Google Scholar] [CrossRef]
- Nakashima, M.; Liu, D. Instability and Complete Failure of Steel Columns Subjected to Cyclic Loading. J. Eng. Mech. 2005, 131, 559–567. [Google Scholar] [CrossRef]
- Fadden, M.; McCormick, J. Finite element model of the cyclic bending behavior of hollow structural sections. J. Constr. Steel Res. 2014, 94, 64–75. [Google Scholar] [CrossRef]
- Packer, J.A. Tubular construction. Prog. Struct. Eng. Mater. 2000, 2, 41–49. [Google Scholar] [CrossRef]
- Wang, T.; McCormick, J.; Yoshitake, N.; Pan, P.; Murata, Y.; Nakashima, M. Collapse simulation of a four-story steel moment frame by a distributed online hybrid test. Earthq. Eng. Struct. Dyn. 2008, 37, 955–974. [Google Scholar] [CrossRef]
- Hancock, G.J.; Zhao, X.-L. Research into the strength of cold-formed tubular sections. J. Constr. Steel Res. 1992, 23, 55–72. [Google Scholar] [CrossRef]
- Elchalakani, M.; Zhao, X.; Grzebieta, R. Plastic Slenderness Limits for Cold-Formed Circular Hollow Sections. Aust. J. Struct. Eng. 2002, 3, 127–141. [Google Scholar] [CrossRef]
- Guo, L.; Yang, S.; Jiao, H. Behavior of thin-walled circular hollow section tubes subjected to bending. Thin-Walled Struct. 2013, 73, 281–289. [Google Scholar] [CrossRef] [Green Version]
- Yao, Y.; Quach, W.-M.; Young, B. Finite element-based method for residual stresses and plastic strains in cold-formed steel hollow sections. Eng. Struct. 2019, 188, 24–42. [Google Scholar] [CrossRef]
- Korol, R.M.; Hudoba, J. Plastic Behavior of Hollow Structural Sections. J. Struct. Div. 1972, 98, 1007–1023. [Google Scholar] [CrossRef]
- Nishiyama, I.; Morino, S. US-Japan cooperative earthquake research program on CFT structures: Achievements on the Japanese side. Prog. Struct. Eng. Mater. 2004, 6, 39–55. [Google Scholar] [CrossRef]
- Dwyer, T.J.; Galambos, T.V. Plastic Behavior of Tubular Beams Columns. J. Struct. Div. 1965, 91, 153–168. [Google Scholar] [CrossRef]
- Fadden, M.; McCormick, J. Parametric finite element analysis of the cyclic flexural behavior of hollow structural sections. In Tubular Structures XIV–Proc., 14th Int. Symp. on Tubular Structures; CRC Press: Leiden, The Netherlands, 2012; pp. 557–564. [Google Scholar] [CrossRef]
- Fadden, M.; McCormick, J. Effect of width-thickness and depth-thickness on the cyclic flexural buckling behavior of hollow structural sections. In Proceedings of the Annual Stability Conference, Structural Research Council, Grapevine, TX, USA, 18–21 April 2012. [Google Scholar]
- Hu, Y.-F.; Chung, K.-F.; Ban, H.; Nethercot, D.A. Structural testing and numerical modelling of T-joints between cold-formed S690 circular hollow sections under brace in-plane bending. Eng. Struct. 2021, 250, 113317. [Google Scholar] [CrossRef]
- Gallegos, M.; Nuñez, E.; Herrera, R. Numerical Study on Cyclic Response of End-Plate Biaxial Moment Connection in Box Columns. Metals 2020, 10, 523. [Google Scholar] [CrossRef]
- Hassan, A.; Arif, M.; Shariq, M.; Alomayri, T. Experimental test and finite element modelling prediction on geopolymer concrete beams subject to flexural loading. Innov. Infrastruct. Solutions 2021, 7, 13. [Google Scholar] [CrossRef]
- Chavan, V.B.; Nimbalkar, V.N.; Jasiwal, A.P. Economic evaluation of open and hollow structural sections in industrial trusses. Int. J. Innov. Res. Science. Eng. Technol. 2014, 3, 9554–9565. [Google Scholar]
- Hoshikuma, J.I.; Priestley, M.J.N. Flexural Behavior of Circular Hollow Columns with a Single Layer of Reinforcement under Seismic Loading; Department of Structural Engineering, University of California: San Diego, CA, USA, 2000; Volume 13. [Google Scholar]
- Agarwal, D.S.; Chhatwani, A.C. The economic and structural analysis of hollow structural sections. Int. J. Recent Innov. Trends Comput. Commun. 2015, 3, 57–62. [Google Scholar]
- Wardenier, J.; Packer, J.A.; Zhao, X.L.; Van der Vegte, G.J. Hollow Sections in Structural Applications; Bouwen Met Staal: Rotterdam, The Netherlands, 2002. [Google Scholar]
- Morkhade, S.G.; Gupta, L.M. Experimental investigation for failure analysis of steel beams with web openings. Steel Compos. Struct. 2017, 23, 647–656. [Google Scholar] [CrossRef]
- Morkhade, S.G.; Gupta, L.M. Ultimate load behaviour of steel beams with web openings. Aust. J. Struct. Eng. 2019, 20, 124–133. [Google Scholar] [CrossRef]
- Morkhade, S.G.; Shirke, T.; Mansuke, A.; Chavan, M.U.; Gupta, L.M. Experimental and Analytical Investigation of Castellated Steel Beams with Varying Openings Eccentricity. J. Inst. Eng. Ser. A 2021, 102, 479–488. [Google Scholar] [CrossRef]
- Morkhade, S.G.; Gupta, L.M.; Martins, C.H. Effect of Web Post Width on Strength Capacity of Steel Beams with Web Openings: Experimental and Analytical Investigation. Pract. Period. Struct. Des. Constr. 2022, 27, 04022010. [Google Scholar] [CrossRef]
- Ammarullah, M.I.; Afif, I.Y.; Maula, M.I.; Winarni, T.I.; Tauviqirrahman, M.; Akbar, I.; Basri, H.; van der Heide, E.; Jamari, J. Tresca Stress Simulation of Metal-on-Metal Total Hip Arthroplasty during Normal Walking Activity. Materials 2021, 14, 7554. [Google Scholar] [CrossRef]
- Jamari, J.; Ammarullah, M.; Saad, A.; Syahrom, A.; Uddin, M.; van der Heide, E.; Basri, H. The Effect of Bottom Profile Dimples on the Femoral Head on Wear in Metal-on-Metal Total Hip Arthroplasty. J. Funct. Biomater. 2021, 12, 38. [Google Scholar] [CrossRef] [PubMed]
- He, P.; Pavlovic, M. Failure modes of bonded wrapped composite joints for steel circular hollow sections in ultimate load experiments. Eng. Struct. 2022, 254, 113799. [Google Scholar] [CrossRef]
- Hu, Y.-F.; Xiao, M.; Chung, K.-F.; Ban, H.; Nethercot, D.A. Experimental investigation into high strength S690 cold-formed circular hollow sections under compression. J. Constr. Steel Res. 2022, 194, 107306. [Google Scholar] [CrossRef]
- ASTM International ASTM A370; Standard Test Methods and Definitions for Mechanical Testing of Steel Products. ASTM International: West Conshohocken, PA, USA, 2014.
- Zeinoddini, M.; Mo’Tamedi, M.; Zandi, A.; Talebi, M.; Shariati, M.; Ezzati, M. On the ratcheting of defective low-alloy, high-strength steel pipes (API-5L X80) under cyclic bending: An experimental study. Int. J. Mech. Sci. 2017, 130, 518–533. [Google Scholar] [CrossRef]
- Zhao, O.; Gardner, L.; Young, B. Structural performance of stainless steel circular hollow sections under combined axial load and bending—Part 1: Experiments and numerical modelling. Thin-Walled Struct. 2016, 101, 231–239. [Google Scholar] [CrossRef]
- Kozich, M.; Wald, F. Resistance of circular hollow section branch plate joints made from high strength steel. Thin-Walled Struct. 2022, 176, 109345. [Google Scholar] [CrossRef]
- Zhou, W.; Shao, Z.; Yu, J.; Lin, J. Advances and Trends in Forming Curved Extrusion Profiles. Materials 2021, 14, 1603. [Google Scholar] [CrossRef]


| Specimen No. | Thickness t (mm) | Yield Stress Fy (MPa) | Ultimate Stress Fu (MPa) |
|---|---|---|---|
| BT1 | 3 | 290 | 370 |
| BT2 | 2 | 360 | 430 |
| BT3 | 6 | 285 | 440 |
| BT4 | 3 | 290 | 370 |
| BT5 | 3 | 290 | 370 |
| BT6 | 3 | 290 | 370 |
| BT7 | 3 | 290 | 370 |
| BT8 | 3 | 290 | 370 |
| BT9 | 3 | 290 | 370 |
| BT10 | 3 | 290 | 370 |
| Specimen No. | Thickness t (mm) | Diameter D (mm) | Span L (mm) | D/t |
|---|---|---|---|---|
| BT1 | 3 | 101.6 | 1500 | 33.87 |
| BT2 | 2 | 101.6 | 1500 | 50.8 |
| BT3 | 6 | 101.6 | 1500 | 16.93 |
| BT4 | 3 | 101.6 | 1500 | 33.87 |
| BT5 | 3 | 101.6 | 1500 | 33.87 |
| BT6 | 3 | 101.6 | 1500 | 33.87 |
| BT7 | 3 | 101.6 | 2000 | 33.87 |
| BT8 | 3 | 101.6 | 1000 | 33.87 |
| BT9 | 3 | 219 | 1500 | 73 |
| BT10 | 3 | 76.2 | 1500 | 25.4 |
Publisher’s Note: MDPI stays neutral with regard to jurisdictional claims in published maps and institutional affiliations. |
© 2022 by the authors. Licensee MDPI, Basel, Switzerland. This article is an open access article distributed under the terms and conditions of the Creative Commons Attribution (CC BY) license (https://creativecommons.org/licenses/by/4.0/).
Share and Cite
Khalaf, M.S.; Ibrahim, A.M.; Najm, H.M.; Sabri, M.M.S.; Morkhade, S.; Agarwal, A.; Alamir, M.A.; Alarifi, I.M. Experimental Analysis of Steel Circular Hollow Section under Bending Loads: Comprehensive Study of Mechanical Performance. Materials 2022, 15, 4350. https://doi.org/10.3390/ma15124350
Khalaf MS, Ibrahim AM, Najm HM, Sabri MMS, Morkhade S, Agarwal A, Alamir MA, Alarifi IM. Experimental Analysis of Steel Circular Hollow Section under Bending Loads: Comprehensive Study of Mechanical Performance. Materials. 2022; 15(12):4350. https://doi.org/10.3390/ma15124350
Chicago/Turabian StyleKhalaf, Manahel Shahath, Amer M. Ibrahim, Hadee Mohammed Najm, Mohanad Muayad Sabri Sabri, Samadhan Morkhade, Ashish Agarwal, Mohammed A. Alamir, and Ibrahim M. Alarifi. 2022. "Experimental Analysis of Steel Circular Hollow Section under Bending Loads: Comprehensive Study of Mechanical Performance" Materials 15, no. 12: 4350. https://doi.org/10.3390/ma15124350