
On the Microstructure and Properties of Nb-Ti-Cr-Al-B-Si-X (X = Hf, Sn, Ta) Refractory Complex Concentrated Alloys


Abstract
:1. Introduction
2. Experimental
3. Results
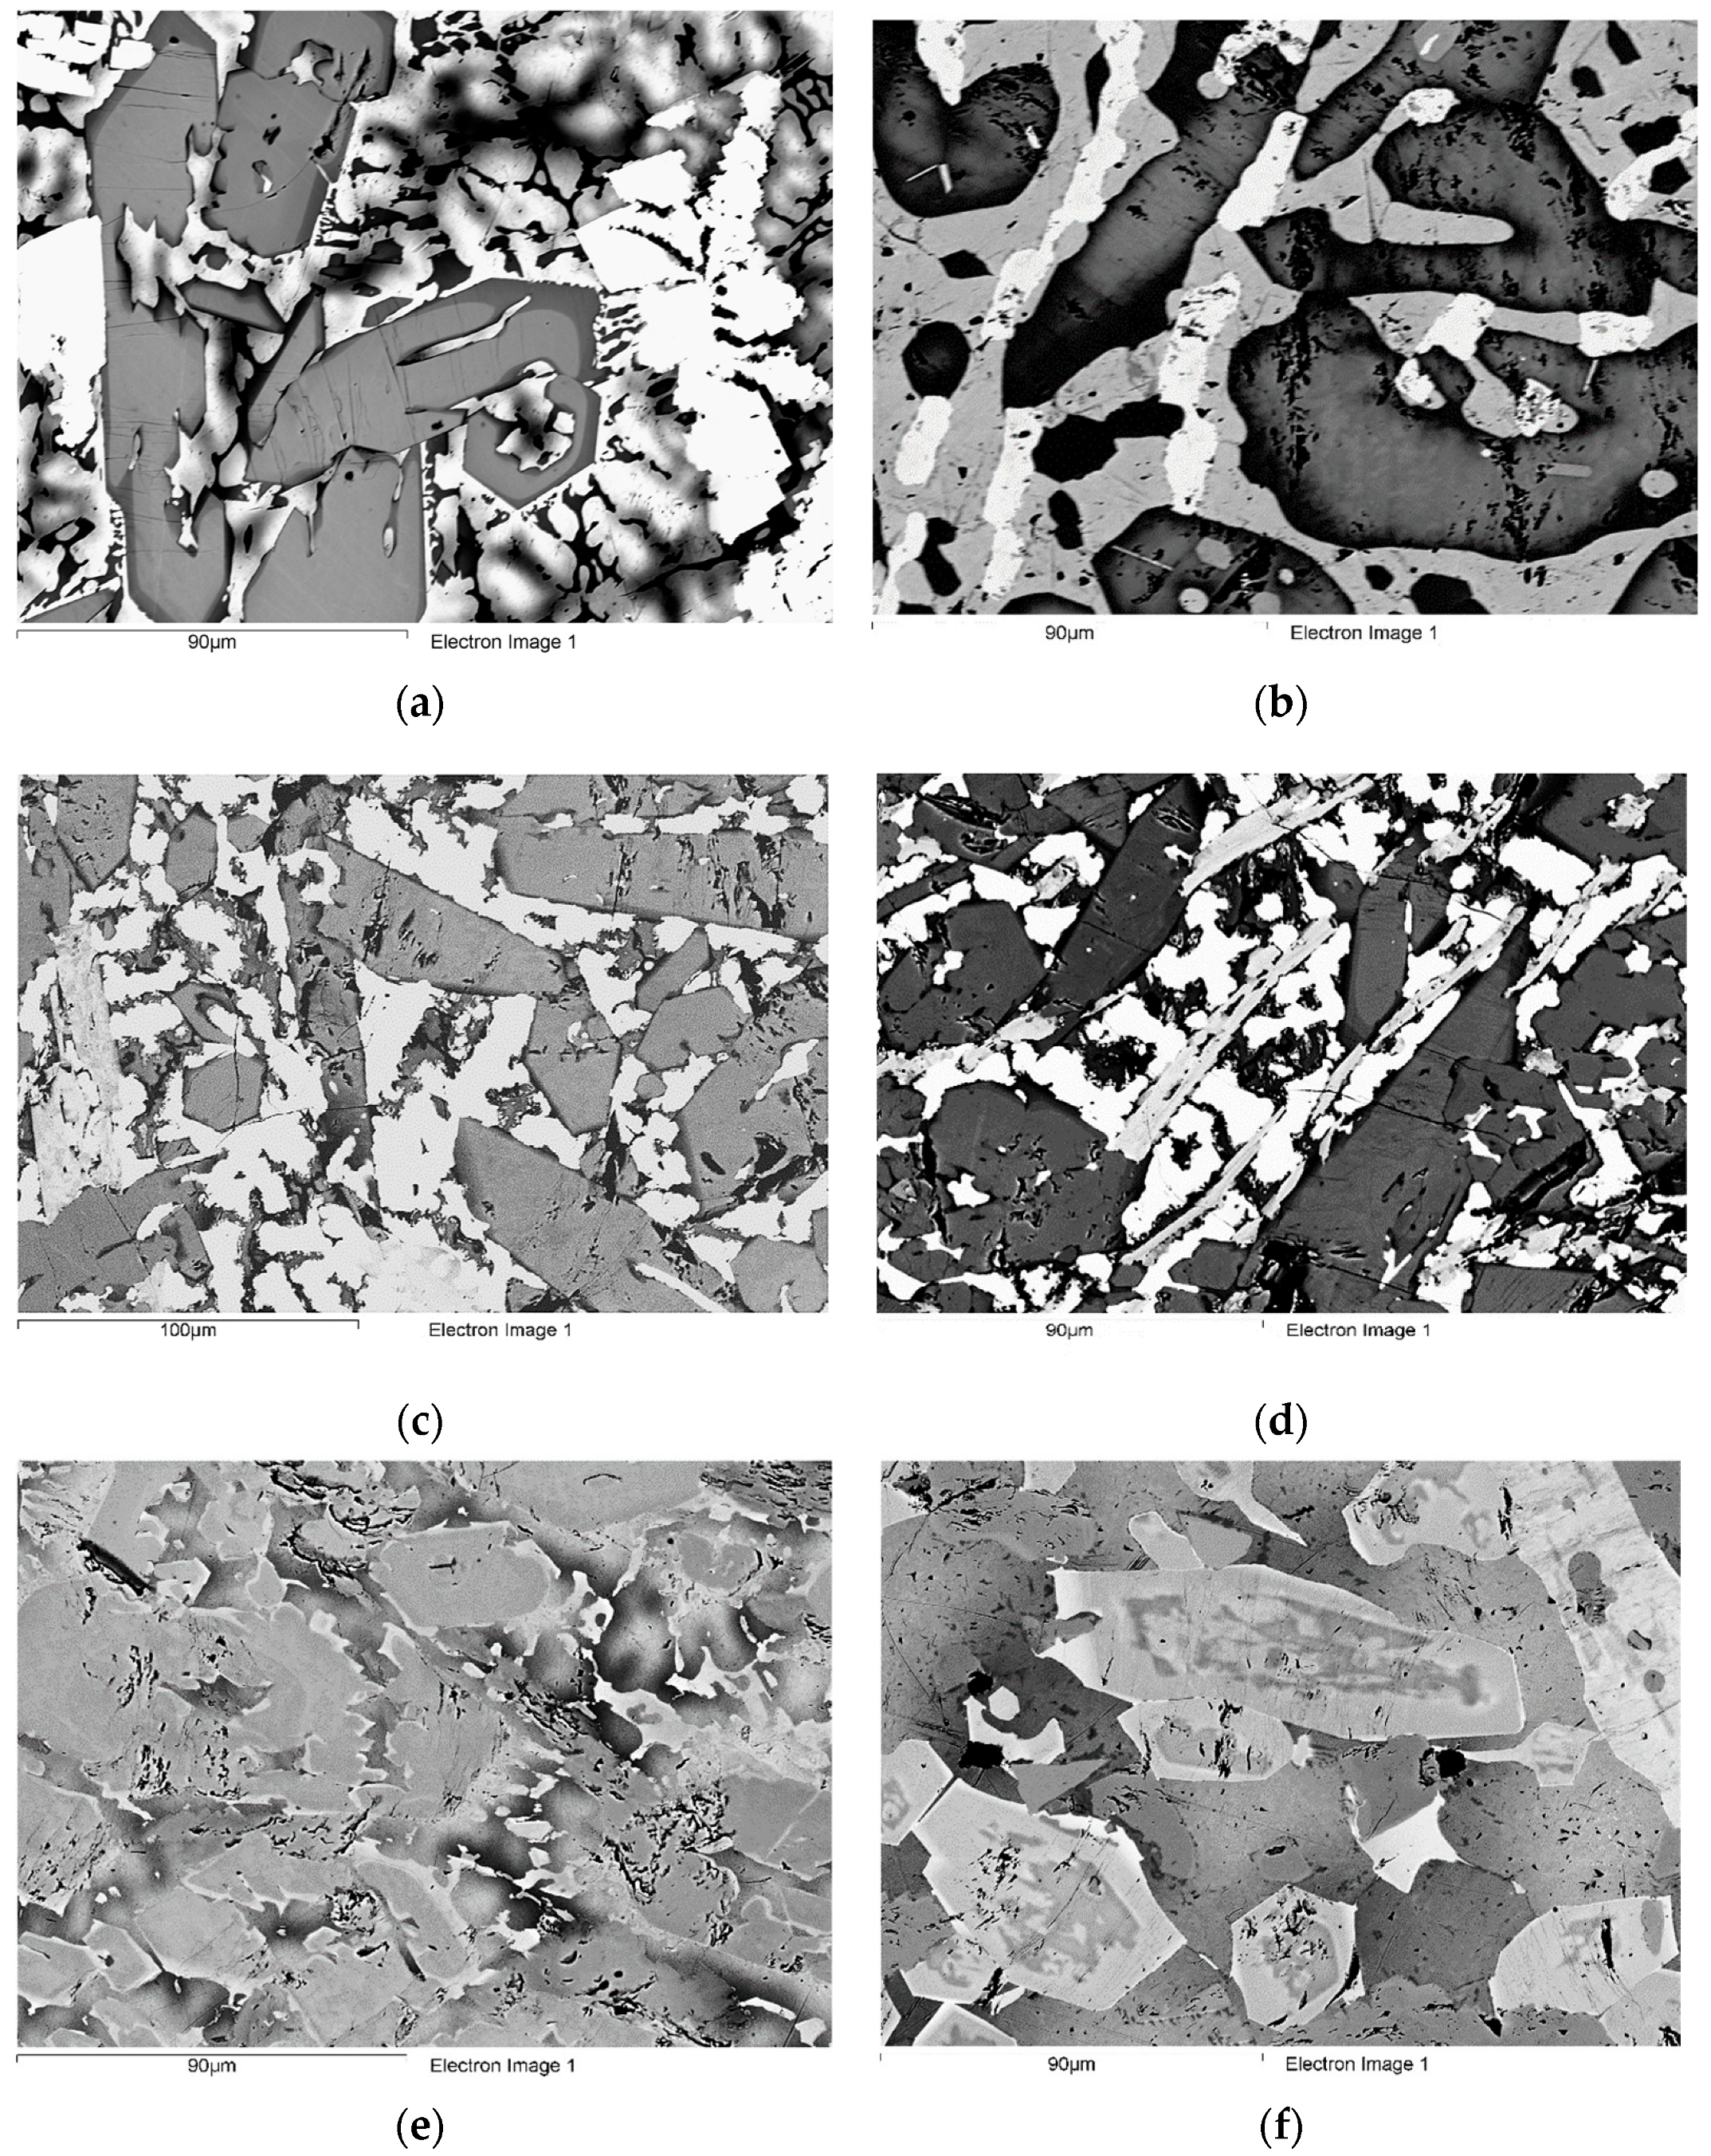
3.1. As Cast Alloys
3.2. Heat Treated Alloys
3.3. Hardness
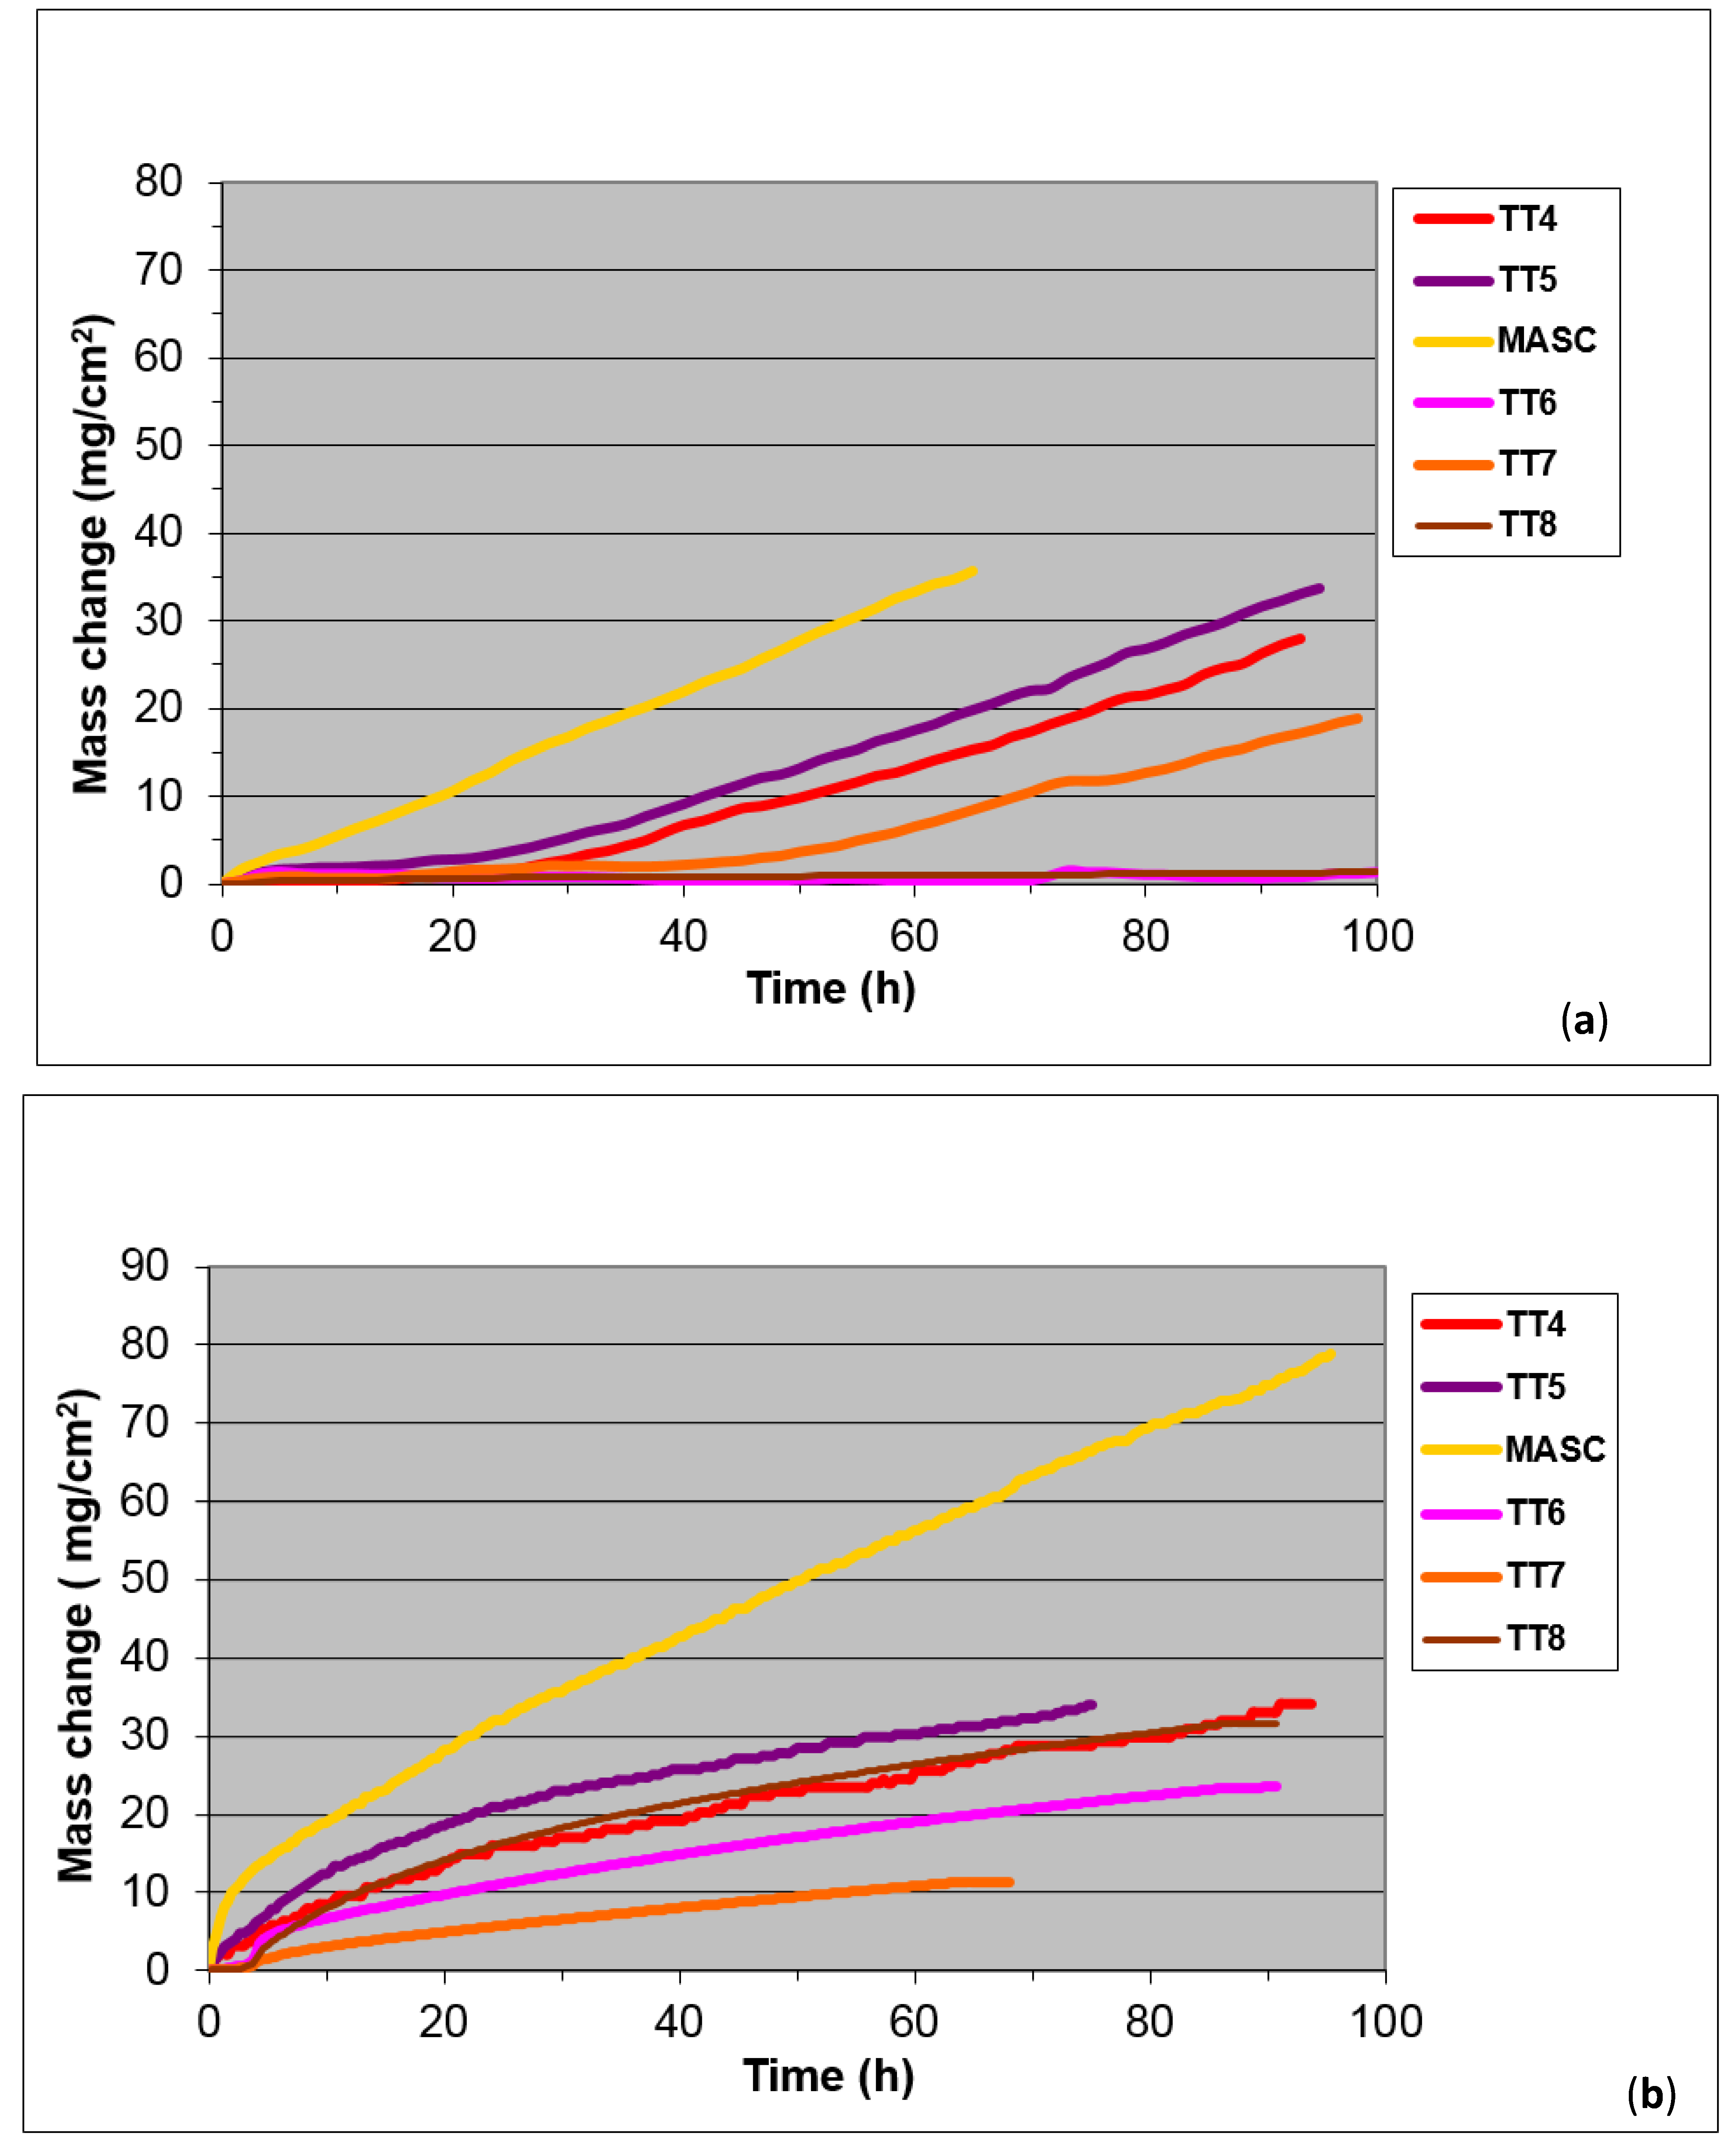
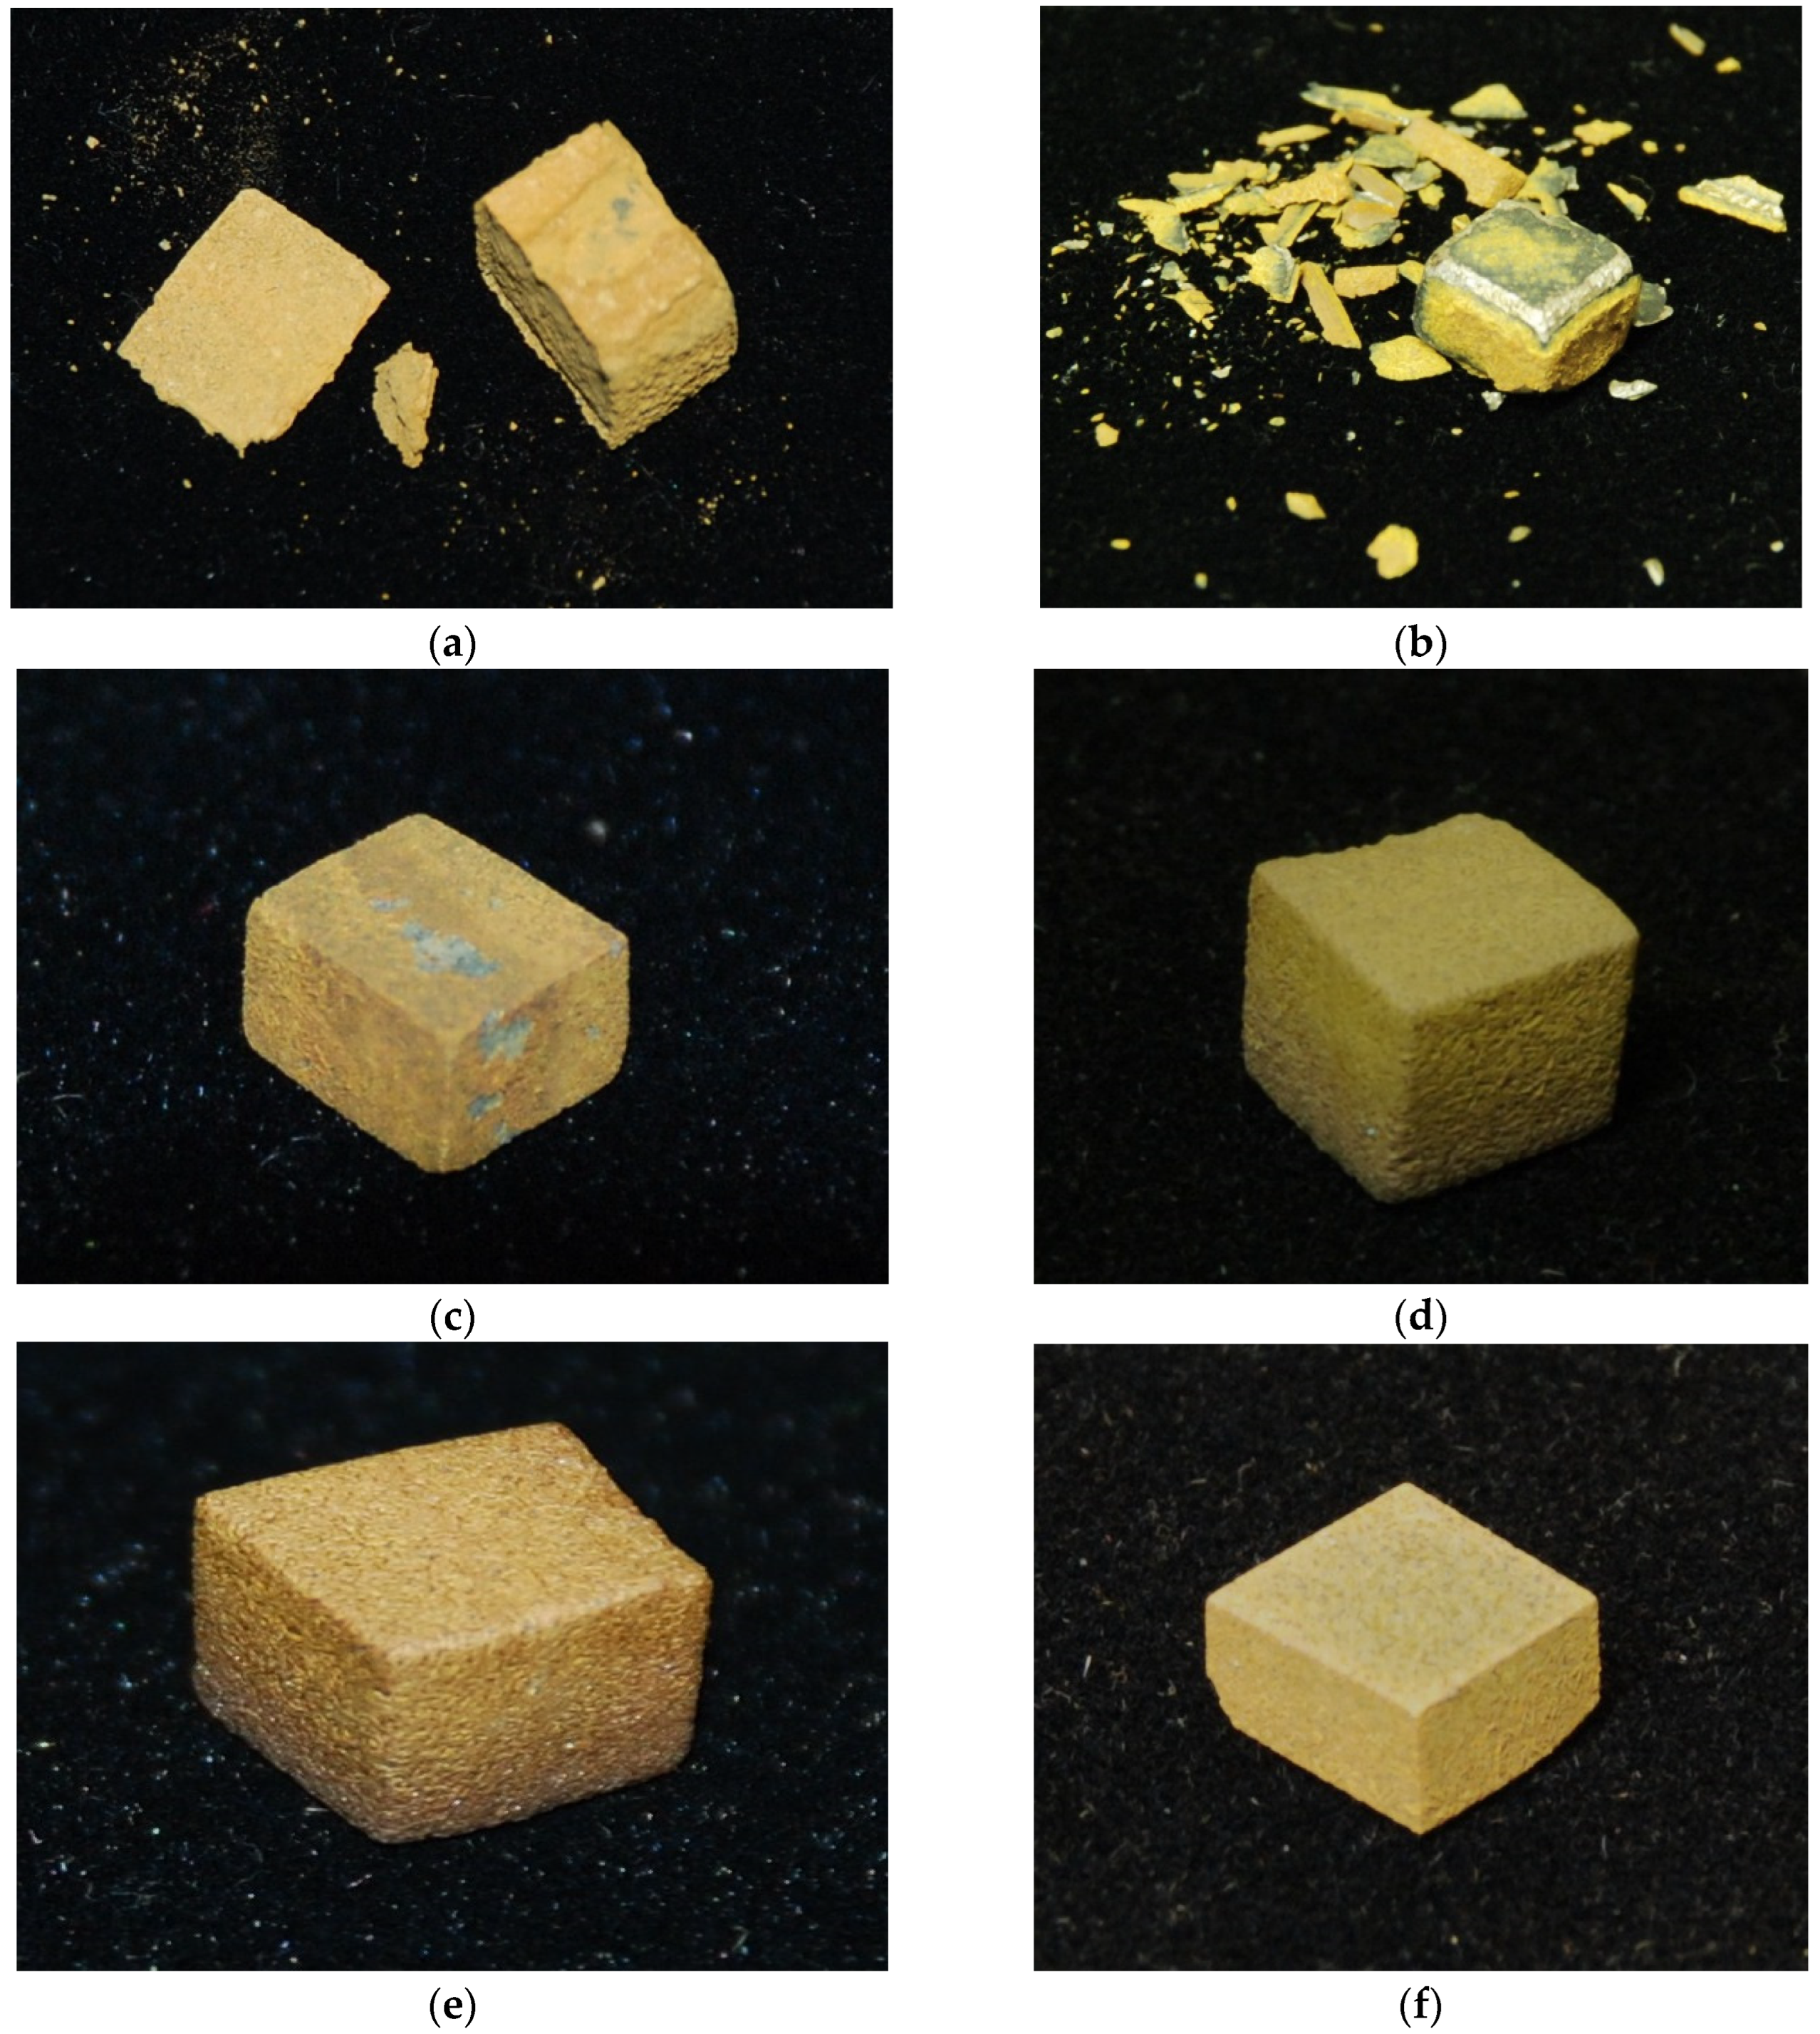
3.4. Oxidation
4. Discussion
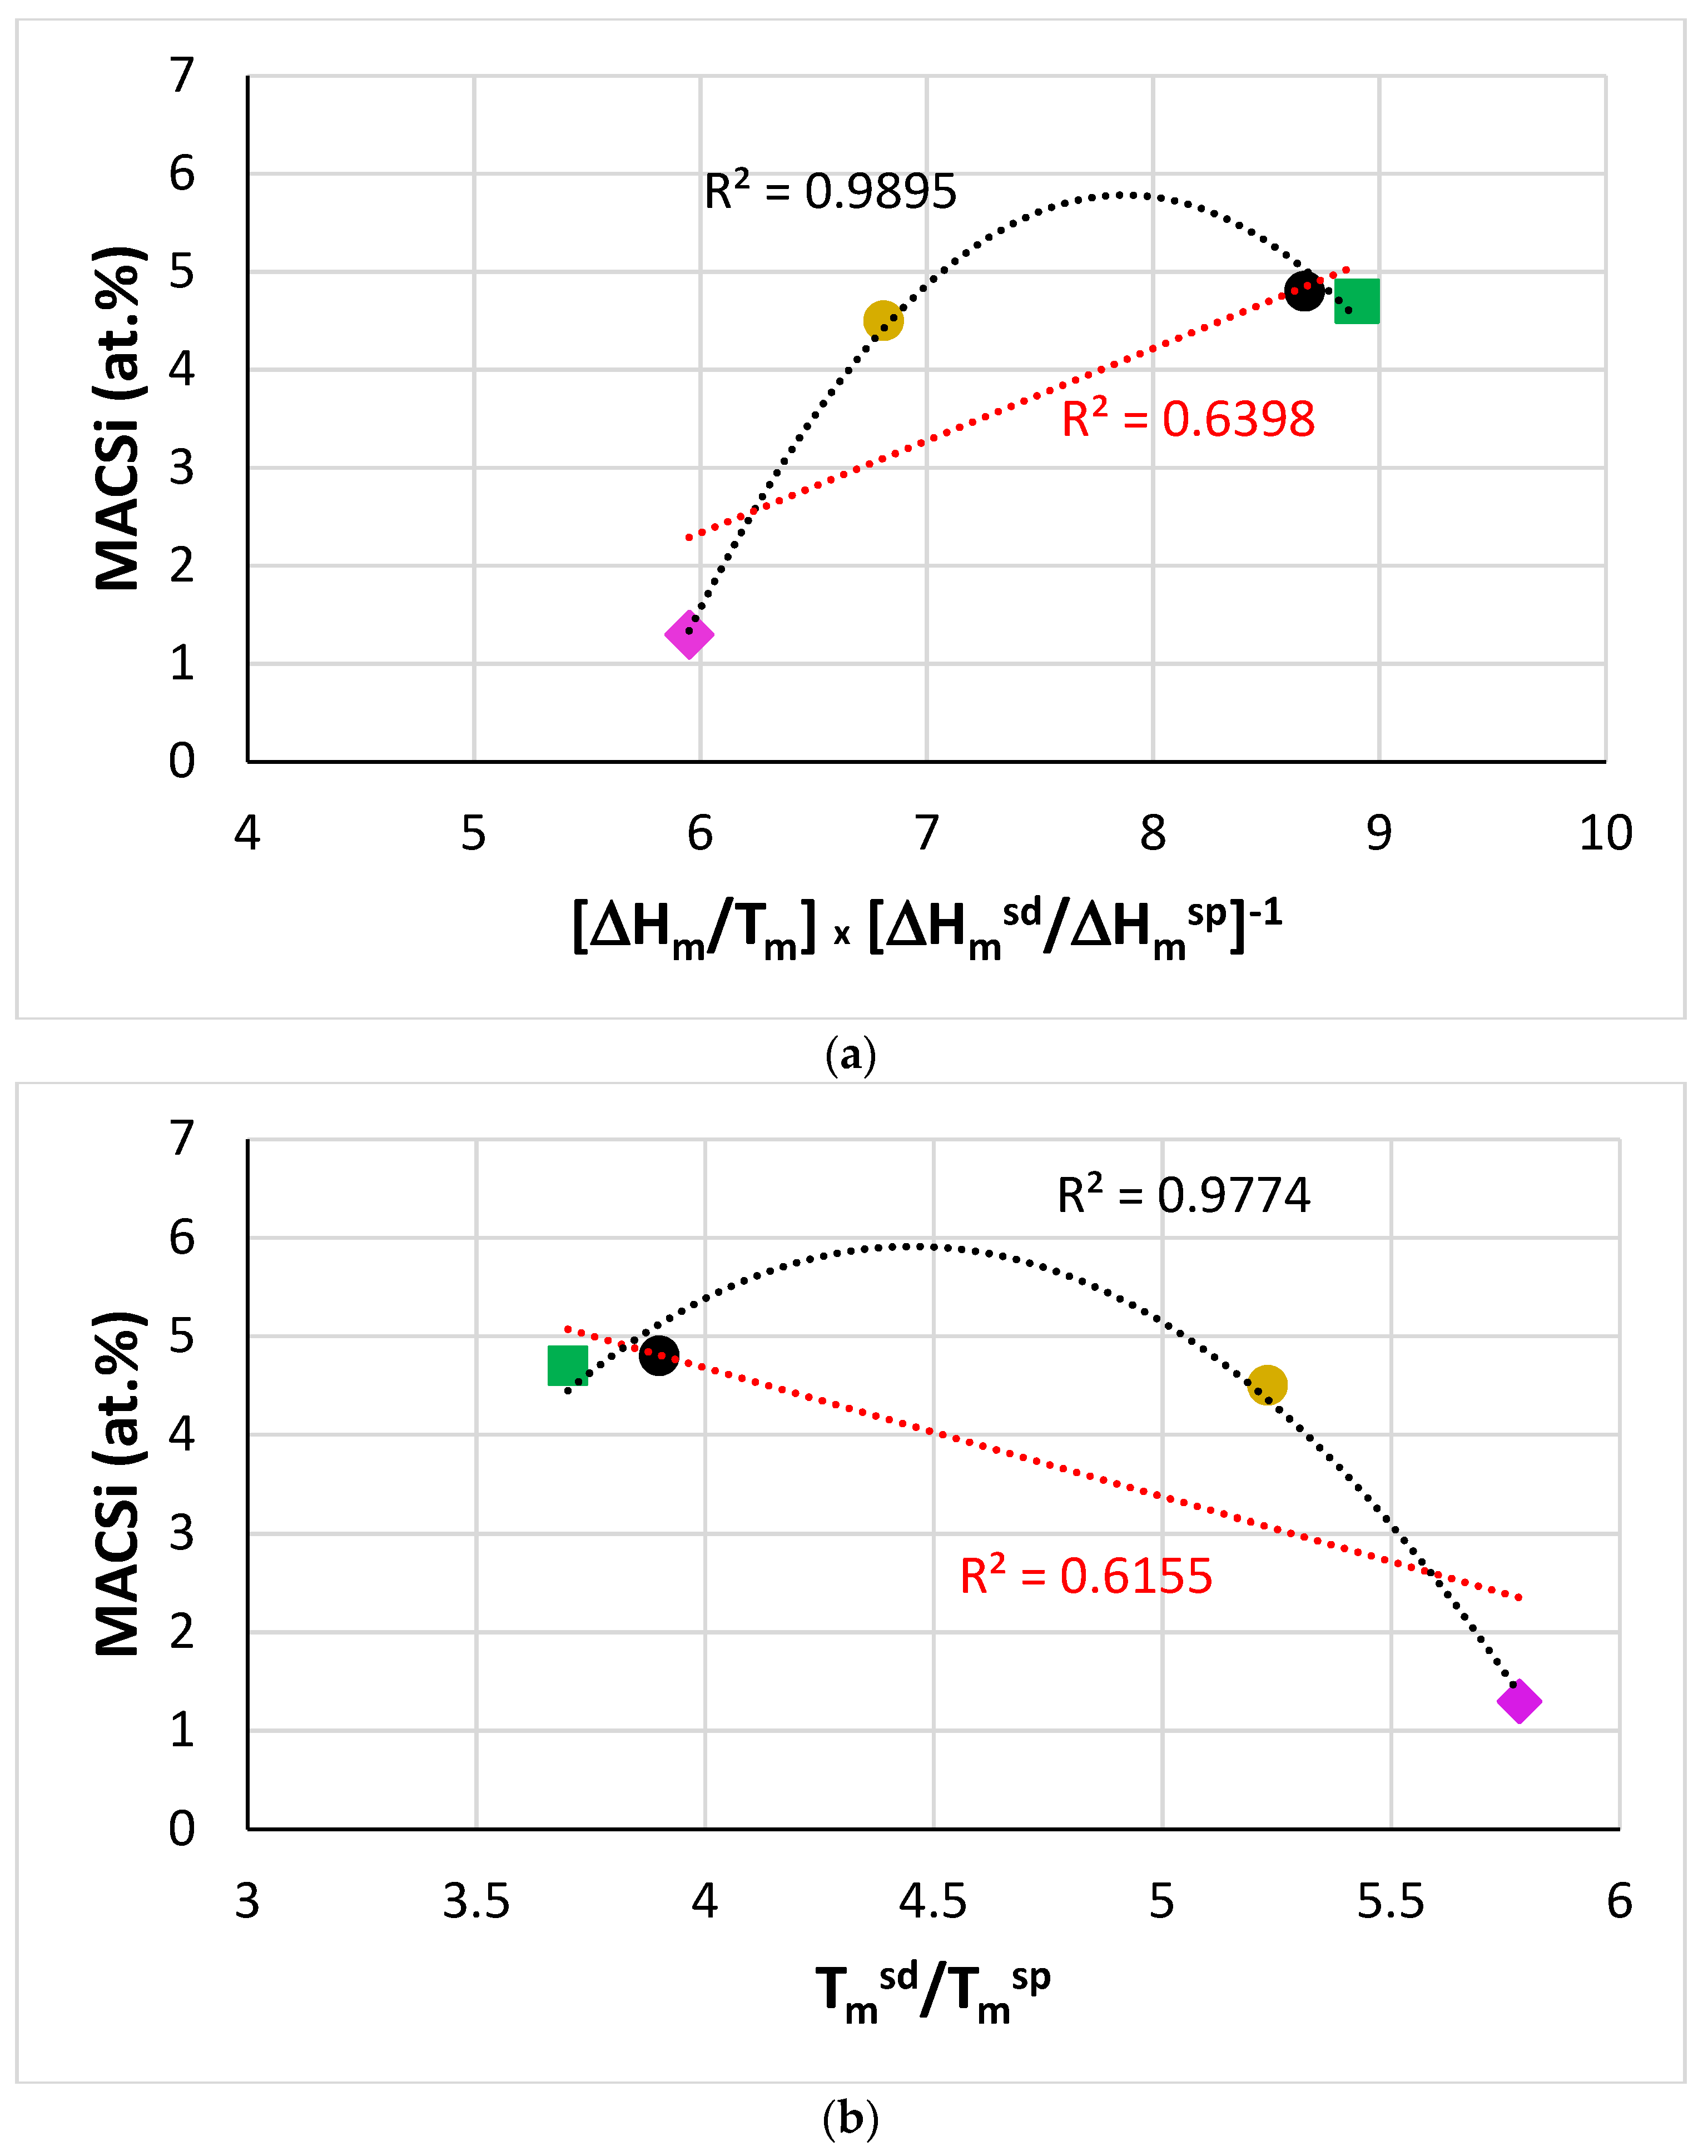
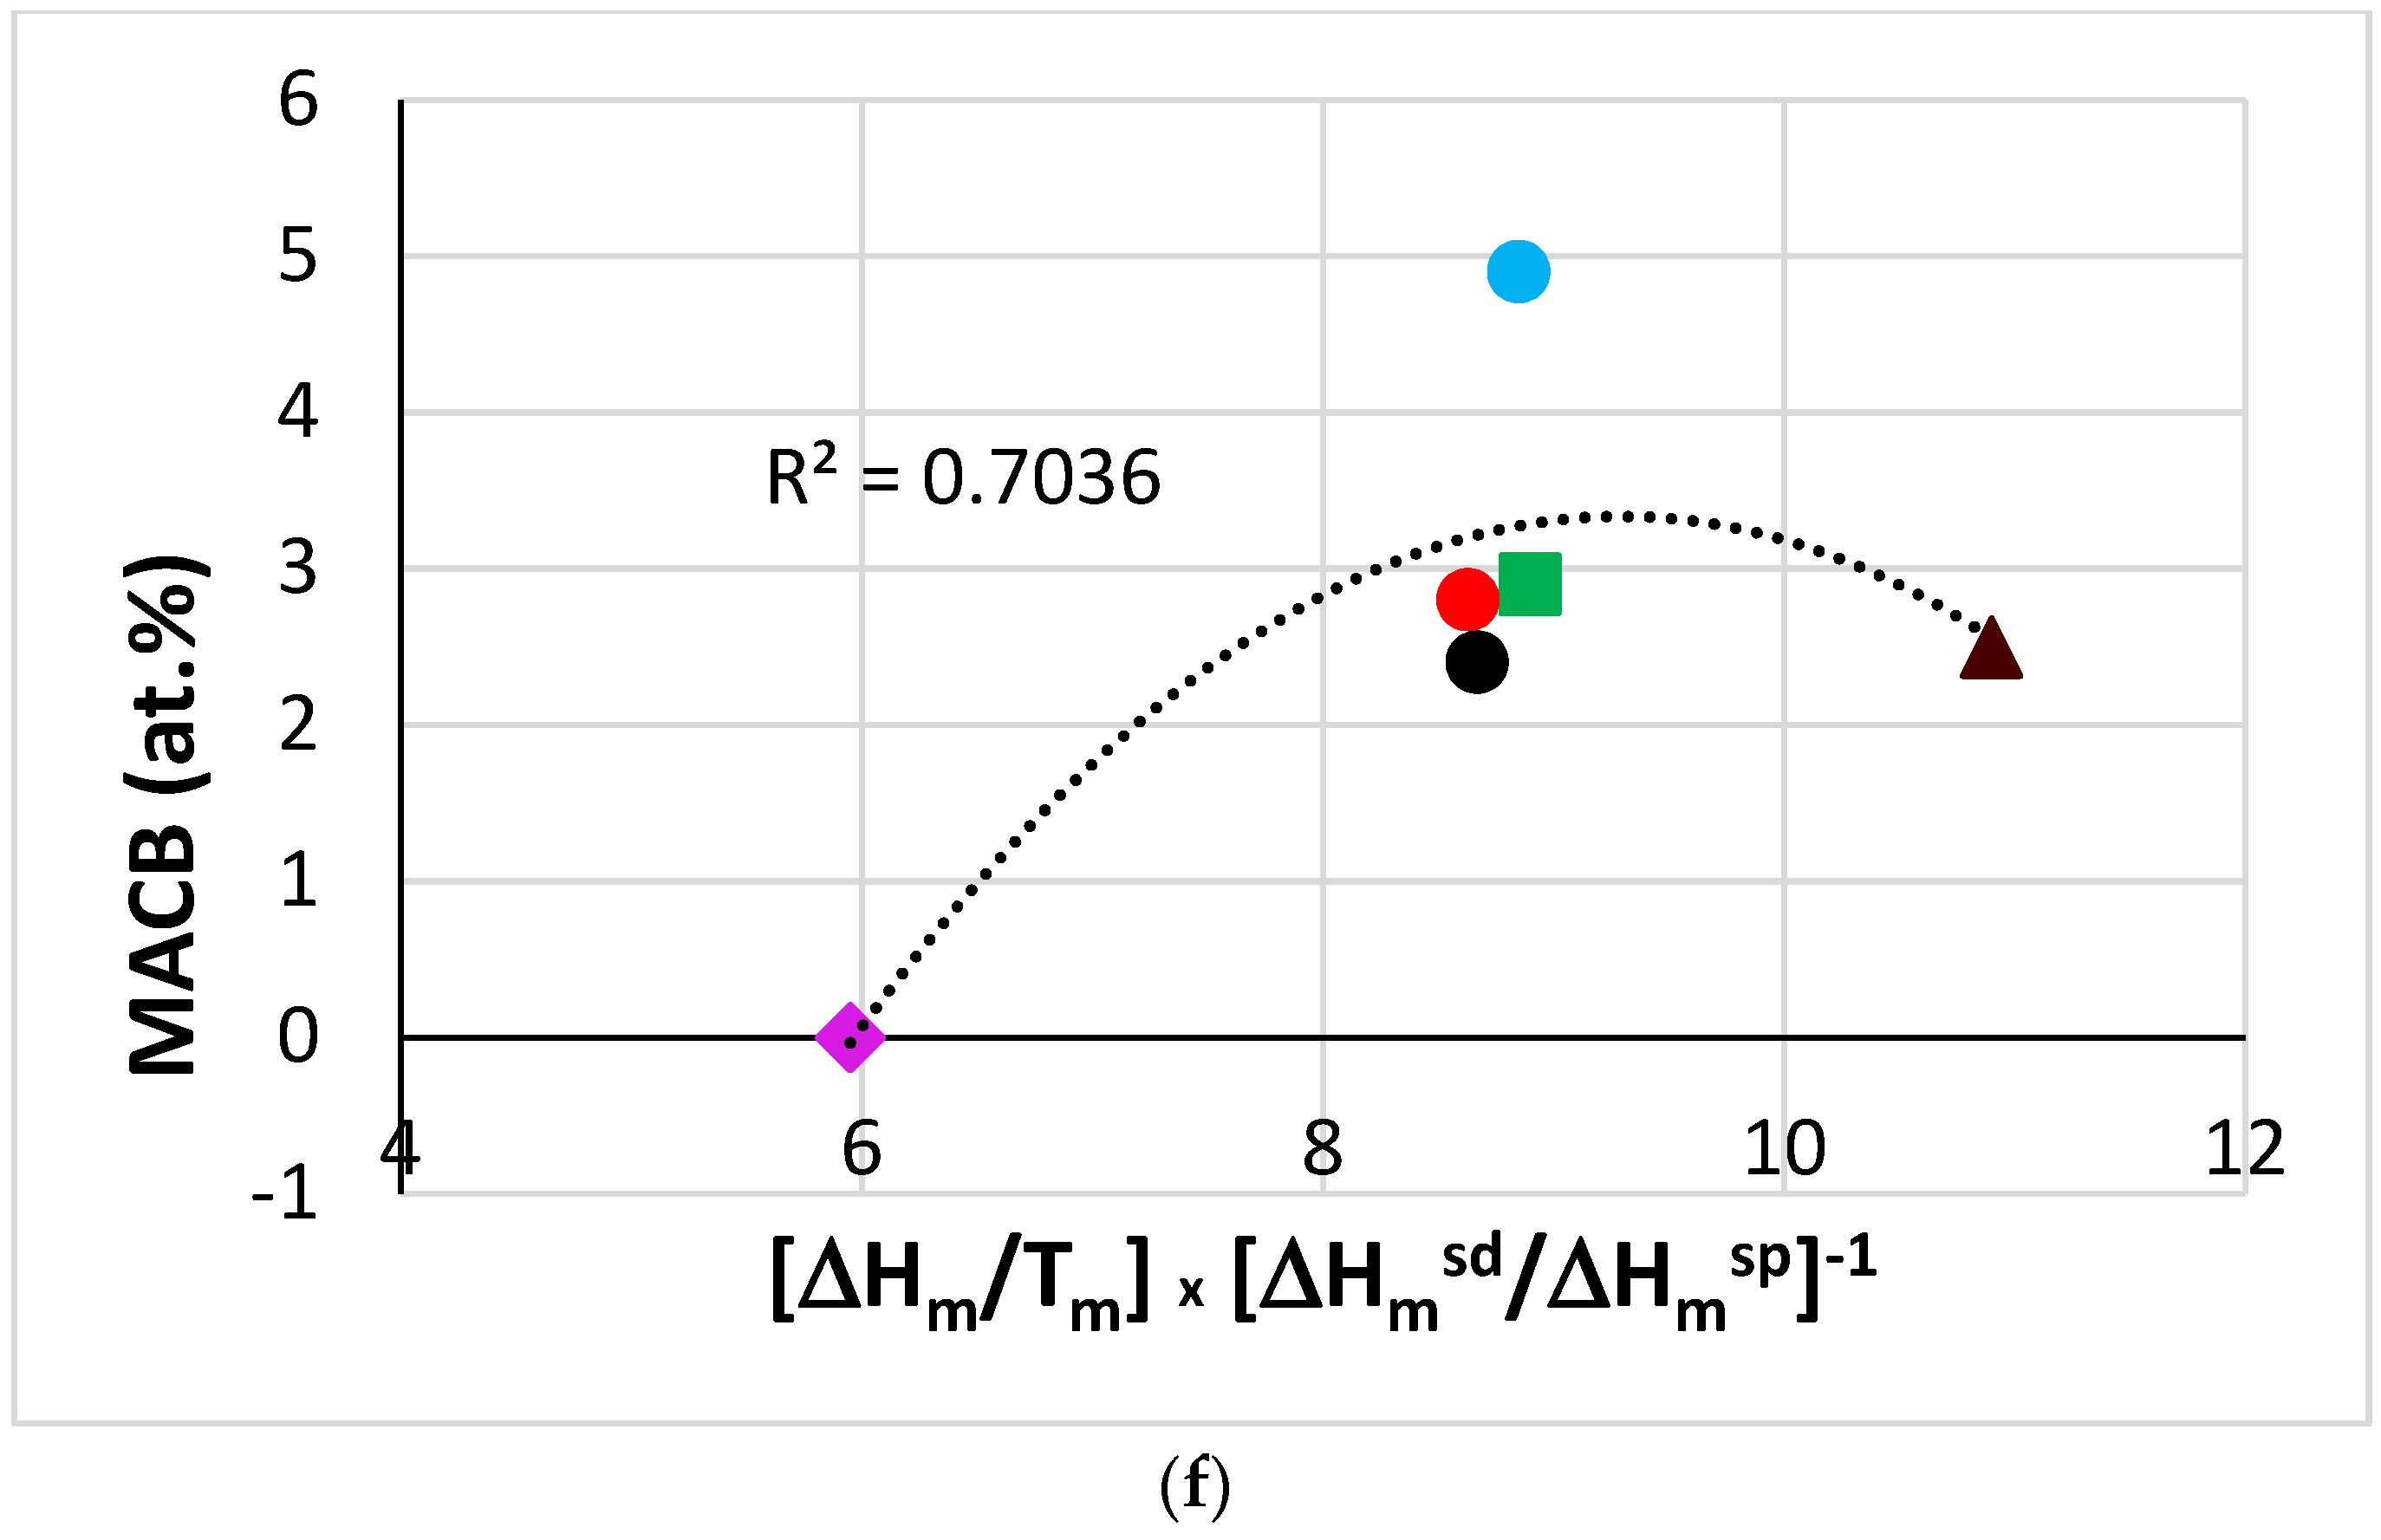
4.1. Macrosegregation of B, Si and Ti
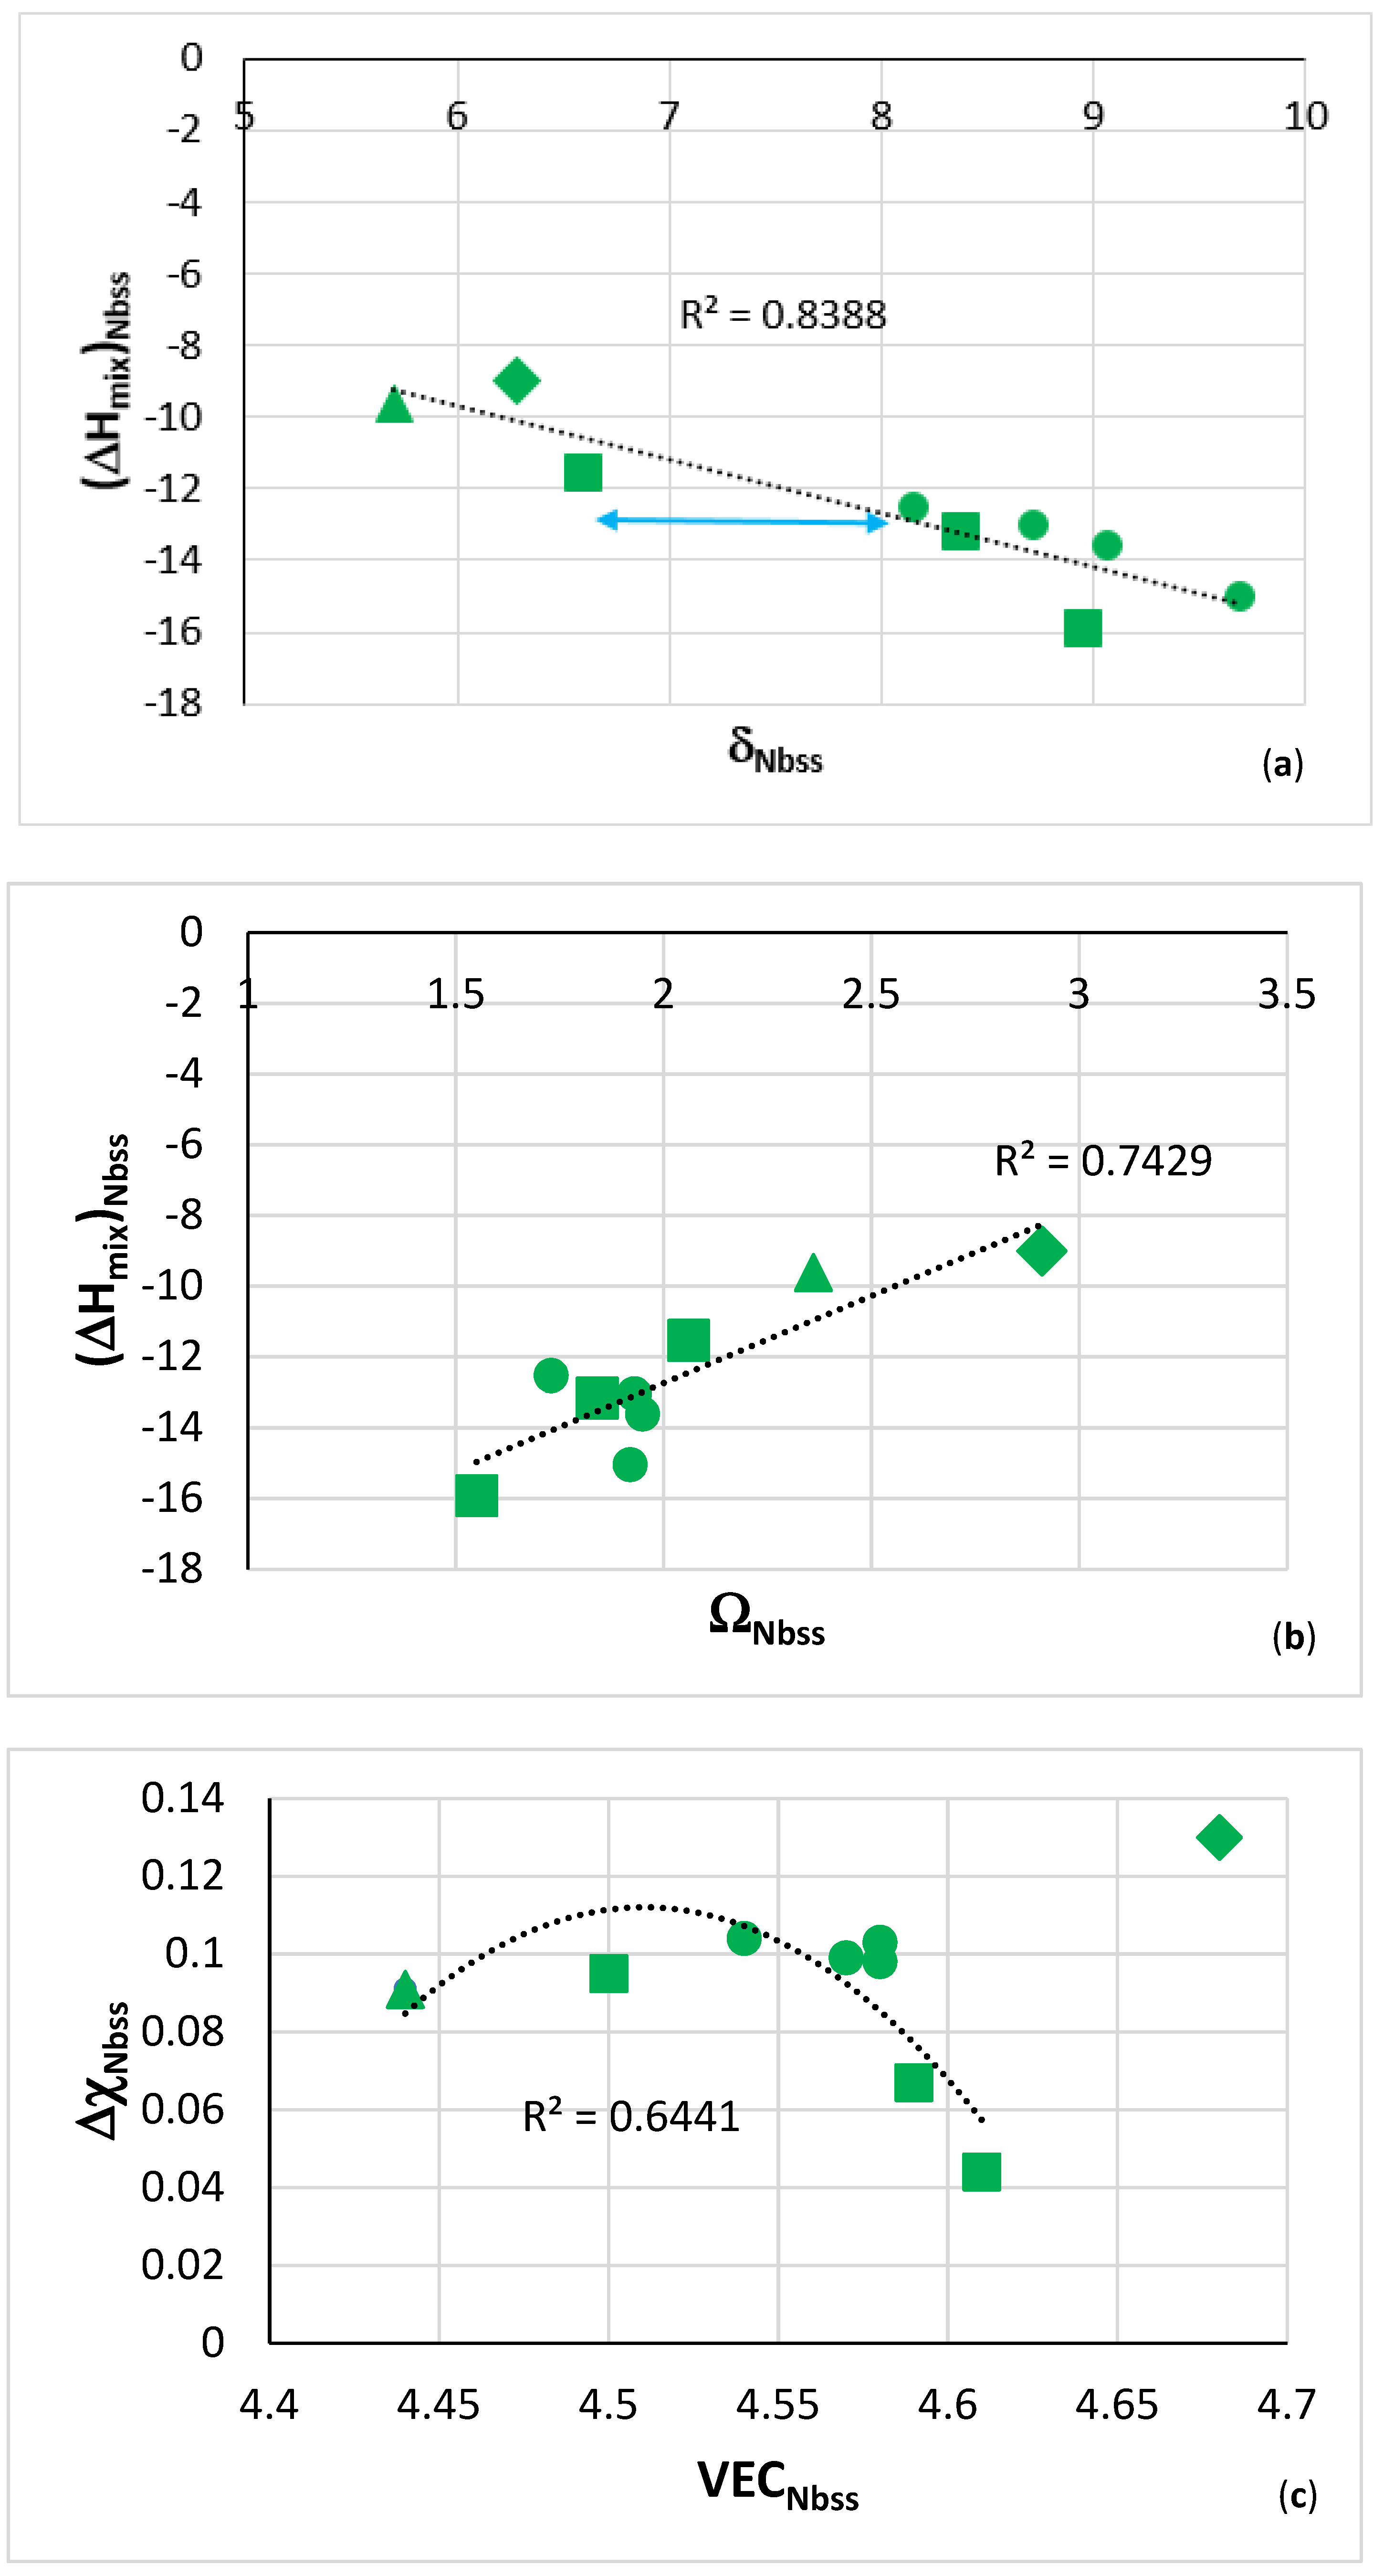
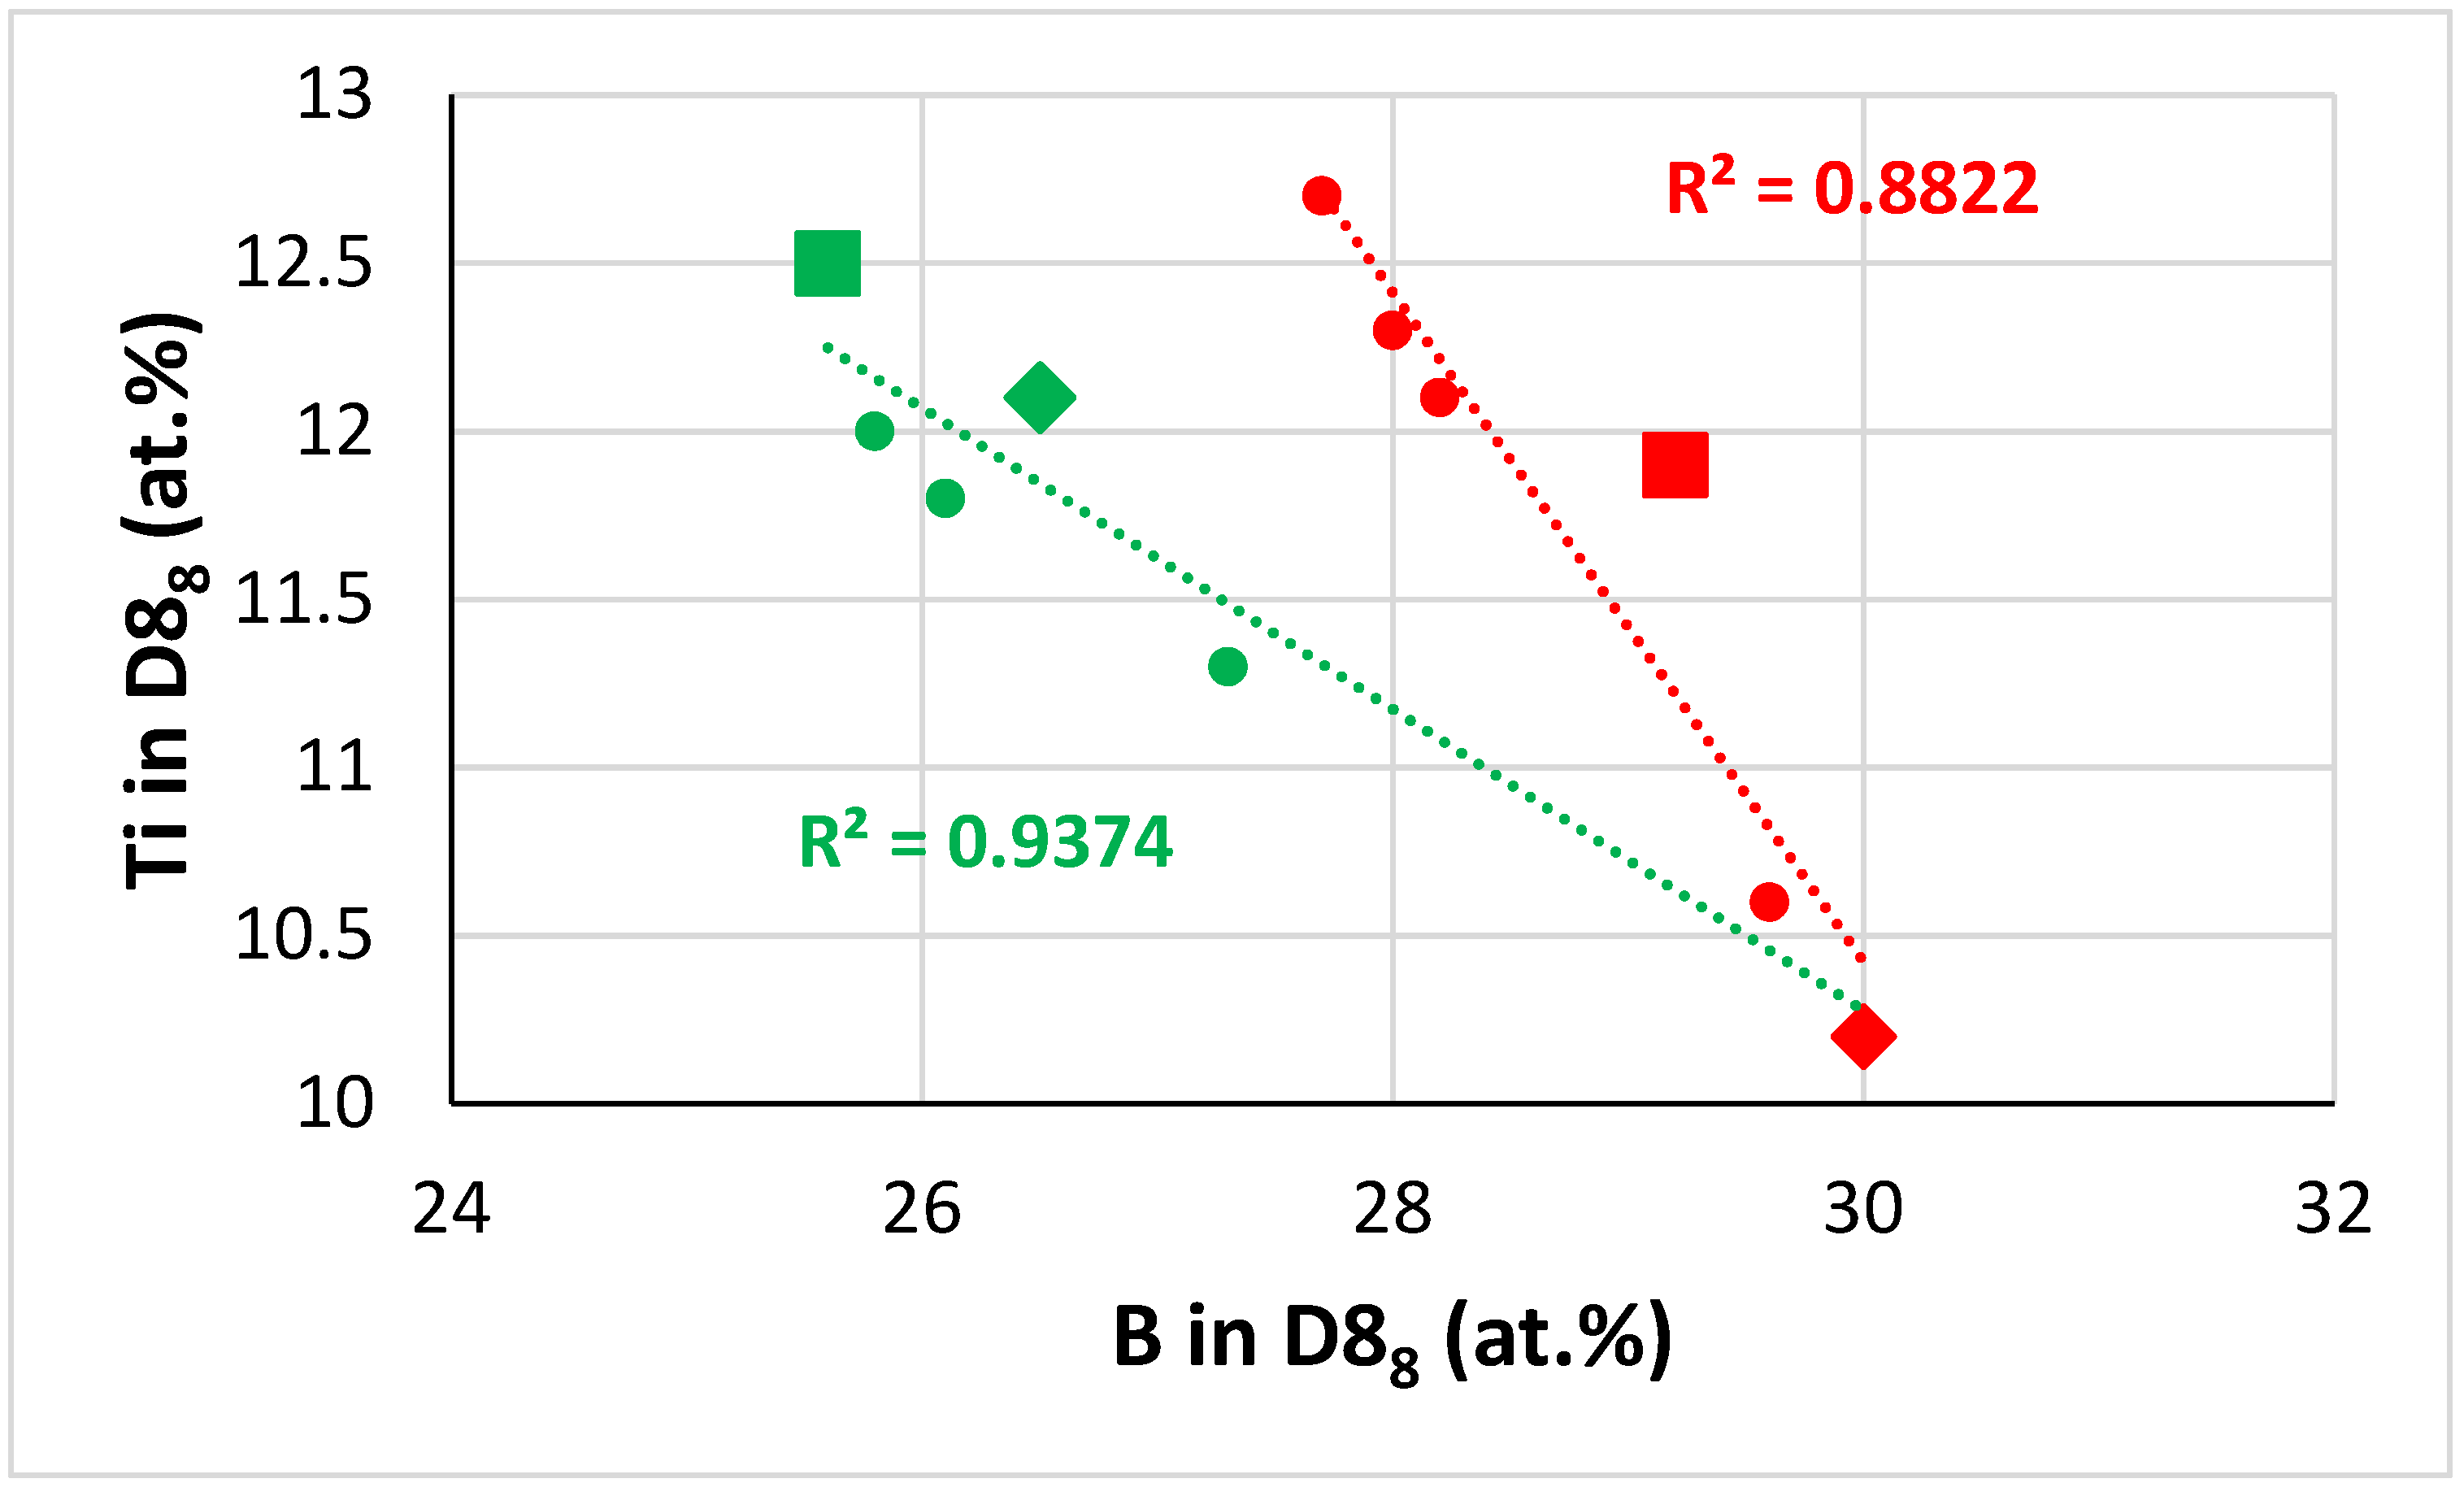
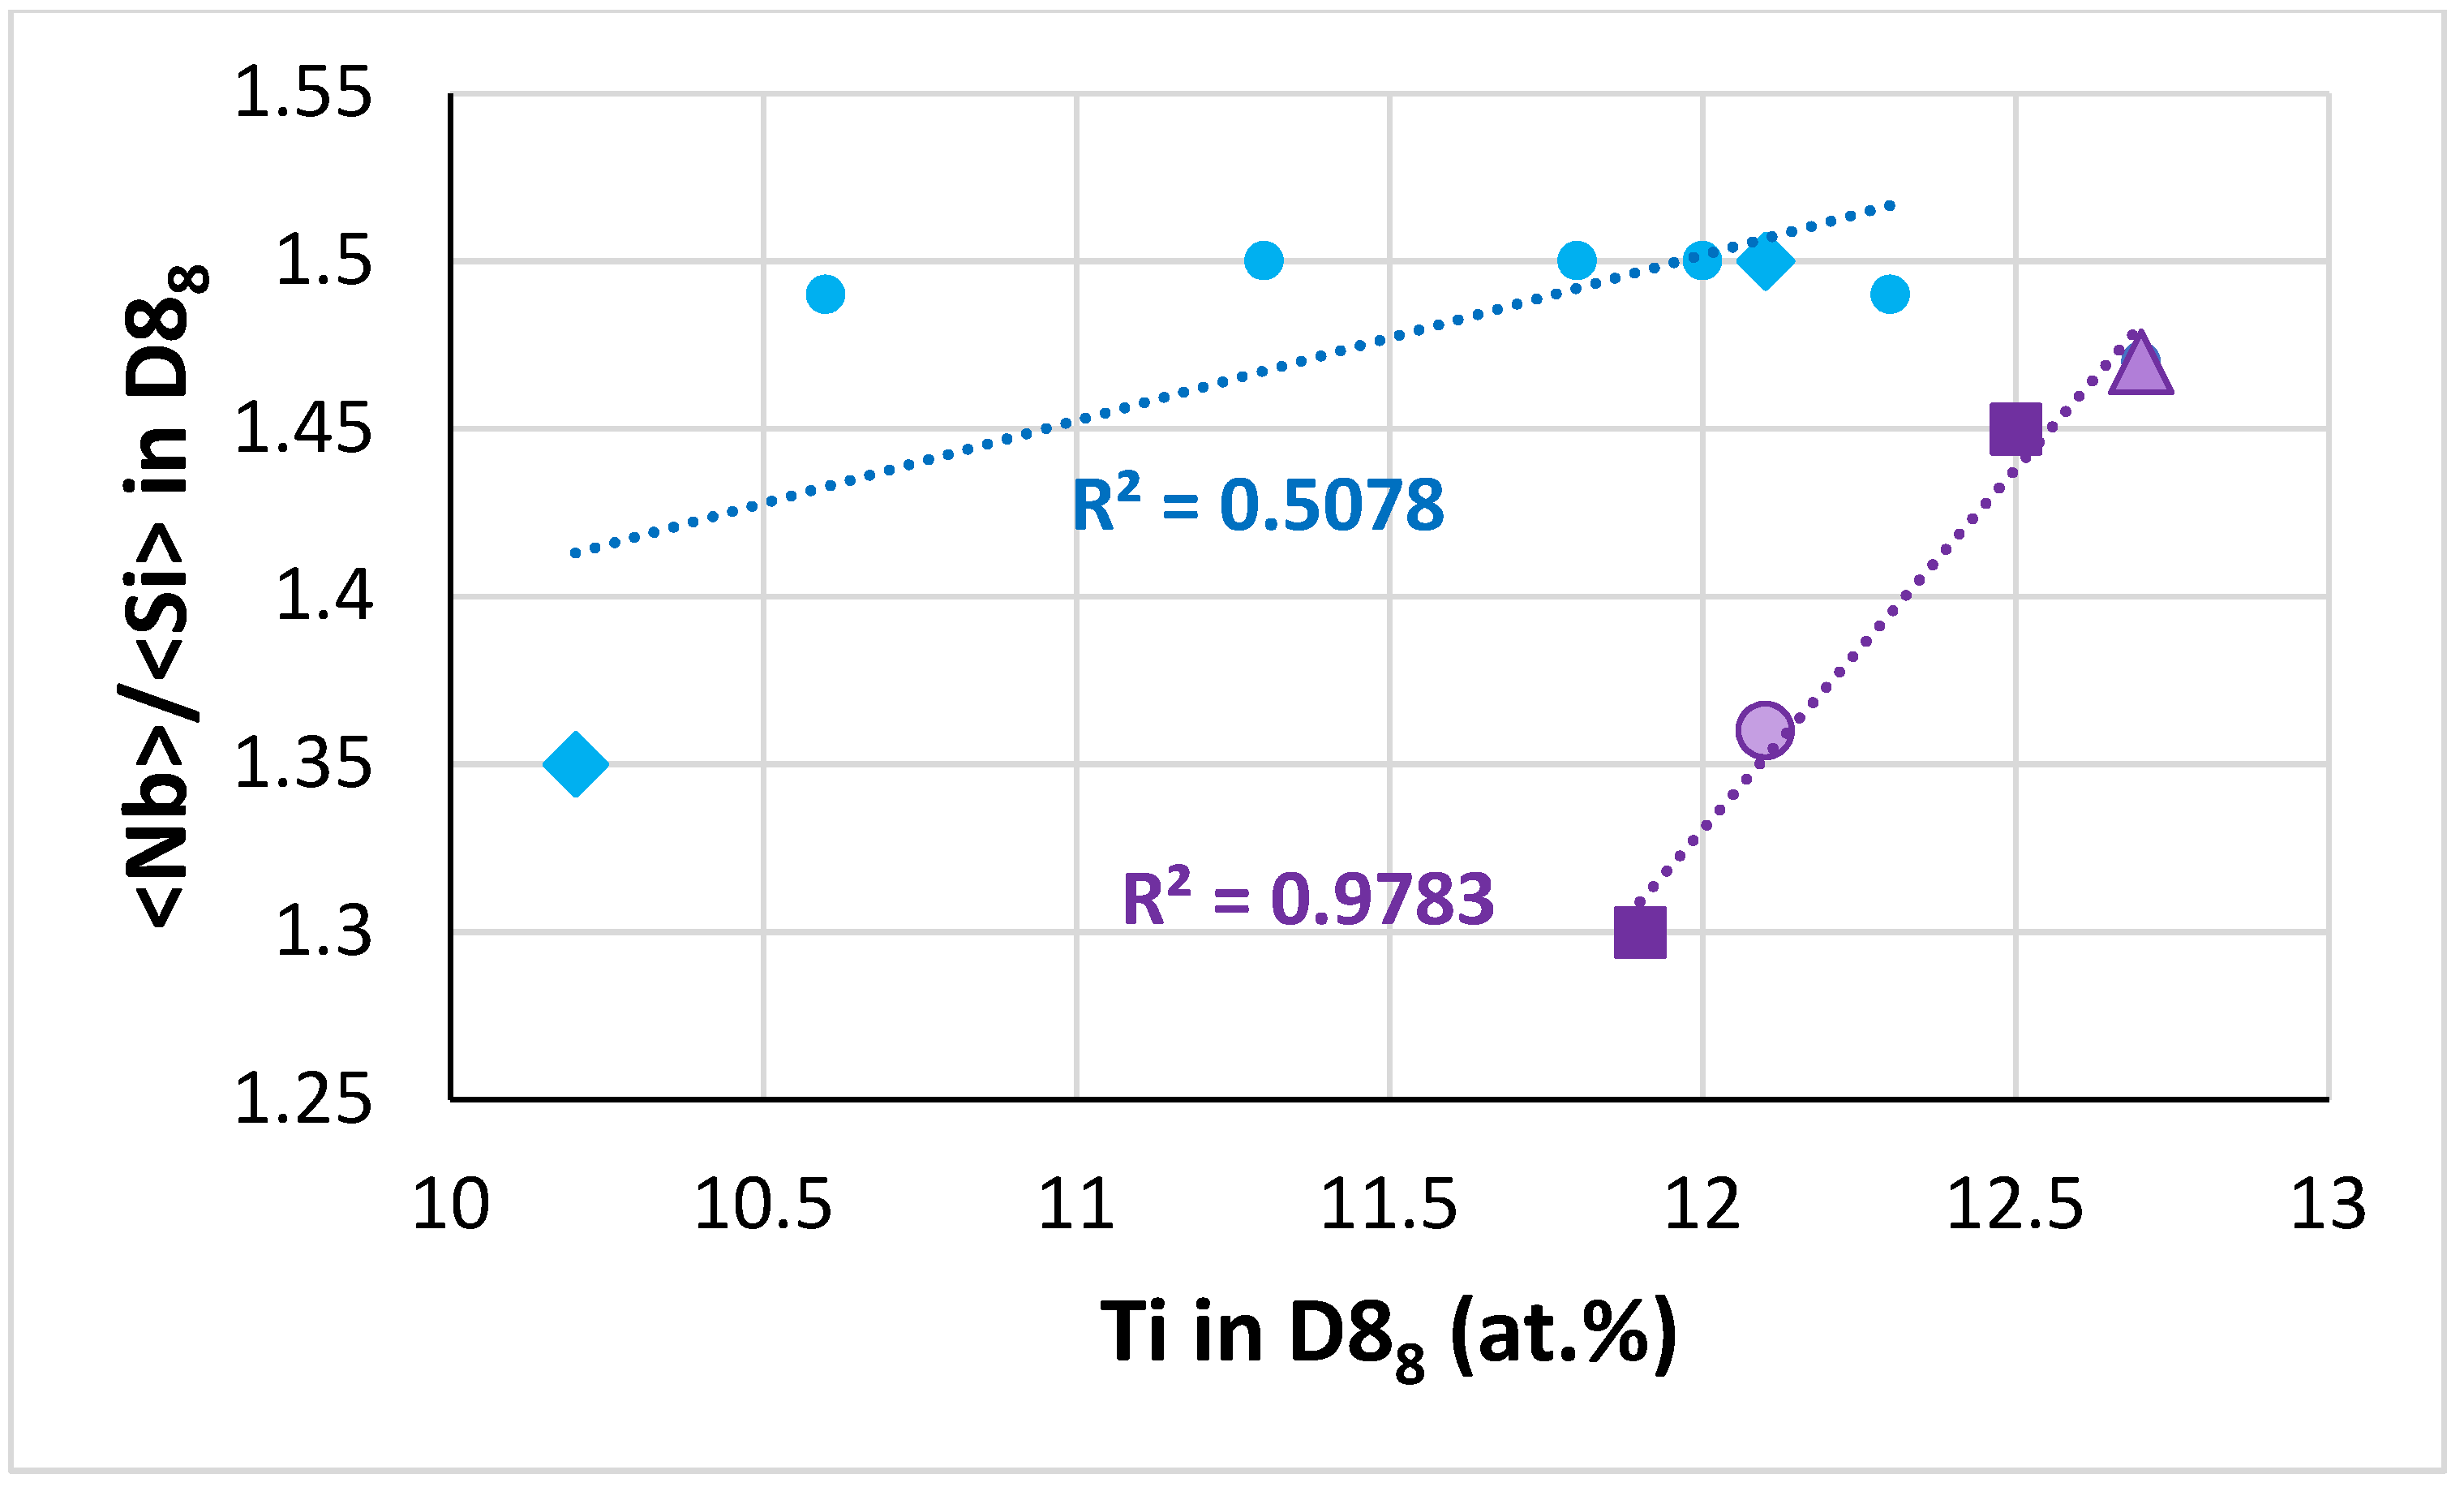
4.2. Microstructures
4.3. Properties
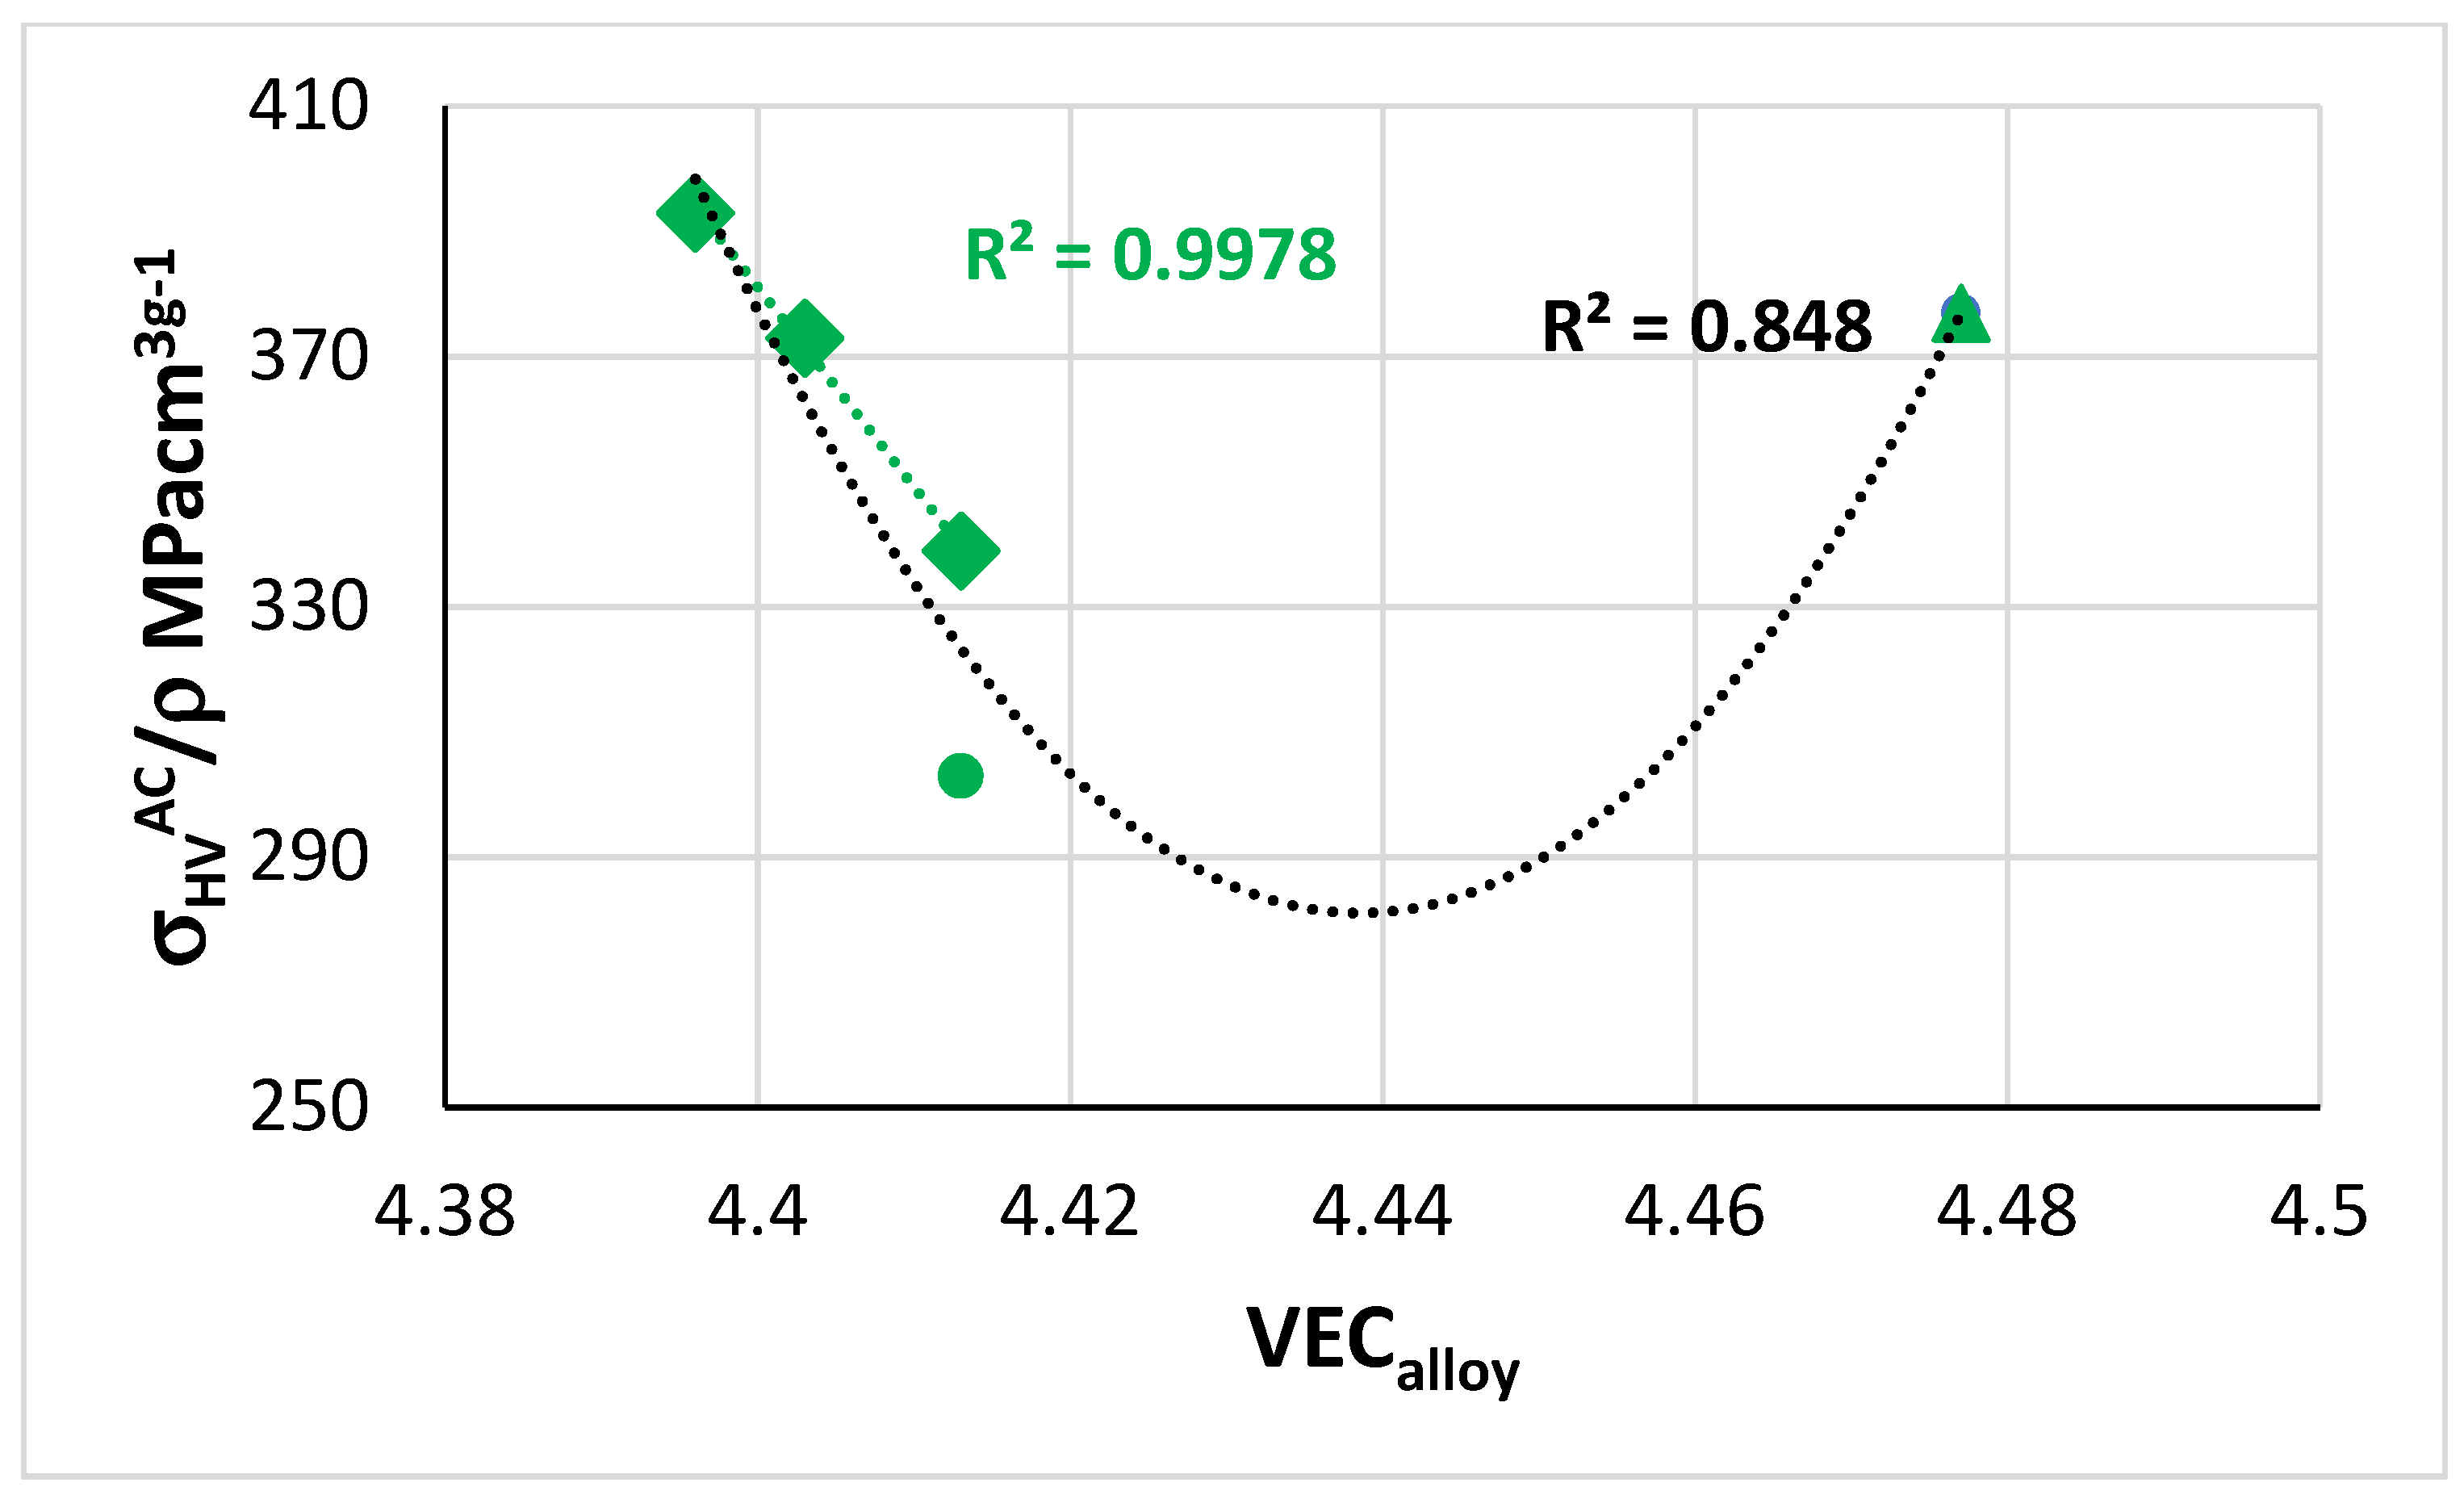
4.3.1. Hardness and Specific Yield Strength
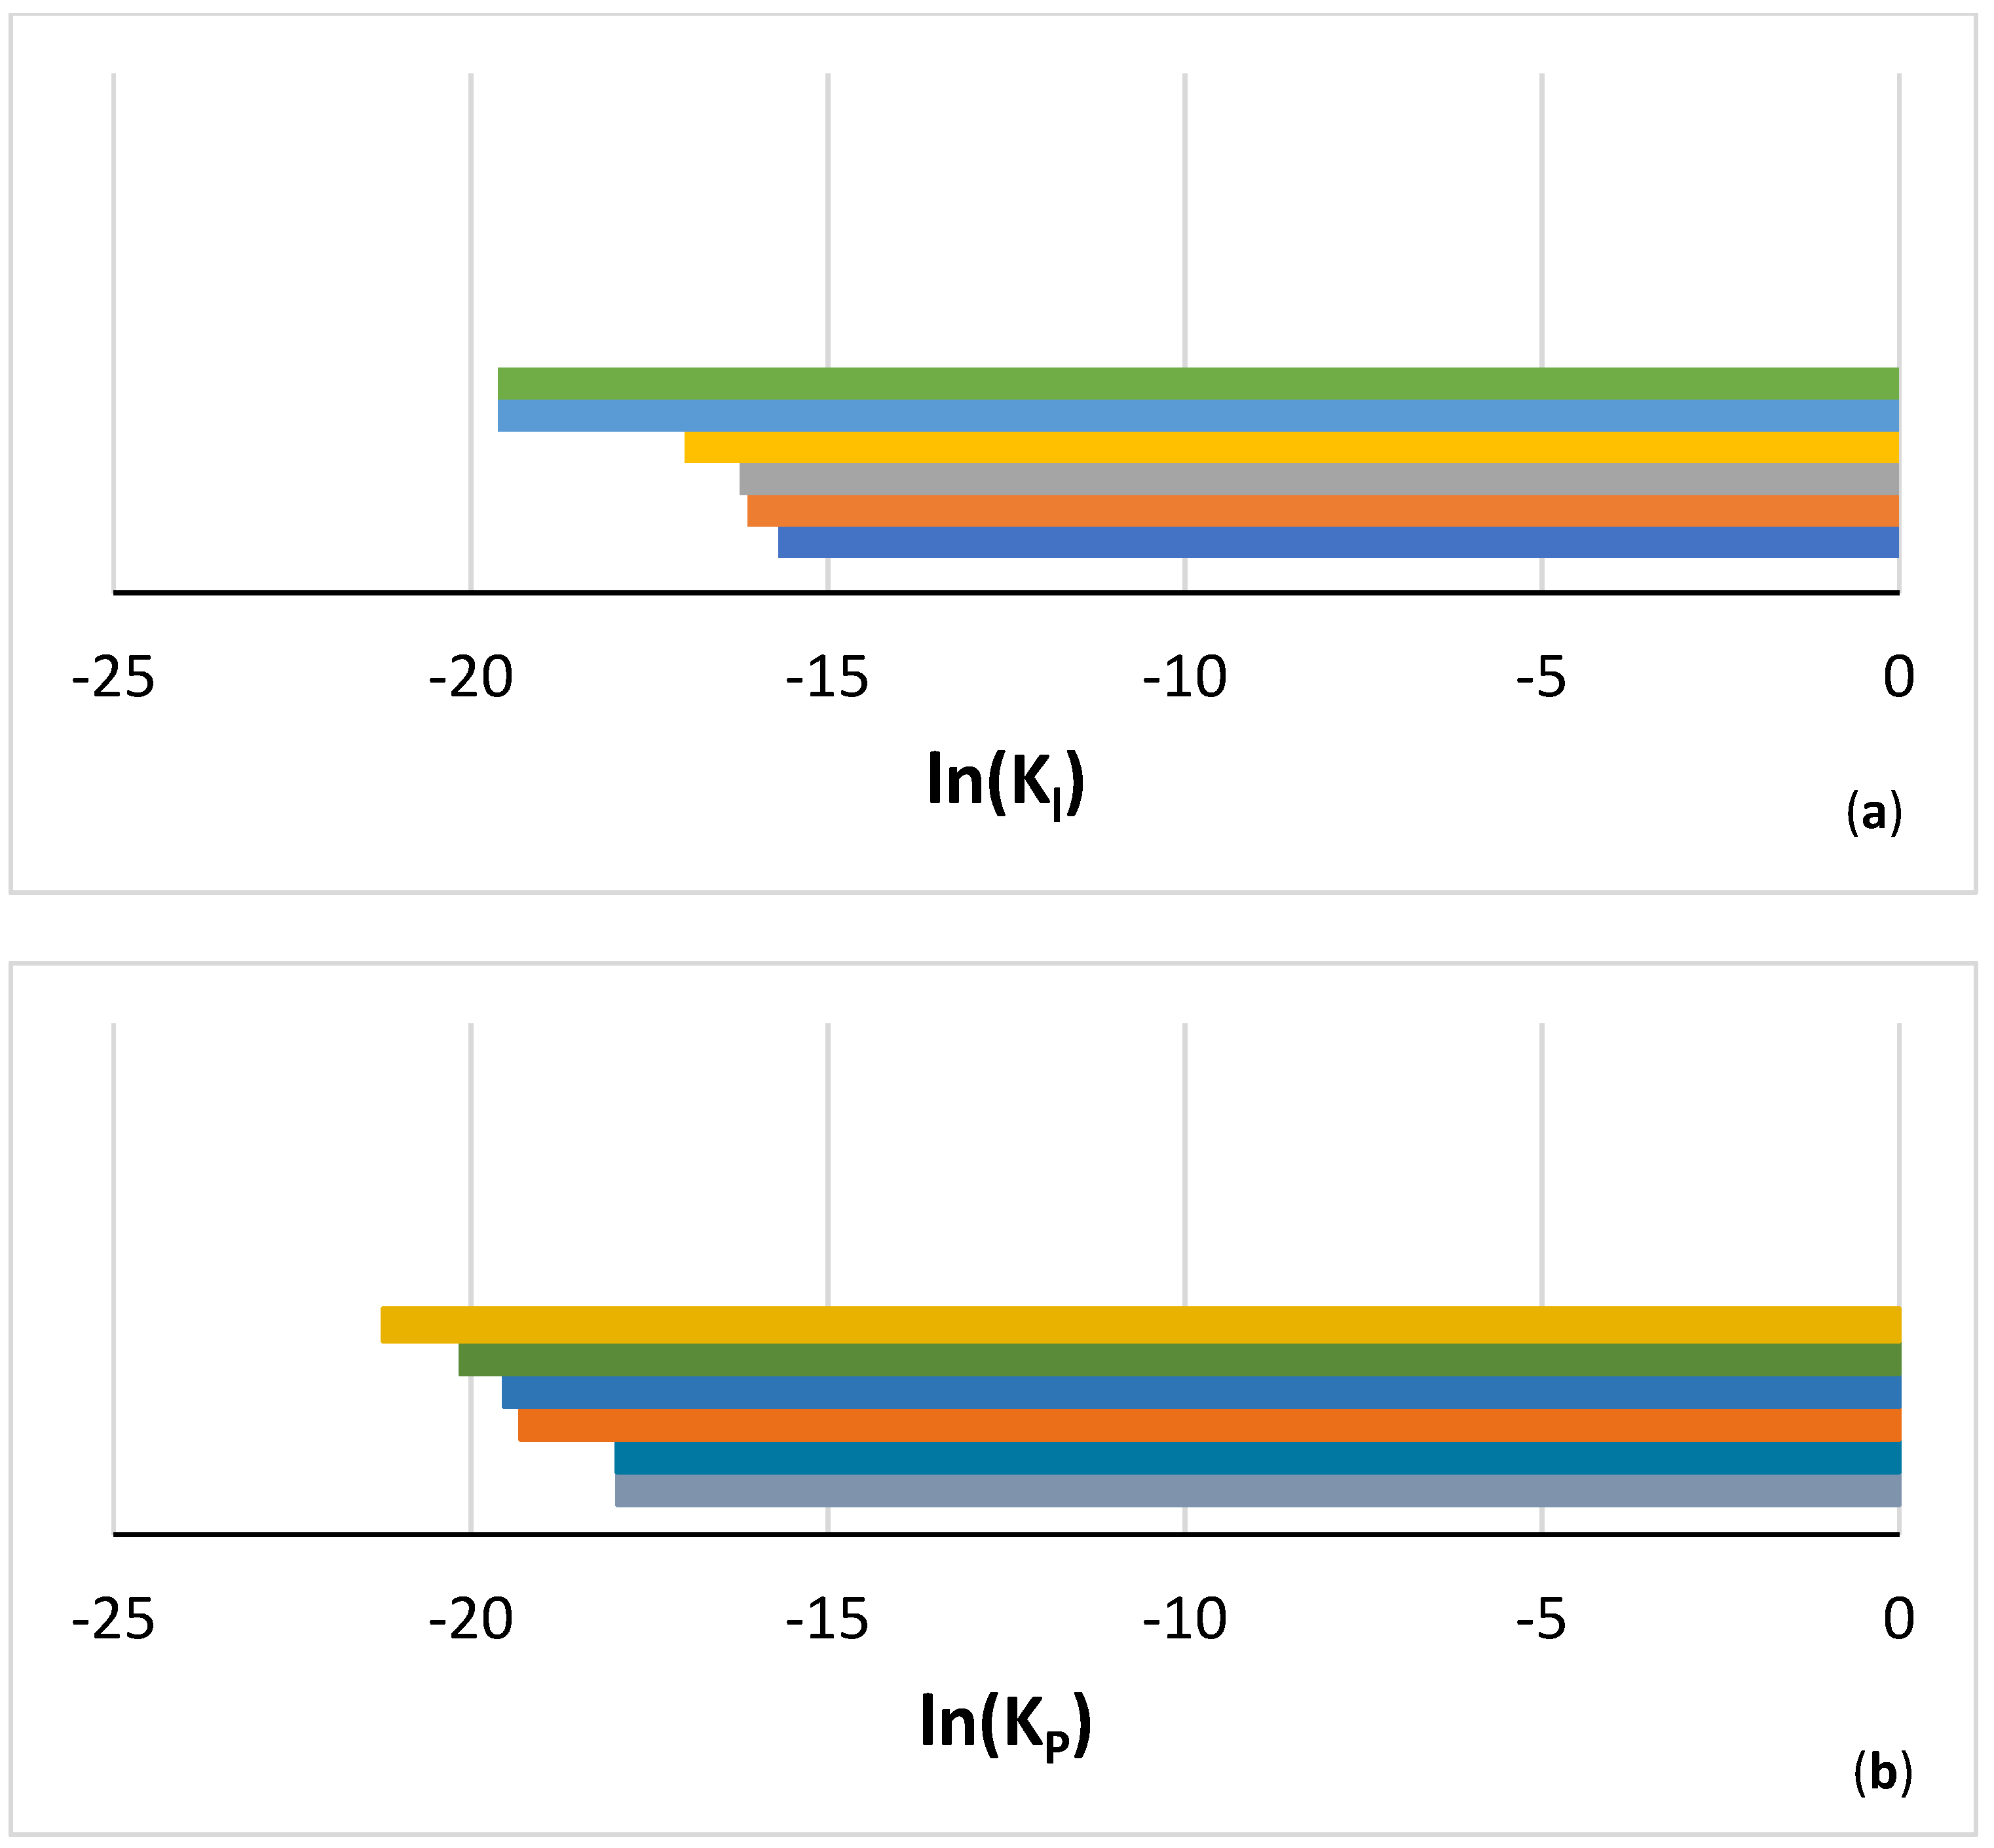
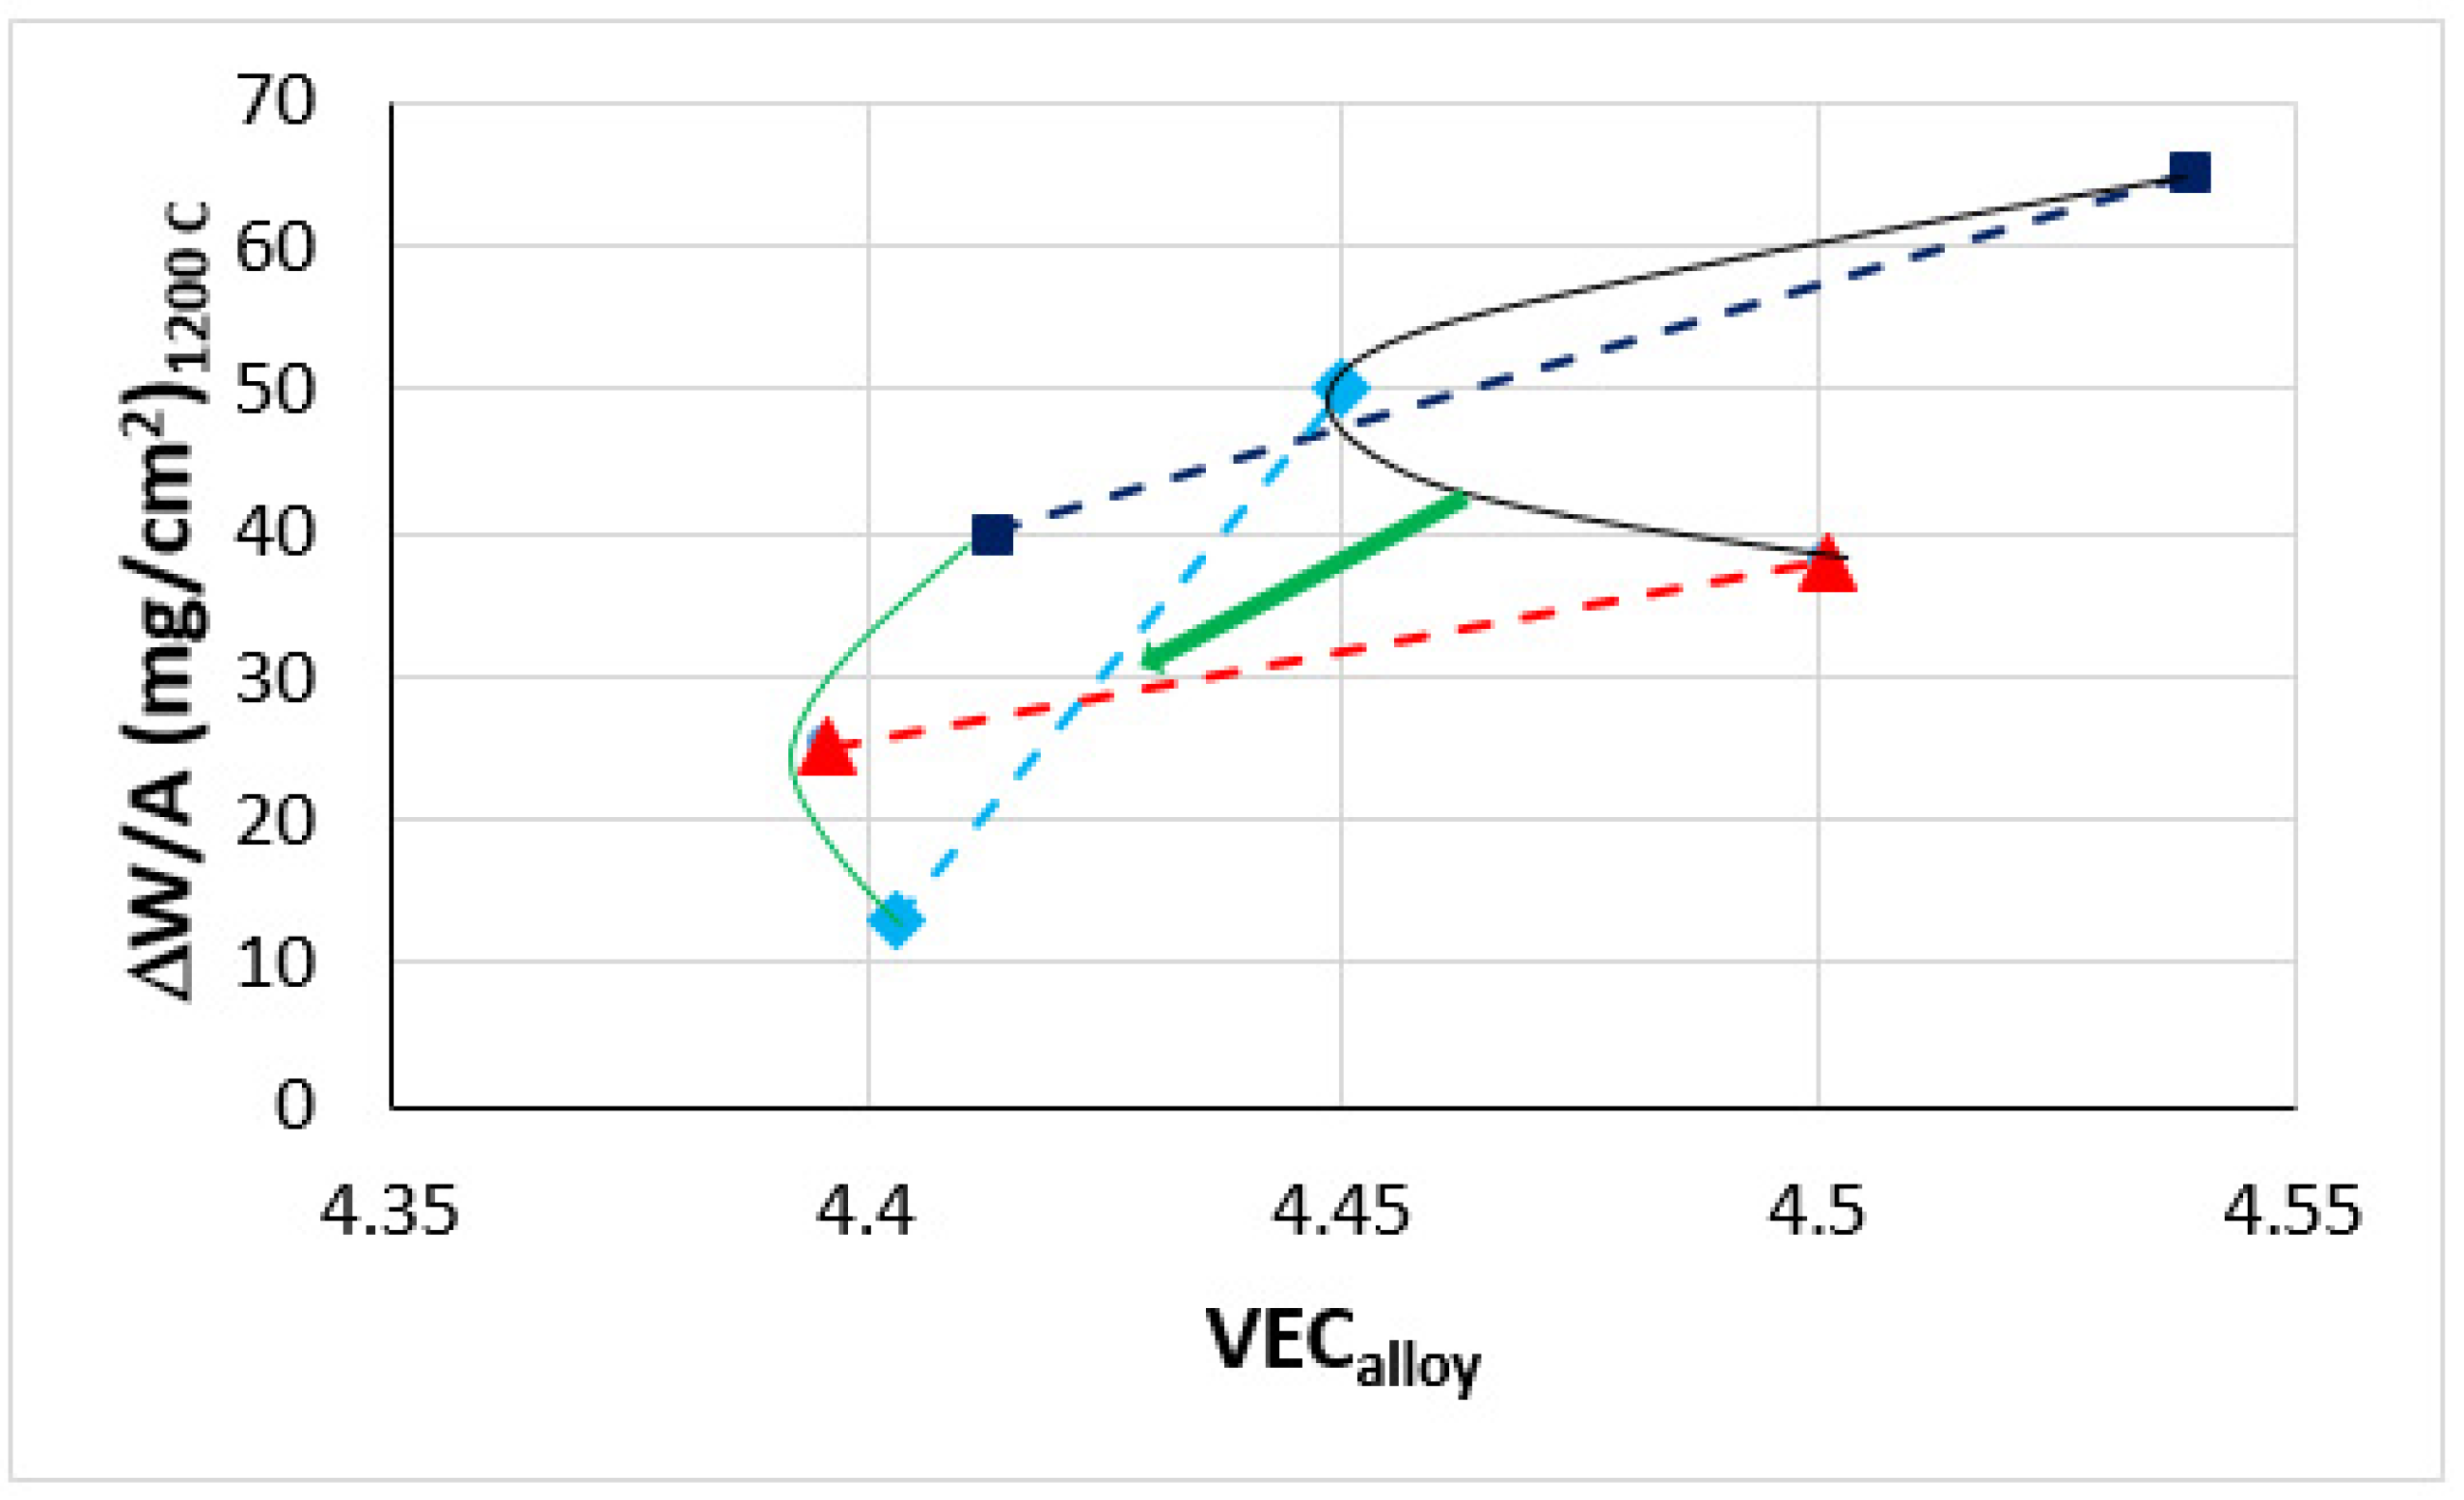
4.3.2. Oxidation
4.3.3. Comparison with Alloy Design Goals and Constraints
5. Conclusions
Supplementary Materials
Author Contributions
Funding
Institutional Review Board Statement
Informed Consent Statement
Data Availability Statement
Acknowledgments
Conflicts of Interest
Appendix A

| Alloy | Nominal Composition (at.%) | Ref. |
|---|---|---|
| JG3 | Nb-24Ti-18Si-5Al-5Cr-2Mo | [35] |
| JN1 | Nb-24Ti-18Si-5Al-5Cr-5Hf | [30] |
| KZ5 | Nb-24Ti-18Si-5Al-5Cr | [34] |
| KZ6 | Nb-24Ti-18Si-5Al-5Cr-6Ta | [28] |
| NV6 | Nb-24Ti-18Si-5Sn | [40] |
| NV9 | Nb-18Si-5Sn | [40] |
| TT1 | Nb-24Ti-18Si-8B | [26] |
| TT2 | Nb-24Ti-18Si-5Cr-7B | [27] |
| TT3 | Nb-24Ti-16Si-5Al-7B | [27] |
| TT4 | Nb-24Ti-18Si-5Al-5Cr-8B | [27] |
| TT8 | Nb-24Ti-17Si-3.5Al-5Cr-6B-2Mo | [27] |
| YG1 | Nb-18Si-5Cr-5Hf | [44] |
| YG2 | Nb-18Si-5Al-5Hf | [44] |
| YG3 | Nb-24Ti-18Si-5Hf | [44] |
| ZF9 | Nb-24Ti-18Si-5Al-5Cr-5Ge-5Hf | [49] |
| ZX7 | Nb-24Ti-18Si-5Al-5Cr-2Sn | [41] |
| ZX8 | Nb-24Ti-18Si-5Al-5Cr-5Sn | [29] |
References
- Tsakiropoulos, P. Alloys for application at ultra-high temperatures: Nb-silicide in situ composites. Challenges, breakthroughs and opportunities. Prog. Mater. Sci. 2022, 123, 100714. [Google Scholar] [CrossRef]
- Senkov, O.N.; Miracle, D.B.; Chaput, K.J. Development and exploration of refractory high entropy alloys-A review. J. Mater. Res. 2018, 33, 3092–3128. [Google Scholar] [CrossRef]
- Tsakiropoulos, P. On Nb silicide based alloys: Alloy design and selection. Materials 2018, 11, 844. [Google Scholar] [CrossRef] [PubMed]
- Tsakiropoulos, P. Refractory Metal (Nb) Intermetallic Composites, High Entropy Alloys, Complex Concentrated Alloys and the alloy design methodology NICE—Mise-en-scène patterns of thought and progress. Materials 2021, 14, 989. [Google Scholar] [CrossRef] [PubMed]
- Jackson, M.R.; Bewlay, B.P.; Zhao, J.-C. Niobium Silicide Based Composites Resistant to Low Temperature Pesting. U.S. Patent 6,419,765, 16 July 2002. [Google Scholar]
- Tsakiropoulos, P. Alloys. U.S. Patent 10,227,680 B2, 12 March 2019. [Google Scholar]
- Guo, H.; Guo, X. Microstructure evolution and room temperature fracture toughness of an integrally directionally solidified Nb–Ti–Si based ultrahigh temperature alloy. Scr. Mater. 2011, 64, 637–640. [Google Scholar] [CrossRef]
- Zhang, S.; Guo, X. Effects of B addition on the microstructure and properties of Nb silicide based ultrahigh temperature alloys. Intermetallics 2015, 57, 83–92. [Google Scholar] [CrossRef]
- Sun, G.; Jia, L.; Hong, Z.; Liu, G.; Zhang, H. Improvement of oxidation resistance of Nb–Ti–Si based alloys with additions of Al, Cr and B at different temperatures. Prog. Nat. Sci. 2021, in press. [Google Scholar] [CrossRef]
- Nowotny, H.; Benesovky, F.; Rudy, E.; Wittmann, A. Aufban und Zunderverhalten von Niob Bor-Silicium Legierungen. Monatch. Chem. 1960, 91, 975–990. [Google Scholar] [CrossRef]
- Schlesinger, M.E.; Okamoto, H.; Gokhale, A.B.; Abbaschian, R. The Nb-Si (Niobium-Silicon) System. J. Phase Equilibria 1993, 14, 502–509. [Google Scholar] [CrossRef]
- Tsakiropoulos, P. On the Nb silicide based alloys: Part I-The bcc Nb solid solution. J. Alloys Compd. 2017, 708, 961–971. [Google Scholar] [CrossRef]
- Tsakiropoulos, P. On Nb silicide based alloys: Part II. J. Alloys Compd. 2018, 748, 569–576. [Google Scholar] [CrossRef]
- Tsakiropoulos, P. On the alloying and properties of tetragonal Nb5Si3 in Nb-silicide based alloys. Materials 2018, 11, 69. [Google Scholar] [CrossRef] [PubMed]
- Cantor, B.; Chang, I.T.H.; Knight, P.; Vincent, A.J.B. Microstructural development in equiatomic multicomponent alloys. Mater. Sci. Eng. 2004, A375–A377, 213–218. [Google Scholar] [CrossRef]
- Tsakiropoulos, P. Alloying and properties of C14-NbCr2 and A15-Nb3X (X = Al,Ge,Si,Sn) in Nb-silicide based alloys. Materials 2018, 11, 395. [Google Scholar] [CrossRef]
- Tsakiropoulos, P. Alloying and hardness of eutectics with Nbss and Nb5Si3 in Nb-silicide based alloys. Materials 2018, 11, 592. [Google Scholar] [CrossRef]
- Zhang, Y.; Zhou, Y.J.; Lin, J.P.; Chen, G.L.; Liaw, P.K. Solid-solution phase formation rules for multi-component alloys. Adv. Eng. Mater. 2008, 10, 534–538. [Google Scholar] [CrossRef]
- Ghadyani, M.; Utton, C.; Tsakiropoulos, P. Microstructure and isothermal oxidation of the alumina forming Nb1.7Si2.4Ti2.4Al3Hf0.5 and Nb1.3Si2.4Ti2.4Al3.5Hf0.4 alloys. Materials 2019, 12, 222. [Google Scholar] [CrossRef]
- Ghadyani, M.; Utton, C.; Tsakiropoulos, P. Microstructure and isothermal oxidation of the alumina scale forming Nb1.45Si2.7Ti2.25Al3.25Hf0.35 and Nb1.35Si2.3Ti2.3Al3.7Hf0.35 alloys. Materials 2019, 12, 759. [Google Scholar] [CrossRef]
- Zhao, J.; Utton, C.; Tsakiropoulos, P. On the microstructure and properties of Nb 18Si-6Mo-5Al-5Cr-2.5W-1Hf Nb-silicide based alloys with Ge, Sn and Ti additions (at.%). Materials 2020, 13, 4548. [Google Scholar] [CrossRef] [PubMed]
- Hernandez-Negrete, O.; Tsakiropoulos, P. On the microstructure and isothermal Oxidation at 800, 1200 and 1300 °C of the Al-25.5Nb-6Cr-0.5Hf (at.%) alloy. Materials 2019, 12, 2531. [Google Scholar] [CrossRef] [PubMed]
- Hernandez-Negrete, O.; Tsakiropoulos, P. On the microstructure and isothermal Oxidation at 800 and 1200 °C of the Nb-24Ti-18Si-5Al-5Cr-5Ge-5Sn (at.%) silicide based alloy. Materials 2020, 13, 722. [Google Scholar] [CrossRef] [PubMed]
- Zhao, J.; Utton, C.; Tsakiropoulos, P. On the microstructure and properties of Nb-12Ti-18Si-6Ta-5Al-5Cr-2.5W-1Hf (at.%) silicide based alloys with Ge and Sn additions. Materials 2020, 13, 3719. [Google Scholar] [CrossRef] [PubMed]
- Zhao, J.; Utton, C.; Tsakiropoulos, P. On the microstructure and properties of Nb-12Ti-18Si-6Ta-2.5W-1Hf (at.%) silicide based alloys with Ge and Sn additions. Materials 2020, 13, 1778. [Google Scholar] [CrossRef] [PubMed]
- Thandorn, T.; Tsakiropoulos, P. Study of the role of B addition on the microstructure of the Nb-24Ti-18Si-8B alloy. Intermetallics 2010, 18, 1033–1038. [Google Scholar] [CrossRef]
- Thandorn, T.; Tsakiropoulos, P. The effect of B on the microstructure and properties of refractory metal intermetallic composites (RMICs) based on Nb-24Ti-xSi (x = 16, 17 or 18 at.%) with additions of Al, Cr or Mo. Materials 2021, 14, 6101. [Google Scholar] [CrossRef]
- Zelenitsas, K.; Tsakiropoulos, P. Study of the role of Ta and Cr additions in the microstructure of Nb-Ti-Si-Al in situ composites. Intermetallics 2006, 14, 639–659. [Google Scholar] [CrossRef]
- Xu, Z.; Utton, C.; Tsakiropoulos, P. A study of the effect of 5 at.% Sn on the microstructure and isothermal oxidation at 800 and 1200 °C of Nb-24Ti-18Si based alloys with Al and/or Cr additions. Materials 2020, 13, 245. [Google Scholar] [CrossRef] [PubMed]
- Nelson, J.; Ghadyani, M.; Utton, C.; Tsakiropoulos, P. A study of the effects of Al, Cr, Hf and Ti additions on the microstructure and oxidation of Nb-24Ti-18Si silicide based alloys. Materials 2018, 11, 1579. [Google Scholar] [CrossRef]
- Yang, Y.; Chang, Y.A.; Tan, L.; Cao, W. Multiphase equilibria in the metal-rich region of the Mo-Ti-Si-B system: Thermodynamics prediction and experimental validation. Acta Mater. 2005, 53, 1711–1720. [Google Scholar] [CrossRef]
- Tsakiropoulos, P. On the macrosegregation of silicon in niobium silicide based alloys. Intermetallics 2014, 55, 95–101. [Google Scholar] [CrossRef]
- Bewlay, B.P.; Whiting, P.W.; Davis, A.W.; Briant, C.L. Creep Mechanisms in Niobium-Silicide Based In-Situ Composites. Mater. Res. Soc. Symp. Proc. 1999, 552, KK6.11.1–KK6.11.5. [Google Scholar] [CrossRef]
- Zelenitsas, K.; Tsakiropoulos, P. Study of the role of Cr and Al additions in the microstructure of Nb-Ti-Si in situ composites. Intermetallics 2005, 13, 1079–1095. [Google Scholar] [CrossRef]
- Geng, J.; Tsakiropoulos, P.; Shao, G. The effects of Ti and Mo additions on the microstructure of Nb-silicide based in situ composites. Intermetallics 2006, 14, 227–235. [Google Scholar] [CrossRef]
- Zacharis, E.; Utton, C.; Tsakiropoulos, P. A study of the effects of Hf and Sn on the microstructure, hardness and oxidation of Nb-18Si silicide based alloys without Ti addition. Materials 2018, 11, 2447. [Google Scholar] [CrossRef] [PubMed]
- Candioto, K.G.C.; Nunes, C.A.; Coelho, G.C.; Suzuki, P.A. Microstructural characterization of Nb-B-Si alloys with composition in the Nb-Nb5Si2B (T2-phase) vertical section. Mater. Charact. 2001, 47, 241–245. [Google Scholar] [CrossRef]
- Júnior, D.M.P.; Nunes, C.A.; Coelho, G.C.; Ferreira, F. Liquidus projection of the Nb-Si-B system in the Nb-rich region. Intermetallics 2005, 11, 251–255. [Google Scholar] [CrossRef]
- Okamoto, H. Phase Diagrams for Binary Alloys: Desk Handbook; ASM International: Metals Park, OH, USA, 2000. [Google Scholar]
- Vellios, N.; Tsakiropoulos, P. The role of Sn and Ti additions in the microstructure of Nb-18Si base alloys. Intermetallics 2007, 15, 1518–1528. [Google Scholar] [CrossRef]
- Xu, Z.; Utton, C.; Tsakiropoulos, P. A study of the effect of 2 at.% Sn on the microstructure and isothermal oxidation at 800 and 1200 °C of Nb-24Ti-18Si based alloys with Al and/or Cr additions. Materials 2018, 11, 1826. [Google Scholar] [CrossRef]
- Yang, Y.; Chang, Y.A.; Zhao, J.-C.; Bewlay, B.P. Thermodynamic modelling of the Nb-Hf-Si ternary system. Intermetallics 2003, 11, 407–415. [Google Scholar] [CrossRef]
- Bewlay, B.P.; Jackson, M.R.; Subramanian, P.R. Processing High-Temperature Refractory-Metal Silicide In-Situ Composites. JOM 1999, 51, 32–36. [Google Scholar] [CrossRef]
- Grammenos, I.; Tsakiropoulos, P. Study of the role of Al, Cr and Ti additions in the microstructure of Nb–18Si–5Hf base alloys. Intermetallics 2010, 18, 242–253. [Google Scholar] [CrossRef]
- Grammenos, I.; Tsakiropoulos, P. Study of the role of Hf, Mo and W additions in the microstructure of Nb-20Si silicide based alloys. Intermetallics 2011, 19, 1612–1621. [Google Scholar] [CrossRef]
- Grammenos, I.; Tsakiropoulos, P. Study of the role of Mo and Ta additions in the microstructure of Nb-18Si-5Hf silicide based alloy. Intermetallics 2010, 18, 1524–1530. [Google Scholar] [CrossRef]
- Vellios, N.; Keating, P.; Tsakiropoulos, P. On the microstructure and properties of the Nb-23Ti-5Si-5Al-5Hf-5V-2Cr-2Sn (at.%) silicide based alloy-RM(Nb)IC. Metals 2021, 11, 1868. [Google Scholar] [CrossRef]
- Sun, Z.; Guo, X.; He, Y.; Guo, J.; Yang, Y.; Chang, Y.A. Investigation on the as-cast microstructure of Nb–Nb silicide based multicomponent alloys. Intermetallics 2010, 18, 992–997. [Google Scholar] [CrossRef]
- Li, Z.; Tsakiropoulos, P. The effect of Ge addition on the oxidation of Nb-24Ti-18Si silicide based alloys. Materials 2019, 12, 3120. [Google Scholar] [CrossRef] [PubMed]


| Alloy | Condition | Element (at.%) | Ti/Si | ||||||||
|---|---|---|---|---|---|---|---|---|---|---|---|
| Nb | Ti | Si | Al | B | Cr | Hf | Sn | Ta | |||
| TT5 | nominal | 37 | 24 | 18 | 5 | 5 | 5 | - | - | 6 | 1.33 |
| AC | 38.6 | 23.7 | 16.4 | 4.6 | 6.3 | 4.9 | - | - | 5.5 | 1.45 | |
| HT | 38.6 | 23.5 | 17.3 | 4.4 | 5.5 | 4.9 | - | - | 5.8 | 1.36 | |
| TT6 | nominal | 39 | 24 | 18 | 4 | 6 | 5 | - | 4 | - | 1.33 |
| AC | 39.3 | 23.7 | 17.5 | 3.4 | 6.7 | 5.2 | - | 4.2 | - | 1.35 | |
| HT | 39.3 | 23 | 18.4 | 3.6 | 6.3 | 5.3 | - | 4.1 | - | 1.25 | |
| TT7 | nominal | 38 | 24 | 17 | 5 | 6 | 5 | 5 | - | - | 1.41 |
| AC | 40.6 | 23.3 | 17 | 4.5 | 5.2 | 4.7 | 4.7 | - | - | 1.37 | |
| HT | 39 | 24.1 | 17.1 | 4.4 | 6.1 | 4.6 | 4.7 | - | - | 1.41 | |
| Alloy | Hardness HValloy | ρ (g/cm3) | Vol.% Nbss | Microhardness HVphase | ||||||
|---|---|---|---|---|---|---|---|---|---|---|
| Nbss | T2 | |||||||||
| AC | HT | AC | HT | AC | HT | AC | HT | AC | HT | |
| TT5 | 715 ± 53 645 − 799 | 657 ± 31 600 − 693 | 6.9 | 6.9 | 32 | 38 | 576 ± 28 538 − 631 | 503 ± 14 479 − 521 | 1480 ± 57 1369 − 1572 | 1484 ± 62 1369 − 1572 |
| TT6 | 776 ± 43 712 − 842 | 730 ± 33 684 − 782 | 6.46 | 6.43 | 29 * | 43 * | 758 ± 28 720 − 796 **◊ | 678 ± 28 631–721 **◊ | 1378 ± 63 1265 − 1468 | 1214 ± 42 1143 − 1265 |
| TT7 | 776 ± 55 696 − 866 | 658 ± 32 612 − 708 | 6.8 | 6.83 | 10 | 37 | 539 ± 22 512 − 577 | 476 ± 21 437 − 504 | 1340 ± 33 1296 − 1405 | 1200 ± 55 1116 − 1299 |
| Alloy | MACX (at.%) | |||||
|---|---|---|---|---|---|---|
| Al | B | Cr | Si | Ti | Sn | |
| TT5 | 1.3 | 2.4 | 1.3 | 4.8 | 1.6 | - |
| TT6 | 1.2 | 2.5 | 2.3 | 3.9 | 3 | 1.1 |
| TT7 | - | 2.8 | 2.2 | 1.7 | 2.4 | - |
| Alloy and Condition | Nbss | T2 | Cr and Ti Rich Phase | C14 Laves | Nbss + T2 Eutectic ** | Nb3Sn | Nb3Si | D88 | Nb5Si3 | Nbss + Nb5Si3 Eutectic |
|---|---|---|---|---|---|---|---|---|---|---|
| TT5-AC | X * | X * | X | - | X | - | X | X | - | - |
| TT5-HT | X | X * | - | - | - | - | - | X | - | - |
| TT6-AC | X ◊ | X * | - | - | X | X | X | X | - | - |
| TT6-HT | - | X * | - | - | - | X | - | X | - | - |
| TT7-AC | X * | X * | - | - | - | - | X | X | - | - |
| TT7-HT | X | X | - | - | - | - | - | X | - | - |
| KZ6-AC | X * | - | - | - | - | - | - | - | X *, β | X |
| KZ6-HT | X | - | - | - | - | - | - | - | X *, β & α | - |
| ZX8-AC | - | - | - | X | - | X | - | - | X *, β | - |
| ZX8-HT | X | - | - | X | - | X | - | - | X *, α | - |
| JN1-AC | X * | - | - | - | - | - | - | - | X *, β | X |
| JN1-HT | X | - | - | - | - | - | - | - | X *, β | - |
| Alloy | Phase | Nb | Ti | Si | B | Cr | Al | Hf | Sn | Ta |
|---|---|---|---|---|---|---|---|---|---|---|
| TT5-AC | Nbss | 41.5 − 46.1 43.5 ± 0.8 | 29.1 − 32.3 31.1 ± 0.6 | 1.2 − 1.7 1.5 ± 0.2 | 0 − 1.6 0.7 ± 0.4 | 8.1 − 10.4 7.1 ± 0.4 | 5.2 − 7.7 6.7 ± 0.4 | - | - | 6.5 − 7.7 7.0 ± 0.4 |
| Ti rich Nbss | 27.9 − 34.1 31.4 ± 1.5 | 38.1 − 43.6 40.2 ± 1.5 | 1.3 − 1.9 1.4 ± 0.3 | - | 14.5 − 17.3 15.9 ± 0.4 | 5.8 − 7.9 7.1 ± 0.6 | - | - | 3 − 5.3 3.7 ± 0.3 | |
| T2 | 34.4 − 35.7 35.2 ± 0.3 | 19.1 − 22.8 20.9 ± 0.9 | 29.6 − 31.9 29.2 ± 1.3 | 3.1 − 5.7 6.2 ± 1.2 | 0.4 − 0.9 0.7 ± 0.2 | 2.2 − 3.9 2.4 ± 0.6 | - | - | 4.9 − 5.8 5.4 ± 0.4 | |
| Ti rich T2 | 22.9 − 28.1 25.4 ± 2.4 | 29.5 − 36.5 32.8 ± 3.8 | 26.5 − 29 27.7 ± 0.9 | 3.8 − 6 5.4 ± 0.3 | 1.6 − 2.6 2.2 ± 0.5 | 3.5 − 4.3 3.9 ± 0.3 | - | - | 2.0 − 3.2 2.6 ± 0.6 | |
| D88 | 38.1 − 39.5 38 ± 0.9 | 11.2 − 12.5 12 ± 0.2 | 14.6 − 16.1 14.2 ± 0.6 | 22.1 − 26.7 25.8 ± 0.5 | 0.8 − 1.4 1.1 ± 0.1 | - | - | - | 8.5 − 9.2 8.9 ± 0.3 | |
| TT6-AC | Nb3Sn | 41.1 − 46.3 43.7 ± 1.7 | 28.2 − 31.1 29.9 ± 1.9 | 3.0 − 3.3 3.1 ± 0.1 | 0.4 − 4.2 2.4 ± 1.4 | 3.5 − 4.8 4.3 ± 0.4 | 3.7 − 5.5 4.6 ± 0.3 | - | 11.0 − 12.4 11.8 ± 0.7 | - |
| Ti rich Nbss | 26.2 − 29.9 28.0 ± 1.0 | 45.5 − 49.3 47.0 ± 0.7 | 0.5 − 1.4 0.9 ± 0.5 | - | 10.2 − 13.7 12.1 ± 0.4 | 7.3 − 8.7 8.1 ± 0.3 | - | 3.5 − 4.7 4.1 ±0.1 | - | |
| T2 | 37.9 − 41 39.9 ± 0.7 | 19.6 − 20.8 20 ± 0.6 | 28.5 − 30.8 29.6 ± 1.4 | 5.7 − 9.4 6.9 ± 1.7 | 0.6 − 9.4 0.9 ± 0.1 | 0.6 − 1.2 2.1 ± 0.3 | - | 1.5 − 2.9 0.6 ± 0.1 | - | |
| Ti-rich T2 | 30.7 − 34.6 33.0 ± 0.9 | 24.8 − 29.4 27.1 ± 0.6 | 26.4 − 28.4 27.4 ± 0.4 | 4.9 − 6.8 5.8 ± 0.4 | 1.0 − 1.8 1.4 ± 0.3 | 3.7 − 4.8 4.3 ± 0.3 | - | 0.7 − 1.1 0.8 ± 0.1 | - | |
| D88 | 42.8 − 44.8 44.1 ± 2.3 | 11.5 − 12.9 12.1 ± 0.5 | 13.1 − 15.2 14.2 ± 1.9 | 27.2 − 28.5 28.2 ± 4.1 | 0.9 − 2.1 1.2 ± 0.2 | - | - | - | - | |
| TT7-AC | Nbss | 44.3 − 50.3 47.4 ± 3.3 | 30.0 − 32.2 31.2 ± 1.1 | 0.9 − 1.2 1.0 ± 0.3 | 0 − 7.3 2.4 ± 1.8 | 7.1 − 10.2 8.9 ± 1.2 | 4.8 − 6.8 5.8 ± 1.3 | 3.1 − 3.3 3.2 ± 0.3 | - | - |
| Ti rich Nbss | 34.8 − 40.8 38.2 ± 2.3 | 32.7 − 40.4 36.7 ± 3.3 | 0.4 − 1.6 0.9 ± 0.4 | 0 − 4.5 3.0 ± 2.5 | 10.4 − 13.4 11.9 ± 1.3 | 4.6 − 6.7 5.6 ± 1.3 | 3.4 − 3.7 3.5 ± 0.2 | - | - | |
| T2 | 32.0 − 37.3 34.7 ± 2.3 | 16.7 − 20.6 19.1 ± 1.1 | 27.8 − 31.9 29.8 ± 1.5 | 1.6 − 11.3 6.0 ± 3.2 | 0.5 − 1.4 0.9 ± 0.1 | 2.0 − 4.6 3.5 ± 2.0 | 6.5 − 7.5 6.9 ± 0.6 | - | - | |
| Ti rich T2 | 31.5 − 36 27.6 ± 3 | 24.8 − 28.4 26.6 ± 0.8 | 26.9 − 29.7 28.6 ± 0.5 | 1.5 − 7.9 4.7 ± 2.9 | 0.9 − 1.7 1.3 ± 0.3 | 3.7 − 4.8 4.2 ± 0.9 | 9.1 − 10.5 9.7 ± 0.5 | - | - | |
| TT5-HT | Nbss | 38.8 − 44.0 41.6 ± 2.4 | 27.6 − 34.9 31.1 ± 2.7 | 0.4 − 0.8 0.6 ± 0.2 | 0 − 7.4 4.1 ± 2.8 | 9.7 − 12.0 10.7 ± 0.5 | 5.7 − 6.7 6.4 ± 1.0 | - | - | 6.1 − 7.0 6.8 ± 0.4 |
| T2 | 33.8 − 38 36.4 ± 1.4 | 18.2 − 22.9 20.7 ± 1.9 | 25 − 32.5 28 ± 2.9 | 1.6 − 13.7 6.7 ± 4.5 | 0.4 − 1.1 0.6 ± 0.2 | 1.7 − 2.4 2.3 ± 0.3 | - | - | 3.6 − 6.1 5.3 ± 1.2 | |
| Ti rich T2 | 29.7 − 33.5 31.1 ± 1.8 | 25.3 − 26.5 25.7 ± 0.6 | 28.1 − 30.9 29 ± 1.3 | 2.2 − 8.3 6 ± 2.9 | 0.5 − 1.7 1.3 ± 0.2 | 2.6 − 3.6 3 ± 0.2 | - | - | 3.7 − 4.0 3.9 ± 0.1 | |
| D88 | 30.4 − 37.0 38.5 ± 3.2 | 9.4 − 14.8 11.8 ± 2.0 | 10.4 − 15.9 13.9 ± 0.4 | 23 − 29.2 26.1 ± 2.2 | 0.5 − 1.6 1 ± 0.3 | - | - | - | 7.4 − 9.9 8.7 ± 0.4 | |
| TT6-HT | Nb3Sn | 36.5 − 47.3 42.0 ± 3.9 | 28.3 − 33.3 31.1 ± 2.3 | 2.6 − 3.3 3.1 ± 0.3 | 0 − 6.4 3.6 ± 2.2 | 3.7 − 4.9 4.4 ± 0.5 | 5.1 − 6.4 5.7 ± 0.5 | - | 10.8 − 12.2 11.4 ± 0.5 | - |
| T2 | 41.4 − 44 42.5 ± 1.3 | 19.3 − 20.4 19.8 ± 0.6 | 27.2 − 31.8 28 ± 1.9 | 6.4 − 8.8 7.1 ± 1.2 | 0.3 − 0.7 0.5 ± 0.2 | 0.9 − 2.4 1.5 ± 0.5 | - | 0.4 − 0.7 0.6 ± 0.1 | - | |
| Ti rich T2 | 31.5 − 39.8 36 ± 3.2 | 22.5 − 23.1 22.9 ± 0.4 | 24.5 − 30.9 28 ± 2.2 | 2.1 − 9 5.2 ± 2.5 | 0.6 − 1.3 1 ± 0.1 | 2.8 − 4.6 3.9 ± 0.9 | - | 0.8 − 1.2 1 ± 0.1 | - | |
| D88 | 40.1 − 51 45.9 ± 3.2 | 11.5 − 13.1 12.3 ± 0.7 | 10.8 − 13.1 12.1 ± 1.1 | 27.5 − 37.6 28 ± 4.7 | 0.9 − 2.4 1.7 ± 0.6 | - | - | - | - | |
| TT7-HT | Nbss | 51.1 − 51.9 51.6 ± 0.4 | 26.7 − 27.4 27.0 ± 0.4 | - | 3.0 − 3.8 3.4 ± 0.2 | 8.3 − 8.7 8.5 ± 0.2 | 7.1 − 7.7 7.4 ± 0.3 | 2.1 − 2.2 2.2 ± 0.1 | - | - |
| T2 | 28.0 − 30.5 29.2 ± 1 | 19.0 − 24.0 21.3 ± 2.5 | 26.9 − 29.0 27.8 ± 0.9 | 3.8 − 10.1 6.4 ± 3.4 | 0.3 − 1.0 0.6 ± 0.4 | 2.0 − 3.8 3.3 ± 0.9 | 7.8 − 8.3 8.0 ± 0.2 | - | - | |
| Ti rich T2 | 27.3 − 32.3 29.9 ± 1.8 | 23.3 − 27.7 24.8 ± 1.7 | 27.2 − 30.2 29.5 ± 1.4 | 1.1 − 7.9 4.2 ± 3 | 0.5 − 1.0 0.8 ± 0.2 | 1.9 − 3.5 2.9 ± 0.7 | 8.2 − 9.1 8.7 ± 0.4 | - | - | |
| D88 | 47.6 − 49.4 45.4 ± 0.9 | 14.0 − 14.5 11.3 ± 0.3 | 13.5 − 13.8 12.7 ± 0.2 | 23.2 − 29.9 27.3 ± 1.8 | 1.4 − 1.6 1.5 ± 0.1 | - | 1.6 − 2 1.8 ± 0.1 | - | - |
| Alloy and Condition | Phase | Parameter | ||||
|---|---|---|---|---|---|---|
| Si + B (at.%) | Si/B | Si + B + Al (at.%) | Si + Al + B + Sn (at.%) | <Nb/<Si> | ||
| TT5-AC | T2 | 35.4 | 4.7 | 37.8 | 1.65 | |
| Ti rich T2 | 33.1 | 5.1 | 37 | 1.7 | ||
| D88 | 40 | 0.55 | 1.5 | |||
| TT5-HT | T2 | 34.7 | 4.2 | 37 | 1.7 | |
| Ti rich T2 * | 35 | 4.8 | 38 | 1.63 | ||
| D88 | 40 | 0.53 | 1.5 | |||
| TT6-AC | T2 | 36.5 | 4.3 | 38.6 | 39.2 | 1.55 |
| Ti rich T2 | 33.2 | 4.7 | 37.5 | 38.3 | 1.61 | |
| D88 | 42.4 | 0.5 | 1.36 | |||
| TT6-HT | T2 | 35.1 | 3.9 | 36.6 | 37.2 | 1.69 |
| Ti rich T2 | 33.2 | 5.4 | 37.1 | 38.1 | 1.62 | |
| D88 | 40.1 | 0.43 | 1.49 | |||
| TT7-AC | T2 | 35.8 | 5 | 39.3 | 1.54 | |
| Ti rich T2 | 33.3 | 6.1 | 37.5 | 1.67 | ||
| D88 * | 40.2, 40.4 | 0.49, 0.46 | 1.49, 1.47 | |||
| TT7-HT | T2 | 34.2 | 4.3 | 37.5 | 1.67 | |
| Ti rich T2 | 33.7 | 7 | 36.6 | 1.73 | ||
| D88 | 40 | 0.47 | 1.5 | |||
| Average | T2 | 34.5 | 4.96 | 37.5 | 38.2 | 1.65 |
| D88 | 40.4 | 0.49 | 1.47 | |||
| Alloy | Oxidation Rate Constant | Mass Change ΔW/A (mg/cm2) | Pest Oxidation | Scale Spallation | |||
|---|---|---|---|---|---|---|---|
| 800 °C kl (g/cm2 s) | 1200 °C kp (g2/cm4 s) | 800 °C | 1200 °C | 800 °C | 800 °C | 1200 °C | |
| MASC | 1.5 × 10⁻⁷ | 1.6 × 10⁻⁸ | 36 (≤65 h) | 80 | MC * | - | Yes |
| TT4 | 8.9 × 10⁻⁸ | 3.4 × 10⁻⁹ | 27.9 | 34 | No | Yes | Yes |
| TT5 | 1 × 10⁻⁷ | 4.2 × 10⁻⁹ | 33.8 | 34 ++ | No | Yes | Yes |
| TT6 | 3 × 10⁻⁹ | 1.8 × 10⁻⁹ | 1.4 | 23.5 + | No | No | No |
| TT7 | 4.2 × 10⁻⁸ | 6 × 10⁻¹⁰ | 18.9 | 11.3 ** | No | No | No |
| TT8 | 3 × 10⁻⁹ | 3.3 × 10⁻⁹ | 1.4 | 30 | No | No | No |
| Alloy | MACSi (at.%) | Alloy | MACB (at.%) | Alloy | MACTi (at.%) |
|---|---|---|---|---|---|
| ZX8 | 10 | TT8 | 4.9 | ZX8 | 9.7 |
| TT5 | 4.8 | TT4 | 2.9 | KZ6 | 3.4 |
| TT4 | 4.7 | TT7 | 2.8 | TT4 | 3.3 |
| KZ6 | 4.5 | TT6 | 2.5 | TT6 | 3.0 |
| JN1 | 4.0 | TT5 | 2.4 | TT8 | 2.8 |
| TT6 | 3.9 | TT7 | 2.4 | ||
| JG3 | 2.7 | JN1 | 1.9 | ||
| TT7 | 1.7 | TT5 | 1.6 | ||
| TT8 | 1.3 | JG3 | 1.5 | ||
| KZ5 | 1.3 | KZ5 | 1.4 |
| Alloy and Condition | Si + Sn (at.%) | Si + Sn + Al (at.%) | Si + Sn + Al + B (at.%) | Si/Sn | (Si + Al)/Sn | (Si + Al + B)/Sn |
|---|---|---|---|---|---|---|
| TT6-AC | - | 19.5 | 21.9 | - | 0.9 | |
| TT6-HT | - | 20.2 | 23.8 | - | 1.1 | |
| ZX8-AC | - | 20.1 | - | - | 1.1 | - |
| ZX8-HT | - | 19.3 | - | - | 1.2 | - |
| NV9-AC | 17.8 | - | - | 1 | - | |
| NV9-HT * | 17.2 | - | - | 0.8 | - |
Publisher’s Note: MDPI stays neutral with regard to jurisdictional claims in published maps and institutional affiliations. |
© 2021 by the authors. Licensee MDPI, Basel, Switzerland. This article is an open access article distributed under the terms and conditions of the Creative Commons Attribution (CC BY) license (https://creativecommons.org/licenses/by/4.0/).
Share and Cite
Thandorn, T.; Tsakiropoulos, P. On the Microstructure and Properties of Nb-Ti-Cr-Al-B-Si-X (X = Hf, Sn, Ta) Refractory Complex Concentrated Alloys. Materials 2021, 14, 7615. https://doi.org/10.3390/ma14247615
Thandorn T, Tsakiropoulos P. On the Microstructure and Properties of Nb-Ti-Cr-Al-B-Si-X (X = Hf, Sn, Ta) Refractory Complex Concentrated Alloys. Materials. 2021; 14(24):7615. https://doi.org/10.3390/ma14247615
Chicago/Turabian StyleThandorn, Tophan, and Panos Tsakiropoulos. 2021. "On the Microstructure and Properties of Nb-Ti-Cr-Al-B-Si-X (X = Hf, Sn, Ta) Refractory Complex Concentrated Alloys" Materials 14, no. 24: 7615. https://doi.org/10.3390/ma14247615