Article

Ironsand (Titanomagnetite-Titanohematite): Chemistry, Magnetic Properties and Direct Applications for Wireless Power Transfer

1
Earth Resources & Materials, Geological and Nuclear Science, National Isotope Centre, 30 Gracefield Road, Lower Hutt 5040, New Zealand
2
The MacDiarmid Institute for Advanced Materials and Nanotechnology, Victoria University of Wellington, Wellington 6140, New Zealand
3
Robinson Research Institute, Victoria University of Wellington, 69 Gracefield Road, Lower Hutt 5010, New Zealand
4
Verum Group, 68 Gracefield Road, Lower Hutt 5010, New Zealand
5
Department of Electrical and Computer Engineering, Faculty of Engineering, University of Auckland, Auckland 1142, New Zealand
6
Department of Physics, Boston University, Boston, MA 02215, USA
7
Advanced Light Source, E. O. Lawrence Berkeley National Laboratory, Berkeley, CA 94720, USA
*
Author to whom correspondence should be addressed.
Materials 2021, 14(18), 5455; https://doi.org/10.3390/ma14185455
Submission received: 27 August 2021 / Revised: 14 September 2021 / Accepted: 15 September 2021 / Published: 21 September 2021

Abstract

:
Ironsand is an abundant and inexpensive magnetic mineral resource. However, the magnetic properties of unprocessed ironsand are often inadequate for any practical applications. In this work, the applicability of ironsand for use as a component in a soft magnetic composite for large-scale inductive power transfer applications was investigated. After magnetic separation, the chemical, structural and magnetic properties of ironsand sourced from different locations were compared. Differences observed in the DC magnetic properties were consistent with changes in the chemical compositions obtained from X-ray Absorption Near-Edge Spectroscopy (XANES), which suggests varying the titanohematite to titanomagnetite content. Increased content in titanomagnetite and magnetic permeability correlated well with the total Fe content in the materials. The best-performing ironsand with the highest permeability and lowest core losses was used alongside Mn,Zn-Ferrite particles (ranging from ∼100 μ m to 2 mm) to fabricate toroid cores with varying magnetic material loading. It was shown that ironsand can be used to replace up to 15 wt.% of the magnetic materials with minimal impact on the composite magnetic performance, thus reducing the cost. Ironsand was also used as a supporting material in a single-rail wireless power transfer system, effectively increasing the power transfer, demonstrating potential applications to reduce flux leakage.

1. Introduction

Ironsand is an important resource for steel and titanium production but has seen limited application beyond that. For example, New Zealand’s ironsand with its iron content in the form of titanomagnetite and titanohematite also makes it a useful supply for titanium. While this ironsand has been exported and used in New Zealand for steel manufacturing for more than 40 years [1,2], there is still ample research to simplify the processing mechanisms and expand the applications of this inexpensive commodity. Recently, for instance, groups have investigated potentially low-cost methods to effectively reduce ironsands, producing microparticles with an insulating TiO2 shell and an iron core for simpler processing [3,4]. Applications requiring large quantities of low-magnetic-permeability materials could benefit from such an inexpensive resource. One such application is Inductive Power Transfer (IPT) for vehicle charging.
The driving range of battery electrical vehicles greatly limits their uptake [5,6,7,8,9]. Rather than deploying more stationary recharging stations, a proposition to resolve this issue is to charge the vehicle as it is driving. While the age-old catenaries or rail solutions can be envisaged and will likely have a continuing role in public transport and long-haul land-based heavy transportation [8,10,11], recent efforts have focused on developing a wireless and contact-less power transfer solution [5,12,13]. Among other competing technologies for wireless power transfer [14,15], IPT is arguably the most promising solution [16,17,18]. Even though IPT technology has been conceptualised for over 100 years [19], it has only recently been widely demonstrated [20]. For in-road IPT specifically, a number of medium- and large-scale systems have now been successfully implemented [21,22,23,24,25]. In-road IPT will likely be exposed to extreme conditions ranging from mechanical stress and vibrations from traffic, to possibly difficult environmental conditions—high seasonal temperature variations and varying moisture levels. Hence, such IPT system will have to be designed to endure or be protected from these conditions. In particular, current magnetic core materials found in conventional IPT system are brittle [26] and may not survive these conditions over the decades-long lifetime of the pad [27,28]. In addition, there are limitations in the amount of flux leakage that are acceptable for such applications—to limit public exposure for instance. This makes removing magnetic core materials altogether difficult [29,30,31,32].
Consequently, new cost-effective materials with suitable magnetic performance and mechanical robustness are needed [33]. Soft Magnetic Composite (SMC) [34,35] materials are a prime candidate for such applications as their magnetic and mechanical properties can easily be optimised by controlling the composition and loading of the filler and matrix [36,37]. Recent approaches have investigated the use of various particle sizes of ferrites and other magnetic fillers in various matrices from polymers to cement (including but not limited to [28,38,39,40]). The use of SMCs in an IPT pad has been successfully demonstrated, yet showing higher losses than with the incumbent ferrite [41]. This suggests the need for different pad designs or different magnetic materials. Many alternative soft magnetic composite materials are being produced that could find useful application in such an in-road IPT system. For instance, high-permeability nanocrystalline flakes and powders in a polymer matrix combine the high permeability properties with low conductivity thanks to the insulating matrix [42,43]. Such Polymer-Bonded Magnets (PBMs) have been investigated for use in mobile applications [26,44], and some commercial products are available [45]. Recently, new commercial products have been proposed for use in secondary circuits [46]. To the best of our knowledge, the cost effectiveness and in-road performance of these solutions are yet to be demonstrated.
This investigation looks into the use of natural magnetic materials as an interesting alternative. Demonstrating the usability of such an inexpensive and abundant resource in this IPT application could drastically reduce the cost of materials for large-scale deployment. As titanohematite’s and titanomagnetite’s magnetic properties vary significantly with their stoichiometry [47], ironsand’s magnetic properties vary widely with their provenance [48], which could limit their application.
This article first provides the reader with a basic understanding of the relationship between the chemistry and magnetic properties of ironsand. This should provide useful information to select the right material composition and guide the postprocessing to further improve the magnetic properties (reduction processes for instance). It then goes on to demonstrate the applicability of using such materials in power transfer applications or as a filler in an SMC material. The best-performing ironsands were selected from various geographical locations based on their direct current and alternative current (DC and AC) magnetic properties [48]. Their magnetic properties were analysed to identify the possible optimum cost-effective concentration. By including an explanation of the ironsand chemistry, we show how different ironsand compositions might affect other properties. Toroidal cores were then produced by mixing ironsand within a resin matrix and further characterised for AC magnetic permeability. Different mixes were produced using various concentrations of ironsand and MnZn -Ferrite particles.

2. Materials and Methods

2.1. Materials

A subset of samples was selected from a series of ironsand samples collected from various New Zealand locations presented previously [48]. This subset represents the samples with the lowest and highest transition metal compositions available. The ironsand samples studied here were the magnetically separated fraction from natural sands with no further processing. The samples’ compositions are provided in Table 1. Prices and costs are indicated in New Zealand dollars. For the chemical characterisation, a magnetite nanopowder was used as a reference (20–30 nm Fe 3 O 4 with >98% purity from SkySpring Nanomaterials, Inc., Houston, TX, USA).

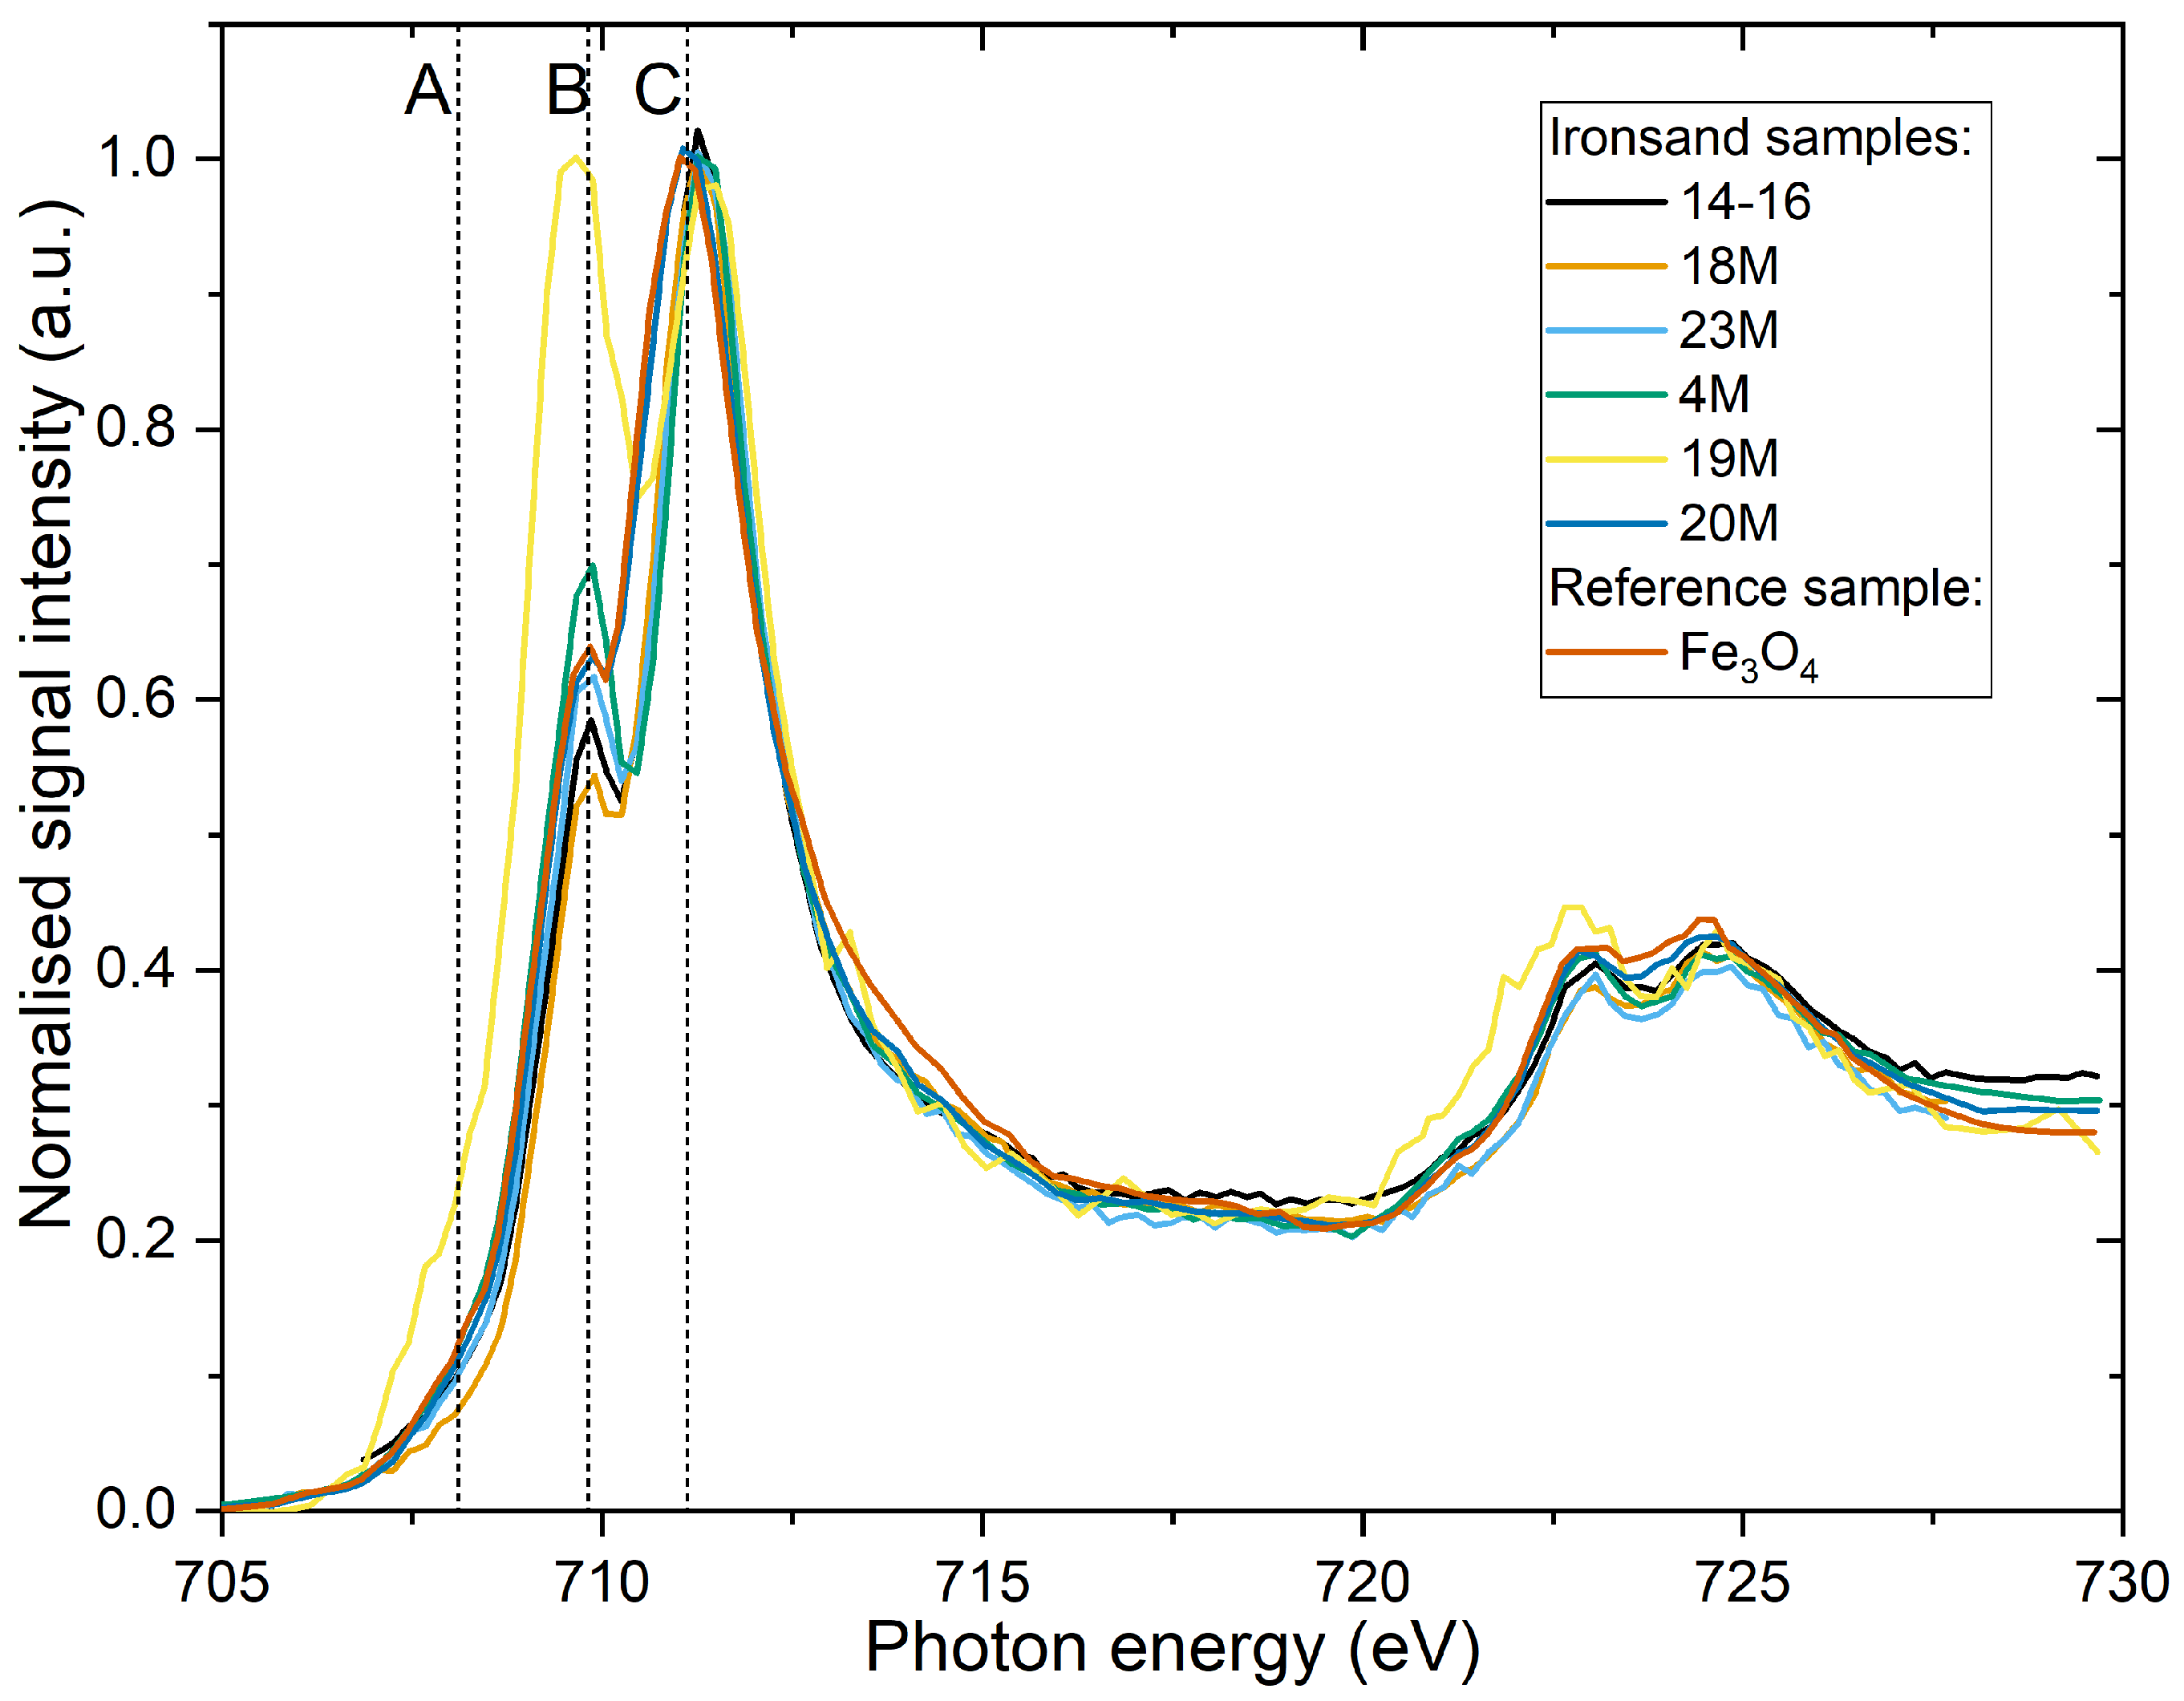
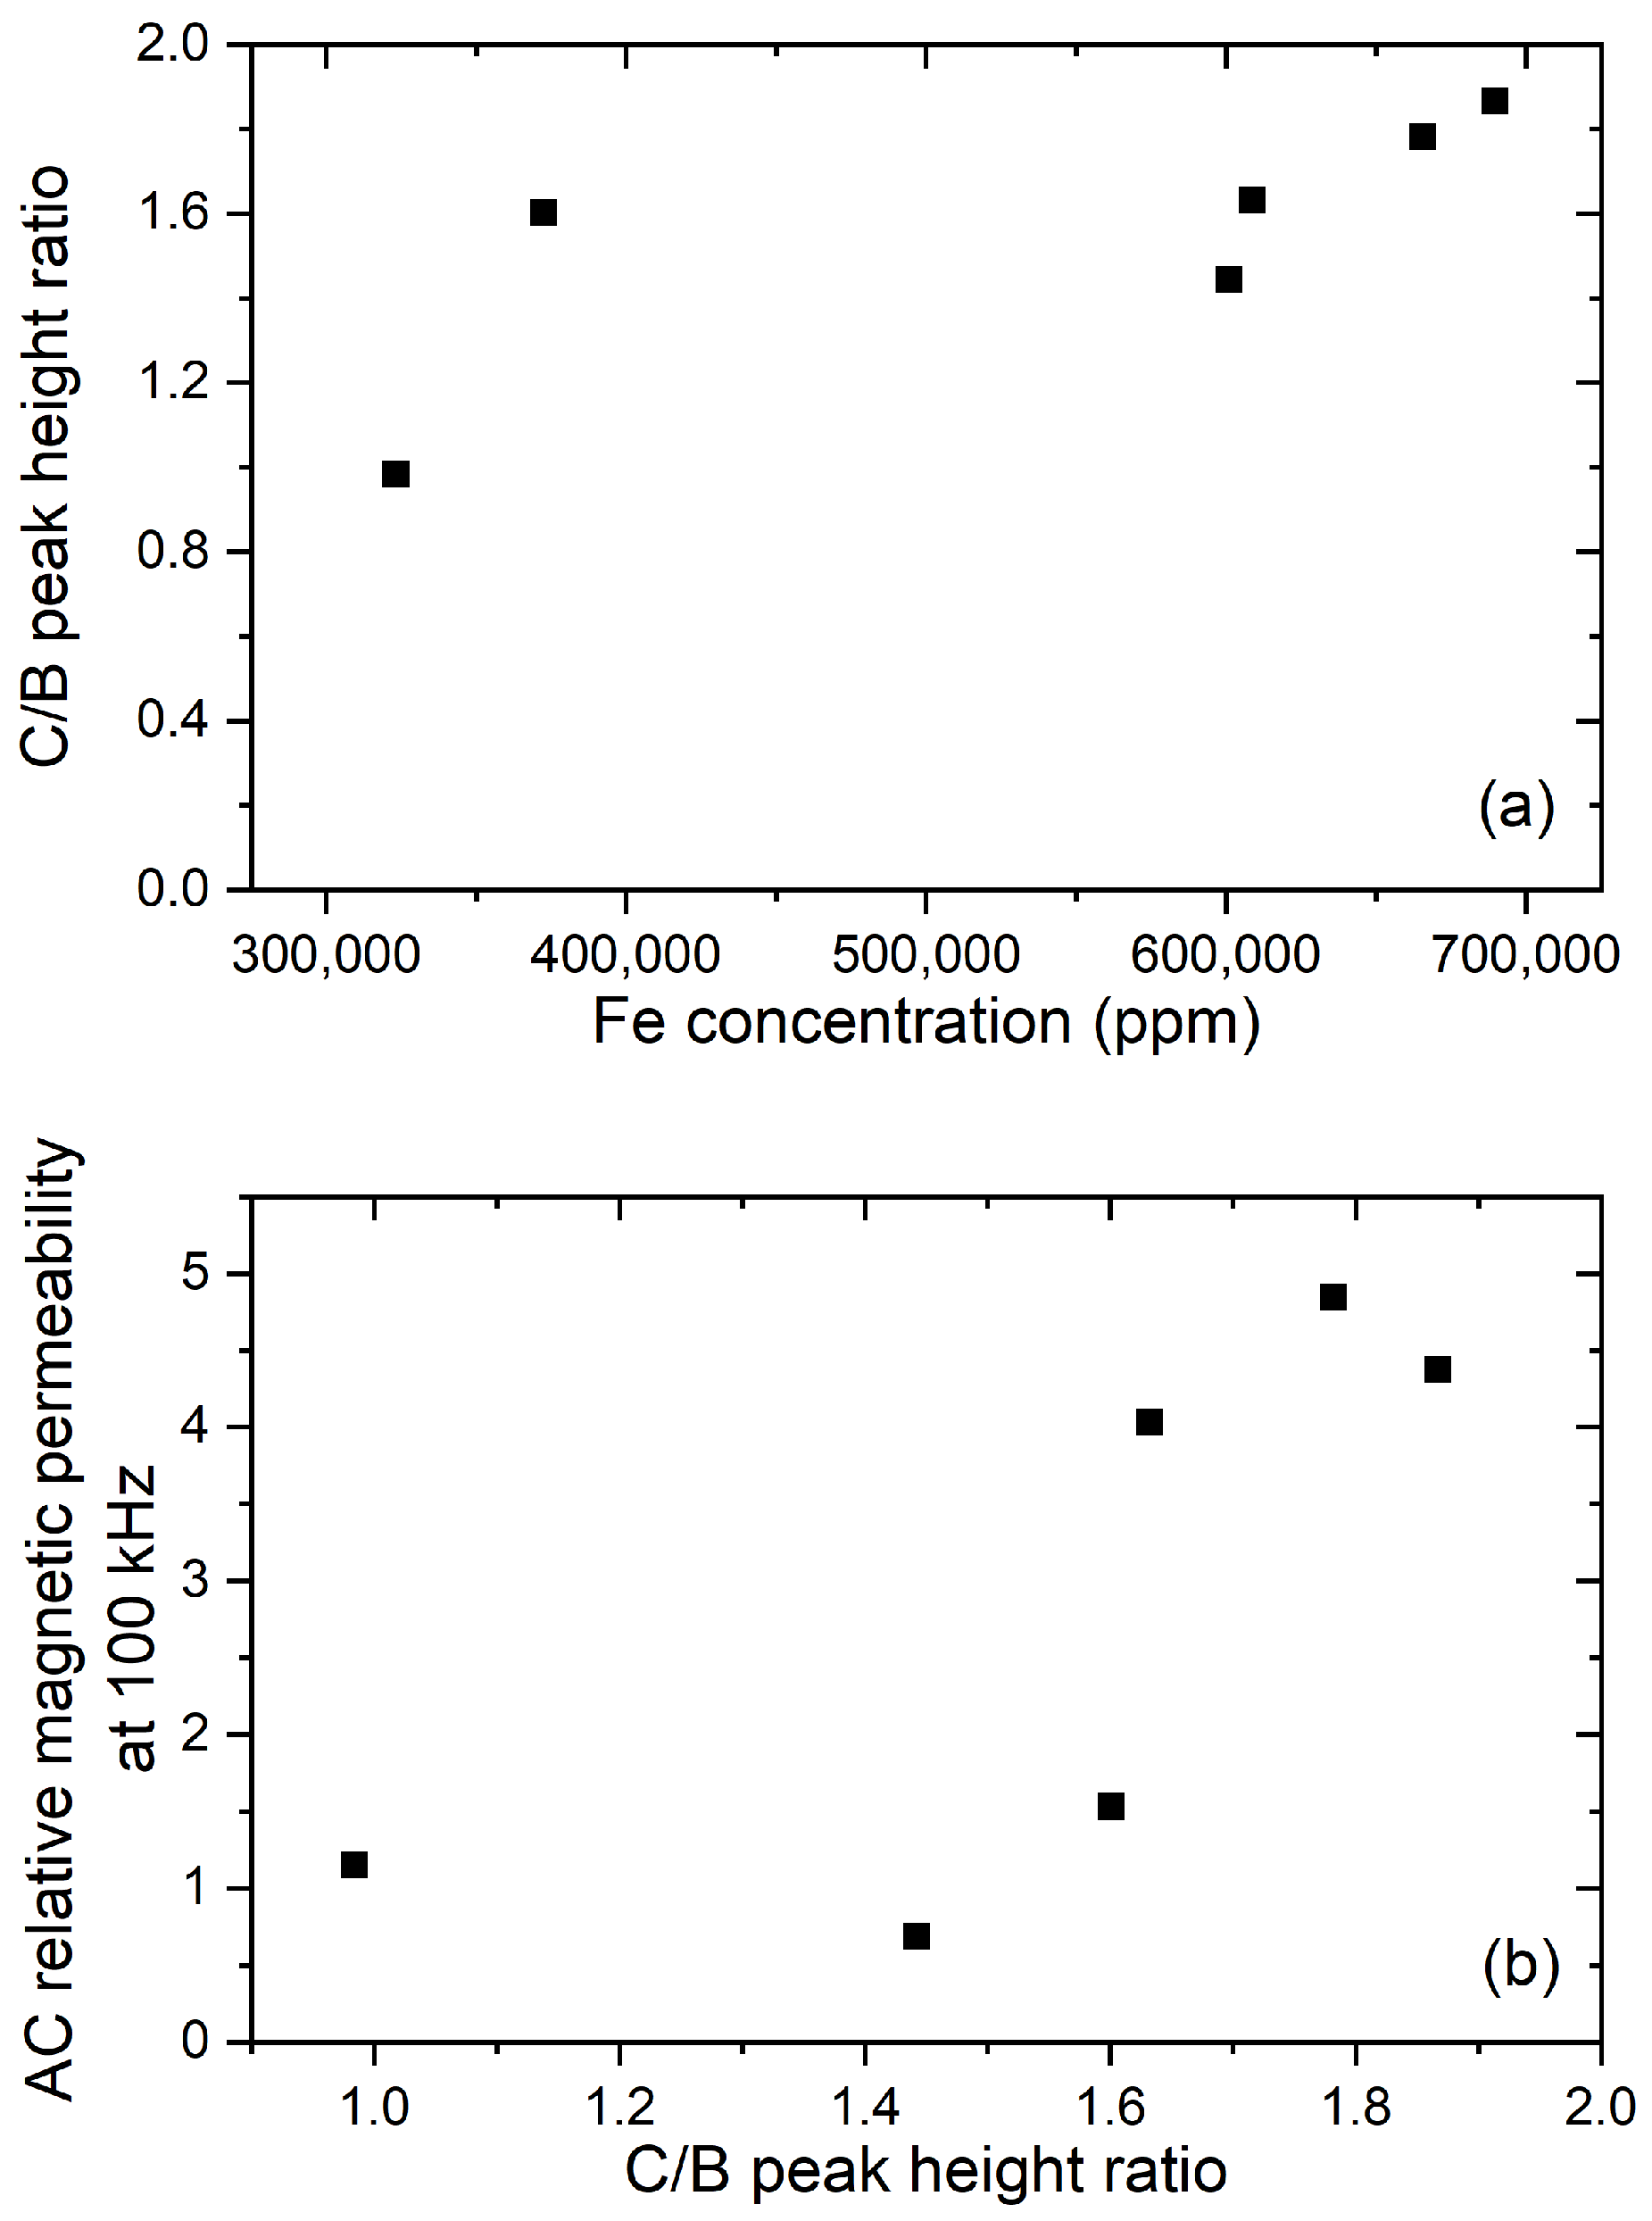
2.2. Chemical Characterisation

A previous investigation using ion beam analysis provided the elemental distribution of these samples [48]. The chemical state of the transition metals was investigated for these samples using soft X-ray Absorption Spectroscopy (XAS), and the data were collected at Beamline 8.0.1 of the Advanced Light Source (ALS) synchrotron at the Lawrence Berkeley National Laboratory (LBNL), Berkeley, CA, USA. XAS data were collected in surface-sensitive (∼10 nm depth) total electron yield (TEY) mode by measuring the sample drain current and in the bulk-sensitive (∼100 nm depth) using Total Fluorescence Yield (TFY) mode. The energy scales of the XAS spectra were calibrated with reference to the Ti L-edge and O K-edge spectra of rutile TiO2. Spectral resolution was ∼200 meV at Full-Width at Half-Maximum (FWHM). Agreement between TEY and TFY spectra indicated that the samples did not charge during the measurements. The incident X-rays were at 45 relative to the surface normal of the sample. The analysis chamber pressure was below 7 × 10   9 mbar during the measurements. The photon energy was calibrated against the values of the O K-edge of anatase TiO 2 at 531.3 eV (T 2 g ) and 633.9 eV (e g ) [49]. The TEY spectra were normalised against the beam intensity and then normalised again so that the flat pre-edge segment of the spectra was at 0 and the maximum peak intensity was set at 1. A linear background was further subtracted from the Fe L-edge spectra. This signal processing was chosen to easily compare the near-edge features of the Fe L 3 -edge.

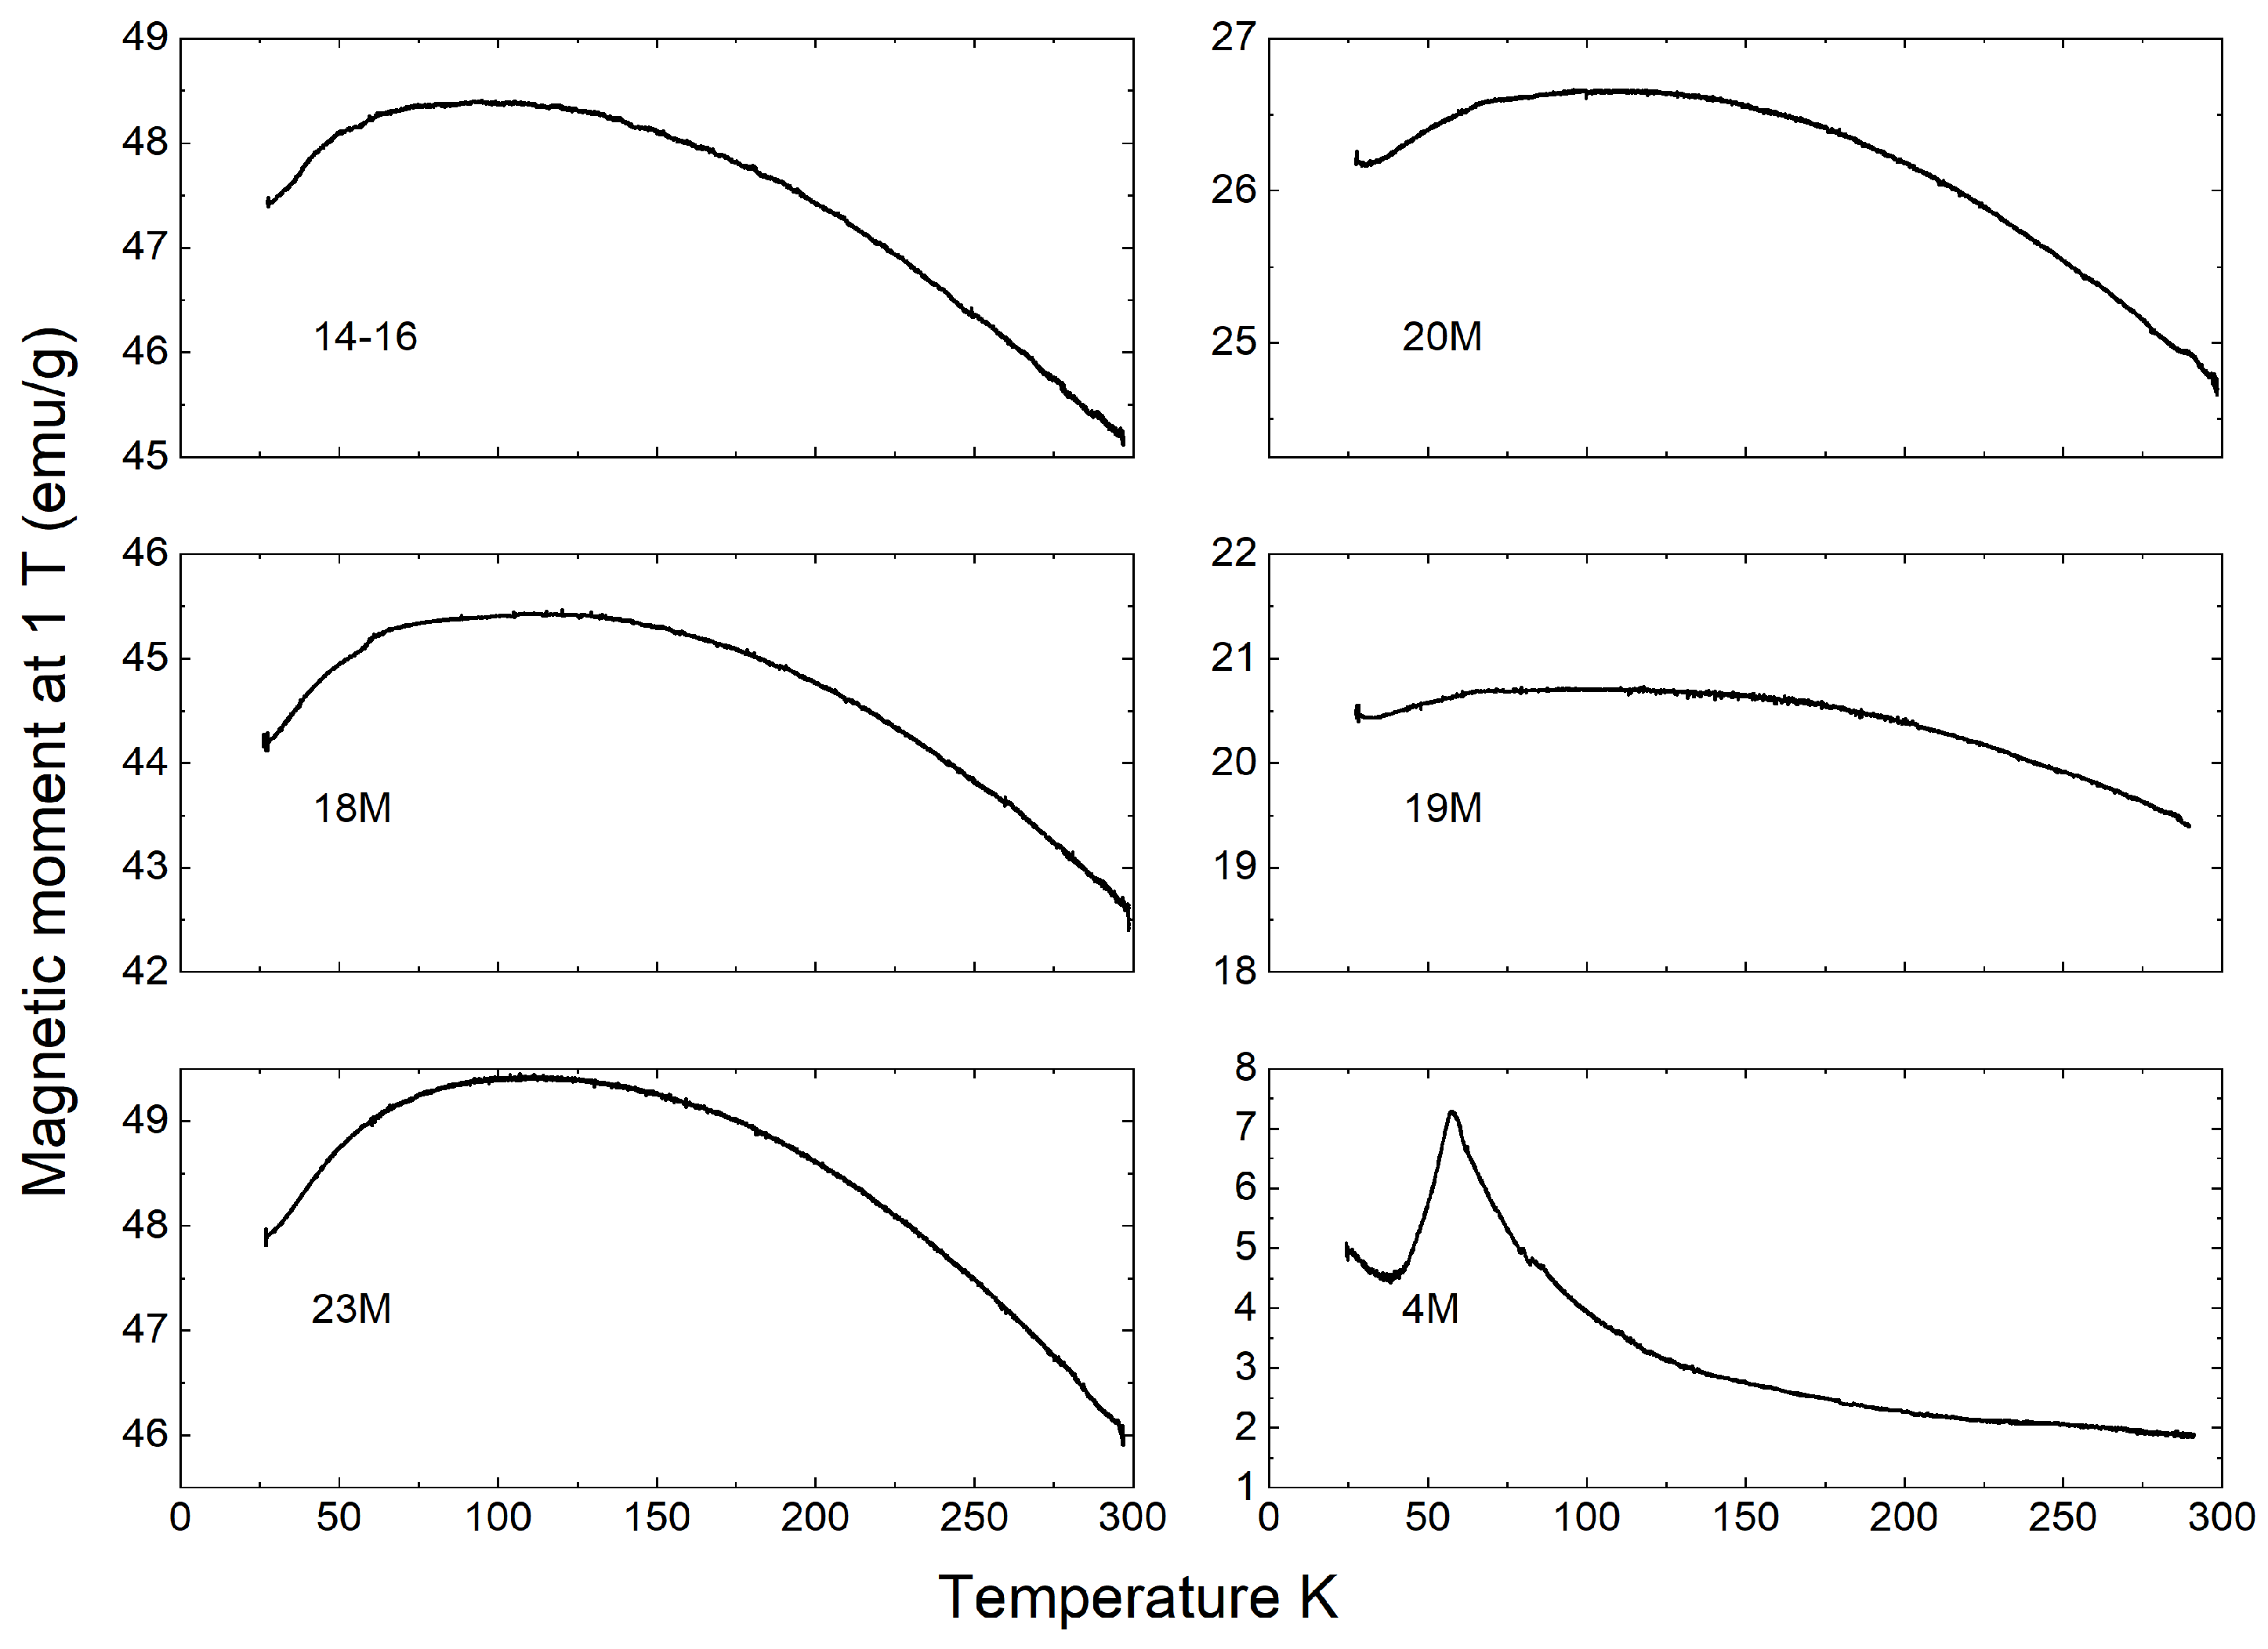
2.3. Magnetic Characterisation

The temperature dependence of the magnetisation was also measured between 25 K and 300 K at 1 T using Vibrating Sample Magnetometry (VSM) on a Lake Shore VSM 735 (Lake Shore Cryogenics Inc., Westerville, OH, USA). After a demagnetising sequence, the samples were cooled to the lowest temperature in a 1 T magnetic field, and the magnetisation was measured as the samples were brought back to 300 K. The samples were weighed prior to the measurements to calculate the magnetic moment per mass and the magnetic moment per mass at saturation M s . The magnetic moment is reported here in emu·g 1 , which is a convenient unit for comparison with the existing literature ( [ emu · g 1 ] [ A · m 2 · kg 1 ] , and the Bohr magneton is μ B = 9.27400994 ( 57 ) × 10 21 emu ) [50]. M s was also normalised against the measured concentration of Fe ( [ ] in wt.%) in the samples following:
M s , norm . = M s [ Fe ]

2.4. Toroid Fabrication

The powder samples were initially packed into 3D-printed moulds. The dimensions of the toroid containers were of height h = 9.0 mm, inner radius a = 4.5 mm and outer radius b = 8.0 mm. The packing density was calculated from the volume of the mould and density of titanomagnetite (5.1 g·cm−3) and found at ∼50 vol.%. To investigate the effect of adding magnetic loading on the magnetic properties of the toroid, the EPO-TEK 301 resin (Epoxy Technology, Billerica, MA, USA was used as the binding matrix. EPO-TEK 301 is a two-component (4:1) room-temperature-curing epoxy featuring very low viscosity. Empty toroid moulds were also wound as toroids and used as a reference “air core” toroid.

2.5. Complex Permeability Characterisation

The AC magnetic properties were measured by measuring the inductance of an inductor built by winding a 10-turn coil around these toroids. The series inductance values were measured using a handheld LCR measurement unit at 100 kHz. The effective complex permeability was determined using [34]:
μ = μ j μ
where the real and imaginary parts of the permeability can be calculated from the measured effective complex impedance of the toroid Z meas and the theoretical or calculated value of the complex impedance of the toroid Z 0 without a magnetic core (the meas. and 0 subscripts are used hereafter to refer to the values for the measured coil with a core and the “air core”, respectively):
μ = 1 + [ ( Z meas . Z 0 ) 2 π ω μ 0 h × l n b a ]
with a the outer radius, b the inner radius, h the height of the toroid and μ 0 the vacuum permeability. Consequently, as we can easily measure the series resistance R and inductance L of the toroid with the magnetic materials and the “air core”:
μ = 1 + [ ( L meas . L 0 ) 2 π ω μ 0 h × l n b a ]
μ = [ ( R meas . R 0 ) 2 π ω μ 0 h × l n b a ]
The loss tangent tan δ = μ μ was used as a proxy for comparing core losses.

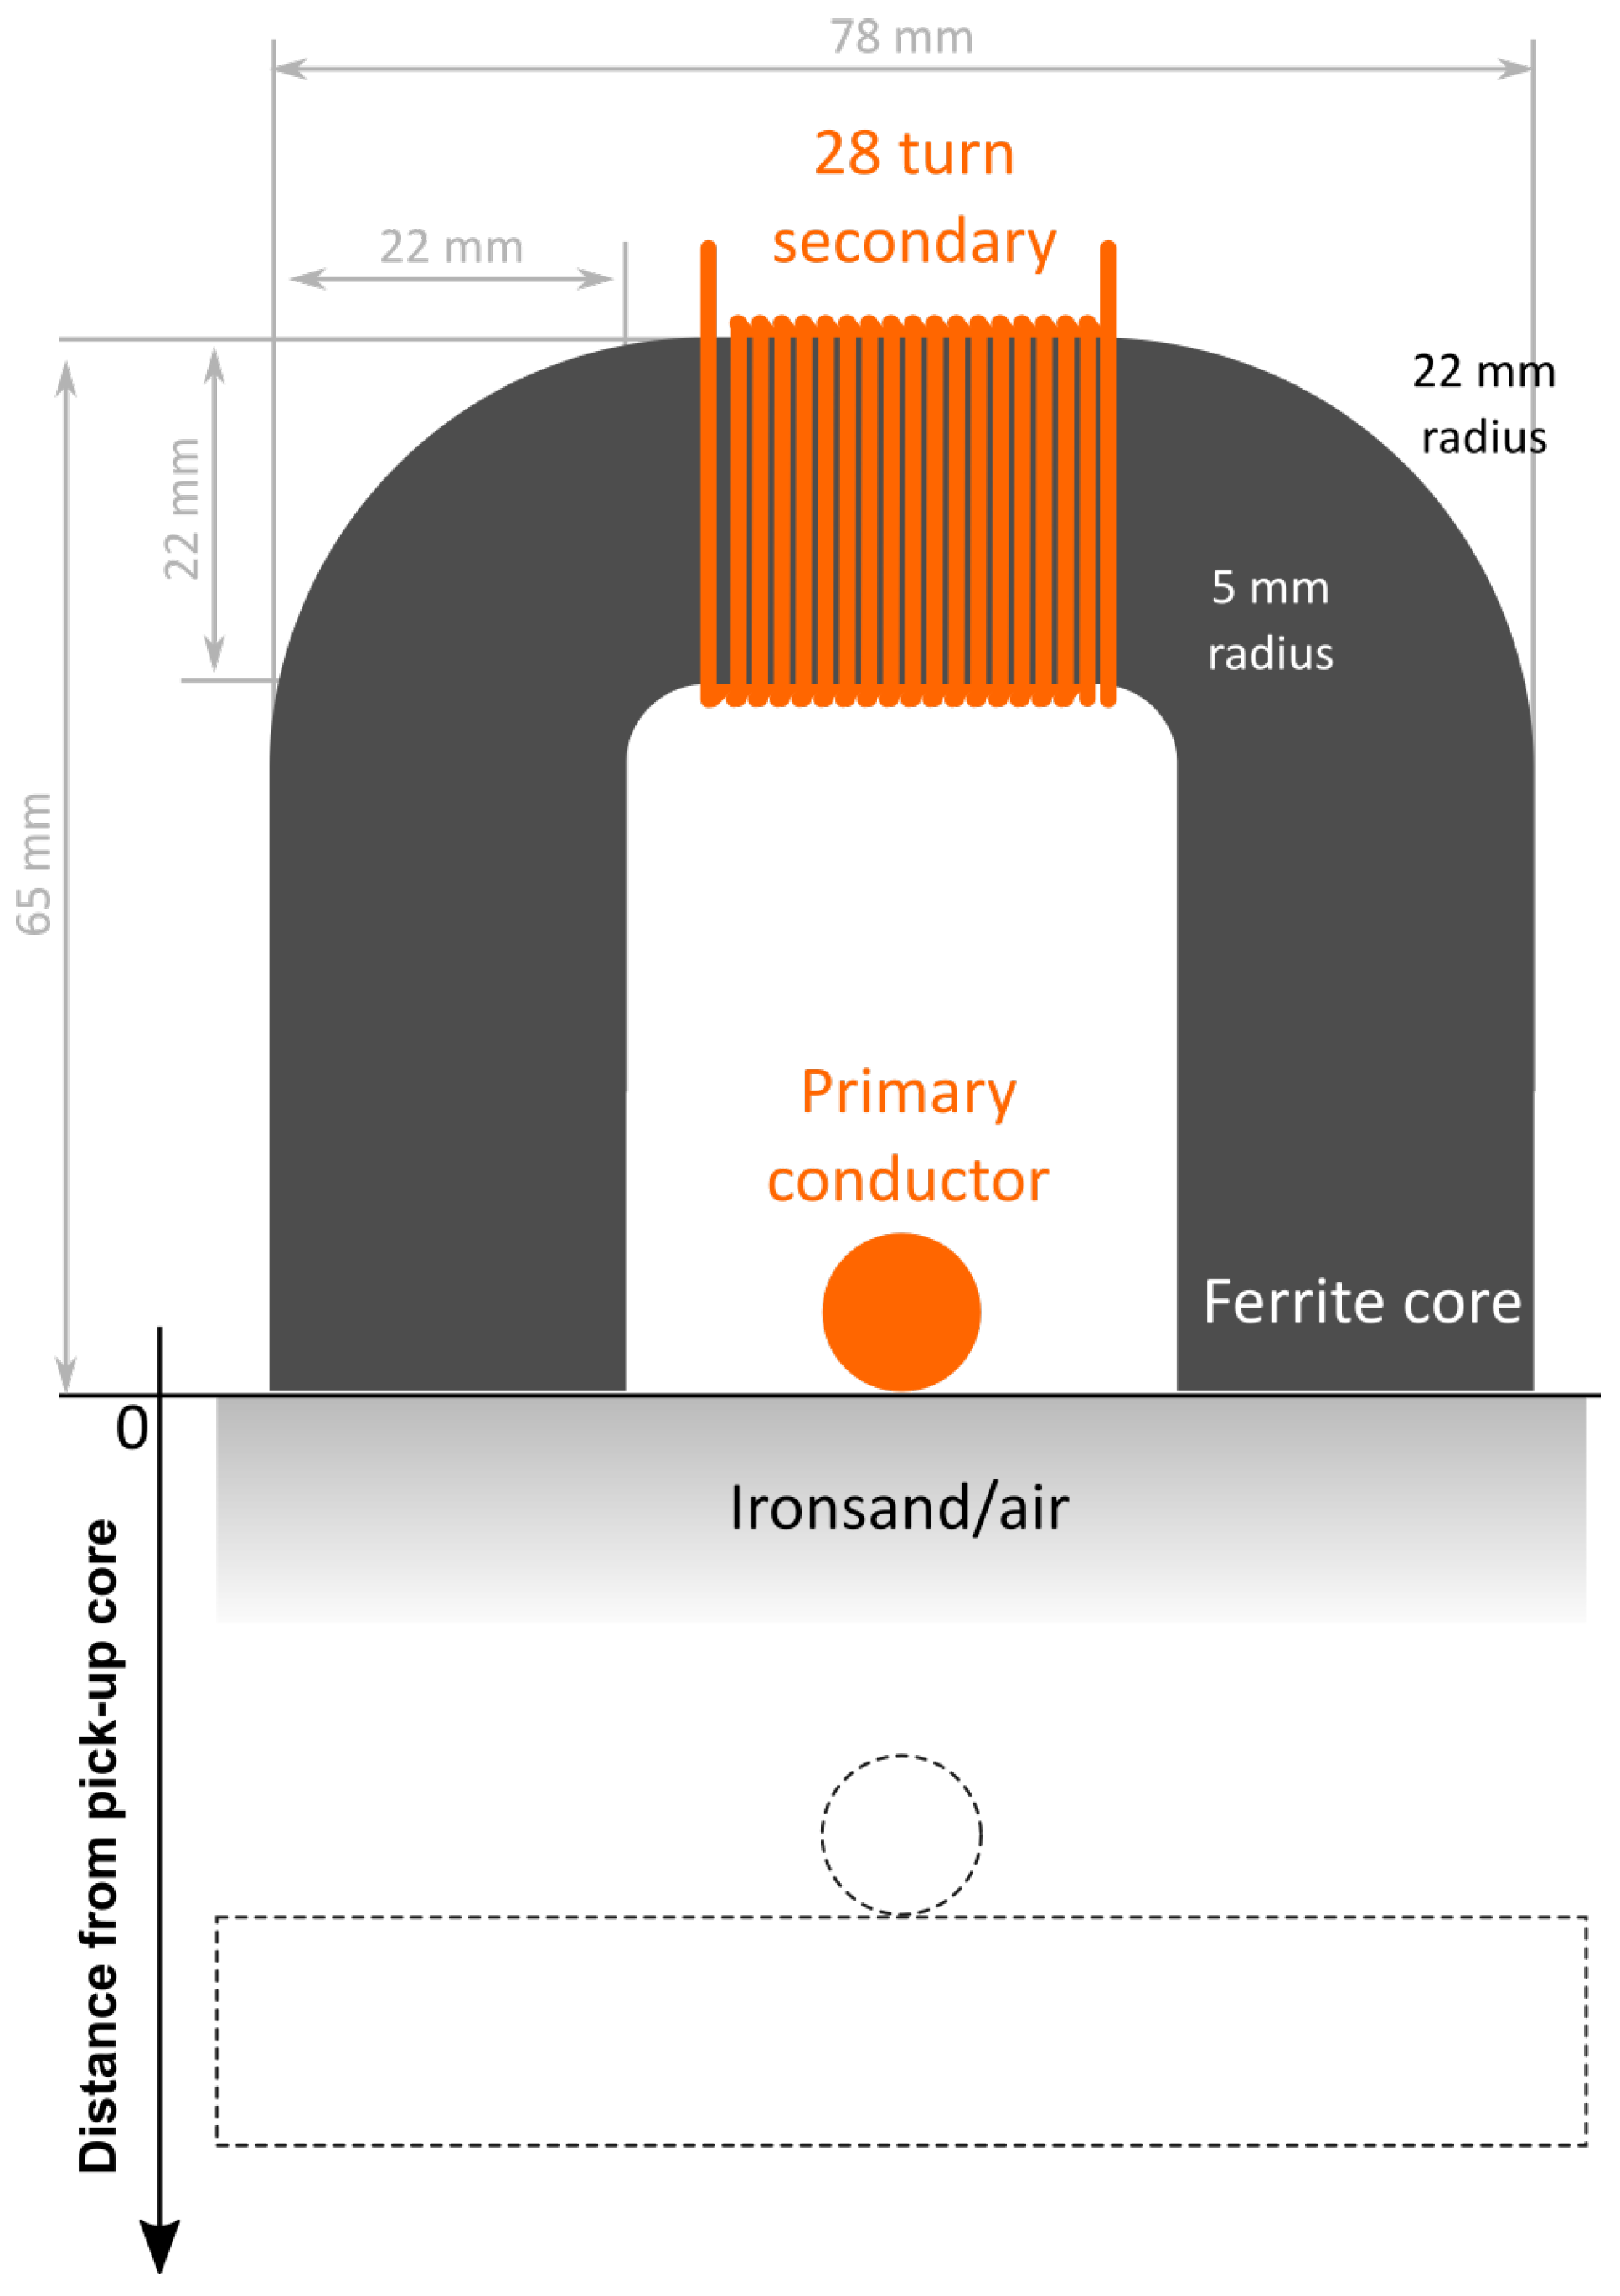
2.6. Power Transfer Setup

A simple wireless power transfer setup, initially developed to investigate noncontact power transfer for a people mover system [51], monorail systems [52] and Automated Guided Vehicles (AGVs) [20], was used to illustrate the possible usages of ironsand to increase power transfer performance. The primary circuit consisted of a pair of parallel wires, or “tracks”, energised by a low-distortion sinusoidal current. In this investigation, the track current was set at 80 A with a 10 kHz frequency. The primary circuit was maintained constant during all testing. Double-coil designs were investigated for the secondary circuit, called “pick-ups”, making use of a U-shaped soft magnetic ceramic core (Cosmo Ferrite’s CF295) to retrieve power from one or both sides of the primary track. The cores were wound with 28 turns of 1 mm-diameter copper wire around their short side (Figure 1). The open-circuit voltage across the secondary coil and the short-circuit current were measured at successive intervals to determine the untuned transferred volt-amps. This setup allowed varying the distance from the track to the coupled pick-up. Measurements were taken with and without ironsand filling the cores.
A 2D simulation of the system was performed using the Finite Element Modeling Method (FEMM, version 4.2, 2020, MA, USA) software using the physical system’s geometry. The magnetic permeability of the ironsand was approximated as a linear permeability of 1.53 to 4.04 corresponding to the range of ironsand used in the study. A 7-layer Dirichlet boundary condition was applied to the system. The B(H) curve of the ferrite from the specifications was used in the model. The magnetic field energy W was calculated from the simulated B and H fields within the block representing the U-shaped core used as the pick-up. This was done using the built-in “Magnetic field energy” block integral function that computes the element-by-element block integral of the product of B and H over the volume V occupied by the core and using the nonlinear B(H) curve of the input material, with dV a finite volume element [53,54]:
W = 0 B H ( B ) d B d V

3. Results and Discussion

3.1. Origin of Magnetic Properties

Table 1 summarises the basic properties of the samples selected for this investigation. As reported previously, the saturation moment of ironsand varies greatly with its provenance and correlates well with the Fe content [48,52,55]. It is also anticorrelated with the content of other elements (denoted as “Crustal” elements in Table 1). Even accounting for the variations in the Fe content, the variations in the magnetic moment remained significant—with a 60% standard deviation of the normalised magnetic moments compared to the initial 48% standard deviation. It is noted that the sample of 4M had a significantly lower magnetic moment per mass of Fe compared to the average of the other samples even though it had a similar Fe content to the most magnetic samples. Samples of 19M and 20M, on the other hand, displayed a magnetic moment per mass of Fe within 10% of the highest values, even though they had almost half as much Fe. Such different magnetic responses suggest differences in the chemical make-up of the samples.
The complex permeability and associated loss coefficient also reflected the changes in magnetic permeability. It was expected that the losses from the wound copper dominate and small variations in winding length and density would affect the measurements more significantly as the magnetic permeability approaches one, also because the measurements were taken relative to the impedance of the “air core” toroid. This explains the nonsensical negative values for the loss tangent and μ . The losses were indeed lower than with the “air core”, but likely not due to the properties of the various ironsand samples.
The temperature dependence of the magnetic moments shed further light on the potential origins for this variation (Figure 2). Indeed, as the magnetic moment became lower, the magnetic state transition became more noticeable around 58 K. This transition was particularly pronounced for the sample of 4M, which had one of the lowest magnetic permeability values. This was consistent with previous observations of magnetic state transitions in the Fe-O-Ti system with high-Ti-content titanohematite or ilmenite ( FeTiO 3 ) [56,57]. Based on other studies of ironsand, it is more likely that this transition originated from titanohematite [3,4].
Understanding the underlying cause for the differences in the magnetic properties presented above can guide the choice of materials and provenance. It can also provide a basis to develop methods to further improve the materials’ performance for a given application. In this context, the chemical structure of each sample can relate directly to its magnetic properties. XAS and X-ray Absorption Near-Edge Spectroscopy (XANES) at the Fe L-edge is a powerful method to differentiate the chemical structure of Fe atoms at the surface of materials. In the Fe-O-Ti system, stoichiometry and ordering significantly affect the energy levels [58]. Indeed, the L 3 ( 2 p 3 / 2 3 d ) and L 2 ( 2 p 1 / 2 3 d ) transitions are particularly sensitive to the oxidation state and local ordering around the absorbing Fe centre. Taking magnetite Fe3O4 as a reference, both Fe 3 + and Fe 2 + ions are present in a 1:2 ratio, with Fe 2 + sitting in tetrahedral ( T D ) sites and Fe 3 + ions sitting equally in both octahedral ( O h ) and T D sites. Variations in the peak intensity corresponding to these transitions inform about the type of oxides present, which can be related directly to the type of magnetic properties that can be expected [58,59,60]. More detailed analysis of the Fe L-edge can be found in the literature [59,61].
As seen in (Figure 3), across the samples, three main features are clearly identifiable at the Fe L3-edge around A = 708.1 eV , B = 710.1 eV and C = 711.1 eV . A can be attributed to the presence of Fe in metallic-state Fe 0 [62], but also can be attributed to multiplets from T D -coordinated Fe 2+ [59,63]. The C and B features are dominated by the response from the Fe 2+ ion and Fe 3+ ion, respectively. Hence, these absorption edges are typical of mixed iron oxide materials [62].
Significant differences in the ratio of C to B were observed (Figure 4). Higher C/B ratios were found that were also correlated with a noticeably higher magnetic permeability and magnetic moment at saturation (Figure 4 and Table 1). For comparison, Fe 3 O 4 had a C/B ratio of 1.59. These results were consistent with varying mixtures of titanohematite and titanomagnetite as expected from New Zealand ironsand resources [3,4]. XRD measurements were also consistent with a varying mixture of titanohematite and titanomagnetite (Table S1 and Figures S1–S3 in Supplementary Material). Both higher total Fe content and higher titanomagnetite or metallic Fe concentration are required to have higher magnetic permeability and saturation magnetisation. In addition, for the samples of 23M and 18M, there were two noticeable peaks corresponding to the L 2 , 3 -edge signal around 778 and 793 eV, but they were not sufficiently resolved to identify the chemistry. These samples were also measured as having some of the highest Co concentrations with XRF and, coincidentally, had some of the highest magnetic permeability. It remains unclear whether the presence of Co traces affects the properties significantly.

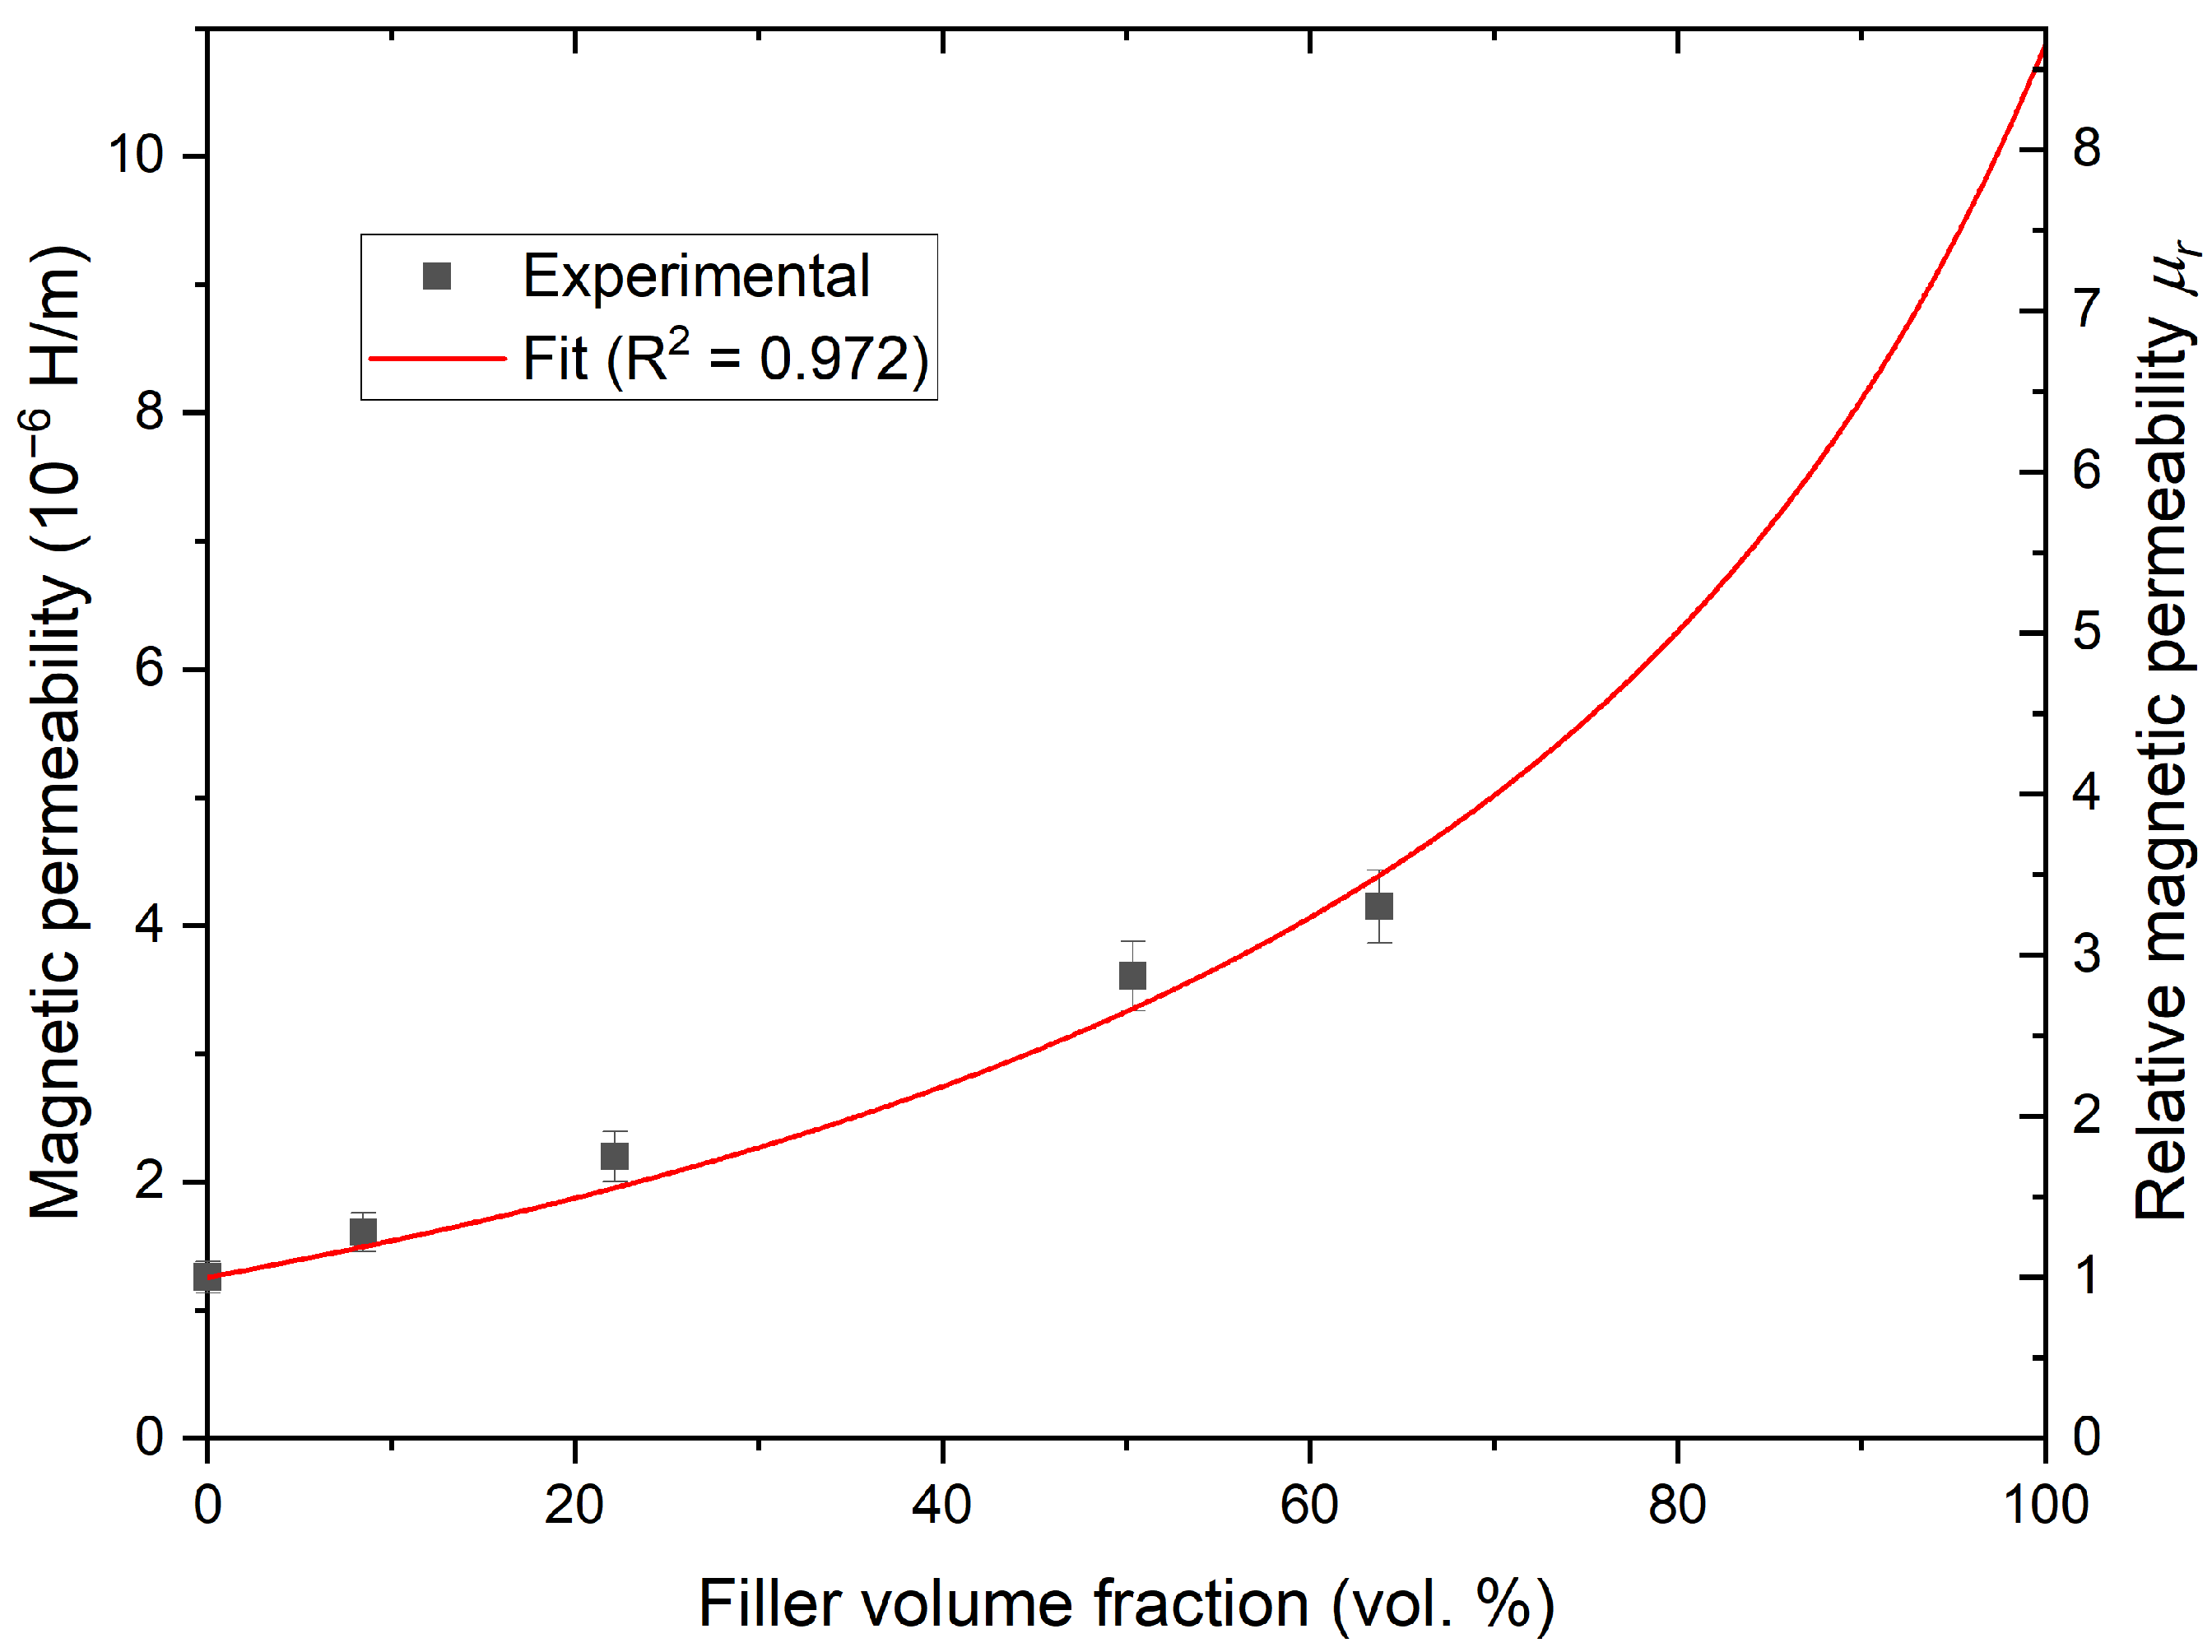
3.2. Properties of an Ironsand-Based Soft Magnetic Composite

Many practical applications may not tolerate the use of loose powders as this might increase variability or be difficult to integrate. It can be more practical to have a bulk solid material. Consequently, the use of ironsand as a base to fabricate a composite material was investigated. The 14–16 material, with the highest magnetic permeability in loose powder, was used in combination with the EPO-TEK-301 resin. The dependence of the magnetic properties of the resulting SMC with various loadings of ironsand were investigated. A higher loading increased the magnetic permeability of the resulting materials (Figure 5). With a loading of 63.8 vol.% (85 wt.%), a relative magnetic permeability of about four was obtained. This value is similar to the value of the ironsand without the matrix, suggesting a similar packing density to the uncompacted powder materials.
The observed trend was consistent with Fricke’s equation to estimate the magnetic permeability μ of a mixture of magnetic grains in a matrix with respective permeability μ 0 and μ 1 [64,65]:
μ = μ 0 [ 1 + ρ ( x + 1 ) ( μ 1 + x μ 0 ) / ( μ 1 μ 0 ) ρ ]
where ρ is the volume concentration of the magnetic filler and x is an empirical factor. The factor x is loosely related to the geometry of the particles [64,65]. This formula successfully fit the experimental values with x = 1.9 and μ r = 8.7 . These values were consistent, within the experimental uncertainty, to the values found in previous investigations of the magnetic properties of ironsands [65].

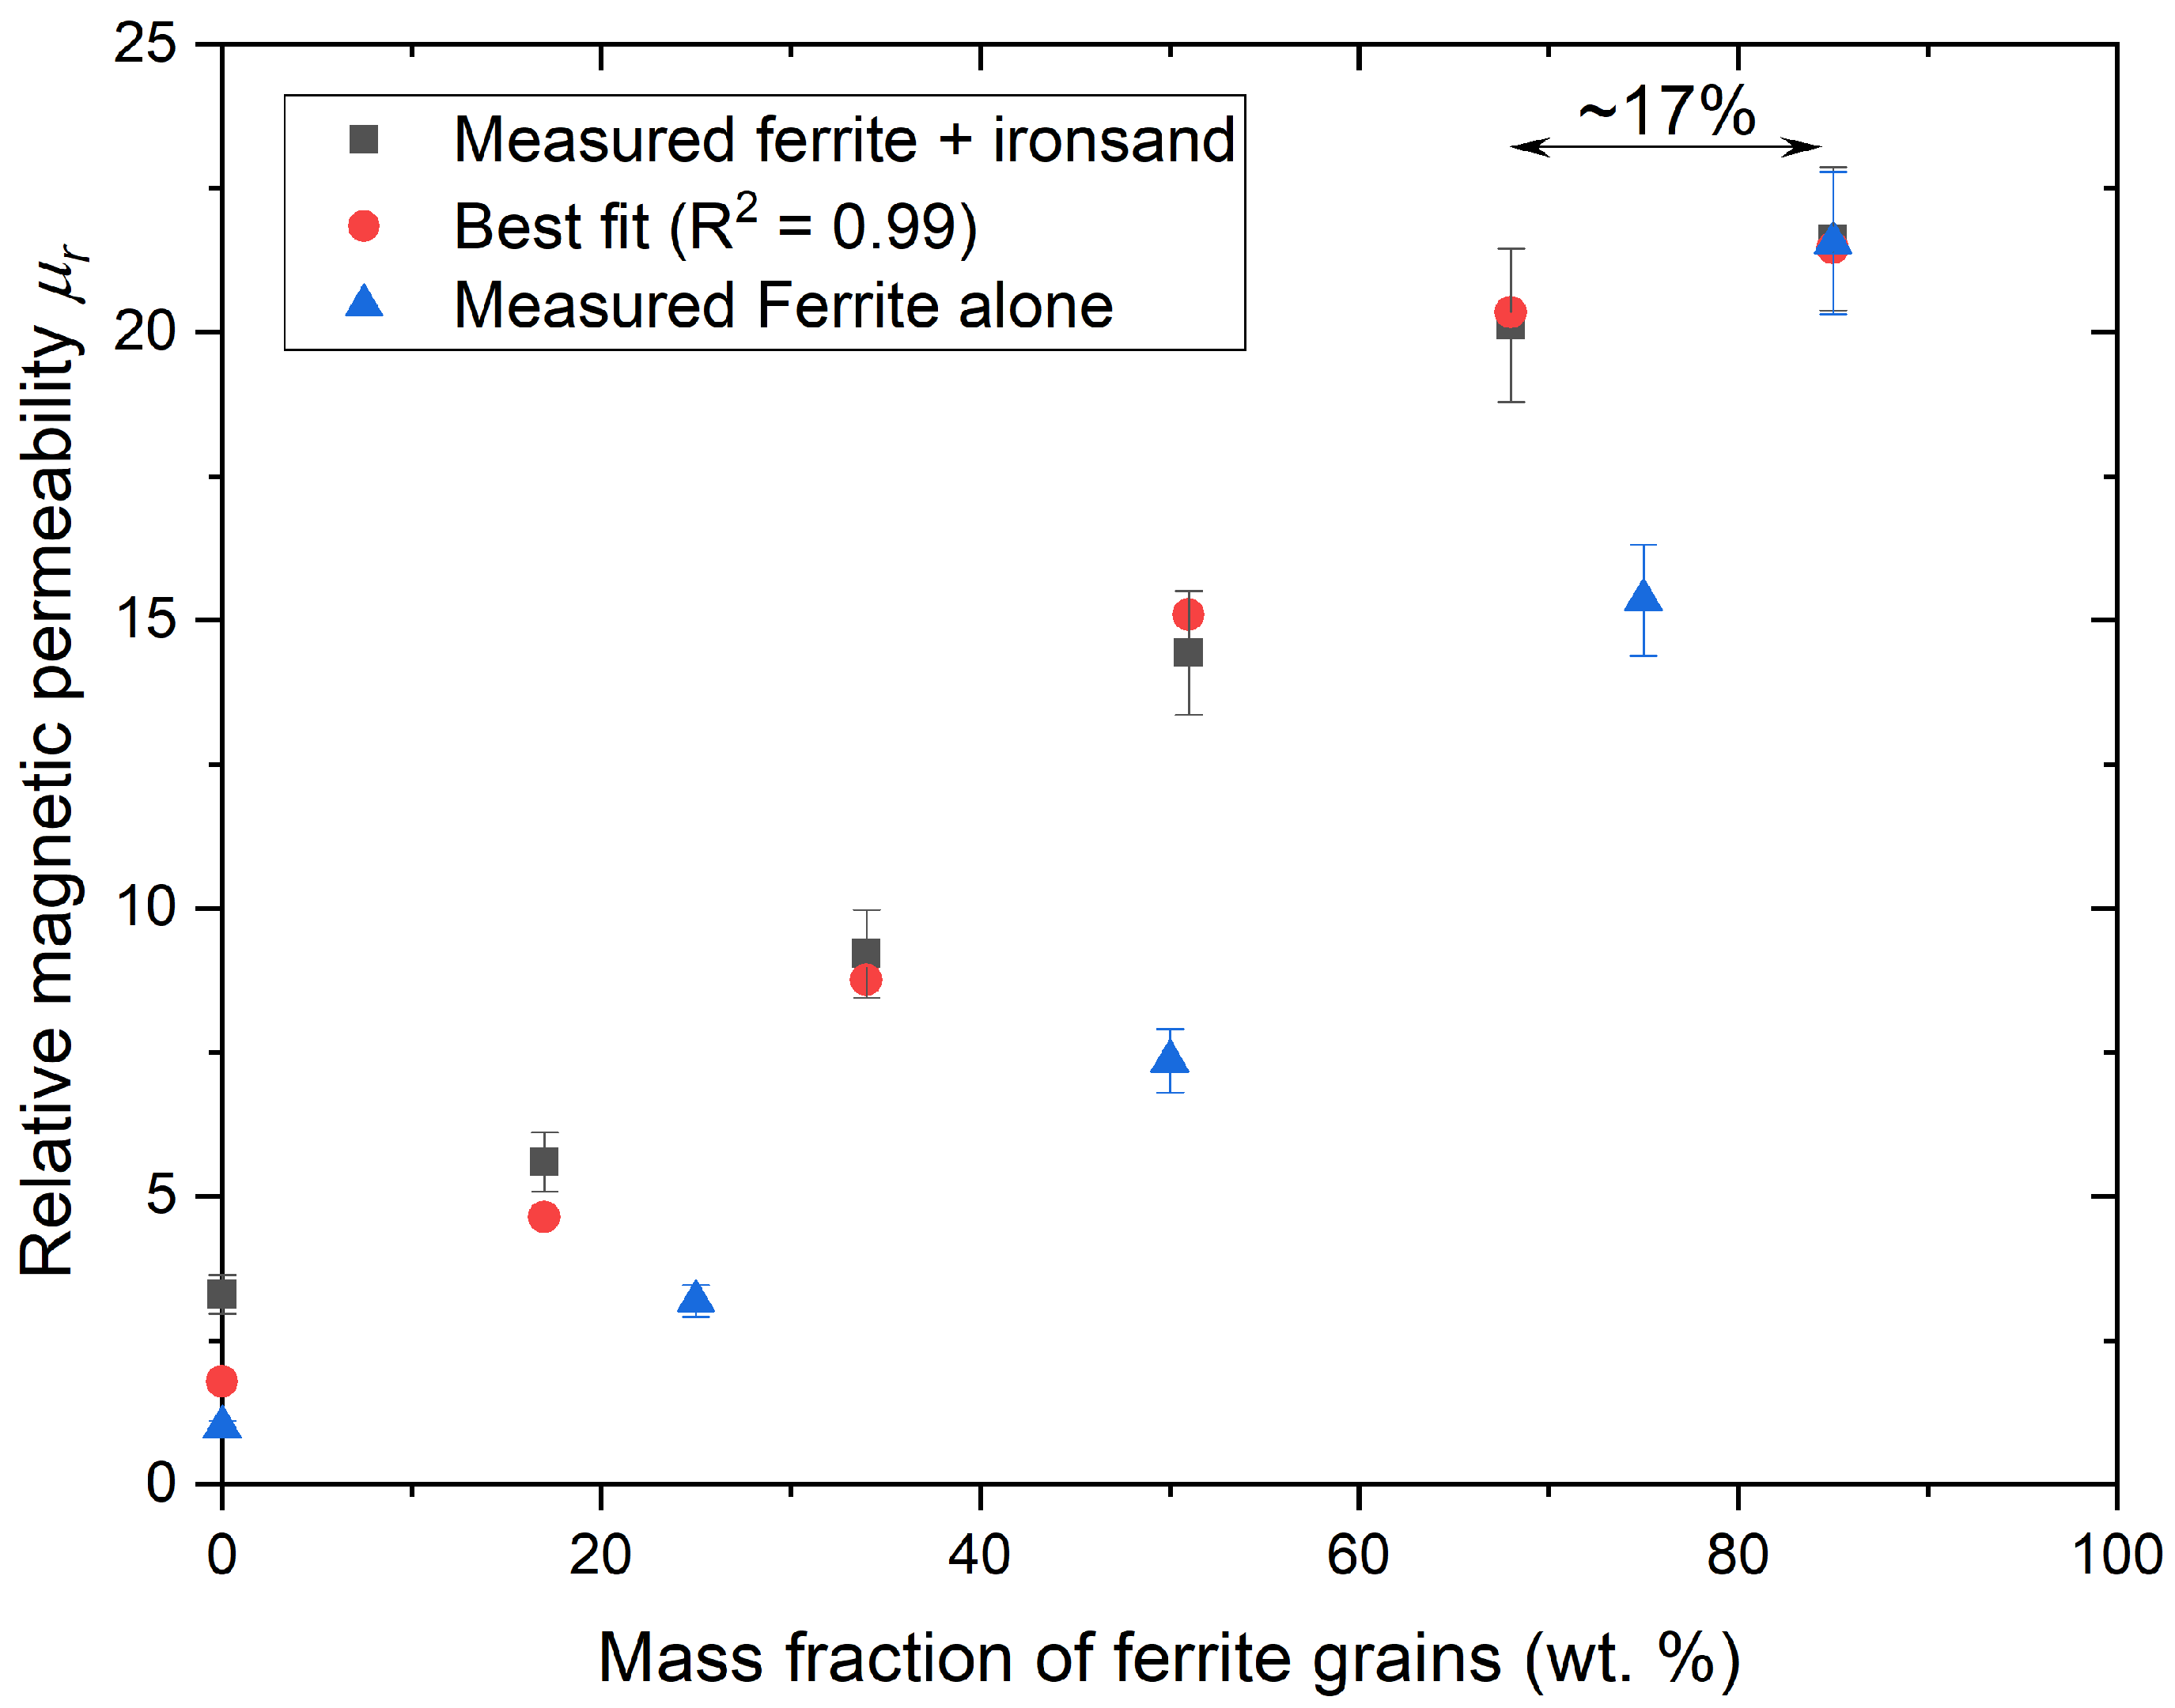
3.3. Combining Ironsand with Higher-Permeability Materials in a Soft Magnetic Composite

The properties of SMC materials with a combination of ferrite particles and ironsand were measured at different loadings in the same resin. The total mass loading of the magnetic filler was maintained at about 85 wt.% (∼70 vol.%). When comparing the relative permeability of such a composite material, there was no significant difference in the relative permeability at an equal volume fraction of the ferrite particles. However, when comparing the filler loading at an equal mass of ferrite materials, the addition of ironsand to reach an overall magnetic filler fraction of 70 vol.% significantly improved the magnetic permeability of the SMC even though the magnetic permeability of the ironsand + resin composites was significantly lower than the permeability of the ferrite + resin composites (Figure 6). Furthermore, above 40 wt.% magnetic filler, the loss factor of the ferrite + resin and ferrite + ironsand + resin were not significantly different and remained between 7.8 and 8.4 × 10 3 . At a similar loading, the loss factors of ironsand + resin mixes were found around 1.3 ± 0.1 × 10 2 .
These permeability values also fit with Fricke’s equation and assuming the value of the matrix permeability as a resin/ironsand composite. However, the best fit was obtained with different values of x and μ 1 than what was found previously for composite materials with a single filler (ferrite + resin and ironsand + resin). This suggest that this model and other related models, such as Ollendorff’s [66] or the Clausius–Mossotti formulae [67], are not suitable for the current experimental dataset.
Nevertheless, these results suggest that it is possible to reach the same magnetic permeability with an SMC material where 15 wt.% of ferrite is replaced by ironsand. The main argument in favour of such replacement is the material’s cost. The price of export-grade ironsand is approximately NZD 80 per tonne. Even with initial estimates incorporating the CAPEX and OPEX for milling sand from 400 µm to 100 µm, if needed, this gives a cost per tonne of NZD 88–225 depending on the scale. This is in comparison to the large price tag associated with ferrite particles of NZD 7500 per tonne. However, as the cost of ferrite particles is lowered, so are the cost benefits for using ironsand. Considering an acceptable minimum 10% cost reduction to justify replacing the ferrite by ironsand, the use of ironsand may remain advantageous as long as the cost of ferrite particles remains above NZD 240 per tonne.

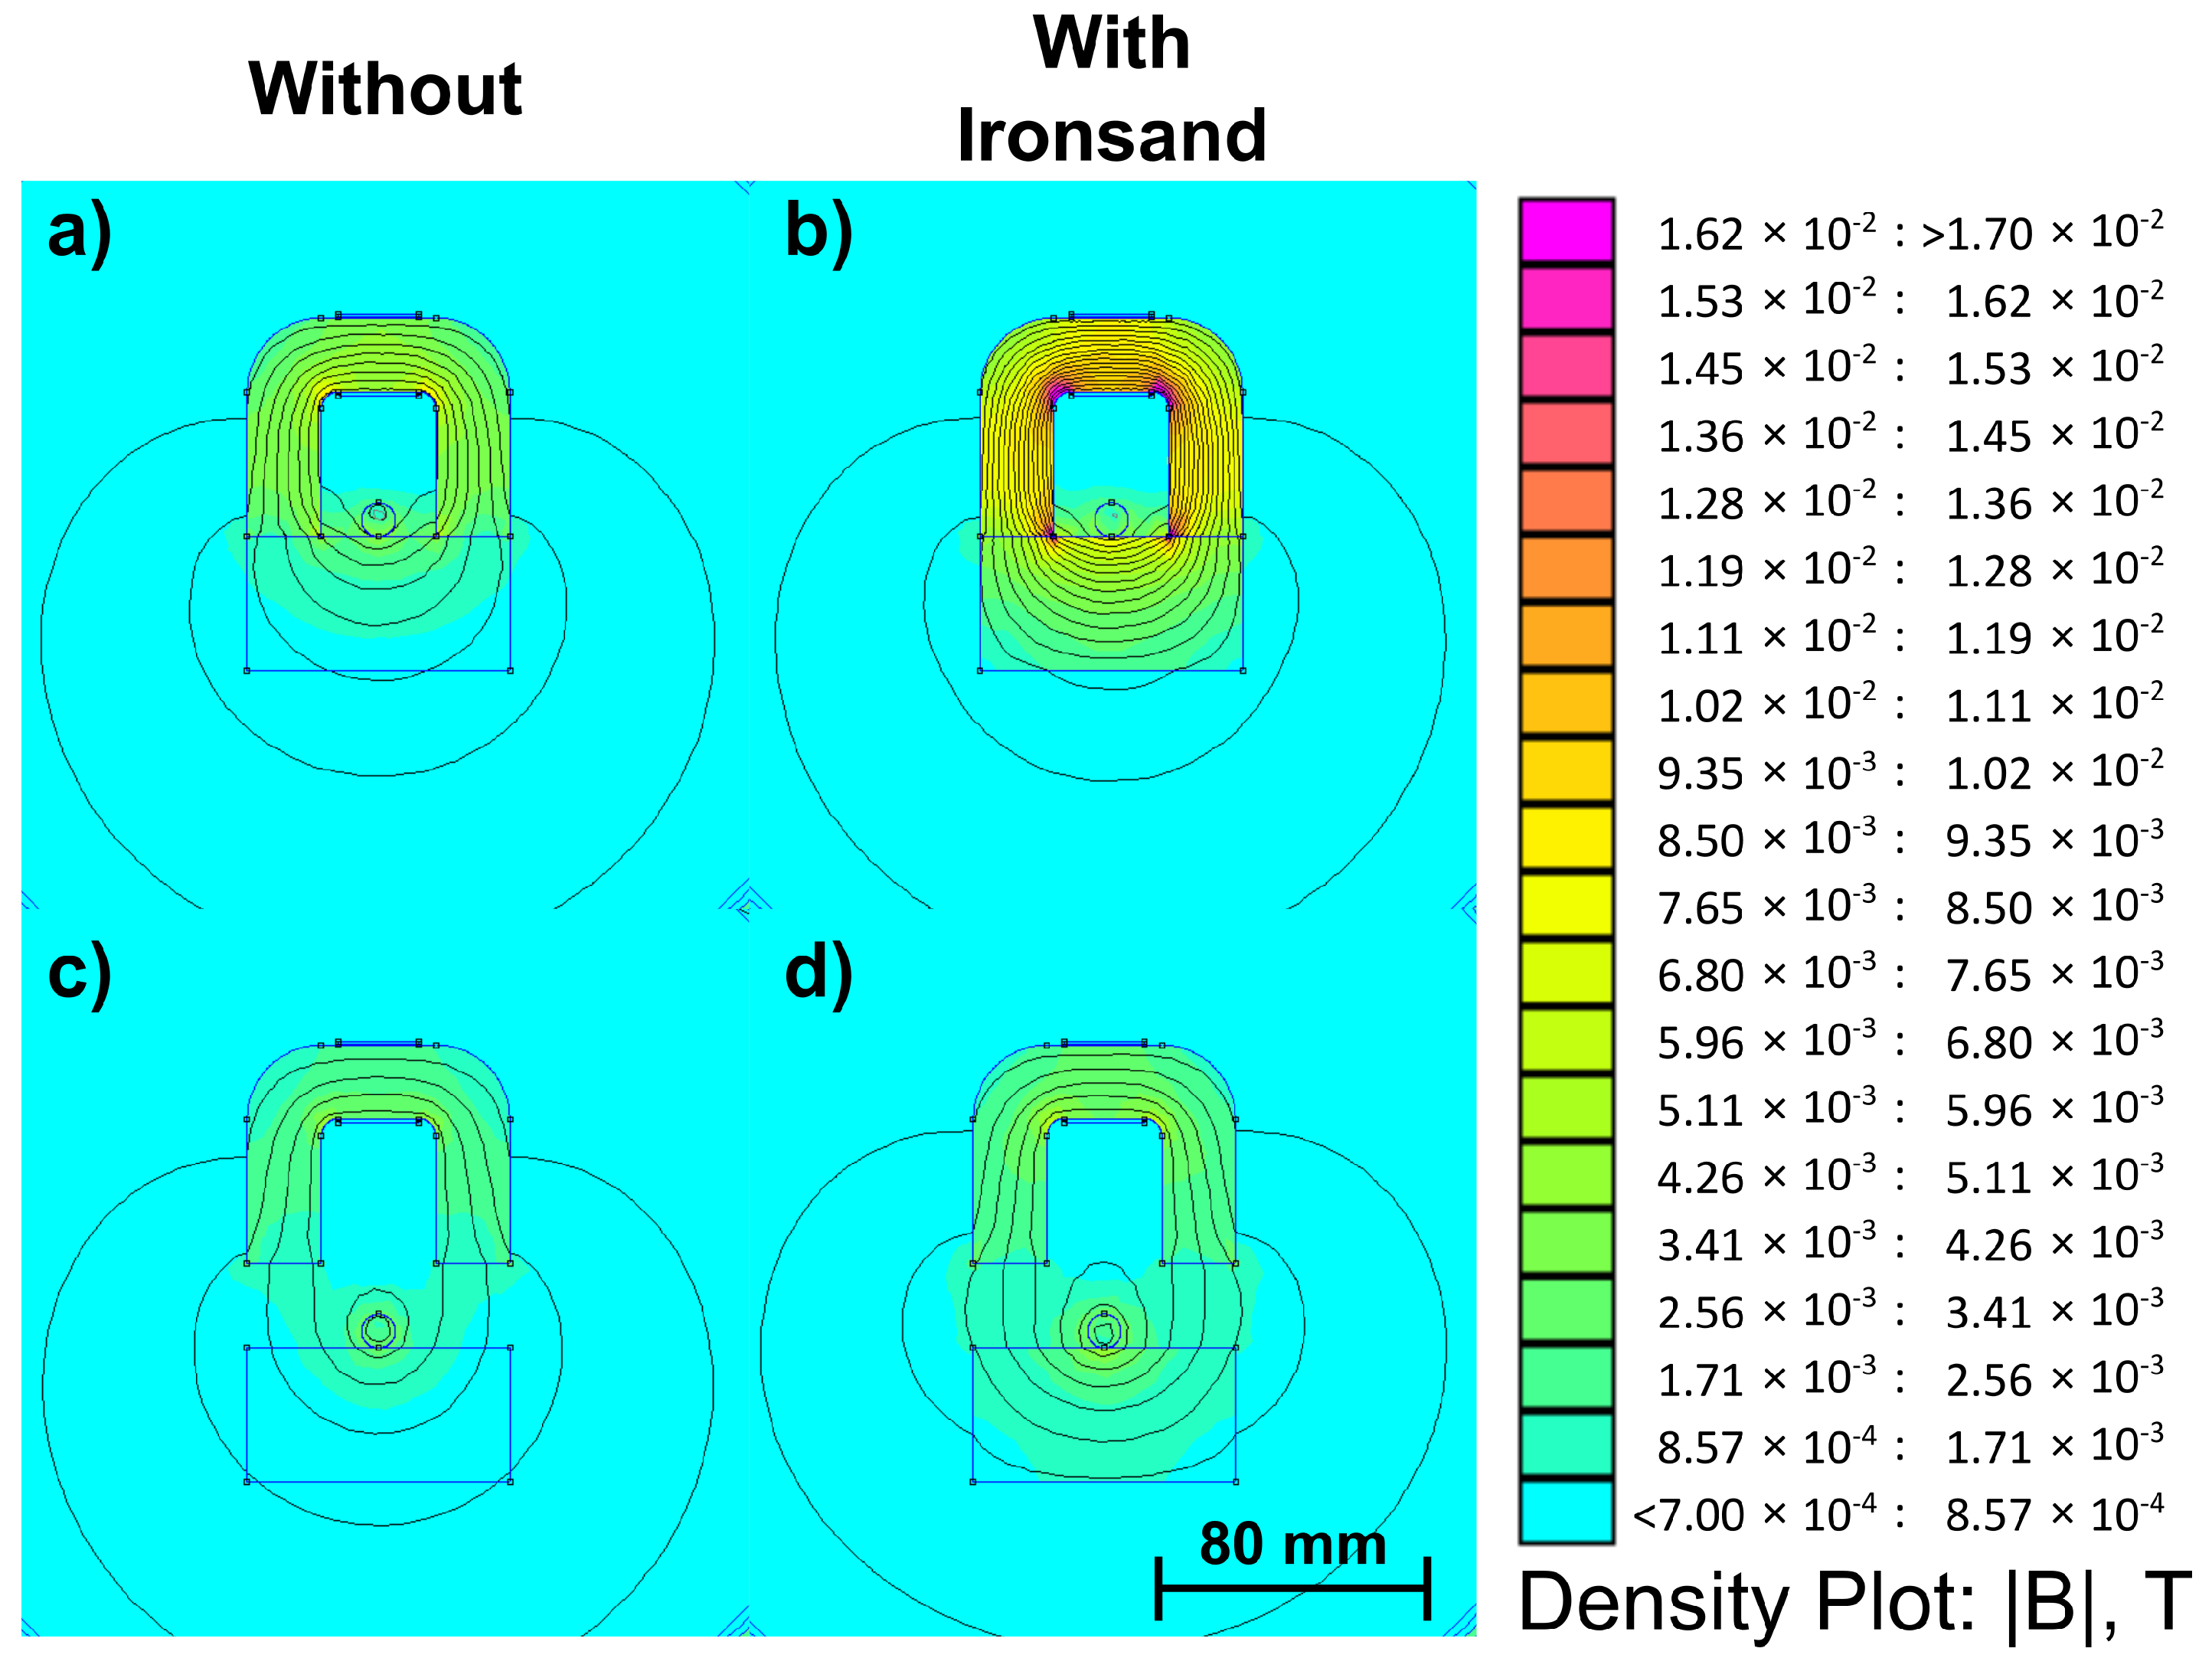
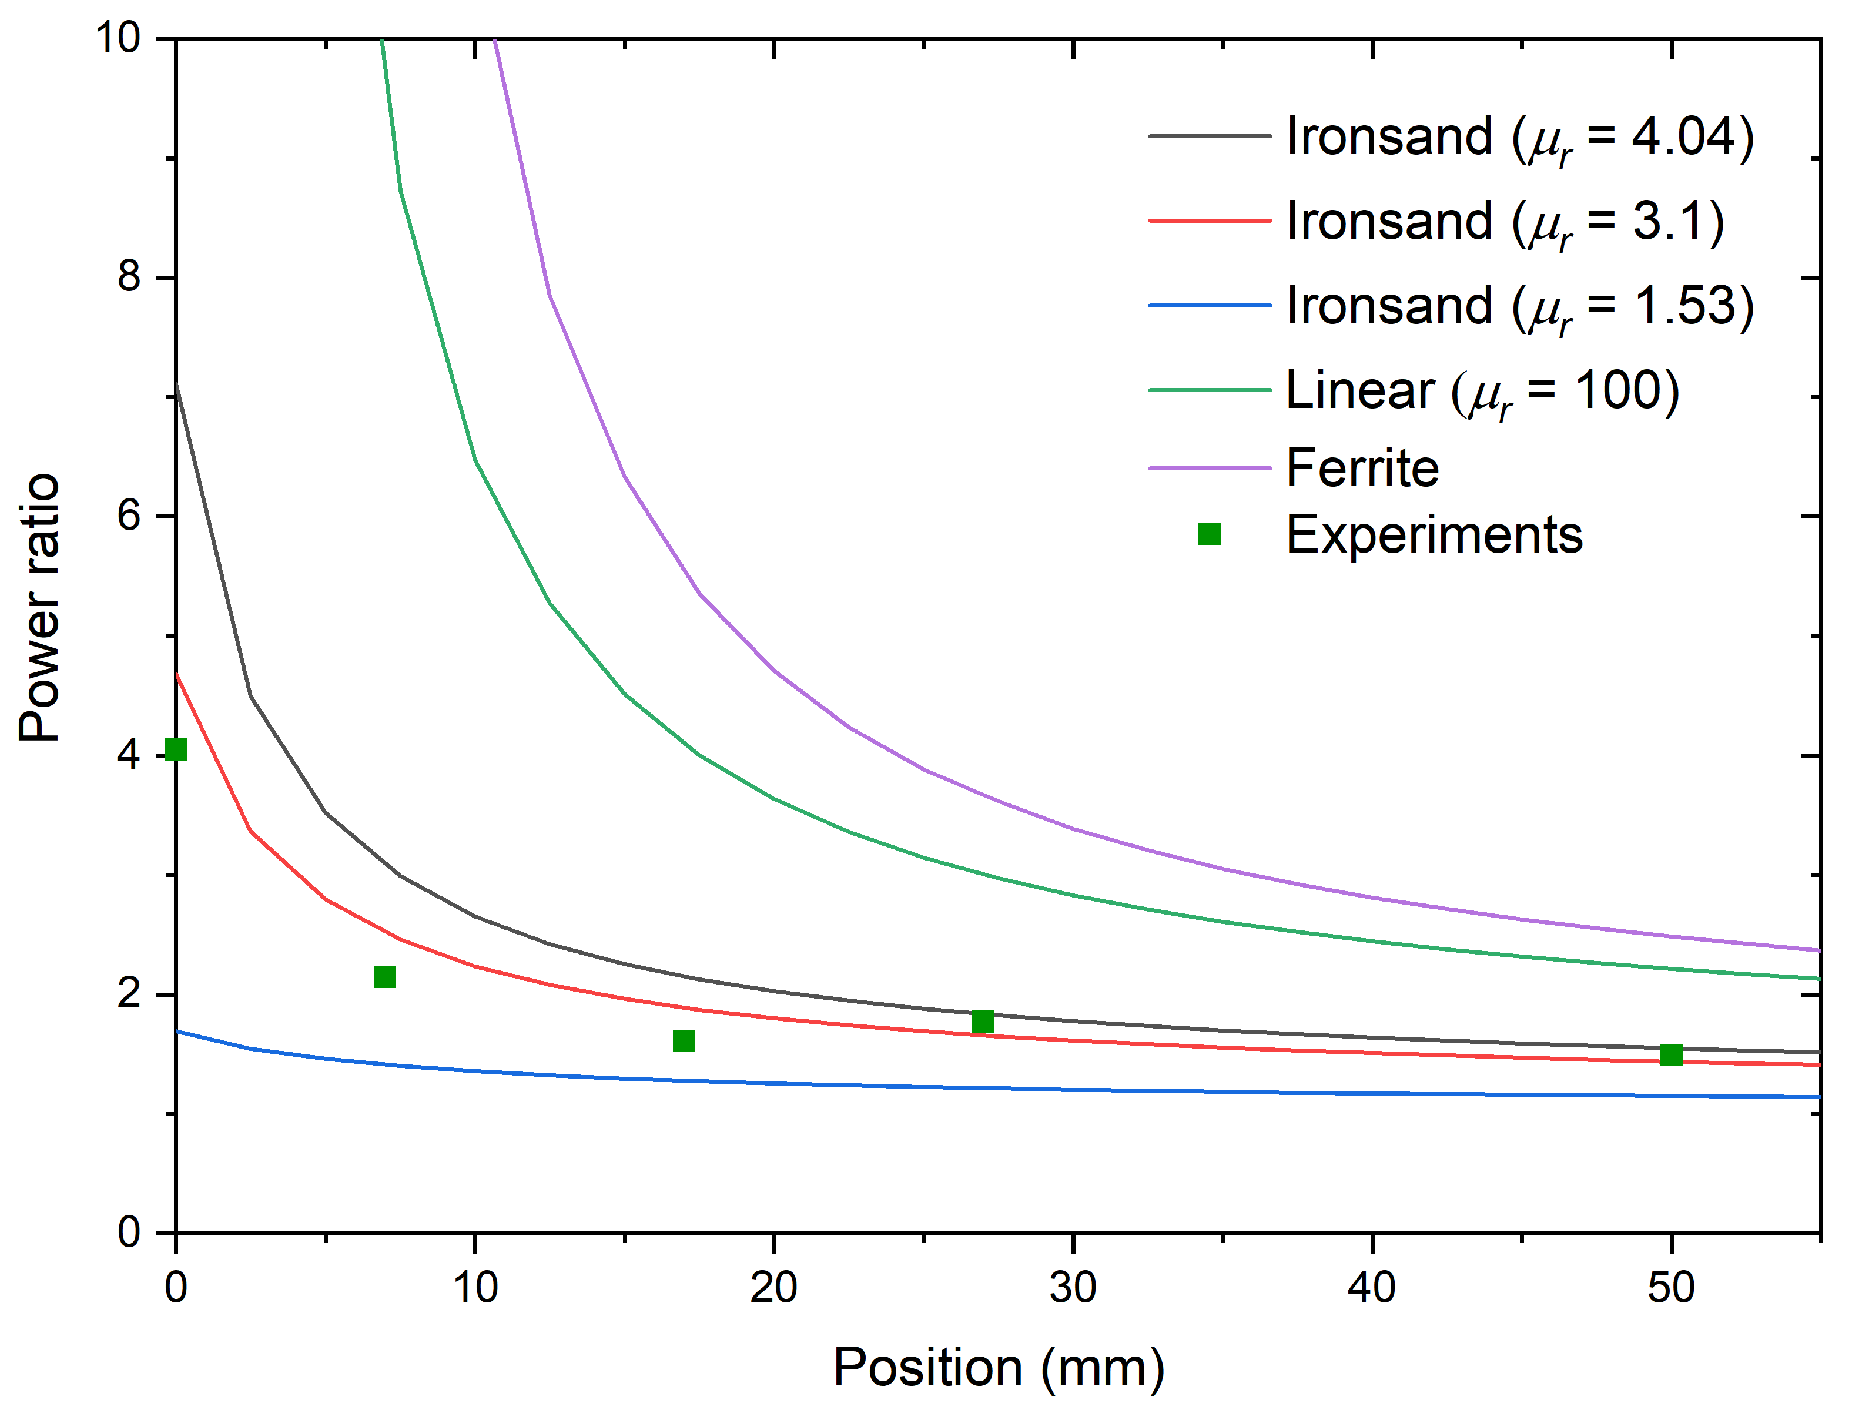
3.4. Directly Using Ironsand to Increase Power Transfer Efficiency

Placing ironsand to bridge part of an air gap within a magnetic circuit is expected to increase power transfer performance. Indeed, the effective magnetic path can be significantly decreased as the magnetic flux traverses ironsand ( μ r 3 ) instead of going through air ( μ r = 1 ). Hence, such low-permeability SMC can potentially be used to improve the performance of an IPT system by providing an additional layer of control of the flux leakage, particularly where material cost reductions are required. This hypothesis was tested here experimentally by investigating changes in the performance of an IPT setup with and without ironsand.
A simple IPT configuration was used in this investigation: a primary circuit consisting of a single-rail track was energised with AC current, and a U-shaped core secondary circuit was used as the pick-up. Such systems are typically used to wirelessly power autonomous guided vehicles. Experiments were undertaken to illustrate the benefits of the use of ironsand to reduce the leakage under the track. The rationale was that with a permeability above one, even with values as low as those of ironsand, this would greatly reduce the effective magnetic path length. This can be seen clearly from the simulated field maps (in Figure 7), which showed higher fields in the core when using ironsand. As expected, the benefits of including an ironsand backing quickly dropped as the distance increased.
Figure 8 gives the ratio of energy transferred to the U-shaped pick-up with ironsand over the energy transferred without ironsand for different distances to the primary circuit. At 50 mm, the transferred power was still about 50% greater than without ironsand. With increasing distance between the rail track and the pick-up core, the benefits of using higher-permeability materials decreased rapidly (Figure 8). At 50 mm, a permeability of 100 increased the power ratio to 52%, whereas using the same ferrite materials ( μ r 4000 ) only increased this value up to 70%.
While these results did not consider changes in loss by incorporating more magnetic materials in the geometry, they suggest that ironsand and, by extension, other SMC materials could be used practically to further optimise the performance of IPT systems. In particular, despite its low magnetic permeability, ironsand could be used in IPT system designs to further decrease the effective length and to reduce flux leakage. This can be particularly important in large-scale applications where cost is paramount or where stray field exposure needs to be reduced. This includes the in-road IPT systems mentioned in the Introduction.

4. Conclusions

It was confirmed that New Zealand ironsand’s magnetic properties were driven primarily by its titanomagnetite and titanohematite content. Increased content in titanomagnetite and magnetic permeability correlated well with the total Fe content in the materials. The presence of traces of Co with higher-permeability ironsand was also confirmed, but its impact on the magnetic properties remains unclear. The magnetic properties of this resource can therefore be selected easily by measuring the total Fe and Co content.
The results obtained with toroids made of an ironsand-based composite allowed the effect of ironsand loading on their inductive properties to be quantified. As expected, a higher loading of ironsand yielded a higher magnetic permeability and a lower loss factor. When combined with larger particles of high-permeability materials, such as a MnZn-Ferrite, it was shown that replacing some of the high-permeability fraction with less expensive ironsand was not detrimental to the magnetic properties. Preliminary cost estimates, based on current commodity prices for ironsand and its basic processing, showed that this could decrease the cost of magnetic materials by 12 to 15%. Further work is also needed to appropriately describe the magnetic properties of such a composite.
Hence, this investigation confirms the potential to use ironsand in an IPT system. This includes using ironsand to replace parts of other higher-permeability-flux-guiding materials without loss of magnetic permeability. Further investigations will focus on the matrix choice and the resulting magnetic, mechanical and thermal properties over the lifetime of an in-road pad. In particular, changes in IPT system designs, including different materials, will have to account precisely for changes in the losses and coupling coefficient.

Supplementary Materials

The following are available online at https://www.mdpi.com/article/10.3390/ma14185455/s1: Table S1. summary of particle size, saturation magnetisation at 1 T, and XRD identification for different ironsand samples in the study, Figure S1. comparison of the XRD pattern of the 35M samples with the ironsand from previous investigation [4], Figure S2. XRD pattern of the 18M samples, Figure S3. XRD pattern of the 14M samples.

Author Contributions

Conceptualization, J.L.; formal analysis, J.L.; funding acquisition, J.K. and G.C.; investigation, W.J.T., S.V.C., V.J., S.K., M.M., E.A., G.C. and J.B.; methodology, J.L., W.J.T., S.V.C., S.K. and G.C.; project administration, J.K. and G.C.; resources, B.R., V.J., M.M., K.E.S. and N.L.; supervision, K.E.S., N.L., J.K., G.C. and J.B.; validation, V.J. and N.L.; writing—original draft, J.L.; writing—review and editing, J.L., W.J.T., S.V.C., B.R., V.J., S.K., M.M., E.A., N.L., J.K. and G.C. All authors have read and agreed to the published version of the manuscript.

Funding

This research was funded by the New Zealand Ministry for Business Innovation and Employment (UOAX1711 Development of IPT roadway charging systems). The APC was funded the same way.

Institutional Review Board Statement

Not applicable.

Informed Consent Statement

Not applicable.

Data Availability Statement

Data are available upon reasonable request to the corresponding author.

Acknowledgments

The authors acknowledge Taharoa Ironsands Ltd. for providing bulk ironsand samples, Trevor Dine from the Verum Group, New Zealand, for beach and dune sample collection, and Jason James for undertaking the power transfer experiments. The authors thank Michel Sassi from the Pacific Northwest National Laboratory, USA, for useful insight into analysing the XANES data. The authors also thank Graham Weir for useful discussions around the models used to fit the experimental values of the relative magnetic permeability of the composite materials.

Conflicts of Interest

The authors declare no conflict of interest. The funders had no role in the design of the study; in the collection, analyses, or interpretation of data; in the writing of the manuscript; nor in the decision to publish the results.

Abbreviations

The following abbreviations are used in this manuscript:
IPTInductive Power Transfer
SMCSoft Magnetic Composite
XASX-ray Absorption Spectroscopy
XANESX-ray Absorption Near-Edge Spectroscopy
TFYTotal Fluorescence Yield
TEYTotal Electron Yield
FWHMFull-Width at Half-Maximum
VSMVibrating Sample Magnetometry
AGVAutomated Guided Vehicles
FEMMFinite Element Modelling Method
XRDX-ray Diffraction
XRFX-ray Fluorescence

References

  1. Marshall, T. Iron Ore, Coal, and Steel Production in New Zealand–Summary: Minerals. In Circum-Pacific Energy and Mineral Resources; American Association of Petroleum Geologists: Tulsa, OK, USA, 1976; Volume 25, pp. 391–394. [Google Scholar]
  2. Brathwaite, R.; Gazley, M.; Christie, A. Provenance of titanomagnetite in ironsands on the west coast of the North Island, New Zealand. J. Geochem. Explor. 2017, 178, 23–34. [Google Scholar] [CrossRef]
  3. Longbottom, R.J.; Ingham, B.; Reid, M.H.; Studer, A.J.; Bumby, C.W.; Monaghan, B.J. In situ neutron diffraction study of the reduction of New Zealand ironsands in dilute hydrogen mixtures. Miner. Process. Extr. Metall. 2019, 128, 183–192. [Google Scholar] [CrossRef]
  4. Prabowo, S.W.; Longbottom, R.J.; Monaghan, B.J.; del Puerto, D.; Ryan, M.J.; Bumby, C.W. Sticking-Free Reduction of Titanomagnetite Ironsand in a Fluidized Bed Reactor. Metall. Mater. Trans. B 2019, 50, 1729–1744. [Google Scholar] [CrossRef]
  5. Rim, C.T. Wireless Charging of Electric Vehicles. In Power Electronics Handbook; Elsevier: Amsterdam, The Netherlands, 2018; pp. 1113–1137. [Google Scholar]
  6. Franke, T.; Neumann, I.; Bühler, F.; Cocron, P.; Krems, J.F. Experiencing range in an electric vehicle: Understanding psychological barriers. Appl. Psychol. 2012, 61, 368–391. [Google Scholar] [CrossRef]
  7. Pearre, N.S.; Kempton, W.; Guensler, R.L.; Elango, V.V. Electric vehicles: How much range is required for a day’s driving? Transp. Res. Part C Emerg. Technol. 2011, 19, 1171–1184. [Google Scholar] [CrossRef]
  8. Reid, R.L. Electric Vehicles: Charging Ahead. Civ. Eng. Mag. Arch. 2018, 88, 54–78. [Google Scholar] [CrossRef]
  9. Karakitsios, I.; Karfopoulos, E.; Hatziargyriou, N. Impact of dynamic and static fast inductive charging of electric vehicles on the distribution network. Electr. Power Syst. Res. 2016, 140, 107–115. [Google Scholar] [CrossRef]
  10. Schulte, J.; Ny, H. Electric Road Systems: Strategic Stepping Stone on the Way towards Sustainable Freight Transport? Sustainability 2018, 10, 1148. [Google Scholar] [CrossRef] [Green Version]
  11. Jelica, D.; Taljegard, M.; Thorson, L.; Johnsson, F. Hourly electricity demand from an electric road system—A Swedish case study. Appl. Energy 2018, 228, 141–148. [Google Scholar] [CrossRef]
  12. Czainski, R.; Meins, J.; Whaley, J. Transferring Electric Energy to a Vehicle by Induction. U.S. Patent 8,997,955, 7 April 2015. [Google Scholar]
  13. Wang, C.S.; Stielau, O.H.; Covic, G.A. Design considerations for a contactless electric vehicle battery charger. IEEE Trans. Ind. Electron. 2005, 52, 1308–1314. [Google Scholar] [CrossRef]
  14. Panchal, C.; Stegen, S.; Lu, J. Review of static and dynamic wireless electric vehicle charging system. Eng. Sci. Technol. Int. J. 2018, 21, 922–937. [Google Scholar] [CrossRef]
  15. Kim, D.; Abu-Siada, A.; Sutinjo, A. State-of-the-art literature review of WPT: Current limitations and solutions on IPT. Electr. Power Syst. Res. 2018, 154, 493–502. [Google Scholar] [CrossRef]
  16. Covic, G.A.; Boys, J.T. Modern trends in inductive power transfer for transportation applications. IEEE J. Emerg. Sel. Top. Power Electron. 2013, 1, 28–41. [Google Scholar] [CrossRef]
  17. Brooker, A.; Thornton, M.; Rugh, J. Technology Improvement Pathways to Cost-Effective Vehicle Electrification: Preprint; Number NREL/CP-540-47454; National Renewable Energy Laboratory: Golden, CO, USA, 2010; pp. 1–18. Available online: https://www.nrel.gov/docs/fy10osti/47454.pdf (accessed on 18 September 2021).
  18. Miller, J.M.; Jones, P.T.; Li, J.M.; Onar, O.C. ORNL experience and challenges facing dynamic wireless power charging of EV’s. IEEE Circuits Syst. Mag. 2015, 15, 40–53. [Google Scholar] [CrossRef]
  19. Tesla, N. Apparatus for Transmitting Electrical Energy. U.S. Patent 1,119,732, 1 December 1914. [Google Scholar]
  20. Boys, J.T.; Covic, G.A. The inductive power transfer story at the University of Auckland. IEEE Circuits Syst. Mag. 2015, 15, 6–27. [Google Scholar] [CrossRef]
  21. Lee, S.; Huh, J.; Park, C.; Choi, N.S.; Cho, G.H.; Rim, C.T. On-line electric vehicle using inductive power transfer system. In Proceedings of the 2010 IEEE Energy Conversion Congress and Exposition, Atlanta, GA, USA, 12–16 September 2010; pp. 1598–1601. [Google Scholar]
  22. Azad, A.N.; Echols, A.; Kulyukin, V.A.; Zane, R.; Pantic, Z. Analysis, Optimization, and Demonstration of a Vehicular Detection System Intended for Dynamic Wireless Charging Applications. IEEE Trans. Transp. Electrif. 2018, 5, 147–161. [Google Scholar] [CrossRef]
  23. Jang, Y.J. Survey of the operation and system study on wireless charging electric vehicle systems. Transp. Res. Part C Emerg. Technol. 2018, 95, 844–866. [Google Scholar] [CrossRef]
  24. Laporte, S.; Coquery, G.; Revilloud, M.; Deniau, V. Experimental Performance Assessment of a Dynamic Wireless Power Transfer System for Future EV in Real Driving Conditions. In Proceedings of the Ninth International Conference on Future Energy Systems, e-Energy ’18, Karlsruhe, Germany, 12–15 June 2018; ACM: New York, NY, USA, 2018; pp. 570–578. [Google Scholar] [CrossRef]
  25. Laporte, S.; Coquery, G.; Deniau, V. The Versailles-Satory charging infrastructure for Dynamic Wireless Power Transfer systems testing. In Proceedings of the 32nd Electric Vehicle Symposium, Lyon, France, 19–22 May 2019; p. 12. [Google Scholar]
  26. Delgado, A.; Salinas, G.; Rodríguez, J.; Oliver, J.A.; Cobos, J.A. Finite Element Modelling of Litz wire Conductors and Compound Magnetic Materials based on Magnetic Nano-particles by means of Equivalent Homogeneous Materials for Wireless Power Transfer System. In Proceedings of the 2018 IEEE 19th Workshop on Control and Modeling for Power Electronics (COMPEL), Padova, Italy, 25–28 June 2018; pp. 1–5. [Google Scholar]
  27. Raabe, S.; Covic, G.; Boys, J.; Pennalligen, C.; Shekar, P. Practical considerations in the design of multiphase pick-ups for contactless power transfer systems. In Proceedings of the 2009 35th Annual Conference of IEEE Industrial Electronics, Porto, Portugal, 3–5 November 2009; pp. 753–758. [Google Scholar]
  28. Tavakoli, R.; Echols, A.; Pratik, U.; Pantic, Z.; Pozo, F.; Malakooti, A.; Maguire, M. Magnetizable concrete composite materials for road-embedded wireless power transfer pads. In Proceedings of the 2017 IEEE Energy Conversion Congress and Exposition (ECCE), Cincinnati, OH, USA, 1–5 October 2017; pp. 4041–4048. [Google Scholar]
  29. Hui, S.Y.R.; Zhong, W.; Lee, C.K. A critical review of recent progress in mid-range wireless power transfer. IEEE Trans. Power Electron. 2013, 29, 4500–4511. [Google Scholar] [CrossRef] [Green Version]
  30. Noh, E.; Ko, K.H.; Kim, K. Transmitter coil system without ferrite in wireless power transfer. Electron. Lett. 2016, 52, 392–393. [Google Scholar] [CrossRef]
  31. Tejeda, A.; Carretero, C.; Boys, J.T.; Covic, G.A. Ferrite-less circular pad with controlled flux cancelation for EV wireless charging. IEEE Trans. Power Electron. 2016, 32, 8349–8359. [Google Scholar] [CrossRef]
  32. Pearce, M.G.S.; Covic, G.A.; Boys, J.T. Robust Ferrite-Less Double D Topology for Roadway IPT Applications. IEEE Trans. Power Electron. 2018, 34, 6062–6075. [Google Scholar] [CrossRef]
  33. Lathiya, P.; Kreuzer, M.; Wang, J. RF complex permeability spectra of Ni-Cu-Zn ferrites prepared under different applied hydraulic pressures and durations for wireless power transfer (WPT) applications. J. Magn. Magn. Mater. 2020, 499, 166273. [Google Scholar] [CrossRef]
  34. Meng, B.; Hou, J.; Ning, F.; Yang, B.; Zhou, B.; Yu, R. Low-loss and high-induction Fe-based soft magnetic composites coated with magnetic insulating layers. J. Magn. Magn. Mater. 2019, 492, 165651. [Google Scholar] [CrossRef]
  35. Dobák, S.; Füzer, J.; Kollár, P.; Fáberová, M.; Bureš, R. Interplay of domain walls and magnetization rotation on dynamic magnetization process in iron/polymer–matrix soft magnetic composites. J. Magn. Magn. Mater. 2017, 426, 320–327. [Google Scholar] [CrossRef]
  36. Shokrollahi, H.; Janghorban, K. Soft magnetic composite materials (SMCs). J. Mater. Process. Technol. 2007, 189, 1–12. [Google Scholar] [CrossRef]
  37. Guo, Y.; Zhu, J.G.; Wu, W. Thermal analysis of soft magnetic composite motors using a hybrid model with distributed heat sources. IEEE Trans. Magn. 2005, 41, 2124–2128. [Google Scholar]
  38. Gramatyka, P.; Nowosielski, R.; Sakiewicz, P. Magnetic properties of polymer bonded nanocrystalline powder. J. Achiev. Mater. Manuf. Eng. 2007, 20, 115–118. [Google Scholar]
  39. Strečková, M.; Füzer, J.; Bureš, R.; Kollár, P.; Fáberová, M.; Girman, V.; Medvecký, L. Characterization of composite materials based on Fe powder (core) and phenol–formaldehyde resin (shell) modified with nanometer-sized SiO2. Bull. Mater. Sci. 2014, 37, 167–177. [Google Scholar] [CrossRef] [Green Version]
  40. Poskovic, E.; Ferraris, L.; Pallavicini, E.; Cavagnino, A. Compaction of SMC Materials by Applying External Magnetic Fields to the Mold. In Proceedings of the 2018 IEEE Energy Conversion Congress and Exposition (ECCE), Portland, OR, USA, 23–27 September 2018; pp. 5379–5386. [Google Scholar]
  41. Carretero, C.; Lope, I.; Acero, J. Magnetizable Concrete Flux Concentrators for Wireless Inductive Power Transfer Applications. IEEE J. Emerg. Sel. Top. Power Electron. 2019, 8, 2696–2706. [Google Scholar] [CrossRef]
  42. Jin, X.; Wang, Q.; Khan, W.; Li, Y.; Tang, Z.H. FeSiAl/(N0.5Zn0.5) Fe2O4 magnetic sheet composite with tunable electromagnetic properties for enhancing magnetic field coupling efficiency. J. Alloy. Compd. 2017, 729, 277–284. [Google Scholar] [CrossRef]
  43. Neamţu, B.; Nasui, M.; Marinca, T.; Popa, F.; Chicinaş, I. Soft magnetic composites based on hybrid coated Fe-Si nanocrystalline powders. Surf. Coat. Technol. 2017, 330, 219–227. [Google Scholar] [CrossRef]
  44. Nowosielski, R.; Wysłocki, J.; Wnuk, I.; Gramatyka, P. Nanocrystalline soft magnetic composite cores. J. Mater. Process. Technol. 2006, 175, 324–329. [Google Scholar] [CrossRef]
  45. Soft Magnetic Materials (SMCs). Available online: https://fluxtrol.com/soft-magnetic-materials (accessed on 18 September 2021).
  46. New Serie of Receiver Antenna for EV Wireless Charging. Available online: https://www.grupopremo.com/content/245-premo-launches-the-wc-rx-series-of-receiver-antennae-secondary-coil-for-ev-wireless-charging-applications (accessed on 18 September 2021).
  47. Reynolds, R.L. Magnetic Titanohematite Minerals in Uranium-Bearing Sandstones; U.S. Geological Survey: Reston, VA, USA, 1977. [Google Scholar]
  48. Trompetter, W.J.; Leveneur, J.; Kennedy, J.; Rumsey, B.; McCurdy, M.; Chong, S.; Long, N. Investigation of New Zealand natural magnetic minerals for application to inroad charging systems. Int. J. Mod. Phys. B 2019, 34, 2040018. [Google Scholar] [CrossRef]
  49. Hsu, M.Y.; Yang, W.C.; Teng, H.; Leu, J. Microstructure and composition of TiO2 nanotube arrays fabricated with HF and NH4F electrolytes and their evolution during annealing. J. Electrochem. Soc. 2011, 158, K81–K87. [Google Scholar] [CrossRef]
  50. O’handley, R.C. Modern Magnetic Materials: Principles and Applications; Wiley: Hoboken, NJ, USA, 2000. [Google Scholar]
  51. Covic, G.A.; Elliott, G.; Stielau, O.H.; Green, R.; Boys, J. The design of a contact-less energy transfer system for a people mover system. In Proceedings of the 2000 International Conference on Power System Technology, Perth, Australia, 4–7 December 2000; Volume 1, pp. 79–84. [Google Scholar]
  52. Sorescu, M.; Xu, T.; Wise, A.; Díaz-Michelena, M.; McHenry, M.E. Studies on structural, magnetic and thermal properties of xFe2TiO4−(1−x) Fe3O4(0≤x≤1) Pseudo-binary System. J. Magn. Magn. Mater. 2012, 324, 1453–1462. [Google Scholar] [CrossRef]
  53. Baltzis, K. The FEMM Package: A Simple, Fast, and Accurate Open Source Electromagnetic Tool in Science and Engineering. J. Eng. Sci. Technol. Rev. 2008, 1, 83–89. [Google Scholar] [CrossRef]
  54. Meeker, D. Finite element method magnetics. FEMM 2010, 4, 162. [Google Scholar]
  55. Lyberatos, A. Temperature dependence of the magnetization of titanomagnetites. J. Magn. Magn. Mater. 2007, 311, 560–564. [Google Scholar] [CrossRef]
  56. Garming, J.; Von Dobeneck, T.; Franke, C.; Bleil, U. Low-temperature partial magnetic self-reversal in marine sediments by magnetostatic interaction of titanomagnetite and titanohematite intergrowths. Geophys. J. Int. 2007, 170, 1067–1075. [Google Scholar] [CrossRef] [Green Version]
  57. Burton, B.P.; Robinson, P.; McEnroe, S.A.; Fabian, K.; Ballaran, T.B. A low-temperature phase diagram for ilmenite-rich compositions in the system Fe2O3-FeTiO3. Am. Mineral. 2008, 93, 1260–1272. [Google Scholar] [CrossRef]
  58. Pearce, C.I.; Henderson, C.M.B.; Telling, N.D.; Pattrick, R.A.; Charnock, J.M.; Coker, V.S.; Arenholz, E.; Tuna, F.; van der Laan, G. Fe site occupancy in magnetite-ulvospinel solid solutions: A new approach using X-ray magnetic circular dichroism. Am. Mineral. 2010, 95, 425–439. [Google Scholar] [CrossRef]
  59. Sassi, M.; Pearce, C.I.; Bagus, P.S.; Arenholz, E.; Rosso, K.M. First-Principles Fe L2,3-Edge and O K-Edge XANES and XMCD Spectra for Iron Oxides. J. Phys. Chem. A 2017, 121, 7613–7618. [Google Scholar] [CrossRef] [PubMed]
  60. Soldatov, M.; Göttlicher, J.; Kubrin, S.; Guda, A.; Lastovina, T.; Bugaev, A.; Rusalev, Y.V.; Soldatov, A.; Lamberti, C. Insight from X-ray Absorption Spectroscopy to Octahedral/Tetrahedral Site Distribution in Sm-Doped Iron Oxide Magnetic Nanoparticles. J. Phys. Chem. C 2018, 122, 8543–8552. [Google Scholar] [CrossRef]
  61. Miedema, P.S.; De Groot, F.M. The iron L edges: Fe 2p X-ray absorption and electron energy loss spectroscopy. J. Electron Spectrosc. Relat. Phenom. 2013, 187, 32–48. [Google Scholar] [CrossRef]
  62. Leveneur, J.; Waterhouse, G.I.; Kennedy, J.; Metson, J.B.; Mitchell, D.R. Nucleation and growth of Fe nanoparticles in SiO2: A TEM, XPS, and Fe L-edge XANES investigation. J. Phys. Chem. C 2011, 115, 20978–20985. [Google Scholar] [CrossRef]
  63. Kaya, S.; Ogasawara, H.; Nilsson, A. Determination of the surface electronic structure of Fe3O4 (1 1 1) by soft X-ray spectroscopy. Catal. Today 2015, 240, 184–189. [Google Scholar] [CrossRef] [Green Version]
  64. Fricke, H. A mathematical treatment of the electric conductivity and capacity of disperse systems I. The electric conductivity of a suspension of homogeneous spheroids. Phys. Rev. 1924, 24, 575. [Google Scholar] [CrossRef]
  65. Lawton, D.; Hochstein, M. Physical properties of titanomagnetite sands. Geophysics 1980, 45, 394–402. [Google Scholar] [CrossRef]
  66. Ollendorff, F. Magnetostatik der massekerne. Arch. Elektrotechnik 1931, 25, 436–447. [Google Scholar] [CrossRef]
  67. Corson, D.R.; Lorrain, P. Introduction to Electromagnetic Fields and Waves; WH Freeman: San Francisco, CA, USA, 1962. [Google Scholar]
Figure 1. Physical dimensions of the power transfer setup used in this investigation. The dash lines show a different position of the primary circuit with respect to the U-shaped core.
Materials 14 05455 g001
Figure 2. Temperature dependence of the magnetic moment at 1 T obtained with Vibrating Sample Magnetometry (VSM) measurement for all samples as per Table 1. Please note the variation in the scale of the vertical axis.
Materials 14 05455 g002
Figure 3. XANES Normalised total electron yield (TEY) Fe L-edge for the different samples and the reference magnetite sample.
Materials 14 05455 g003
Figure 4. Comparison of the changes of the C/B ratio in the measured Fe L-edges against (a) measured Fe concentration and (b) magnetic permeability.
Materials 14 05455 g004
Figure 5. Evolution of the magnetic permeability as a function of the filler volume fraction. The red line is the fit of the experimental data using Equation (7).
Materials 14 05455 g005
Figure 6. Evolution of the magnetic permeability with different loadings of ferrite and ironsand. The horizontal axis gives the fraction of ferrite grains. The fraction of ironsand is complementary to make a total magnetic filler loading of ∼80 wt.%.
Materials 14 05455 g006
Figure 7. Changes in the magnetic field magnitude with different distances to the pick-up and the presence of ironsand: (a) 0 mm, no ironsand; (b) 25 mm, no ironsand; (c) 0 mm, ironsand; (d) 25 mm, ironsand.
Materials 14 05455 g007
Figure 8. Evolution of the apparent power with/without ironsand at different distances to the pick-up for different relative magnetic permeabilities. The “Linear” dataset corresponds to a hypothetical material that will stay at a constant permeability of 100 over the range of magnetic fields in these conditions. The Ferrite dataset corresponds to the simulation with a slab of the same ferrite and the same thickness as the U-shaped core. The scatter plot represents the experimental values.
Materials 14 05455 g008
Table 1. Composition and magnetic properties of the ironsand samples used in this study. Sample location can be found in [48].
Sample μ r μ μ tan δ M s Ms,norm. H s FeCoCrustal
( μ / μ ) × 10 3 (emu/g)(emu/g Fe )(Oe)(ppm)(ppm)(ppm)
114–164.854.950.036.450.275.42564665,535208689,784
218M4.374.460.025.443.262.724406894773540136,708
323M4.044.120.001.147.277.52227608,7012650109,485
420M1.531.55−0.02−1.425.468.22508372,484265452,505
519M1.151.15−0.04−3.819.761.02591323,222942606,951
64M0.690.68−0.06−8.31.93.28215600,871727159,545
Publisher’s Note: MDPI stays neutral with regard to jurisdictional claims in published maps and institutional affiliations.

