Article

Influence of Magnetite Nanoparticles Shape and Spontaneous Surface Oxidation on the Electron Transport Mechanism

by
Adrian Radoń
1,2,*,
Mariola Kądziołka-Gaweł
3,
Dariusz Łukowiec
2,
Piotr Gębara
4,
Katarzyna Cesarz-Andraczke
2,
Aleksandra Kolano-Burian
1,
Patryk Włodarczyk
1,
Marcin Polak
1 and
Rafał Babilas
2
1
Łukasiewicz Research Network—Institute of Non-Ferrous Metals, Sowinskiego 5 St., 44-100 Gliwice, Poland
2
Faculty of Mechanical Engineering, Silesian University of Technology, Konarskiego 18 a St., 44-100 Gliwice, Poland
3
A. Chelkowski Institute of Physics, University of Silesia, 75 Pułku Piechoty 1A St., 41-500 Chorzów, Poland
4
Institute of Physics, Czestochowa University of Technology, al. Armii Krajowej 19, 42-200 Czestochowa, Poland
*
Author to whom correspondence should be addressed.
Materials 2021, 14(18), 5241; https://doi.org/10.3390/ma14185241
Submission received: 12 August 2021 / Revised: 31 August 2021 / Accepted: 8 September 2021 / Published: 12 September 2021
(This article belongs to the Special Issue Nanocomposite Magnetic Materials for Energy Conversion)

Abstract

:
The spontaneous oxidation of a magnetite surface and shape design are major aspects of synthesizing various nanostructures with unique magnetic and electrical properties, catalytic activity, and biocompatibility. In this article, the roles of different organic modifiers on the shape and formation of an oxidized layer composed of maghemite were discussed and described in the context of magnetic and electrical properties. It was confirmed that Fe3O4 nanoparticles synthesized in the presence of triphenylphosphine could be characterized by cuboidal shape, a relatively low average particle size (9.6 ± 2.0 nm), and high saturation magnetization equal to 55.2 emu/g. Furthermore, it has been confirmed that low-frequency conductivity and dielectric properties are related to surface disordering and oxidation. The electric energy storage possibility increased for nanoparticles with a disordered and oxidized surface, whereas the dielectric losses in these particles were strongly related to their size. The cuboidal magnetite nanoparticles synthesized in the presence of triphenylphosphine had an ultrahigh electrical conductivity (1.02 × 10⁻⁴ S/cm at 10 Hz) in comparison to the spherical ones. At higher temperatures, the maghemite content altered the behavior of electrons. The electrical conductivity can be described by correlated barrier hopping or overlapping large polaron tunneling. Interestingly, the activation energies of electrons transport by the surface were similar for all the analyzed nanoparticles in low- and high-temperature ranges.

1. Introduction

The modification of the surface of nanoparticles (NPs) plays an essential role in the synthesis of materials with controlled properties. The formation of functionalized nanoparticles with core–shell nanostructures are widely studied, especially in medical and catalytic applications [1,2,3,4]. This procedure allows one to change the properties of nanoparticles, especially to increase their reactivity, stability, and even biocompatibility. For many different nanostructures, the formation of particles with a core–shell structure results in highly efficient gas sensors synthesis. For example, Au@NiO nanoparticles are much more sensitive to ethanol than pristine NiO, which is related to the effect of the electronic and chemical sensitization of Au [5]. The synergetic effects of two different oxides on acetone sensitivity are also observed in systems such as Fe3O4@Co3O4 and are associated with the formation of the heterojunction [6]. In addition, the core–shell combination of nanoparticles and the functionalization process can be used to prepare materials with high catalytic activity. Sappino et al. [7] demonstrated that Fe3O4@SiO2 nanoparticles with a core–shell structure could be successfully functionalized to obtain stable and removable amino alcohol catalysts that can be used for the asymmetric addition of diethylzinc to aromatic aldehydes. The functionalization of Fe3O4@SiO2 nanoparticles has also been successfully used to prepare nanocatalysts functionalized by alkylsulfonic and butylcaboxylic acids, which were used by Ingle et al. for the production of biofuels from sugarcane straw [8].
On the other hand, magnetite nanoparticles functionalized with polymers, such as polylactic acid, cyclodextrins, amine-terminated poly(propylene glycol), and polyethylene glycol, can be used as magnetic resonance imaging agents and efficient drug delivery systems [9,10]. Therefore, understanding the functionalization mechanisms and the influence of surface modification on the properties of magnetite nanoparticles is essential in various fields of research. Recently, the role of the dissolution of the surface of oxidized magnetite nanoparticles in catalytic activity and magnetoelectric properties was discussed [11]. It has been shown that chemical treatment of magnetite nanoparticles synthesized by the co-precipitation method with malonic acid results in surface reorganization, dissolution of the oxidized layer, and spontaneous functionalization with an organic acid. Moreover, this process reduces the catalytic activity and increases the electrical conductivity of these nanoparticles 10 times.
The oxidation of magnetite to maghemite can occur spontaneously, or it can take place under certain conditions. This process can occur even during the synthesis; therefore, the synthesis should be carried out in anaerobic conditions [12]. The oxidation of a magnetite surface results in phase transformation, in which magnetite is transformed into maghemite [13]. In the magnetite structure, the tetrahedral sites (A-sites) are occupied by Fe3+ ions and the octahedral sites (B-sites) are occupied by Fe3+ and Fe2+ ions, whereas in maghemite, all Fe2+ ions convert into Fe3+ ions with the formation of iron vacancies (2.5 per 21.5 Fe3+ ions in the unit cell) as a result of Fe3O4 NPs oxidation [4,14]. The magnetic response under AC-fields of magnetite and maghemite nanoparticles of the same size is also different, which has been confirmed by Morales et al. [15]. Therefore, even though both iron oxides exhibit ferrimagnetic properties at room temperature, their electronic properties must be different, which should be related to the changes in electron transport. The electrical properties of pure magnetite nanoparticles have been discussed and described in detail in the previous work [16]. In the pure Fe3O4 phase, two different models were used to describe the behaviors of electrons at different temperatures and frequency ranges.
Moreover, it was confirmed that the energy of tunneling of small polarons decreases with increasing temperature, and for the high-temperature regions, it may occur spontaneously. Interestingly, the electron behavior in magnetite is strongly related to the structure, and even Drude-like behavior can be observed for this type of material [17]. The Drude model uses the kinetic theory of gases to explain electrons’ movement in, for example, metals and heavy fermionic materials [18]. Above that, the changes in dielectric properties have been observed for various mixed ferrites such as barium ferrite–zinc ferrite and Sr2Cu2Fe12O22–zinc ferrite systems, which indicates that the presence of other structures can drastically change the behavior of electrons in this type of material [19,20].
Despite that, there is a lack of knowledge of how the surface modification can change magnetic and dielectric properties of magnetite nanoparticles, especially charge carriers motions and electric energy storage properties. Those, in turn, may contribute to the development of highly sensitive and stable toxic gas sensors [21]. Therefore, this study investigated the influence of magnetite crystallization on spherical and cuboidal nanoparticles and the disordered and oxidized magnetite surface on the behavior of electrons in magnetite nanoparticles. Oxidized magnetite nanoparticles with various γ-Fe2O3 contents and cuboidal shapes were synthesized by the controlled co-precipitation method, and the maghemite presence was determined by Mössbauer spectroscopy. The mechanism of electrical conductivity in magnetite with different shapes as well as surface disordering and oxidation was proposed and discussed.

2. Materials and Methods

2.1. Synthesis of Magnetite Nanoparticles in a Hydrophobic–Hydrophilic Environment

The synthesis of magnetite nanoparticles was performed in a hydrophobic–hydrophilic environment, in which the upper layer was hexadecane, protecting the formed nanoparticles against contact with atmospheric oxygen. First, 20 mmol of FeCl3 (anhydrous) and 10 mmol of FeSO4·7H2O were dissolved in a stock solution with 50 mL of water and 50 mL of hexadecane, respectively. Then, 5 mmol of an organic modifier, i.e., ethylenediamine (en), chloramine T (ClT), or triphenylphosphine (PPh3), was added to the as-prepared solution with constant stirring. It was observed that the PPh3 was dissolved only in the hexadecane layer due to its low solubility in water. Next, the solution was heated up to 328 K in an ultrasonic water bath during a continuous sonication process. Finally, a solution with 80 mL of water and 200 mmol of NaOH was added dropwise to the reaction mixture. The black precipitate was sonicated in a post-reaction solution throughout the process. The powder was collected by filtration, washed twice with water, ethanol, and acetone and then dried at 333 K for 2 h. The obtained samples were marked as Fe3O4–en NPs, Fe3O4–ClT NPs, and Fe3O4–PPh3 NPs, depending on the modifier used for the synthesis. The same synthesis method was used to prepare Fe3O4 NPs without using any additional organic modifier.

2.2. Materials Characterization

The phase purity and crystal structure of the synthesized nanoparticles were described by X-ray diffraction (XRD). The diffractograms were collected using a Rigaku MiniFlex 600 with a copper tube Cu Kα (λ = 0.15406 nm) and a D/teX Ultra silicon strip detector (Rigaku Corporation, Tokyo, Japan). The tube voltage was 40 kV, and the current was 15 mA. The measurements were performed with a step width of 0.02° in the scan range from 10° to 90°. The phase analysis was performed using a dedicated Rigaku PDXL software suite. Fourier-transform infrared (FTIR) spectroscopy was used to determine the presence of organic modifiers on the surface of magnetite nanoparticles and confirm the presence of maghemite on their surface. FTIR spectra were recorded in the infrared transmission mode with a range of 4000–400 cm−1 using a Nicolet 6700/8700 FTIR spectrometer (Thermo Fisher Scientific, Waltham, MA, USA) and the KBr pellet method. The transmission electron microscope (TEM) micrographs of the magnetite nanoparticles deposited on the surface of a copper grid with a carbon film were collected using S/TEM TITAN 80-300 (FEI Company, Eindhoven, The Netherlands). The average nanoparticles size (Dav) was calculated based on the analysis of TEM micrographs. For this purpose, the size of nanoparticles was measured for at least 100 different particles and at least 5 different micrographs. The Dav value was calculated as a mean value. The magnetic properties of magnetite nanoparticles were determined by a Quantum Design VersaLab (Quantum Design, San Diego, CA, USA) cryogen-free vibrating-sample magnetometer (VSM). To determine the presence of an oxidized surface and to confirm the existence of the magnetite structure, the 57Fe Mössbauer spectra (MS) were recorded using the MS96 spectrometer (Tampa, FL, USA) with a 7Co: Rh source (activity ~ 25mCi), the linear arrangement of the 57Co source, absorber and detector and a multichannel analyzer with 1024 channels. A metallic α-Fe foil absorber was used to calibrate velocity and isomer shift. Spectral analysis was performed using WMOSS software (Ion Prisecaru, WMOSS4 Mössbauer Spectral Analysis Software, 2009–2016). Measurements of dielectric spectra (complex permittivity and dielectric losses) and electrical conductivity were performed for compressed samples in the form of discs with a uniform diameter of 10 mm at a compression pressure of 30 bar. Measurements were performed using a Concept 81 dielectric spectrometer equipped with a Novo-cool temperature control system and an Alpha analyzer (Novocontrol, Montabaur, Germany) in the frequency range from 0.01 to 10 MHz and in the temperature range of 173–363 K with ΔT equal to 10 K.

3. Results and Discussion

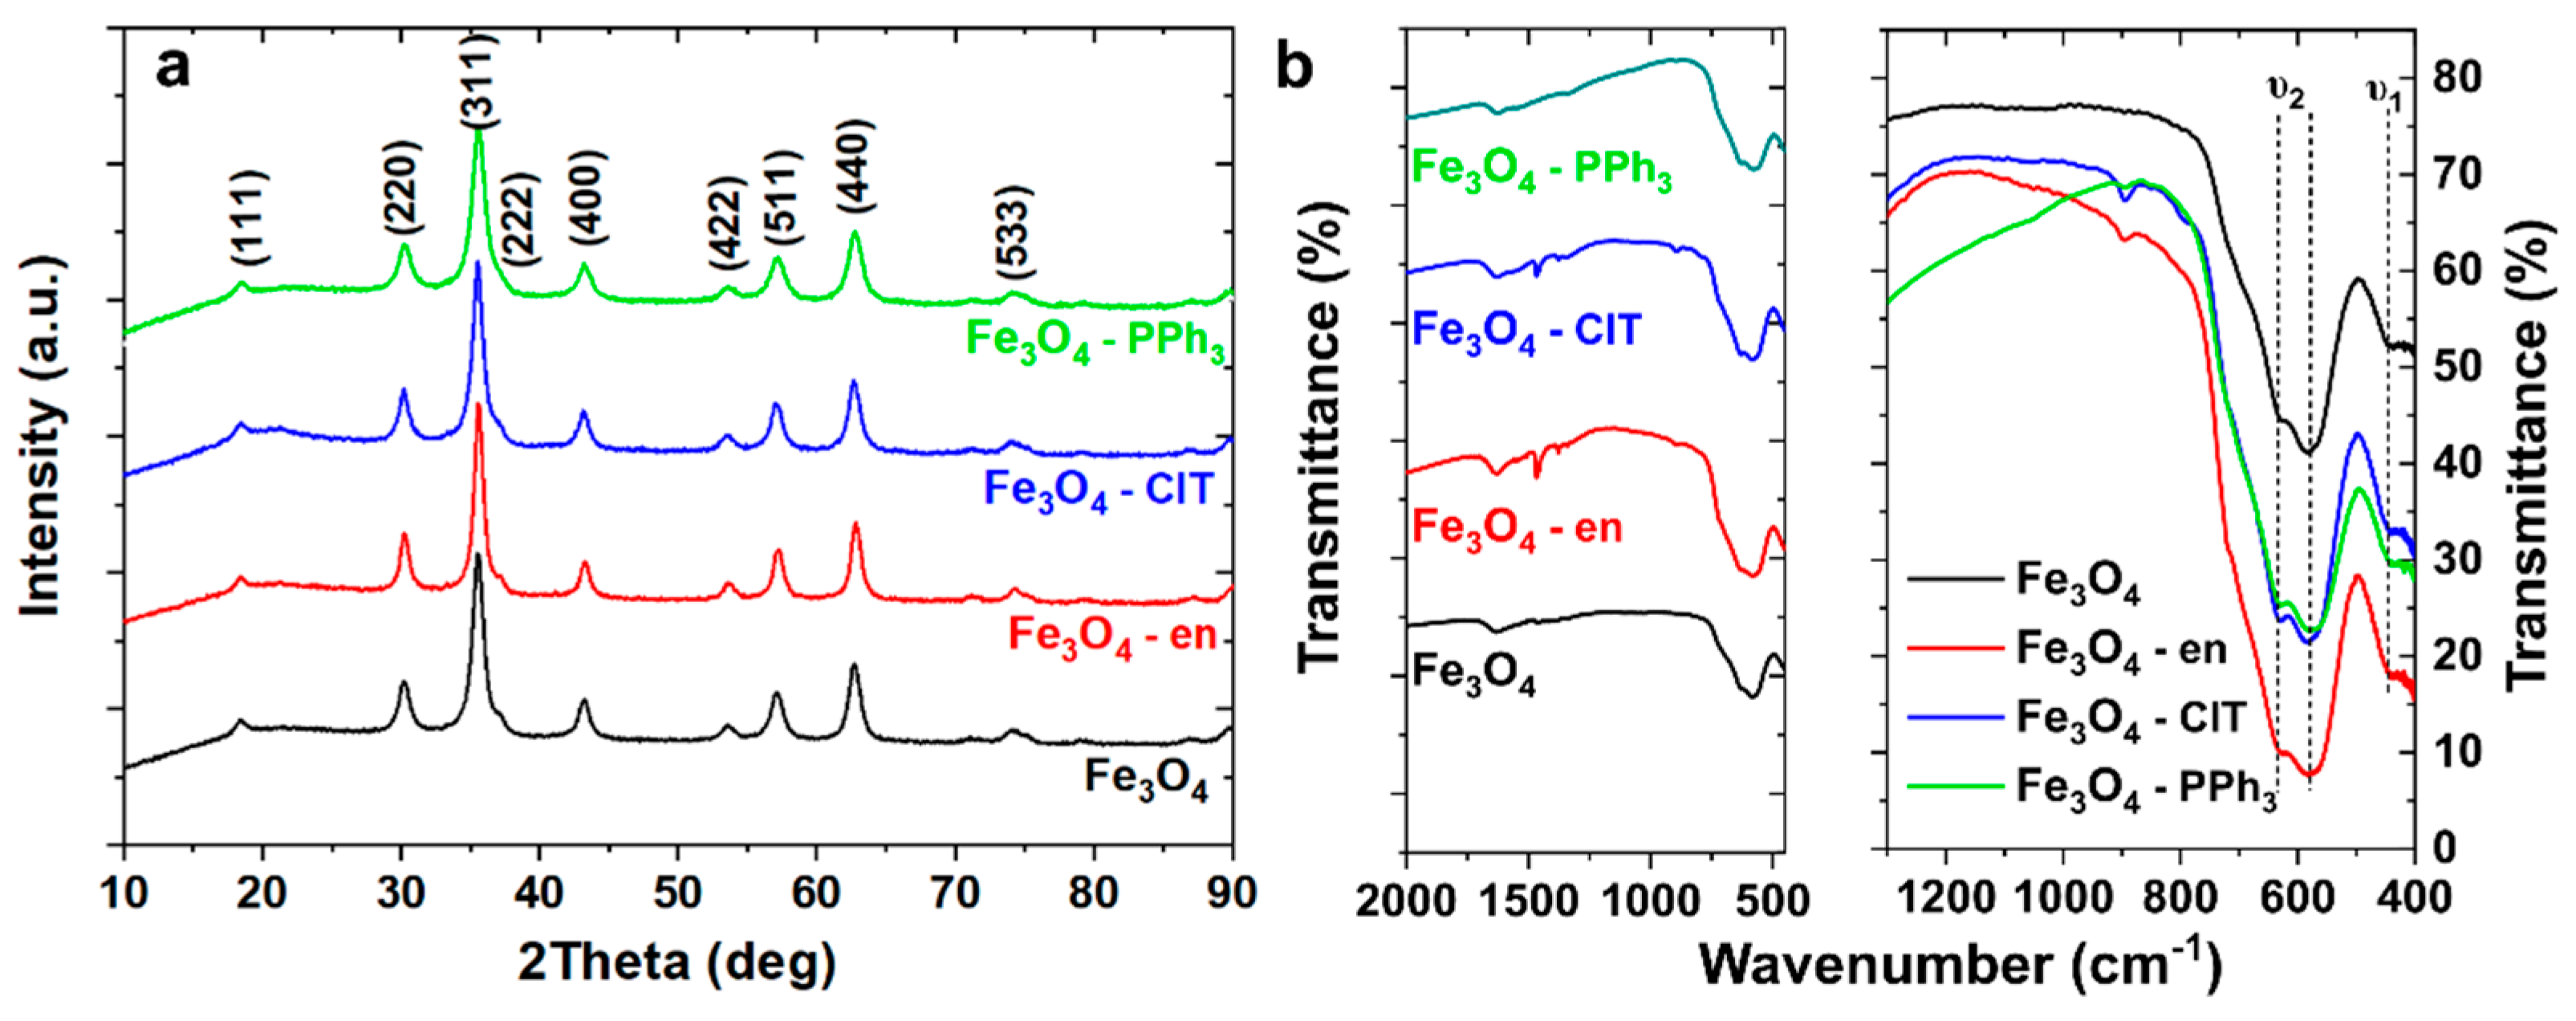
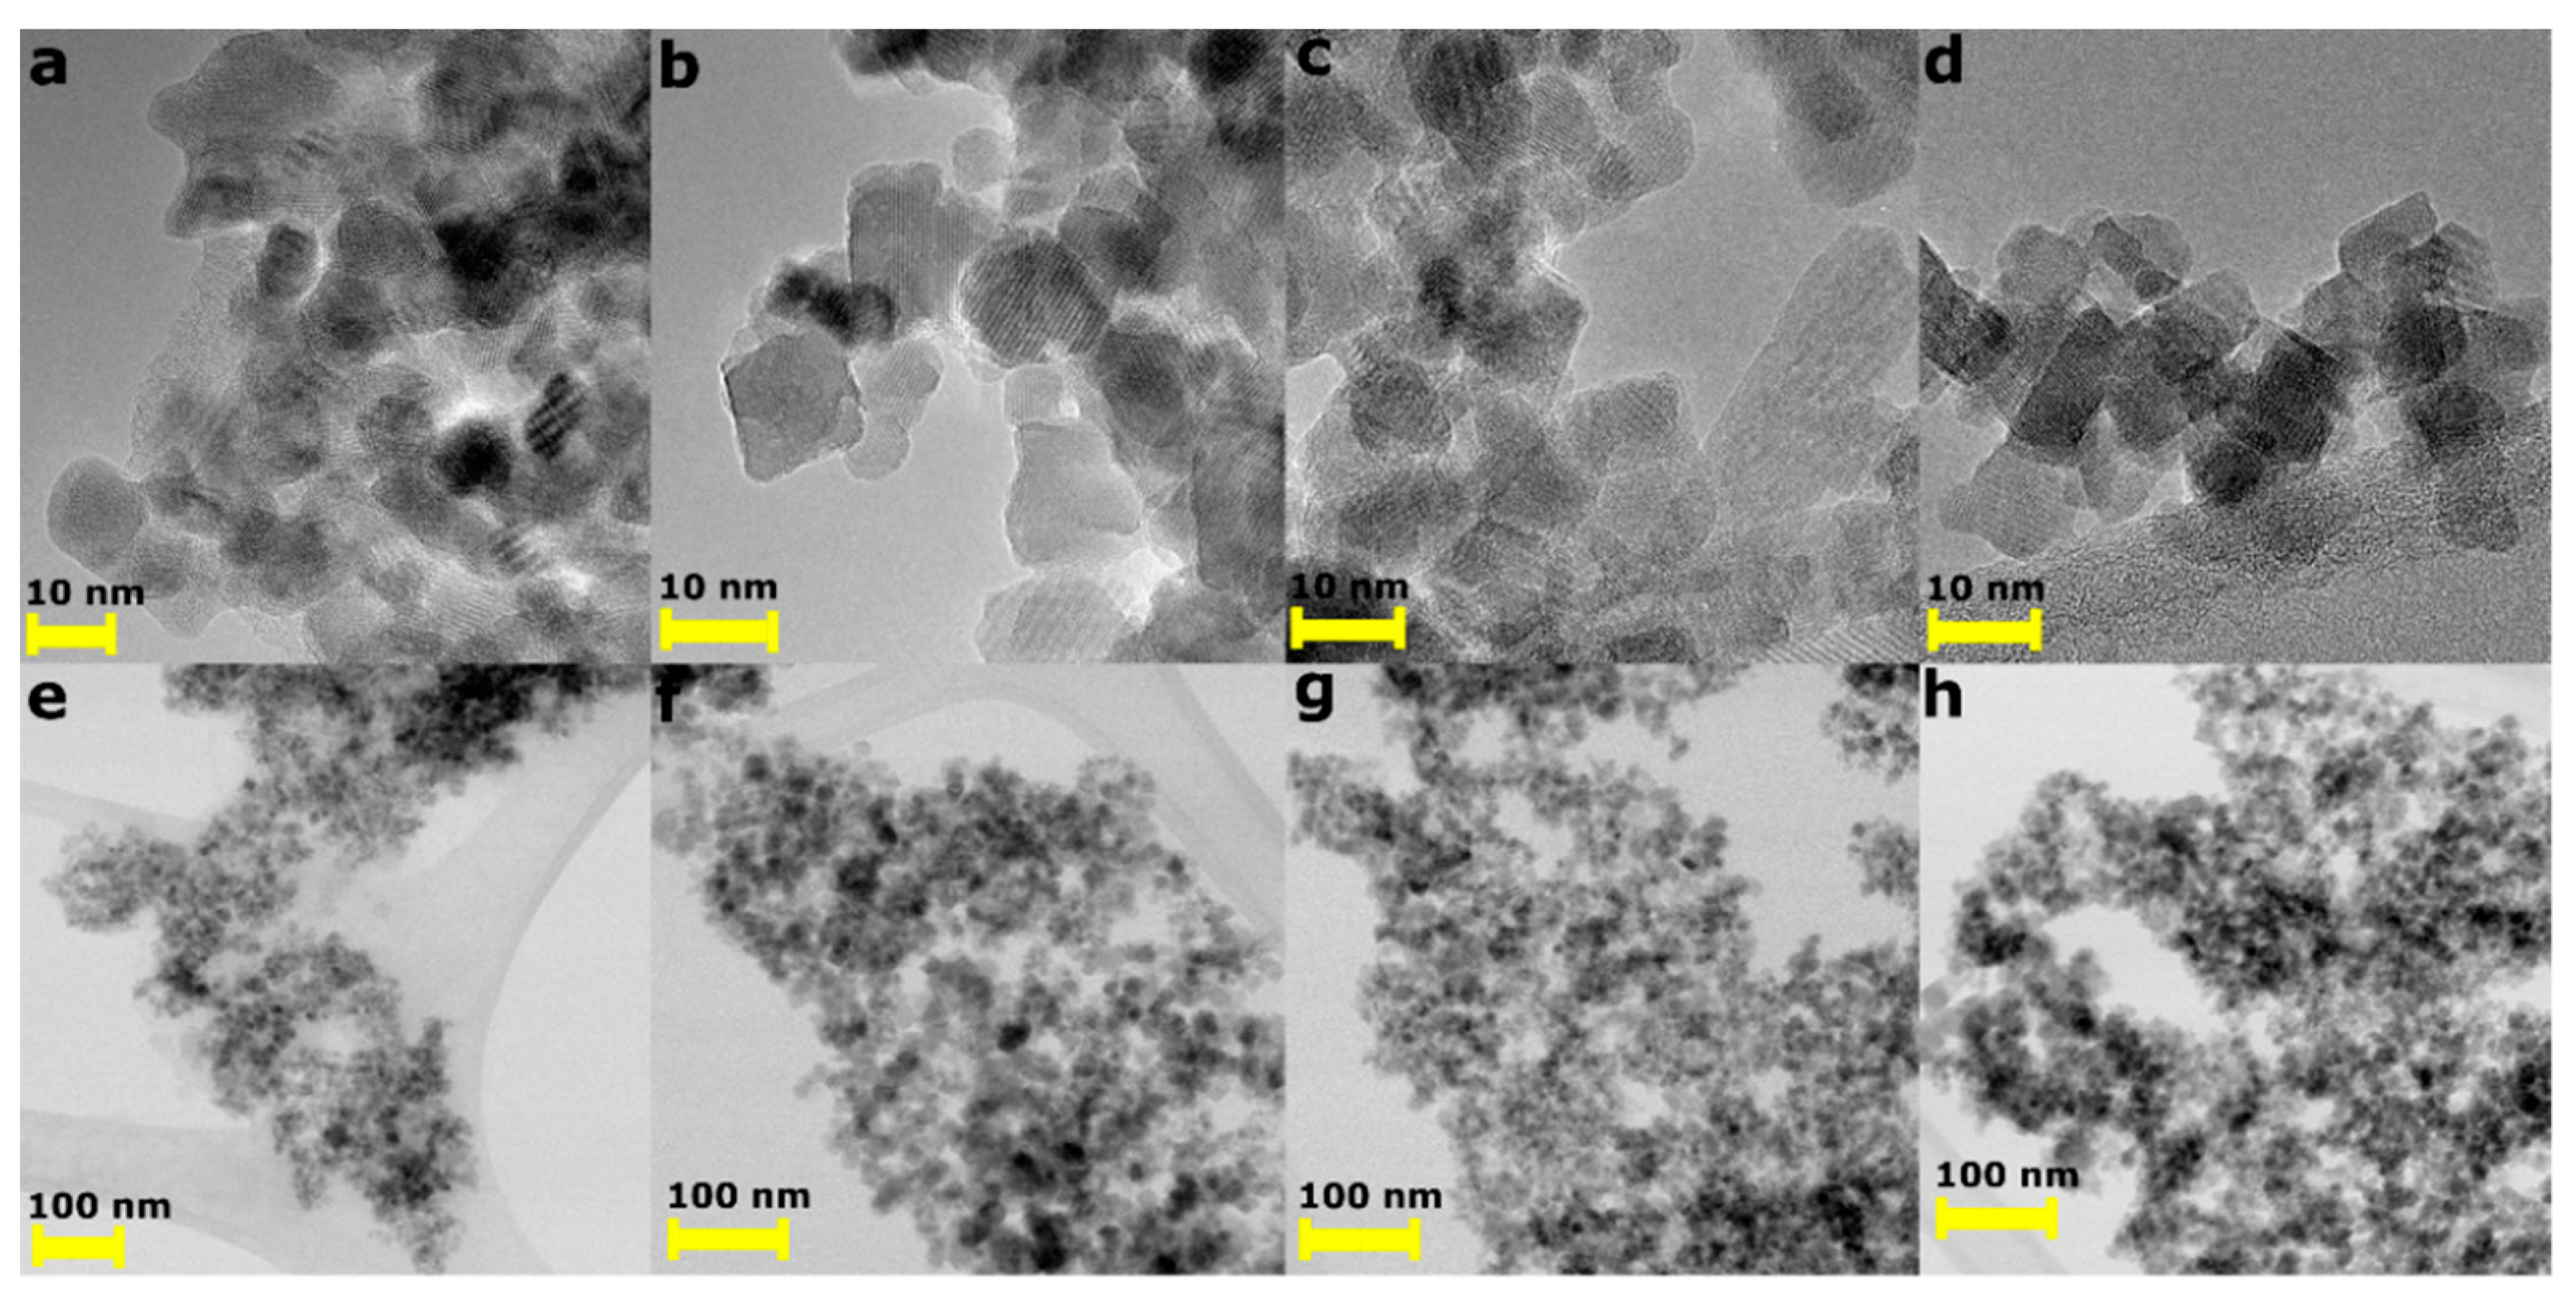
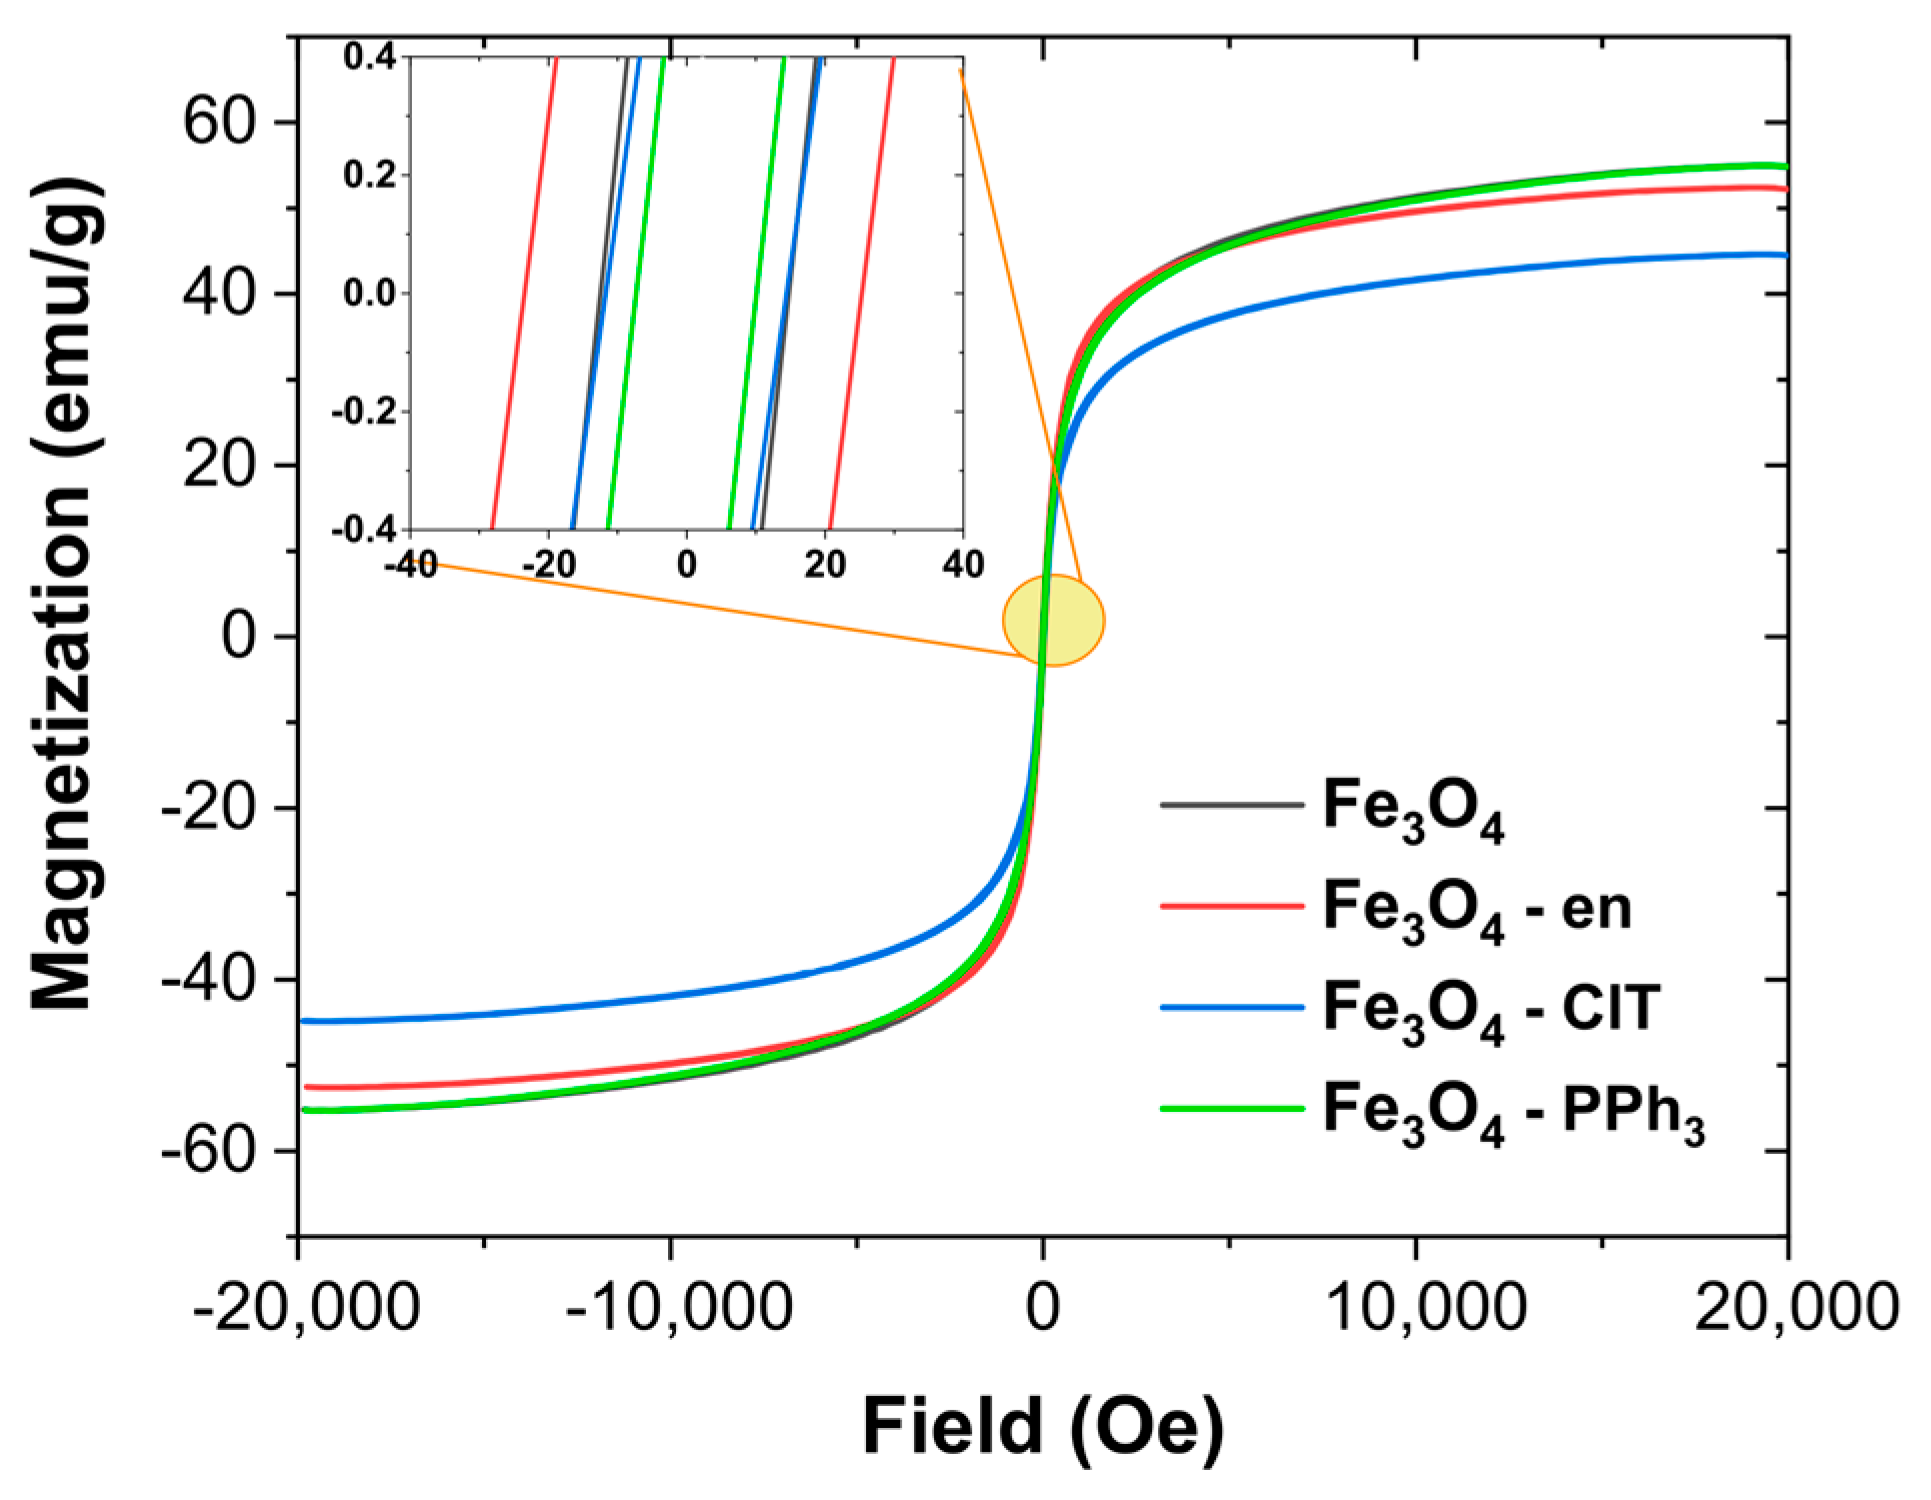
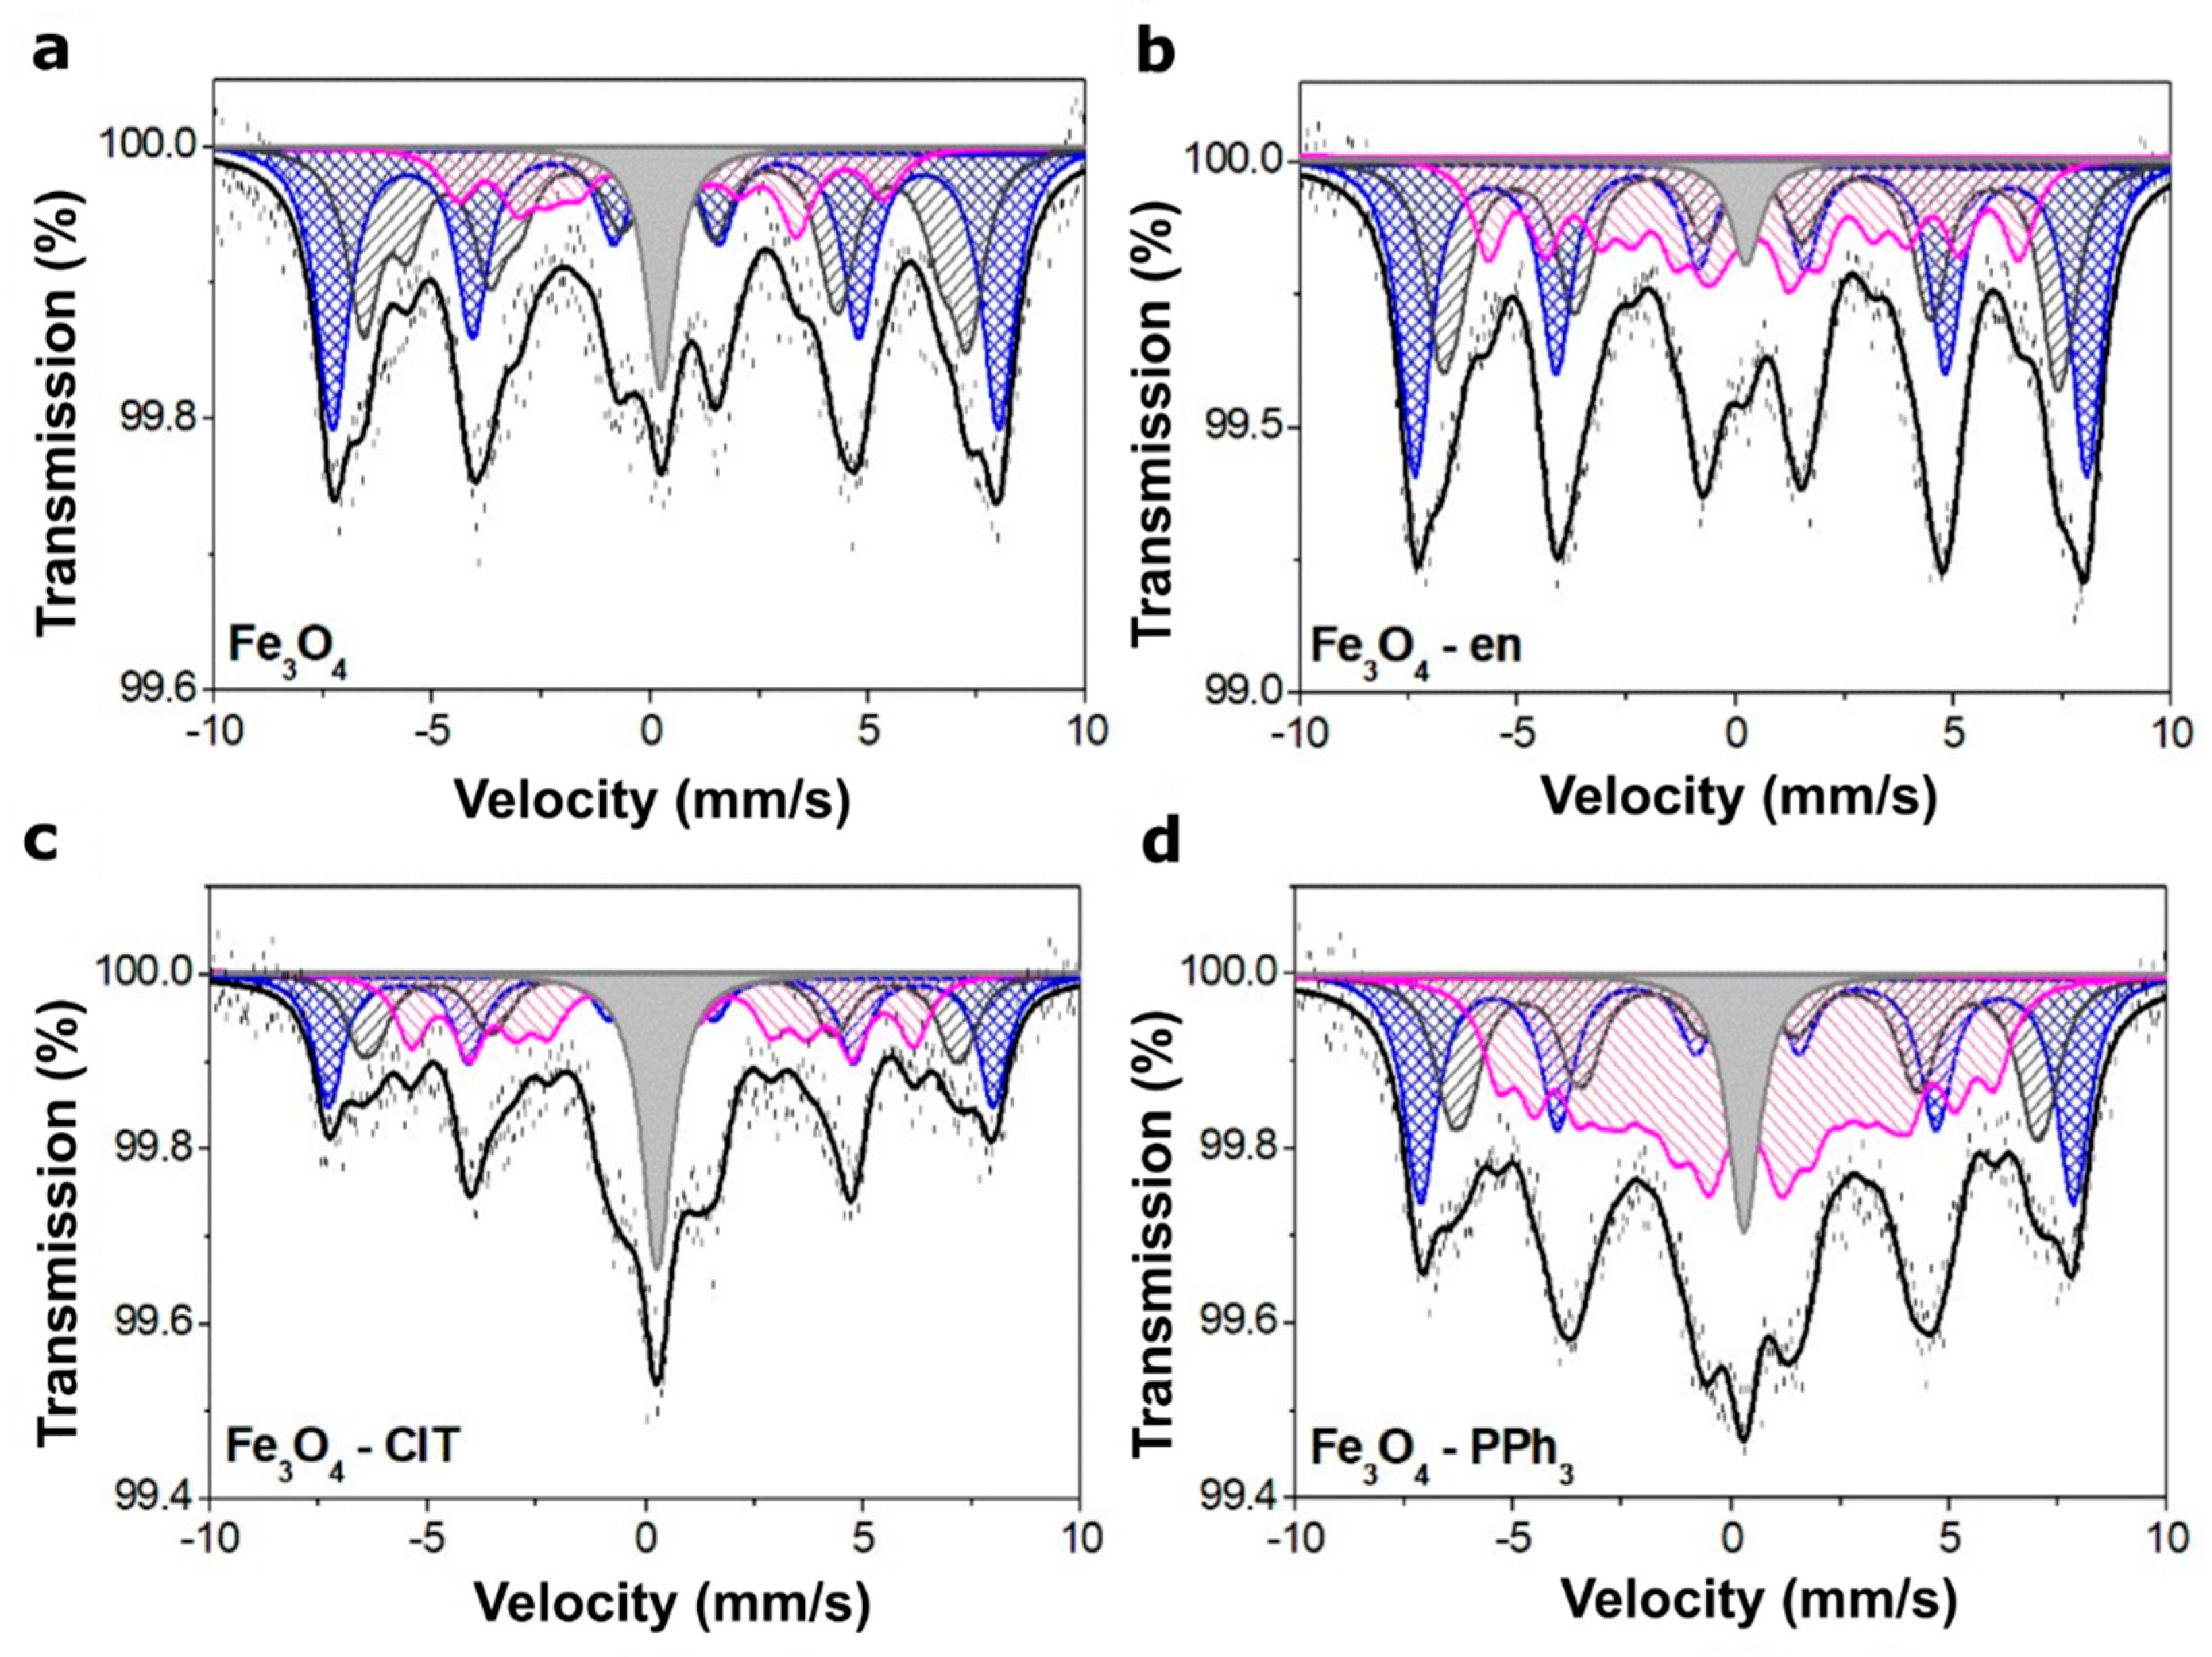
3.1. Structural Analysis and Magnetic Properties of Magnetite Nanoparticles

The XRD patterns recorded for synthesized magnetite nanoparticles using various organic modifiers are shown in Figure 1a. As one can see, all patterns can be very well described using Miller indices characteristic to the magnetite phase (Fd-3m; a = b = c = 0.8375 nm; α = β = γ = 90°). Based on the measured XRD patterns, average crystallite size and intrinsic strain were calculated using the Halder–Wagner method, which was previously used to determine the size of crystallites of magnetite and other ferrites [22,23,24]. Intrinsic strain in nanomaterials is prevalent and can be determined by analyzing the broadening of diffraction peaks. This broadening in nanomaterials is related to the fine size and the existence of strain, which is related to the high concentration of defects such as dislocations, point defects, stacking faults, and grain boundaries [25]. Therefore, strain analysis can provide helpful information on the defects concentration in magnetite nanoparticles. The results of the analysis are presented in Table 1. As can be seen, the use of chloramine T and ethylenediamine resulted in the synthesis of nanoparticles with an average crystallite size (DH-W) equal to or greater than 10 nm, while the lowest DH-W value equal to 8.04 nm was found for nanoparticles synthesized with the use of PPh3. Interestingly, the analysis of intrinsic strain showed that the highest ε value was obtained for nanoparticles synthesized with PPh3 and the lowest value (undetectable) was achieved for nanoparticles synthesized without organic modifiers. The presence of the strain in nanoparticles can be related to the numerous factors such as ultrafine size, different shapes, highly disordered surface, and presence of vacancies [26,27]. To understand these changes in DH-W and ε, the analyses of the FTIR spectra (presented in Figure 1b) and the TEM images (presented in Figure 2) were performed.
The FTIR spectra over a wide range of wavenumbers (left panel in Figure 1b) confirmed that Fe3O4 NPs and Fe3O4–PPh3 NPs were pure in the context of the presence of hexadecane and PPh3. Accordingly, PPh3 molecules only changed the average crystallite size and intrinsic strain in the synthesis step by interacting with the crystallized nanoparticles without spontaneously functionalizing them. In the case of Fe3O4–en NPs and Fe3O4–ClT NPs, the presence of C–H bonds was confirmed in the FTIR spectra. Therefore, both organic modifiers changed the structure and morphology of nanoparticles and functionalize their surface. Probably negatively charged molecules interacted with iron ions and could not be removed even when washing samples [28]. The narrow range of wavenumbers (right panel in Figure 1b) showed the two characteristic vibrations of Fe–O bonds (marked as υ1 and υ2). These vibrations are also listed in Table 1. For bulk magnetite, the υ1 vibrations occurred at much lower wavenumbers (about 375 cm−1); however, for nanoparticles, peak shifts to higher wavenumbers can occur, which is related to the fine size of the particles [29]. The dual nature of the υ2 is related to the oxidized surface in which maghemite is formed. For this phase, vibrational mode with the T2 symmetry occurs, whereas only one vibration mode with T1u symmetry at ±600 cm−1 can be observed for pure magnetite nanoparticles [30].
The analysis of TEM images confirmed that all nanoparticles had an ultrafine size; however, their size distribution was broad (Dav in Table 1). This is characteristic of magnetite nanoparticles synthesized by the co-precipitation method. In this method, it is challenging to control the growth of Fe3O4 and synthesize uniform monodisperse nanoparticles. Moreover, as shown in Figure 2, all nanoparticles were strongly agglomerated, and only the Fe3O4 NPs had a near-spherical shape. Other samples crystallized into cuboidal forms. Moreover, their surface was strongly disordered, which is consistent with the measurements of intrinsic strain. For the Fe3O4–en and Fe3O4–PPh3 nanoparticles, ε was the highest, and after analysis of the TEM micrographs, it can be connected primarily with the highly disordered surface.
As presented above, the structural analysis clearly showed that the average crystallite size, shape, and surface functionalization were different for all synthesized samples. Therefore, their magnetic properties should be different. Interestingly, the DH-W values were similar for all samples (between 8.04 and 11.8 nm). Therefore, the changes in magnetic behavior could be related mainly to differences in the surface of nanoparticles. The recorded VSM curves are shown in Figure 3, and the parameters obtained from the curves, i.e., saturation magnetization (Ms), remanence (Mr), coercivity (Hc), and Mr/Ms ratio, are summarized in Table 2. It can be noticed that Fe3O4 NPs and Fe3O4–PPh3 NPs had similar magnetic properties, especially the Ms value. For nanoparticles synthesized using PPh3, the Mr and Hc values were lower than for nanoparticles synthesized without organic modifiers, which confirmed that PPh3 plays a crucial role in synthesizing Fe3O4 NPs with good superparamagnetic properties. Lower Ms values were recorded for nanoparticles synthesized in the presence of ClT and en. For Fe3O4–ClT NPs, Hc was much slower than for Fe3O4–en NPs, but the Ms value was only 44.75 emu/g, which is probably related to the presence of a highly oxidized surface.
The analysis of Mössbauer spectra (MS) can provide very useful information on the oxidation of a magnetite surface. The same analysis cannot be performed with the XRD and TEM methods because of minor differences between the maghemite and magnetite unit cell parameters. To confirm the presence of maghemite on the surface of magnetite nanoparticles, the MS at room temperature were recorded for all samples and are presented in Figure 4. These spectra revealed asymmetrical six-line patterns with broad lines and were fitted using five to seven magnetic sextets and one single line. In turn, the obtained hyperfine parameters are summarized in Table 3. The full line widths at half maximum for all components were equal to 0.85 mm/s. The observed broad line width of the sextets confirmed the superparamagnetic size of the magnetite nanoparticles.
Note maghemite is cation-deficient spinel with Fe3+ on both the octahedral and tetrahedral sites. The contribution from Fe3+ on both sites of magnetically ordered maghemite led to the MS consisting of two sextets with similar hyperfine magnetic fields, essentially zero quadrupole splitting and isomer shifts characteristic for Fe3+ in tetrahedral and octahedral coordination. However, room-temperature MS of maghemite appeared as a single sextet (S1), which is evident since the contributions from Fe3+ ions at both sites of the maghemite spinel structure had close values. Sextets S2 and S3 represented iron ions located in the tetrahedral and octahedral sites in the Fe3O4 structure, respectively. Broader lines and smaller hyperfine fields can be a result of some non-stoichiometric of the crystals.
The MS of bulk magnetite is different than for nanoparticles, which is associated with a high contribution from the surface of nanoparticles, which is very important at the nanoscale and cannot be neglected. Furthermore, in the case of nanoparticles, much more sextets can be observed. Some are related to the maghemite formation on the magnetite surface, and others are associated to the external region and the transition layer between the external and internal regions. In the external region, Fe3+ ions are characterized by different magnetic properties due to the lack of adjacent ions and a new type of bond with organic molecules. Furthermore, Fe3+ ions are surrounded by two different types of ions in the transition layer from the core and the surface. Consequently, their properties are also different from the ions in the core of the nanoparticles. In all patterns, one can see these sextets marked in Table 3 as S4, S5, S6 and S7. The existence of these sextets has also been confirmed and described recently [11,31].
All spectra also contained a single line (L). As can be seen, the contribution from the L component was the highest for nanoparticles synthesized using ClT and those from Fe3O4 and Fe3O4–PPh3 NPs were the same. This component could arise from the cation vacancies and some superparamagnetic fine particles with no magnetic hyperfine splitting due to a lack of proper magnetic interactions. On the other hand, the analysis of the S1 sextets allowed us to state that the highest content of the oxidized layered had magnetite synthesized without any modifiers and Fe3O4–en NPs. The lowest contribution from γ-Fe2O3 was noted for Fe3O4–ClT and Fe3O4–PPh3 NPs. However, the high contribution from the single line suggests other non-magnetic particles in the sample synthesized in the presence of ClT.

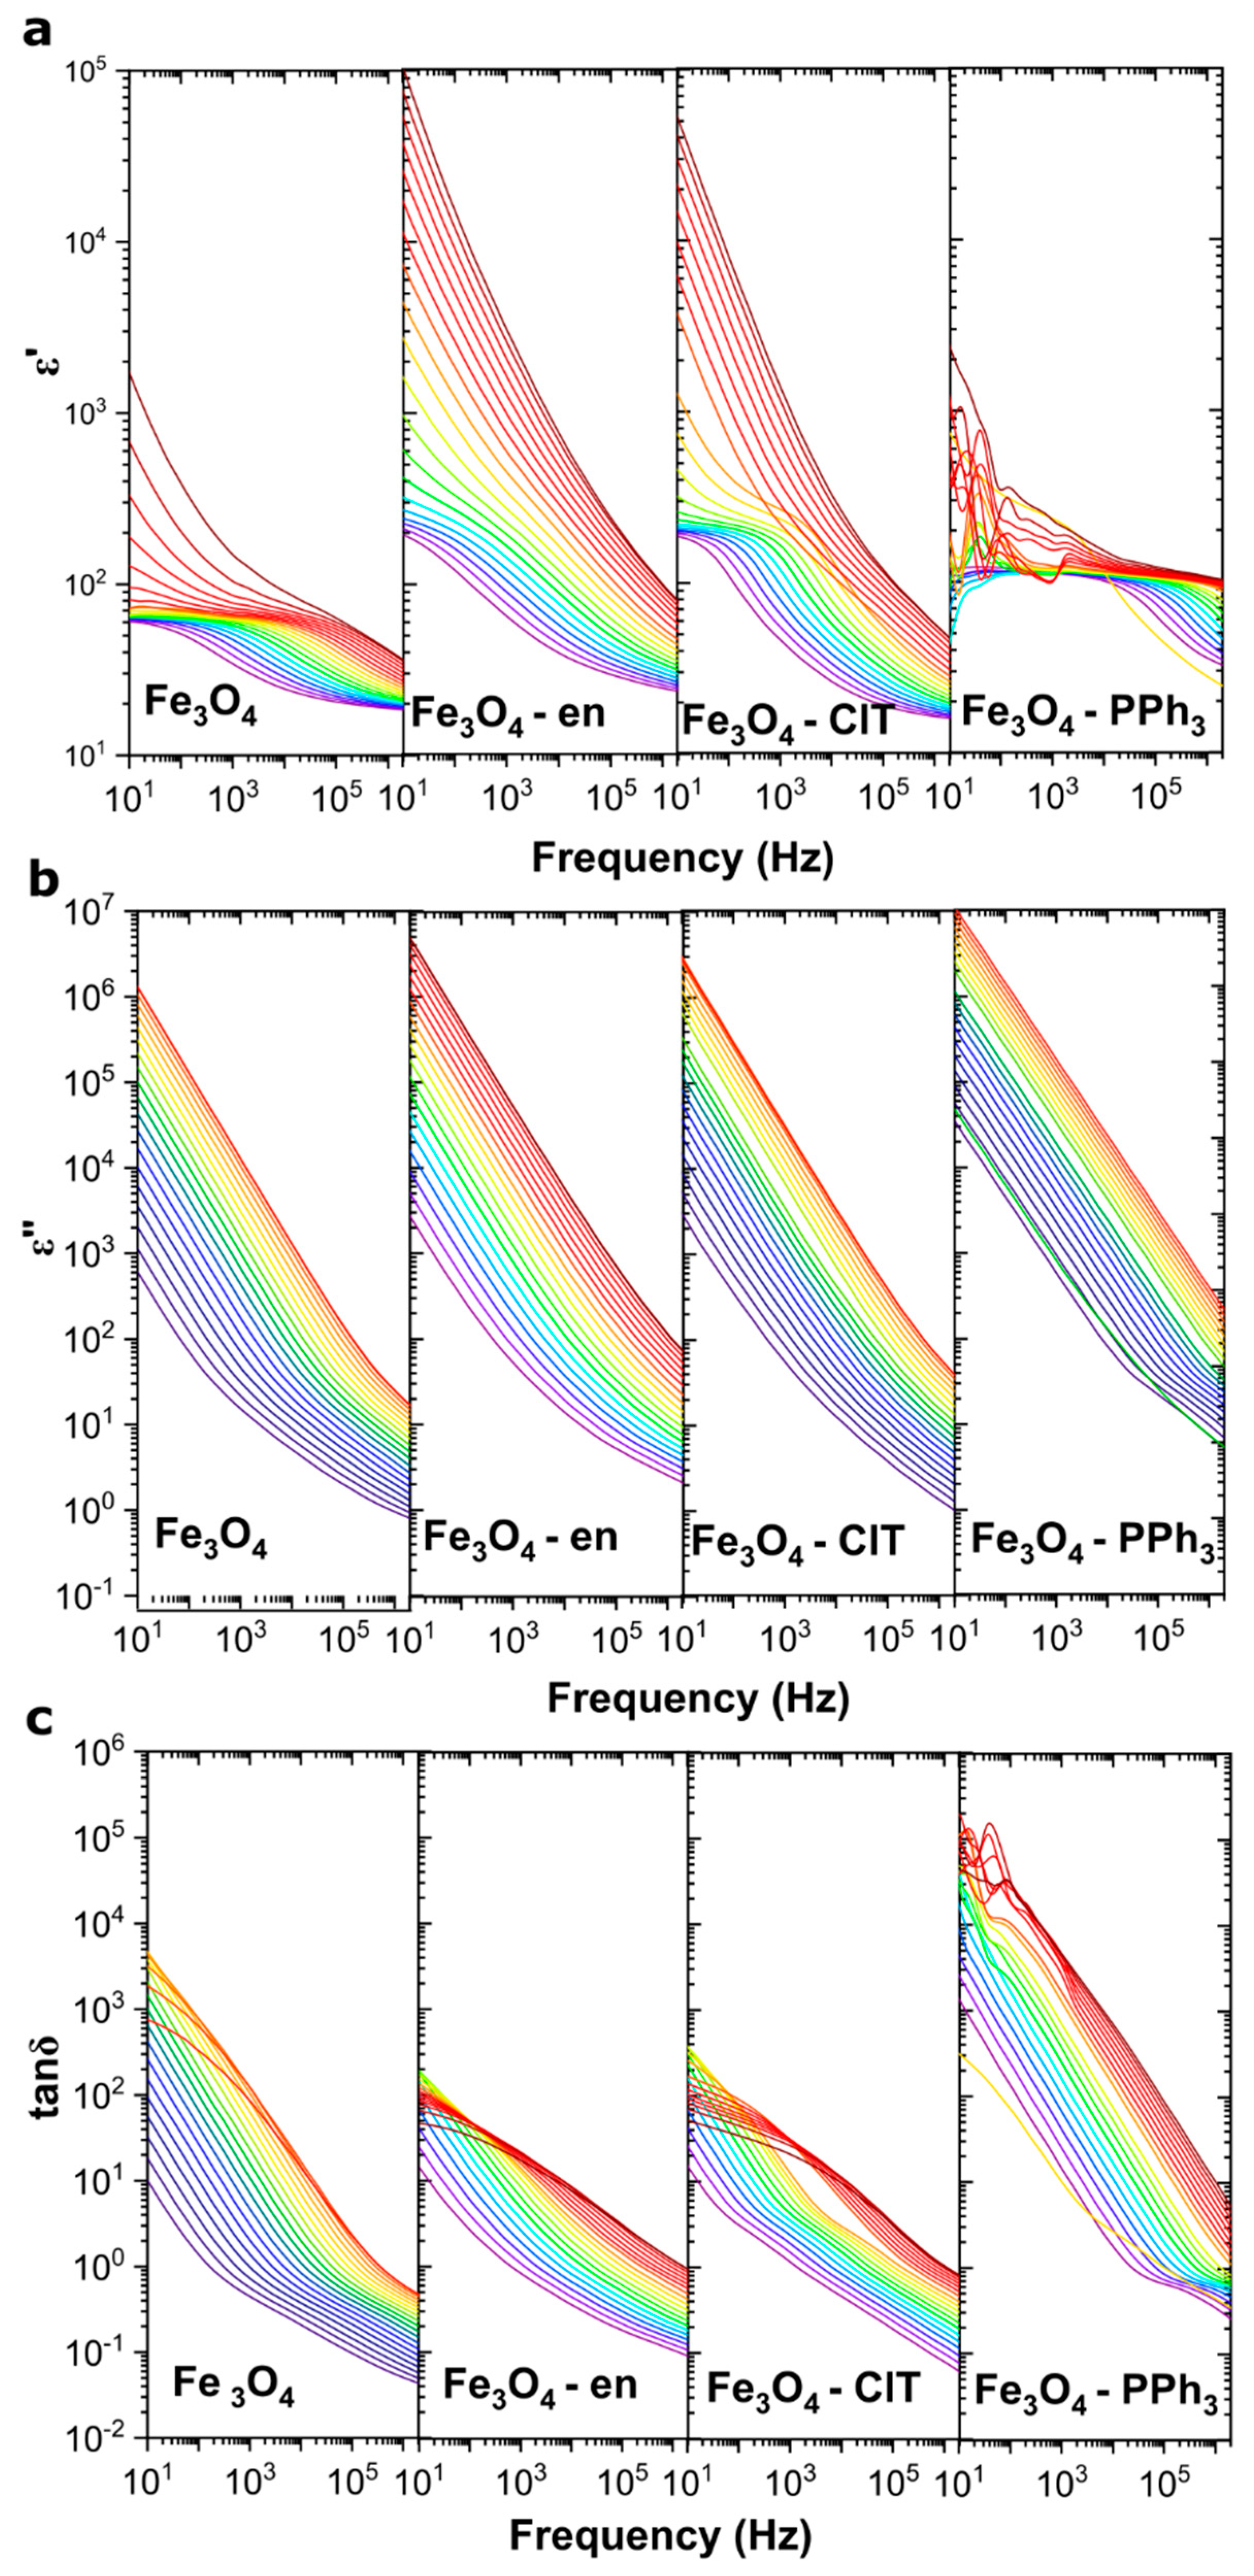
3.2. Dielectric Properties of Magnetite Nanoparticles with Different Sizes, Shapes, and Maghemite Contents

For all the synthesized samples, the dielectric properties of Fe3O4@γ-Fe2O3 nanoparticles with a core–shell structure were measured as a function of frequency and temperature. The obtained dielectric spectra, i.e., the real and imaginary parts of electric permittivity and the loss tangent, are presented in Figure 5. Complex electric permittivity ε* can be expressed as ε′ + ″, and the loss factor tanδ can be described as the ratio of ε″/ε′. ε* was measured by the dielectric spectroscopy indirectly by measuring complex capacitance C* and calculated by Equation (1) [32,33]:
C* = ε*ε0A/h,
where ε0 is the vacuum permittivity (8.85 × 10⁻¹² As/(V·m)), A is the surface area, and h is the height of the measured sample.
In Figure 5, the electrical permittivity characteristics for various ferrites are shown. At low frequencies (10 Hz) and low temperatures, it is possible to determine the plateau region (in which ε′ was nearly frequency-independent and can be marked as εconst) for magnetite nanoparticles containing high γ-Fe2O3 content. The εconst for Fe3O4 NPs was equal to 61, that for Fe3O4–en NPs was 192, and that for Fe3O4–ClT NPs was 185, all of which increased with increasing temperature. For Fe3O4–PPh3 NPs, it is impossible to study the low-frequency ε′, especially in high-temperature regions. It is known, from the structural analysis, that these nanoparticles were cuboidal and had relatively low maghemite content.
The presence of the plateau region and the ε′ dispersion in the high-frequency range is associated with the Maxwell–Wagner polarization, which is characteristic of inhomogeneous samples, such as highly conductive particles covered with a resistive surface. The analysis of only the low-frequency region can allow observing that the polarization phenomenon in these nanoparticles is related to the interfacial polarization [34]. As the temperature rises, much more charge carriers accumulate on the surface of the particles, and this polarization is clearly visible. Interestingly, at high temperatures, the role of the magnetite shape, maghemite content, presence of organic molecules, cations vacancies, and surface disordering is very important. For example, at 353 K and 10 Hz, ε′ for spherically shaped Fe3O4 NPs was equal to 329, whereas that for cuboidally shaped Fe3O4–en NPs was 53,409. Accordingly, the accumulation of electrons increased with the introduction of the maghemite layer onto the magnetite surface and by crystallizing nanoparticles into cuboidal particles with a highly disordered surface.
Interestingly, for Fe3O4–PPh3 NPs with a low γ-Fe2O3 content, the possibility of the electrons accumulation on the surface of the particles was negligible. In the low-frequency region, only the fluctuation of ε′ can be observed, which is related to the high mobility of electrons and high conductivity in this sample, which will be discussed later. The question is: why does the change of shape and surface chemical composition increase the ε′ value so drastically? When analyzing this type of nanoparticles, it can be seen that the low-frequency electron transport did not occur from the surface of one nanoparticle to the surface of the second one, but through the disordered γ-Fe2O3 layer. Accordingly, the accumulation of charge carriers occurred on highly defected, more resistive γ-Fe2O3 surfaces containing many different defects such as iron vacancies and dislocations [4,14].
The real part of the permittivity is related to the degree of polarization, while the imaginary one provides information about dielectric losses. The ε″(f) behavior for a wide temperature range from 173 to 363 K is shown in Figure 5b. As can be seen, ε″ values are similar for all samples; however, in the low-temperature range, much higher values were observed for the Fe3O4–PPh3 sample. The analysis of dielectric losses can be carried out in the context of the loss tangent, which can represent the energy dissipation in the material under the influence of an applied AC electromagnetic field and for various applications such as supercapacitors should be minimized [35]. In general, increasing the defect density results in higher tanδ values, which have been confirmed in the literature [36]. These defects can be related to the presence of impurities and any imperfections in the crystalline structure.
Interestingly, tanδ did not depend on the maghemite concentration but is closely related to the average crystallite size. Higher dielectric losses were observed for nanoparticles with DH-W equal to 8.04 nm (Fe3O4–PPh3) and the lowest was identified for Fe3O4–en NPs with an average crystallite size equal to 11.8 nm. Thus, the storage properties were strongly related to the disordering and oxidation of the magnetite surface and their dissipation properties with their size.

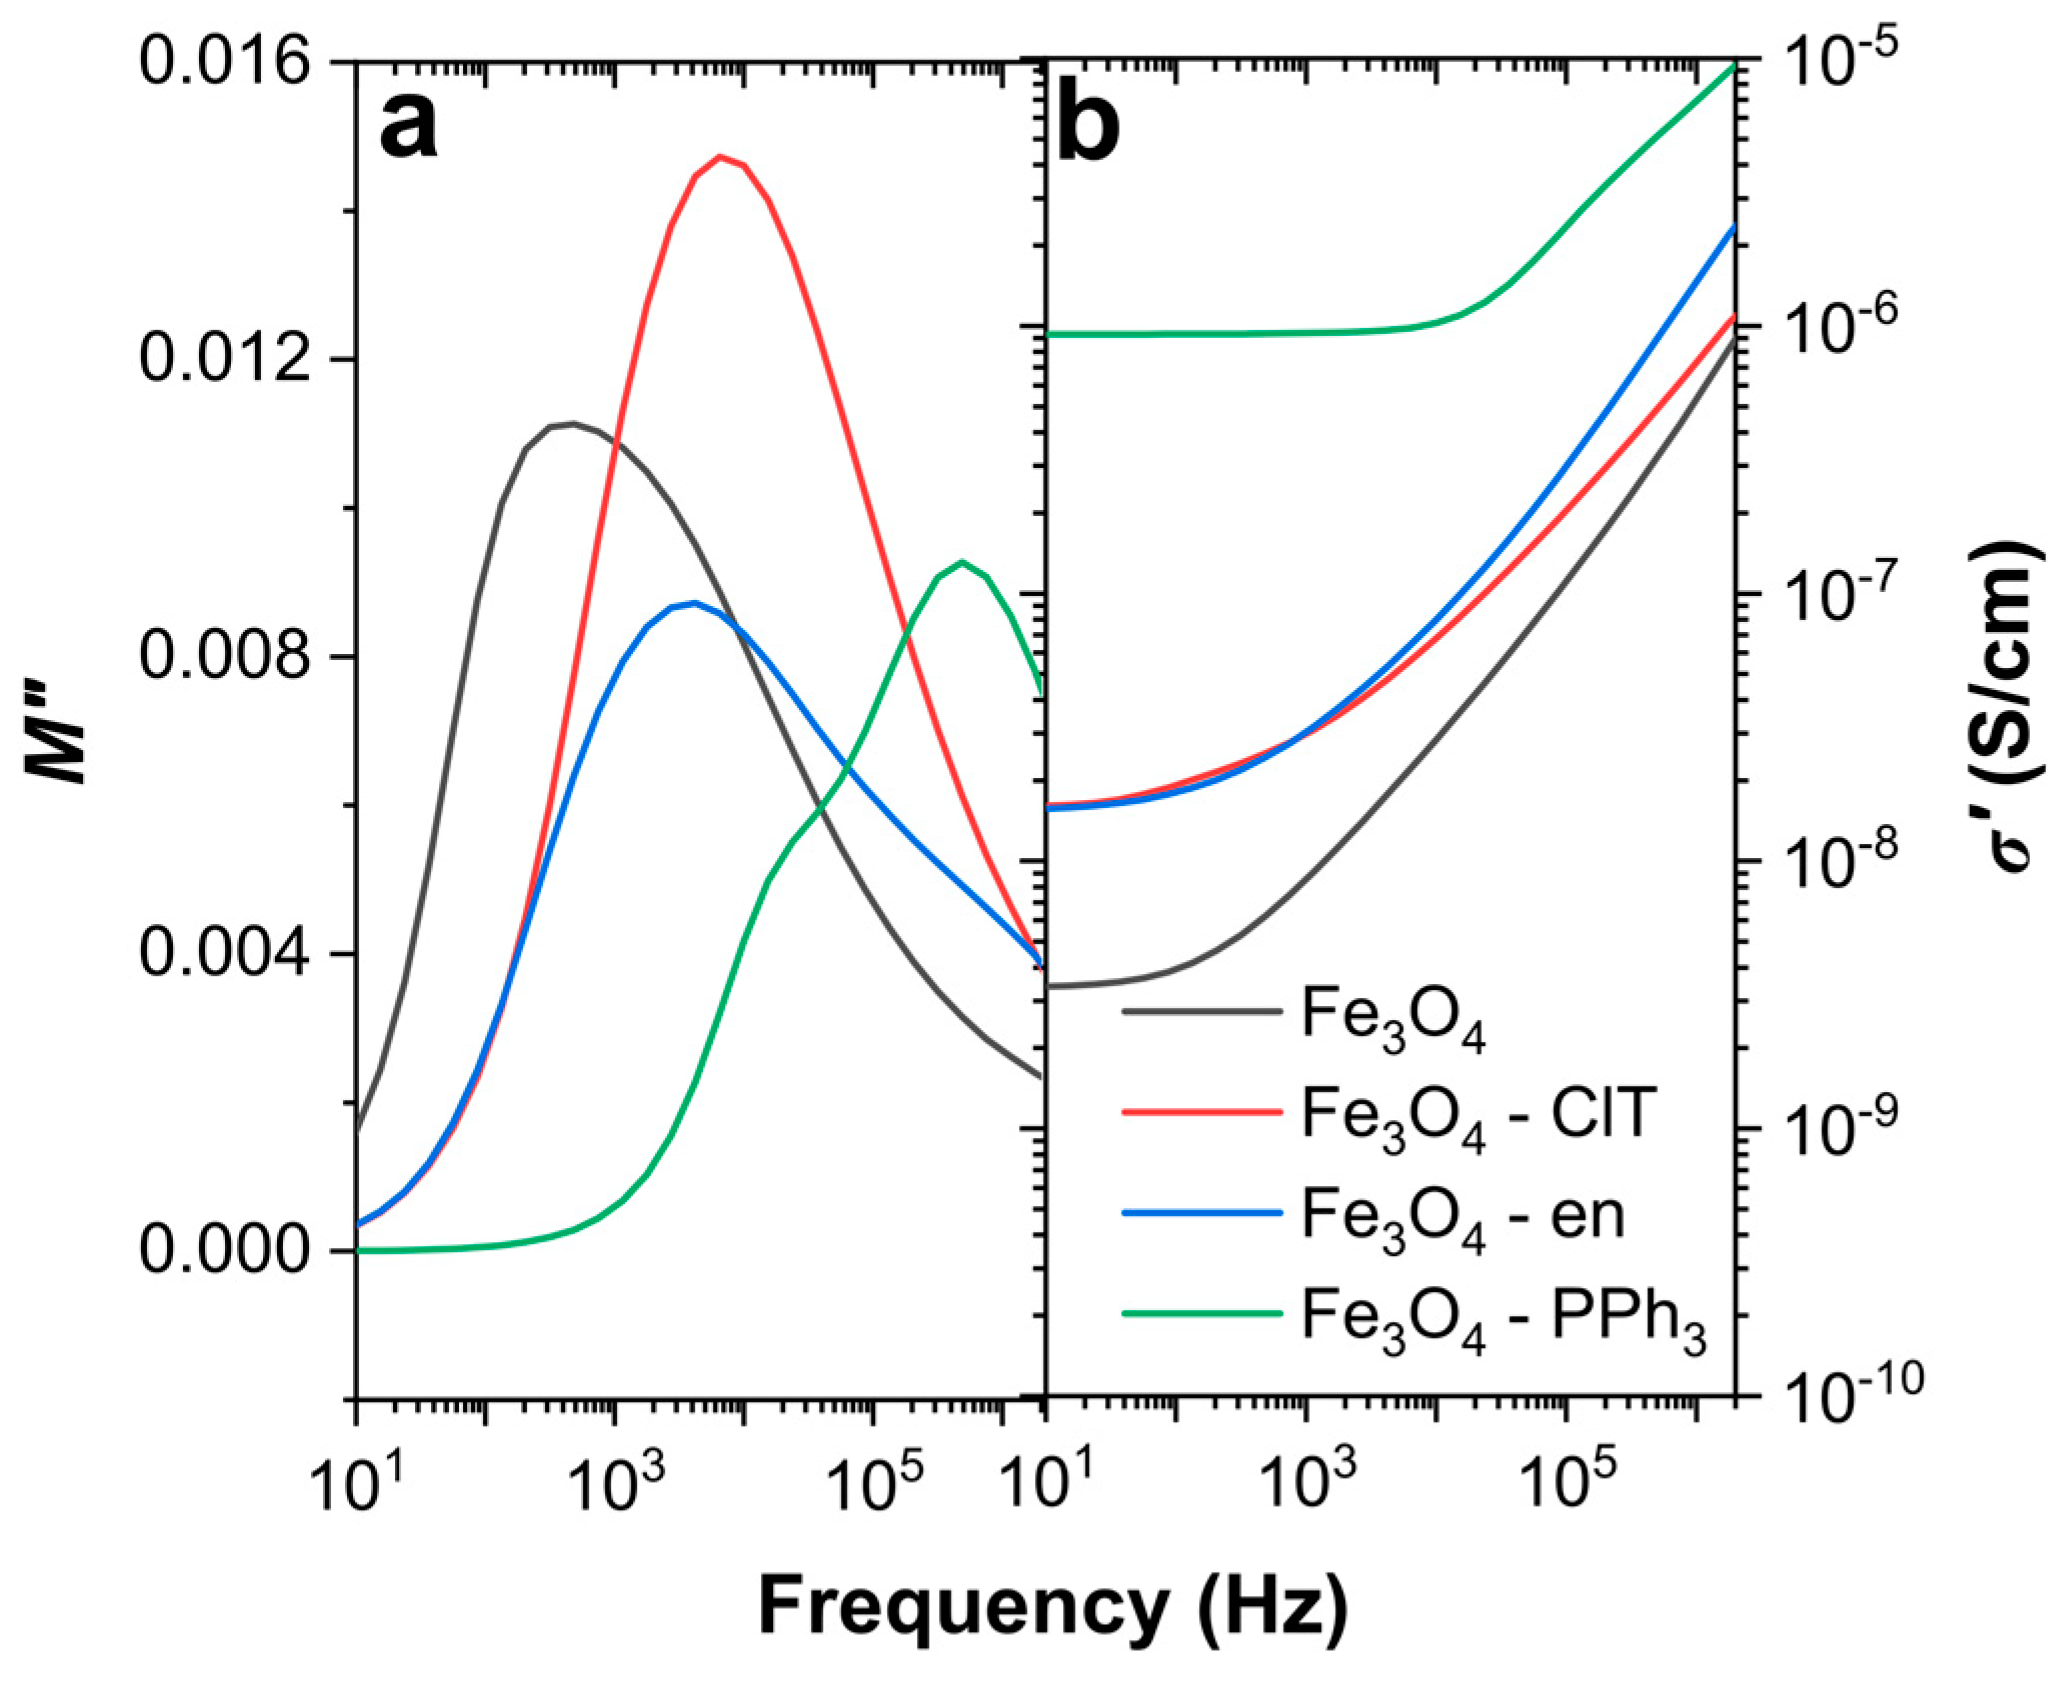
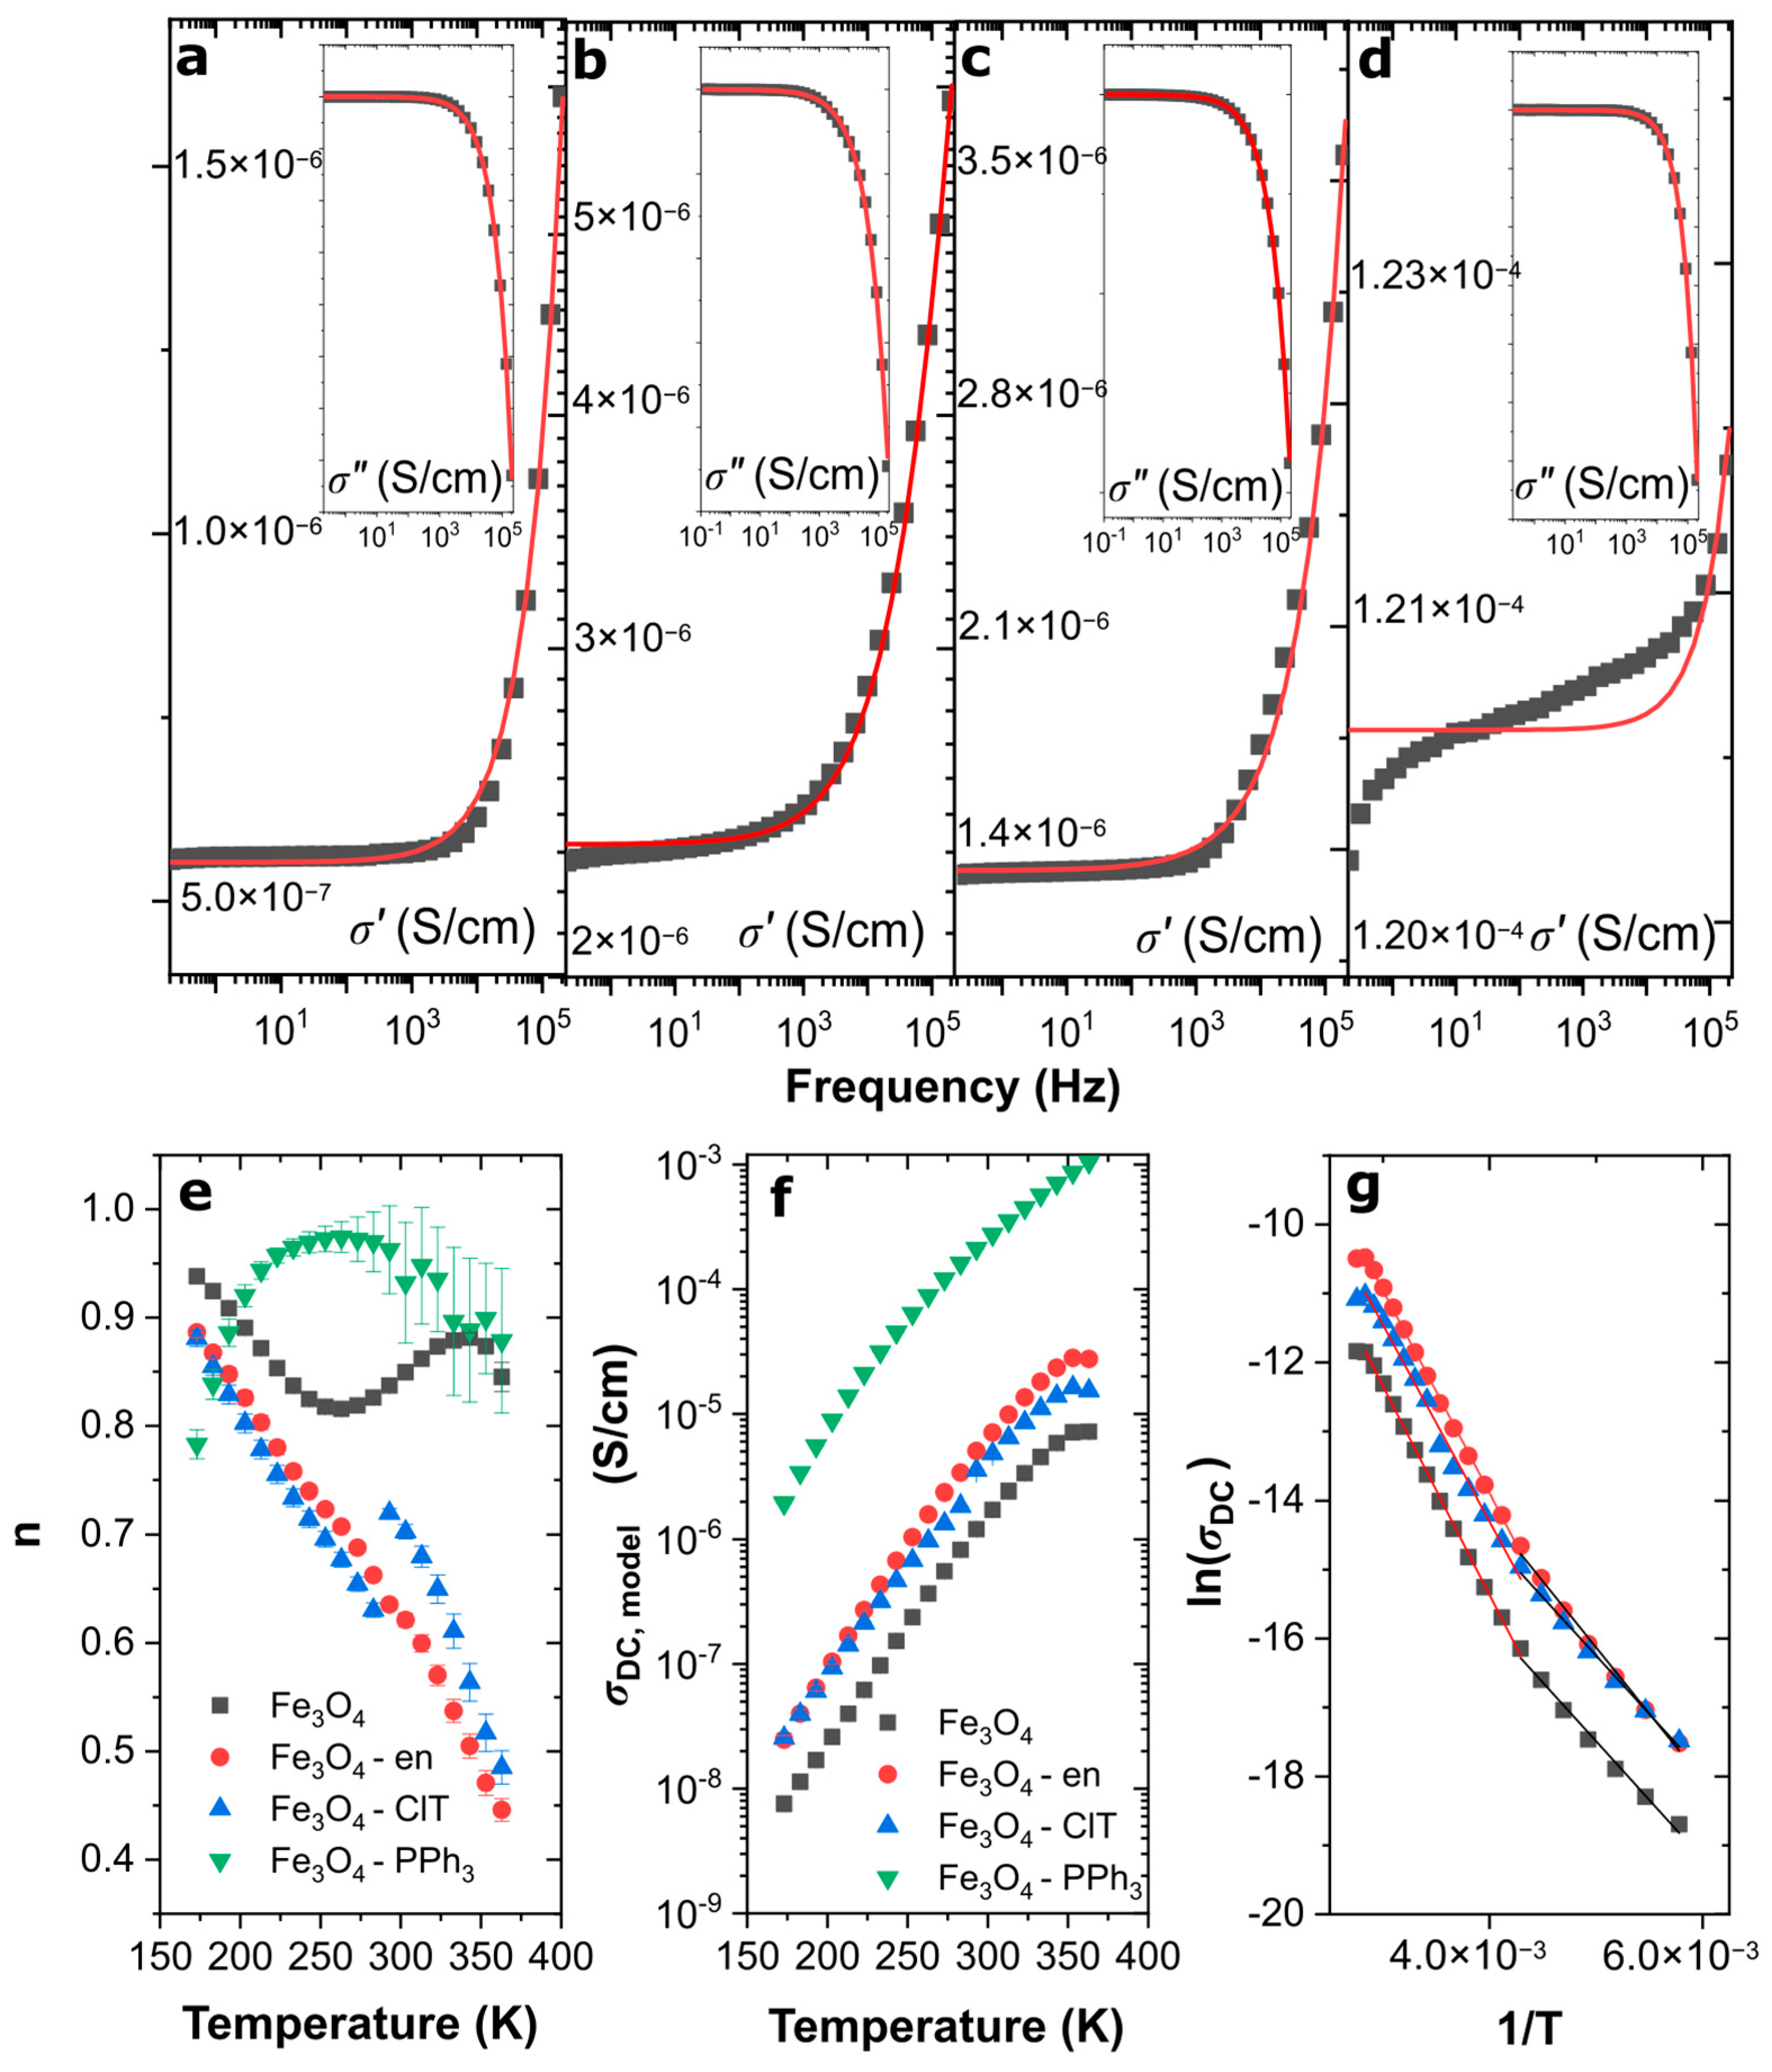
3.3. Electrical Conductivity of Magnetite Nanoparticles

The electrical conductivity of magnetite nanoparticles with a modified surface and shape was determined based on measurements of complex electrical conductivity and complex dielectric modulus. The electrical conductivity σ* is related to the electrical permittivity according to Equation (2), and the complex dielectric modulus (M*) is given by Equation (3) [33,37]:
σ* = σ′ − ″ = i2πfε0ε*,
M* = M′ − iM″ = 1/ε*.
The analysis of complex electrical conductivity can provide information about the lag in the movements of charge carriers associated with rapid changes of the electric field and information about their movement, type of electrical conductivity mechanism, and even DC conductivity. The complex dielectric modulus can be used to determine the number of electric processes in materials and the relaxation time of the transition between long- and short-range charge carriers motions (especially in heterogeneous systems) [38]. The imaginary part of the dielectric modulus M″, together with the real part of electrical conductivity σ′, is presented in Figure 6. As can be seen, both M″ and σ′ were different for all synthesized nanoparticles. The most visible changes can be observed for the electrical conductivity of Fe3O4 NPs and Fe3O4–PPh3 NPs. The σ′ value at the low-frequency region was a few orders higher for nanoparticles synthesized in the presence of PPh3. These nanoparticles were characterized by the low concentration of the maghemite phase, cuboidal shape, and the surface free from organic modifiers. The low-frequency electrical conductivities of Fe3O4–en and Fe3O4–ClT NPs were similar and higher than that of pure Fe3O4 NPs. It is well-known that low-frequency conductivity is closely related to the slow movement of charge carriers through the particle surface and high frequency to the movement of charge carriers in particles. The transition between these processes can be determined based on the analysis of the M″ peak [16]. The presence of an oxidized and disordered surface, organic modifiers, and different shapes drastically change the electrical properties, especially in the low-frequency region, where the surface plays a crucial role in the movement of charge carriers. Accordingly, the oxidized surface of Fe3O4–en NPs and the additional presence of non-magnetic ultrafine particles in Fe3O4–ClT NPs caused a decrease in the electrical conductivity in the low-frequency region compared to in spherically shaped Fe3O4–PPh3 NPs. The conductivity of the pure Fe3O4 NPs was the lowest and related to their spherical shape and the highest maghemite content. In addition, the shapes and maximum positions of the M″ peak were different for all nanoparticles and were related to the oxidation and functionalization of their surface. The dual nature of the M″ peak was visible for Fe3O4–PPh3 NPs, for which the content of the maghemite phase was relatively low. According to previous studies [11], the high-frequency peak is related to the movements of electrons in the magnetite, while the visible shoulder to their movements in the maghemite. For cuboidal Fe3O4–ClT NPs containing especially non-magnetic particles, the dual nature of the peak cannot be observed, but for other samples, the presence of broad peaks was related to the overlapping of these two electrical processes.
The modified universal power law (Equation (4)) was used to determine the mechanism of electrical conductivity that occurs in the magnetite nanoparticles with an oxidized and disordered surface. This model, unlike the universal power law, can be used to fit the real and imaginary parts of a complex conductivity simultaneously [17]:
σ* = σDC + A1ωniA2ωn,
where σDC is the DC conductivity, A1 and A2 preexponential factors, and n is the exponent, which can be used to determine the electrical conductivity mechanism.
The applicability of this model has recently been validated for magnetite nanoparticles and allowed for a better fit of the theoretical model to the experimental data. The simultaneous fitting of the real and imaginary parts of the electrical conductivity can result in different n(T) behaviors that can be used to describe the high-frequency behavior. Therefore, this approach should also allow for an accurate and comprehensive analysis of the behavior of the electrons in oxidized magnetite nanoparticles with various shapes. In general, when exponent n decreases with increasing temperature, the correlated barrier hopping (CBH) can be used to describe their behavior; when exponent n increases with increasing temperature, non-overlapping small polaron tunneling (NSPT) occurs [16]. In some cases, the non-linear behavior of this exponent can be observed. For example, when n drops to a minimum value and then increases with increasing temperature, overlapping large polaron tunneling (OLPT) occurs [17]. The quantum mechanical tunneling appears when the n value equals 0.8, and only slight changes in its value generated by the temperatures can be observed [39]. Additionally, DC electrical conductivity related to the motion of the electrons through the surface of particles in the low-frequency region can be determined from the modified universal power law. In general, this process is highly temperature-dependent, and the activation energy can be estimated based on the Arrhenius law [40].
Figure 7a–d shows the real and imaginary parts of the electrical conductivity at 273 K, along with the theoretical curves obtained from the fitting by Equation (4). As can be seen, the modified universal power law can be successfully used to describe the complex electrical conductivity over the entire frequency range for samples with relatively low electrical conductivity. Only for Fe3O4–PPh3 NPs, the applicability of this model is limited. However, despite the fact that the modified universal power law cannot describe the real part of electrical conductivity, the imaginary one was very well described by the proposed model.
The model and experimental data differences are strongly related to the ultrafast electron transport between ultrafine magnetite nanoparticles with low maghemite content and cuboidal shape. When for other samples, there was an accumulation and slow motion of electrons on the disordered and oxidized surface (which was discussed in the context of electric permittivity) for Fe3O4–PPh3 NPs, electrons can be easily transferred through the particles surface to the electrodes, which is manifested in a significant drop in σ′ at high temperatures and in a low-frequency region. It is also visible in the difference between the values of the low-frequency conductivity for the analyzed samples. For example, σ′ equaled 1.33 × 10⁻⁶ S/cm (at 10 Hz) for Fe3O4–ClT NPs, whereas σ′ for Fe3O4–PPh3 NPs was 100 times higher (1.02 × 10⁻⁴ S/cm at 10 Hz). Therefore, the calculation of the n(T) behavior for Fe3O4–PPh3 NPs was burdened with a significant error, especially in the case of high temperatures, which can be observed in Figure 7e. On the other hand, in a low-temperature region, where the mobility of electrons in magnetite was low, the n(T) behaviors for these particles were characteristic of the NSPT model, which was also theoretically confirmed using DFT + U and hybrid functional calculations [41].
At high temperatures, the ultrafine cuboidal nanoparticles with n ≈ 1 should behave similarly to the ideal Debye dielectric dipolar-type crystal. However, the other situation arose in the n(T) analysis for oxidized samples. While the surface of the oxidized nearly spherical nanoparticles (Fe3O4 NPs) was free of organic molecules, OLPT occurred. However, correlated barrier hopping occurred when nanoparticles crystallized into cuboidal forms, and organic molecules functionalized their oxidized surfaces (such as ClT and en).
Figure 7f shows the relationship between the DC electrical conductivity obtained from the modified universal power law and temperature. While the σDC values for spherically shaped and highly oxidized samples can be satisfactorily analyzed, the σDC for Fe3O4–PPh3 NPs was presented only illustratively, because in this type of material, the experimental data did not stay in good agreement with the theoretical model (see Figure 7d). However, with increasing temperature, an increasing tendency of electrical conductivity can be observed for all materials. It is related to the mobility of electrons, which is strongly dependent on temperature. Moreover, it is possible to determine activation energies Ea of electrons moving through the surface of particles. Accordingly, Figure 7g shows the Arrhenius plots for the oxidized samples. The Fe3O4–PPh3 NPs were not analyzed, because the obtained values had a high error. Interestingly, all analyzed samples were characterized by two different activation energies, in low- (173–233 K) and high- temperature (243–363 K) ranges. The calculated values of Ea are listed in Table 4. As one can see, the values of both processes were similar for all nanoparticles (ΔEa was not higher than ±0.02 eV), because the movement of the charge carriers through the surface occurred in γ-Fe2O3 and it did not depend on the shape, size, and functionalization. It is well-known that the transport of electrons in magnetite is much easier than in maghemite and is related to the electrons hopping between Fe3+ and Fe2+ ions [41]. When the magnetite surface is blocked by other non-magnetic nanoparticles, high disordering, or γ-Fe2O3, in which only Fe3+ and iron vacancies exist, the electron movement becomes slower [4,14,42]. In high-temperature regions, movement of electrons increases; however, negatively charged cation vacancies and thermal vibrations of the lattice structure appear. Accordingly, the energy required for this process is much higher than for the low-energy region, in which conductivity is much lower, and electrons can slowly move through the particle surface.
Based on the comprehensive analysis of the structure and properties of magnetite nanoparticles synthesized in a hydrophobic–hydrophilic environment performed above, it can be concluded that there is a possibility to synthesize Fe3O4 NPs with determined properties. For example, when good magnetic properties could characterize the nanoparticles, we can adjust the synthesis conditions to maintain these properties and obtain nanoparticles that are excellent electrically conductive (Fe3O4–PPh3 NPs) or have a high ability to store charges on their surface (Fe3O4 NPs). Both samples have similar and high Ms and low Hc values; however, the electrical conductivity of spherically shaped Fe3O4 NPs can be even 1000 times lower than Fe3O4–PPh3 NPs at low temperature and in a low-frequency range. However, when the magnetite nanoparticles are used as a capacitor, Fe3O4–en and Fe3O4–ClT NPs should be used according to their high ε’ and low tanδ values in wide temperature and frequency ranges [35].

4. Conclusions

The surface modification of magnetite plays a key role in synthesizing nanoparticles with specific properties, such as catalytic activity, biocompatibility, and magnetic and dielectric properties. Herein, the possibility of synthesizing ultrafine (9.6 ± 2.0) cuboidal nanoparticles with a relatively low content of an oxidized layer using PPh3 as an organic modifier have been confirmed. For these nanoparticles, the highest electrical conductivity (about 1000 times higher than for spherically shaped nanoparticles) and the best superparamagnetic properties (Ms equal to 55.2 emu/g and Hc equal to 8.7 Oe) have been observed. Furthermore, it was confirmed that the transformation of magnetite into maghemite and the copresence of ultrafine non-magnetic nanoparticles caused a decrease in saturation magnetization (44.75 emu/g for the Fe3O4–ClT NPs). Interestingly, the electric energy storage properties are strictly related to surface disordering and composition. Therefore, ε′ was the highest for Fe3O4–en NPs and Fe3O4–ClT NPs, for which the oxidized layer, surface disordering and presence of non-magnetic particles or cation vacancies were observed.
On the other hand, dielectric losses are not attributed to an oxidized layer and can be connected with the size of particles. The analysis of the electrical conductivity and the imaginary part of the electric modulus confirmed the high impact of the oxidized surface on the electron behavior. In the M″ spectra, a double peak related to the transition between two electric processes has been observed. Moreover, applying the modified universal power law allowed determining the DC conductivity, the activation energy of electron movements through the surface, and the electrical conductivity mechanism. Interestingly, only in the case of Fe3O4–PPh3 NPs, the application of this model was not possible, especially in regions of high temperature. However, the electron behavior and electrical conductivity for Fe3O4–PPh3 NPs can be described using non-overlapping small polaron tunneling in a low-temperature range.
In contrast, at higher temperatures, the behavior of this sample is similar to the ideal Debye dielectric dipolar-type crystal. The electrical conductivity mechanism is also different for nanoparticles with variable γ-Fe2O3 contents and with a different shape. For Fe3O4–en NPs and Fe3O4–ClT NPs, the high-frequency electrical conductivity mechanism is related to the CBH model, whereas for Fe3O4 NPs it is associated with OLPT model. Accordingly, the presented results can be used to synthesize magnetite nanoparticles with defined magnetic and dielectric properties by modifying the synthesis route. As confirmed, it is simple to prepare Fe3O4 nanoparticles with similar magnetic properties, whereas their electrical conductivity can differ by a few orders. Moreover, further research should develop restrictions needed at the synthesis step to obtain materials for chosen applications.

Author Contributions

Conceptualization, A.R., D.Ł. and R.B.; formal analysis, M.K.-G.; investigation, A.R., M.K.-G., D.Ł., A.K.-B., P.G., P.W. and M.P.; methodology, M.K.-G., D.Ł. and P.G.; supervision, K.C.-A. and R.B.; validation, M.P.; writing—the original draft, A.R.; writing—review & editing, A.R., K.C.-A., A.K.-B., P.W., M.P. and R.B. All authors have read and agreed to the published version of the manuscript.

Funding

This work was funded by the Polish Ministry of Science and Higher Education Diamond Grant VII (grant number: 0220/DIA/2018/470) and was supported by the Silesian University of Technology, Poland (grant number: 10/010/BKM21/1053).

Institutional Review Board Statement

Not applicable.

Informed Consent Statement

Not applicable.

Data Availability Statement

The data presented in this study are available on request from the corresponding authors.

Conflicts of Interest

The authors declare no conflict of interest. The funders had no role in the design of the study; in the collection, analyses, or interpretation of data; in the writing of the manuscript, or in the decision to publish the results.

References

  1. Kumar, R.; Mondal, K.; Panda, P.K.; Kaushik, A.; Abolhassani, R.; Ahuja, R.; Rubahn, H.G.; Mishra, Y.K. Core-shell nanostructures: Perspectives towards drug delivery applications. J. Mater. Chem. B 2020, 8, 8992–9027. [Google Scholar] [CrossRef]
  2. Tan, L.; Wang, F.; Zhang, P.; Suzuki, Y.; Wu, Y.; Chen, J.; Yang, G.; Tsubaki, N. Design of a core-shell catalyst: An effective strategy for suppressing side reactions in syngas for direct selective conversion to light olefins. Chem. Sci. 2020, 11, 4097–4105. [Google Scholar] [CrossRef] [Green Version]
  3. Kumar, N.; Sinha Ray, S. Synthesis and functionalization of nanomaterials. In Processing of Polymer-Based Nanocomposites; Springer Series in Materials Science; Sinha Ray, S., Ed.; Springer: Berlin/Heidelberg, Germany, 2018; Volume 277. [Google Scholar]
  4. Natarajan, S.; Harini, K.; Gajula, G.P.; Sarmento, B.; Neves-Petersen, M.T.; Thiagarajan, V. Multifunctional magnetic iron oxide nanoparticles: Diverse synthetic approaches, surface modifications, cytotoxicity towards biomedical and industrial applications. BMC Mater. 2019, 1, 2. [Google Scholar] [CrossRef]
  5. Majhi, S.M.; Naik, G.K.; Lee, H.J.; Song, H.G.; Lee, C.R.; Lee, I.H.; Yu, Y.T. Au@NiO core-shell nanoparticles as a p-type gas sensor: Novel synthesis, characterization, and their gas sensing properties with sensing mechanism. Sens. Actuators B Chem. 2018, 268, 223–231. [Google Scholar] [CrossRef]
  6. Qu, F.; Liu, J.; Wang, Y.; Wen, S.; Chen, Y.; Li, X.; Ruan, S. Hierarchical Fe3O4@Co3O4 core-shell microspheres: Preparation and acetone sensing properties. Sens. Actuators B Chem. 2014, 199, 346–353. [Google Scholar] [CrossRef]
  7. Sappino, C.; Primitivo, L.; De Angelis, M.; Domenici, M.O.; Mastrodonato, A.; Romdan, I.B.; Tatangelo, C.; Suber, L.; Pilloni, L.; Ricelli, A.; et al. Functionalized Magnetic Nanoparticles as Catalysts for Enantioselective Henry Reaction. ACS Omega 2019, 4, 21809–21817. [Google Scholar] [CrossRef]
  8. Ingle, A.P.; Philippini, R.R.; de Souza Melo, Y.C.; da Silva, S.S. Acid-functionalized magnetic nanocatalysts mediated pretreatment of sugarcane straw: An eco-friendly and cost-effective approach. Cellulose 2020, 27, 7067–7078. [Google Scholar] [CrossRef]
  9. Xiong, F.; Hu, K.; Yu, H.; Zhou, L.; Song, L.; Zhang, Y.; Shan, X.; Liu, J.; Gu, N. A Functional Iron Oxide Nanoparticles Modified with PLA-PEG-DG as Tumor-Targeted MRI Contrast Agent. Pharm. Res. 2017, 34, 1683–1692. [Google Scholar] [CrossRef] [PubMed]
  10. Salem, M.; Xia, Y.; Allan, A.; Rohani, S.; Gillies, E.R. Curcumin-loaded, folic acid-functionalized magnetite particles for targeted drug delivery. RSC Adv. 2015, 5, 37521–37532. [Google Scholar] [CrossRef]
  11. Radoń, A.; Łoński, S.; Kądziołka-Gaweł, M.; Gębara, P.; Lis, M.; Łukowiec, D.; Babilas, R. Influence of magnetite nanoparticles surface dissolution, stabilization and functionalization by malonic acid on the catalytic activity, magnetic and electrical properties. Colloids Surf. A Physicochem. Eng. Asp. 2020, 607, 125446. [Google Scholar] [CrossRef]
  12. Wu, W.; He, Q.; Jiang, C. Magnetic iron oxide nanoparticles: Synthesis and surface functionalization strategies. Nanoscale Res. Lett. 2008, 3, 397–415. [Google Scholar] [CrossRef] [Green Version]
  13. Schwaminger, S.P.; Bauer, D.; Fraga-García, P.; Wagner, F.E.; Berensmeier, S. Oxidation of magnetite nanoparticles: Impact on surface and crystal properties. CrystEngComm 2017, 19, 246–255. [Google Scholar] [CrossRef] [Green Version]
  14. Winsett, J.; Moilanen, A.; Paudel, K.; Kamali, S.; Ding, K.; Cribb, W.; Seifu, D.; Neupane, S. Quantitative determination of magnetite and maghemite in iron oxide nanoparticles using Mössbauer spectroscopy. SN Appl. Sci. 2019, 1, 1636. [Google Scholar] [CrossRef] [Green Version]
  15. Morales, I.; Costo, R.; Mille, N.; da Silva, G.B.; Carrey, J.; Hernando, A.; de la Presa, P. High frequency hysteresis losses on γ-Fe2O3 and Fe3O4: Susceptibility as a magnetic stamp for chain formation. Nanomaterials 2018, 8, 970. [Google Scholar] [CrossRef] [Green Version]
  16. Radoń, A.; Łukowiec, D.; Kremzer, M.; Mikuła, J.; Włodarczyk, P. Electrical conduction mechanism and dielectric properties of spherical shaped Fe3O4 nanoparticles synthesized by co-precipitation method. Materials (Basel) 2018, 11, 735. [Google Scholar] [CrossRef] [PubMed] [Green Version]
  17. Radoń, A.; Łukowiec, D.; Włodarczyk, P. Ultraslow electron-phonon scattering and polaron formation in magnetite. J. Mater. 2021, in press. [Google Scholar]
  18. Truncik, C.J.S.; Huttema, W.A.; Turner, P.J.; Özcan, S.; Murphy, N.C.; Carrière, P.R.; Thewalt, E.; Morse, K.J.; Koenig, A.J.; Sarrao, J.L.; et al. Nodal quasiparticle dynamics in the heavy fermion superconductor CeCoIn5 revealed by precision microwave spectroscopy. Nat. Commun. 2013, 4, 2477. [Google Scholar] [CrossRef] [PubMed] [Green Version]
  19. Kotnala, R.K.; Ahmad, S.; Ahmed, A.S.; Shah, J.; Azam, A. Investigation of structural, dielectric, and magnetic properties of hard and soft mixed ferrite composites. Proc. J. Appl. Phys. 2012, 112, 054323. [Google Scholar] [CrossRef]
  20. Jotania, R.B.; Nandotaria, R.A.; Chauhan, C.C.; Hashim, M.; Singh Meena, S.; Shirsath, S.E. Structural phases and Maxwell-Wagner relaxation in magnetically soft-ZnFe2O4 and hard-Sr2Cu2Fe12O22 nanocomposites. Ceram. Int. 2016, 42, 2289–2298. [Google Scholar] [CrossRef]
  21. Siregar, J.; Septiani, N.L.W.; Abrori, S.A.; Sebayang, K.; Irzaman; Fahmi, M.Z.; Humaidi, S.; Sembiring, T.; Sembiring, K.; Yuliarto, B. Review—A Pollutant Gas Sensor Based On Fe3O4 Nanostructures: A Review. J. Electrochem. Soc. 2021, 168, 027510. [Google Scholar] [CrossRef]
  22. Radoń, A.; Hawełek, Ł.; Łukowiec, D.; Kubacki, J.; Włodarczyk, P. Dielectric and electromagnetic interference shielding properties of high entropy (Zn,Fe,Ni,Mg,Cd)Fe2O4 ferrite. Sci. Rep. 2019, 9, 20078. [Google Scholar] [CrossRef]
  23. Radoń, A.; Łukowiec, D.; Włodarczyk, P. Microwave absorption by dextrin-magnetite nanocomposite in frequencies below 2.5 GHz: Role of magnetite content, shape and temperature on magneto-dielectric properties. Mater. Des. 2020, 193, 108860. [Google Scholar] [CrossRef]
  24. Debnath, S.; Das, R. Cobalt doping on nickel ferrite nanocrystals enhances the micro-structural and magnetic properties: Shows a correlation between them. J. Alloys Compd. 2021, 852, 156884. [Google Scholar] [CrossRef]
  25. Nath, D.; Singh, F.; Das, R. X-ray diffraction analysis by Williamson-Hall, Halder-Wagner and size-strain plot methods of CdSe nanoparticles- a comparative study. Mater. Chem. Phys. 2020, 239, 122021. [Google Scholar] [CrossRef]
  26. Yuan, K.; Lee, S.S.; Cha, W.; Ulvestad, A.; Kim, H.; Abdilla, B.; Sturchio, N.C.; Fenter, P. Oxidation induced strain and defects in magnetite crystals. Nat. Commun. 2019, 10, 703. [Google Scholar] [CrossRef]
  27. Sneed, B.T.; Young, A.P.; Tsung, C.K. Building up strain in colloidal metal nanoparticle catalysts. Nanoscale 2015, 7, 12248–12265. [Google Scholar] [CrossRef]
  28. Dheyab, M.A.; Aziz, A.A.; Jameel, M.S.; Noqta, O.A.; Khaniabadi, P.M.; Mehrdel, B. Simple rapid stabilization method through citric acid modification for magnetite nanoparticles. Sci. Rep. 2020, 10, 10793. [Google Scholar] [CrossRef] [PubMed]
  29. Radoń, A.; Drygała, A.; Hawełek, Ł.; Łukowiec, D. Structure and optical properties of Fe3O4 nanoparticles synthesized by co-precipitation method with different organic modifiers. Mater. Charact. 2017, 131, 148–156. [Google Scholar] [CrossRef]
  30. Chernyshova, I.V.; Hochella, M.F.; Madden, A.S. Size-dependent structural transformations of hematite nanoparticles. 1. Phase transition. Phys. Chem. Chem. Phys. 2007, 9, 1736–1750. [Google Scholar] [CrossRef] [PubMed]
  31. Shipilin, M.A.; Zakharova, I.N.; Shipilin, A.M.; Bachurin, V.I. Mössbauer studies of magnetite nanoparticles. J. Surf. Investig. X-ray Synchrotron Neutron Tech. 2014, 8, 557–561. [Google Scholar] [CrossRef]
  32. Bonkerud, J.; Zimmermann, C.; Weiser, P.M.; Vines, L.; Monakhov, E.V. On the permittivity of titanium dioxide. Sci. Rep. 2021, 11, 12443. [Google Scholar] [CrossRef]
  33. Woodward, W.H.H. Broadband Dielectric Spectroscopy—A Practical Guide. In ACS Symposium Series; American Chemical Society: Washington, DC, USA, 2021. [Google Scholar]
  34. Kooti, M.; Sedeh, A.N.; Gheisari, K.; Figuerola, A. Synthesis, characterization, and performance of nanocomposites containing reduced graphene oxide, polyaniline, and cobalt ferrite. Phys. B Condens. Matter 2021, 612, 412974. [Google Scholar] [CrossRef]
  35. Boonlakhorn, J.; Manyam, J.; Krongsuk, S.; Thongbai, P.; Srepusharawoot, P. Enhanced dielectric properties with a significantly reduced loss tangent in (Mg2+, Al3+) co-doped CaCu3Ti4O12 ceramics: DFT and experimental investigations. RSC Adv. 2021, 11, 25038–25046. [Google Scholar] [CrossRef]
  36. Hussain, M.; Khan, R.; Khan, T.Z.; Khan, G.; Khattak, S.; Rahman, M.U.; Ali, S.; Iqbal, Z.; Safeen, K. Dielectric and magnetic properties of cobalt doped γ-Fe2O3 nanoparticles. J. Mater. Sci. Mater. Electron. 2019, 30, 13698–13707. [Google Scholar] [CrossRef]
  37. Türkay, S.; Tataroğlu, A. Complex dielectric permittivity, electric modulus and electrical conductivity analysis of Au/Si3N4/p-GaAs (MOS) capacitor. J. Mater. Sci. Mater. Electron. 2021, 31, 11418–11425. [Google Scholar] [CrossRef]
  38. Altındal, Ş.; Ulusoy, M.; Özçelik, S.; Azizian-Kalandaragh, Y. On the frequency-dependent complex-dielectric, complex-electric modulus and conductivity in Au/(NiS:PVP)/n-Si structures. J. Mater. Sci. Mater. Electron. 2021, 32, 20071–20081. [Google Scholar] [CrossRef]
  39. Megdiche, M.; Perrin-Pellegrino, C.; Gargouri, M. Conduction mechanism study by overlapping large-polaron tunnelling model in SrNiP2O7 ceramic compound. J. Alloys Compd. 2014, 584, 209–215. [Google Scholar] [CrossRef]
  40. Jebli, M.; Rayssi, C.; Dhahri, J.; Ben Henda, M.; Belmabrouk, H.; Bajahzar, A. Structural and morphological studies, and temperature/frequency dependence of electrical conductivity of Ba0.97La0.02Ti1−xNb4x/5O3perovskite ceramics. RSC Adv. 2021, 11, 23664–23678. [Google Scholar] [CrossRef]
  41. Liu, H.; Di Valentin, C. Band Gap in Magnetite above Verwey Temperature Induced by Symmetry Breaking. J. Phys. Chem. C 2017, 121, 25736–25742. [Google Scholar] [CrossRef]
  42. Cuenca, J.A.; Bugler, K.; Taylor, S.; Morgan, D.; Williams, P.; Bauer, J.; Porch, A. Study of the magnetite to maghemite transition using microwave permittivity and permeability measurements. J. Phys. Condens. Matter 2016, 28, 106002. [Google Scholar] [CrossRef] [Green Version]
Figure 1. Structural analysis of magnetite nanoparticles: (a) X-ray diffraction patterns of magnetite nanoparticles synthesized without (Fe3O4) and with the presence of ethylenediamine (Fe3O4–en), chloramine T (Fe3O4–ClT), and triphenylphosphine (Fe3O4–PPh3); (b) Fourier-transform infrared spectra of the same samples. The left panel presents the spectra in a wide frequency range, and the right panel shows the spectra in a narrow frequency range, in which characteristic vibrations from Fe–O bonds (υ1 and υ2) occurred.
Materials 14 05241 g001
Figure 2. Transmission electron microscopy images of magnetite nanoparticles synthesized without (a,e) and with the presence of en (b,f), ClT (c,g), and PPh3 (d,h).
Materials 14 05241 g002
Figure 3. Magnetization curves obtained by a vibrating-sample magnetometer. The inset shows the enlarged area near the coercive field.
Materials 14 05241 g003
Figure 4. Mössbauer spectra of magnetite nanoparticles synthesized without (a) and with the presence of different organic modifiers: en (b), ClT (c), and PPh3 (d). The contribution of the γ-Fe2O3 is displayed in blue, and that of the Fe3O4 is displayed in dark grey; the sextets connected with the magnetic interaction between nanoparticles are displayed in magenta, and the contribution of superparamagnetic fine particles is displayed in light gray.
Materials 14 05241 g004
Figure 5. Dielectric properties of magnetite nanoparticles with different shapes and oxidized surfaces: real (a) and imaginary (b) parts of permittivity, (c) loss tangents in different temperatures from 173 K (violet line) to 363 K (red line) with ΔT = 10 K.
Materials 14 05241 g005
Figure 6. Comparison of electric properties of magnetite nanoparticles at a constant temperature equal to 173 K: (a) imaginary part of the dielectric modulus; and (b) real part of the electrical conductivity.
Materials 14 05241 g006
Figure 7. Electrical conductivity for magnetite nanoparticles with different shapes and oxidized surfaces: fitting of the modified universal power law (red line) to the experimental data (black points) for Fe3O4 NPs (a), Fe3O4–en NPs (b), Fe3O4–ClT NPs (c), and Fe3O4–PPh3 NPs (d). The insets shows the imaginary part of the electrical conductivity; (e) the n(T) behavior in temperature function with marked measurement errors; (f) changes in σDC value generated by the temperature changes; (g) Arrhenius plots with the fitted curves confirming the existence of two different electrical processes.
Materials 14 05241 g007
Table 1. The average crystallite size (DH-W), intrinsic strain (ε), average particle size (Dav), and characteristic for Fe–O bonds vibrations (υ1, υ2, and υ2′).
SampleDH-W (nm)ε (10−3)Dav (nm)υ1 (cm−1)υ2 (cm−1)υ2′ (cm−1)
Fe3O49.06011.1 ± 2.2444.5583.6630.0
Fe3O4–en11.814.610.7 ± 3.8445.5582.4629.6
Fe3O4–ClT1013.1111.4 ± 2.6444.5588.0631.6
Fe3O4–PPh38.0421.79.6 ± 2.0440.6580.5630.6
Table 2. Magnetic properties of Fe3O4 NPs (saturation magnetization (Ms), remanence (Mr), coercivity (Hc), and Mr/Ms ratio).
SampleMs (emu/g)Mr (emu/g)Hc (Oe)Mr/Ms (a.u.)
Fe3O455.11.413.625.2 × 10−3
Fe3O4–en52.52.124.439.4 × 10−3
Fe3O4–ClT44.71.113.123.7 × 10−3
Fe3O4–PPh355.20.98.715.8 × 10−3
Table 3. Hyperfine parameters of the synthesized samples (isomer shift (Is), quadrupole splitting (Qs), hyperfine magnetic field (H), and relative area (A)).
SampleParametersSextetsSingle Line
S1 S2S3S4S5S6S7L
Fe3O4Is (mm/s)0.360.340.550.480.18--0.26
Qs (mm/)0.000.010.00−0.01−0.02-
H (T)47.643.238.230.319.9-
A (%)412512778
Fe3O4–enIs (mm/s)0.320.260.560.360.340.18-0.17
Qs (mm/)0.00−0.010.020.000.010.03-
H (T)47.943.943.037.929.510.4-
A (%)381910121083
Fe3O4–ClTIs (mm/s)0.370.250.600.390.360.32-0.37
Qs (mm/)0.00−0.020.020.030.02−0.01-
H (T)47.242.841.835.827.38.6-
A (%)2311913151215
Fe3O4–PPh3Is (mm/s)0.370.260.600.350.310.290.290.28
Qs (mm/)0.00−0.010.000.010.02−0.02−0.02-
H (T)46.941.841.435.429.923.89.7-
A (%)271210101110128
Table 4. Activation energies (Ea) of electrical conductivity in low- (173–233 K) and high-temperature (243–363 K) ranges determined from Arrhenius plots.
SampleEa,low T (eV)Ea,highT (eV)
Fe3O40.150.26
Fe3O4–en0.170.25
Fe3O4–ClT0.150.24
Publisher’s Note: MDPI stays neutral with regard to jurisdictional claims in published maps and institutional affiliations.

