
Phononic Bandgap Optimization in Sandwich Panels Using Cellular Truss Cores


Abstract
:1. Introduction
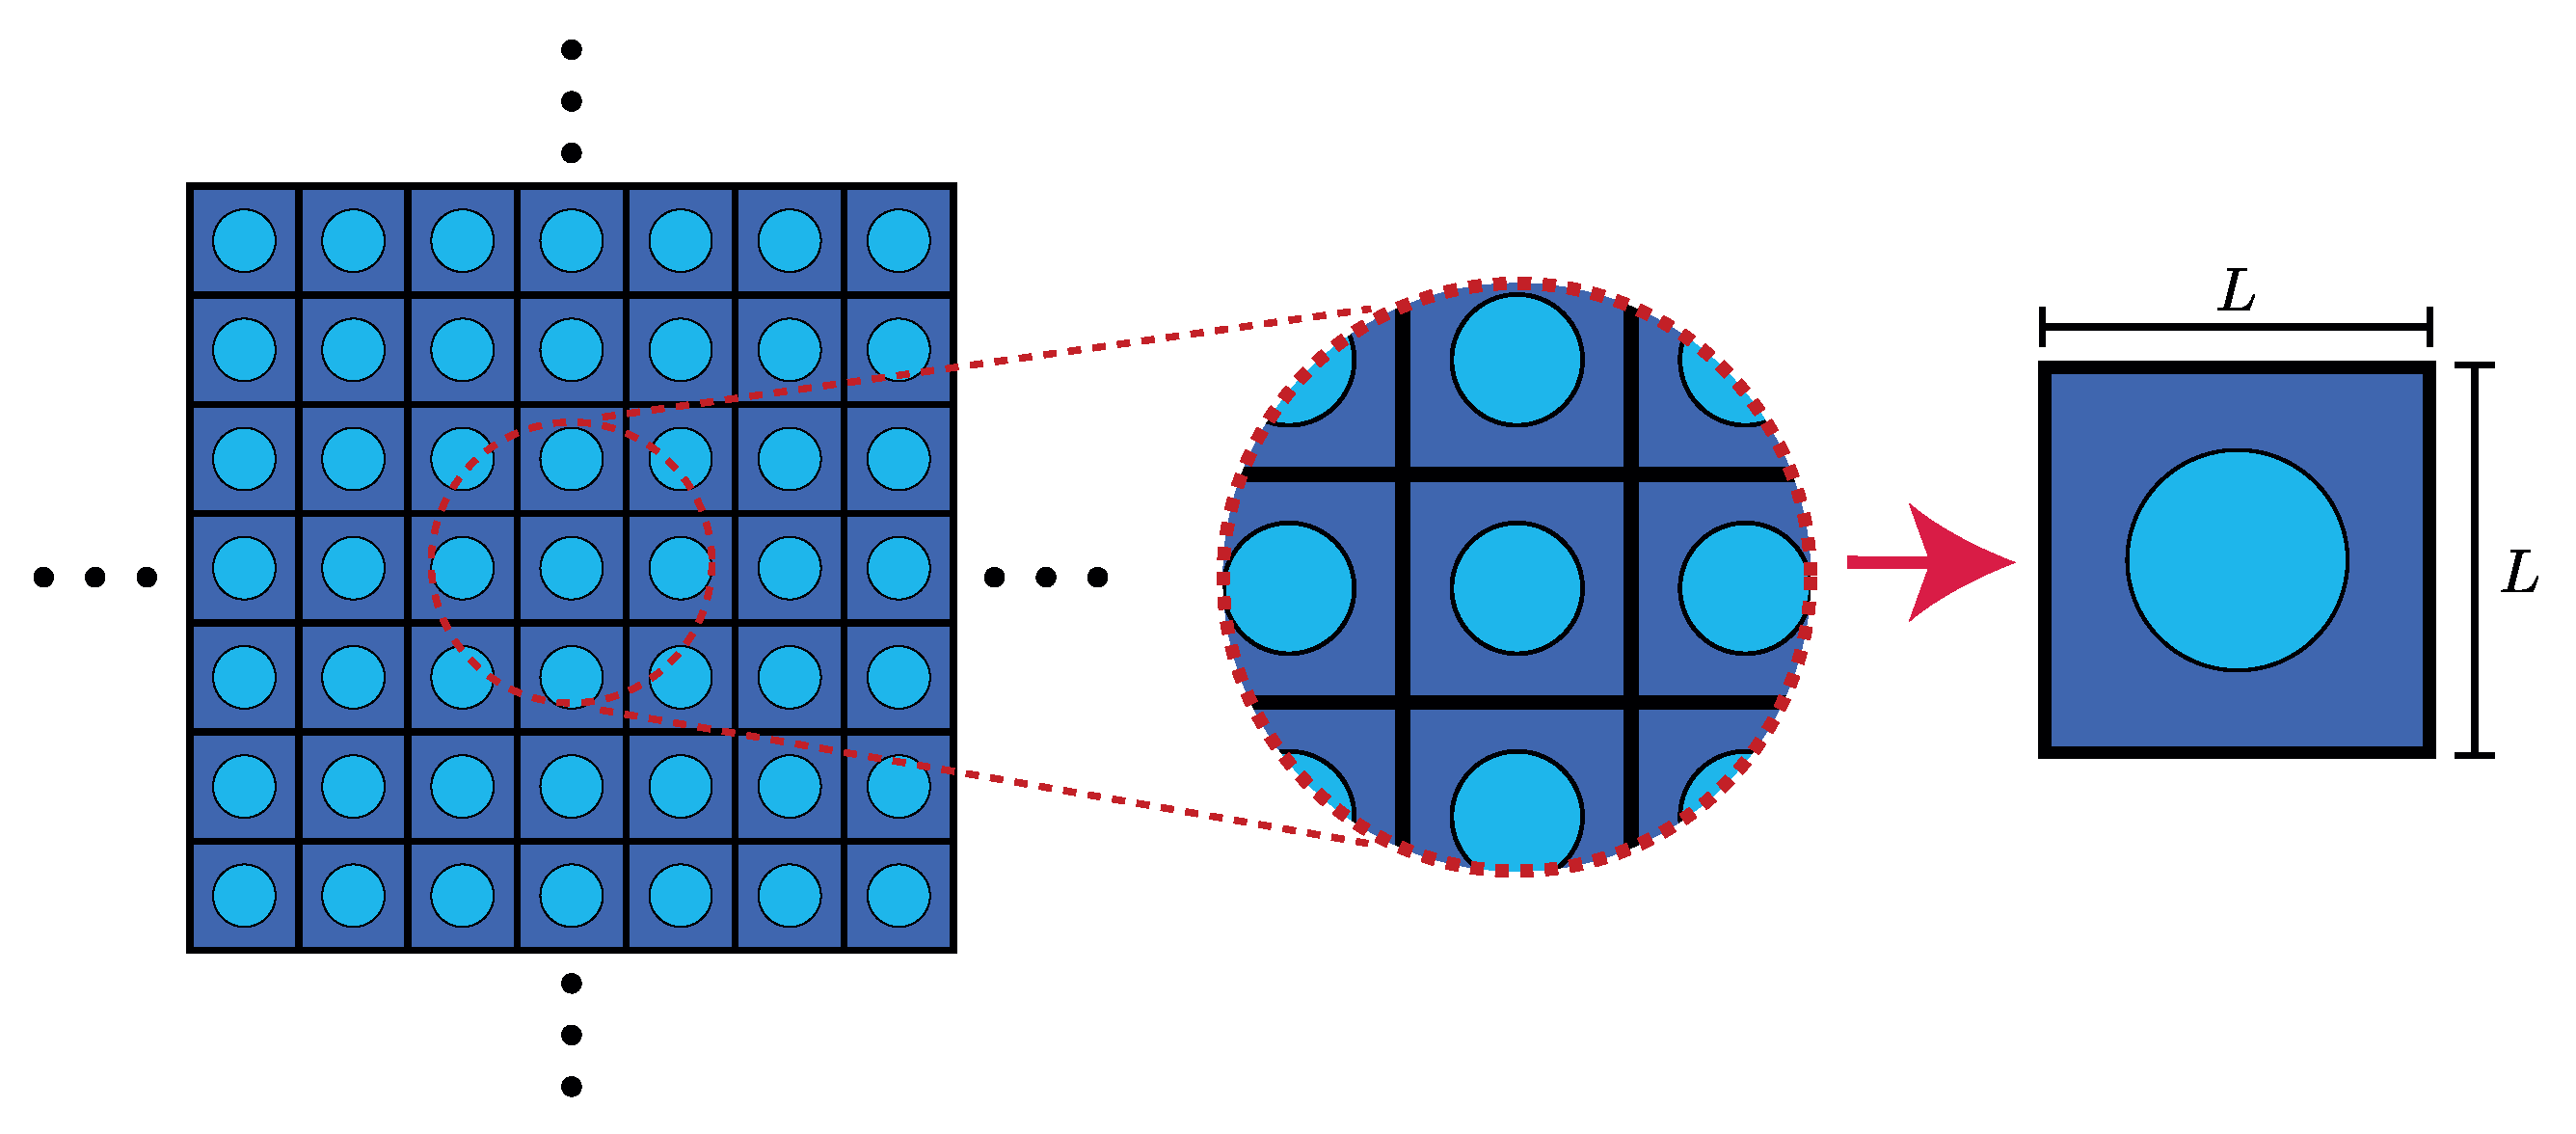
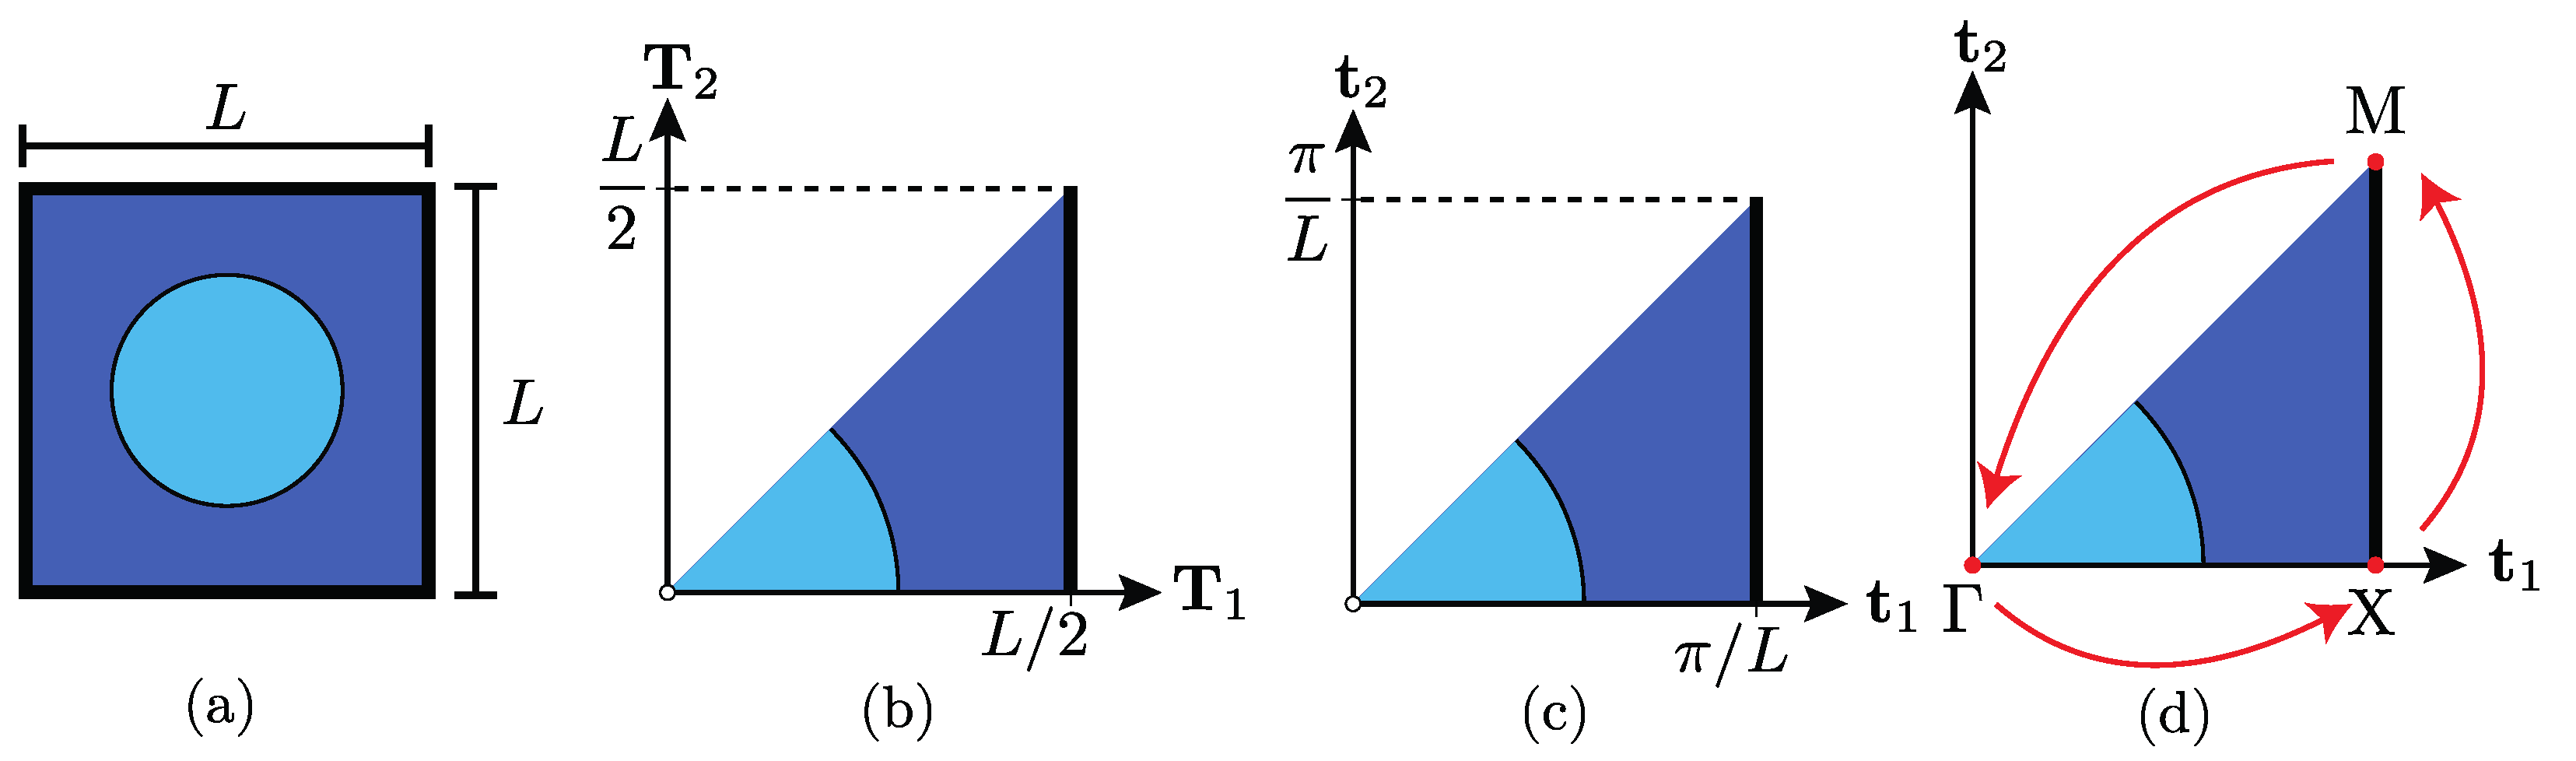
2. Periodic Structures Theory
3. Sandwich Panel Modelling
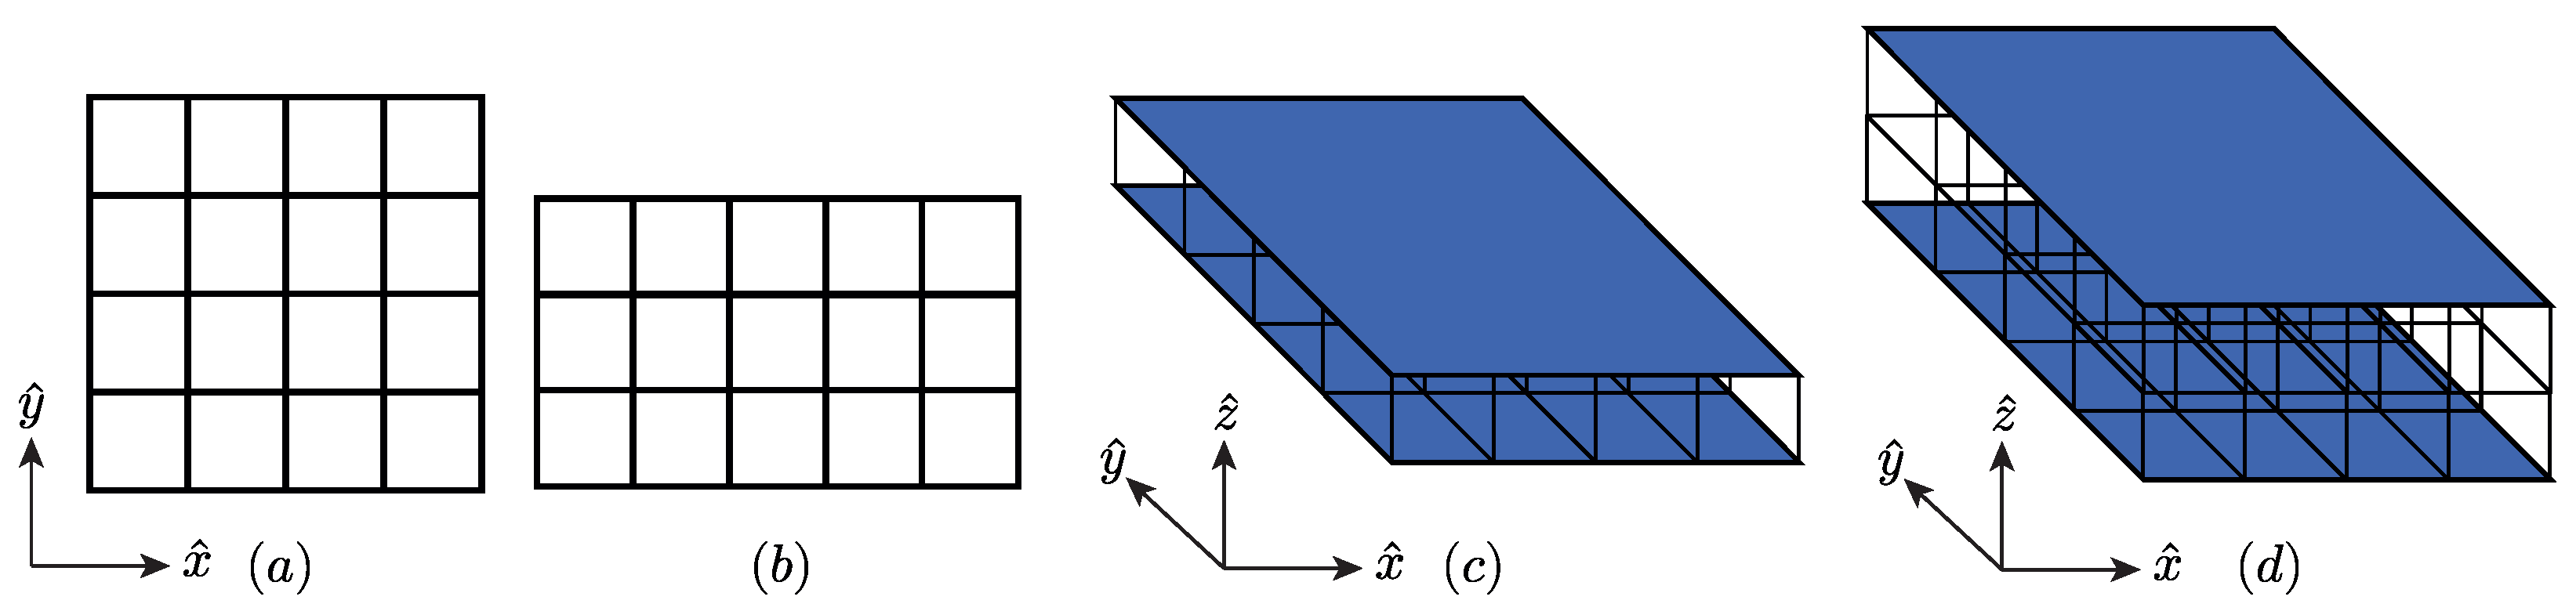
3.1. Geometry
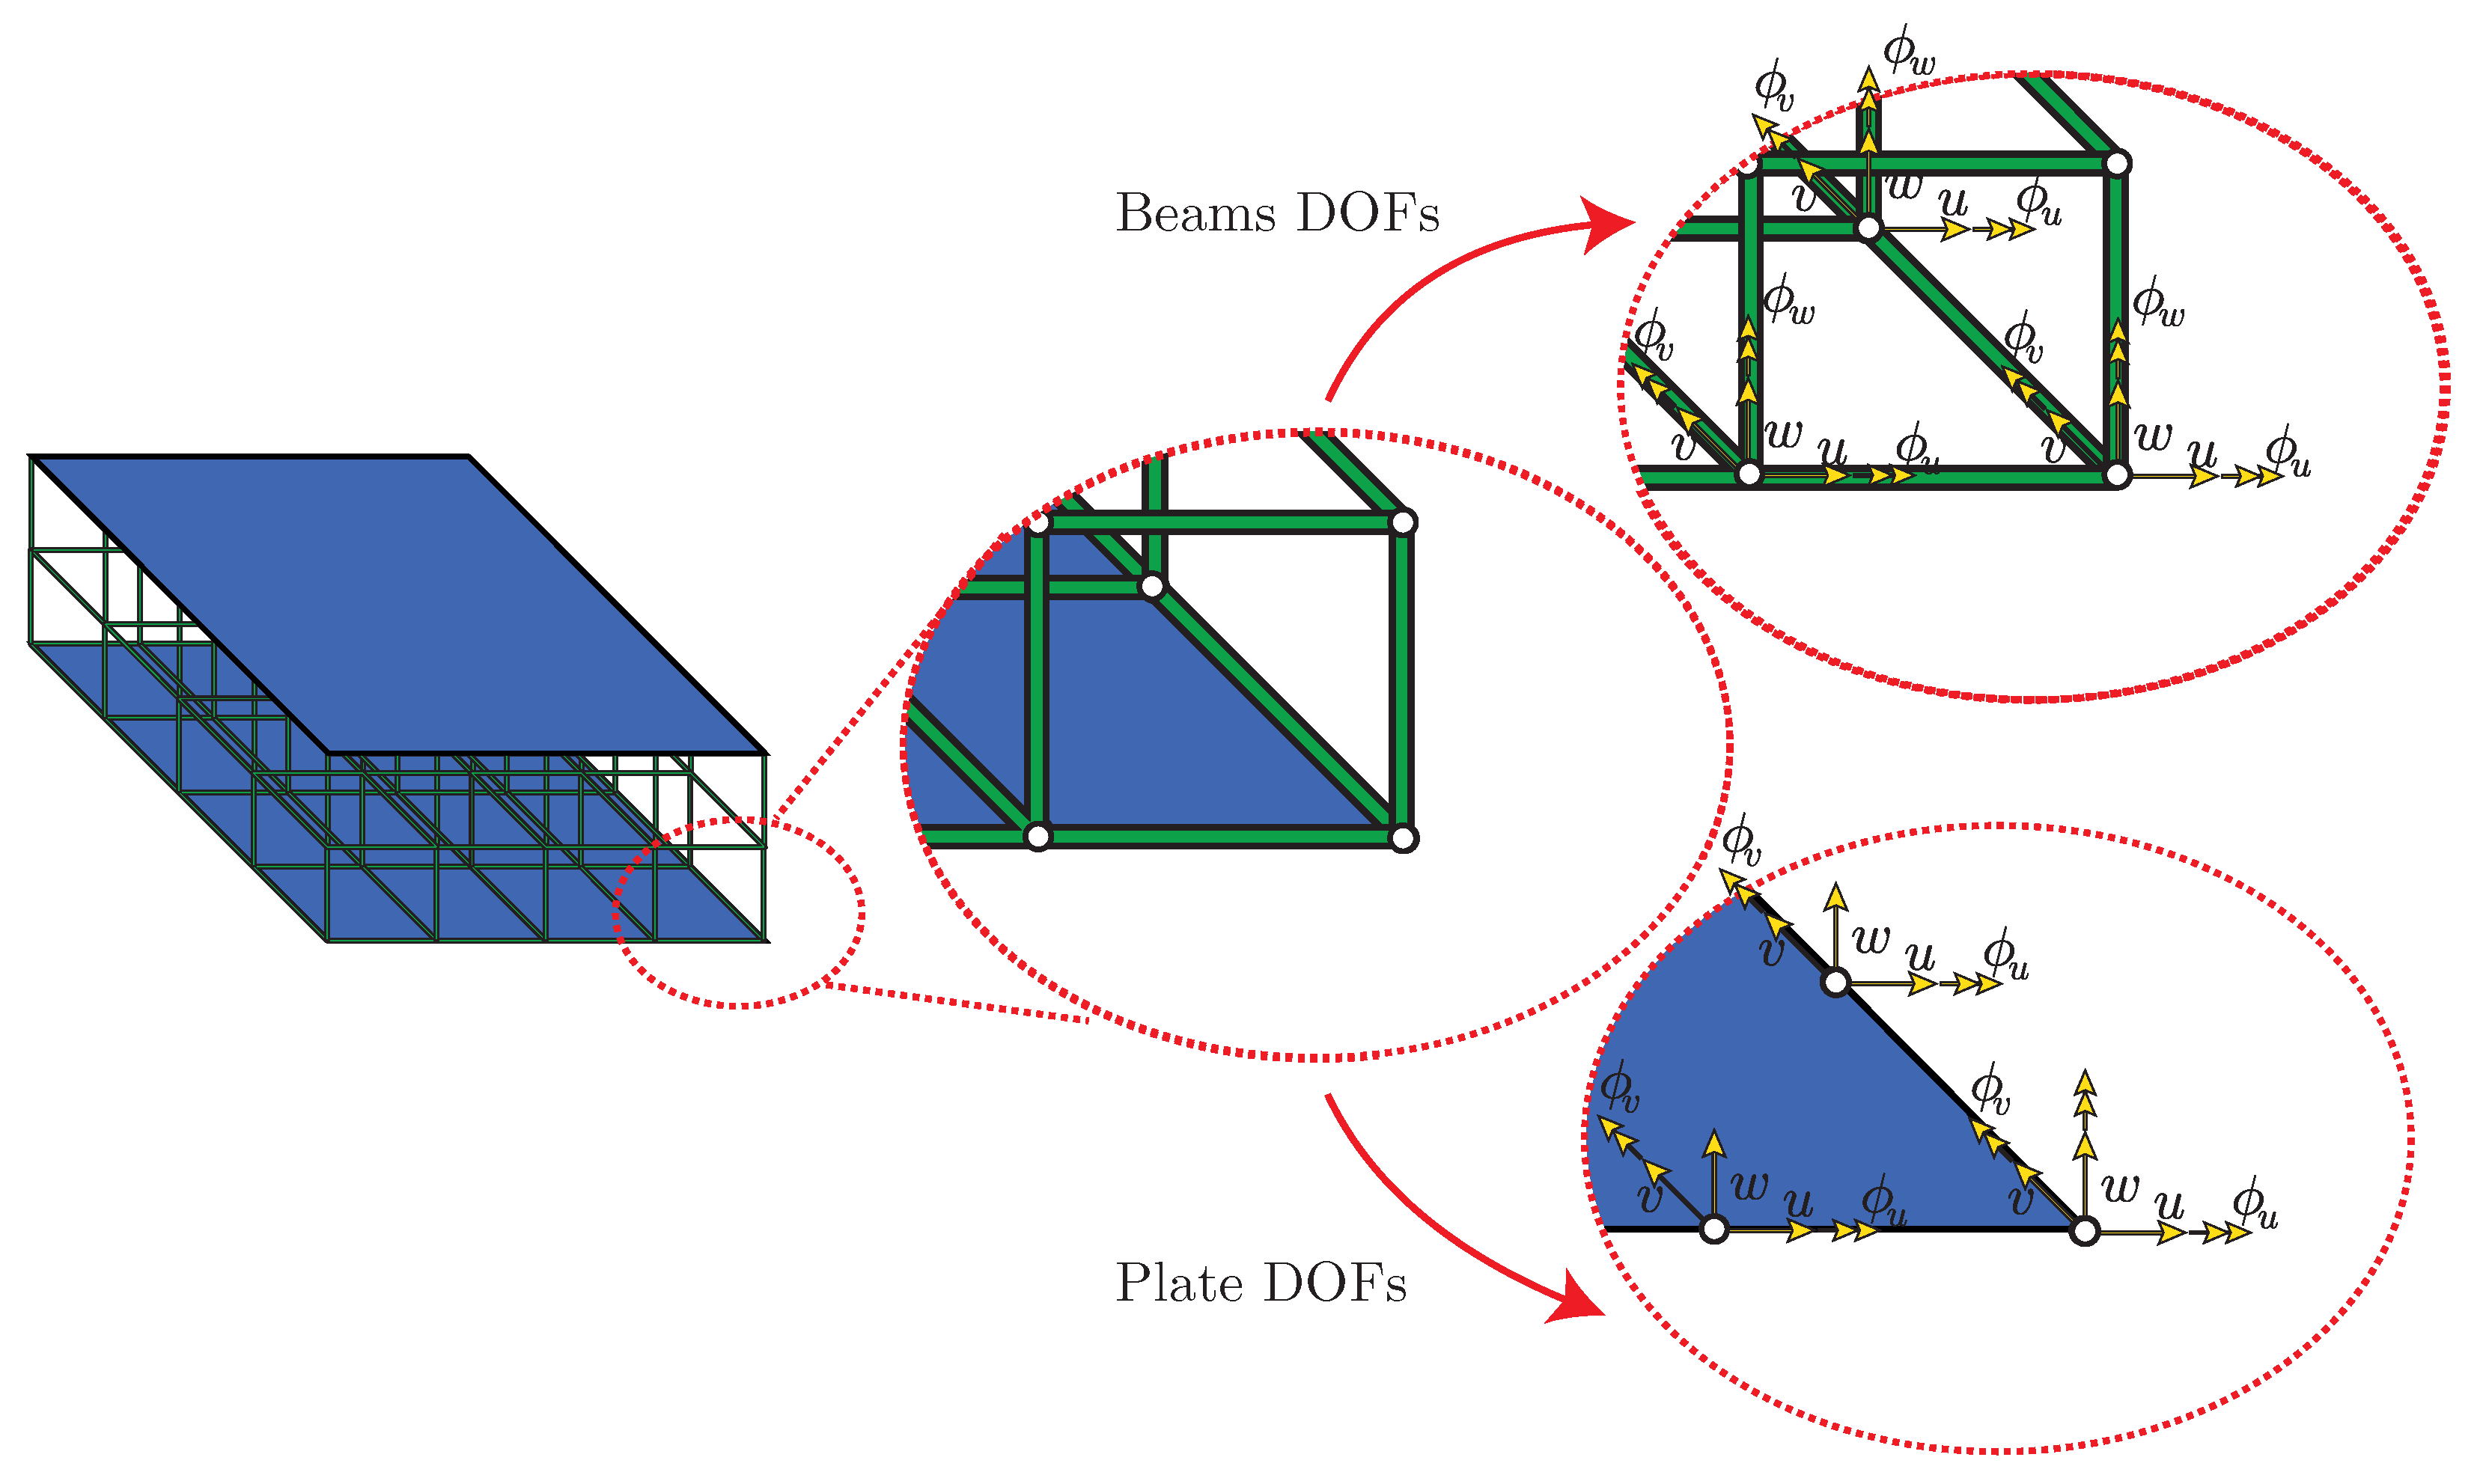
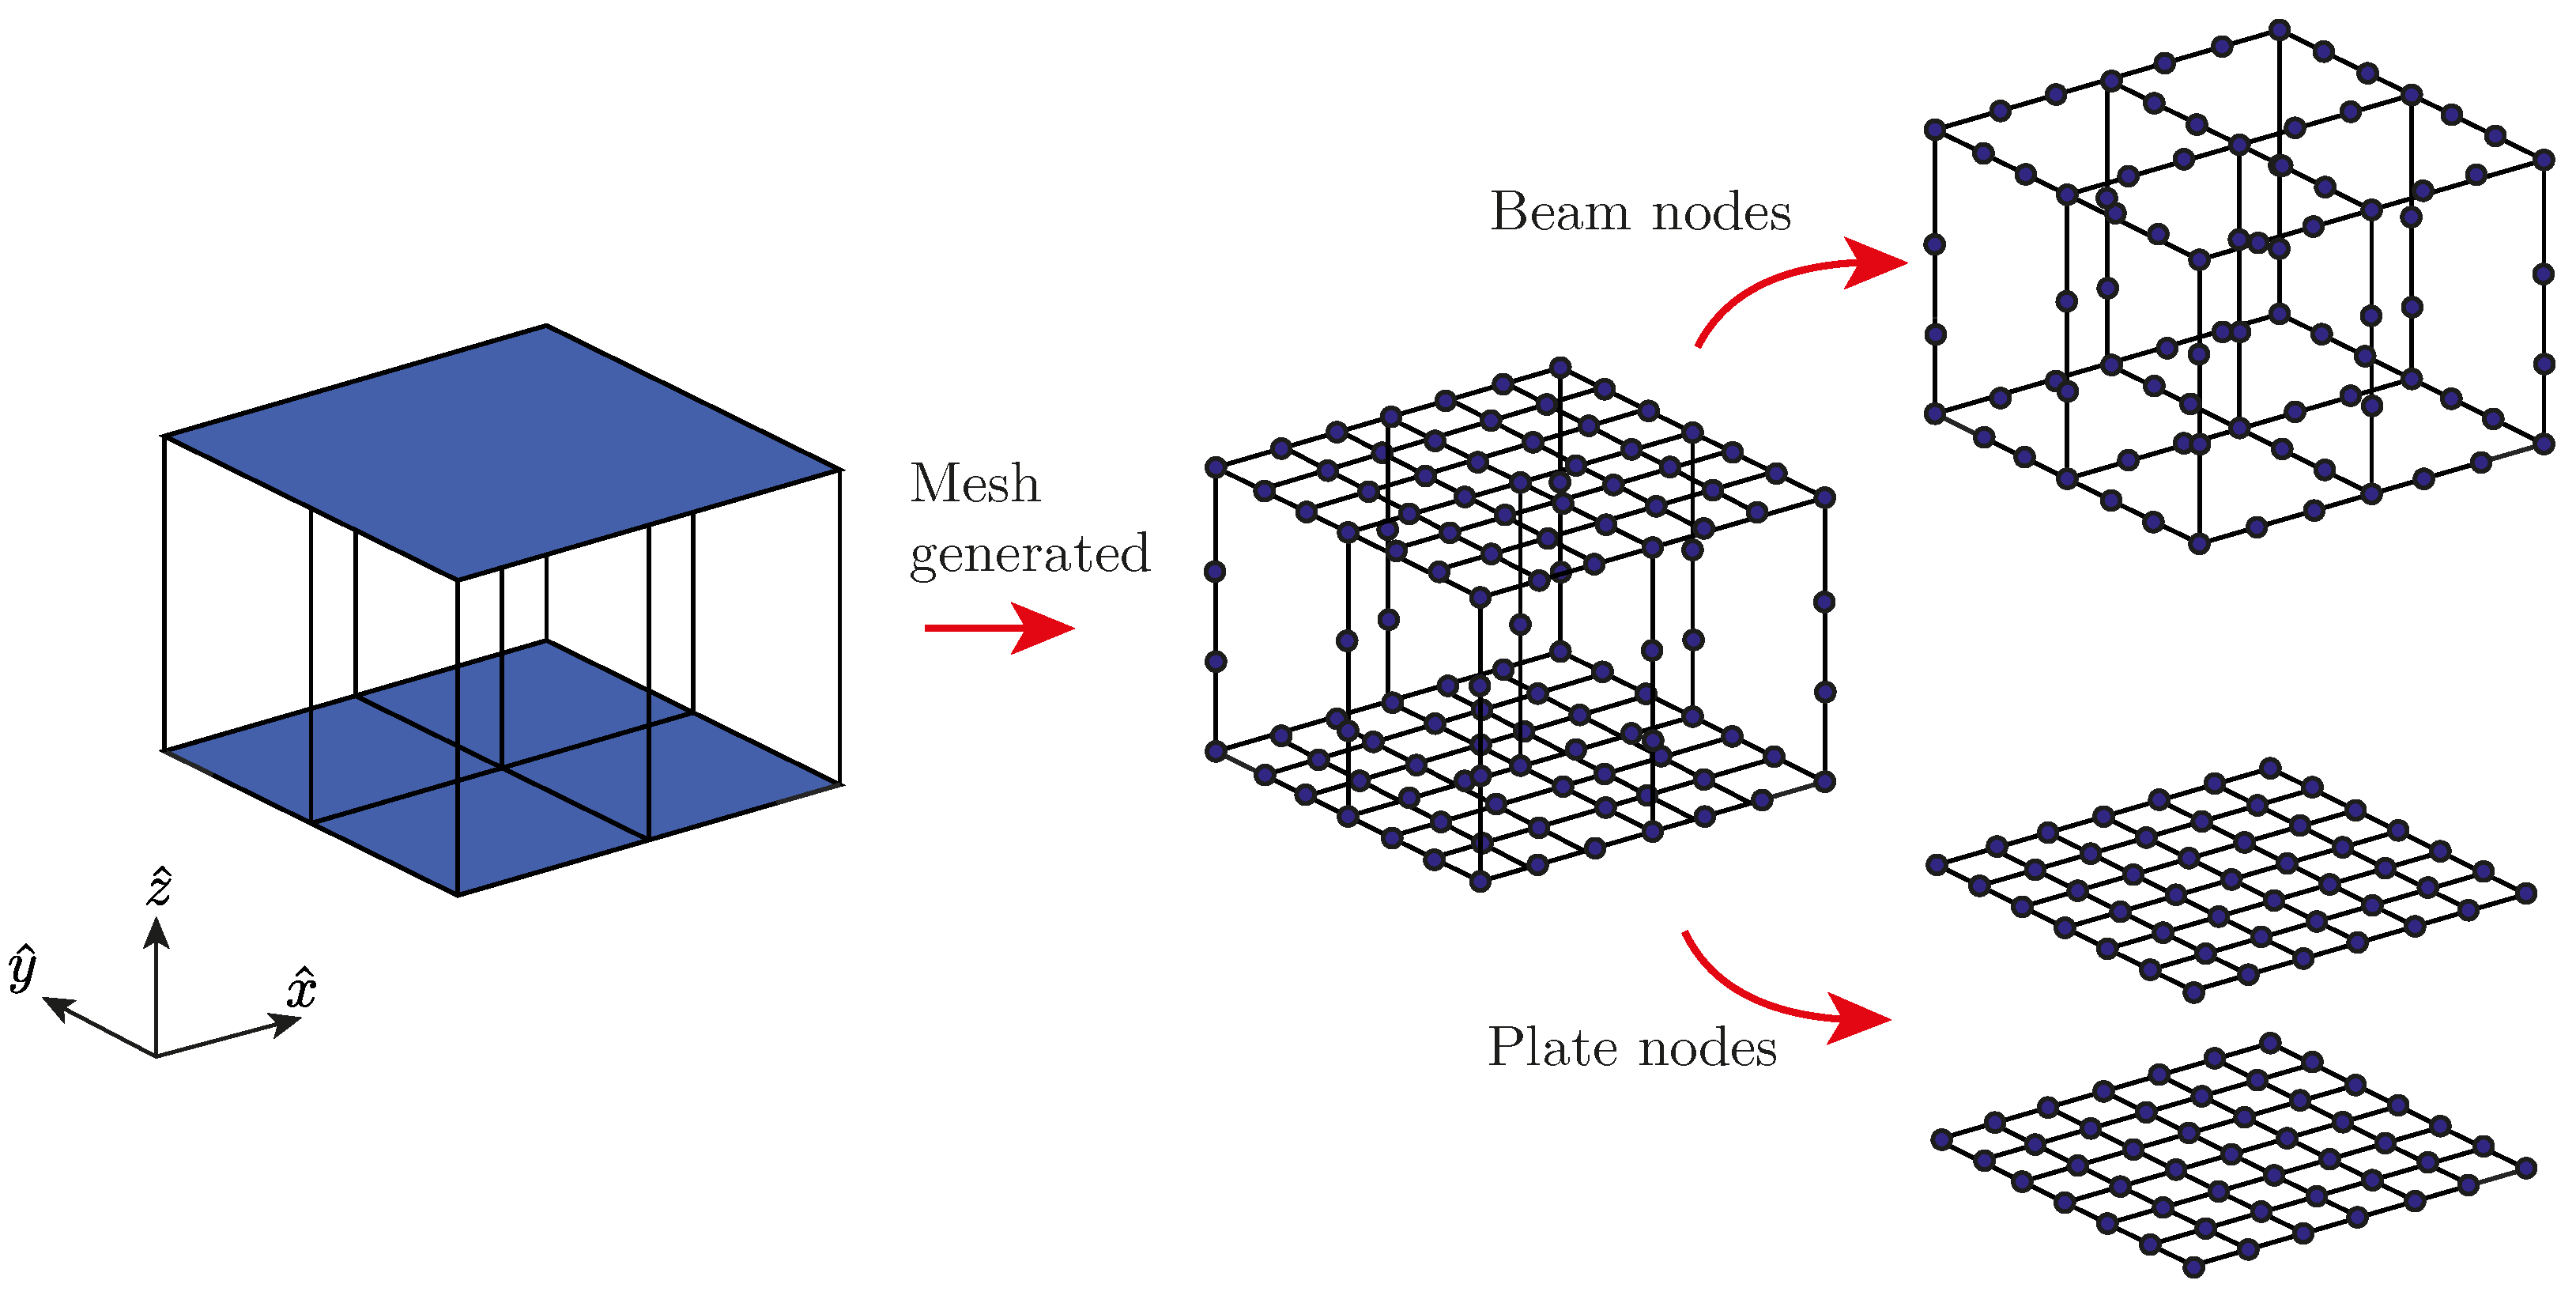
3.2. Finite Element Model
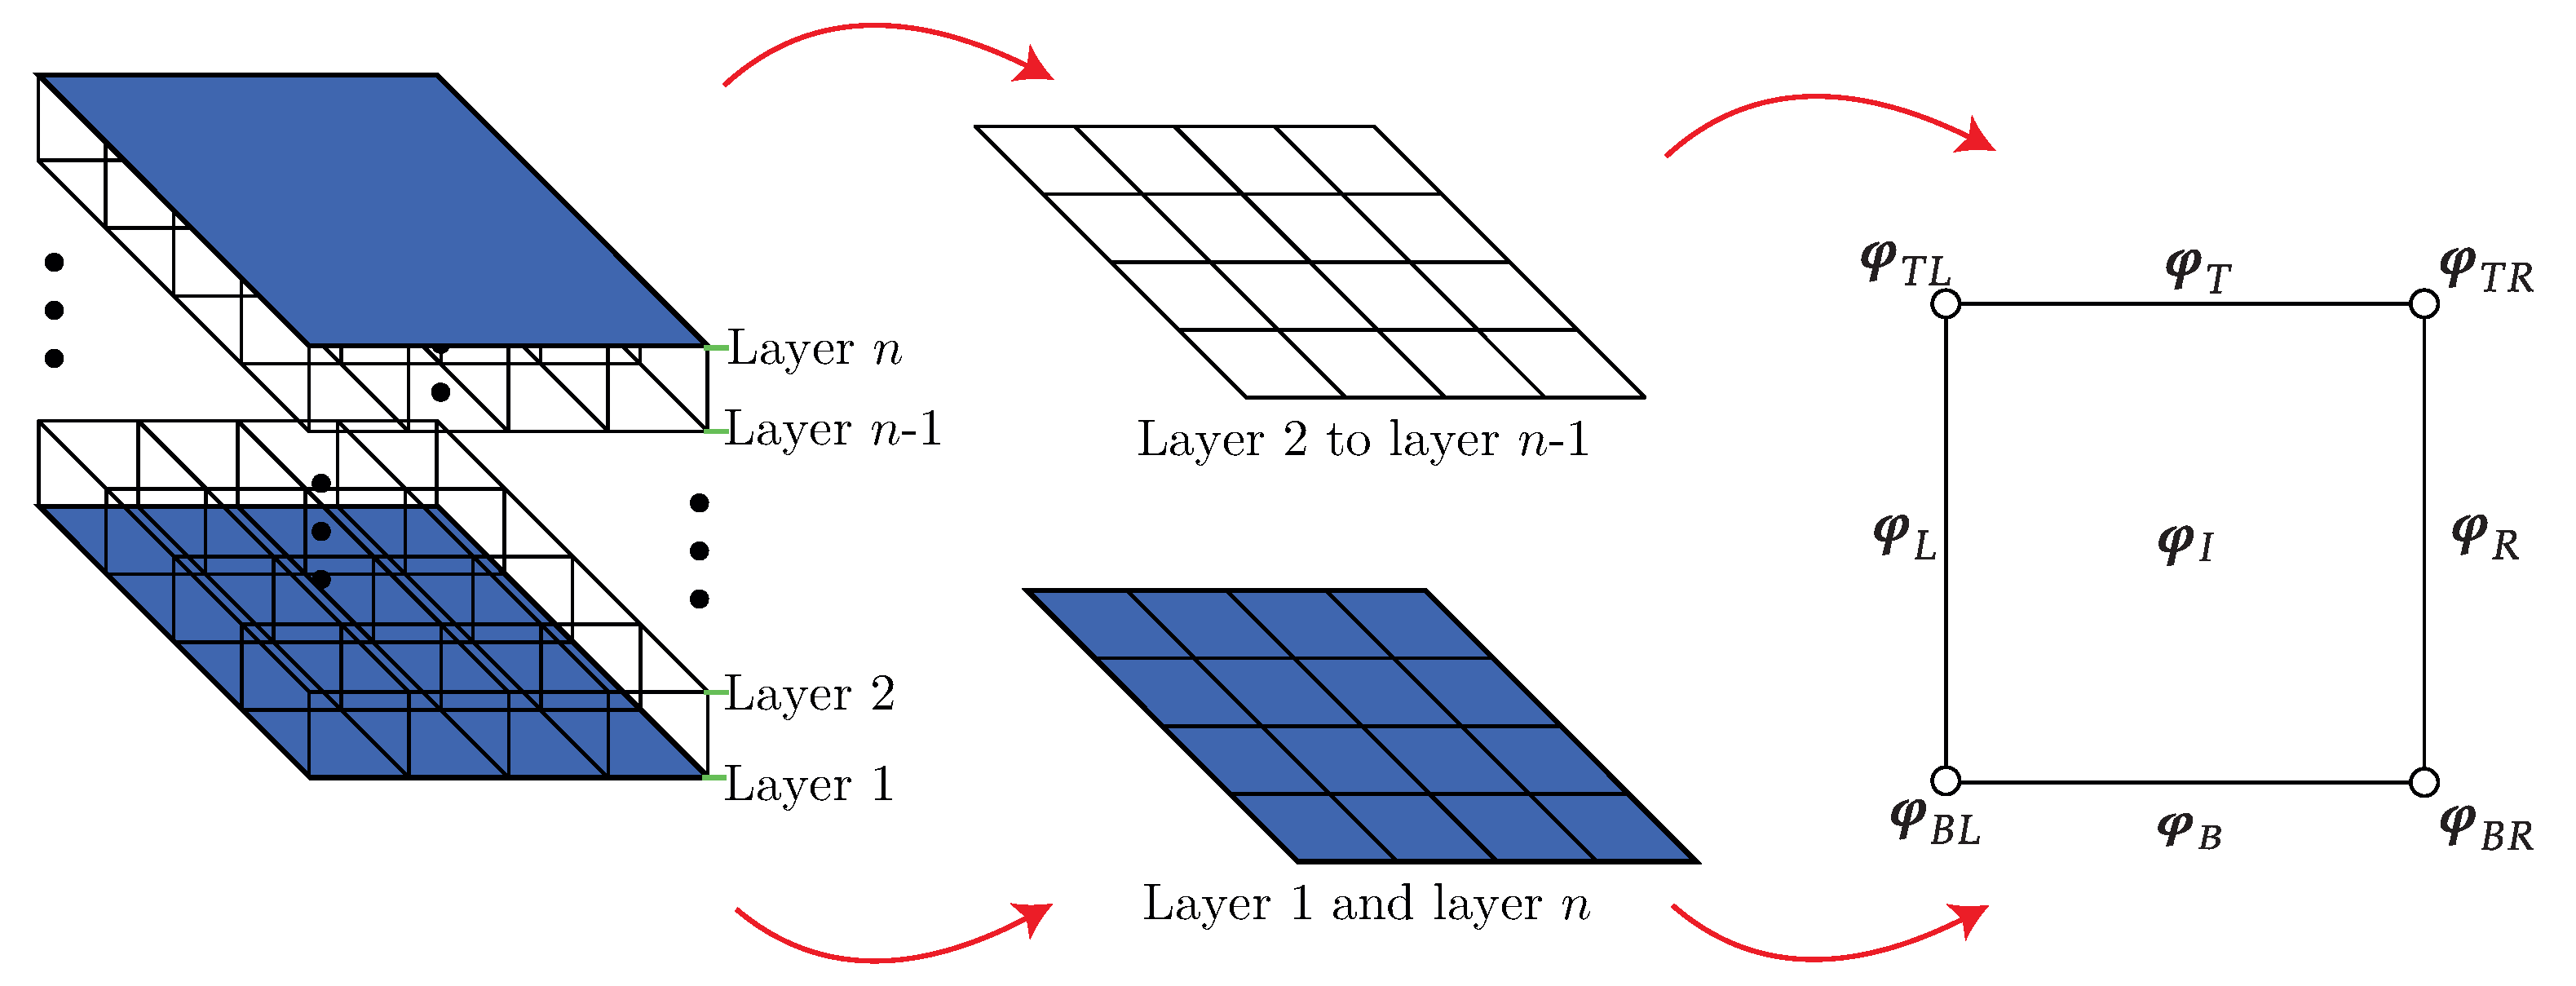
3.3. PST Applied to the Sandwich Panel
4. Optimization Problem
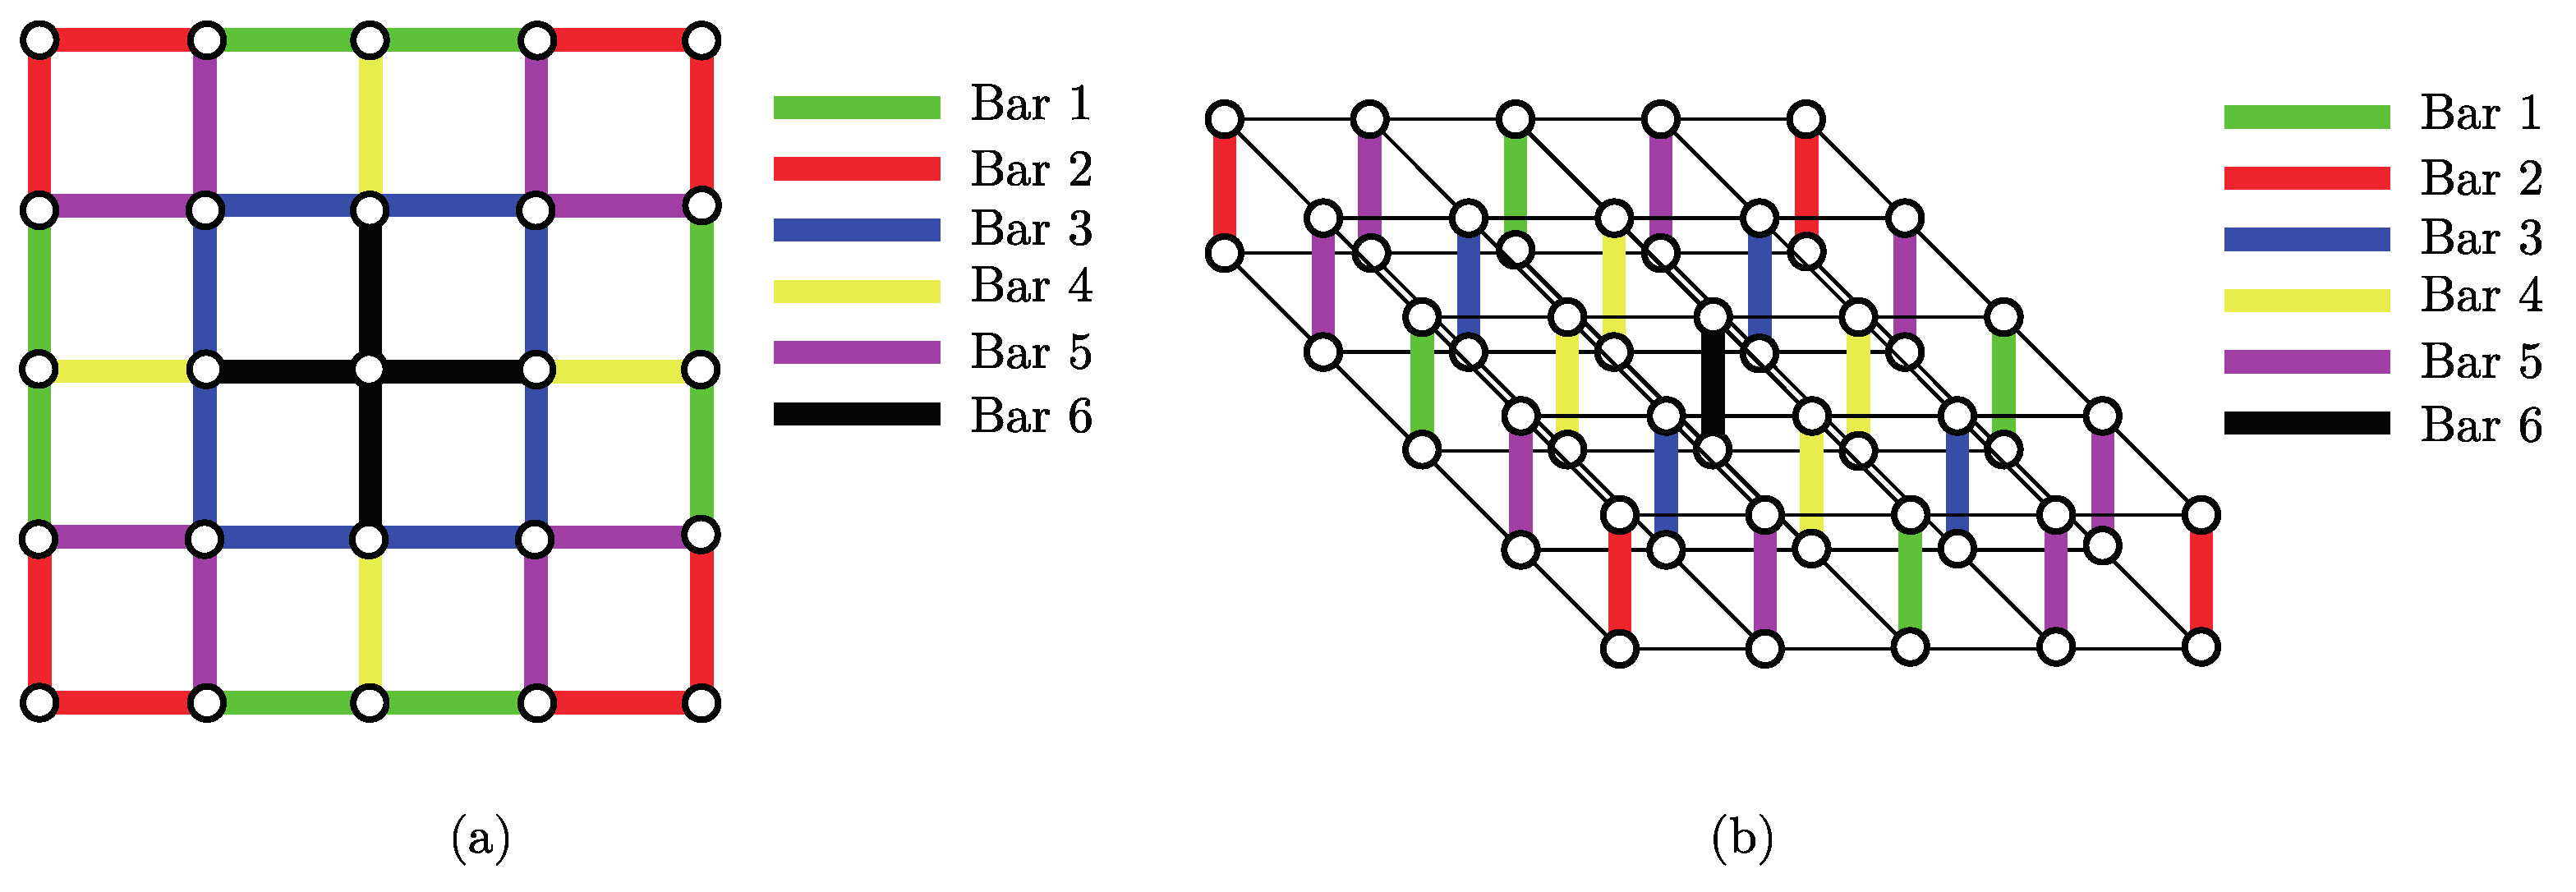
4.1. Design Variables
4.2. Optimization
4.3. Sensitivity Analysis
5. Results
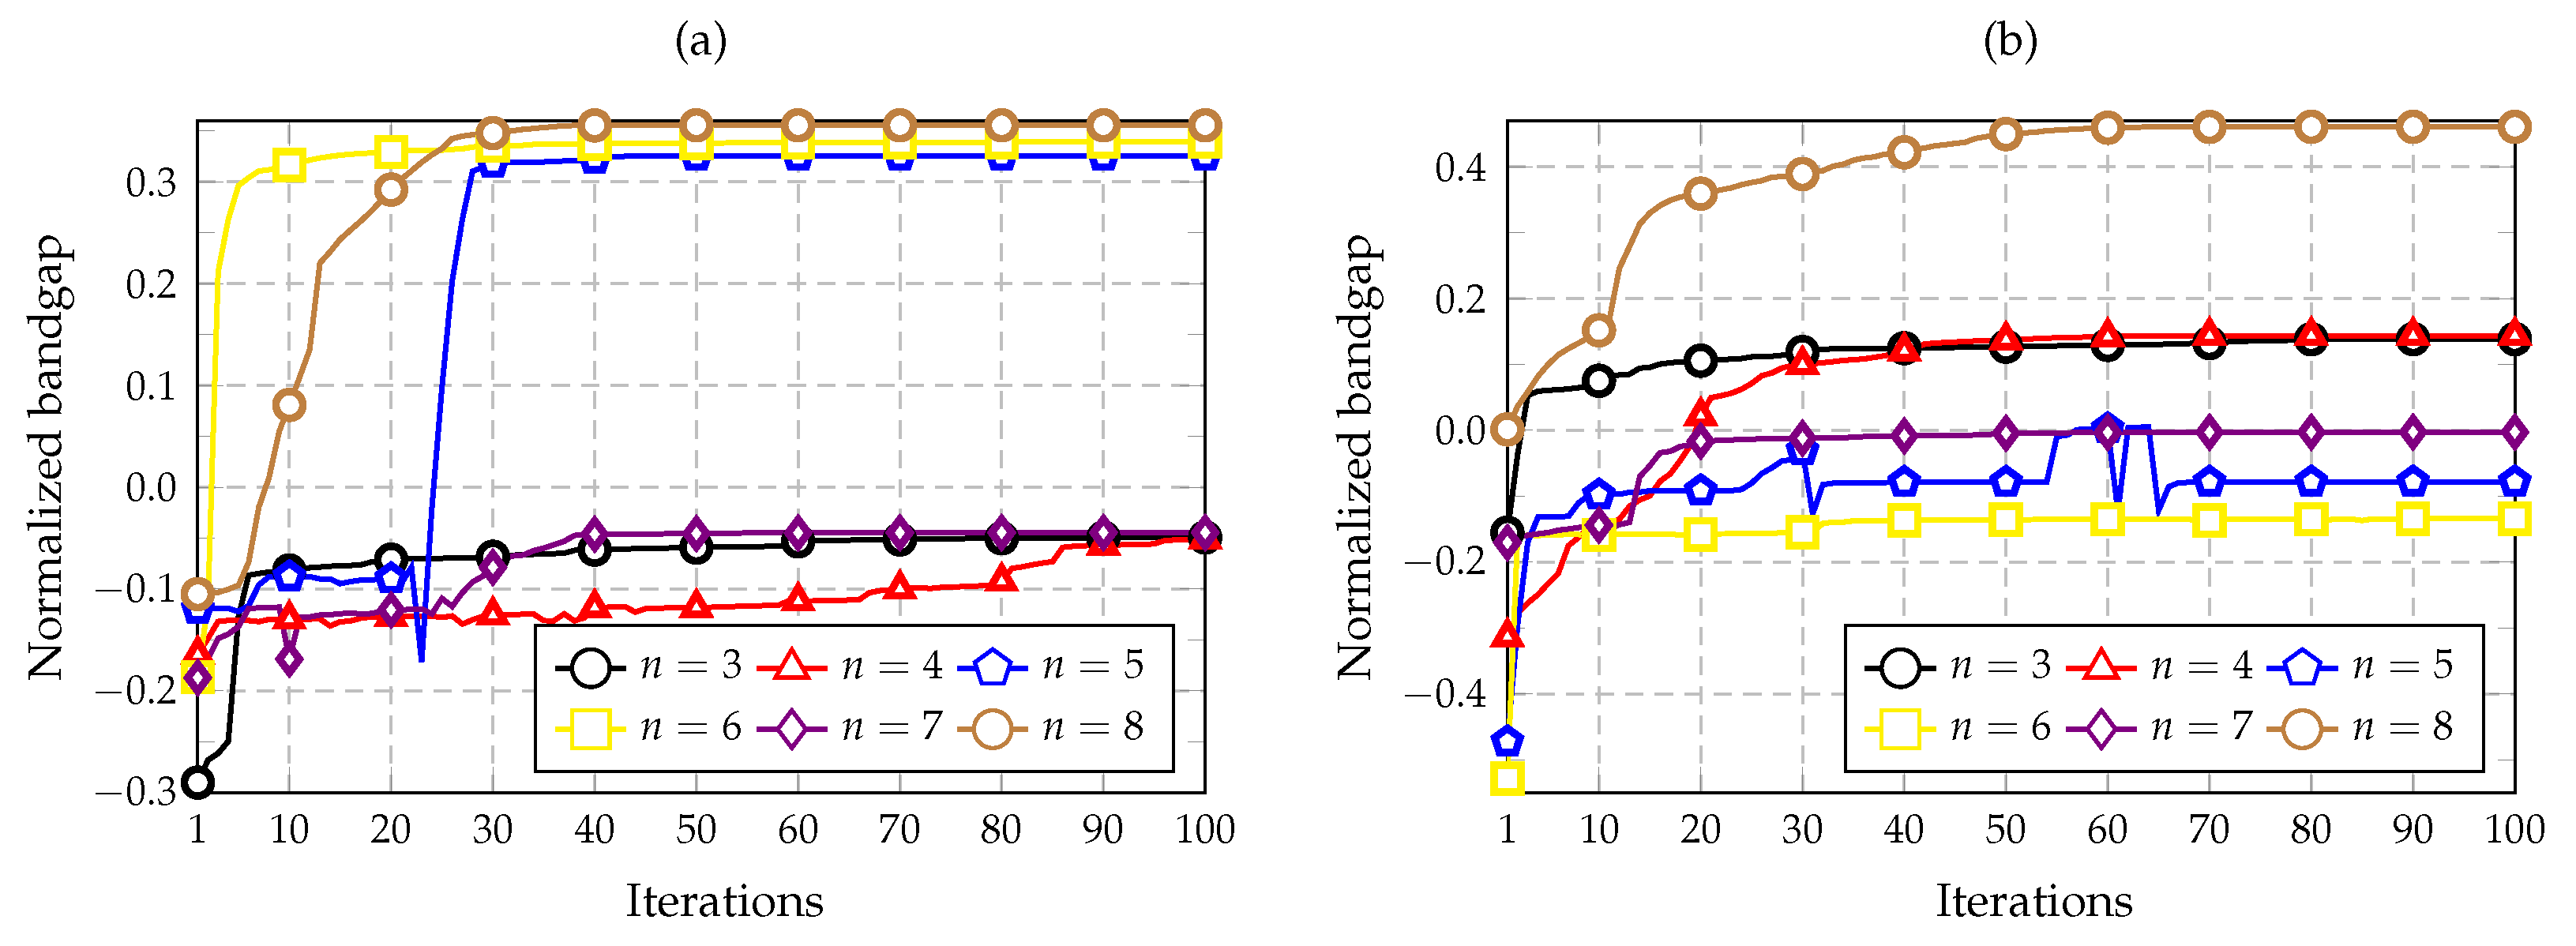
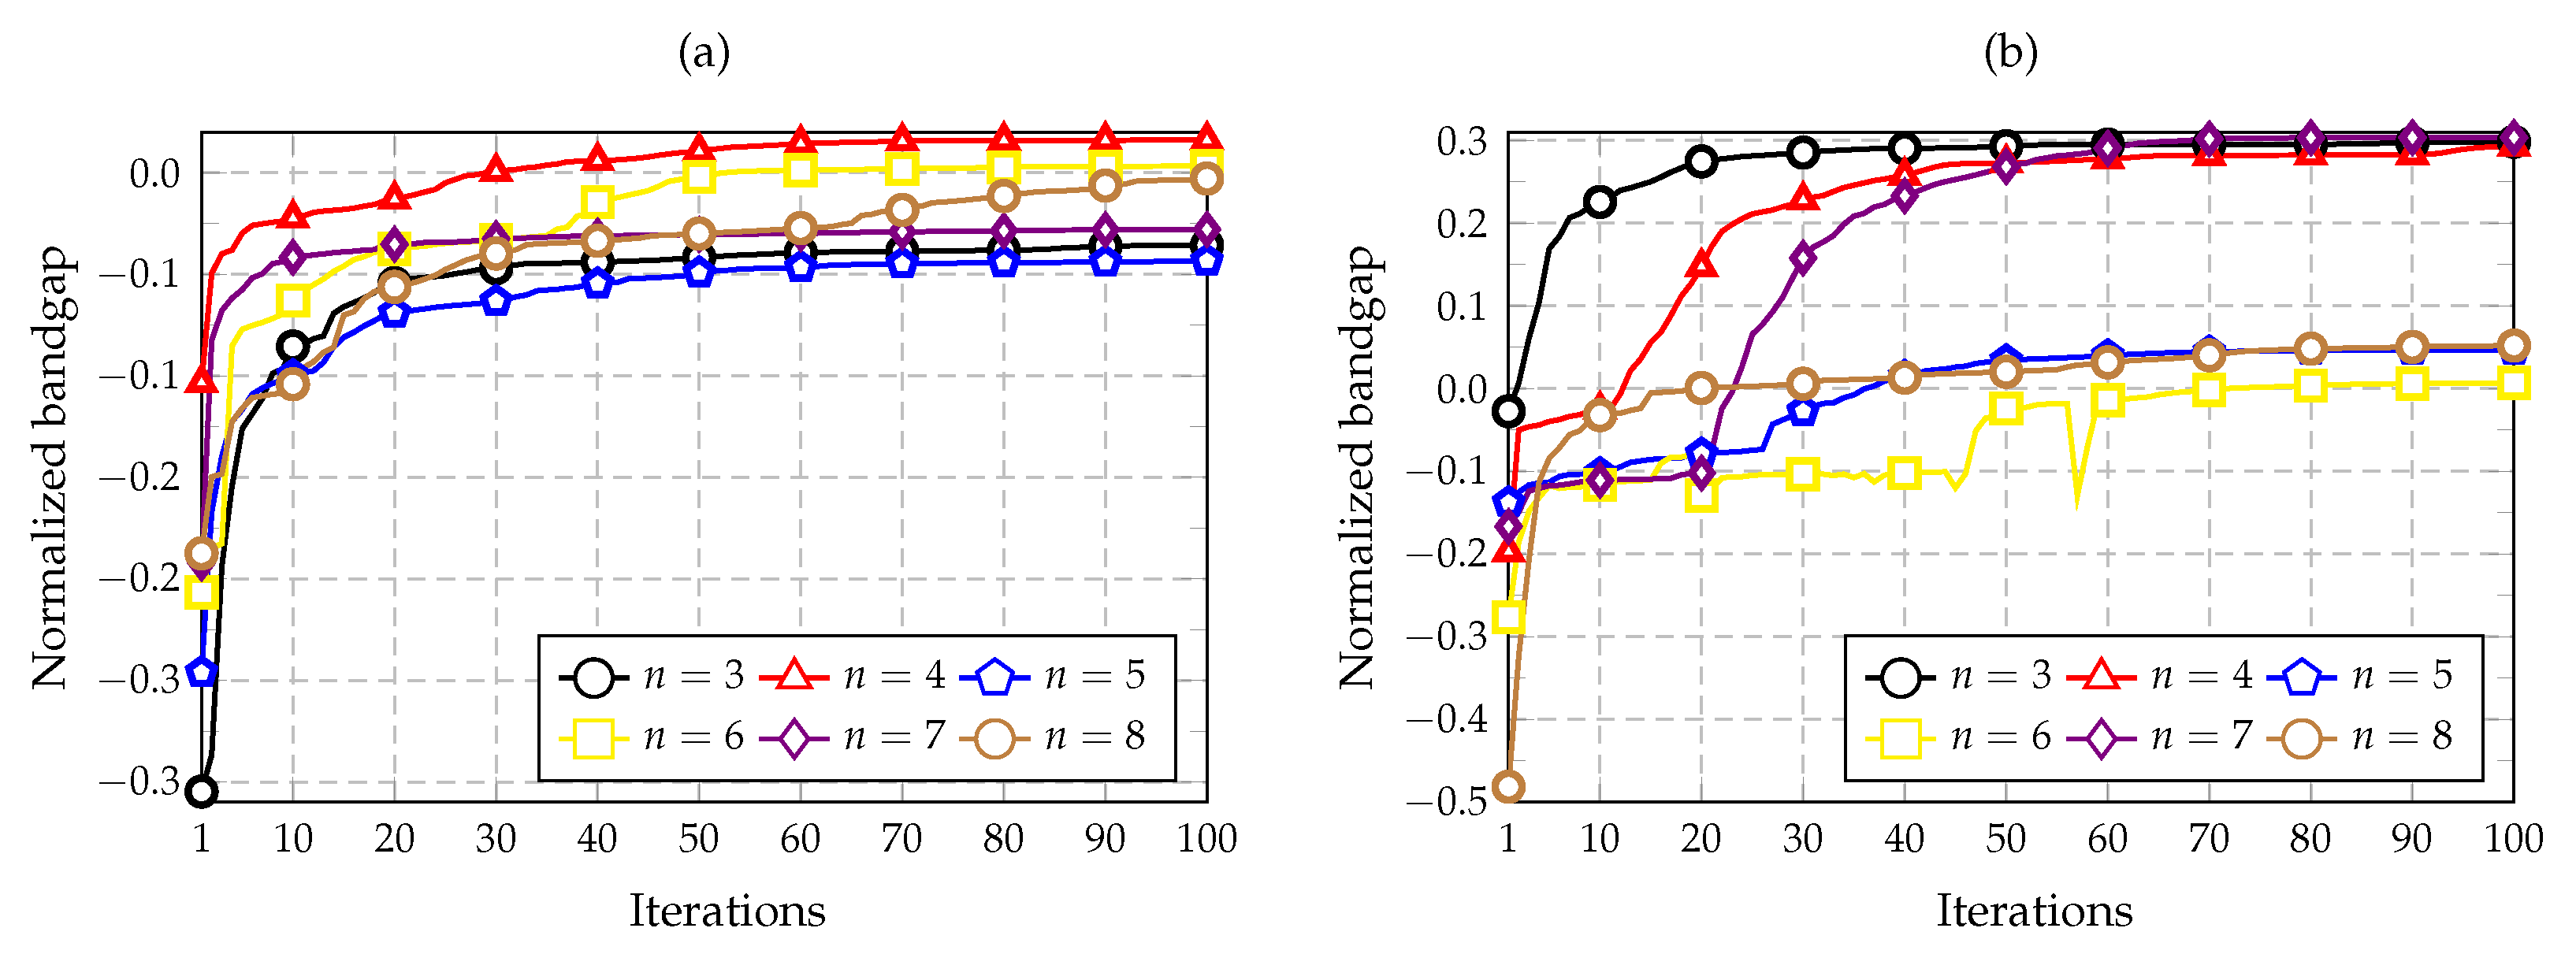
5.1. Convergence: Results Verification
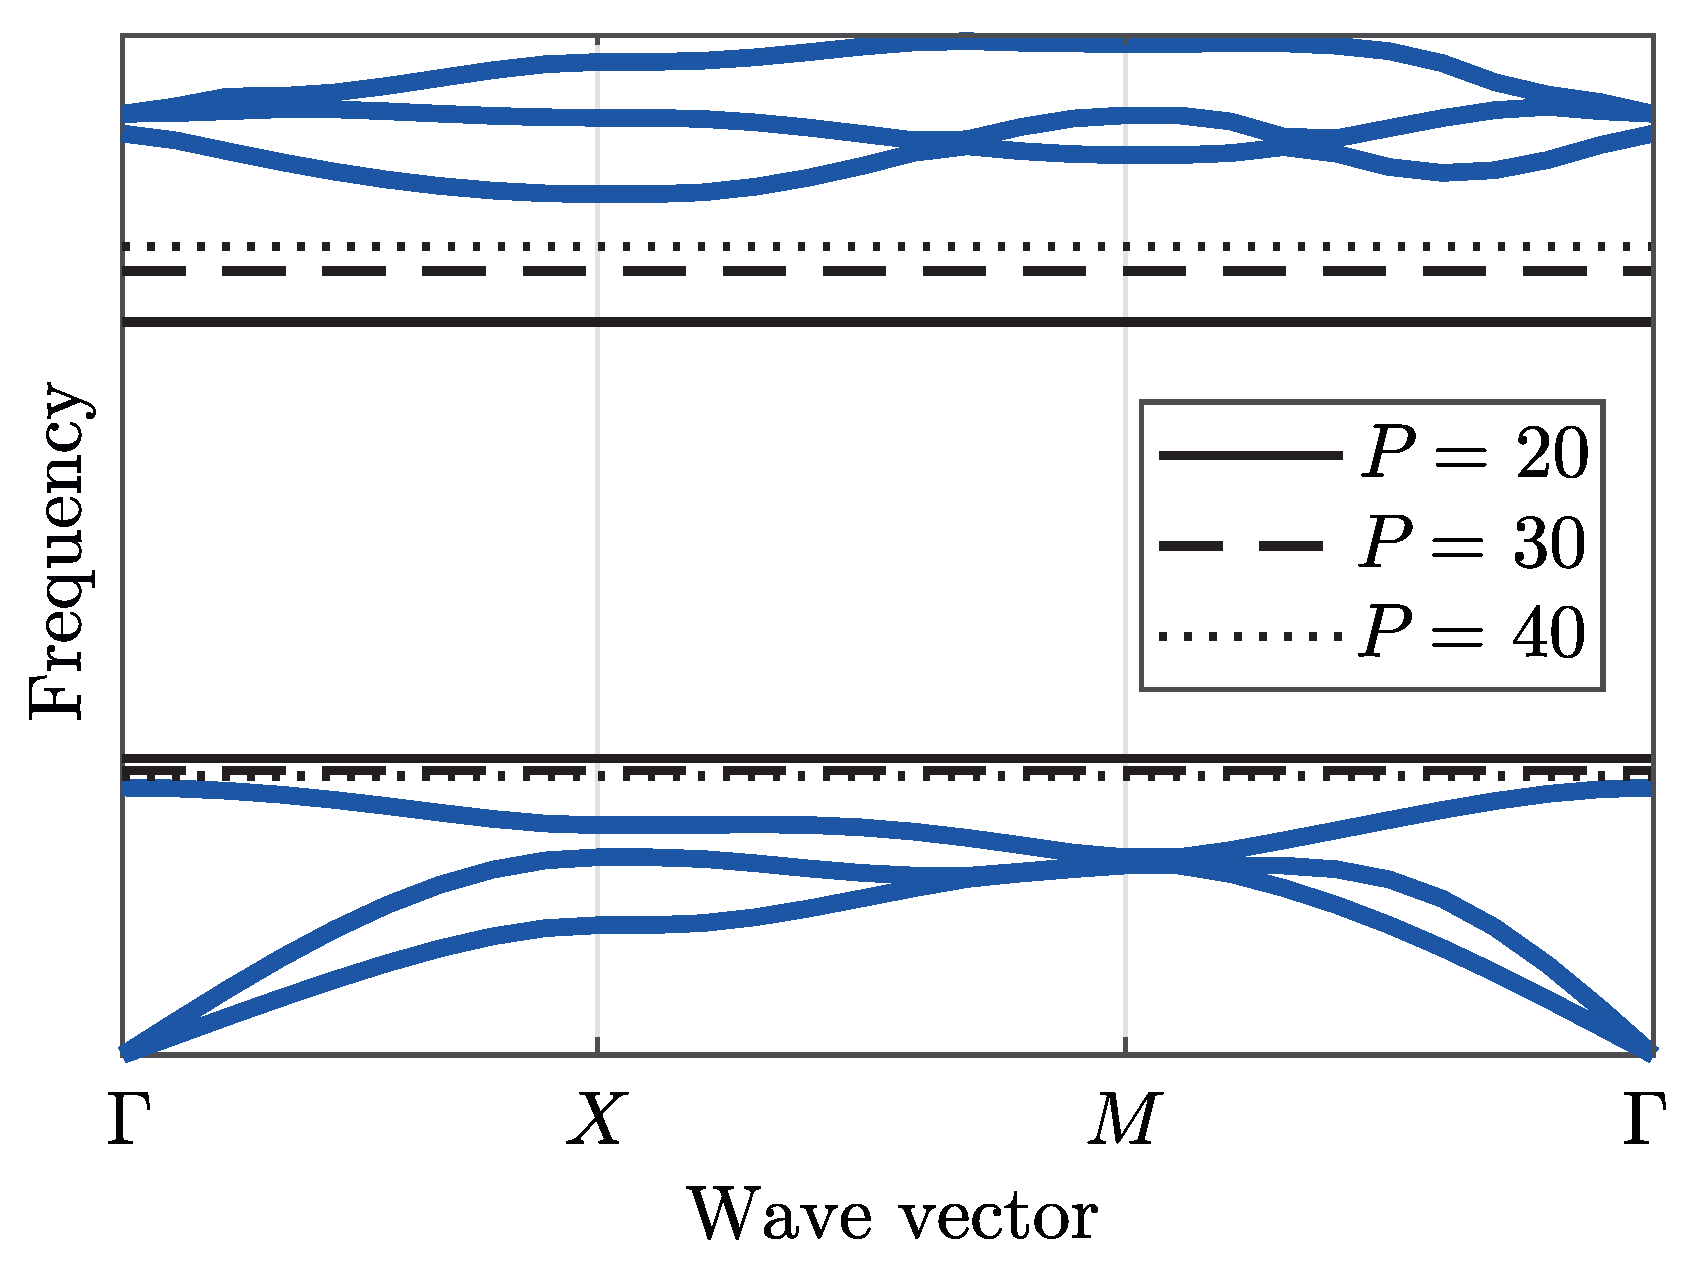
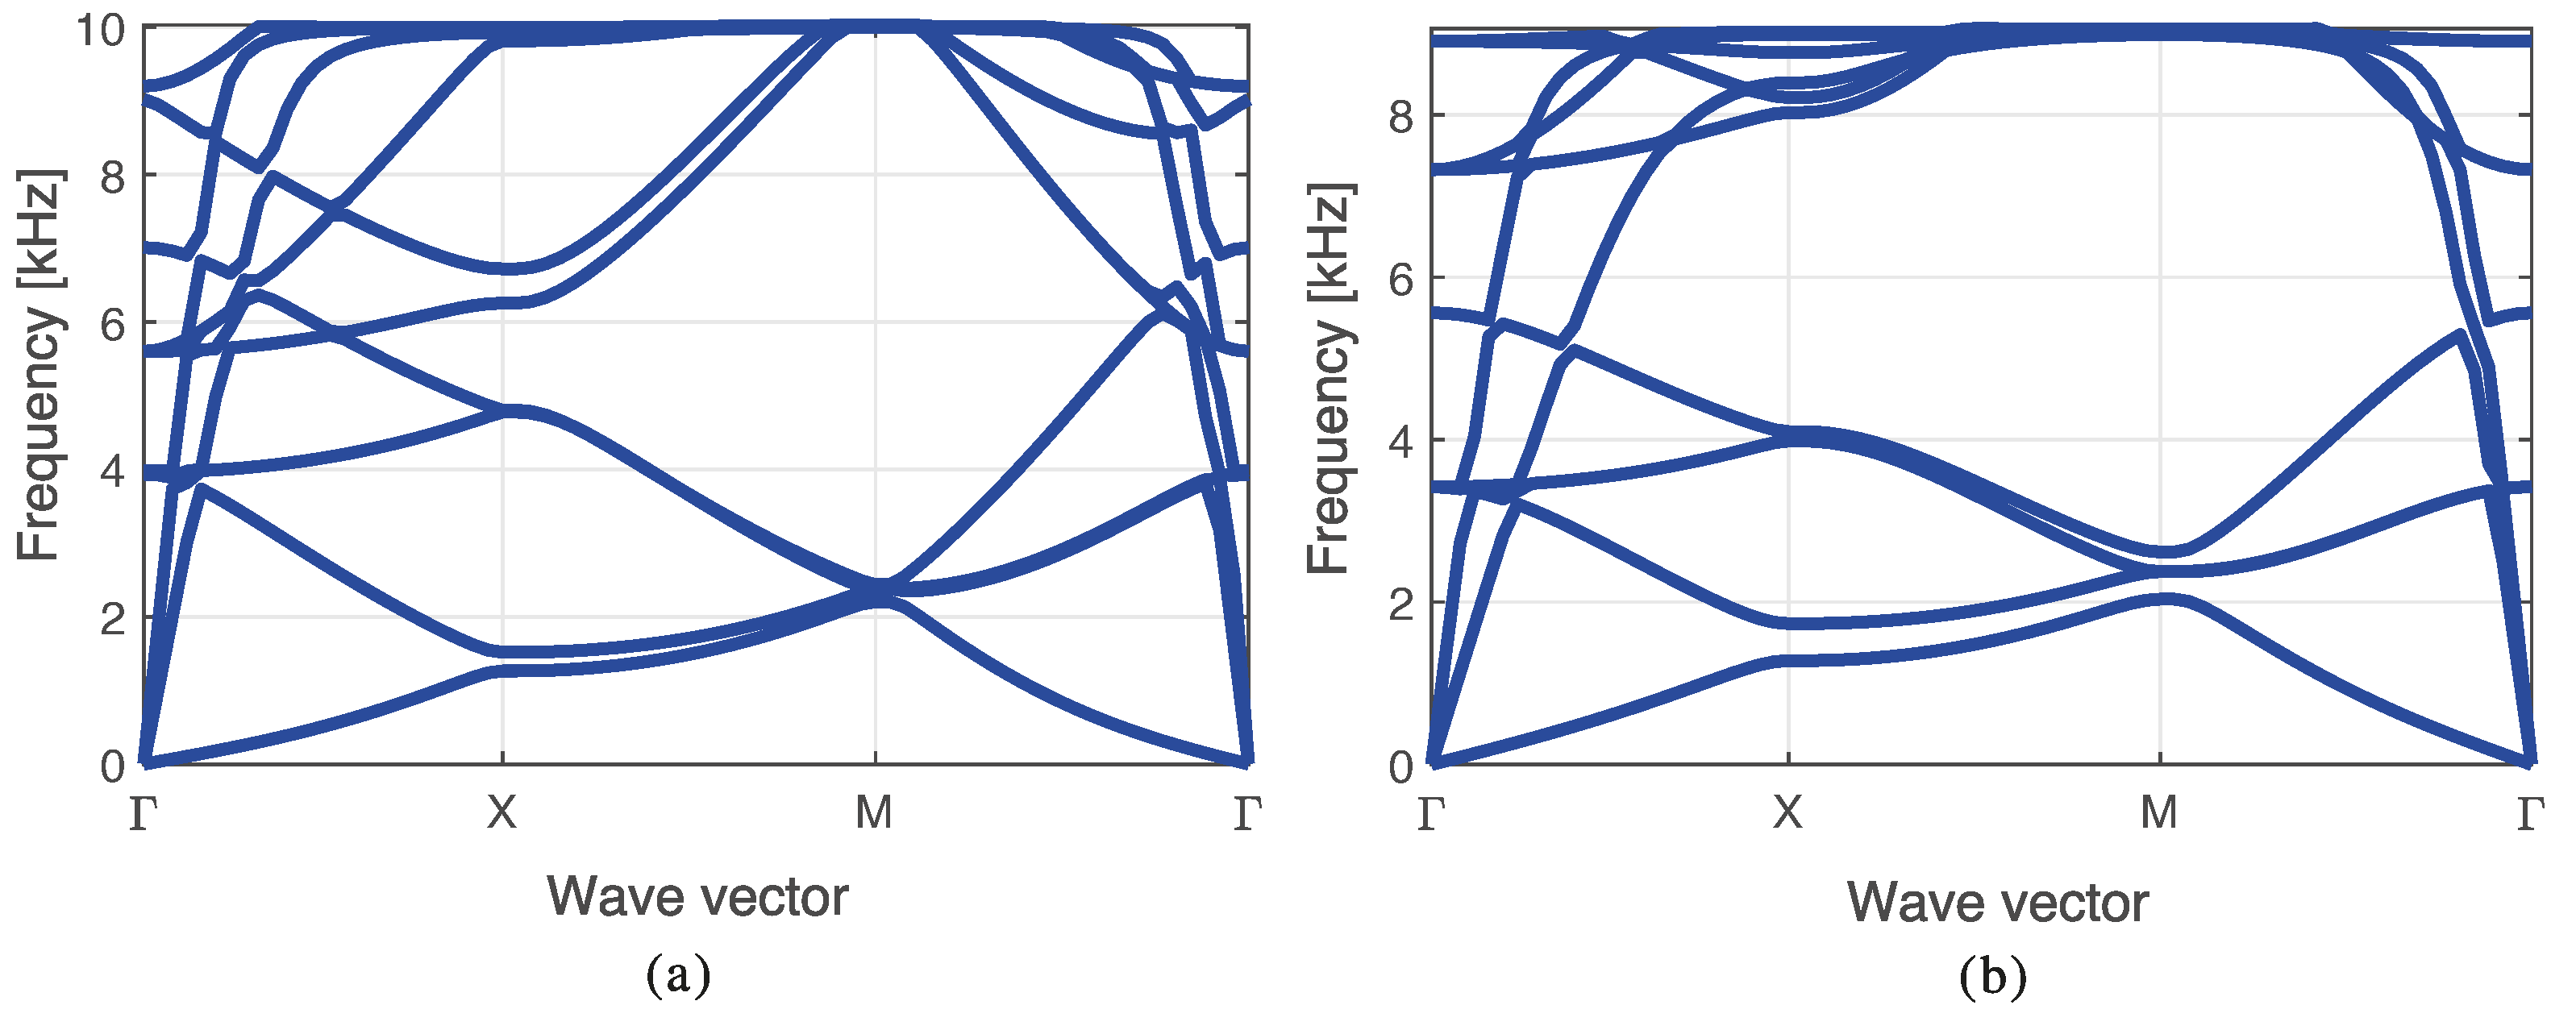
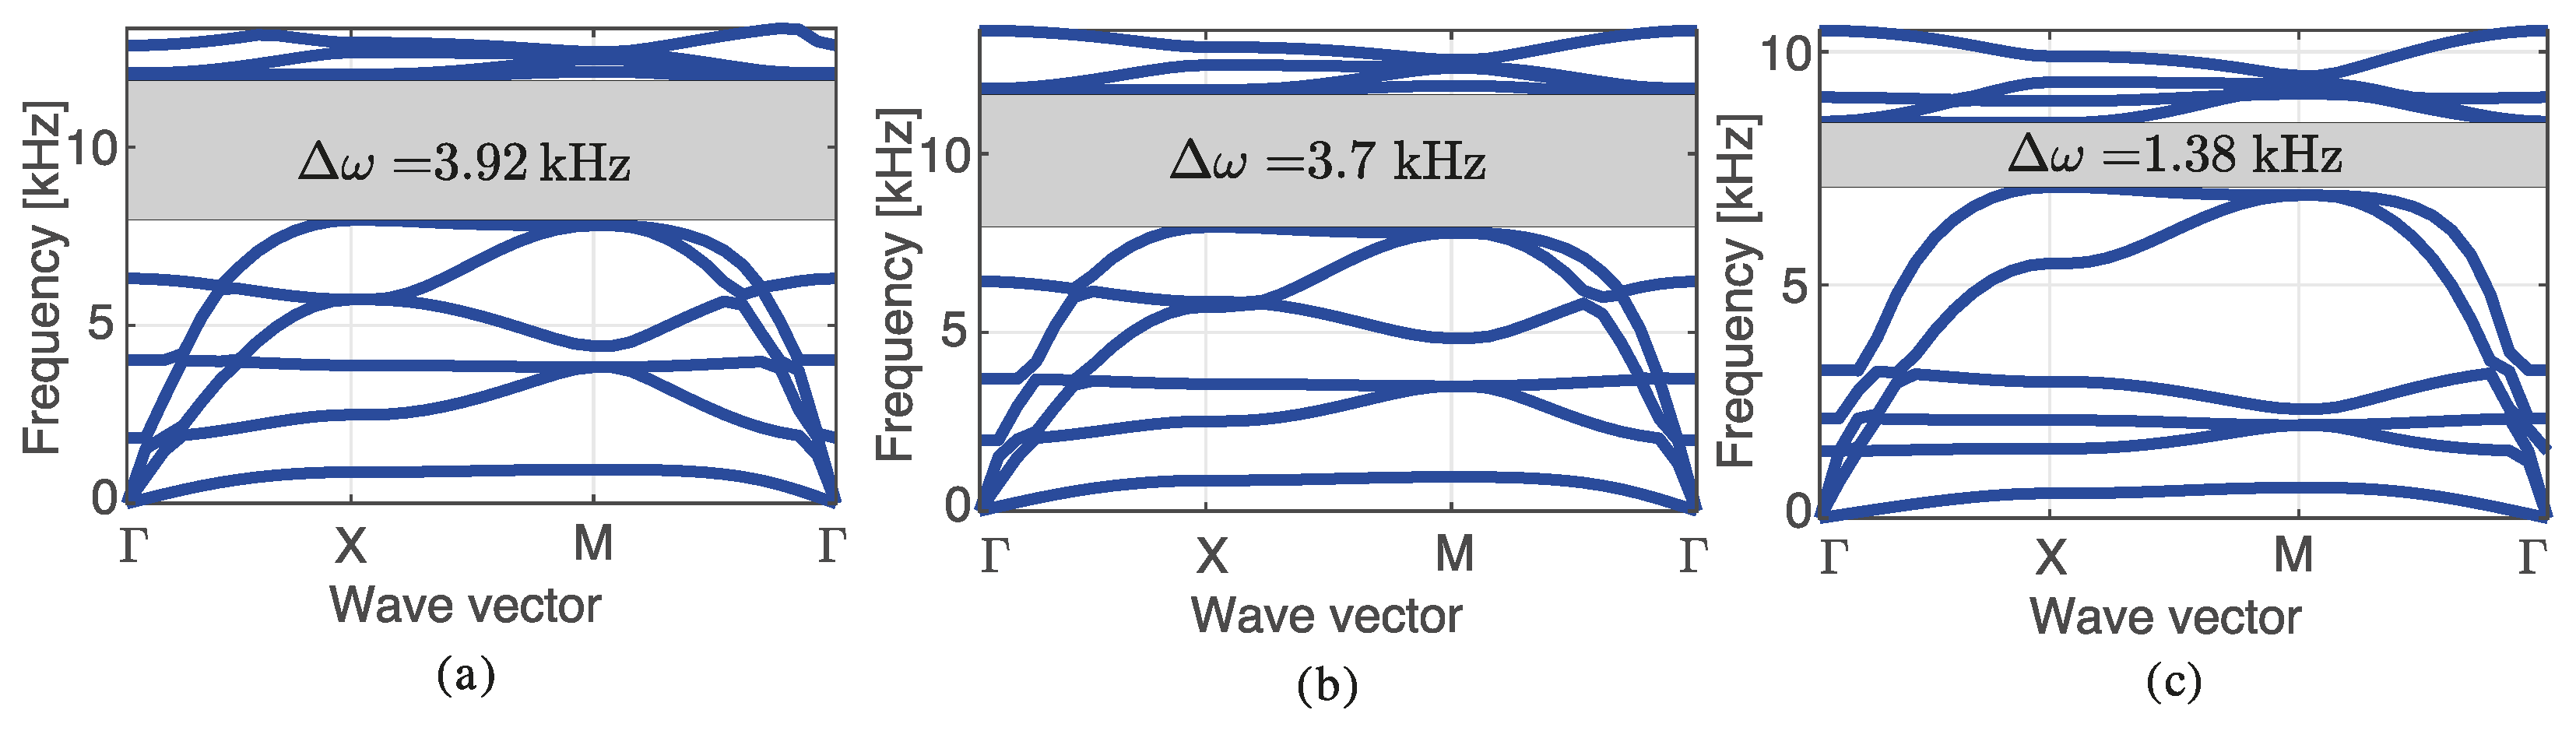
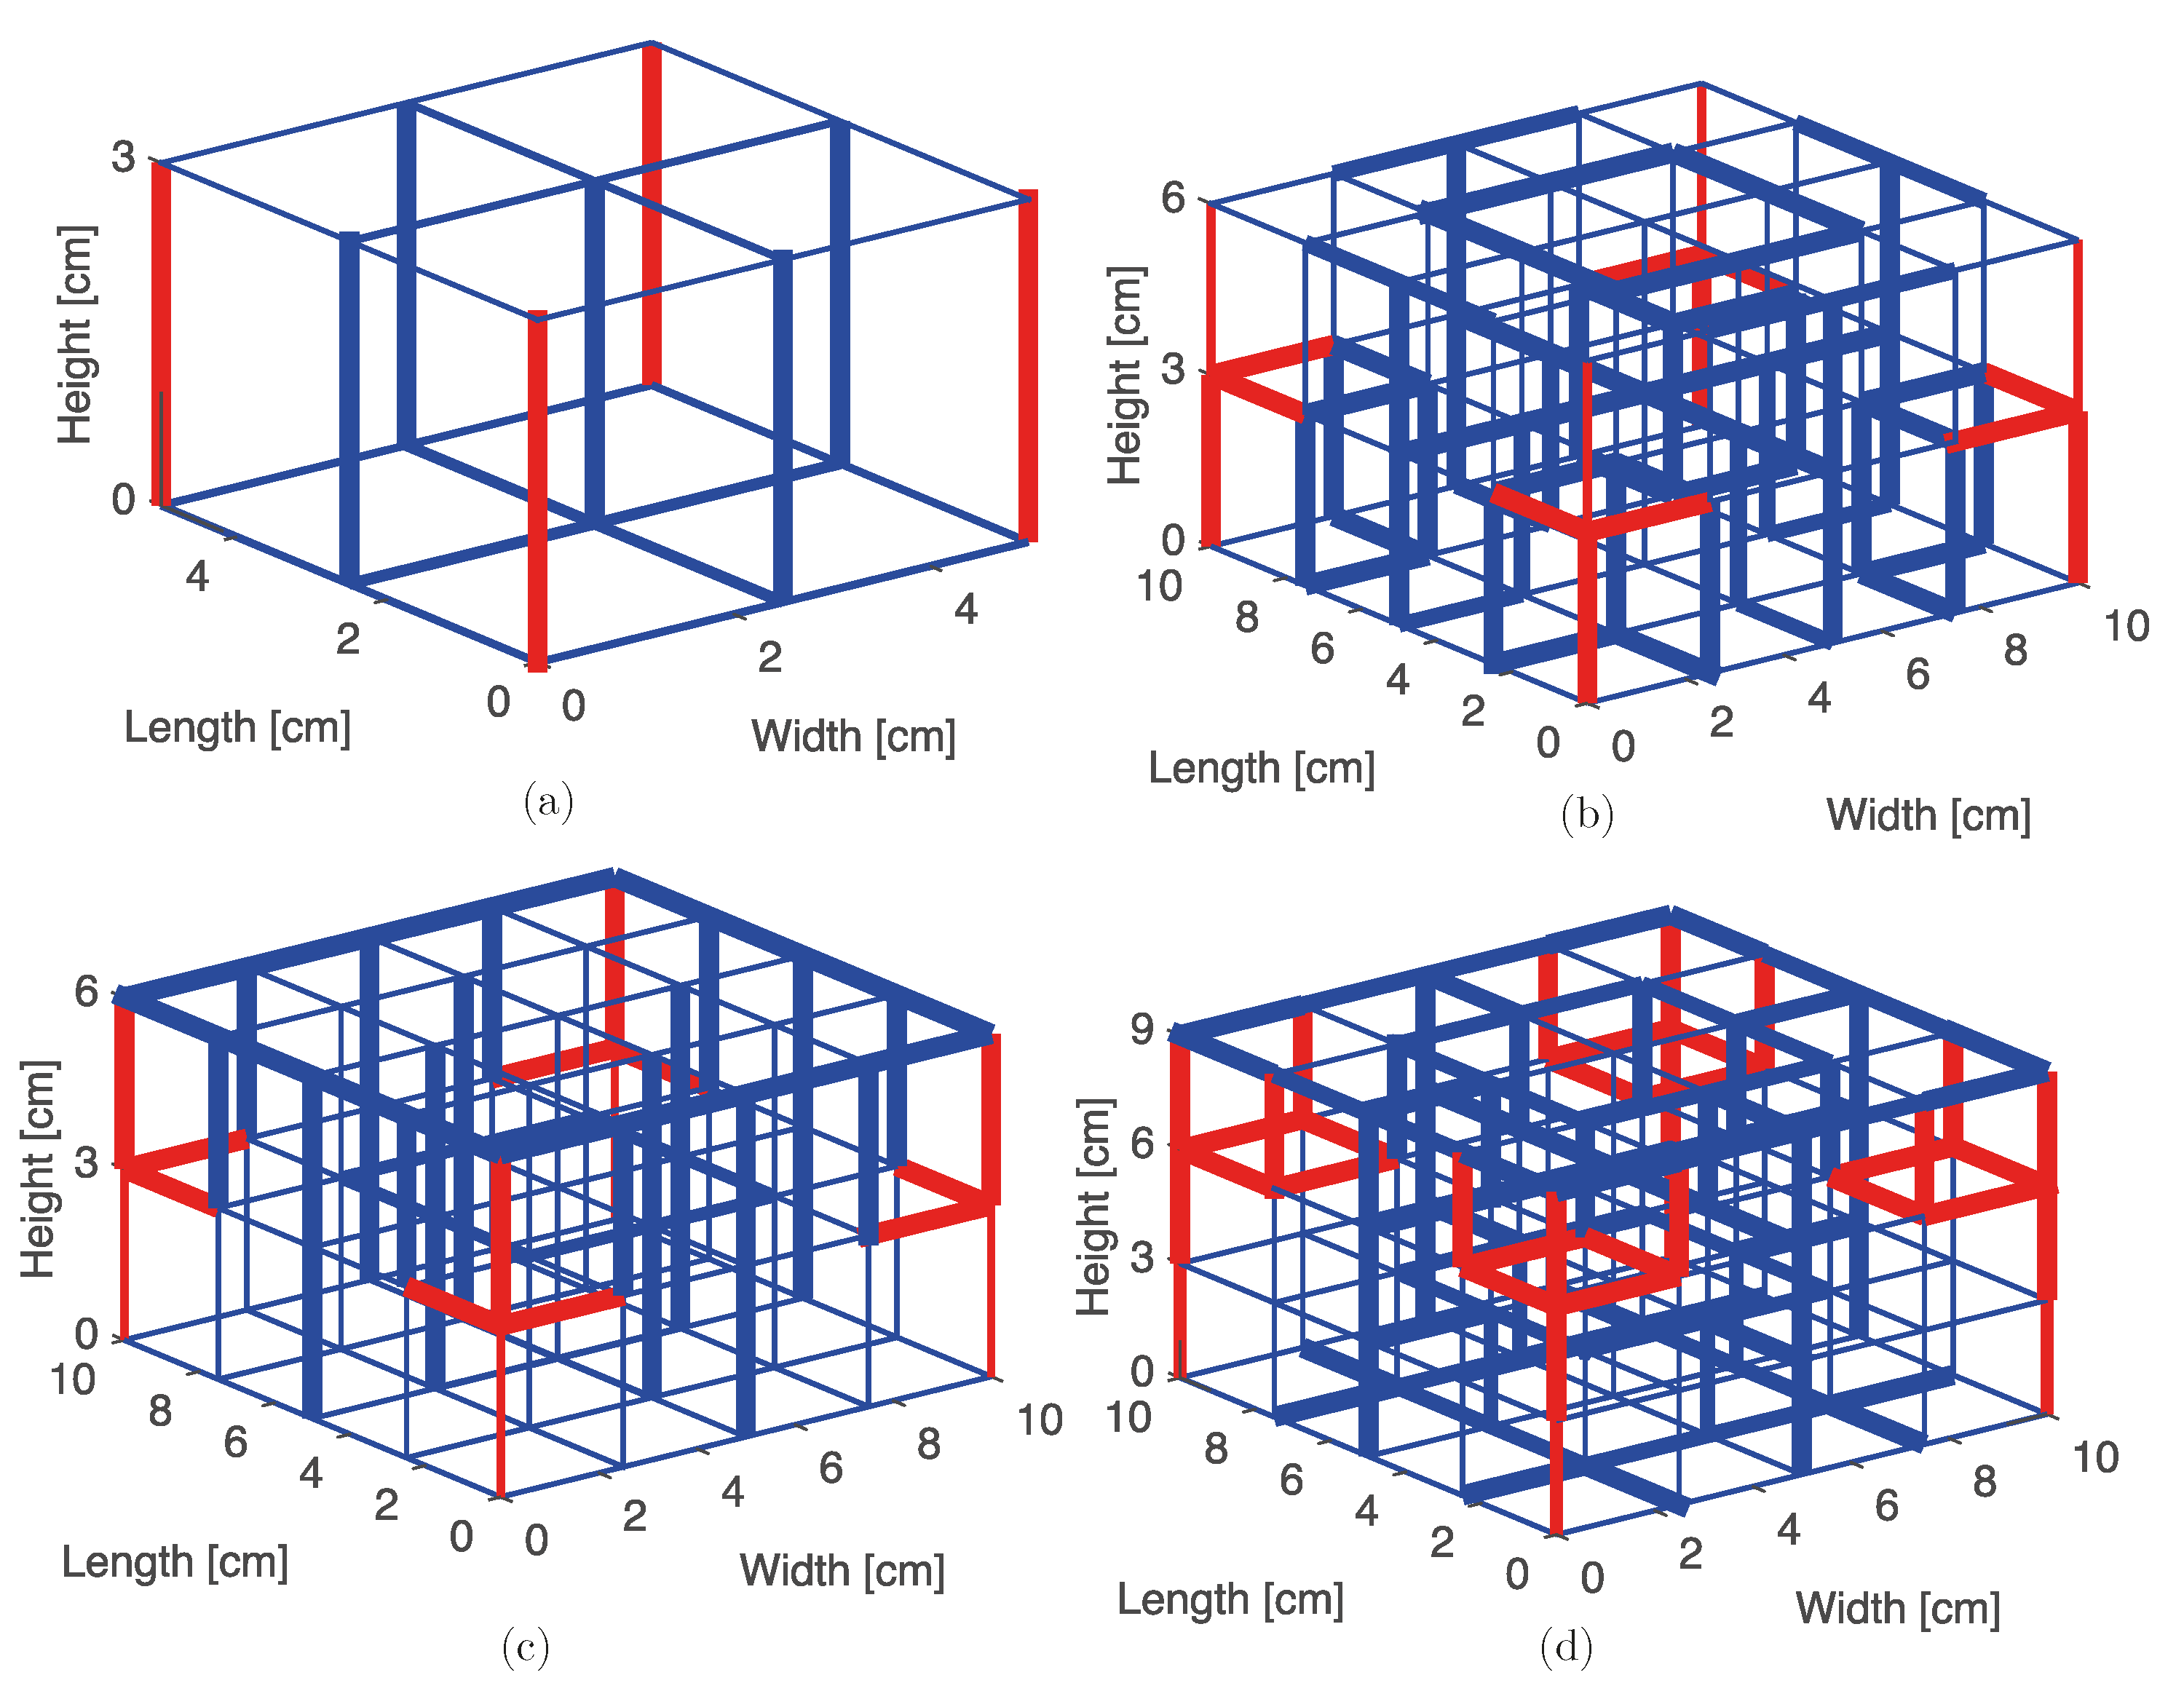
5.2. Band Diagram and Lattice Topology
6. Conclusions
Author Contributions
Funding
Institutional Review Board Statement
Informed Consent Statement
Data Availability Statement
Acknowledgments
Conflicts of Interest
References
- Schaedler, T.A.; Carter, W.B. Architected Cellular Materials. Annu. Rev. Mater. Res. 2016, 46, 187–210. [Google Scholar] [CrossRef]
- Cheung, K.C.; Gershenfeld, N. Reversibly Assembled Cellular Composite Materials. Science 2013, 341, 1219–1221. [Google Scholar] [CrossRef] [PubMed] [Green Version]
- Cramer, N.B.; Cellucci, D.W.; Formoso, O.B.; Gregg, C.E.; Jenett, B.E.; Kim, J.H.; Lendraitis, M.; Swei, S.S.; Trinh, G.T.; Trinh, K.V.; et al. Elastic shape morphing of ultralight structures by programmable assembly. Smart Mater. Struct. 2019, 28, 055006. [Google Scholar] [CrossRef] [PubMed] [Green Version]
- Vinson, J.R. Sandwich Structures: Past, Present, and Future. In Sandwich Structures 7: Advancing with Sandwich Structures and Materials; Thomsen, O.T., Bozhevolnaya, E., Lyckegaard, A., Eds.; Springer: Dordrecht, The Netherlands, 2005; pp. 3–12. [Google Scholar]
- Liebold-Ribeiro, Y.; Körner, C. Phononic Band Gaps in Periodic Cellular Materials. Adv. Eng. Mater. 2014, 16, 328–334. [Google Scholar] [CrossRef]
- Hussein, M.I.; Leamy, M.J.; Ruzzene, M. Dynamics of Phononic Materials and Structures: Historical Origins, Recent Progress, and Future Outlook. Appl. Mech. Rev. 2014, 66, 040802. [Google Scholar] [CrossRef]
- Jensen, J. Phononic band gaps and vibrations in one- and two-dimensional mass–spring structures. J. Sound Vib. 2003, 266, 1053–1078. [Google Scholar] [CrossRef]
- Ruzzene, M.; Scarpa, F. Directional and band-gap behavior of periodic auxetic lattices. Phys. Status Solidi (b) 2005, 242, 665–680. [Google Scholar] [CrossRef]
- Warmuth, F.; Körner, C. Phononic Band Gaps in 2D Quadratic and 3D Cubic Cellular Structures. Materials 2015, 8, 8327–8337. [Google Scholar] [CrossRef] [Green Version]
- Wang, P.; Casadei, F.; Kang, S.H.; Bertoldi, K. Locally resonant band gaps in periodic beam lattices by tuning connectivity. Phys. Rev. B 2015, 91, 020103. [Google Scholar] [CrossRef] [Green Version]
- Yi, G.; Youn, B.D. A comprehensive survey on topology optimization of phononic crystals. Struct. Multidiscip. Optim. 2016, 54, 1315–1344. [Google Scholar] [CrossRef]
- Li, W.; Meng, F.; Chen, Y.; Li, Y.F.; Huang, X. Topology Optimization of Photonic and Phononic Crystals and Metamaterials: A Review. Adv. Theory Simul. 2019, 2, 1900017. [Google Scholar] [CrossRef]
- Bonnecaze, R.T.; Rodin, G.J.; Sigmund, O.; Søndergaard Jensen, J. Systematic design of phononic band-gap materials and structures by topology optimization. Philos. Trans. R. Soc. Lond. Ser. A Math. Phys. Eng. Sci. 2003, 361, 1001–1019. [Google Scholar] [CrossRef]
- Gazonas, G.A.; Weile, D.S.; Wildman, R.; Mohan, A. Genetic algorithm optimization of phononic bandgap structures. Int. J. Solids Struct. 2006, 43, 5851–5866. [Google Scholar] [CrossRef] [Green Version]
- Hussein, M.I.; Hamza, K.; Hulbert, G.M.; Saitou, K. Optimal synthesis of 2D phononic crystals for broadband frequency isolation. Waves Random Complex Media 2007, 17, 491–510. [Google Scholar] [CrossRef]
- Liu, Z.-F.; Wu, B.; He, C.-F. Band-gap optimization of two-dimensional phononic crystals based on genetic algorithm and FPWE. Waves Random Complex Media 2014, 24, 286–305. [Google Scholar] [CrossRef]
- Bilal, O.R.; Hussein, M.I. Optimization of Phononic Crystals for the Simultaneous Attenuation of out-of-Plane and in-Plane Waves. In Proceedings of the ASME International Mechanical Engineering Congress and Exposition, Denver, CO, USA, 11–17 November 2011; Volume 54945, pp. 969–972. [Google Scholar]
- Bilal, O.R.; Hussein, M.I. Ultrawide phononic band gap for combined in-plane and out-of-plane waves. Phys. Rev. E 2011, 84, 065701. [Google Scholar] [CrossRef] [PubMed] [Green Version]
- Dong, H.W.; Su, X.X.; Wang, Y.S.; Zhang, C. Topology optimization of two-dimensional asymmetrical phononic crystals. Phys. Lett. A 2014, 378, 434–441. [Google Scholar] [CrossRef]
- Diaz, A.R.; Haddow, A.G.; Ma, L. Design of band-gap grid structures. Struct. Multidiscip. Optim. 2005, 29, 418–431. [Google Scholar] [CrossRef]
- Halkær, S.; Sigmund, O.; Jensen, J.S. Inverse design of phononic crystals by topology optimization. Z. Krist. Cryst. Mater. 2005, 220, 895–905. [Google Scholar] [CrossRef]
- Halkjær, S.; Sigmund, O.; Jensen, J.S. Maximizing band gaps in plate structures. Struct. Multidiscip. Optim. 2006, 32, 263–275. [Google Scholar] [CrossRef]
- Vatanabe, S.L.; Silva, E.C.N. Design of phononic band gaps in functionally graded piezocomposite materials by using topology optimization. In Proceedings of the Behavior and Mechanics of Multifunctional Materials and Composites 2011, San Diego, CA, USA, 7–9 March 2011; Volume 7978, pp. 268–277. [Google Scholar]
- Vatanabe, S.L.; Paulino, G.H.; Silva, E.C.N. Maximizing phononic band gaps in piezocomposite materials by means of topology optimization. J. Acoust. Soc. Am. 2014, 136, 494–501. [Google Scholar] [CrossRef] [PubMed] [Green Version]
- Li, Y.F.; Huang, X.; Meng, F.; Zhou, S. Evolutionary topological design for phononic band gap crystals. Struct. Multidiscip. Optim. 2016, 54, 595–617. [Google Scholar] [CrossRef]
- Yi, G.; Shin, Y.C.; Yoon, H.; Jo, S.H.; Youn, B.D. Topology optimization for phononic band gap maximization considering a target driving frequency. JMST Adv. 2019, 1, 153–159. [Google Scholar] [CrossRef] [Green Version]
- Dong, H.W.; Su, X.X.; Wang, Y.S. Multi-objective optimization of two-dimensional porous phononic crystals. J. Phys. D Appl. Phys. 2014, 47, 155301. [Google Scholar] [CrossRef]
- Hedayatrasa, S.; Abhary, K.; Uddin, M.; Ng, C.T. Optimum design of phononic crystal perforated plate structures for widest bandgap of fundamental guided wave modes and maximized in-plane stiffness. J. Mech. Phys. Solids 2016, 89, 31–58. [Google Scholar] [CrossRef]
- Hedayatrasa, S.; Abhary, K.; Uddin, M.S.; Guest, J.K. Optimal design of tunable phononic bandgap plates under equibiaxial stretch. Smart Mater. Struct. 2016, 25, 055025. [Google Scholar] [CrossRef]
- Li, Y.F.; Huang, X.; Zhou, S. Topological Design of Cellular Phononic Band Gap Crystals. Materials 2016, 9, 186. [Google Scholar] [CrossRef] [PubMed] [Green Version]
- Torii, A.J.; Faria, J.R.D. Structural optimization considering smallest magnitude eigenvalues: A smooth approximation. J. Braz. Soc. Mech. Sci. Eng. 2017, 39, 1745–1754. [Google Scholar] [CrossRef]
- Quinteros, L.; Meruane, V.; Cardoso, E.L. Phononic band gap optimization in truss-like cellular structures using smooth P-norm approximations. Struct. Multidiscip. Optim. 2021, 64, 113–124. [Google Scholar] [CrossRef]
- Liu, J.S.; Lu, T.J. Multi-objective and multi-loading optimization of ultralightweight truss materials. Int. J. Solids Struct. 2004, 41, 619–635. [Google Scholar] [CrossRef]
- Liu, T.; Deng, Z.; Lu, T. Design optimization of truss-cored sandwiches with homogenization. Int. J. Solids Struct. 2006, 43, 7891–7918. [Google Scholar] [CrossRef] [Green Version]
- Beli, D.; Arruda, J.; Ruzzene, M. Wave propagation in elastic metamaterial beams and plates with interconnected resonators. Int. J. Solids Struct. 2018, 139–140, 105–120. [Google Scholar] [CrossRef]
- Chen, J.; Sharma, B.; Sun, C. Dynamic behaviour of sandwich structure containing spring-mass resonators. Compos. Struct. 2011, 93, 2120–2125. [Google Scholar] [CrossRef]
- Phani, A.S.; Woodhouse, J.; Fleck, N.A. Wave propagation in two-dimensional periodic lattices. J. Acoust. Soc. Am. 2006, 119, 1995–2005. [Google Scholar] [CrossRef] [PubMed] [Green Version]
- Setyawan, W.; Curtarolo, S. High-throughput electronic band structure calculations: Challenges and tools. Comput. Mater. Sci. 2010, 49, 299–312. [Google Scholar] [CrossRef] [Green Version]
- Kittel, C.; McEuen, P.; McEuen, P. Introduction to Solid State Physics; Wiley: New York, NY, USA, 1996; Volume 8. [Google Scholar]
- Brillouin, L. Wave Propagation in Periodic Structures: Electric Filters and Crystal Lattices, 2nd ed.; Dover Publications: New York, NY, USA, 1953; pp. 94–121. [Google Scholar]
- Bathe, K.J. Finite Element Procedures, 2nd ed.; Prentice Hall: Upper Saddle River, NJ, USA, 1996; pp. 397–450. [Google Scholar]
- Langlet, P.; Hladky-Hennion, A.; Decarpigny, J. Analysis of the propagation of plane acoustic waves in passive periodic materials using the finite element method. J. Acoust. Soc. Am. 1995, 98, 2792–2800. [Google Scholar] [CrossRef]
- Bendsøe, M.P.; Sigmund, O. Material interpolation schemes in topology optimization. Arch. Appl. Mech. 1999, 69, 635–654. [Google Scholar] [CrossRef]
- Bendsøe, M.P.; Sigmund, O. Topology Optimization: Theory, Methods and Applications, 2nd ed.; Springer: Berlin/Heidelberg, Germany, 2004; pp. 138–147. [Google Scholar]
- Gravesen, J.; Evgrafov, A.; Nguyen, D.M. On the sensitivities of multiple eigenvalues. Struct. Multidiscip. Optim. 2011, 44, 583–587. [Google Scholar] [CrossRef] [Green Version]
- Haftka, R.T.; Zafer, G. Elements of Structural Optimization, 3rd ed.; Kluwer Academic Publ.: Dordrecht, The Netherlands, 1992; pp. 276–290. [Google Scholar]
- Svanberg, K. A Class of Globally Convergent Optimization Methods Based on Conservative Convex Separable Approximations. SIAM J. Optim. 2002, 12, 555–573. [Google Scholar] [CrossRef] [Green Version]
- Svanberg, K. MMA and GCMMA-Two Methods for Nonlinear Optimization; Technical Report; KTH Royal Institute of Technology: Stockholm, Sweden, 2007; Volume 1, pp. 1–15. [Google Scholar]
- Iman, R.; Davenport, J.; Zeigler, D. Latin Hypercube Sampling (Program User’s Guide); Sandia Labs: Albuquerque, NW, USA, 1980; pp. 1–27.


| Name | Symbol | Value |
|---|---|---|
| Aluminum density | 2700 kg/m3 | |
| Tungsten density | 19,300 kg/m3 | |
| Aluminum elastic modulus | 70 | |
| Tungsten elastic modulus | 411 | |
| Aluminum Poisson’s ratio | 0.28 | |
| Tungsten Poisson’s ratio | 0.33 | |
| Lower cross-section diameter | 2 | |
| Upper cross-section diameter | 8 | |
| Cell length | 2.5 | |
| Distance between lattice | 3.0 | |
| P-norm value | P | 30 |
| Number of eigenvalues considered in the P-norm approximation | m | 15 |
| Number of points in | 30 | |
| Refinement parameter | 3 |
| Number of Cells | Band Maximized n | P-Norm | Post-Processed | ||||
|---|---|---|---|---|---|---|---|
| , | 5 | 0.325 | 0.065 | 0.186 | 0.284 | 0.300 | 0.284 |
| 6 | 0.339 | 0.514 | 0.412 | 0.391 | 0.382 | 0.378 | |
| 8 | 0.355 | 0.484 | 0.335 | 0.303 | 0.285 | 0.273 | |
| , | 3 | 0.078 | 0.235 | 0.188 | 0.143 | 0.113 | 0.094 |
| 4 | 0.143 | 0.234 | 0.206 | 0.148 | 0.115 | 0.100 | |
| 8 | 0.460 | 0.154 | 0.061 | 0.042 | 0.031 | 0.021 | |
| , | 4 | 0.016 | −0.005 | −0.059 | −0.075 | −0.095 | −0.109 |
| , | 3 | 0.298 | 0.362 | 0.352 | 0.342 | 0.336 | 0.333 |
| 4 | 0.292 | 0.349 | 0.331 | 0.310 | 0.297 | 0.290 | |
| 7 | 0.303 | 0.348 | 0.338 | 0.325 | 0.320 | 0.319 | |
| Number of Cells | P-Norm | Post-Processed | ||||
|---|---|---|---|---|---|---|
| 0.077 | 0.049 | −0.034 | −0.116 | −0.179 | −0.217 | |
| 0.309 | 0.371 | 0.358 | 0.342 | 0.333 | 0.329 | |
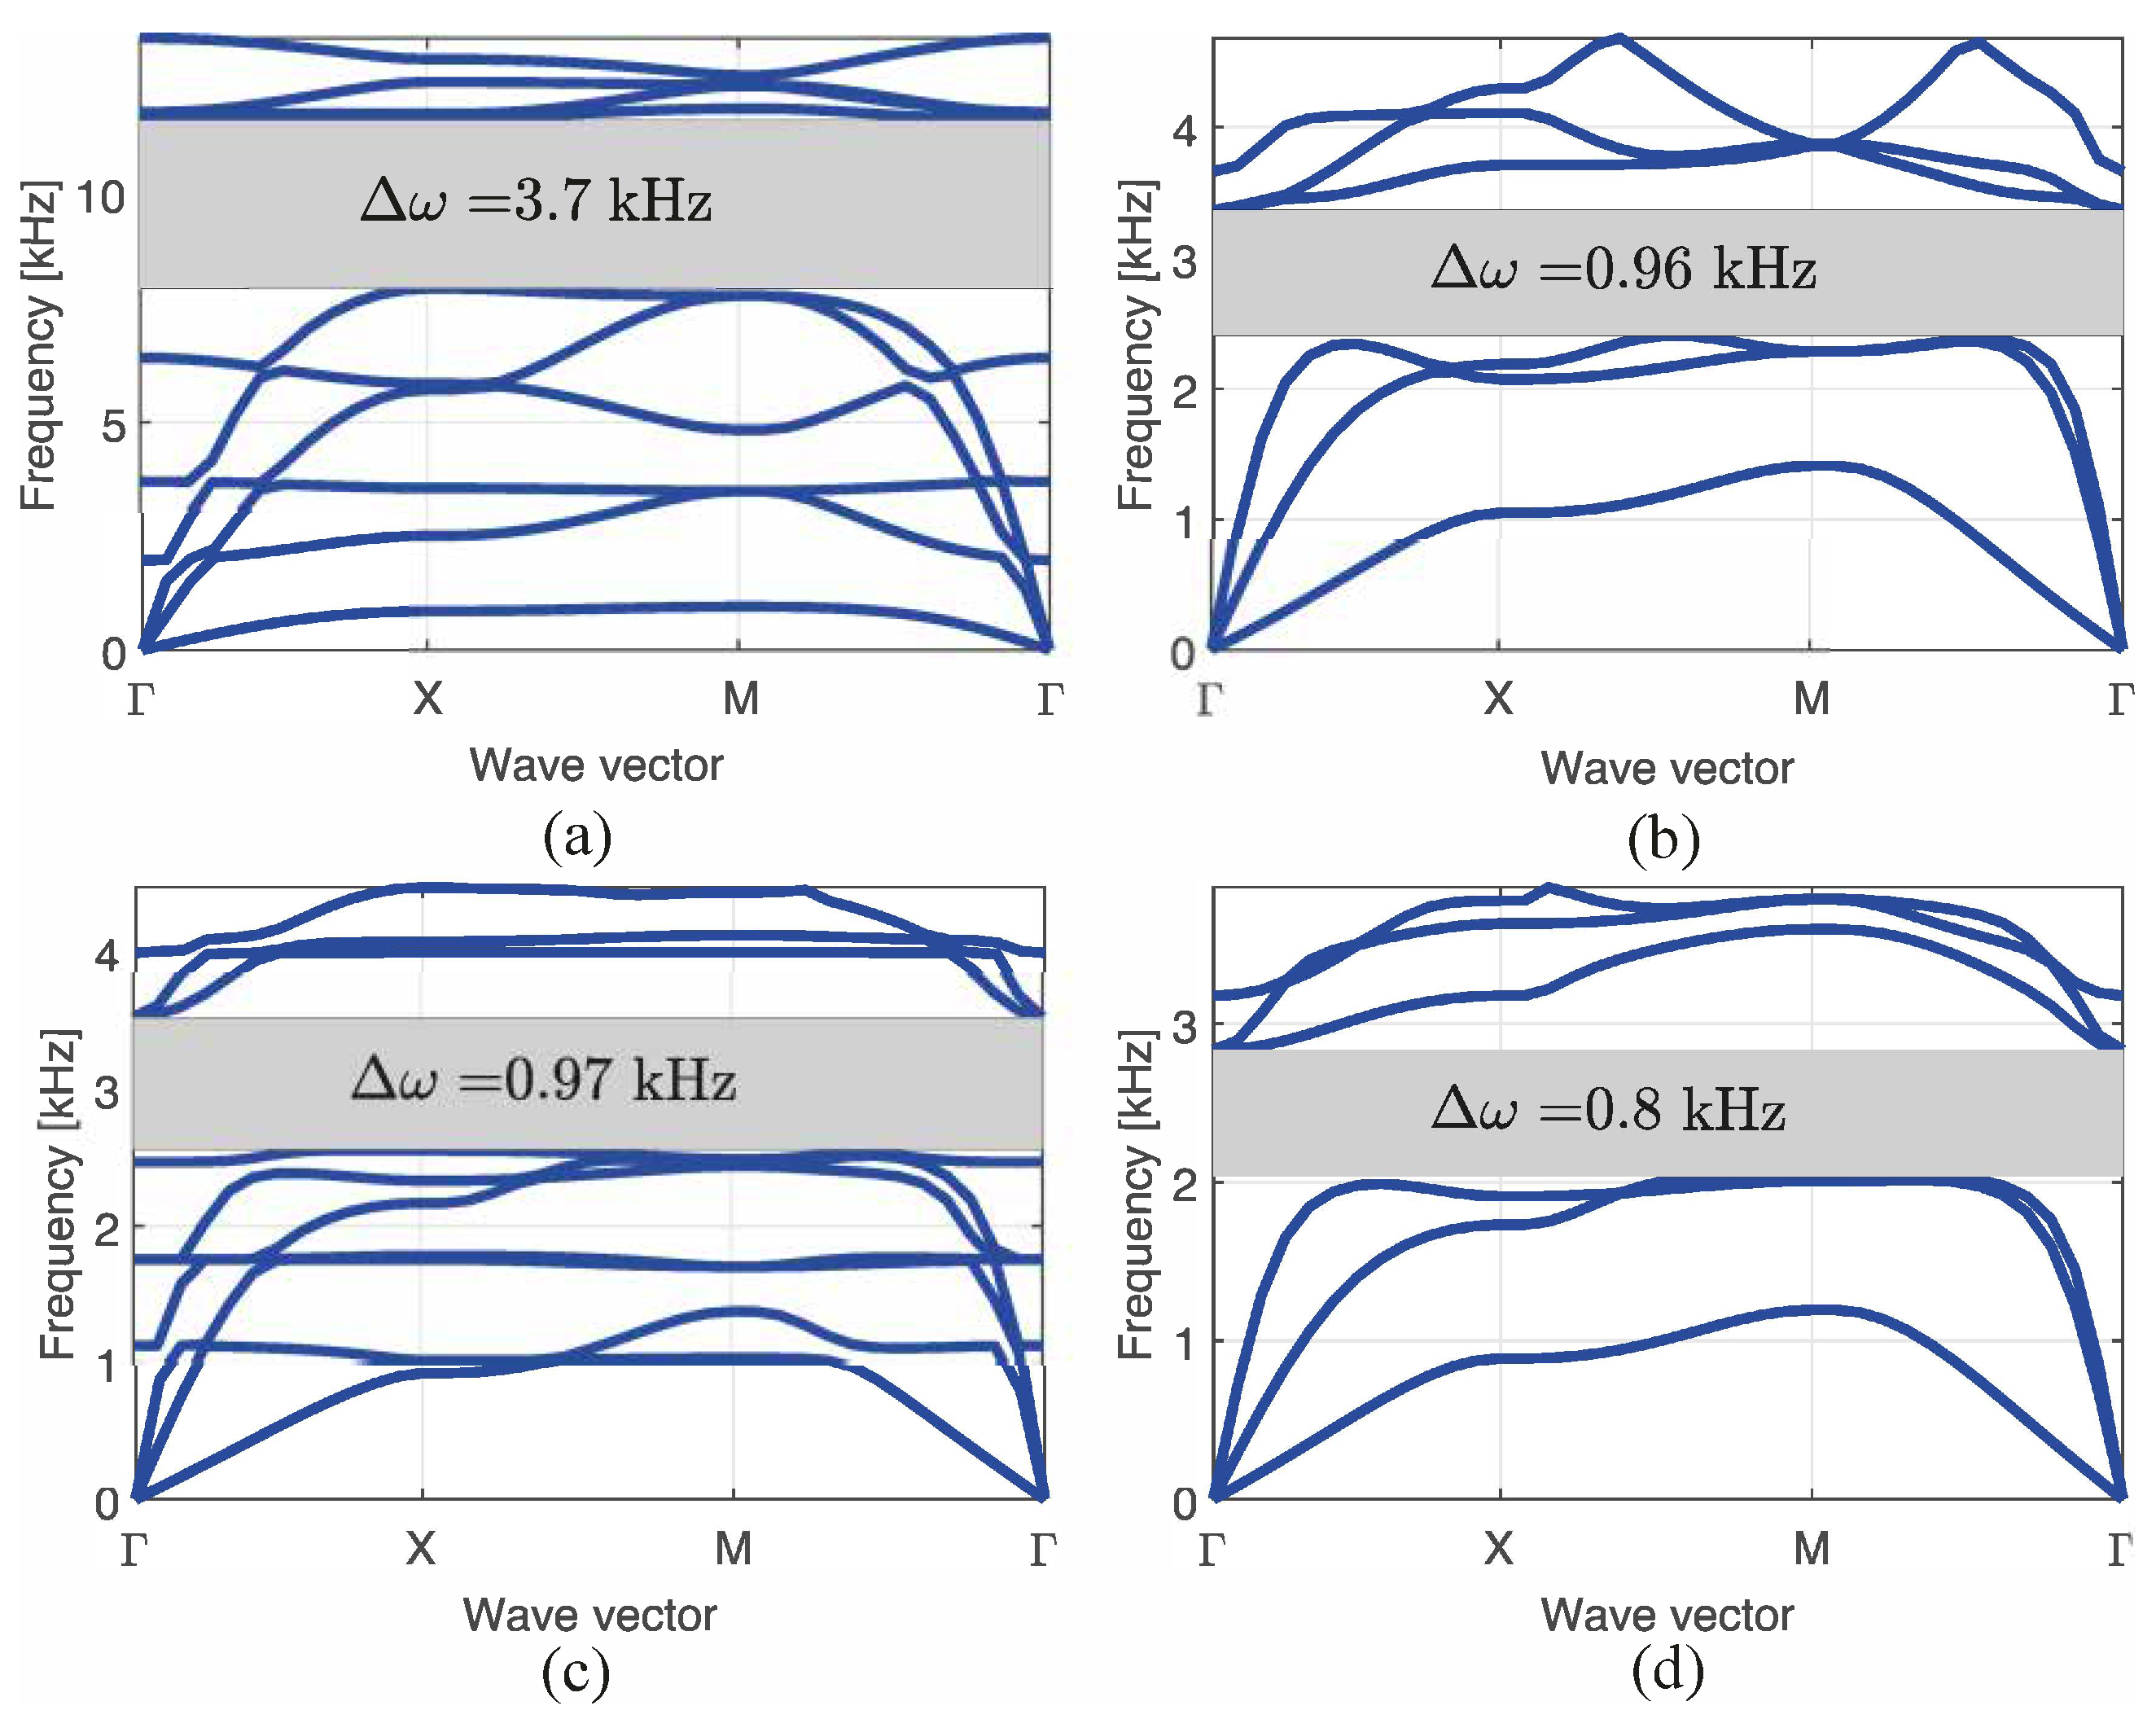
| Number of Cells | Band-Maximized n | Normalized Bandgap | Mean Bandgap Frequency kHz | Absolute Bandgap kHz |
|---|---|---|---|---|
| , | 6 | 0.378 | 9.794 | 3.703 |
| , | 3 | 0.332 | 2.887 | 0.961 |
| , | 7 | 0.319 | 3.041 | 0.972 |
| , | 3 | 0.329 | 2.433 | 0.8 |
Publisher’s Note: MDPI stays neutral with regard to jurisdictional claims in published maps and institutional affiliations. |
© 2021 by the authors. Licensee MDPI, Basel, Switzerland. This article is an open access article distributed under the terms and conditions of the Creative Commons Attribution (CC BY) license (https://creativecommons.org/licenses/by/4.0/).
Share and Cite
Quinteros, L.; Meruane, V.; Lenz Cardoso, E.; Ruiz, R.O. Phononic Bandgap Optimization in Sandwich Panels Using Cellular Truss Cores. Materials 2021, 14, 5236. https://doi.org/10.3390/ma14185236
Quinteros L, Meruane V, Lenz Cardoso E, Ruiz RO. Phononic Bandgap Optimization in Sandwich Panels Using Cellular Truss Cores. Materials. 2021; 14(18):5236. https://doi.org/10.3390/ma14185236
Chicago/Turabian StyleQuinteros, Leonel, Viviana Meruane, Eduardo Lenz Cardoso, and Rafael O. Ruiz. 2021. "Phononic Bandgap Optimization in Sandwich Panels Using Cellular Truss Cores" Materials 14, no. 18: 5236. https://doi.org/10.3390/ma14185236