We have integrated the continuum model presented in the previous section in a custom TCAD tool based on an open-source FEM framework and mesh generator dedicated to laser processing [
13]. The related numerical simulation reveals complex features, which critically depend on the process parameters [
26] (fluence or power density and laser pulse duration and shape) and the initial system preparation (i.e., the components’ space distribution in the initial state). In this paper, we will discuss 1D systems; anyhow, the code works starting with 2D and 3D material distribution. In order to study a case of relevance for the experimental application, we considered an “as prepared” system formed by a stack of air, thin pure Ni film and a 4H-SiC substrate. The experimental counterpart is the deposited Ni layer on 4H-SiC which undergoes the thermal processes for the formation of back-contacts in 4H-SiC based devices [
10]. Therefore, the element fraction variables in the initial states of the model are
in the Ni layer, and
elsewhere,
in the SiC substrate and
in the SiC substrate and
elsewhere. The other variables of the initial simulation state are all constant in the simulation box: uniform temperature field at RT
, solid phase-field
, null clustered carbon component
, null silicide components
. A zero flux (Neumann) boundary condition is imposed on the top (air) boundary. The incident laser wave is coming from the top of the air in a descending direction.
In order to qualitatively categorize the simulation scenario, we can distinguish three main cases which subsequently occur when increasing the laser power density: non-melting, partial melting, and full-melting regimes. In the following subsections, we will discuss the simulation features in these three cases.
3.1. Sub-Melting Regime
If the laser fluence
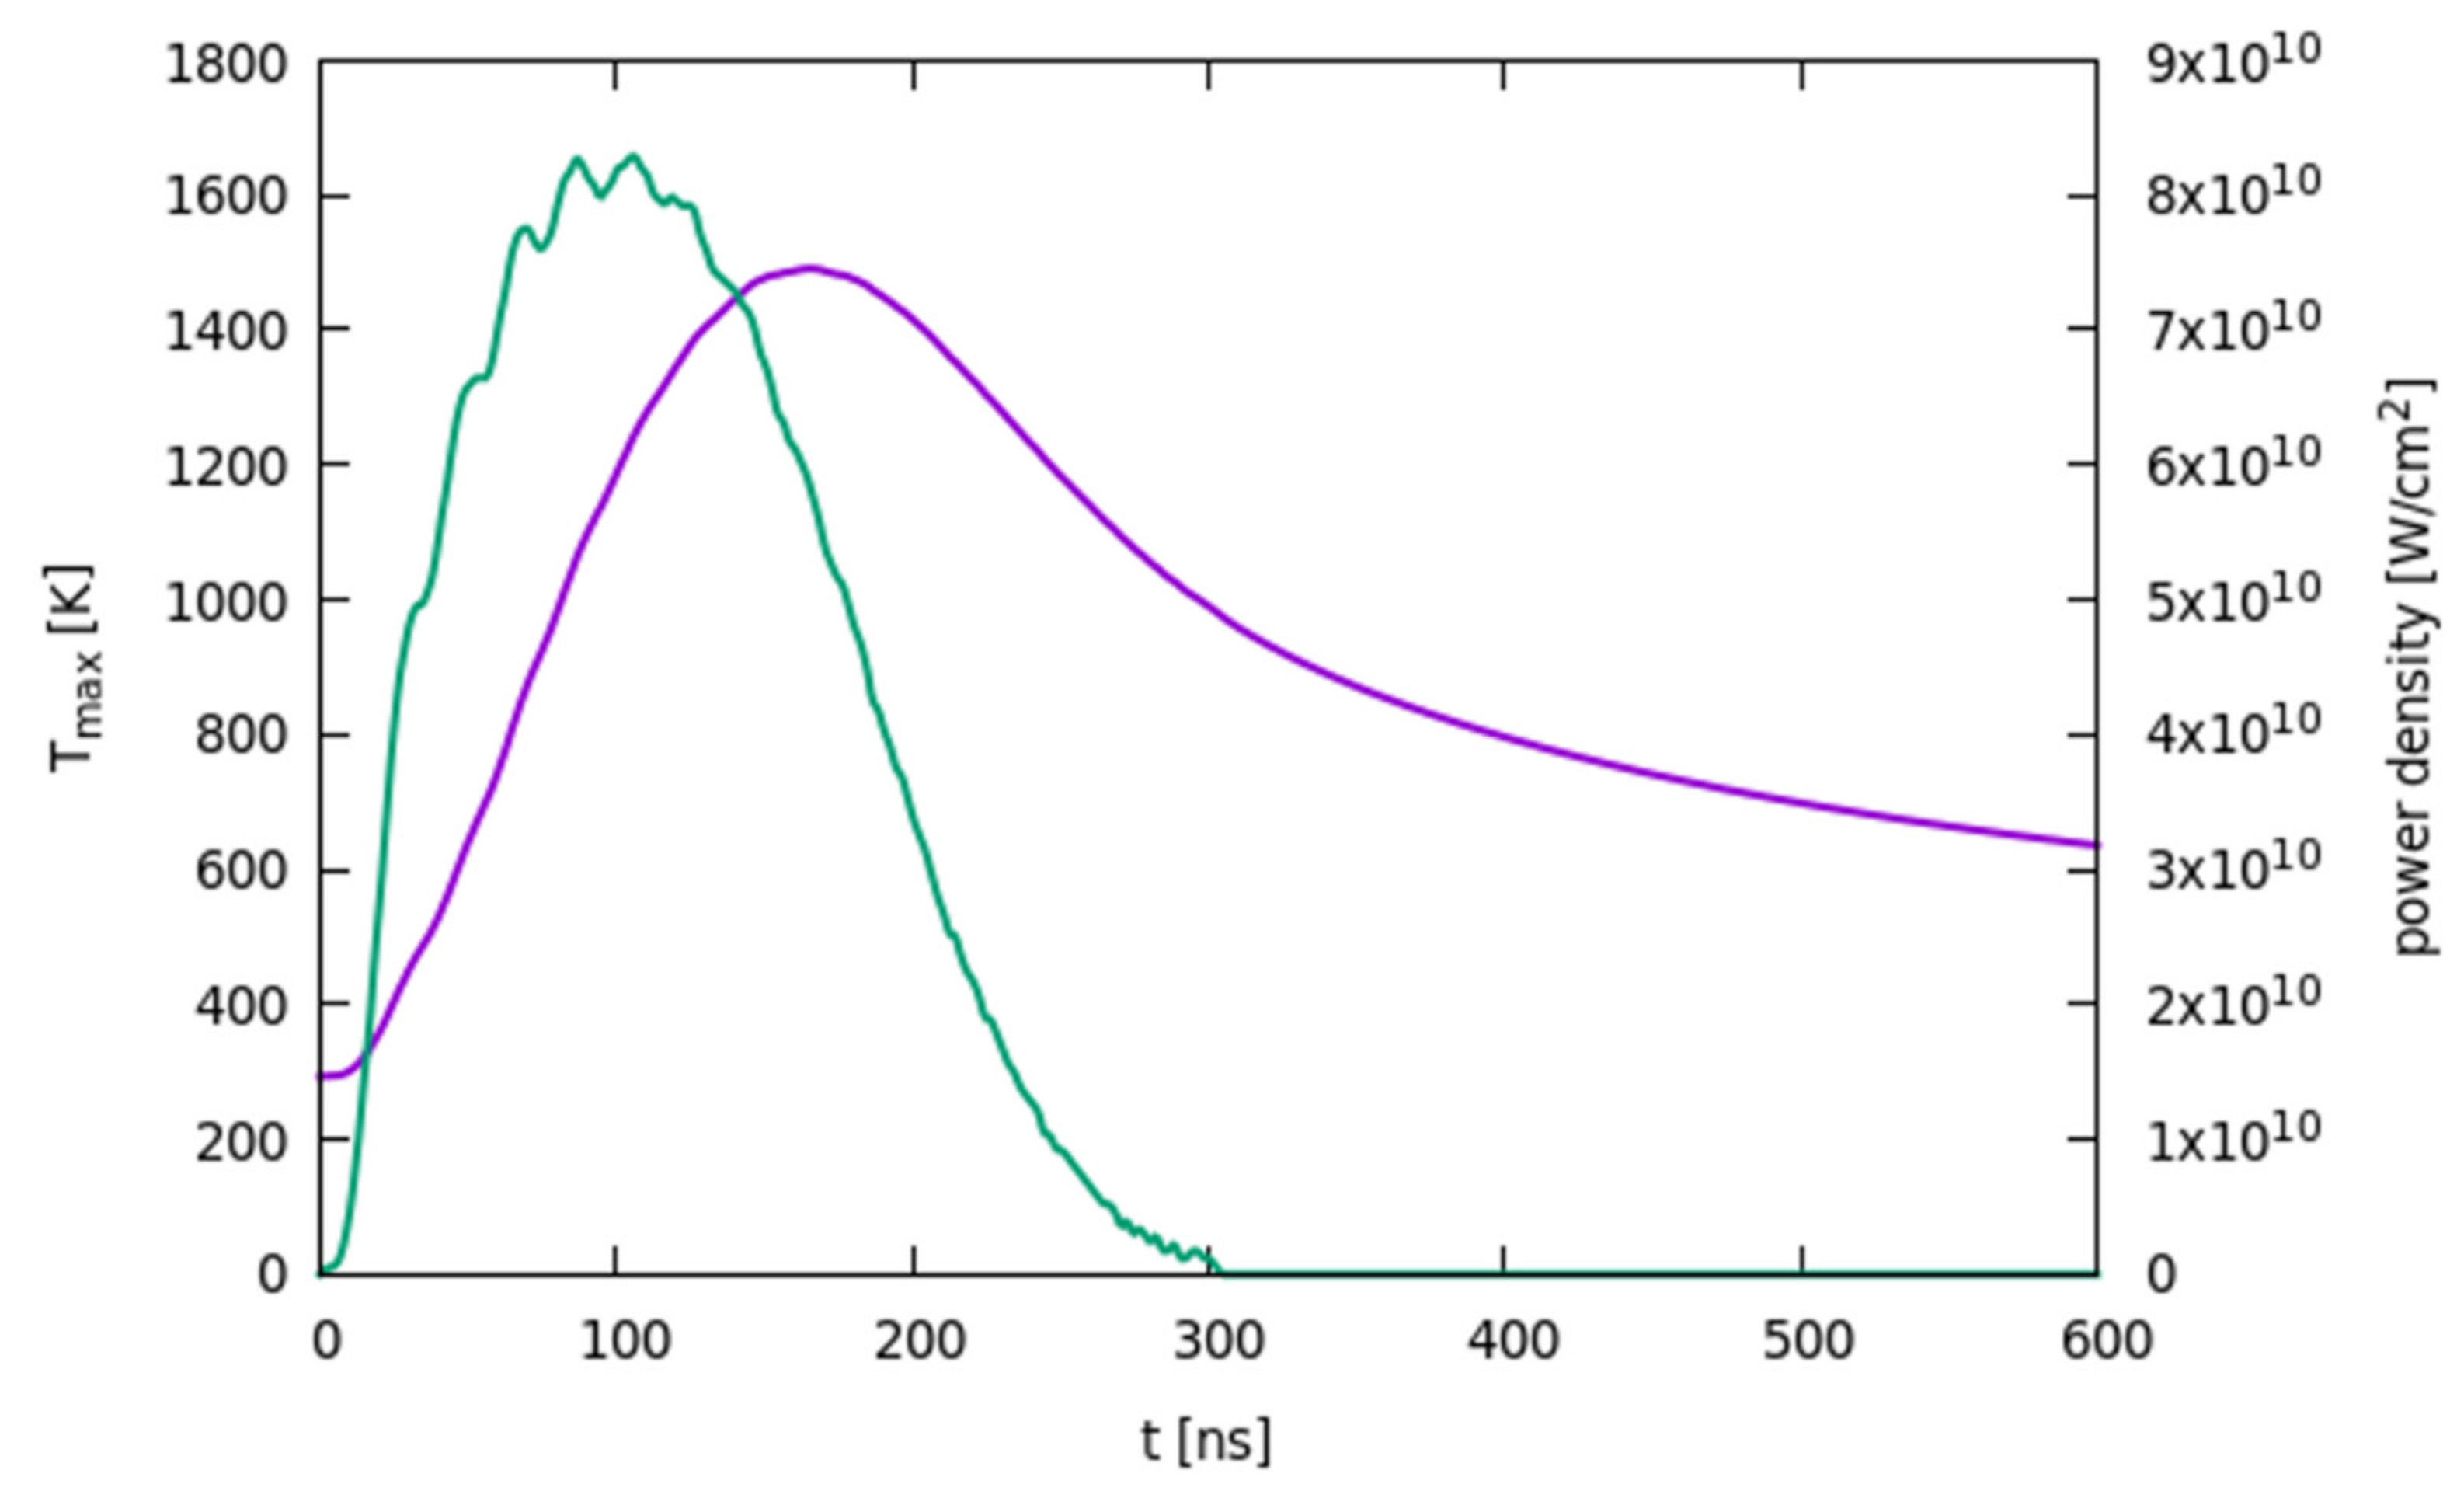
is below a (case dependent) threshold, no liquid-solid transient phase transition occurs, and all the kinetic evolution is generated by solid-phase element intermixing and reactions. Of course, the evolution of the fast-varying temperature field is the key aspect driving all the material kinetics. In
Figure 1, we show the maximum temperature
(obtained for this case at the surface location) and the power absorbed by the laser pulse as a function of the time in a system with an initial 100 nm thick Ni film and 110 µm thick 4H-SiC substrate for an irradiation process with an energy density of 2.2 J/cm
2, which is below the melting threshold. We notice that, for consistency, we will consider the same power density pulse in the simulations discussed in this paper: the change of the pulse shape and, especially, its duration quantitatively affects the results, but the overall scenario is usually confirmed.
Comparing the absorbed electro-magnetic power and , we can observe the typical shift of the two temporal profiles related to the heat diffusion in the sample, e.g., in the interval between ≈110 and ≈190 ns, despite the reduction of the laser power density, the temperature continues to rise. From ≈190 to ≈310 ns, the system begins the thermal quenching since the laser is now too weak to sustain the local temperature increase against the heat diffusion. After ≈310 ns, the laser’s power reaches the zero value, and the temperature continues to decrease, again reaching RT = 300 K after a few tens of microseconds (not shown).
Intermixing between Ni, Si and C atomic species is the first thermally activated phenomenon characterizing the early state of the annealing. In
Figure 2a, a snapshot of the elements’ volume fraction after 100 ns of simulated evolution for the
= 2.2 J/cm
2 process is shown. Calibrated simulations (see
Table 4 for the intermixing coefficient) predict a relevant and asymmetric (stronger in the Ni-rich region in comparison with the SiC one) intermixing of the atomic species in the pure solid phase during the early stage of the heating process, with Si and C diffuse profiles in the Ni-rich regions.
A relatively high solid solubility level of Si (close to 20%) can be obtained at high temperatures (the maximum temperature is
for the case in the snapshot in
Figure 2a while the maximum temperature obtained is more than
a discussed in the following) in the Ni crystalline matrix whereas C monomers tend to segregate in C aggregates according to an effective rate (low in the pure solid phase) ruled by the reaction and diffusion coefficients. A tail of the Ni profile progressively extends in the SiC-rich region, increasing the reactivity of the interfacial layer, where the three atomic species are concurrently present in similar proportions. As a consequence of this penetration, the Ni-rich region at the end of the process is thicker than the original one, e.g., ≈120 nm in
Figure 2b for a
process, to be compared with the 100 nm thickness of the deposited Ni layer.
In the Ni-SiC interfacial region, the unbalance of thermodynamic stability between solid-phase solution state and the
compounds’ state leads to the formation of silicide compounds; of course, if the relative local stoichiometry of the Ni and Si components and the local temperature permit these transformations with a significant rate in relation to the time scale of the process. These conditions are ruled both by the model Equations (4)–(17) and the calibrated reaction coefficient expressions (
Table 4). In
Figure 3, the local density profiles of silicide compounds after the process obtained by means of the laser annealing simulations of the processes at 2.2 J/cm
2 are shown together with the maximum value of the local temperature field
as a function of the position obtained during the simulated annealing. We show only the Ni
3Si, Ni
5Si
2 and Ni
2Si since the density of other compounds is less significant (less than 0.01 in the used scale). We note that, in this case, and whenever we plot compound density profiles in this paper, the local fraction of the Ni and Si elements in the compounds can be obtained from the plotted quantity by simply multiplying this quantity by the respective stoichiometry coefficients.
The silicide with the higher Ni content (Ni3Si) can be considered as the “nucleation” phase, and it is the only one that really characterizes the silicide phases in the sub-melting regime. The density peak is generated by the term in Equation (7) multiplied by . Therefore, the only one active when Ni is a minority element with respect to Si (i.e., in the SiC region, see also Equation (15)). We note that in the early calibration proposed here, we do not distinguish the reaction rate for the first two terms in the right side of Equation (15), i.e., we use the same expression for the Ni3Si nucleation also when Si is the minority element. Further focused investigations, with comparisons between simulations and experimental data, are necessary in order to, eventually, revise this choice.
The local temperature in the silicide region exceeds 1400 K (
Figure 3 right axis) during the process; this is a sufficient thermal budget to activate the silicide formation. Other silicide compounds form in the (expanding) Ni-rich region (i.e., when Si is the relative minority element) at significantly lower rates, and they appear in the simulations at negligible densities (see Ni
5Si
2 and Ni
2Si profiles in
Figure 3).
3.2. Partial-Melting Regime
The transient melting phenomenon is simulated for fluences
. The melting partially (partial-melting regime) affects the Ni-rich layer in the energy density range
. In
Figure 4, a snapshot of the phase, temperature and total Ni atomic fraction taken during the melting stage, i.e., after 220 ns of the simulated irradiation process, is shown for a process with
. In this case, the melting starts at t
on-melt ≈ 120 ns and ends at t
off-melt ≈ 240 ns (the time origin is the irradiation pulse starting, see
Figure 1) and the maximum molten extension, calculated by the
condition, is ≈35 nm.
It is clear from
Figure 4 that the liquid phase nucleates at the Ni-SiC interface for this value of the fluence in spite of the larger value of the temperature obtained at the surface (
x = 0). This unusual inner location of the melting is caused by the solid phase intermixing, occurring during the heating in the
t <
ton-melt interval of the irradiation, which tends to lower the melting point of the ternary system with respect to the pure Ni phase. Indeed, in the binary phase diagram of the Ni-Si system, for pure Ni, the melting temperature is 1728 K while it reaches the value of 1424 K for a Si:Ni stoichiometric ratio of about 0.2, and a similar trend is observed in the Ni-Si-C system [
14]. We have considered this effect in the implemented calibration dependence of
and the simulated peculiar behavior. It is a direct kinetic consequence when the temperature difference (T = 1523 K at the surface and T = 1493 K at the Ni-SiC interface at
t =
ton-melt for the
process) between the surface and the Ni-SiC interface location (where the intermixing is maximal), is not large enough to compensate the
reduction. Melting occurs at this interface position.
The diffusivity coefficient increases from maximum values in the order of 10
−10 m
2/s in the solid phase to ≈2 × 10
−8 m
2/s values in the liquid phase (see
Table 4). This jump of the intermixing coefficient significantly alters the element profiles in the molten regions (Ni profile,
Figure 4). Moreover, as stated in
Section 2, the silicide compounds, which form in the
t <
ton-melt pre-melting stage, are dissolved by the mobile melting front; e.g., the Ni profile portion in the molten region of
Figure 4 is fully composed of Ni monomers in the Ni-Si liquid alloy coexisting with the C (monomers and clusters) counterpart.
The energy density range where the transient melting occurs at the Ni-SiC interface is . We note that, in these conditions, the melting event cannot be easily detected with in-situ reflectivity measurements since the phase transition could be too deep to be probed with surface reflectivity.
Ni silicide phases reform after the transient melting, during the quenching stage of the process. However, the strong element intermixing obtained in the liquid phase brings, in the few tens of ns of the transient melting duration, the local composition to a completely different state. As a consequence, the solid-state reactions activated after the melting can follow a different path with respect to the non-melting regime. In particular, simulations show the increased relevance of compounds with higher Si content. In
Figure 5, we show some snapshots of the simulated local density profiles of three silicide compounds (profiles of compounds with higher Si content with respect to the Ni
2Si have a maximum lower than 0.01 in this scale in the whole range of conditions explored in this paper) during the melting and regrowth stages for the laser annealing process at the 2.6 J/cm
2 energy density; whilst the final profiles after the full quenching at the end of the process are shown in
Figure 6. The phase function is also plotted in the two figures. Similar to the non-melting case reported in
Figure 3, we observe a sharp peak of Ni
3Si density at the interface of the SiC material. The presence of the Ni
3Si phases in this particular position have already been discussed for the non-melting case. This Ni-rich silicide is again the most important one after the partial melting process. However, we can observe that the liquid phase intermixing also activates a relevant formation of silicide compounds with higher Si content, which distribute preferentially in different positions along the depth.
For fluence larger than the liquid phase more conventionally nucleates at the surface. Starting from this value of the fluence, the melting extension (melt depth in this case) increases strongly with the fluence, and the full melting of the Ni-rich layer occurs at . The surface melting can give access to the in-situ reflectivity measurements studied in this regime of fluence.
3.3. Full-Melting Regime
In
Figure 7, the melting extension
as a function of the fluence is shown in the 2.0–3.8 J/cm
2 energy density range. The different regimes (non-melting, partial melting at the Ni-SiC interface, partial melting at the surface, full melting) are indicated and are clearly correlated with the characteristic shapes of the
curve. We can observe first a significant increase with the fluence of the melting front nucleating at the Ni-SiC interface for
, while the melting extension tends to saturate at the turning point (
) for the change of location of the liquid nucleation. As already noted, the melt depth increases strongly in the 2.8–3.0 J/cm
2 interval, extending in the whole Ni-rich layer for
. The latest regime (i.e., the full melting one) is again characterized by an abrupt change of the
curve slope, which now grows slowly with
. We can understand this behavior in the full melting regime, where the possibility of additional melting is hindered by the SiC material presence (pure SiC is practically a non-melting region in our simulations). Indeed, the increased melting extension is not driven by thermodynamic energy balance only (i.e., latent heat consumption) but also by the slower interface mixing with the Ni penetrations, which lowers the local melting point.
Of course, in the full melting case, all the silicide compounds forming in the t < ton-melt interval are completely dissolved since the melting phenomenon affects the whole Ni-rich layer. Similar to the partial melting case, Ni silicides form after the re-solidification of the Ni-rich layer from a local stoichiometry condition determined by the liquid phase intermixing.
In
Figure 8, we show a simulation analysis of local silicide density profiles during the melting and regrowth stages of the full melting process at the 3.6 J/cm
2 energy density; whilst the final profiles after the full quenching (at the end of the process) are shown in
Figure 9. The phase function is also plotted in these figures. In this case, the Ni
3Si, N
5Si
2 classes and Ni
2Si compounds have similar weights in the silicide layer, which extends for 49 nm from the SiC interface. Again, we can observe a preferential location for the tree compounds along the depth.
In the full-melting regime, a gradual trend of silicide formation is evident from the simulated laser processes. This trend is characterized by the monotonic increase with
of the Ni-rich layer M
Ni-rich and the Ni-silicide M
Silicide region reported in
Figure 10 as green and purple lines, respectively. We note that M
Ni-rich(
) when
follows the dependence of melt depth of
Figure 6 (the thickness of this layer is few nm greater than
due to the already discussed Ni-penetration in the solid SiC region). In the full meting regime, we also observe a gradual increase of the weight of the Si richer Ni-silicides in mixtures residing in the M
Silicide region. The behaviour of M
Ni-rich(
) and M
Silicide(
) is not monotonic when
as a consequence of the complex evolution discussed in the previous subsections. An experimental measurement of M
Ni-rich(
) and M
Silicide(
) for
has been determined by transmission electron microscopy (TEM) for experimental laser annealing processes performed in the same conditions as the ones studied here (see Ref. [
11]) and reported in
Figure 10 as black crosses. Simulations and experimental analyses show a noteworthy agreement.
The excess C atoms after the silicide formation tend to segregate in the non-SiC region, and the corresponding clustering is boosted by the high liquid-phase diffusion of the residual monomer. This phenomenon is particularly important in full melting processes and at high fluences, when the high absorbed laser power maintains the liquid phase for a longer time. In order to confirm this effect, we plotted the ratio between the total C-cluster density as a function of
and the one obtained for the higher
value (
Figure 11); a strong increase with
is simulated for this quantity in the full melting regime. We notice that consistent with previous comments, the non-monotonic dependence of the carbon clusters density on
is related, as for the Ni-silicides case, to the switching of the initial melting location in the surface region where the local different element composition hinders the reaction yields.
As a final comment regarding this simulation analysis, we notice that in the real experimental sample, the mixture of Ni-silicides have a 3D distribution (e.g., nano-grains with given composition). Therefore, for the 1D case presented here, all the quantities have to be considered as depth-dependent averages of such distribution.


 ,
, 


