
Interdiffusion and Intermetallic Compounds at Al/Cu Interfaces in Al-50vol.%Cu Composite Prepared by Solid-State Sintering


Abstract
:
1. Introduction
2. Materials and Methods
2.1. Preparation and Analysis of Al–Cu Powder
2.2. Preparation and Characterization of Al–Cu Composite
3. Results and Discussion
3.1. Formation of Intermetallic Compounds at Al/Cu Interface in Al–Cu Composite
3.2. Effect of Intermetallic Compounds on Properties of Al–Cu Composite
4. Conclusions
Supplementary Materials
Author Contributions
Funding
Institutional Review Board Statement
Informed Consent Statement
Data Availability Statement
Conflicts of Interest
References
- Kwon, H.; Takamichi, M.; Kawasaki, A.; Leparoux, M. Investigation of the interfacial phases formed between carbon nanotubes and aluminum in a bulk material. Mater. Chem. Phys. 2013, 138, 787–793. [Google Scholar] [CrossRef]
- Kwon, H.; Park, D.H.; Park, Y.; Silvain, J.F.; Kawasaki, A.; Park, Y. Spark plasma sintering behavior of pure aluminum depending on various sintering temperatures. Met. Mater. Int. 2010, 16, 71–75. [Google Scholar] [CrossRef]
- Ye, T.; Xu, Y.; Ren, J. Effects of SiC particle size on mechanical properties of SiC particle reinforced aluminum metal matrix composite. Mater. Sci. Eng. A 2019, 753, 146–155. [Google Scholar] [CrossRef]
- Zhao, K.; Zhang, T.; Ren, A.; Yang, Y.; Xiao, P.; Ge, Z.; Ma, Y.; Chen, Y. High ampacity of superhelix graphene/copper nanocomposite wires by a synergistic growth-twisting-drawing strategy. Carbon 2019, 141, 198–208. [Google Scholar] [CrossRef]
- Singh, M.K.; Gautam, R.K. Structural, mechanical, and electrical behavior of ceramic-reinforced copper metal matrix hybrid composites. J. Mater. Eng. Perform. 2019, 28, 886–899. [Google Scholar] [CrossRef]
- Wang, J.; Deng, Q.; Li, M.; Jiang, K.; Hu, Z.; Chu, J. High-capacity and long-life lithium storage boosted by pseudocapacitance in three-dimensional MnO–Cu–CNT/graphene anodes. Nanoscale 2018, 10, 2944–2954. [Google Scholar] [CrossRef] [PubMed]
- Abyzov, A.M.; Kidalov, S.V.; Shakhov, F.M. High thermal conductivity composite of diamond particles with tungsten coating in a copper matrix for heat sink application. Appl. Therm. Eng. 2012, 48, 72–80. [Google Scholar] [CrossRef]
- Sidhu, S.S.; Kumar, S.; Batish, A. Metal matrix composites for thermal management: A review. Crit. Rev. Solid State Mater. Sci. 2016, 41, 132–157. [Google Scholar] [CrossRef]
- Wu, J.; Zhang, H.; Zhang, Y.; Li, J.; Wang, X. Effect of copper content on the thermal conductivity and thermal expansion of Al–Cu/diamond composites. Mater. Des. 2012, 39, 87–92. [Google Scholar] [CrossRef]
- Davis, L.; Artz, B. Thermal conductivity of metal-matrix composites. J. Appl. Phys. 1995, 77, 4954–4960. [Google Scholar] [CrossRef]
- Jiang, L.; Li, Z.; Fan, G.; Cao, L.; Zhang, D. The use of flake powder metallurgy to produce carbon nanotube (CNT)/aluminum composites with a homogenous CNT distribution. Carbon 2012, 50, 1993–1998. [Google Scholar] [CrossRef]
- Yang, X.; Shi, C.; He, C.; Liu, E.; Li, J.; Zhao, N. Synthesis of uniformly dispersed carbon nanotube reinforcement in Al powder for preparing reinforced Al composites. Compos. Part. A Appl. Sci Manuf. 2011, 42, 1833–1839. [Google Scholar] [CrossRef]
- Gundrum, B.C.; Cahill, D.G.; Averback, R.S. Thermal conductance of metal-metal interfaces. Phys. Rev. B 2005, 72, 245426. [Google Scholar] [CrossRef]
- Danilenko, V.; Sergeev, S.; Baimova, J.; Korznikova, G.; Nazarov, K.; Khisamov, R.K.; Glezer, A.; Mulyukov, R. An approach for fabrication of Al-Cu composite by high pressure torsion. Mater. Lett. 2019, 236, 51–55. [Google Scholar] [CrossRef]
- Matli, P.R.; Fareeha, U.; Shakoor, R.A.; Mohamed, A.M.A. A comparative study of structural and mechanical properties of Al–Cu composites prepared by vacuum and microwave sintering techniques. J. Mater. Process. Technol. 2018, 7, 165–172. [Google Scholar] [CrossRef]
- Kim, Y.K.; Hong, S.I. Effect of intermetallic compound layer on peel strength and crack propagation behavior in Cu/Al/Cu clad composites. Metals 2019, 9, 1155. [Google Scholar] [CrossRef] [Green Version]
- Školáková, A.; Novák, P.; Mejzlíková, L.; Průša, F.; Salvetr, P.; Vojtěch, D. Structure and mechanical properties of Al-Cu-Fe-X alloys with excellent thermal stability. Materials 2017, 10, 1269. [Google Scholar] [CrossRef] [PubMed] [Green Version]
- Novák, P.; Kubatík, T.; Vystrčil, J.; Hendrych, R.; Kříž, J.; Mlynár, J.; Vojtěch, D. Powder metallurgy preparation of Al–Cu–Fe quasicrystals using mechanical alloying and spark plasma sintering. Intermetallics 2014, 52, 131–137. [Google Scholar] [CrossRef]
- Rodak, K.; Kuc, D.; Mikuszewski, T. Superplastic Deformation of Al–Cu Alloys after Grain Refinement by Extrusion Combined with Reversible Torsion. Materials 2020, 13, 5803. [Google Scholar] [CrossRef] [PubMed]
- Wei, Y.; Li, J.; Xiong, J.; Zhang, F. Investigation of interdiffusion and intermetallic compounds in Al–Cu joint produced by continuous drive friction welding. Eng. Sci. Technol. Int. J. 2016, 19, 90–95. [Google Scholar] [CrossRef] [Green Version]
- Ouyang, J.; Yarrapareddy, E.; Kovacevic, R. Microstructural evolution in the friction stir welded 6061 aluminum alloy (T6-temper condition) to copper. J. Mater. Process. Technol. 2006, 172, 110–122. [Google Scholar] [CrossRef]
- Lee, W.-B.; Bang, K.-S.; Jung, S.-B. Effects of intermetallic compound on the electrical and mechanical properties of friction welded Cu/Al bimetallic joints during annealing. J. Alloys Compd. 2005, 390, 212–219. [Google Scholar] [CrossRef]
- Zare, G.; Divandari, M.; Arabi, H. Investigation on interface of Al/Cu couples in compound casting. Mater. Sci. Technol. 2013, 29, 190–196. [Google Scholar] [CrossRef]
- Lee, K.S.; Yong-Nam, K. Solid-state bonding between Al and Cu by vacuum hot pressing. Trans. Nonferrous Met. Soc. 2013, 23, 341–346. [Google Scholar] [CrossRef]
- Chang, Q.; Xie, J.; Mao, A.; Wang, W. Study on interface structure of Cu/Al clad plates by roll casting. Metals 2018, 8, 770. [Google Scholar] [CrossRef] [Green Version]
- Hannech, E.; Lamoudi, N.; Benslim, N.; Makhloufi, B. Intermetallic formation in the aluminum–copper system. Surf. Rev. Lett. 2003, 10, 677–683. [Google Scholar] [CrossRef]
- Zhang, J.; Wang, B.-H.; Chen, G.-H.; Wang, R.-M.; Miao, C.-H.; Zheng, Z.-X.; Tang, W.-M. Formation and growth of Cu–Al IMCs and their effect on electrical property of electroplated Cu/Al laminar composites. Trans. Nonferrous Met. Soc. 2016, 26, 3283–3291. [Google Scholar] [CrossRef]
- Hug, E.; Bellido, N. Brittleness study of intermetallic (Cu, Al) layers in copper-clad aluminium thin wires. Mater. Sci. Eng. A 2011, 528, 7103–7106. [Google Scholar] [CrossRef]
- Tavassoli, S.; Abbasi, M.; Tahavvori, R. Controlling of IMCs layers formation sequence, bond strength and electrical resistance in AlCu bimetal compound casting process. Mater. Des. 2016, 108, 343–353. [Google Scholar] [CrossRef]
- Kim, K.; Kim, D.; Park, K.; Cho, M.; Cho, S.; Kwon, H. Effect of intermetallic compounds on the thermal and mechanical properties of Al–Cu composite materials fabricated by spark plasma sintering. Materials 2019, 12, 1546. [Google Scholar] [CrossRef] [PubMed] [Green Version]
- Xu, H.; Liu, C.; Silberschmidt, V.; Pramana, S.S.; White, T.; Chen, Z.; Acoff, V. Behavior of aluminum oxide, intermetallics and voids in Cu–Al wire bonds. Acta Mater. 2011, 59, 5661–5673. [Google Scholar] [CrossRef]
- Pretorius, R.; Vredenberg, A.; Saris, F.; De Reus, R. Prediction of phase formation sequence and phase stability in binary metal-aluminum thin-film systems using the effective heat of formation rule. J. Appl. Phys. 1991, 70, 3636–3646. [Google Scholar] [CrossRef]
- Funamizu, Y.; Watanabe, K. Interdiffusion in the Al–Cu system. Trans. Jpn. Inst. Met. 1971, 12, 147–152. [Google Scholar] [CrossRef] [Green Version]
- Hentzell, H.; Tu, K.-N. Interdiffusion in copper–aluminum thin film bilayers. II. Analysis of marker motion during sequential compound formation. J. Appl. Phys. 1983, 54, 6929–6937. [Google Scholar] [CrossRef]
- Hentzell, H.; Thompson, R.; Tu, K.-N. Interdiffusion in copper–aluminum thin film bilayers. I. Structure and kinetics of sequential compound formation. J. Appl. Phys. 1983, 54, 6923–6928. [Google Scholar] [CrossRef]
- Eizadjou, M.; Talachi, A.K.; Manesh, H.D.; Shahabi, H.S.; Janghorban, K. Investigation of structure and mechanical properties of multi-layered Al/Cu composite produced by accumulative roll bonding (ARB) process. Compos. Sci. Technol. 2008, 68, 2003–2009. [Google Scholar] [CrossRef]
- Abbasi, M.; Taheri, A.K.; Salehi, M. Growth rate of intermetallic compounds in Al/Cu bimetal produced by cold roll welding process. J. Alloys Compd. 2001, 319, 233–241. [Google Scholar] [CrossRef]


| Sintering Temperature (°C) | Thickness Fraction (%) | Area Fraction (%) | |||||
|---|---|---|---|---|---|---|---|
| II | III | IV | Al | CuAl2 | Cu9Al4 | Cu | |
| 360 | 38 | 16 | 46 | 51 | 10 | 5 | 34 |
| 380 | 18 | 42 | 40 | 33 | 11 | 11 | 45 |
| 400 | 50 | 25 | 25 | 28 | 13 | 9 | 50 |
| Property | Sintering Temperature (°C) | ||||||||
|---|---|---|---|---|---|---|---|---|---|
| 340 | 360 | 380 | 400 | 420 | 440 | 460 | 480 | 500 | |
| Density (g∙cm−3) ± 0.0 | 5.2 | 5.3 | 5.4 | 5.7 | 5.5 | 5.8 | 5.8 | 6.0 | 6.0 |
| Hardness (HV) ± 15.6 | - | 65.0 | 78.9 | 69.8 | - | - | - | - | - |
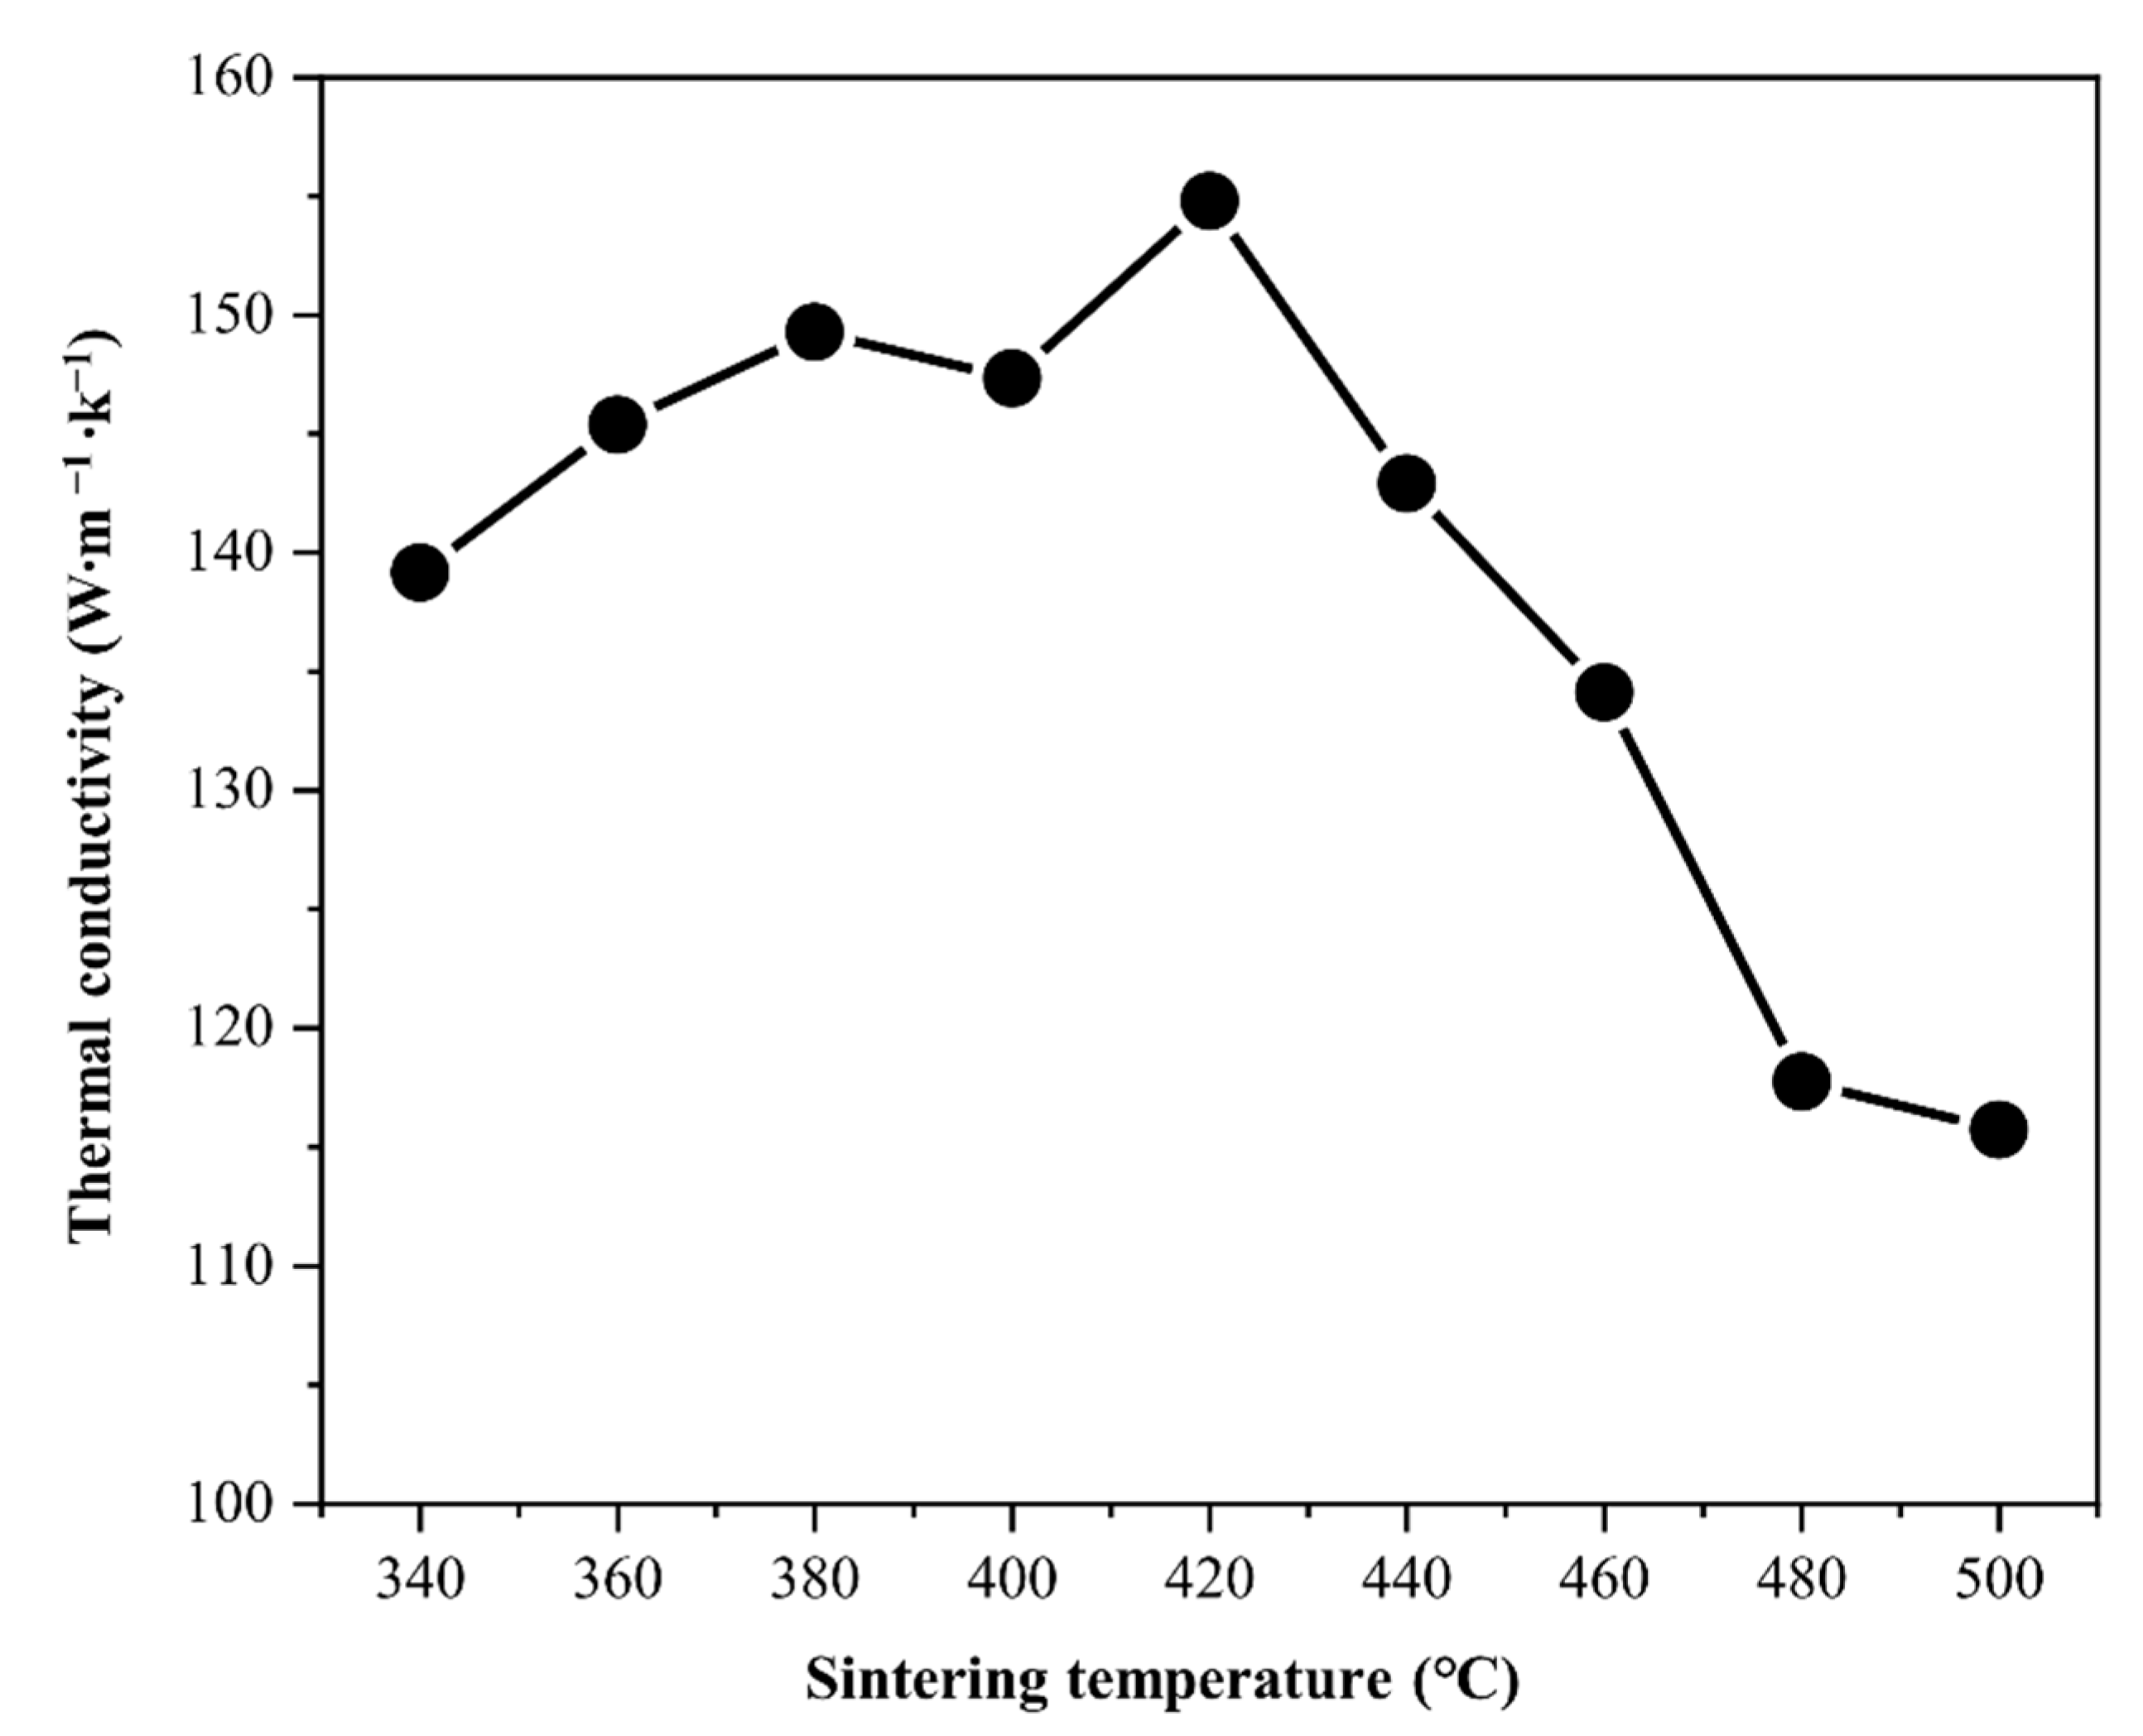
| Thermal conductivity (W∙m−1∙K−1) ± 0.5 | 139.2 | 145.4 | 149.3 | 147.3 | 154.8 | 142.9 | 134.1 | 117.8 | 115.7 |
Publisher’s Note: MDPI stays neutral with regard to jurisdictional claims in published maps and institutional affiliations. |
© 2021 by the authors. Licensee MDPI, Basel, Switzerland. This article is an open access article distributed under the terms and conditions of the Creative Commons Attribution (CC BY) license (https://creativecommons.org/licenses/by/4.0/).
Share and Cite
Kim, D.; Kim, K.; Kwon, H. Interdiffusion and Intermetallic Compounds at Al/Cu Interfaces in Al-50vol.%Cu Composite Prepared by Solid-State Sintering. Materials 2021, 14, 4307. https://doi.org/10.3390/ma14154307
Kim D, Kim K, Kwon H. Interdiffusion and Intermetallic Compounds at Al/Cu Interfaces in Al-50vol.%Cu Composite Prepared by Solid-State Sintering. Materials. 2021; 14(15):4307. https://doi.org/10.3390/ma14154307
Chicago/Turabian StyleKim, Dasom, Kyungju Kim, and Hansang Kwon. 2021. "Interdiffusion and Intermetallic Compounds at Al/Cu Interfaces in Al-50vol.%Cu Composite Prepared by Solid-State Sintering" Materials 14, no. 15: 4307. https://doi.org/10.3390/ma14154307