
Shear Capacity of Reinforced Concrete Beams under Monotonic and Cyclic Loads: Experiments and Computational Models


Abstract
:1. Introduction
2. Materials and Methods
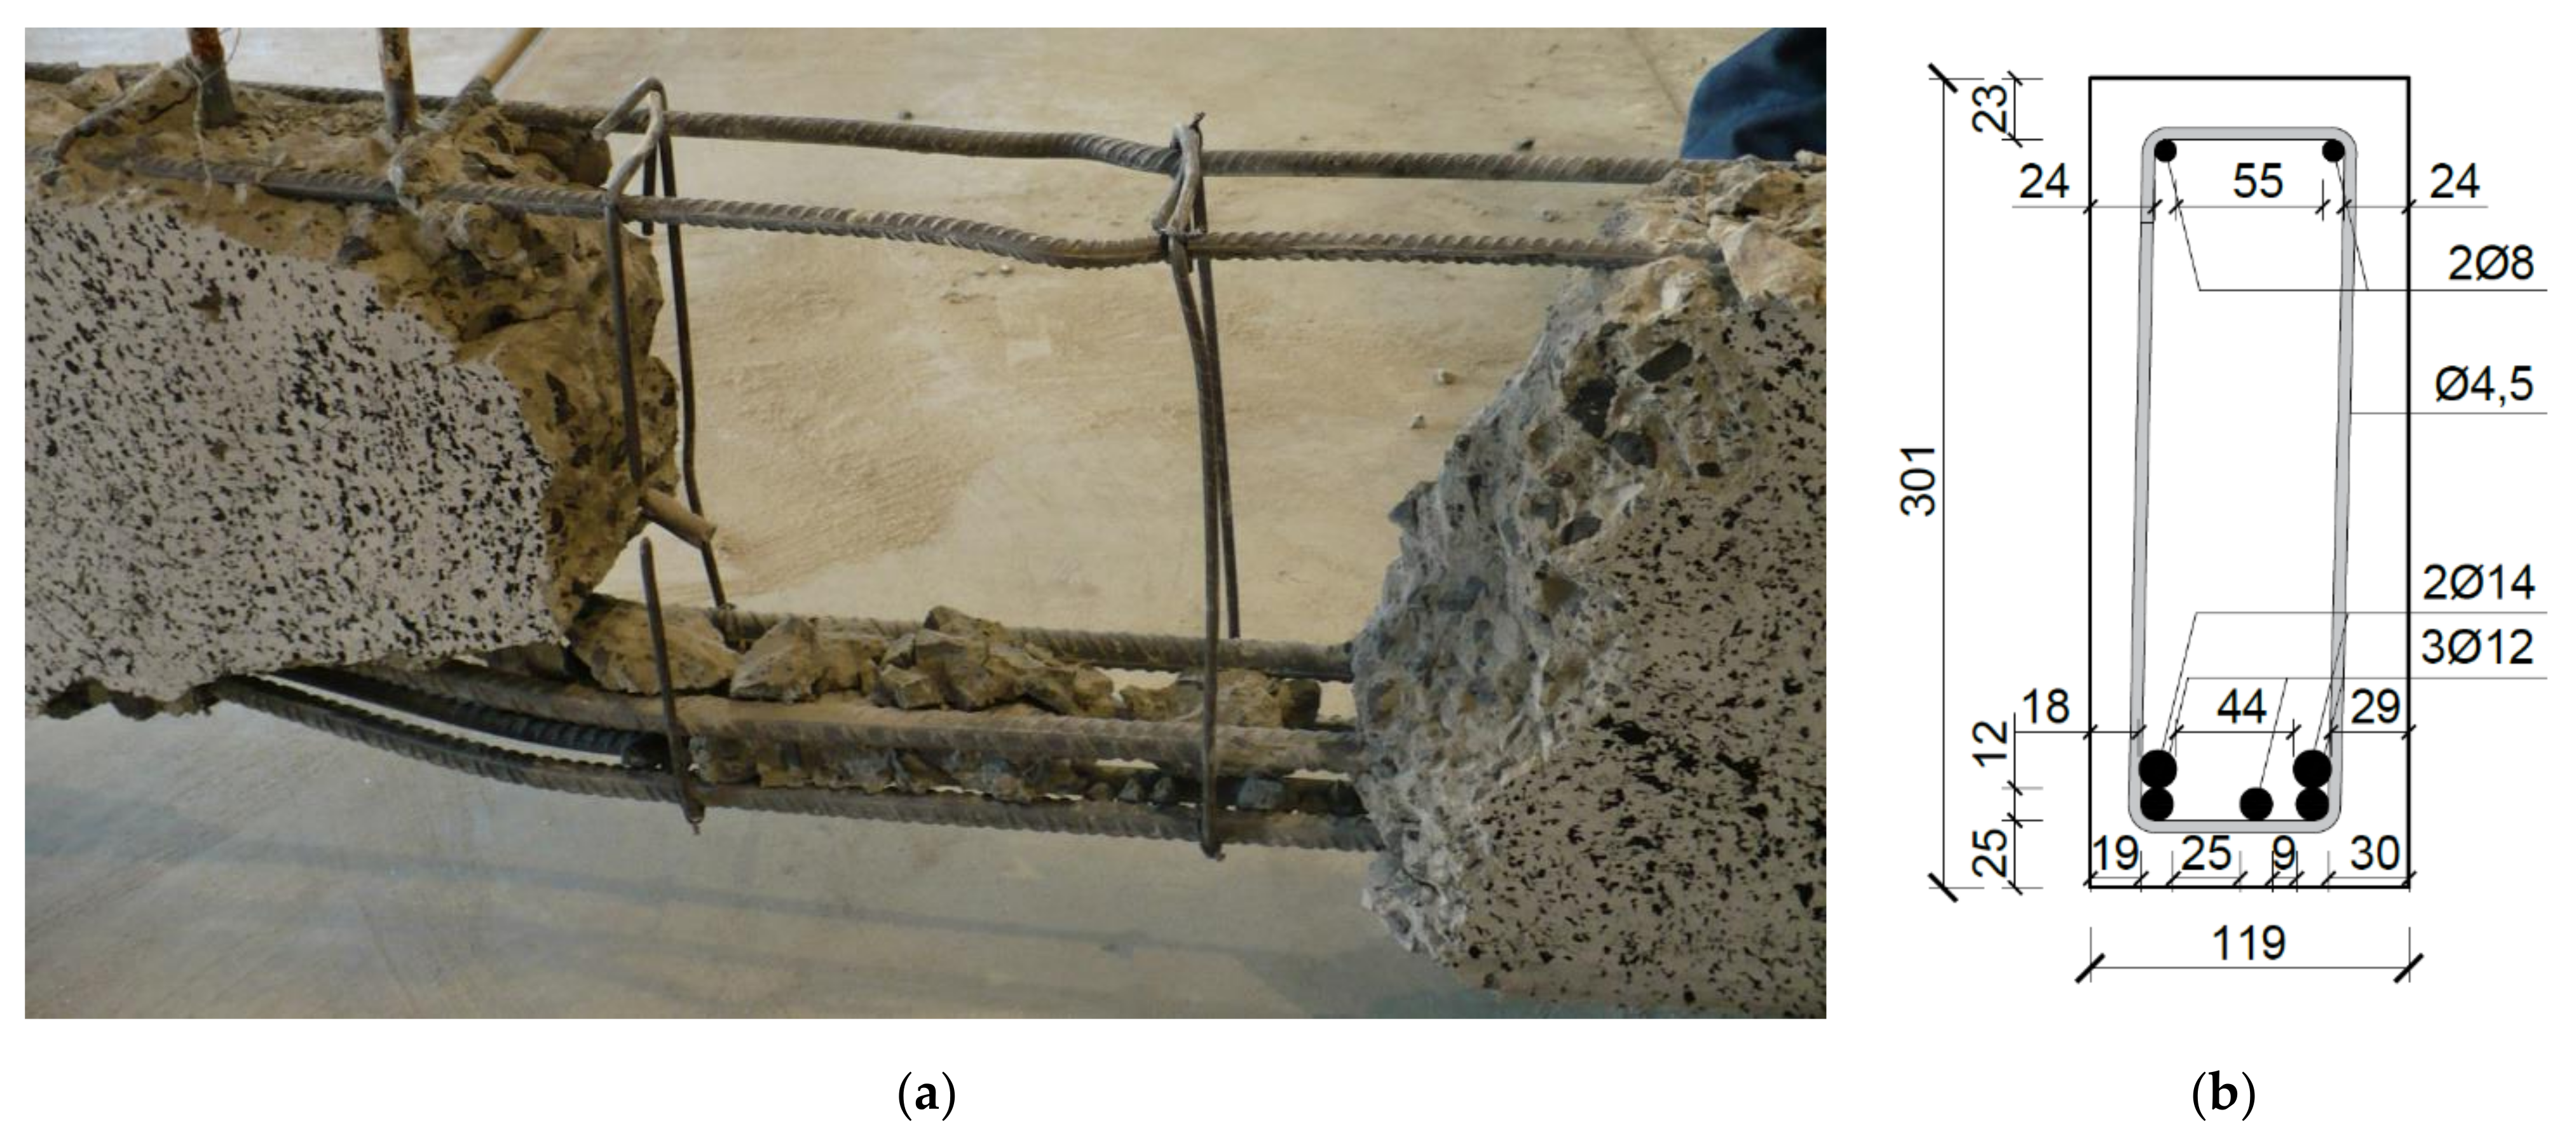
2.1. Test Elements
2.2. Test Setups
2.3. Static Scheme and Load Program
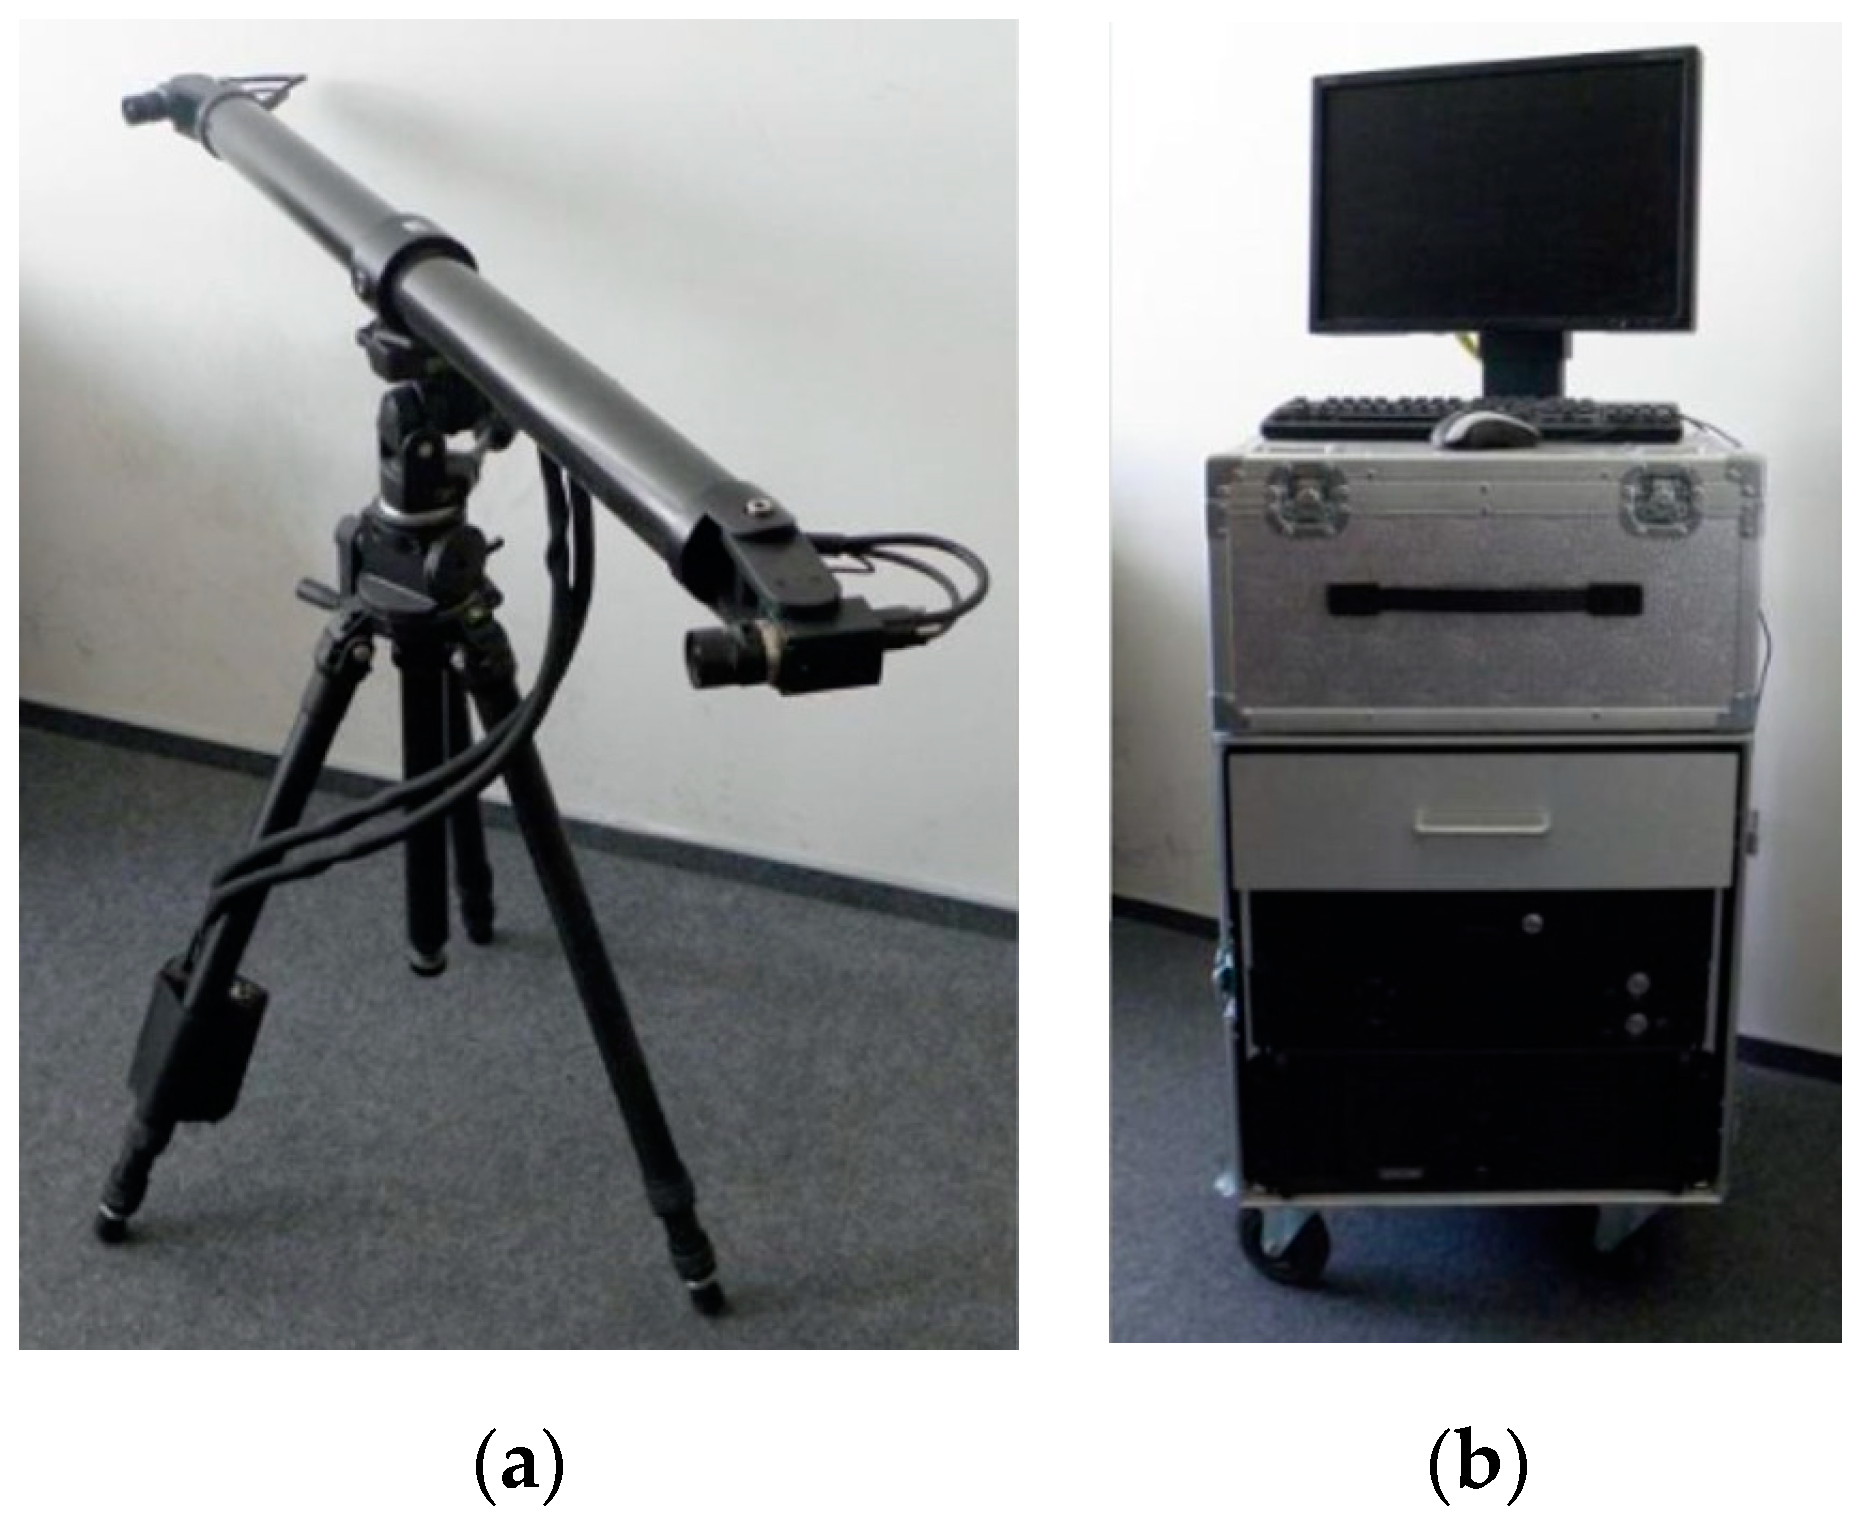
2.4. Test Apparatus
- for elements S2M and S2C, two tripods of the optical system allowed testing two beam support surfaces by creating overlapping measurement fields with dimensions 0.30 m × 1.40 m (Figure 9a),
- for BL-02M elements, due to loading with one concentrated force, the measurement field covered the support zone at the actuator with dimensions of 0.45 m × 1.70 m and 0.45 m × 1.80 m (Figure 9b,c),
- for double-span elements B3C, two tripods of the optical system were used to cover the measurement areas of the support zone loaded with two forces and with one force, thus creating two measurement fields with dimensions of 0.30 m × 1.40 m each (Figure 9d). The surface of the measurement fields, shown in Figure 9, had to be adequately prepared before the test by applying a black paint pattern to enable continuous tracking of strain changes. Strain analyses and calculations were performed on the prepared measurement fields of the beams after the test ended.
2.5. Additional Tests
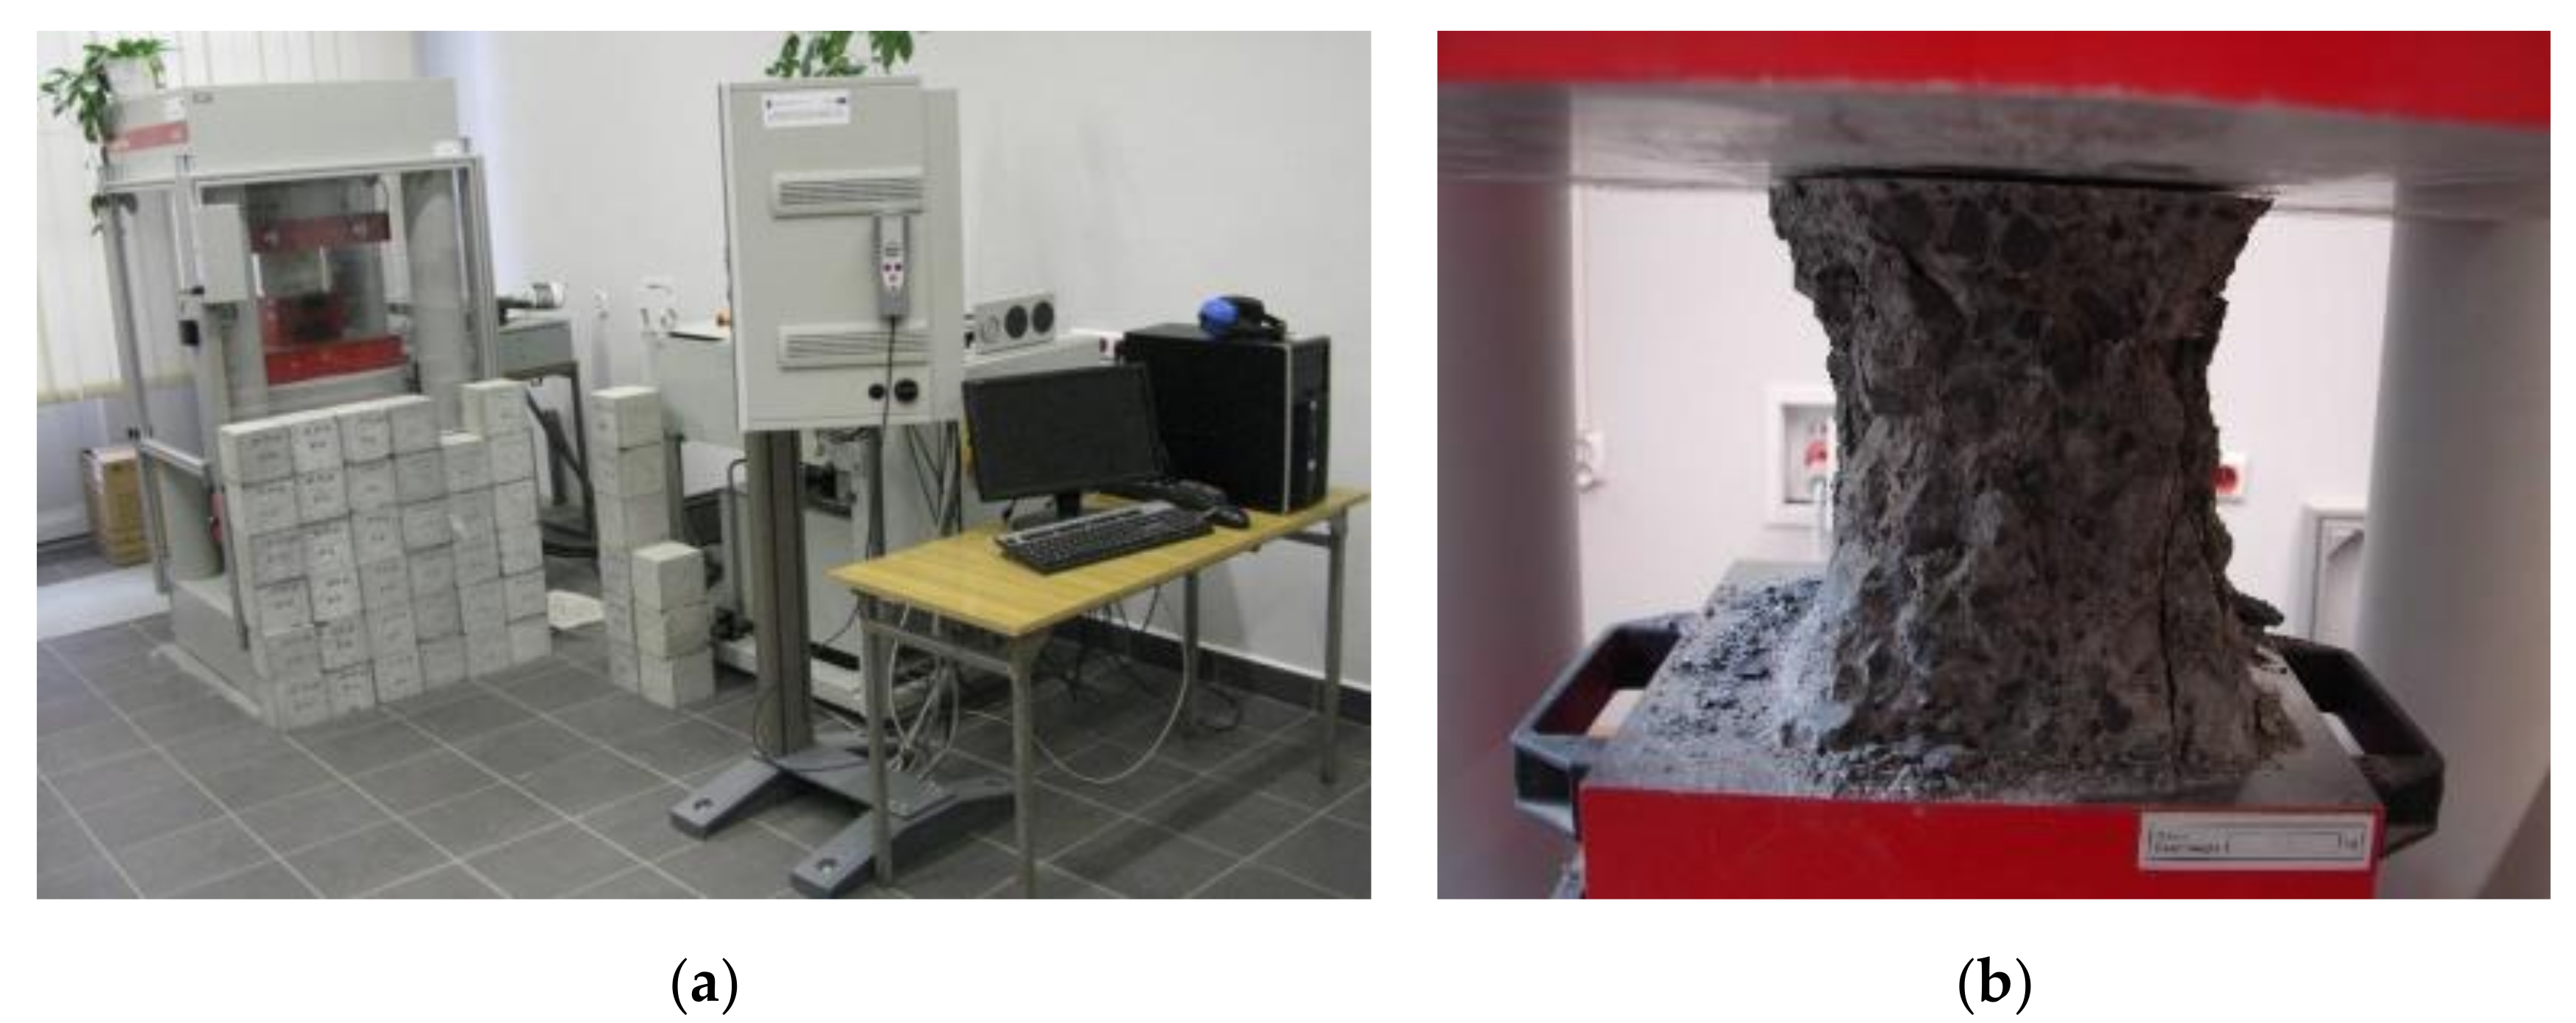
2.5.1. Concrete Strength
2.5.2. Steel Strength
3. Test Results and Analysis
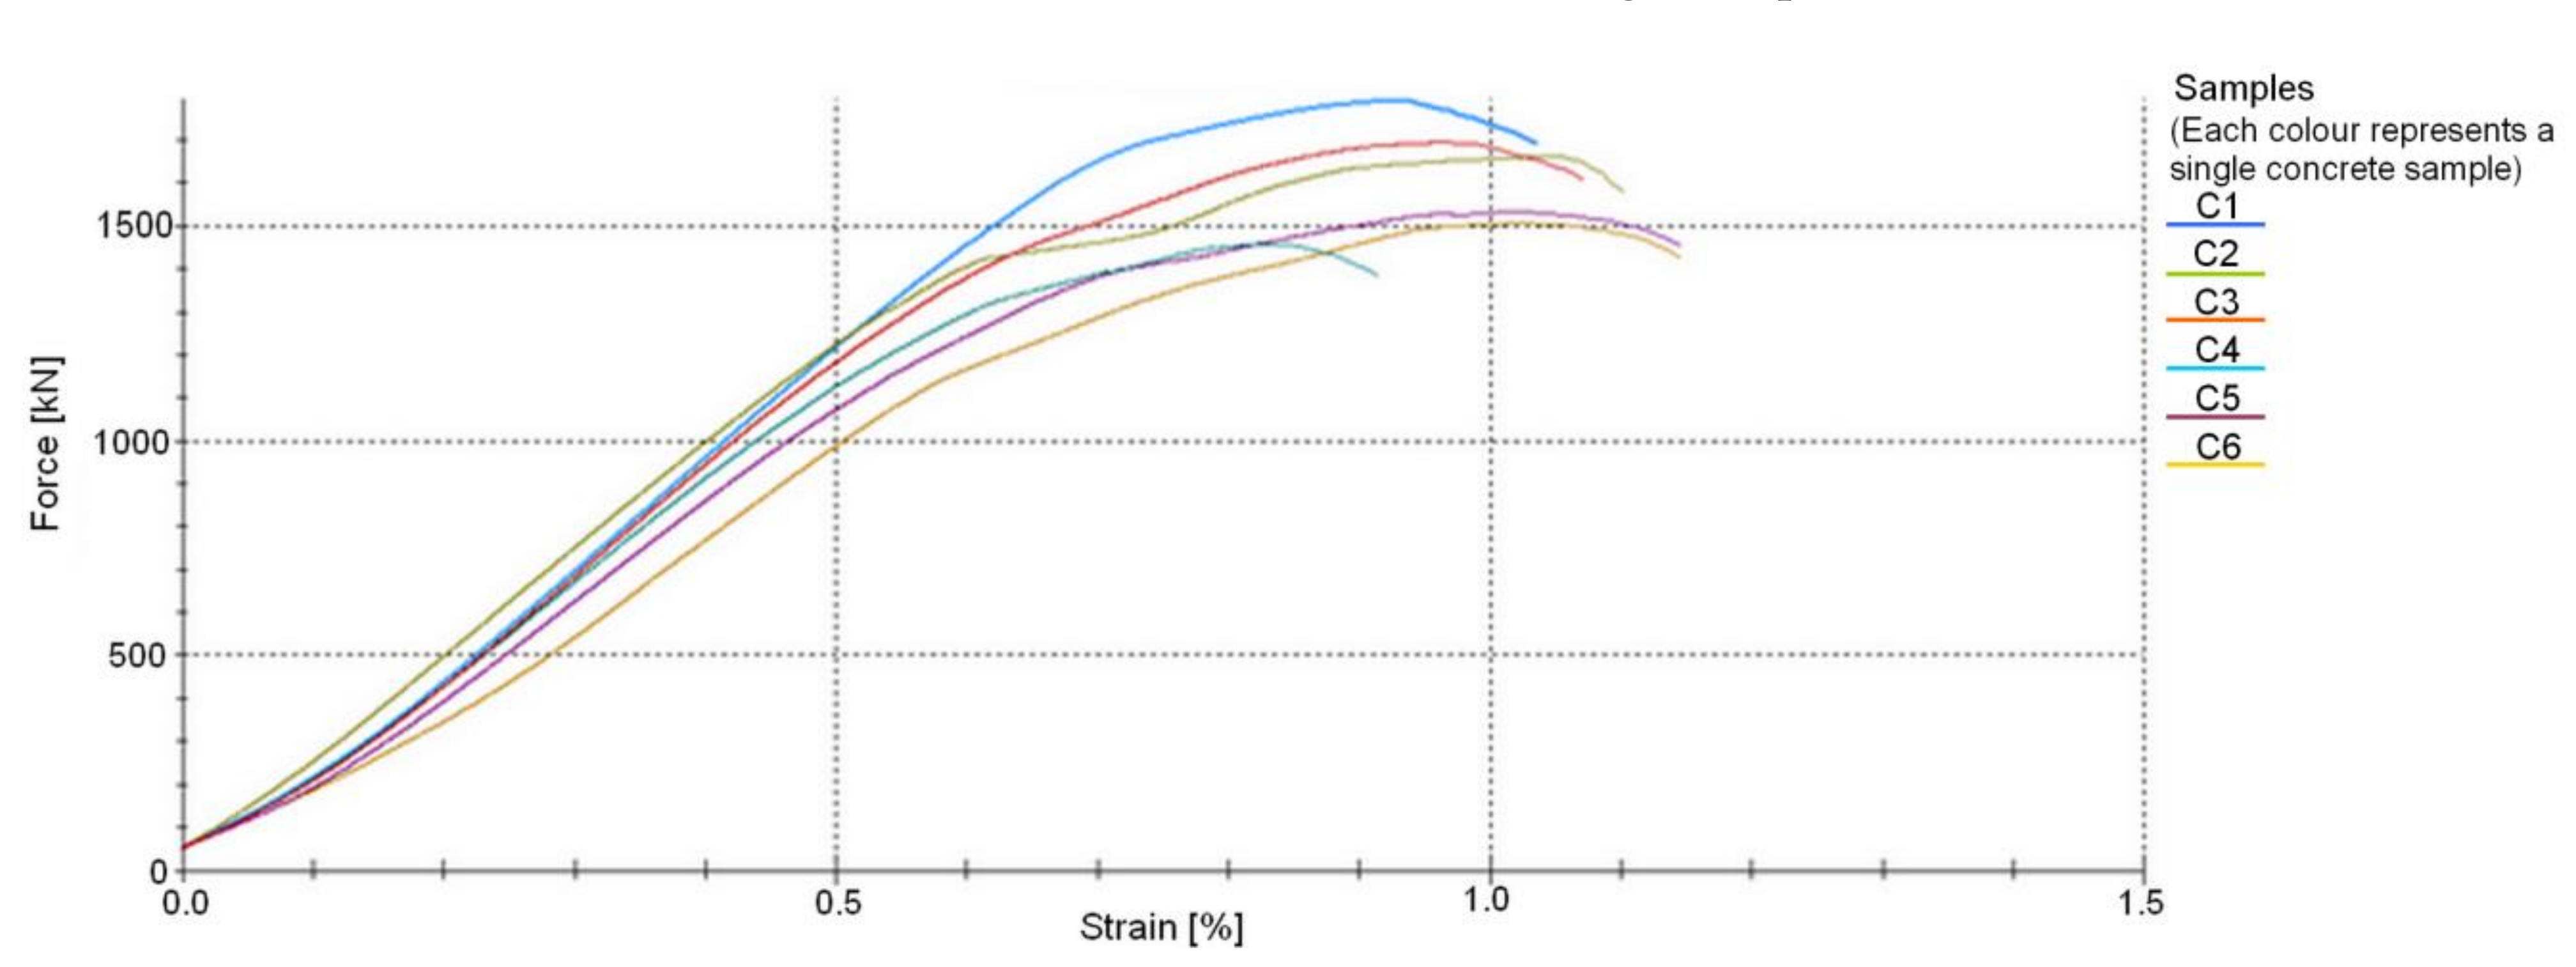
3.1. Results of Experimental Research
3.2. Calculation Models
3.3. Selection of Models for Calculation
- Mӧrsch truss model acc. to Kupfer–Rüsch (PN-EN-1992-1:2008) [14],
- Mӧrsch truss model acc. to Kupfer–Rüsch (DIN 1045-1:2008) [17],
- models acc. to ACI-318-14; approaches 1, 2, 3, 4 (ACI-318-14) [18],
- model acc. to ACI-318-19; approaches 1, 2, 3 (ACI-318-19) [4],
- Clader, Mari, Bairan, Oller and Ribas model, [48],
- Bentz and Collins model—simplified and detailed method, [52],
- Reineck model [53],
- Hong-Gun Park, Kyoung-Kyu Choi model [54],
- Forsch, Yu, Cusatis and Bazant model [57],
- Li, Hsu and Hwang [60].
- comparison of the experimental load capacity with the shear capacity of the concrete cross-section in the beam supporting zone,
- comparison of the experimental load capacity with the shear capacity of the beam support zone.
- obtaining the calculated shear capacity of concrete or the calculated shear capacity for a given element greater than the experimental capacity,
- no repeatability of the model in the already selected group to avoid duplicating the results obtained,
- adopting substantial simplifications in the model in order to simplify the design calculations at the expense of the accuracy of the results.
- the simplified modified compressed field theory model used in Model Code 2010 approximation No. 3 [3]—as it is the only approach adopted in Model Code 2010, in which the total shear capacity of the support zone accounts for the resistance of cracked concrete expressed by aggregate interlock.
- Mӧrsch truss model acc. to Kupfer–Rüsch (PN-EN-1992-1-1:2008), (M-KR) [17],
- Model Code 2010, approximations 2 and 3, (MC2010 AP2 and AP3) [3],
- ACI-318-14 approach 3, (ACI-318-14 W3) [18],
- ACI-318-19 approach 1, (ACI-318-19 W1) [4],
- Bentz and Collins—detailed method, (BC-DM) [52],
- Cladera, Mari, Bairan, Oller and Ribas model, (CMBOR) [48],
- Forsch, Yu, Cusatis and Bazant model, (FYCB) [57],
- Hong-Gun Park, Kyoung-Kyu Choi model, (PC) [54].
3.4. Analysis of the Results
- the compliance of the shear capacity values obtained from the tests with those calculated according to the selected models,
- the effect of adopting the diagonal compression strut inclination angle θ,
- the contribution of concrete in shear resistance.
4. Discussion
- the loading program, static scheme, and the dimensions of the beam cross-section affect the experimental shear capacity of the reinforced concrete beam support zone,
- as demonstrated, statically indeterminate elements show lower shear capacity than statically determinate elements under cyclic and monotonic loads,
- values of shear capacity calculated from the modified truss model largely depend on the angle θ (the angle of inclination of a diagonal strut) and are much lower than the values obtained experimentally,
- the ctg θ value used in some models does not result from the inclination angle θ of the compressed concrete diagonals and can be used as an effective parameter for adjusting the shear design values to fit the experimental results (e.g., Model Code 2010 approximations 2 and 3 [3], Bentz and Collins [52] and Hong-Gun Park, Kyoung-Kyu Choi model) [54,55,56],
- the shear capacity of the RC beam support zone depends on the shear strength provided by the shear reinforcement and concrete (e.g., interlocking effect—MC2010 [3], dowel action—e.g., ACI [4,18]) during loading and after cracking. For this reason, it should be taken into account in shear capacity estimation.
5. Conclusions
- verification of calculation models, including numerical models, should be based on test results for statically indeterminate beams under cyclic loading;
- the highest agreement between the experimental and calculated shear capacity was obtained from the models that are independent of angle θ;
- the value of ctg θ can serve as a parameter adjusting calculated shear capacity to real values;
- the support zone capacity calculations for the entire loading process and after cracking should take into account the capacities of both transverse reinforcement and concrete.
Author Contributions
Funding
Institutional Review Board Statement
Informed Consent Statement
Data Availability Statement
Conflicts of Interest
References
- Aguilar, V.; Barnes, R.; Nowak, A. Shear Strength of Concrete Members: Challenges, Recent Developments and Possibilities. Adv. Civ. Eng. Technol. 2020, 1, 4. [Google Scholar]
- Godycki-Ćwirko, T. Ścinanie w Żelbecie; Arkady: Warszwa, Poland, 1968. (In Polish) [Google Scholar]
- Pre-norma Konstrukcji Betonowych—Fib Model Code 2010, Tom 2; fib CEB-FIP Polish Group; Polski Cement: Kraków, Poland, 2014; Volume 2, p. 45. (in Polish)
- ACI 318-19 Building Code Requirements for Structural Concrete with Commentary; American Concrete Institute: Farmington Hills, MI, USA, 2019.
- Pawelska-Mazur, M.; Kaszyńska, M. Mechanical Performance and Environmental Assessment of Sustainable Concrete Recycled End-of-Life Tyre Fibers. Materials 2021, 14, 256. [Google Scholar] [CrossRef] [PubMed]
- Jagadesh, P.; Juan-Valdes, A.; Guerra-Romero, M.I.; Pozo, J.M.M.; Garicia-Gonzalez, J.; Martinez-Garcia, R. Effect of Design Parameters on Compressive and Split Tensile Strength of Self-Compacting Concrete with Recycled Aggregate: An Overview. Appl. Sci. 2021, 11, 6028. [Google Scholar] [CrossRef]
- Lee, E.; Ko, J.; Yoo, J.; Park, S.; Nam, J. Analysis of the Aggregate Effect on the Compressive Strength of Concrete Using Dune Sand. Appl. Sci. 2021, 11, 1952. [Google Scholar] [CrossRef]
- Kaszyńska, M.; Skibicki, S. Influence of Eco-Friendly Mineral Additives on Early Age Compressive Strength and Temperature Development of High-Performance Concrete. In IOP Conference Series: Earth and Environmental Science; IOP Publishing: Bristol, UK, 2017; Volume 95. [Google Scholar]
- Ju, H.; Yerzhanov, M.; Serik, A.; Lee, D.; Kim, J.R. Statistical and Reliability Study on Shear Strength of Recycled Coarse Aggregate Reinforced Concrete Beams. Materials 2021, 14, 3321. [Google Scholar] [CrossRef]
- Goszczyńska, B.; Trąmpczyński, W.; Bacharz, M.; Bacharz, K.; Tworzewska, J.; Tworzewski, P. Doświadczalna analiza odkształceń przestrzennych belek żelbetowych z zastosowaniem skanera optycznego 3D. Inżynieria I Bud. 2014, 3, 156–159. (In Polish) [Google Scholar]
- Trąmpczyński, W.; Goszczyńska, B.; Tworzewska, J. Analysis of Crack Width Development in Reinforced Concrete Beams. Materials 2021, 14, 3043. [Google Scholar]
- Godowska, M. Automatyzacja Badań belek Żelbetowych z Zastosowaniem Zestawu Pomiarowego HBM, Aktualne Badania i Analizy z Inżynierii Lądowej; Wydawnictwo Politechniki Śląskiej: Gliwice, Poland, 2013; pp. 225–231. (In Polish) [Google Scholar]
- Świątkiewicz, A. Fotogrametria; PWN: Warszawa, Poland, 1979. (In Polish) [Google Scholar]
- PN-EN-1992-1-1:2008 Eurokod 2: Projektowanie Konstrukcji z Betonu-Część 1: Reguły Ogólne i Reguły dla Budynków; PKN: Warszawa, Poland, 2008. (In Polish)
- PN-B-03264:1999-Konstrukcje Betonowe, Żelbetowe i Sprężone-Obliczenia Statyczne i Projektowanie; PKN: Warszawa, Poland, 1999. (In Polish)
- PN-B-03264:2002-Konstrukcje Betonowe, Żelbetowe i Sprężone-Obliczenia Statyczne i Projektowanie; PKN: Warszawa, Poland, 2002. (In Polish)
- DIN 1045-1 Tragwerke aus Beton, Stahlbeton und Spannbeton–Teil 1: Bemessung und Konstruktion; Deutsches Institut für Normung: Berlin, Germany, 2008. (In German)
- ACI 318-14 Building Code Requirements for Structural Concrete with Commentary; American Concrete Institute: Farmington Hills, MI, USA, 2014.
- Ahmad, A.; Baker, A.L.L. A Statically Indeterminate Truss Mechanism for Reinforced Concrete Beams, Filing by Shear. Ph.D. Thesis, University of London, London, UK, 1963. [Google Scholar]
- Godycki-Ćwirko, T. Mechanika Betonu; Arkady: Warszawa, Polnad, 1982. (In Polish) [Google Scholar]
- Leonhardt, F.; Walther, R. Beitrage zur Behandlung der Schubprobleme im Stahlbetonbau, 4. fortsetzung des Kapitals II: Versuchsberichte, Beton und Stahlbetonbau. 1962. (In German) [Google Scholar]
- Kupfer, H. Erweiterung der Mörsches-Fachwerkanalogie mit Hilfe des Prinzips vom Minimum der Formänderungsarbeit. In Bulletin d’Inoformation; CEB: Paris, France, 1964; p. 40. (In German) [Google Scholar]
- Digler, W. Einfluss der Querkraft auf Die Traglast Statisch Unbestimmt Gelagerter Stahlbeton-Stabtragwerke; Diss T.H.: Stuttgart, Germany, 1965. (In German) [Google Scholar]
- Rusch, H. Über die Grenzen der Anwendbarkeit der Fachwerkanalogie bei der Berechnung der Schubfestigkeit von Stahlbetonbalken. In Ehrenbuch Prof. Ing. F. Campus, Amicet Alumni. 1964. (In German) [Google Scholar]
- PAN, S.K.B.K. Podstawy Projektowania Konstrukcji Żelbetowych i Sprężonych Według Eurokodu 2; Dolnośląskie Wydawnictwo Edukacyjne: Wrocław, Poland, 2006. (In Polish) [Google Scholar]
- Lipski, A. Poutres a âme mince en béton armé on precontraint. In Annales des Travaux Publiés de Belgique; 1971. (In French) [Google Scholar]
- Boriszański, M.S. Rasczotot Ognutych Stierżni i Chomutow w Izgibajemnych Żelzaobietonnych Elemirntach po Stadii Razruszenia; Strojizdat: Moskwa, Russia, 1946. (In Russian) [Google Scholar]
- Kani, G. The Riddle of Shear Failure and Its Solution. ACI J. 1964, 61, 441–468. [Google Scholar]
- Kani, G. Basic Factor Concerning Shear Failure. J. Proc. 1966, 63, 675–692. [Google Scholar]
- PN-B-03264:1984 Konstrukcje Betonowe, Żelbetowe i Sprężone. Obliczenia Statyczne i Projektowe; Wydawnictwo Normalizacyjne ALFA: Warszawa, Poland, 1984. (In Polish)
- Collins, P.M.; Mitchell, D.; Adebar, P.; Vecchio, F.J. A General Shear Design Method. ACI Struct. J. 1996, 93, 36–45. [Google Scholar]
- Vecchio, F.J.; Collins, M.P. The Modified Compression Field Theory for Reinforced Concrete Elements Subjected to Shear. ACI J. Proc. 1986, 83, 219–231. [Google Scholar]
- Bentz, E.C.; Vecchio, F.J.; Collins, M.P. Simplified Modified Compression Field Theory for Calculating Shear Strength of Reinforced Concrete Elements. ACI Struct. J. 2006, 103, 614–624. [Google Scholar]
- Sigrist, V. Generalized Stress Field Approach for Analysis of Beams in Shear. ACI Struct. J. 2011, 108, 479–487. [Google Scholar]
- Wójcicki, A. Strefa Przypodporowa Belek Żelbetowych w Doświadczeniu i Opisie Modelowym. Ph.D. Thesis, Politechnika Świętorzyska, Kielce, Poland, 2000. (In Polish). [Google Scholar]
- Goszczyński, S.; Wójcicki, A.; Bijak, I. Estymacja parametrów modelu betonu dla strefy ścinania belki żelbetowej. Bud. I Inżynieria Sr. 2004, 37, 97–102. (In Polish) [Google Scholar]
- Woliński, S. Wymiarowanie elementów żelbetowych metodą symulacji Monte Carlo. Inżynieria I Bud. 2002, 6, 335–337. [Google Scholar]
- Buda-Ożóg, L. Niezawodność Konstrukcji Żelbetowych Projektowanych Metodą Strut and Tie; Oficyna Wydawnicza Politechniki Rzeszowskiej: Rzeszów, Poland, 2019. (In Polish) [Google Scholar]
- Chorzępa, M.; Kim, Y.J.; Yun, G.J.; Harmon, T.G.; Dyke, S. Cyclic Shear-Friction Constitutive Model for Finite Element Analysis of Reinforced Concrete Membrane Elements. ACI Struct. J. 2011, 108, 324–331. [Google Scholar]
- Bhatt, P.; Kader, A.M. Prediction of shear strength of reinforced concrete beams by nonlinear finite element analysis. Comput. Struct. 1998, 68, 139–155. [Google Scholar] [CrossRef]
- Potisuk, T.; Higgins, C.C.; Miller, T.H.; Yim, S.C. Finite Element Analysis of Reinforced Concrete Beams with Corrosion Subjected to Shear. Adv. Civ. Eng. 2011. [Google Scholar] [CrossRef] [Green Version]
- Arafar, M.; Alqedra, M.; An-Najjar, H. Neural Network Models for Predicting Shear Strength of Reinforced Normal and High-strength Concrete Deep Beams. J. Appl. Sci. 2011, 11, 266–274. [Google Scholar] [CrossRef] [Green Version]
- Koo, S.; Shin, D.; Kim, C. Application of Principal Component Analysis Approach to Predict Shear Strength of Reinforced Concrete Beams with Stirrups. Materials 2021, 14, 3471. [Google Scholar] [CrossRef]
- Walrawen, J.C. Fundamental Analysis of Aggregate Interlock. J. Struct. Div. 1981, 107, 2245–2270. [Google Scholar] [CrossRef]
- Lantsonght, E.O.; van der Veem, C.; Walrawen, J.C. Case Study on Aggregate Interlock Capacity for the Shear Assessment of Cracked Reinforced-Concrete Bridge Cross Sections. J. Bridge Eng. 2016, 21, 04016004. [Google Scholar] [CrossRef] [Green Version]
- Sun, C.; Chen, Q.; Xiao, J.; Ge, W. Study on aggregate interlock behavior of pre-cracked recycled aggregate concrete without stirrups. J. Build. Eng. 2021, 39, 102257. [Google Scholar] [CrossRef]
- Belarbi, A.; Kuchma, D.A.; Sanders, D.H. Proposals for New One-Way Shear Equations for the 318 Building Code. Concr. Int. 2017, 39, 29–32. [Google Scholar]
- Cladera, A.; Mari, A.; Bairan, J.-M.; Oller, E.; Ribas, C. One way Shear Design Method Based on a Multi-Action Model. Concr. Int. 2017, 39, 40–46. [Google Scholar]
- Mari, A.; Bairan, J.; Caldera, A.; Oller, E.; Ribas, C. Shear Flexural Strength Mechanical Model for the Design and Assessment of Reinforced Concrete Beams. Struct. Infrastruct. Eng. 2015, 11, 1399–1419. [Google Scholar] [CrossRef]
- Caldera, A.; Mari, A.; Ribas, C.; Bairan, J.; Oller, E. Predicting the Shear-Flexural Strength of Slender Reinforced Concrete T and I Shaped Beams. Eng. Struct. 2015, 101, 386–398. [Google Scholar] [CrossRef]
- Mari, A.; Bairan, J.M.; Caldera, A.; Oller, E. Shear Design and Assessment of Reinforced and Prestressed Concrete Beams Based on a Mechanical Model. J. Struct. Eng. 2016, 142, 04016064. [Google Scholar] [CrossRef] [Green Version]
- Benatz, E.C.; Collins, M.P. Updating the ACI Shear Design Provisions. Concr. Int. 2017, 39, 33–38. [Google Scholar]
- Reineck, K.H. Proposal for ACI 318 Shear Design. Concr. Int. 2017, 39, 65–70. [Google Scholar]
- Hong-Gun Park, K.-K.C. Unified Shear Design Method of Concrete Beams Based on Compression Zone Failure Mechanism. Concr. Int. 2017, 39, 59–63. [Google Scholar]
- Choi, K.-K.; Park, H.-G.; Wight, J. Unified Shear Strength Model for Reinforced Concrete Beams—Part 1: Development. ACI Struct. J. 2007, 104, 142. [Google Scholar]
- Choi, K.-K.; Park, H.-G. Unified Shear Strength Model for Reinforced Concrete Beams—Part 2: Verification and Simplified Method. ACI Struct. J. 2007, 104, 153. [Google Scholar]
- Forsch, R.J.; Yu, Q.; Cusatis, G.; Bažant, Z.P. A Unified Approach to Shear Design. Concr. Int. 2017, 39, 47–52. [Google Scholar]
- Tureyen, A.K.; Forsch, R.J. Concrete shear strength: Another prospective. Struct. J. 2003, 100, 609–615. [Google Scholar]
- Tureyen, A.K.; Wolf, T.S.; Forsch, R.J. Shear strength of reinforced concrete T-beams without transverse reinforcement. ACI Struct. J. 2006, 103, 656. [Google Scholar]
- Li, Y.-A.; Hsu, T.T.; Hwang, S.-J. Shear Strength of Prestressed and Nonprestressed Concrete Beams. Concr. Int. 2017, 39, 53–57. [Google Scholar]
- Kuo, W.W.; Hsu, T.T.C.; Hwang, S.J. Shear Strength of Reinforced Concrete Beams. ACI Struct. J. 2014, 111, 809–818. [Google Scholar] [CrossRef]
- Laskar, A.; Hsu, T.T.C.; Mo, Y.L. Shear strengths of Prestressed Concrete Beam Part 1: Experiments and Shear Design Equations. ACI Struct. J. 2010, 107, 330–339. [Google Scholar]
- Hsu, T.T.C.; Laskar, A.; Mo, Y.L. Shear Strengths of Prestressed Concrete Beams Part 2: Comparisons with ACI and AASHTO Provisions. ACI Struct. J. 2010, 107, 340–345. [Google Scholar]
- Kuchma, D.A.; Wei, S.; Sanders, D.H.; Belarbi, A.; Novak, L.C. Development of the One-Way Shear Design Provisions of ACI 318-19 for Reinforced Concrete. ACI Struct. J. 2019, 116, 285–295. [Google Scholar] [CrossRef]
- Bazant, Z.P.; Yu, Q.; Gerstle, G.; Hanson, J.; Ju, J.W. Justification of ACI 446 Proposal for Updating ACI Code Provisions for Shear Design of Reinforced Concrete Beams. ACI Struct. J. 2007, 104, 601–610. [Google Scholar]
- Aguilar, V.H. Realiability of Shear-Critical Reinforced Concrete Members. Ph.D. Thesis, Auburn University, Auburn, AL, USA, 2020. [Google Scholar]
- Godycki-Ćwirko, T. Konstrukcje Betonowe, Żelbetowe i Sprężone-Komentarz Naukowy do PN-B-03264:2002–Rozdział 9–Ścinanie; ITB: Warszawa, Poland, 2005. (In Polish) [Google Scholar]
- Sigrist, V.; Bentz, E.; Ruiz, M.F.; Foster, S.; Muttoni, A. Background to the fib Model Code 2010 shear provisions—Part I: Beams and slabs. Struct. Concr. J. Fib 2013, 14, 195–203. [Google Scholar] [CrossRef]
- Piloto, P.A.G.; Ramos-Gavilán, A.B.; Gonçalves, C.; Mesquita, L.M.R. Experimental bending tests of partially encased beams at elevated temperatures. Fire Saf. J. 2017, 92, 23–41. [Google Scholar] [CrossRef] [Green Version]
- Ferreira, D.M.; Araújo, A.; Fonseca, E.M.M.; Piloto, P.A.G.; Pinto, J. Behaviour of non-loadbearing tabique wall subjected to fire—Experimental and numerical analysis. J. Build. Eng. 2017, 9, 164–176. [Google Scholar] [CrossRef] [Green Version]


| Symbol | Dimension [m] | Longitudinal Reinforcement [mm] | Stirrups [mm/m] | Number of Elements [pcs] | Static Scheme | ||
|---|---|---|---|---|---|---|---|
| Length | Cross-Section | Top | Bottom | ||||
| S2M-1 to 4 | 3.30 | 0.12 × 0.30 | 2ϕ8 | 3ϕ12 + 2ϕ14 | ϕ4.5/0.20 | 4 | Single-span |
| S2C-1,2 | 3.30 | 0.12 × 0.30 | 2ϕ8 | 3ϕ12 + 2ϕ14 | ϕ4.5/0.20 | 2 | Single-span |
| B3C-1,2 | 6.30 | 0.12 × 0.30 | 2ϕ12 | 3ϕ12 + 2ϕ14 | ϕ4.5/0.30 | 2 | Two-span |
| BL-02-M-1,3,4 | 6.60 | 0.20 × 0.45 | 2ϕ10 | 4ϕ20 + 2ϕ20 | ϕ6.0/0.50 | 3 | Single-span |
| Beams | Bottom Bars As1 [cm2] | Average Bottom Reinforcement Ratio ρAs1 | Top Bars As2 [cm2] | Shear Reinforcement Asw [cm2] | Shear Reinforcement Ratio ρw |
|---|---|---|---|---|---|
| S2M-1 to 4 | 6.47 | 0.0212 | 1.01 | 0.32 | 0.0013 |
| S2C-1,2 | 6.47 | 0.0212 | 1.01 | 0.32 | 0.0013 |
| B3C-1,2 | 4.52 | 0.0148 | 2.26 | 0.32 | 0.0009 |
| BL-02-M-1,3,4 | 18.85 | 0.0235 | 1.57 | 0.32 | 0.0009 |
| Beam | Range I [kN] | Frequency I f [Hz] | Range II [kN] | Frequency II f [Hz] | Range III [kN] | Frequency III f [Hz] |
|---|---|---|---|---|---|---|
| S2C-1,2 | 5–30 | 0.5 | 5–70 | 0.5 | 5–110 | 0.3 |
| B3C-1,2 | 15–25 | 0.25 | 15–35 | 0.12 | 15–55 | 0.06 |
| Beams | fcmCUBE [MPa] | fcm [MPa] | fckCUBE [MPa] | fck [MPa] | fctm [MPa] | |
|---|---|---|---|---|---|---|
| Single-span beams 0.12 m × 0.30 m × 3.30 m | S2M-1,2 | 71.9 | 57.5 | 63.9 | 49.5 | 4.0 |
| S2M-3,4 | 74.1 | 59.3 | 66.1 | 51.3 | 4.1 | |
| S2C-1,2 | 74.1 | 59.3 | 66.1 | 51.3 | 4.1 | |
| Two-span beams 0.12 m × 0.30 m × 6.30 m | B3C-1,2 | 71.2 | 57.0 | 63.2 | 49.0 | 4.0 |
| Single-span beams 0.20 m × 0.45 m × 6.60 m | BL-02-1 | 65.2 | 52.1 | 57.2 | 44.1 | 3.7 |
| BL-02-3 | ||||||
| BL-02-4 | ||||||
| Beams | fm [MPa] | fyk [MPa] | fywk [MPa] | Es [GPa] | |
|---|---|---|---|---|---|
| Single-span beams 0.12 m × 0.30 m × 3.30 m | S2M-1,2,3,4 | 646.0 | 562.5 | 559.6 | 199.7 |
| S2C-1,2 | |||||
| Two-span beams 0.12 m × 0.30 m × 6.30 m | B3C-1 | ||||
| B3C-2 | |||||
| Single-span beams 0.20 m × 0.45 m × 6.60 m | BL-02M-1 | ||||
| BL-02M-3 | |||||
| BL-02M-4 | |||||
| Beams | Angle θ [deg.] | Destructive Load | Shear Force and Bending Moment at the Destructive Load | Shear Stress τ [MPa] | ||||
|---|---|---|---|---|---|---|---|---|
| S1 [kN] | S2 [kN] | S3 [kN] | S4 [kN] | V [kN] | M [kNm] | |||
| S2M-1 | 31 | - | 150.6 | 149.8 | - | 151.3 | 90.9 | 5.4 |
| S2M-2 | 30 | - | 147.5 | 152.2 | - | 152.1 | 91.4 | 5.5 |
| S2M-3 | 27 | - | 134.7 | 134.7 | - | 135.6 | 81.5 | 5.1 |
| S2M-4 | 27 | - | 134.7 | 133.2 | - | 134.3 | 80.8 | 5.1 |
| S2C-1 | 28 | - | 109.8 | 109.7 | - | 110.5 | 66.5 | 4.3 |
| S2C-2 | 35 | - | 109.7 | 109.8 | - | 110.6 | 66.5 | 4.1 |
| B3C-1 | 47 | - | 54.8 | 54.8 | 15.8 | 64.0 | 15.5 | 2.5 |
| B3C-2 | 44 | - | 54.9 | 54.8 | 15.3 | 64.1 | 15.4 | 2.4 |
| BL-02-1 | 32 | 402.0 | - | - | - | 353.4 | 283.4 | 4.8 |
| BL-02-3 | 45 | 261.1 | - | - | 217.5 | 240.6 | 2.9 | |
| BL-02-4 | 34 | 295.3 | - | - | 245.5 | 271.3 | 3.3 | |
| Model | B3C-1 | B3C-2 | S2C-1 | S2C-2 | S2M-1 | S2M-2 | S2M-3 | S2M-4 | BL-02-1 | BL-02-3 | BL-02-4 |
|---|---|---|---|---|---|---|---|---|---|---|---|
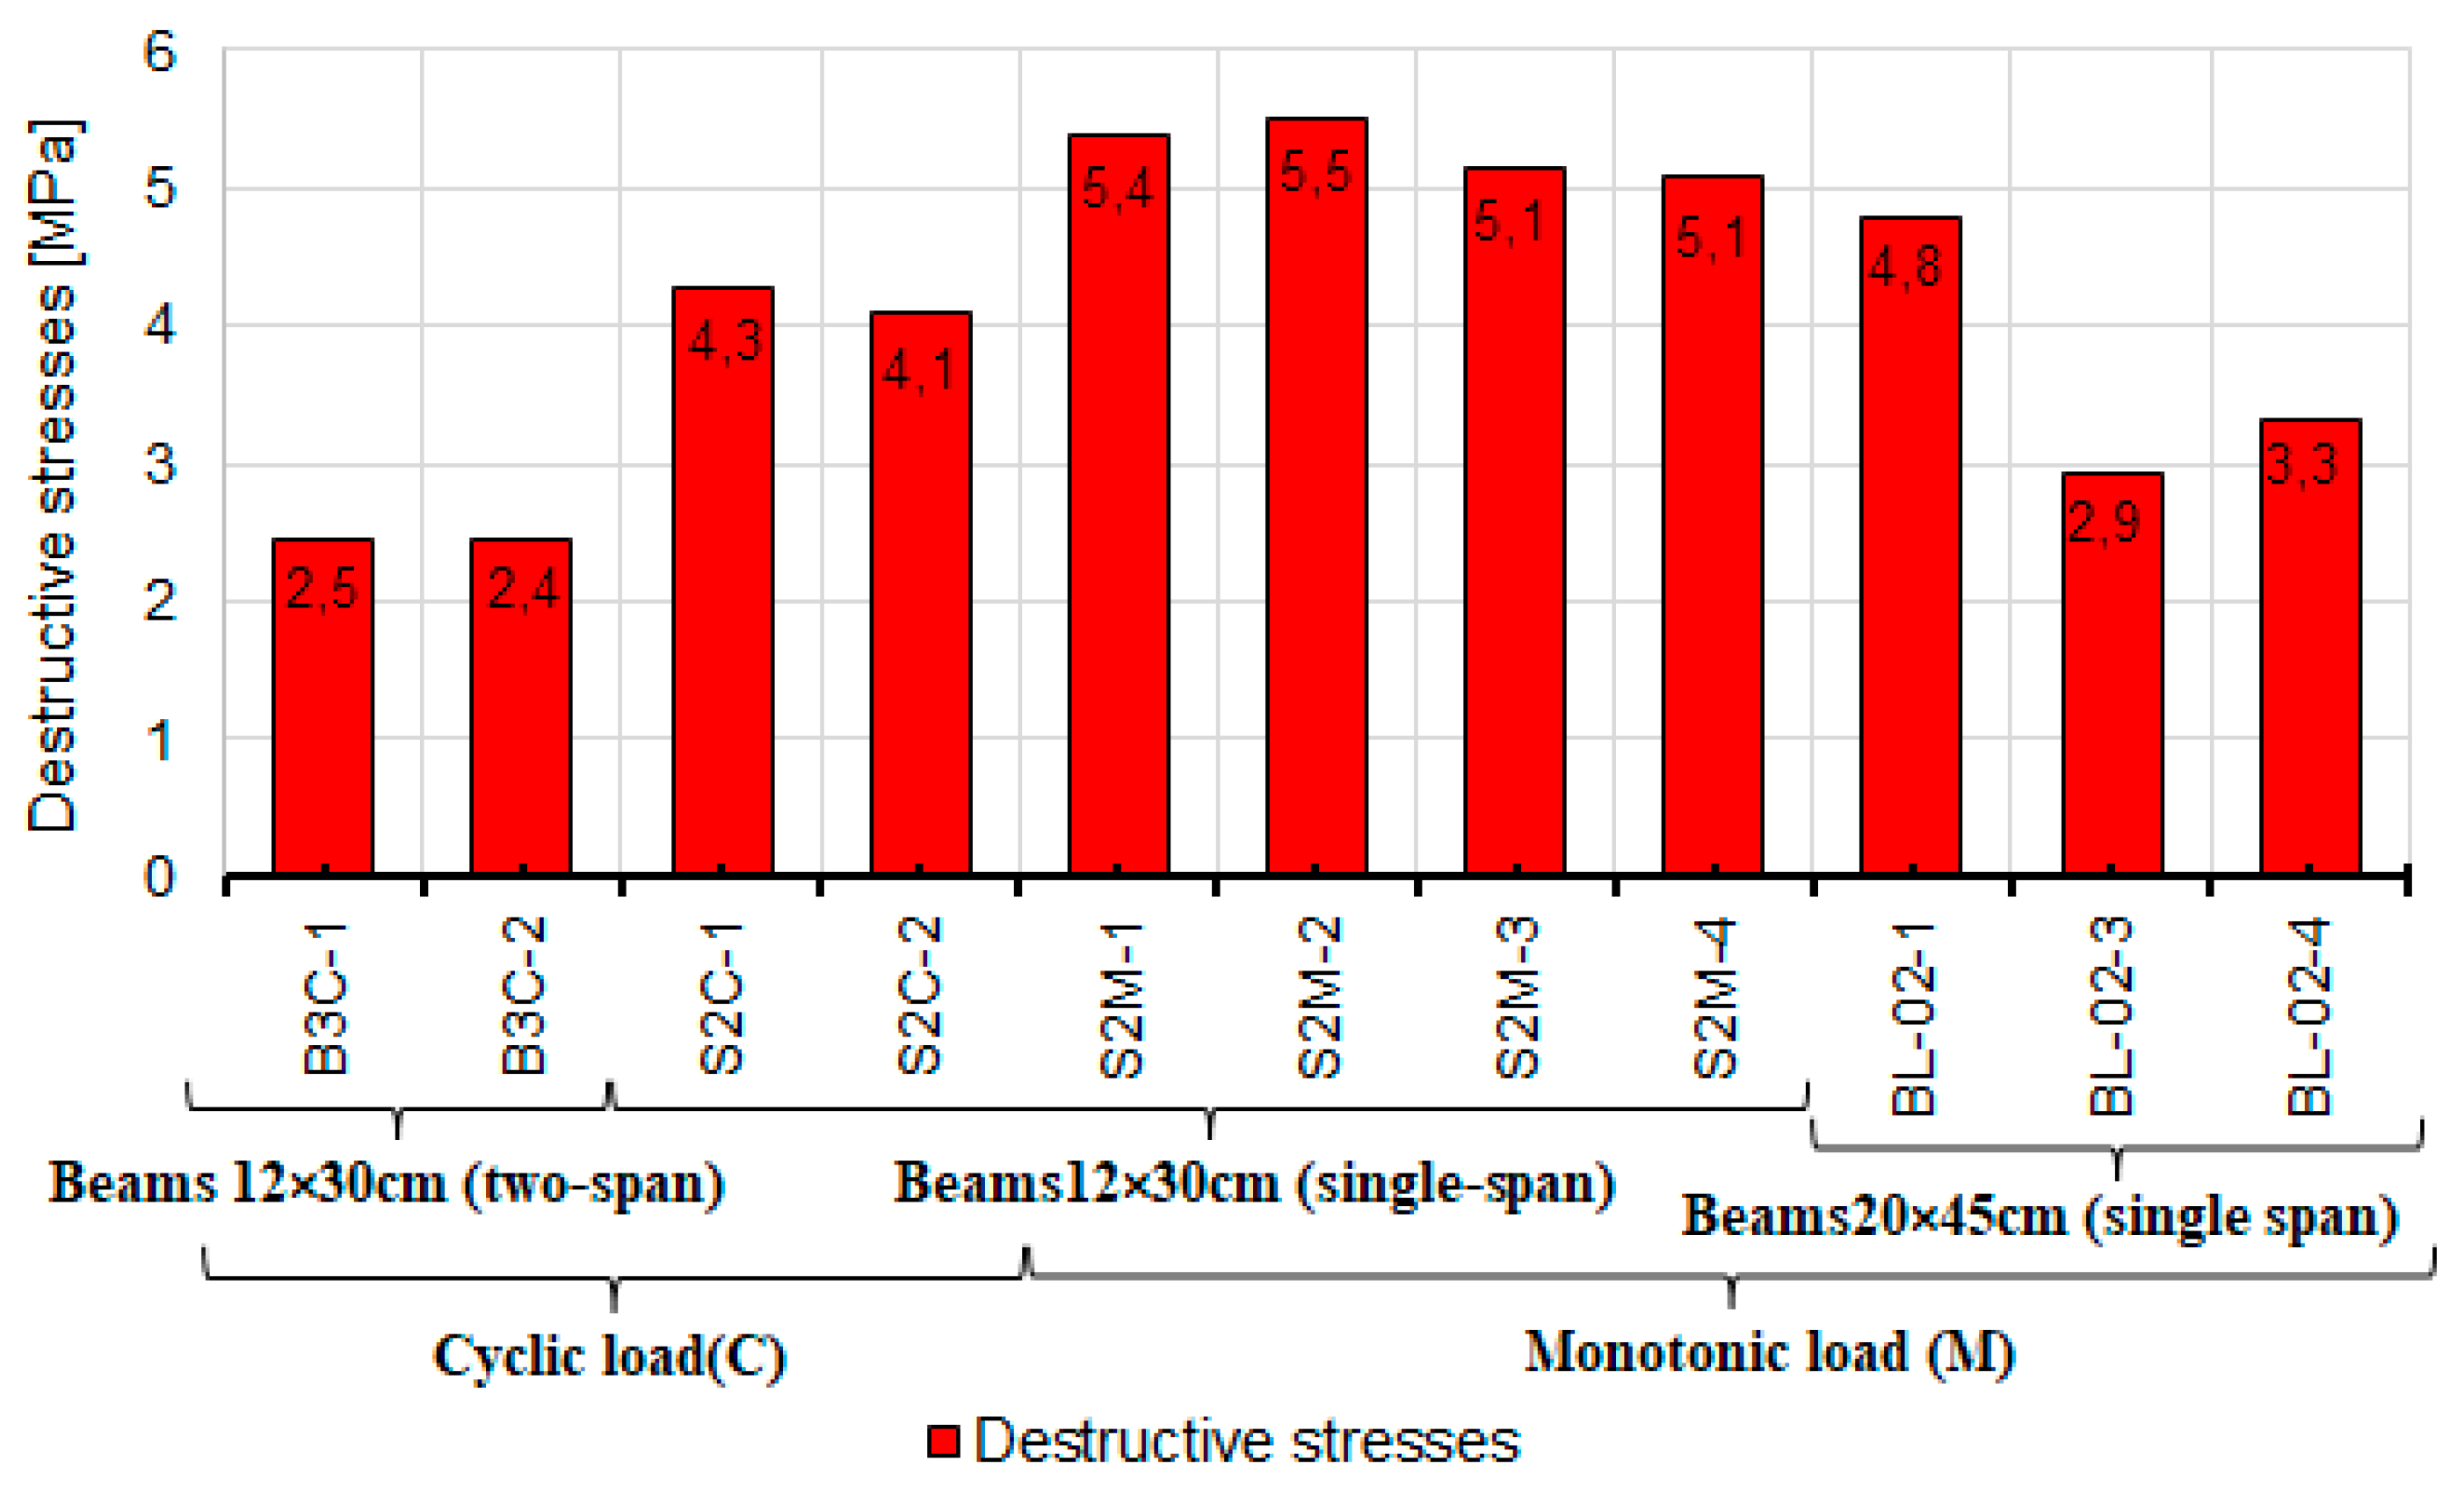
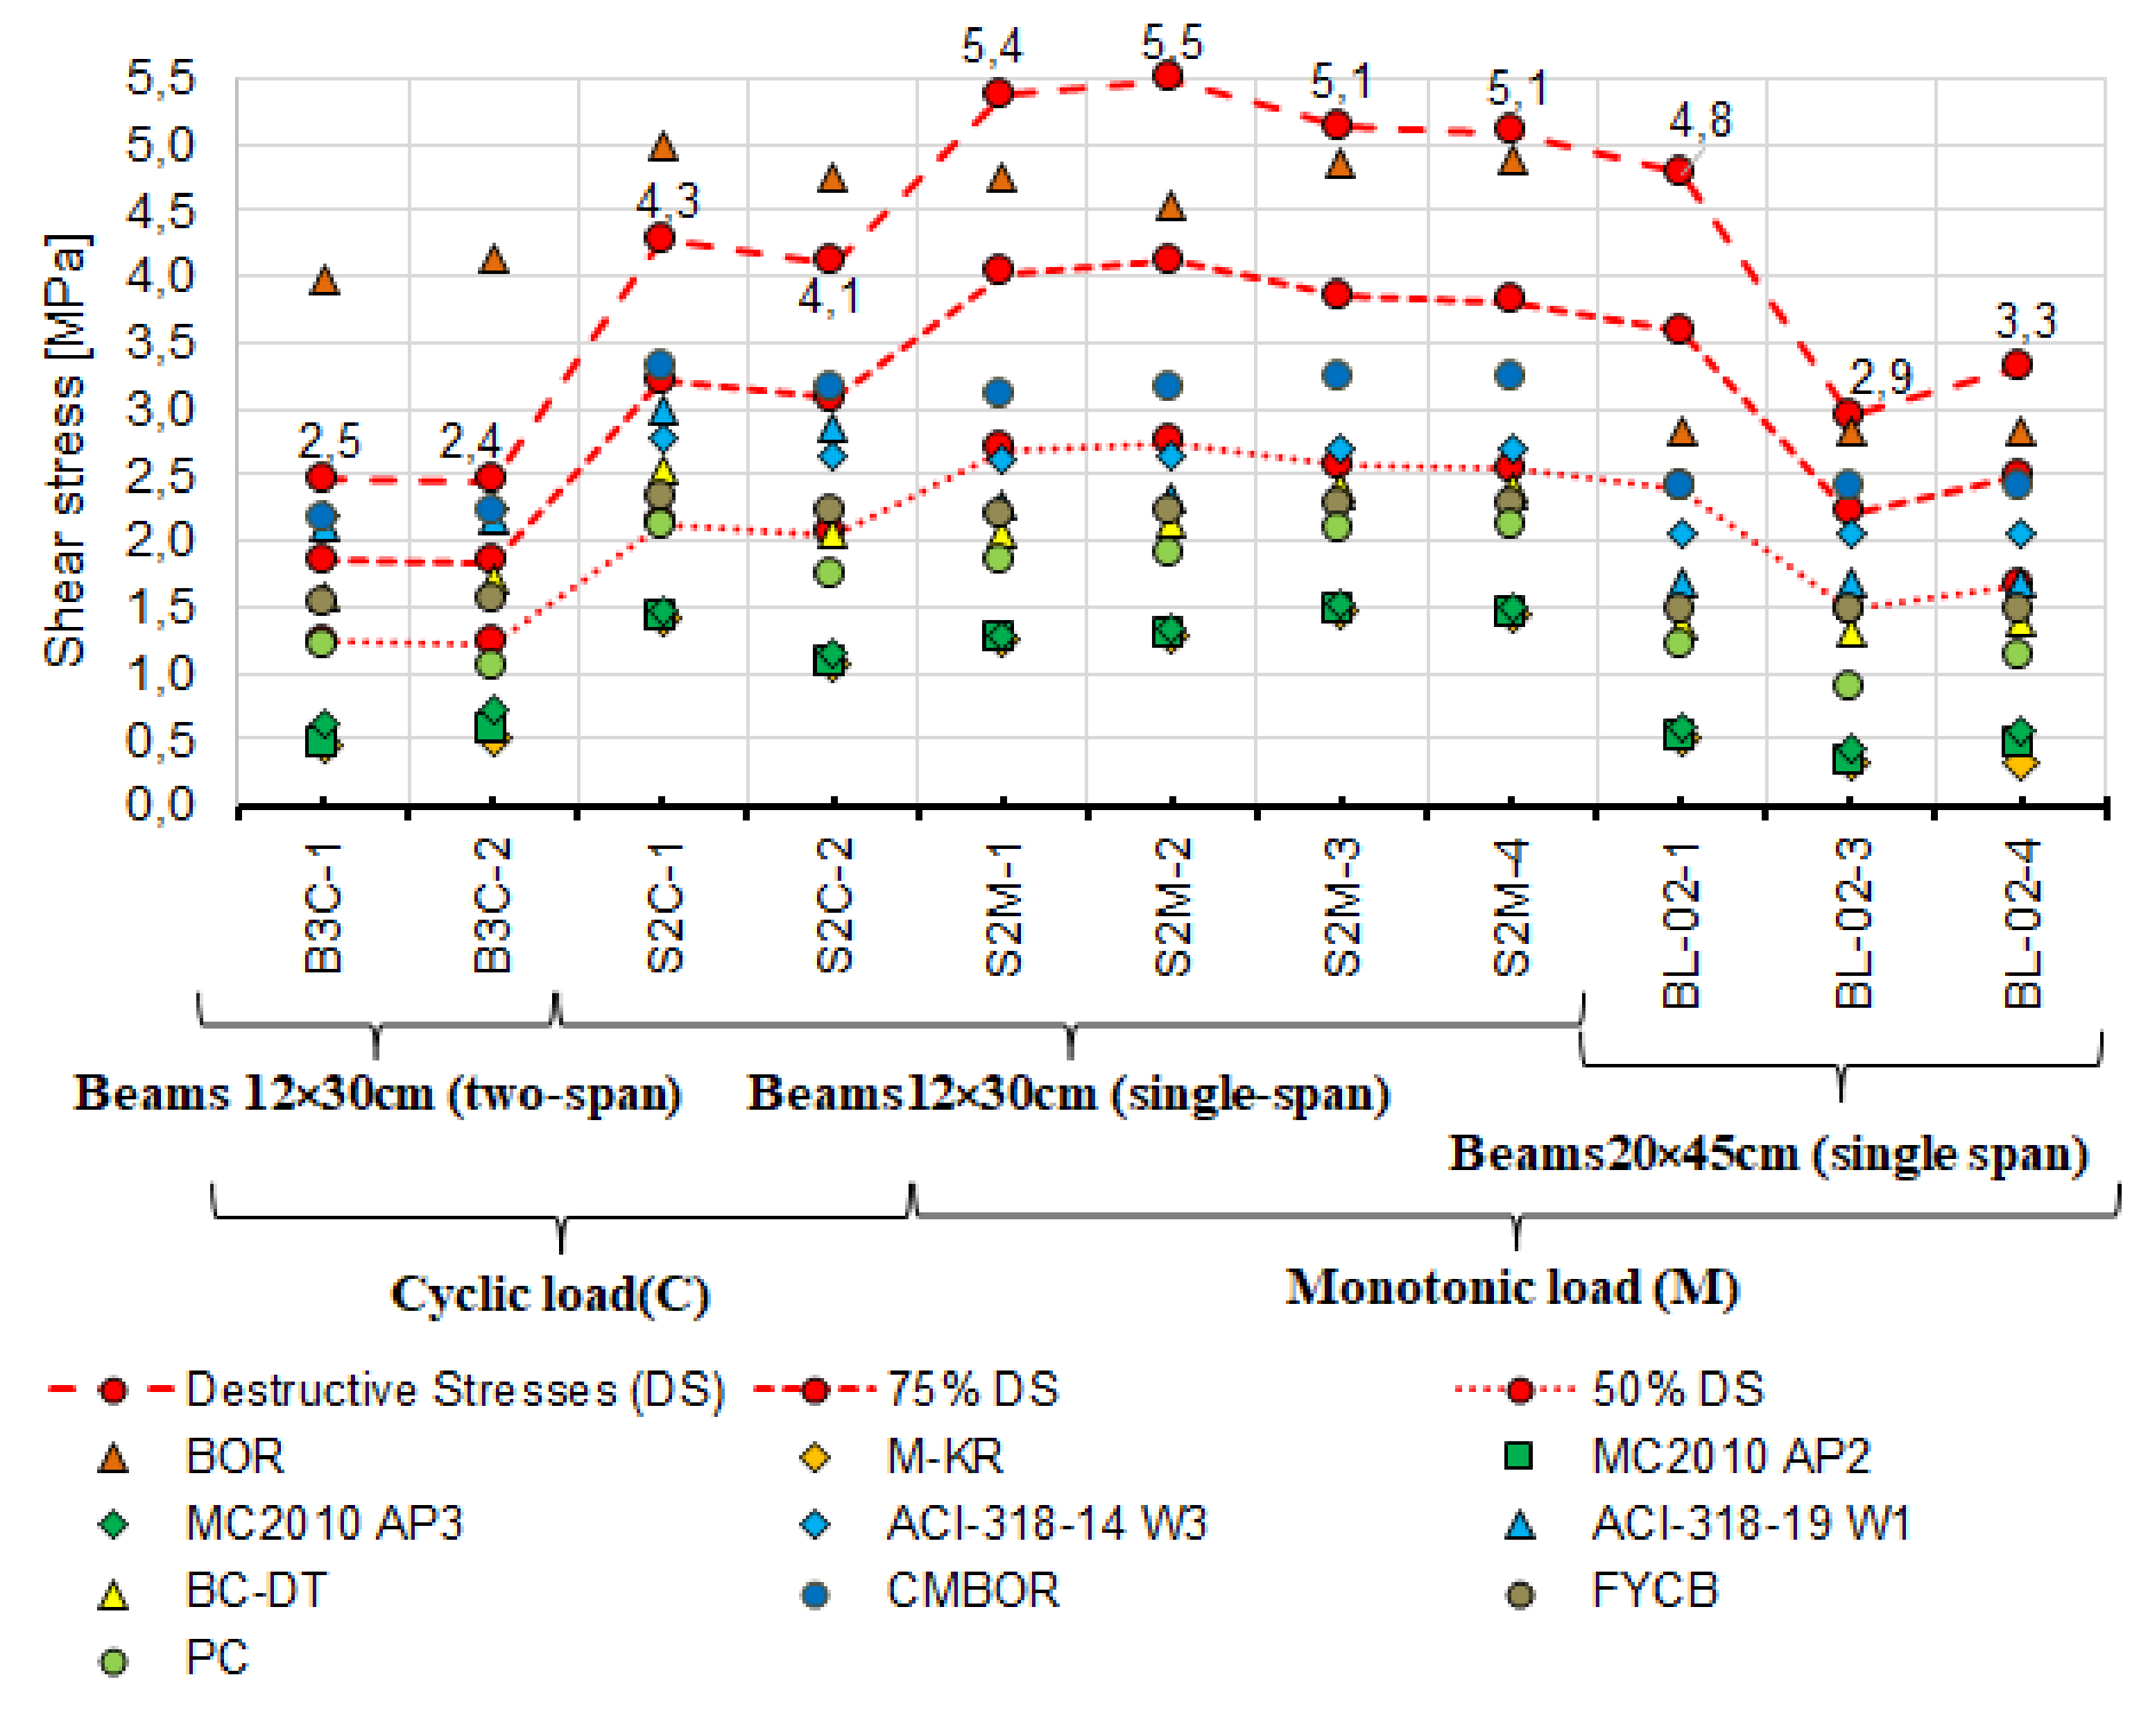
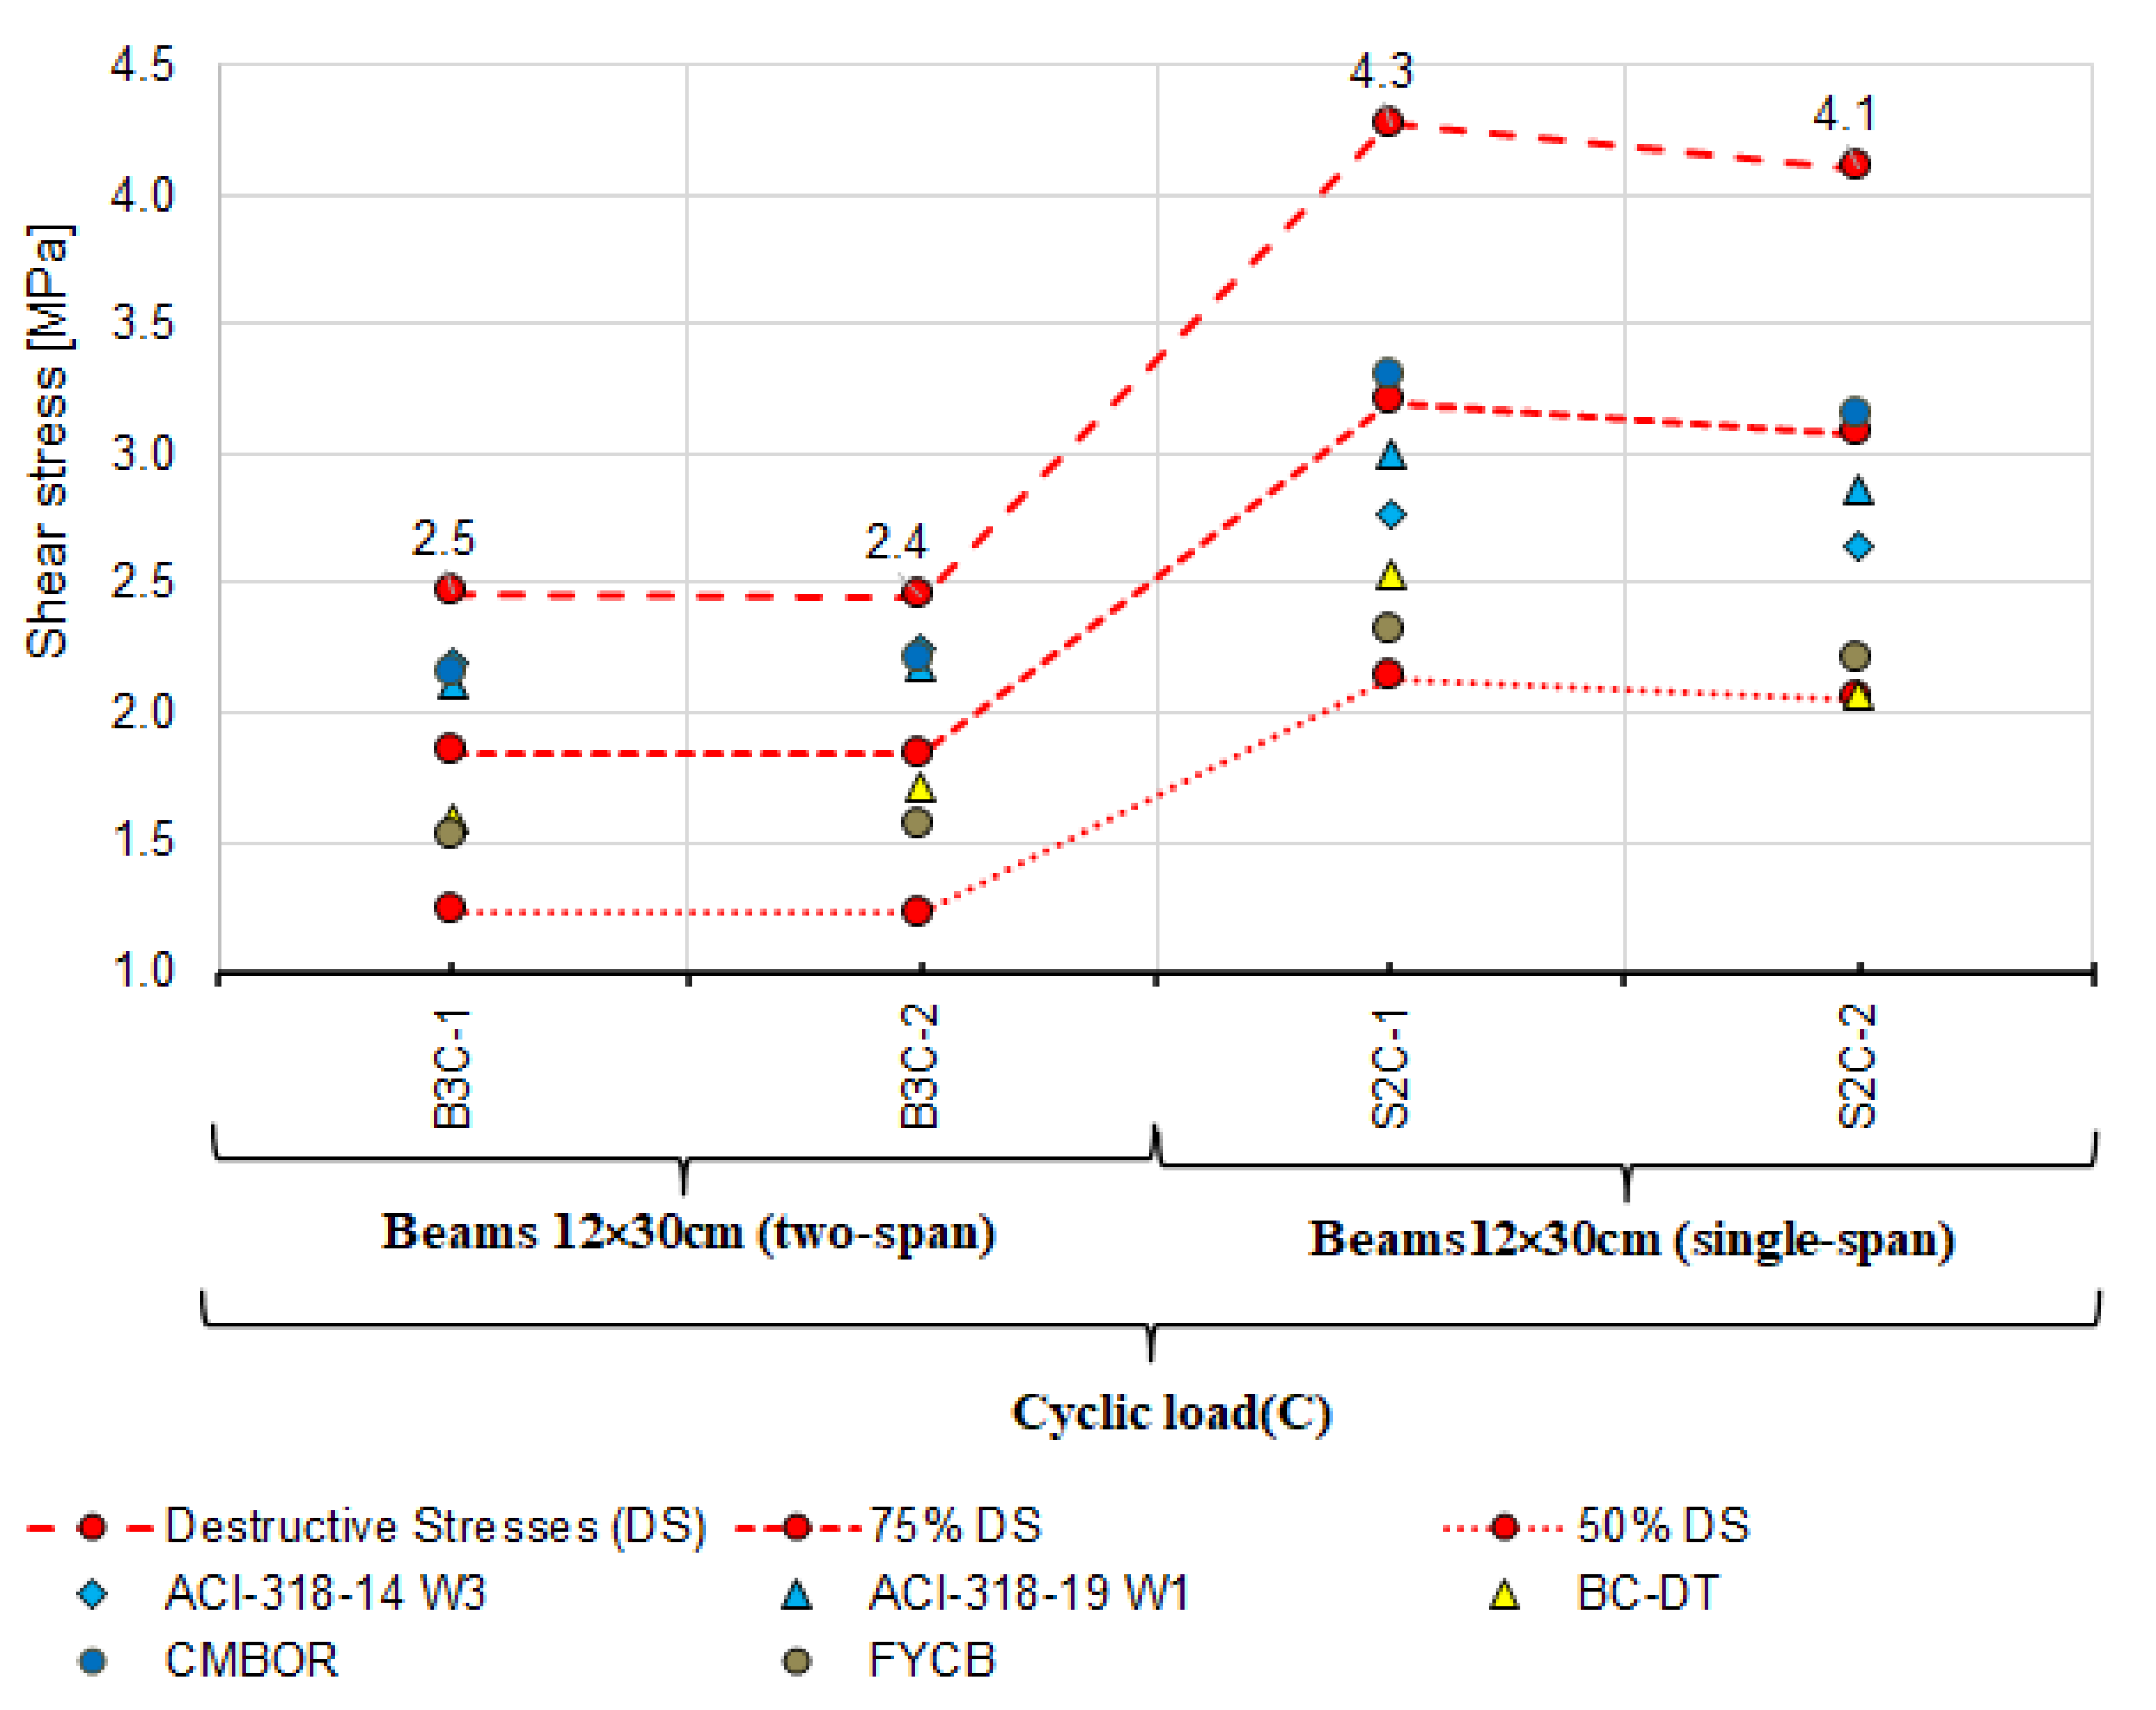
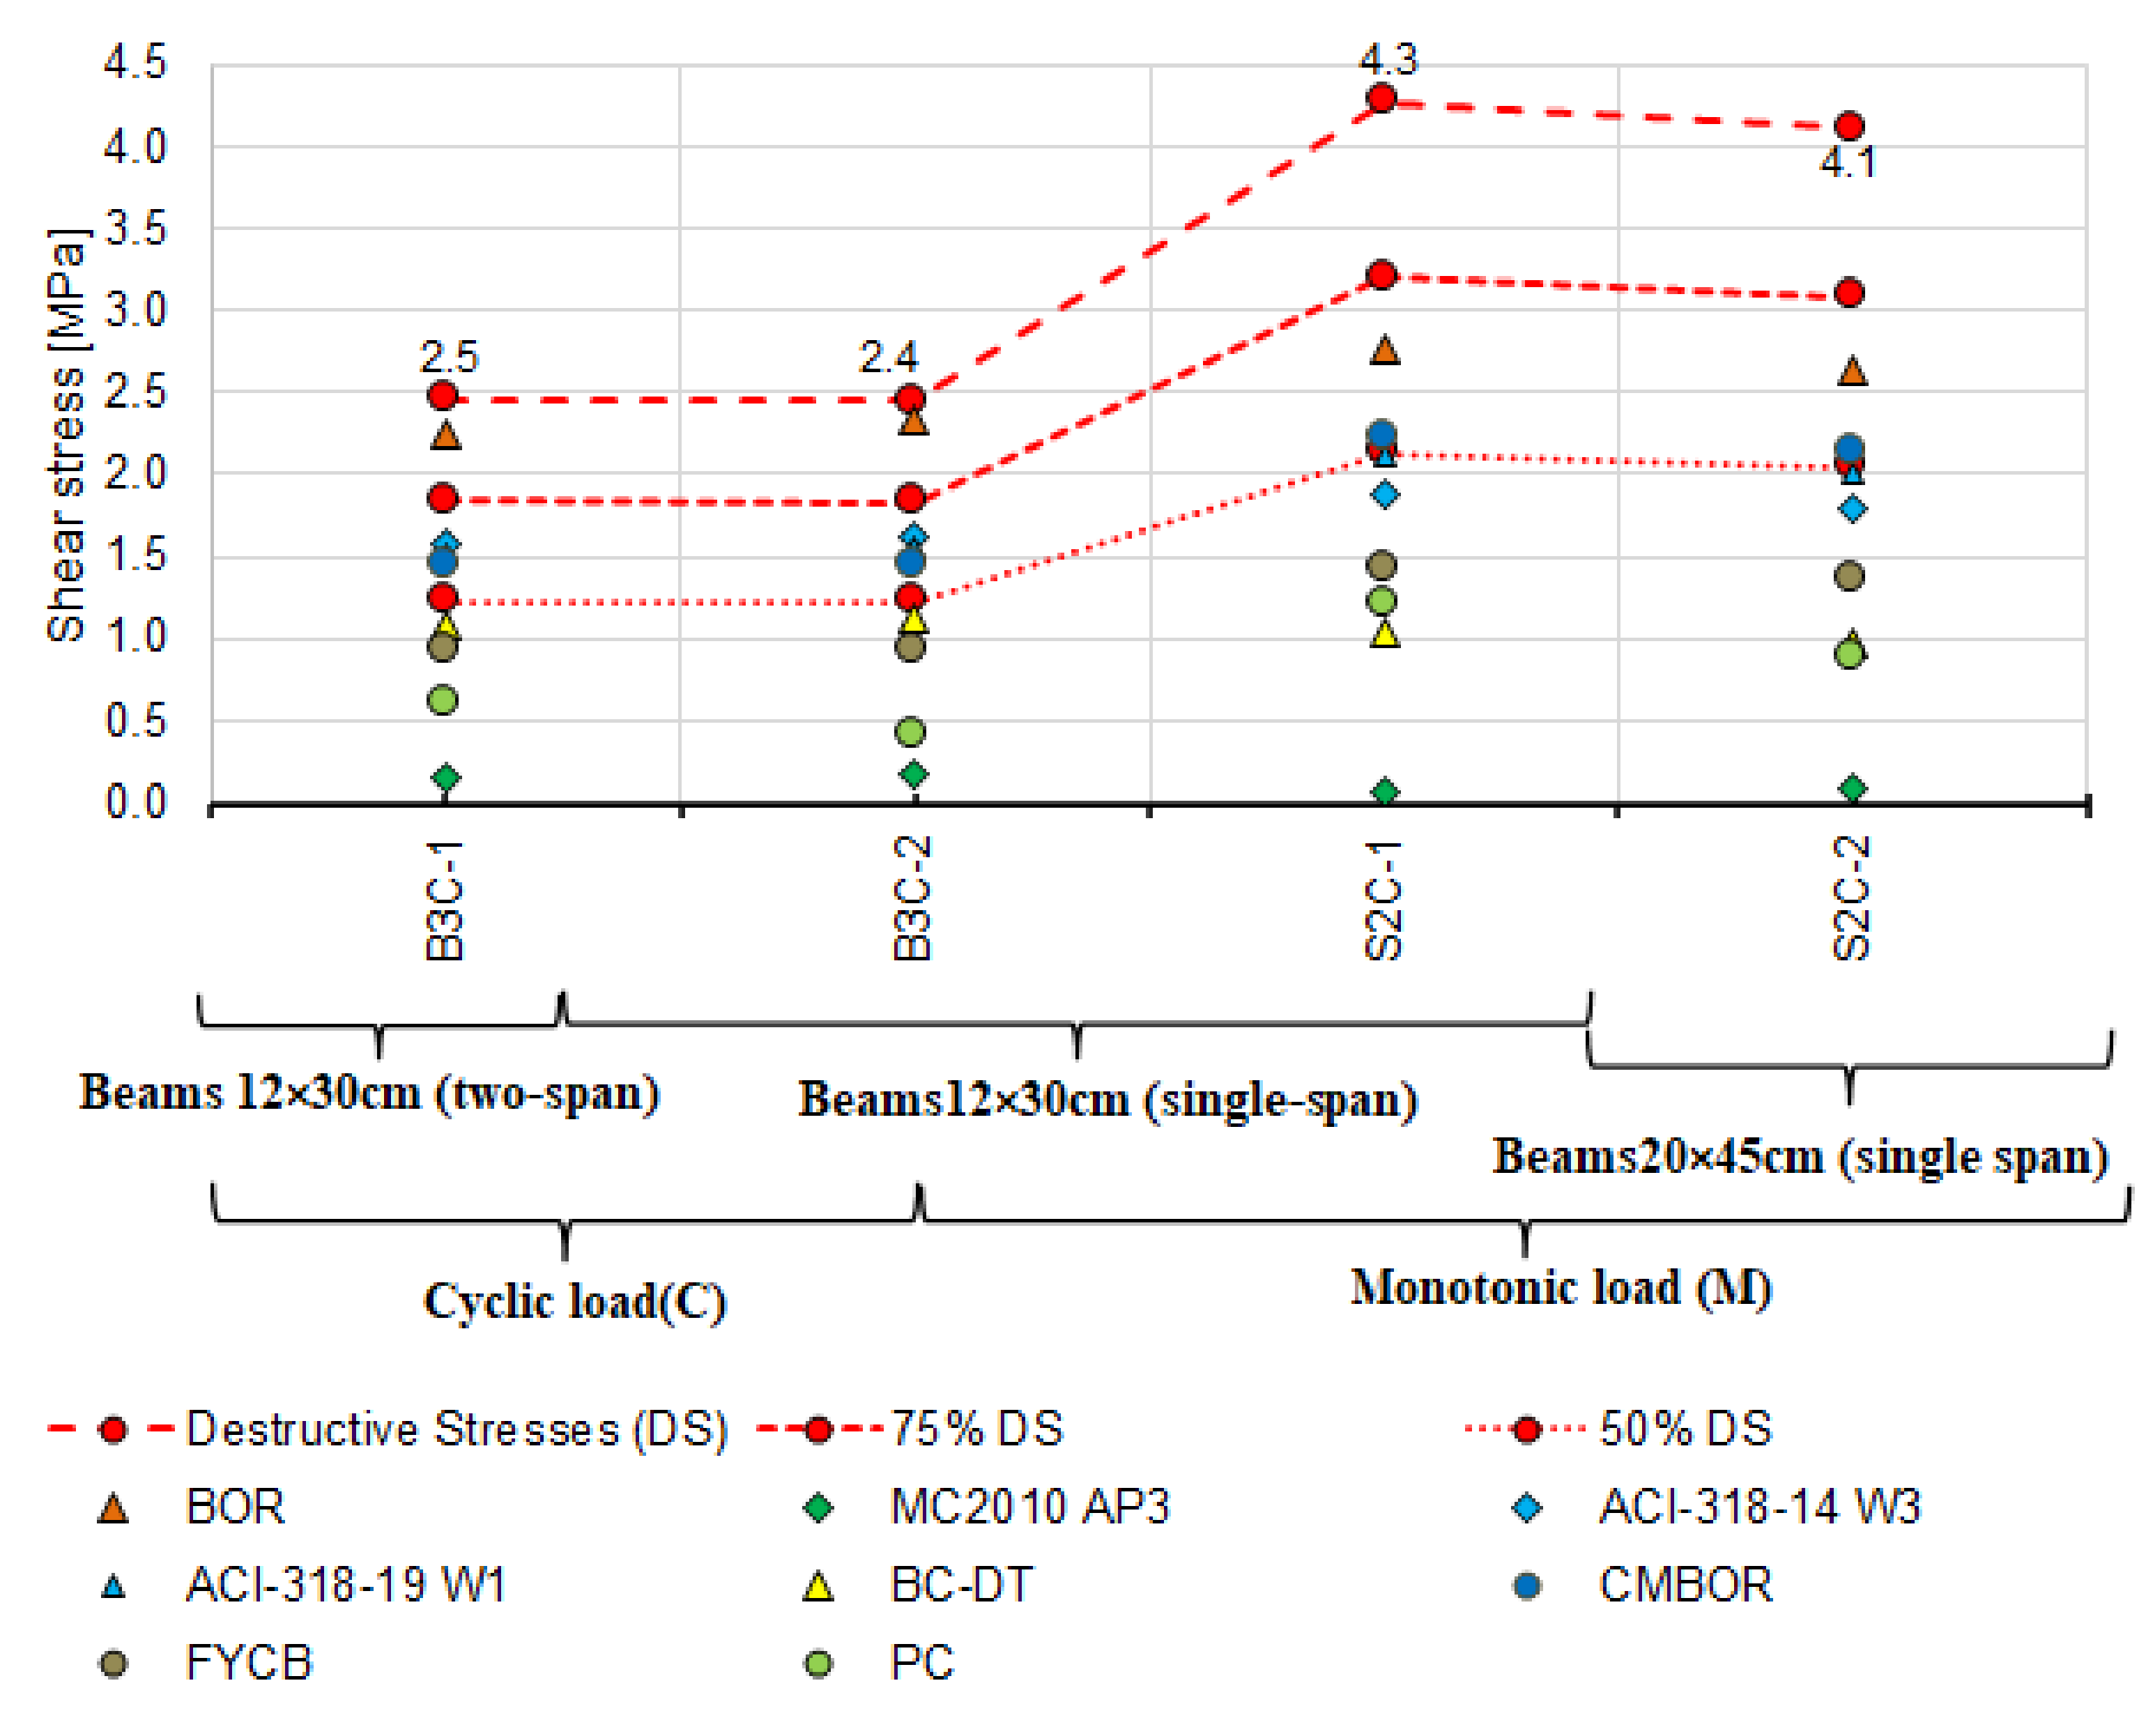
| Destructive Stresses (D.S.) | 2.5 | 2.4 | 4.3 | 4.1 | 5.4 | 5.5 | 5.1 | 5.1 | 4.8 | 2.9 | 3.3 |
| 75% D.S. | 1.8 | 1.8 | 3.2 | 3.1 | 4.0 | 4.1 | 3.8 | 3.8 | 3.6 | 2.2 | 2.5 |
| 50% D.S. | 1.2 | 1.2 | 2.1 | 2.1 | 2.7 | 2.7 | 2.6 | 2.5 | 2.4 | 1.5 | 1.7 |
| Mӧrsch truss analogy by Kupfer–Rüsch (PN-B-03264:2002) [16] | 3.3 | 3.4 | 3.6 | 3.5 | 3.4 | 3.4 | 3.5 | 3.5 | 2.7 | 2.7 | 2.7 |
| ACI-318-14 W4 [18] | 2.6 | 2.7 | 2.6 | 2.5 | 2.5 | 2.5 | 2.6 | 2.6 | 2.3 | 2.3 | 2.3 |
| Reineck [53] | 2.7 | 2.8 | 2.8 | 2.6 | 2.6 | 2.6 | 2.7 | 2.7 | 2.3 | 2.3 | 2.3 |
| Model | B3C-1 | B3C-2 | S2C-1 | S2C-2 | S2M-1 | S2M-2 | S2M-3 | S2M-4 | BL-02-1 | BL-02-3 | BL-02-4 |
|---|---|---|---|---|---|---|---|---|---|---|---|
| Destructive Stresses (D.S.) | 2.5 | 2.4 | 4.3 | 4.1 | 5.4 | 5.5 | 5.1 | 5.1 | 4.8 | 2.9 | 3.3 |
| 75% D.S. | 1.8 | 1.8 | 3.2 | 3.1 | 4.0 | 4.1 | 3.8 | 3.8 | 3.6 | 2.2 | 2.5 |
| 50% D.S. | 1.2 | 1.2 | 2.1 | 2.1 | 2.7 | 2.7 | 2.6 | 2.5 | 2.4 | 1.5 | 1.7 |
| Li, Hsu and Hwang [60] | 2.4 | 2.5 | 2.8 | 2.6 | 2.6 | 2.7 | 2.7 | 2.7 | 2.1 | 1.7 | 1.7 |
| Model | B3C-1 | B3C-2 | S2C-1 | S2C-2 | S2M-1 | S2M-2 | S2M-3 | S2M-4 | BL-02-1 | BL-02-3 | BL-02-4 |
|---|---|---|---|---|---|---|---|---|---|---|---|
| Destructive Stresses (D.S.) | 2.5 | 2.4 | 4.3 | 4.1 | 5.4 | 5.5 | 5.1 | 5.1 | 4.8 | 2.9 | 3.3 |
| 75% D.S. | 1.8 | 1.8 | 3.2 | 3.1 | 4.0 | 4.1 | 3.8 | 3.8 | 3.6 | 2.2 | 2.5 |
| 50% D.S. | 1.2 | 1.2 | 2.1 | 2.1 | 2.7 | 2.7 | 2.6 | 2.5 | 2.4 | 1.5 | 1.7 |
| Boriszański Failure Model (PN-B-03264:1984) [2,30] | 4.0 | 4.1 | 5.0 | 4.8 | 4.7 | 4.5 | 4.9 | 4.9 | 2.8 | 2.8 | 2.8 |
| Mӧrsch truss analogy by Kupfer–Rüsch (PN-EN-1992-1-1:2008) [14] | 0.5 | 0.5 | 1.4 | 1.1 | 1.2 | 1.3 | 1.5 | 1.5 | 0.5 | 0.3 | 0.3 |
| Generalized stress field approach (Model Code 2010 AP2) [3] | 0.5 | 0.6 | 1.4 | 1.1 | 1.2 | 1.3 | 1.5 | 1.5 | 0.5 | 0.3 | 0.5 |
| Simplified modified compression field theory (Model Code 2010 AP3) [3] | 0.6 | 0.7 | 1.5 | 1.1 | 1.3 | 1.3 | 1.5 | 1.5 | 0.6 | 0.4 | 0.6 |
| ACI-318-14 W3 [18] | 2.2 | 2.2 | 2.8 | 2.6 | 2.6 | 2.7 | 2.7 | 2.7 | 2.1 | 2.1 | 2.1 |
| ACI-318-19 W1 [4] | 2.1 | 2.2 | 3.0 | 2.9 | 2.3 | 2.3 | 2.3 | 2.4 | 1.7 | 1.7 | 1.7 |
| Bentz and Collins—detailed method [52] | 1.7 | 1.7 | 2.6 | 2.0 | 2.3 | 2.4 | 2.6 | 2.6 | 1.5 | 1.3 | 1.4 |
| Cladera, Mari, Bairan, Oller and Ribas [48] | 2.2 | 2.2 | 3.3 | 3.2 | 3.1 | 3.1 | 3.2 | 3.2 | 2.4 | 2.4 | 2.4 |
| Forsch, Yu, Cusatis and Bazant [57] | 1.5 | 1.6 | 2.3 | 2.2 | 2.2 | 2.2 | 2.3 | 2.3 | 1.5 | 1.5 | 1.5 |
| Hong-Gun Park, Kyoung-Kyu Choi [54] | 1.2 | 1.0 | 2.1 | 1.7 | 1.8 | 1.9 | 2.1 | 2.1 | 1.2 | 0.9 | 1.1 |
| Model | B3C-1 | B3C-2 | S2C-1 | S2C-2 | S2M-1 | S2M-2 | S2M-3 | S2M-4 | BL-02-1 | BL-02-3 | BL-02-4 |
|---|---|---|---|---|---|---|---|---|---|---|---|
| Destructive Stresses (D.S.) | 2.5 | 2.4 | 4.3 | 4.1 | 5.4 | 5.5 | 5.1 | 5.1 | 4.8 | 2.9 | 3.3 |
| 75% D.S. | 1.8 | 1.8 | 3.2 | 3.1 | 4.0 | 4.1 | 3.8 | 3.8 | 3.6 | 2.2 | 2.5 |
| 50% D.S. | 1.2 | 1.2 | 2.1 | 2.1 | 2.7 | 2.7 | 2.6 | 2.5 | 2.4 | 1.5 | 1.7 |
| Boriszański Failure Model [2,30] | 2.3 | 2.3 | 2.8 | 2.6 | 2.6 | 2.5 | 2.7 | 2.7 | 1.6 | 1.6 | 1.6 |
| Simplified modified compression field theory (* Model Code 2010 AP3) [3] | 0.16 | 0.18 | 0.07 | 0.08 | 0.05 | 0.04 | 0.04 | 0.04 | 0.08 | 0.12 | 0.10 |
| ACI-318-14 W3 [18] | 1.6 | 1.6 | 1.9 | 1.8 | 1.8 | 1.8 | 1.8 | 1.8 | 1.7 | 1.7 | 1.7 |
| ACI-318-19 W1 [4] | 1.5 | 1.6 | 2.1 | 2.0 | 1.4 | 1.5 | 1.5 | 1.5 | 1.3 | 1.3 | 1.3 |
| Bentz and Collins—detailed method [52] | 1.1 | 1.1 | 1.1 | 0.9 | 1.0 | 1.1 | 1.1 | 1.1 | 1.0 | 1.0 | 1.0 |
| Cladera, Mari, Bairan, Oller and Ribas [48] | 1.4 | 1.5 | 2.2 | 2.1 | 2.1 | 2.1 | 2.2 | 2.2 | 2.0 | 2.0 | 2.0 |
| Forsch, Yu, Cusatis and Bazant [57] | 0.9 | 0.9 | 1.4 | 1.4 | 1.3 | 1.4 | 1.4 | 1.4 | 1.1 | 1.1 | 1.1 |
| Hong-Gun Park, Kyoung-Kyu Choi [54] | 0.6 | 0.4 | 1.2 | 0.9 | 1.0 | 1.0 | 1.2 | 1.2 | 0.8 | 0.5 | 0.8 |
Publisher’s Note: MDPI stays neutral with regard to jurisdictional claims in published maps and institutional affiliations. |
© 2021 by the authors. Licensee MDPI, Basel, Switzerland. This article is an open access article distributed under the terms and conditions of the Creative Commons Attribution (CC BY) license (https://creativecommons.org/licenses/by/4.0/).
Share and Cite
Bacharz, K.; Goszczyńska, B. Shear Capacity of Reinforced Concrete Beams under Monotonic and Cyclic Loads: Experiments and Computational Models. Materials 2021, 14, 4092. https://doi.org/10.3390/ma14154092
Bacharz K, Goszczyńska B. Shear Capacity of Reinforced Concrete Beams under Monotonic and Cyclic Loads: Experiments and Computational Models. Materials. 2021; 14(15):4092. https://doi.org/10.3390/ma14154092
Chicago/Turabian StyleBacharz, Kamil, and Barbara Goszczyńska. 2021. "Shear Capacity of Reinforced Concrete Beams under Monotonic and Cyclic Loads: Experiments and Computational Models" Materials 14, no. 15: 4092. https://doi.org/10.3390/ma14154092