
A Study on the Detection of Internal Defect Types for Duct Depth of Prestressed Concrete Structures Using Electromagnetic and Elastic Waves


Abstract
:1. Introduction
2. Materials and Methods
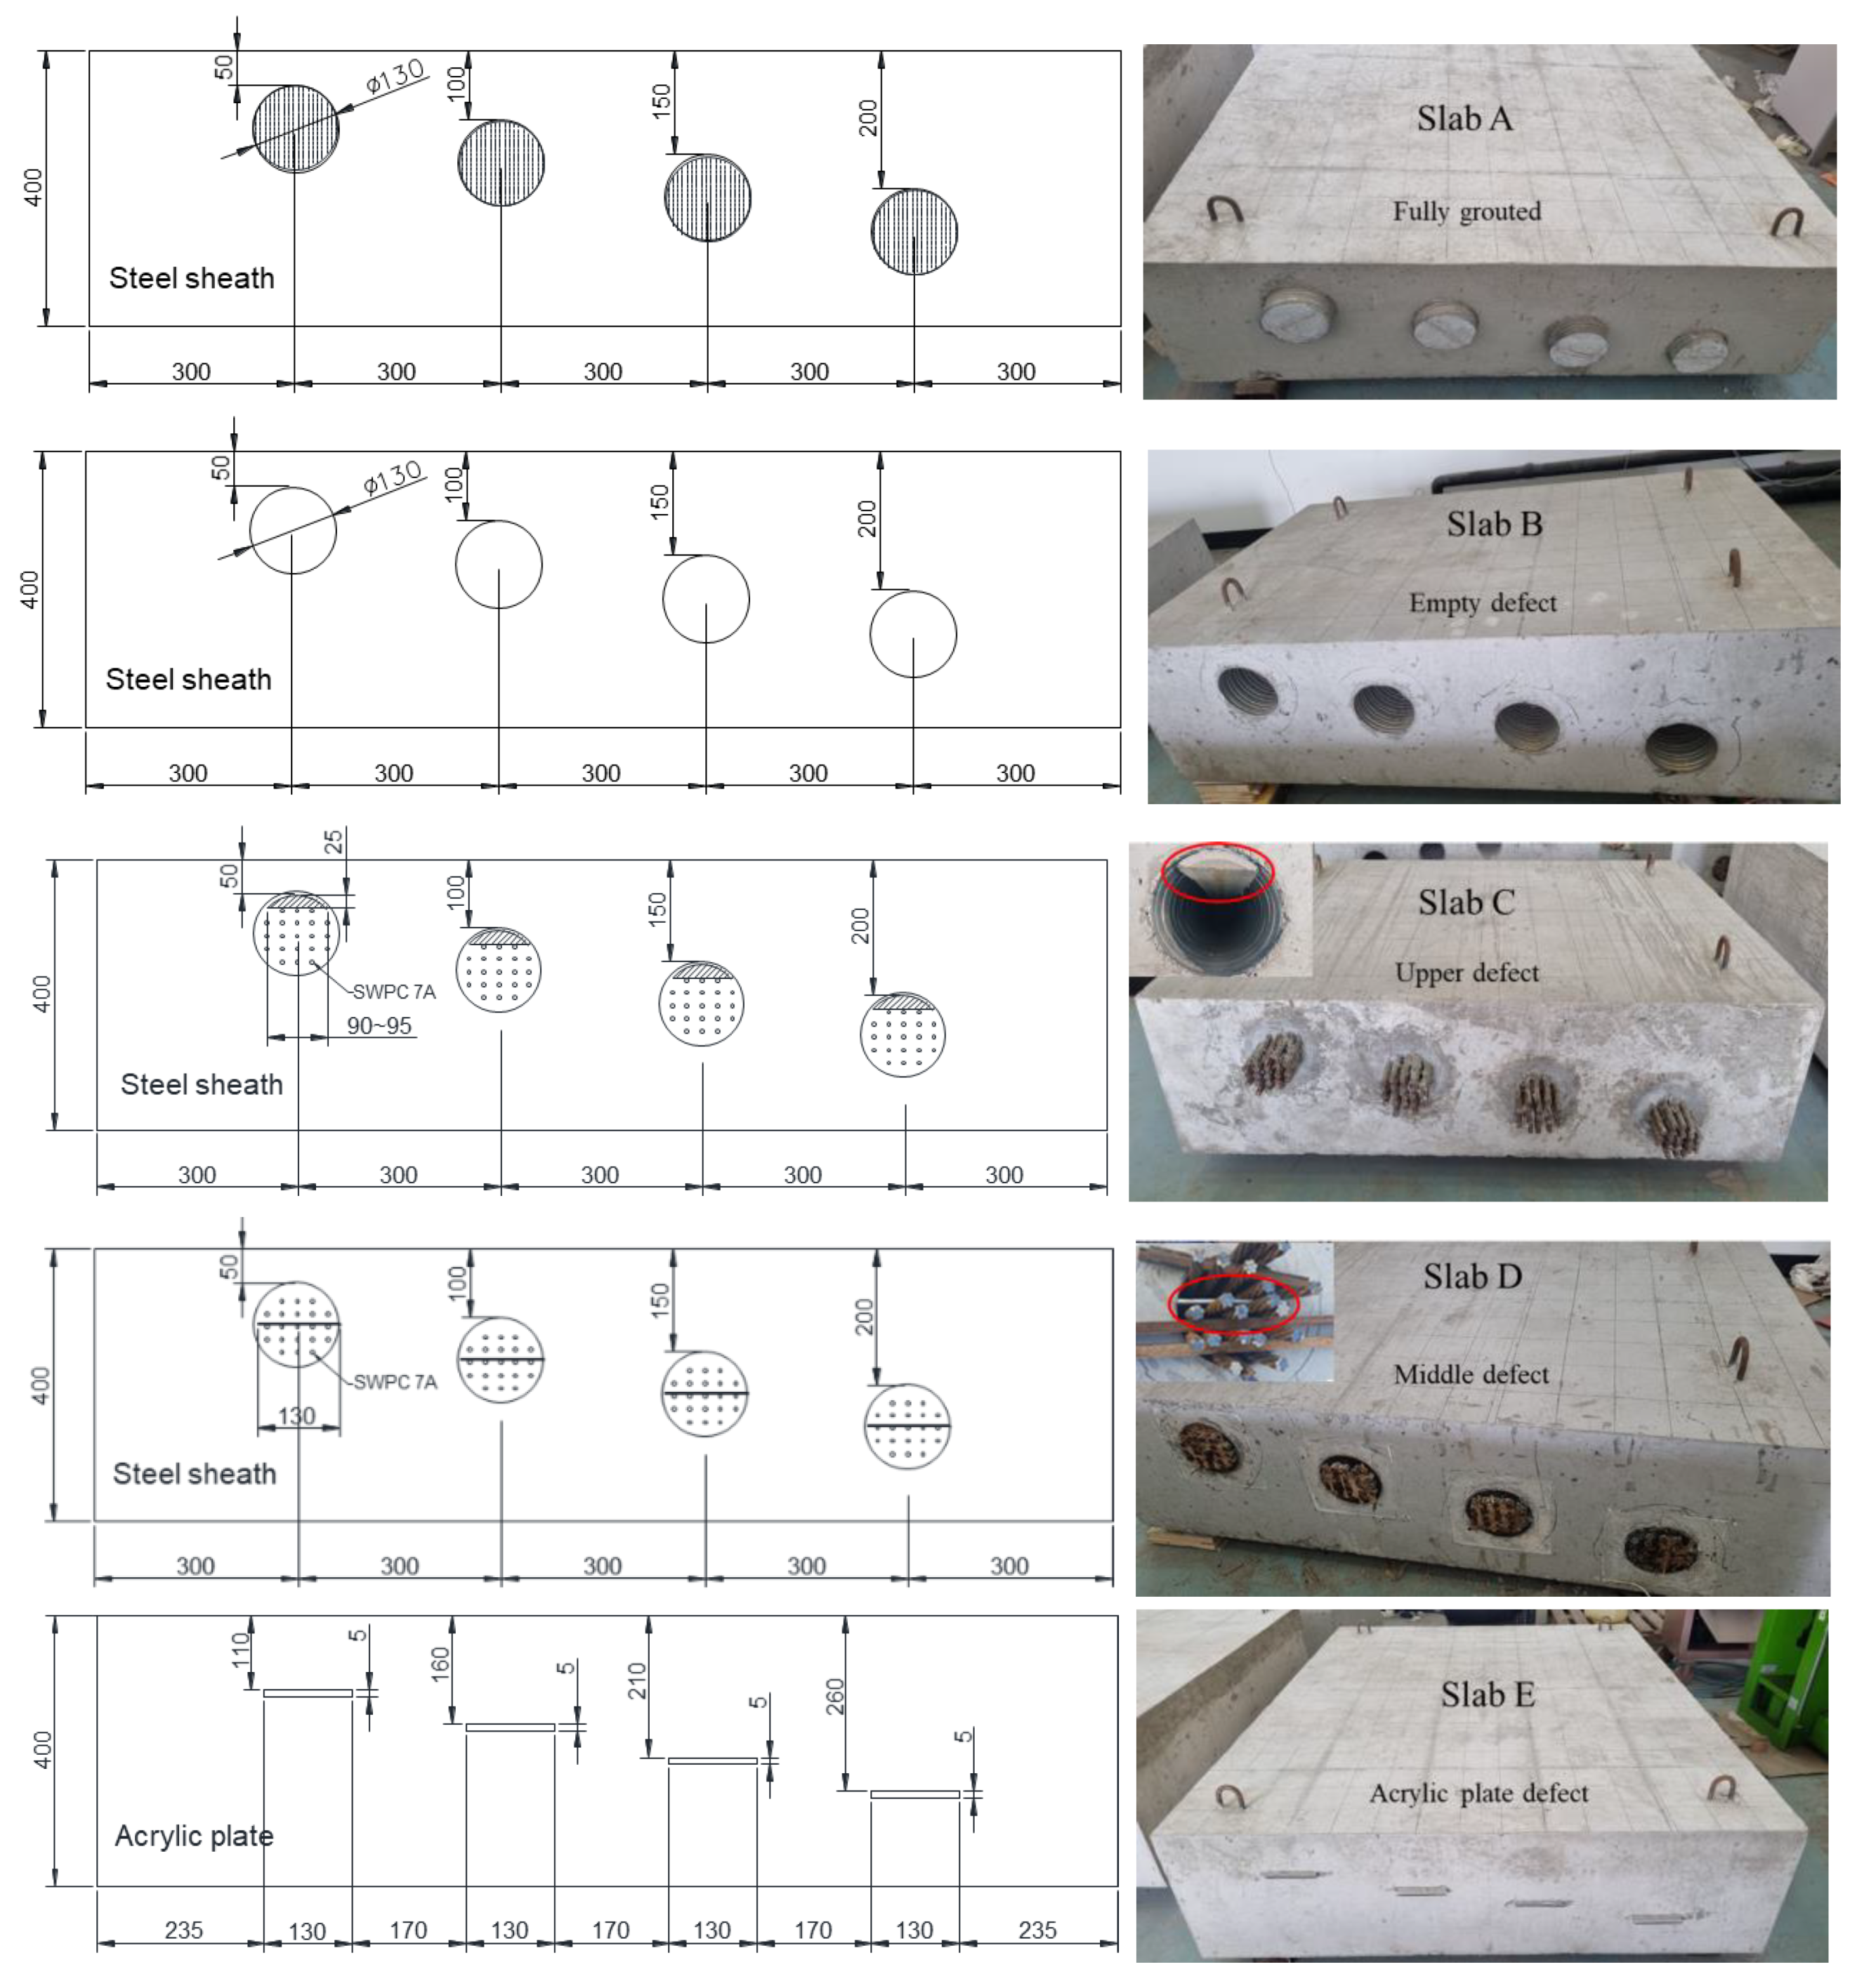
2.1. Materials and Preparation of Specimens
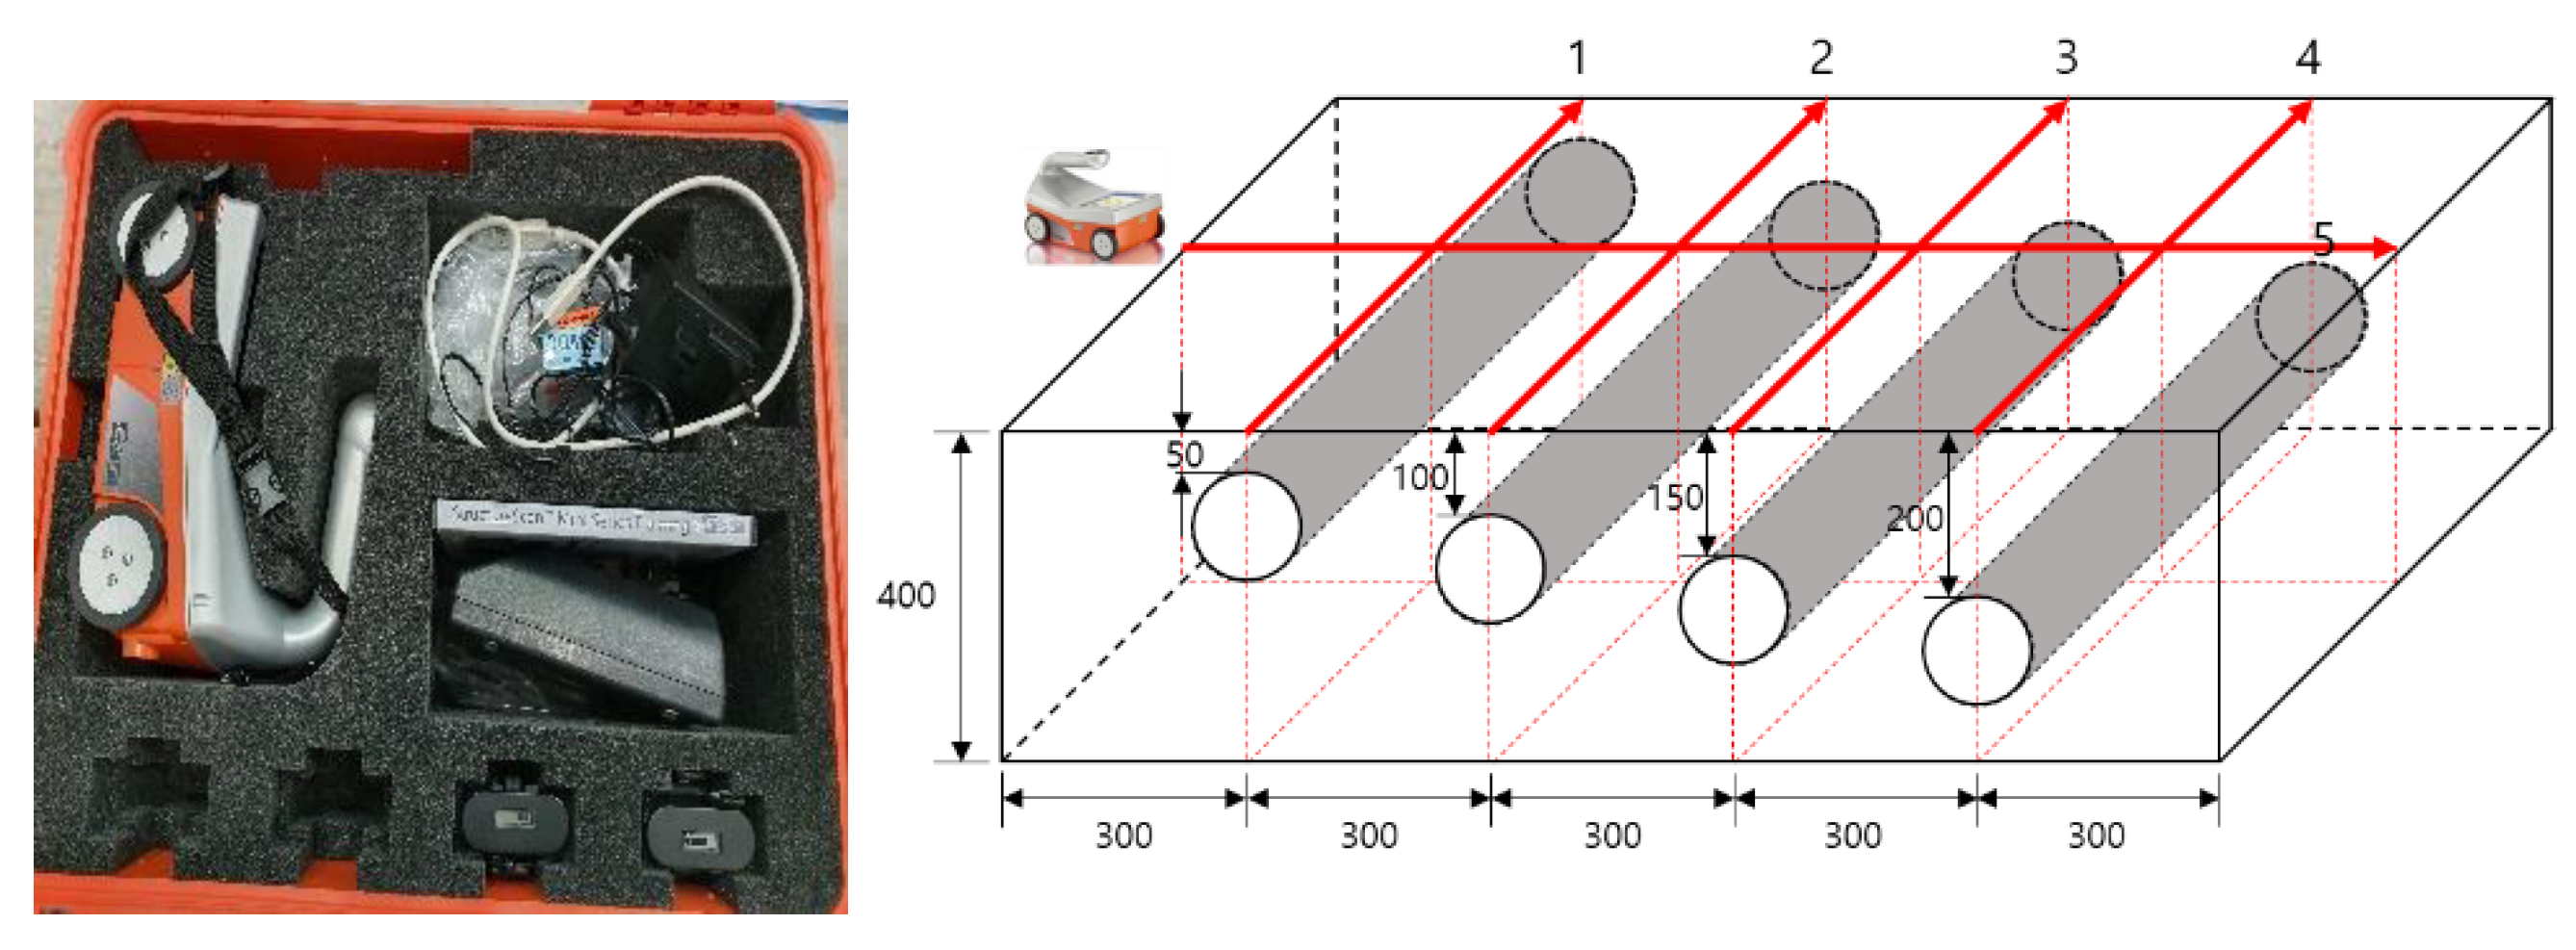
2.2. Electromagnetic Wave Measurement with RC Radar
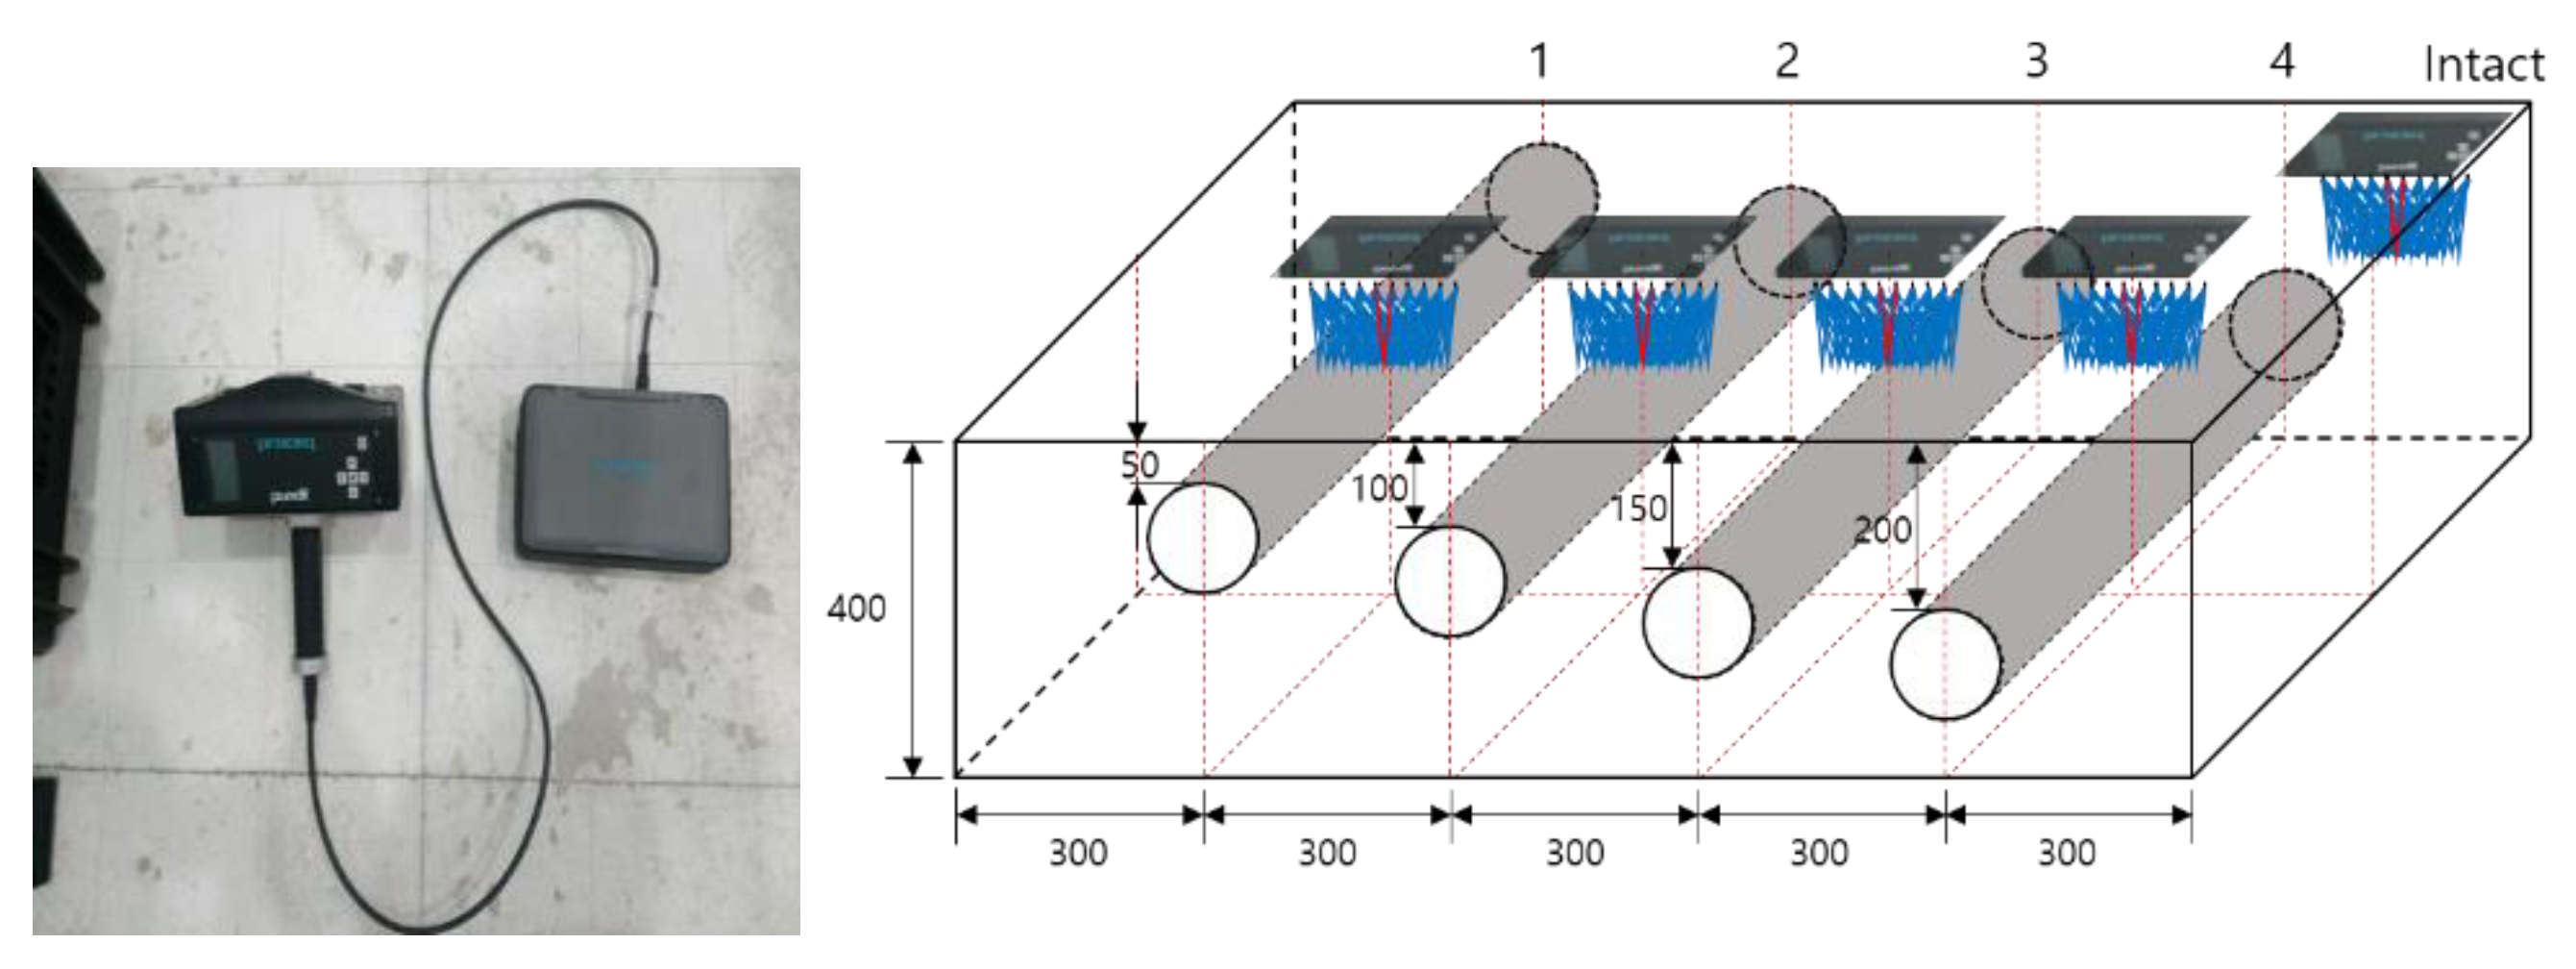
2.3. S Wave Measurement with Pundit 250 Array
2.4. Elastic Wave Measurement with IE and MASW
3. Feature Extraction Methods
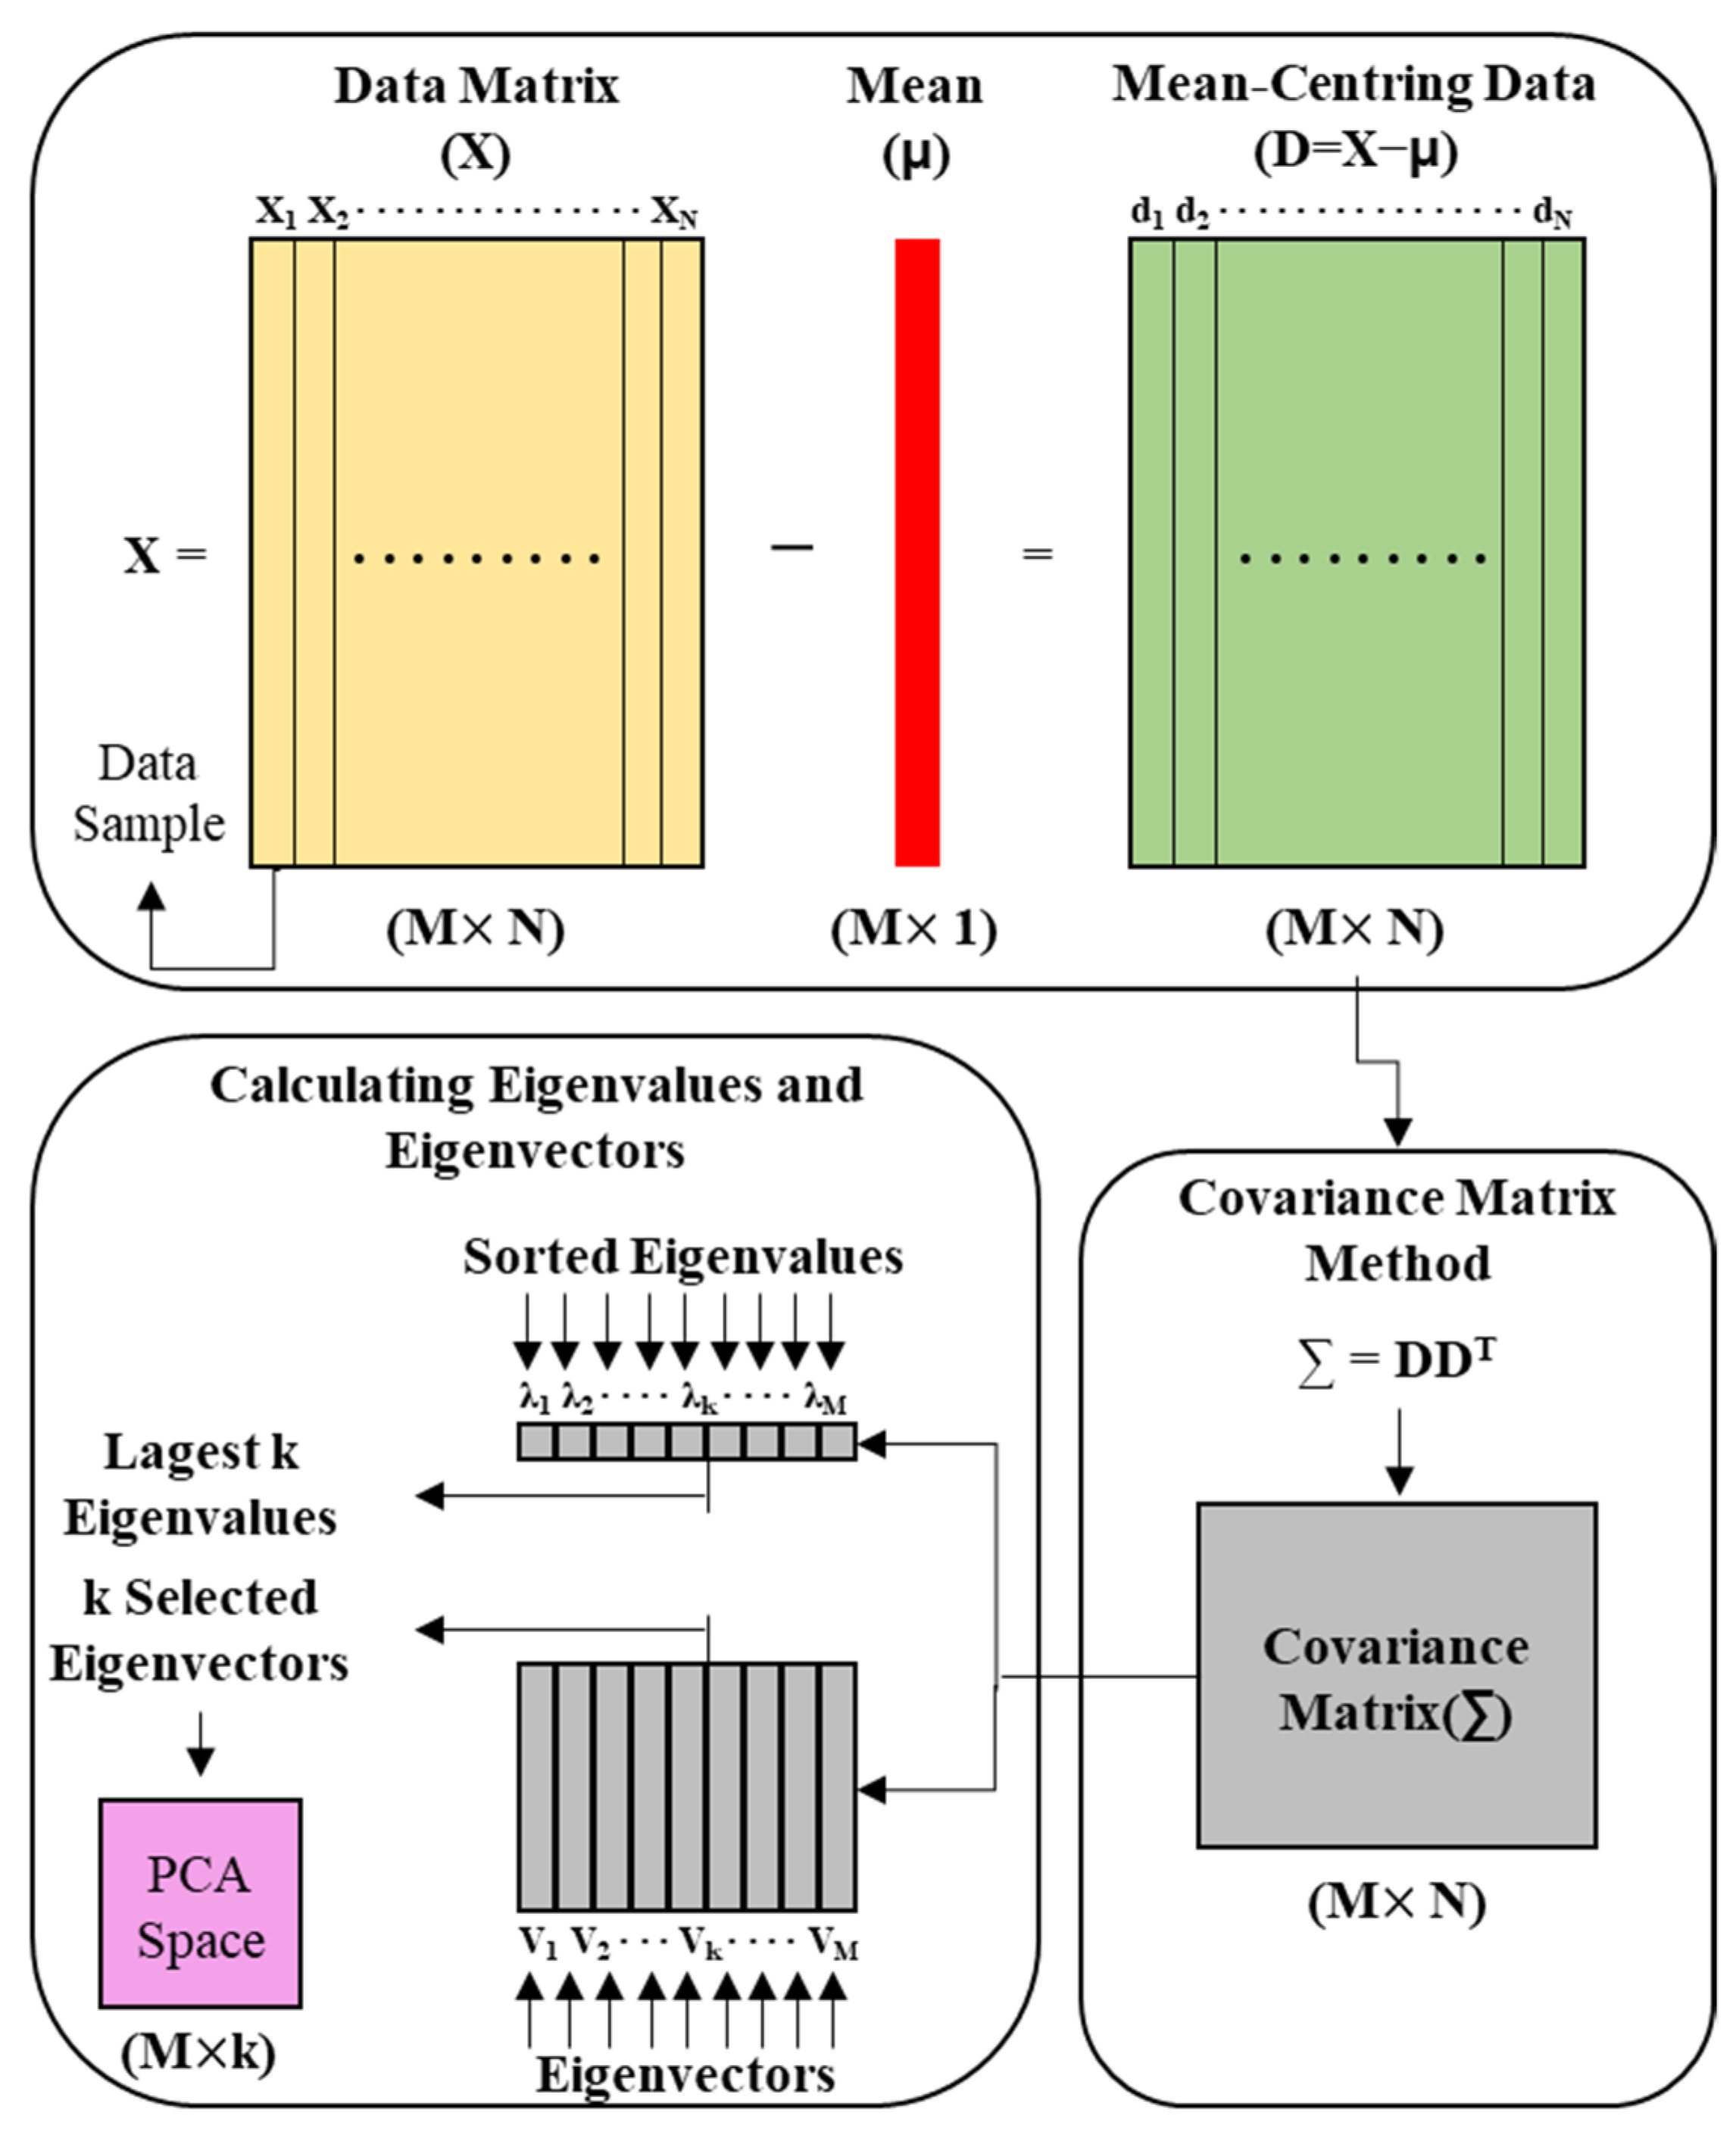
Principal Component Analysis
4. Results and Discussion
4.1. Experimental Result for RC Radar
4.2. Experimental Result for Pundit 250 Array
4.3. Experimental Result for MASW
4.4. Experimental Result for IE
4.5. Analysis of Defect Types with PCA
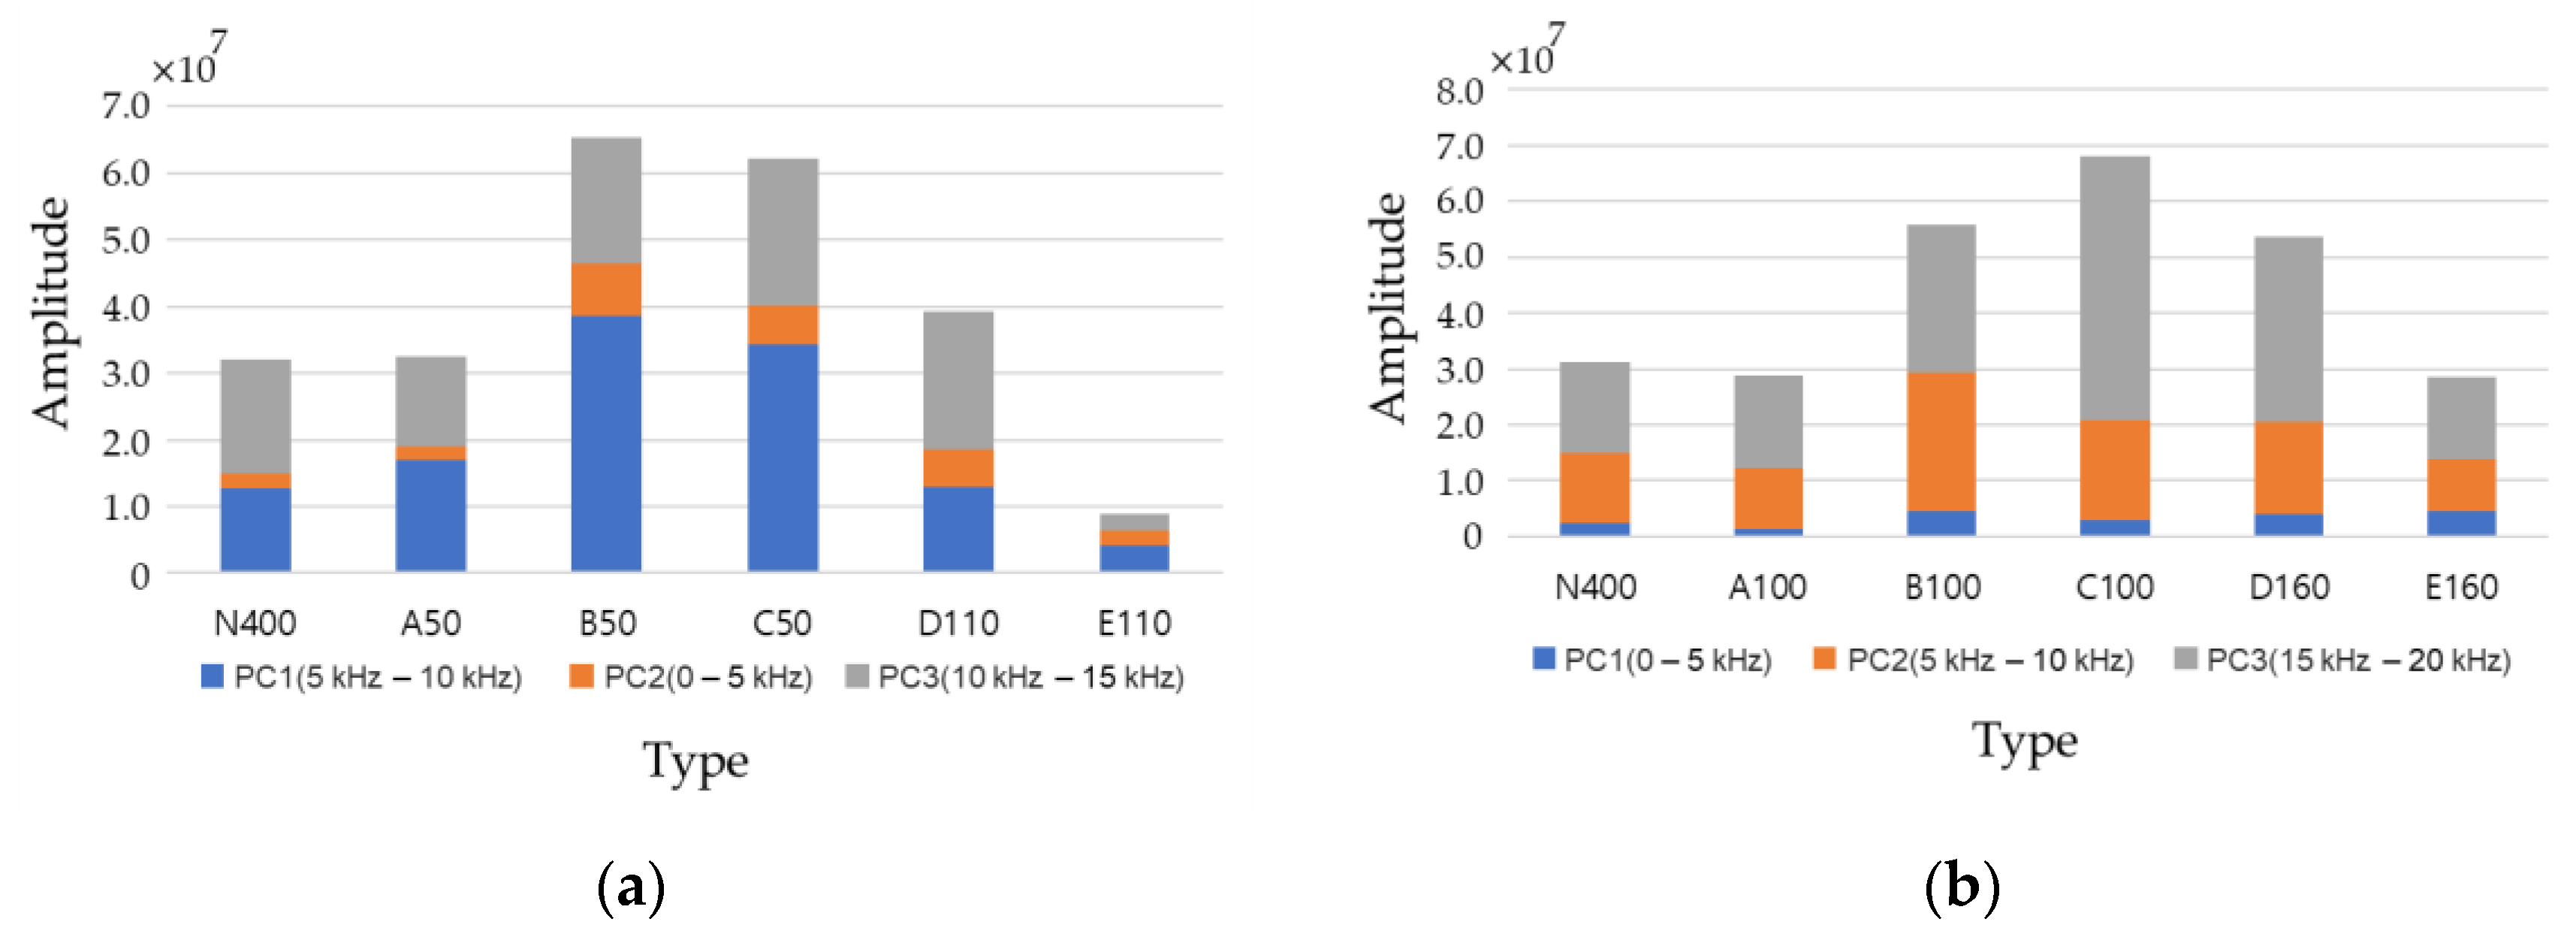
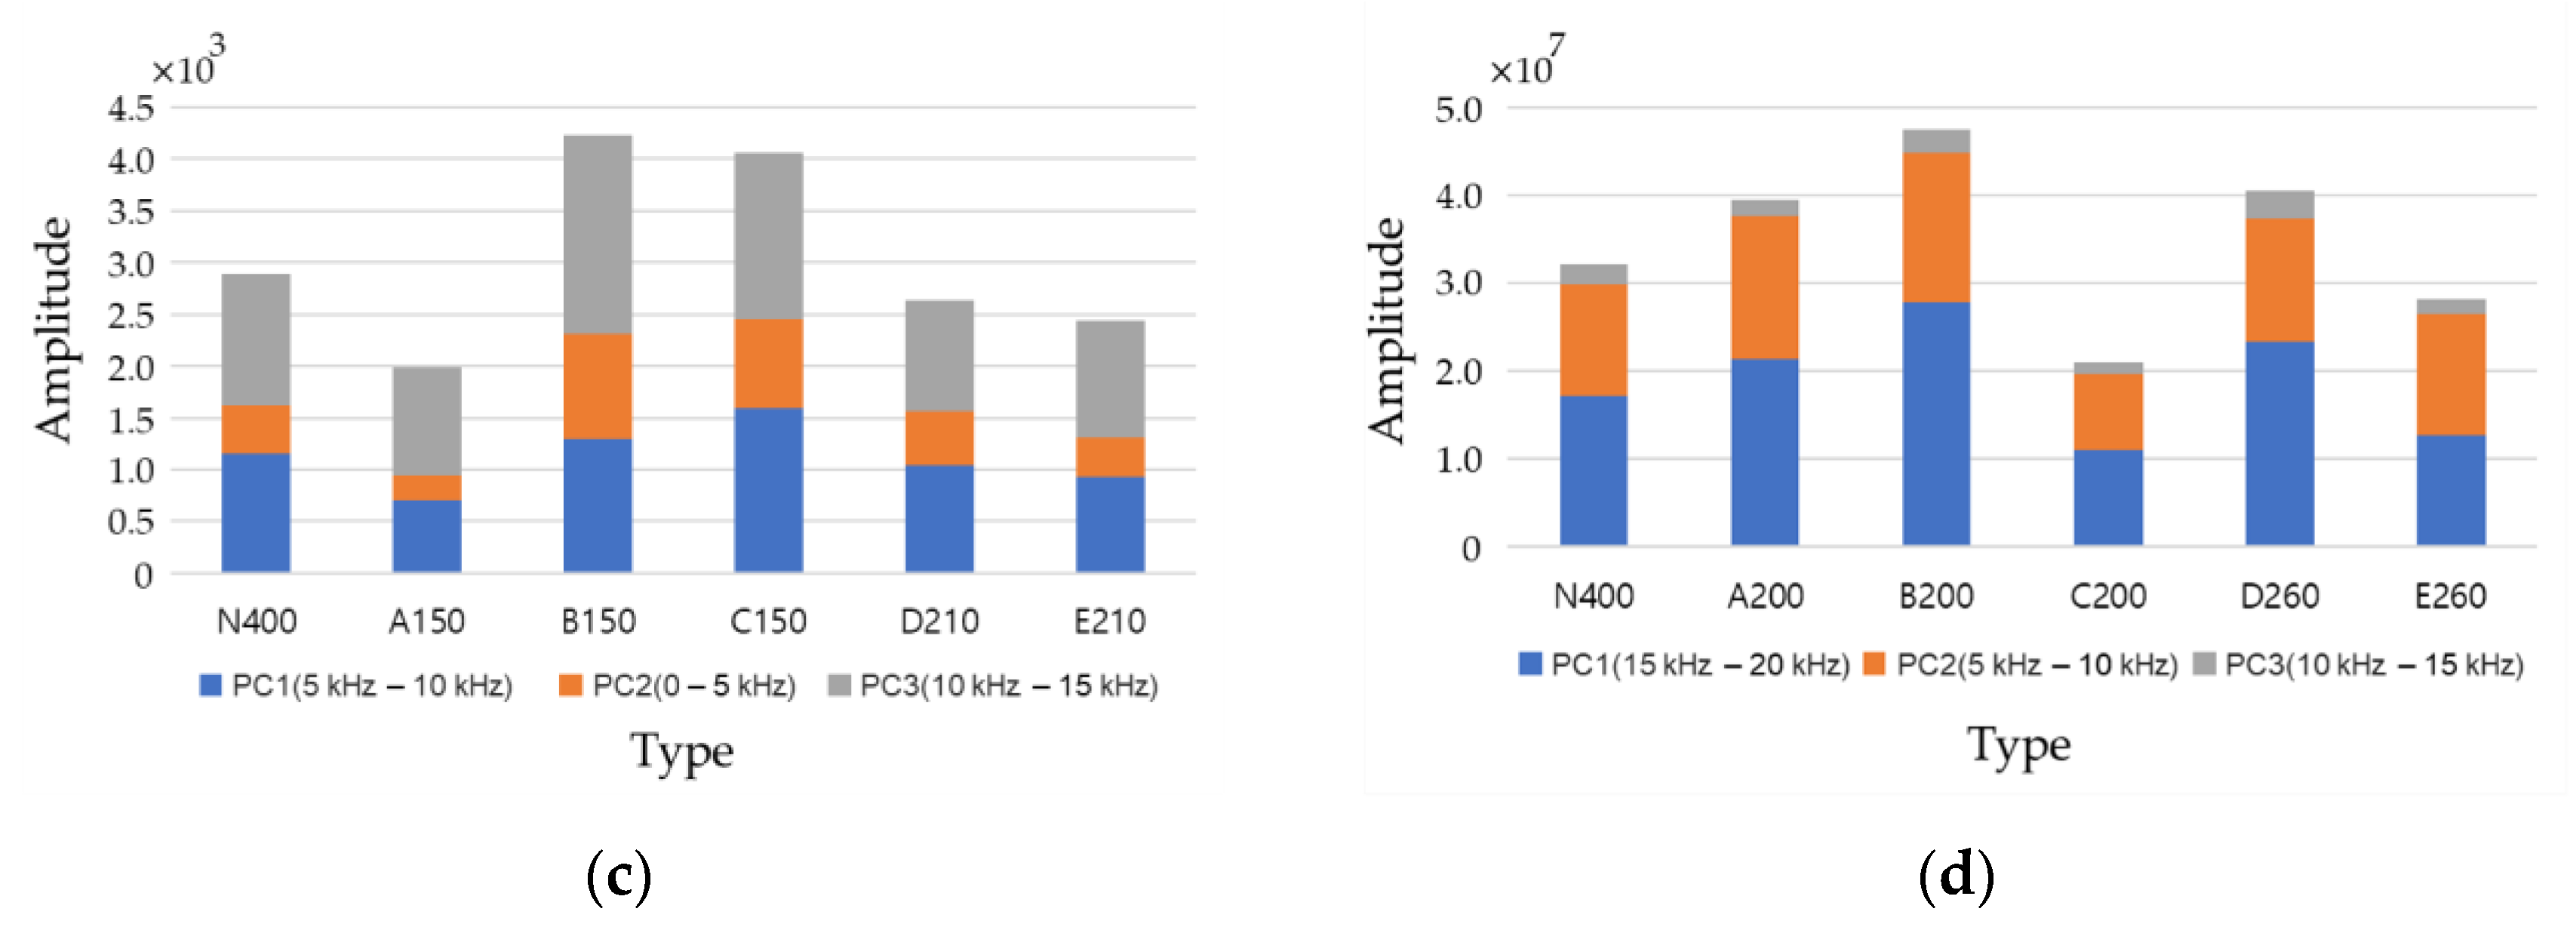
4.5.1. Feature Extraction
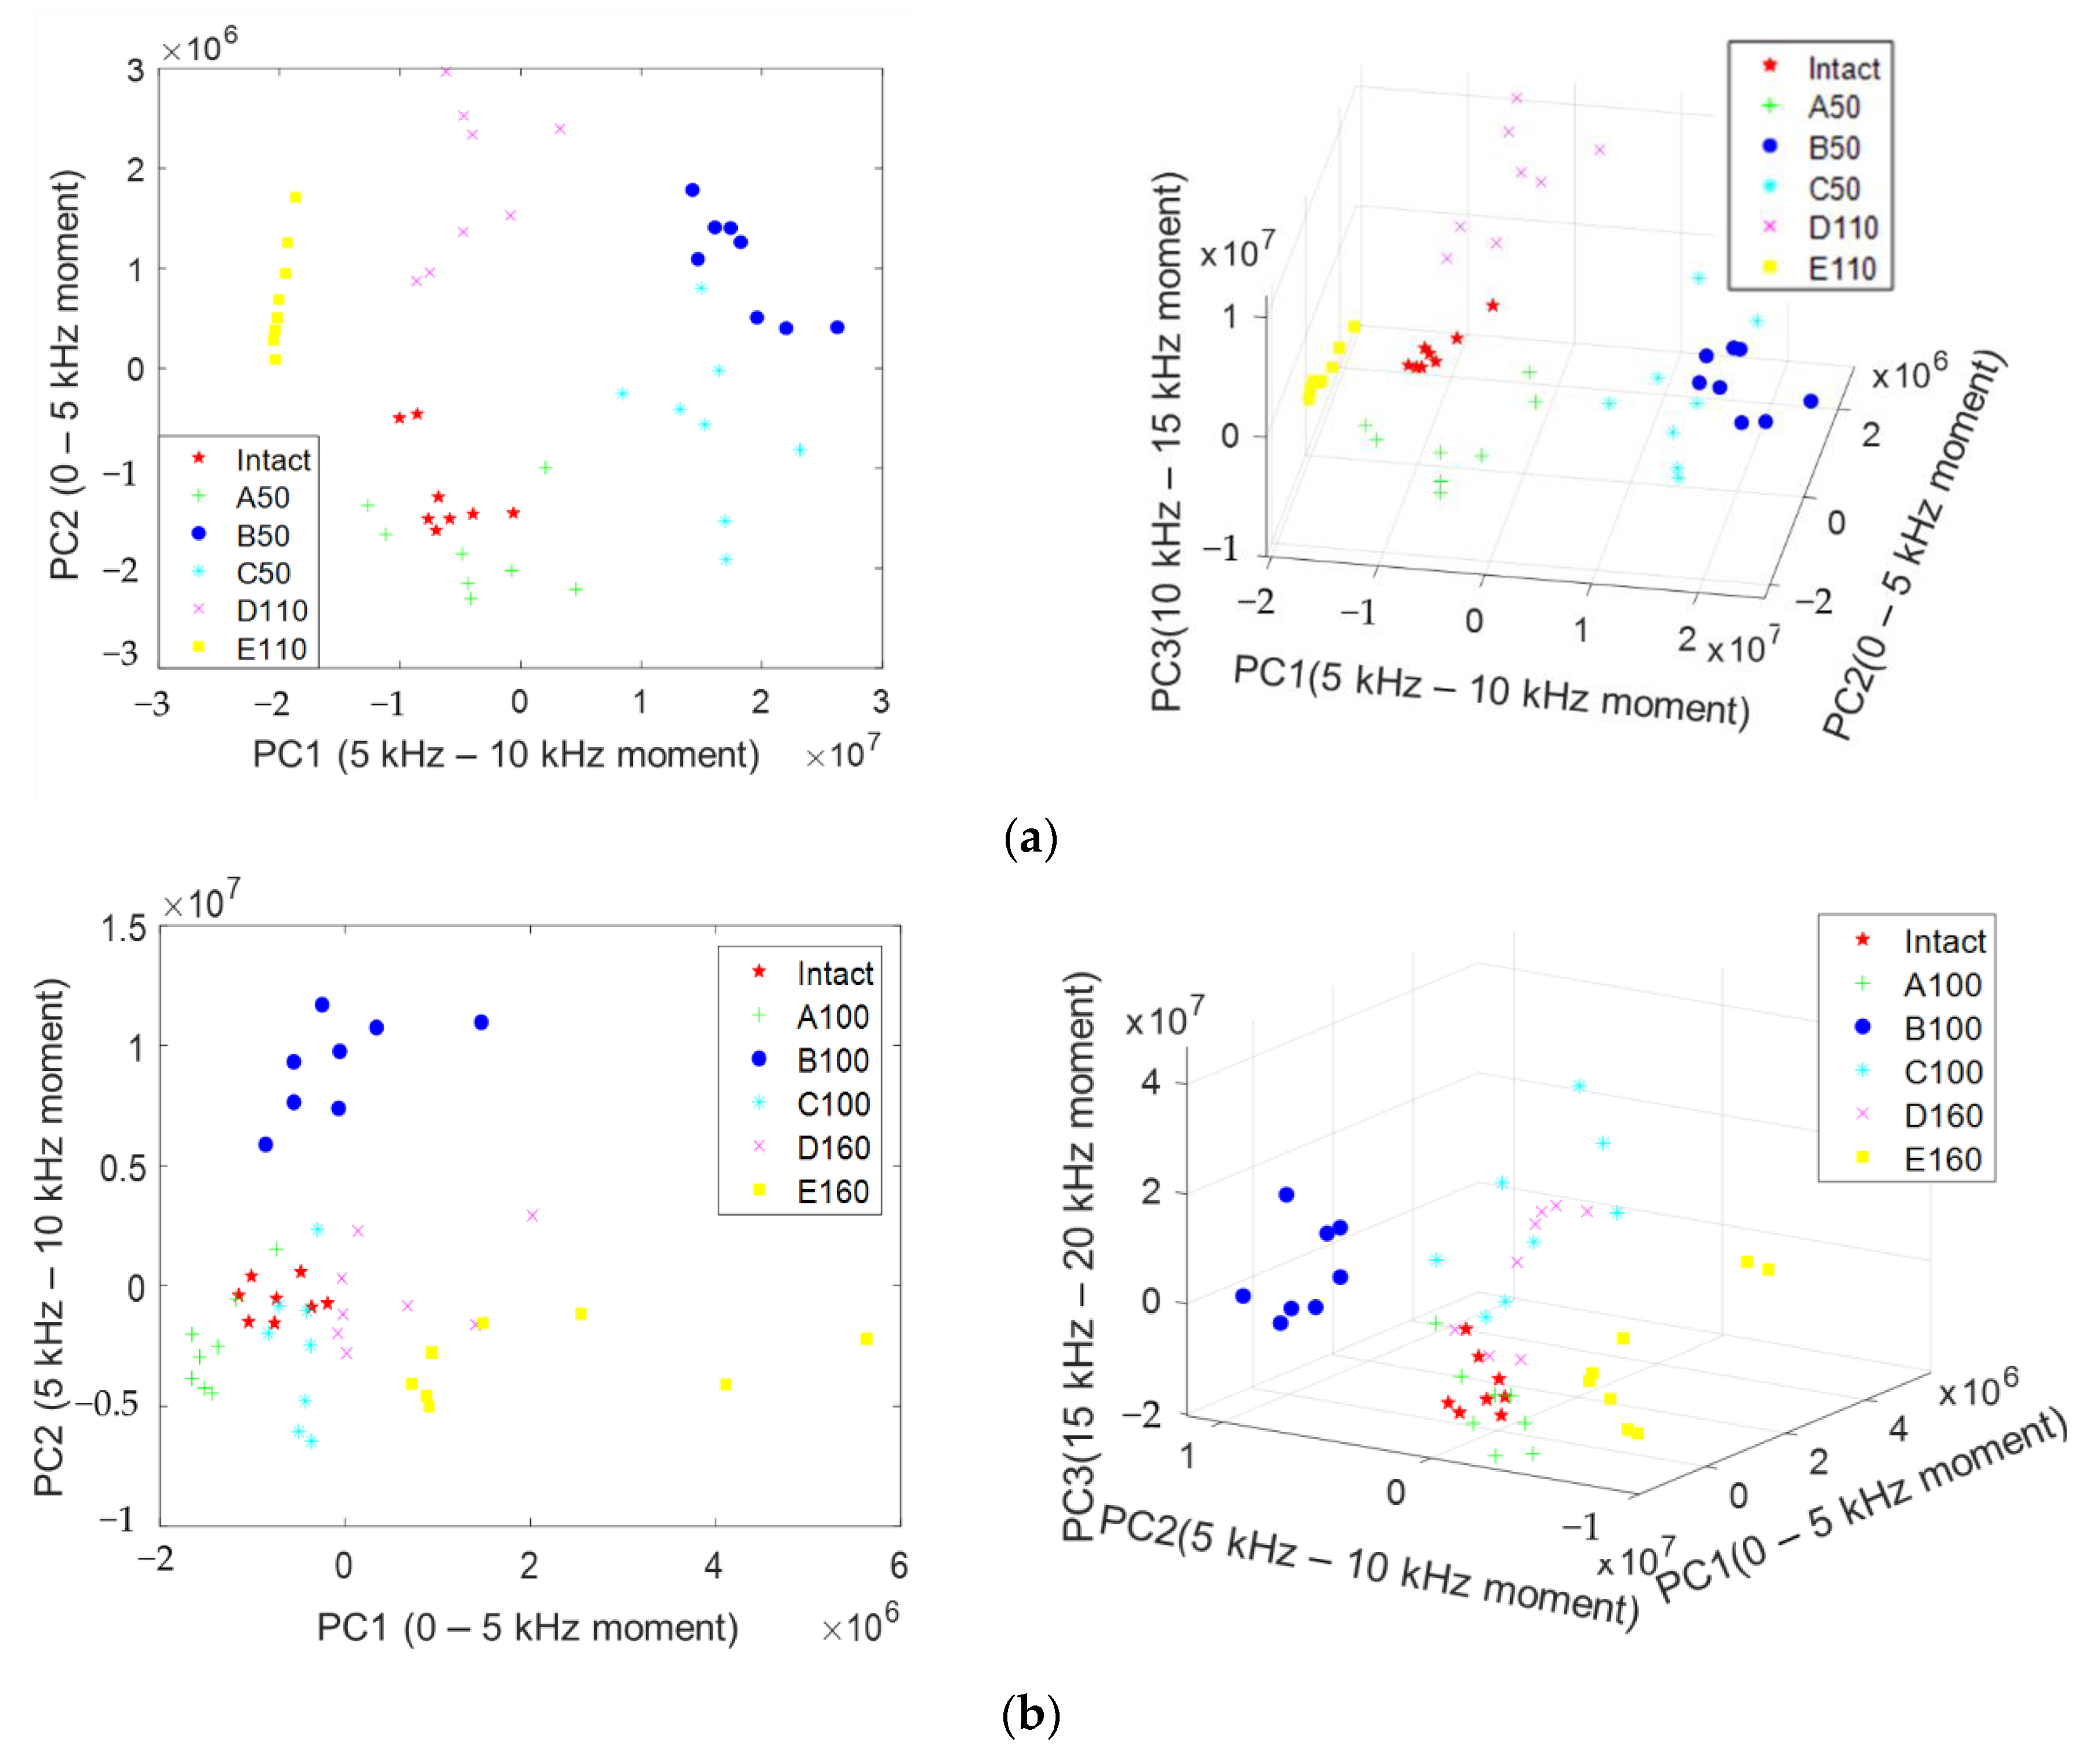
4.5.2. Classification Visualization with Principal Components
4.6. Integrity Detection Procedure of PSC Structure
5. Conclusions
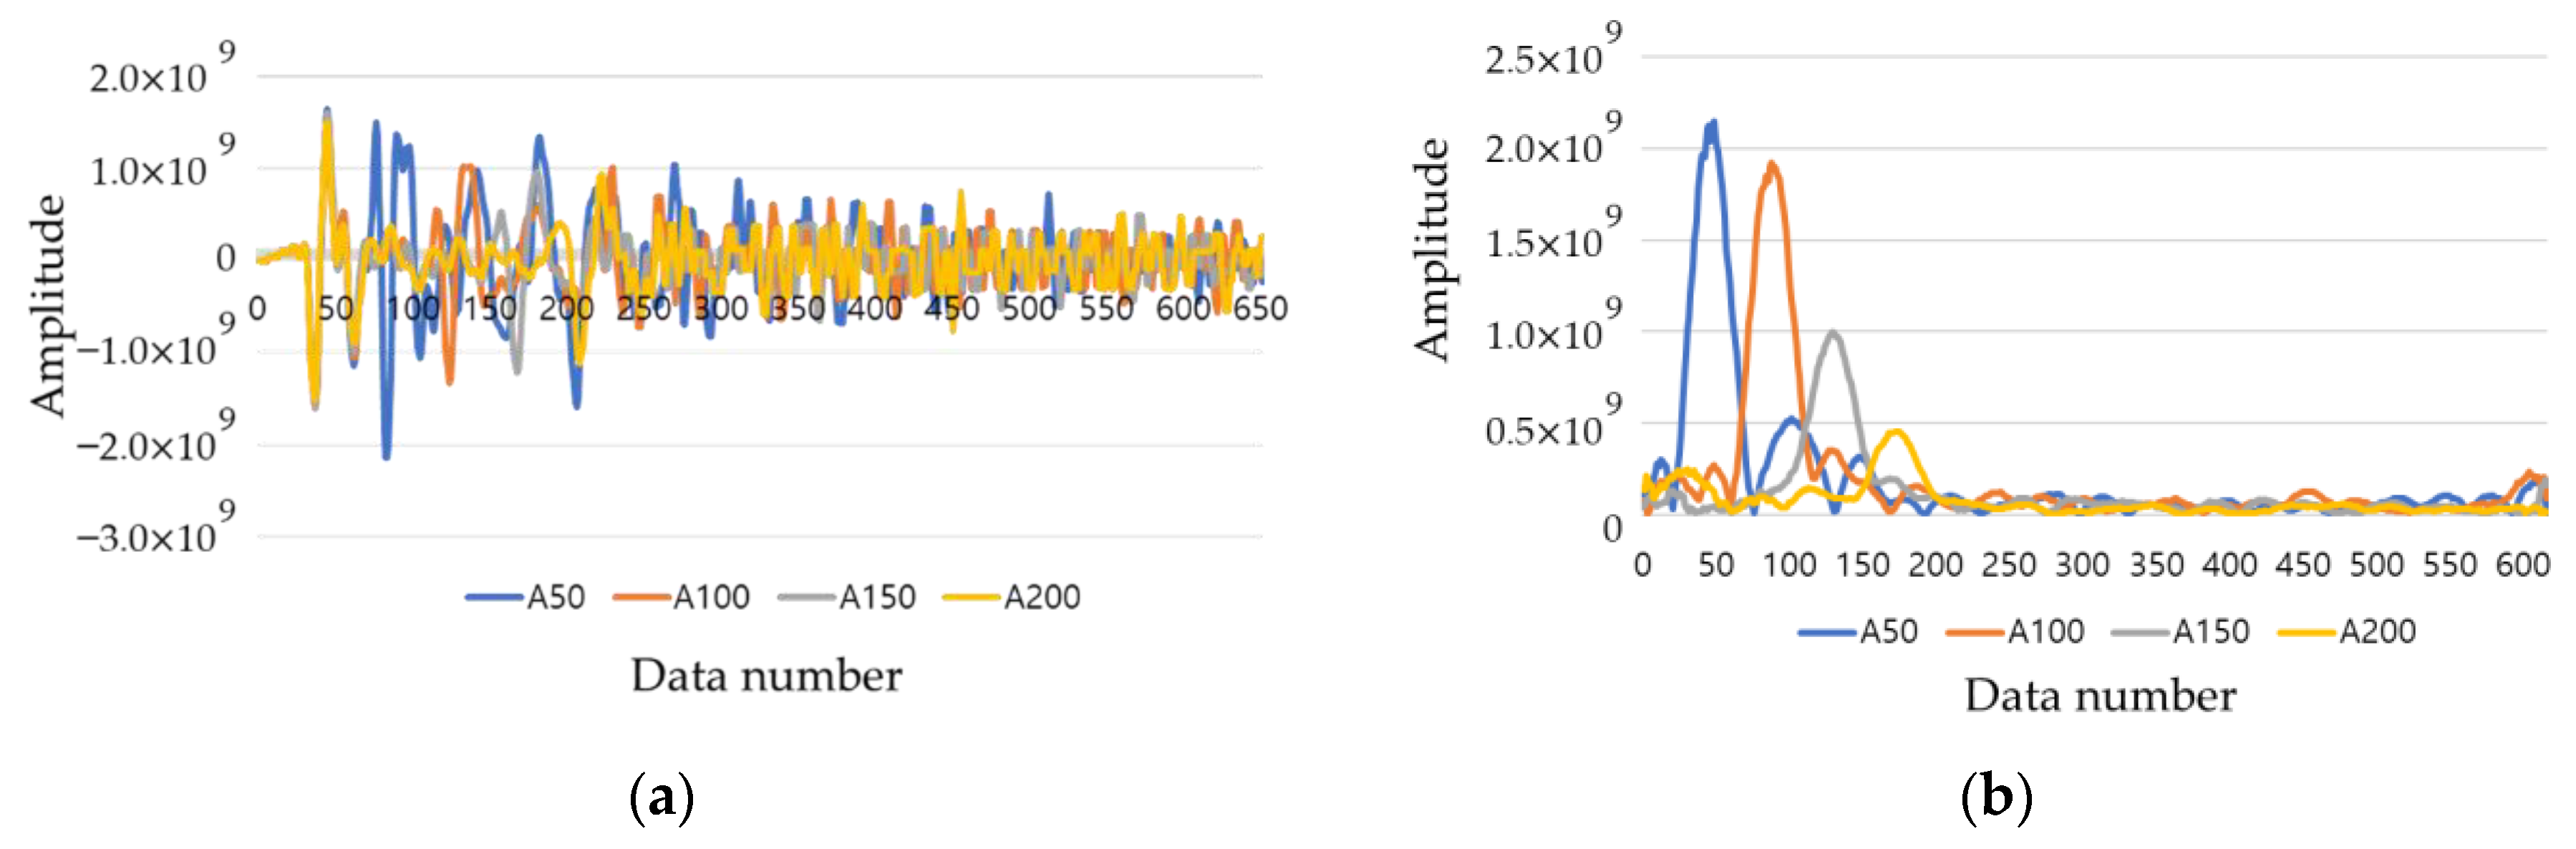
- Although it was difficult to identify defects inside the duct through the general B-scan of the RC radar, they could be roughly inferred from the energy attenuation degree of energy through the Hilbert transformation of the extracted raw data.
- Array equipment using S waves showed similar B-scan results with voids, tendons, and delamination defects; thus, there is a limit to evaluate the defects of the PSC structure.
- In the MASW, some features of the A0 and S1 modes were identified for delamination defects described with normal N400 and acrylic plates. However, it is difficult to apply the MASW analysis based on an infinite plate, because most of the features disappear in the arched duct and do not follow the theoretical curve.
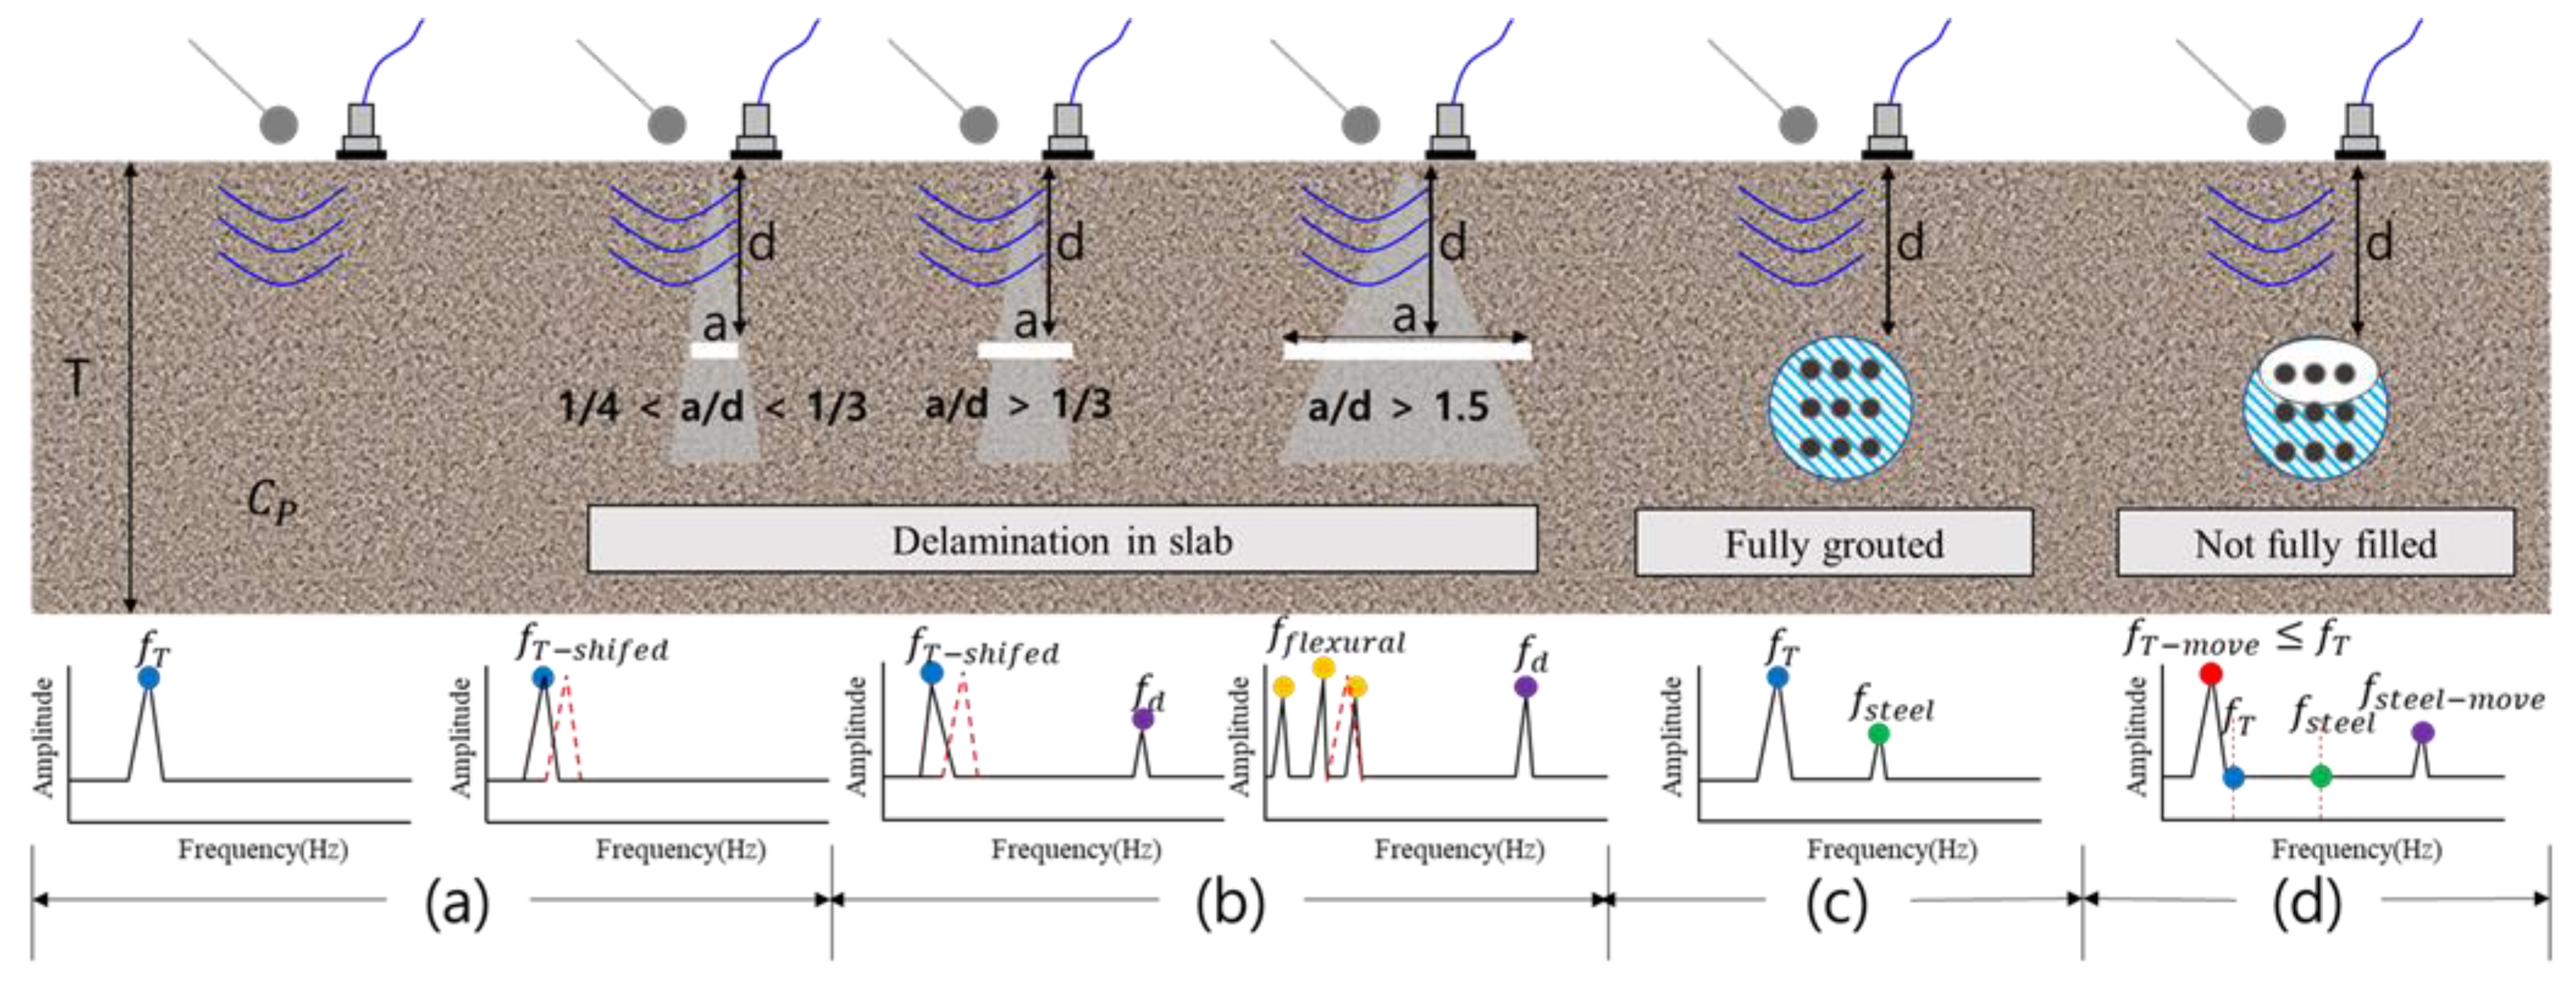
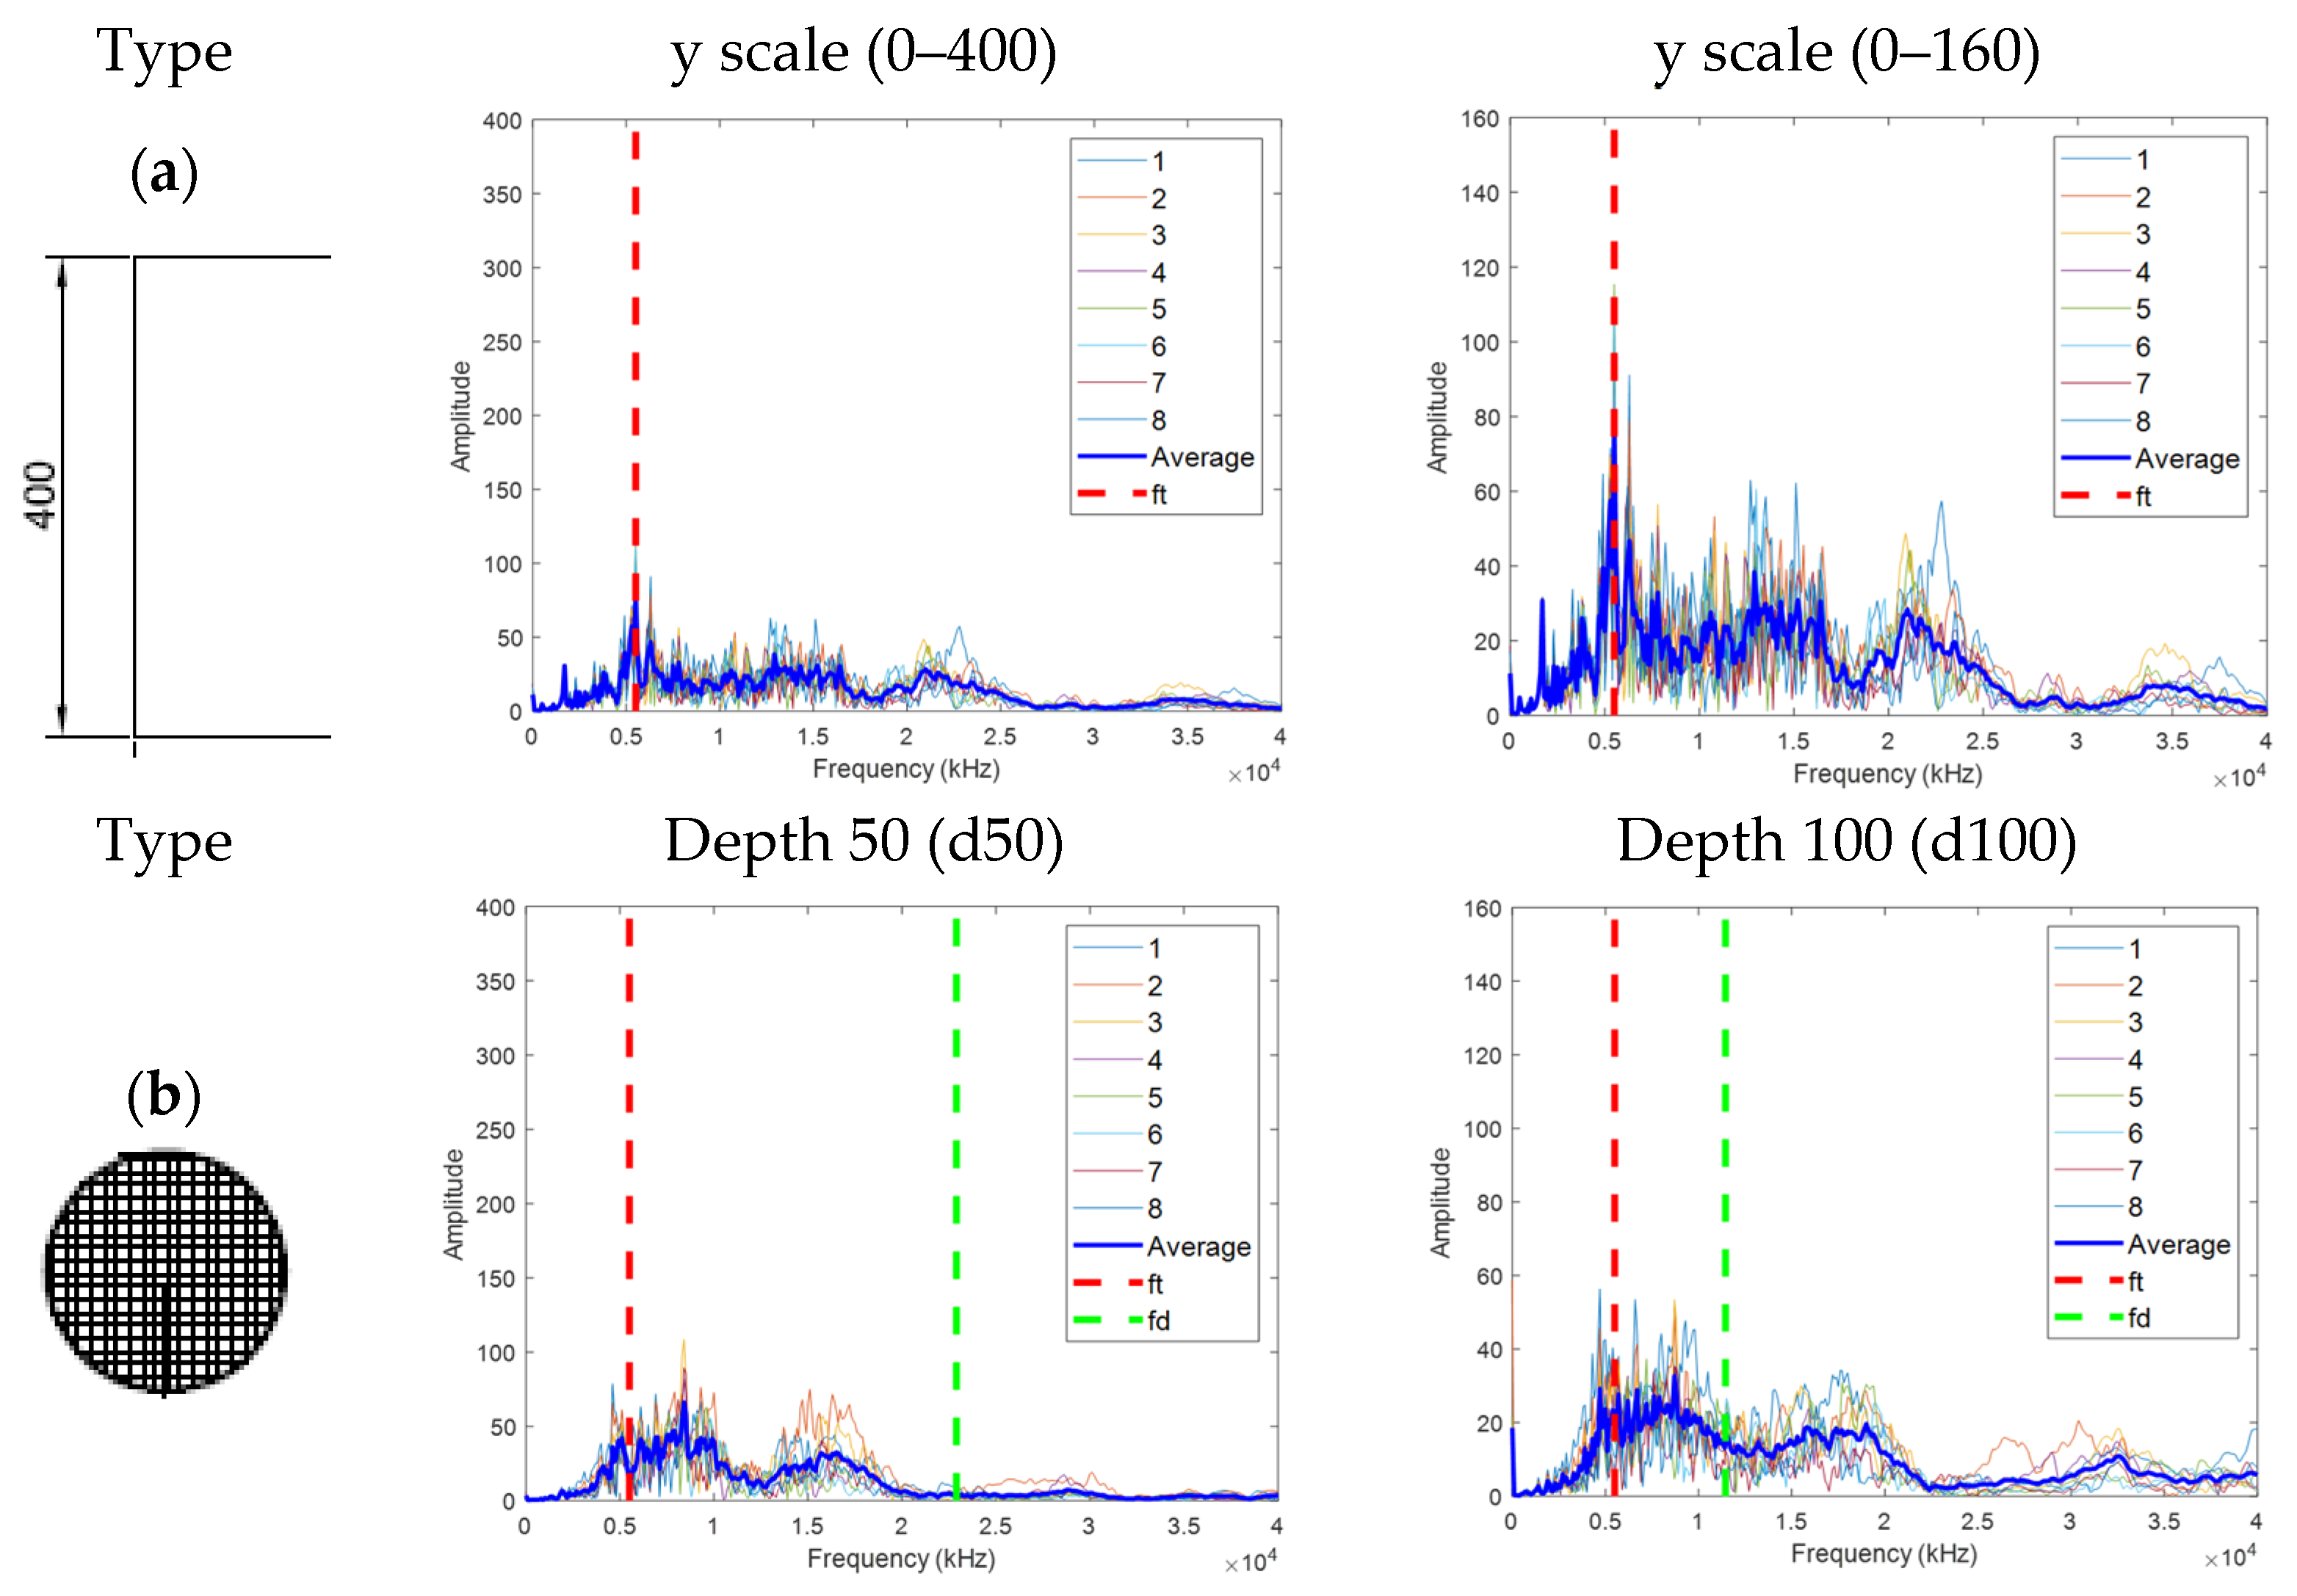
- In the IE test, when the inside of the duct was completely grouted (A), it was difficult to transmit energy because of the reflection of the duct and the interface between the duct and the filled concrete; thus, no clear features were identified other than the thickness mode (ft).
- In the IE spectra of A, B, C, and D with N400 and duct, ft was in the order of A > C > B > D, and there was a difference in the shift depending on the degree of grouting and the depth of the defect. The largest shift occurred in the intermediate defect (D), which is considered to be because the elastic wave propagating into the duct was shifted once more through the middle delamination defect, and the movement distance increased. However, this seems difficult to quantify, as the spectrum may change depending on the test conditions and physical properties of concrete.
- Because it is difficult to consider all the effects of the duct through the occurrence and change of frequency in the general IE spectrum, in this study, features such as moment and area were extracted by considering the frequency range where theoretical ft, ff, and fd occur for each defect type. This was effective in classifying the six types and might be used for the activation and development of the IE method.
- In the case of d150 and d200, the energy gradually weakened depending on the impact position and positions 1–8 of the sensor; thus, an overlapping section occurred in the spectrum, limiting the application of the six types. However, if the position and depth of the duct could be determined using EM waves, it would be sufficiently applicable to detect fully grouted conditions, lack of grouting, and delamination defects in ducts.
- In this study, we proposed a procedure for specifying the location and burial depth of steel ducts using EM waves and classifying defect types through IE and PCA. The proposed procedure seems to be applicable to bridge deck slabs and can contribute to the convergence of various technologies in IE.
Author Contributions
Funding
Institutional Review Board Statement
Informed Consent Statement
Data Availability Statement
Conflicts of Interest
References
- Mathy, B.; Demars, P.; Roisin, F.; Wouters, M. Investigation and strengthening study of twenty damaged bridges: A Belgium case history. In Proceedings of the Third International Conference on Bridge Management, Guildford, UK, 14–17 April 1996; pp. 648–656. [Google Scholar]
- Youn, S.; Kim, E. Deterioration of bonded posttensioned concrete bridges and research topics on the strength evaluation in ISARC. In Proceedings of the JSCE–KSCE Joint Seminar on Maintenance and Management Strategy of Infrastructure in Japan and Korea, JSCE Concrete Committee Newsletter, Shiga, Japan, 20 September 2006; pp. 1–15. [Google Scholar]
- Concrete Society. Durable Bonded Post-Tensioned Concrete Bridges; Technical Rep. No. 47; Concrete Society: Camberley, UK, 2006. [Google Scholar]
- Woodward, R.J.; Williams, F.W. Collapse of YNYS-Y-GWAS bridge, Glamorgan. Proc. Inst. Civ. Eng. 1988, 84, 635–669. [Google Scholar]
- Woodward, D.J.; Wilson, D.L.S. Deformation of segmental post-tensioned precast bridges as a result of corrosion of the tendons. ICE Proc. 1991, 90, 397–419. [Google Scholar] [CrossRef]
- Chen, W.F.; Duan, L. Handbook of International Bridge Engineering; Place, H., Ed.; CRP Press: Boca Raton, FL, USA; Taylor & Francis Group: London, UK, 2014; pp. 593–634. [Google Scholar]
- Gucunski, N.; Basily, B.; Kim, J.; Duong, T.; Maher, A.; Dinh, K.; Azari, H.; Ghasemi, H. Assessing condition of concrete bridge decks by robotic platform RABIT for development of deterioration and predictive models. In Proceedings of the 8th International Conference on Bridge Maintenance, Safety and Management (IABMAS), Foz do Iguacu, Brazil, 26–30 June 2016; pp. 26–30. [Google Scholar]
- Reichling, K.; Raupach, M.; Wiggenhauser, H.; Stoppel, M.; Dobmann, G.; Kurz, J. BETOSCAN—Robot controlled non-destructive diagnosis of reinforced concrete decks. In Proceedings of the NDTCE’09, NonDestructive Testing in Civil Engineering, Nantes, France, 30 June–3 July 2009. [Google Scholar]
- Krause, M.; Milmann, B.; Mayer, K.; Schickert, M. Investigation of Tendon Ducts by Means of Ultrasonic Echo Methods: A Comparative Study. In Proceedings of the 9th European Conference on NDT (ECNDT 2006), Berlin, Germany, 25–29 September 2006; pp. 1–12. [Google Scholar]
- Dawood, N.; Marzouk, H.; Hussein, A.; Gillis, N. Nondestructive assessment of a jetty bridge structure using Impact-Echo and Shear-Wave techniques. ASCE 2013, 18, 801–809. [Google Scholar] [CrossRef]
- Sansalone, M.J.; Streett, W.B. Impact-Echo: Nondestructive Evaluation of Concrete and Masonry; Bullbrier Press: Ithaca, NY, USA, 1997. [Google Scholar]
- Sansalone, M.J. Impact-Echo: The complete story. ACI Struct. J. 1997, 94, 777–786. [Google Scholar]
- Grosse, C.U.; Reinhardt, H.W.; Krüger, M.; Beutel, R. Application of Impact-Echo techniques for crack detection and crack parameter estimation in concrete. In Proceedings of the 11th International Conference on Fracture (ICF11), Turin, Italy, 20–25 March 2005; pp. 4884–4889. [Google Scholar]
- Sansalone, M.J.; Carino, N.J. Detecting delaminations in concrete slabs with and without overlays using the impact-echo method. ACI Mater. J. 1989, 86, 175–184. [Google Scholar]
- Carino, N.J.; Sansalone, M. Flaw Detection in Concrete Using the Impact-Echo Method. In Bridge Evaluation, Repair and Rehabilitation; NATO ASI Series (Series E: Applied Sciences) 187; Nowak, A.S., Ed.; Springer: Dordrecht, The Netherlands, 1990; pp. 101–118. [Google Scholar]
- Garbacz, A.; Piotrowski, T.; Kwasniewski, L.; Courard, L. On the evaluation of interface quality in concrete repair system by means of impact-echo signal analysis. Constr. Build. Mater. 2017, 134, 311–323. [Google Scholar] [CrossRef] [Green Version]
- Schubert, F.; Köhler, B. Ten Lectures on Impact-Echo. J. Nondestruct. Eval. 2008, 27, 5–21. [Google Scholar] [CrossRef]
- Xiao, J.Z.; Agrawal, A. Robotic Inspection of Bridges Using Impact-Echo Technology; UTRC-RITA Project Final Report; The City College of New York: New York, NY, USA, 2015; pp. 7–18. [Google Scholar]
- Krüger, M.; Grosse, C.U. Impact-Echo-Techniques for crack depth measurement. Sustain. Bridges 2007, SB-3.7, 1–29. [Google Scholar]
- Chaudhary, M.T.A. Effectiveness of impact echo testing in detecting flaws in prestressed concrete slabs. Construct. Build. Mater. 2013, 47, 753–759. [Google Scholar] [CrossRef]
- Liang, M.T.; Su, P.J. Detection of the corrosion damage of rebar in concrete using impact-echo method. Cem. Concr. Res. 2001, 31, 1427–1436. [Google Scholar] [CrossRef]
- Song, K.I.; Cho, G.C. Bonding state evaluation of tunnel shotcrete applied onto hard rocks using the impact-echo method. NDT E Int. 2009, 42, 487–500. [Google Scholar] [CrossRef]
- Valenzuela, M.L.; Sansalone, M.J.; Streett, W.B.; Krumhansl, C.L. Use of sound for the interpretation of impact-echo signals. In Proceedings of the 4th International Conference on Auditory Display (ICAD1997), Palo Alto, CA, USA, 2–5 November 1997. [Google Scholar]
- Carino, N.J.; Sansalone, M.J.; Hsu, N.N. A point sourcepoint receiver, pulse-echo technique for flaw detection in concrete. ACI J. 1986, 83, 199–208. [Google Scholar]
- Sansalone, M.; Carino, N.J. Impact-Echo: A Method for Flaw Detection in Concrete Using Transient Stress Waves; National Bureau of Standard: Gaithersburg, MD, USA, 1986.
- Lee, Y.H.; Oh, T.K. The simple lamb wave analysis to characterize concrete wide beams by the practical MASW test. Materials 2016, 9, 437. [Google Scholar] [CrossRef] [PubMed] [Green Version]
- Song, H.M.; Hong, J.Y.; Choi, H.J.; Min, J.Y. Concrete delamination depth estimation using a noncontact MEMS ultrasonic sensor array and an optimization approach. Appl. Sci. 2021, 11, 592. [Google Scholar] [CrossRef]
- Chen, H.; Xu, B.; Wang, J.; Luan, L.; Zhou, T.; Nie, X.; Mo, Y.L. Interfacial debonding detection for rectangular CFST using the MASW method and its physical mechanism analysis at the Meso-Level. Sensors 2019, 19, 2778. [Google Scholar] [CrossRef] [Green Version]
- Abraham, O.; Cote, P. Impact Echo Thickness Frequency Profiles for detection of voids in tendon ducts. ACI Struct. J. 2002, 3, 239–248. [Google Scholar]
- Liu, Y.L.; Shi, J.J.; Huang, J.Q.; Wei, G.S.; Wu, Z.X. Grouting defect detection of lapped bar connections based on Impact-Echo method. Shock. Vib. 2019, 2019, 1934240. [Google Scholar] [CrossRef] [Green Version]
- Tinkey, Y.; Olson, L.D. Impact-Echo Scanning for Grout Void Detection in Post-tensioned Bridge Ducts-Findings from a Research Project and a Case History. ASCE 2007, 1–13. [Google Scholar] [CrossRef]
- Zou, C.; Chen, Z.; Dong, P.; Chen, C. Experimental and numerical studies on nondestructive evaluation of grout quality in tendon ducts using Impact-Echo method. ASCE 2016, 21, 04015040. [Google Scholar] [CrossRef]
- Zhang, J.K.; Yan, W.; Cui, D.M. Concrete condition assessment using Impact-Echo method and extreme learning machines. Sensors 2016, 16, 447. [Google Scholar] [CrossRef]
- Oh, B.D.; Choi, H.; Song, H.J.; Kim, J.D.; Park, C.Y.; Kim, Y.S. Detection of defect inside duct using recurrent neural networks. Sens. Mater. 2020, 32, 171–182. [Google Scholar] [CrossRef] [Green Version]
- Oh, T.K.; Park, J.I.; Byun, Y.S.; Lee, Y.H. A study on the influence factors on flexural and thickness modes in the Impact-Echo test. J. Comput. Struct. Eng. Inst. Korea 2015, 28, 659–666. [Google Scholar] [CrossRef] [Green Version]
- Hotelling, H. Analysis of a complex of statistical variables into principal components. J. Educ. Psychol. 1993, 24, 417–441, 498–520. [Google Scholar] [CrossRef]
- Jollie, I.T. Principal Component Analysis, 2nd ed.; Springer Science & Business Media: New York, NY, USA, 2002; pp. 1–27. [Google Scholar]
- Choi, I.H.; Son, J.A.; Koo, J.B.; Yoon, Y.G.; Oh, T.K. Damage assessment of porcelain insulators through principal component analysis associated with frequency response signals. Appl. Sci. 2019, 9, 3150. [Google Scholar] [CrossRef] [Green Version]
- Rao, S.S. Vibration of Continuous Systems; John Wiley & Sons, Inc.: Hoboken, NJ, USA, 2007; pp. 680–683. [Google Scholar]


| Type | a/d | ft | ff | fd | Type | a/d | ft | ff | fd |
|---|---|---|---|---|---|---|---|---|---|
| N400 | - | o | x | x | - | - | - | - | - |
| A50 | - | o | x | o | A150 | - | o | x | o |
| B50 | 2.60 | x | o | o | B150 | 0.87 | o (shift) | x | o |
| C50 | 1.80 | x | o | o (shift) | C150 | 0.60 | o (shift) | x | o (shift) |
| D50 | 1.13 | o (shift) | x | o (shift) | D150 | 0.60 | o (shift) | x | o (shift) |
| E50 | 1.13 | o (shift) | x | o | E150 | 0.60 | o (shift) | x | o |
| A100 | - | o | x | o | A200 | - | o | x | o |
| B100 | 1.30 | o (shift) | x | o | B200 | 0.65 | o (shift) | x | o |
| C100 | 0.90 | o (shift) | x | o (shift) | C200 | 0.45 | o (shift) | x | o (shift) |
| D100 | 0.79 | o (shift) | x | o (shift) | D200 | 0.49 | o (shift) | x | o (shift) |
| E100 | 0.79 | o (shift) | x | o | E200 | 0.49 | o (shift) | x | o |
| Type | n | a (m) | d (m) | Natural Frequency (Hz) | a/d | |
|---|---|---|---|---|---|---|
| A50 (top) | 1 | 0.13 | 0.05 | 2954 | 2.60 | |
| A50 (end) | 1 | 0.13 | 0.115 | 10,305 | 1.13 | |
| B50 (top) | 1 | 0.09 | 0.05 | 6164 | 1.80 | |
| B50 (end) | 1 | 0.09 | 0.07 | 10,211 | 1.29 |
Publisher’s Note: MDPI stays neutral with regard to jurisdictional claims in published maps and institutional affiliations. |
© 2021 by the authors. Licensee MDPI, Basel, Switzerland. This article is an open access article distributed under the terms and conditions of the Creative Commons Attribution (CC BY) license (https://creativecommons.org/licenses/by/4.0/).
Share and Cite
Yoon, Y.-G.; Lee, J.-Y.; Choi, H.; Oh, T.-K. A Study on the Detection of Internal Defect Types for Duct Depth of Prestressed Concrete Structures Using Electromagnetic and Elastic Waves. Materials 2021, 14, 3931. https://doi.org/10.3390/ma14143931
Yoon Y-G, Lee J-Y, Choi H, Oh T-K. A Study on the Detection of Internal Defect Types for Duct Depth of Prestressed Concrete Structures Using Electromagnetic and Elastic Waves. Materials. 2021; 14(14):3931. https://doi.org/10.3390/ma14143931
Chicago/Turabian StyleYoon, Young-Geun, Jae-Yun Lee, Hajin Choi, and Tae-Keun Oh. 2021. "A Study on the Detection of Internal Defect Types for Duct Depth of Prestressed Concrete Structures Using Electromagnetic and Elastic Waves" Materials 14, no. 14: 3931. https://doi.org/10.3390/ma14143931