
In Situ Investigation of Strain Localization in Sintered, Porous Segmented Alumina

 ,
, 
Abstract
:1. Introduction
2. Materials and Methods
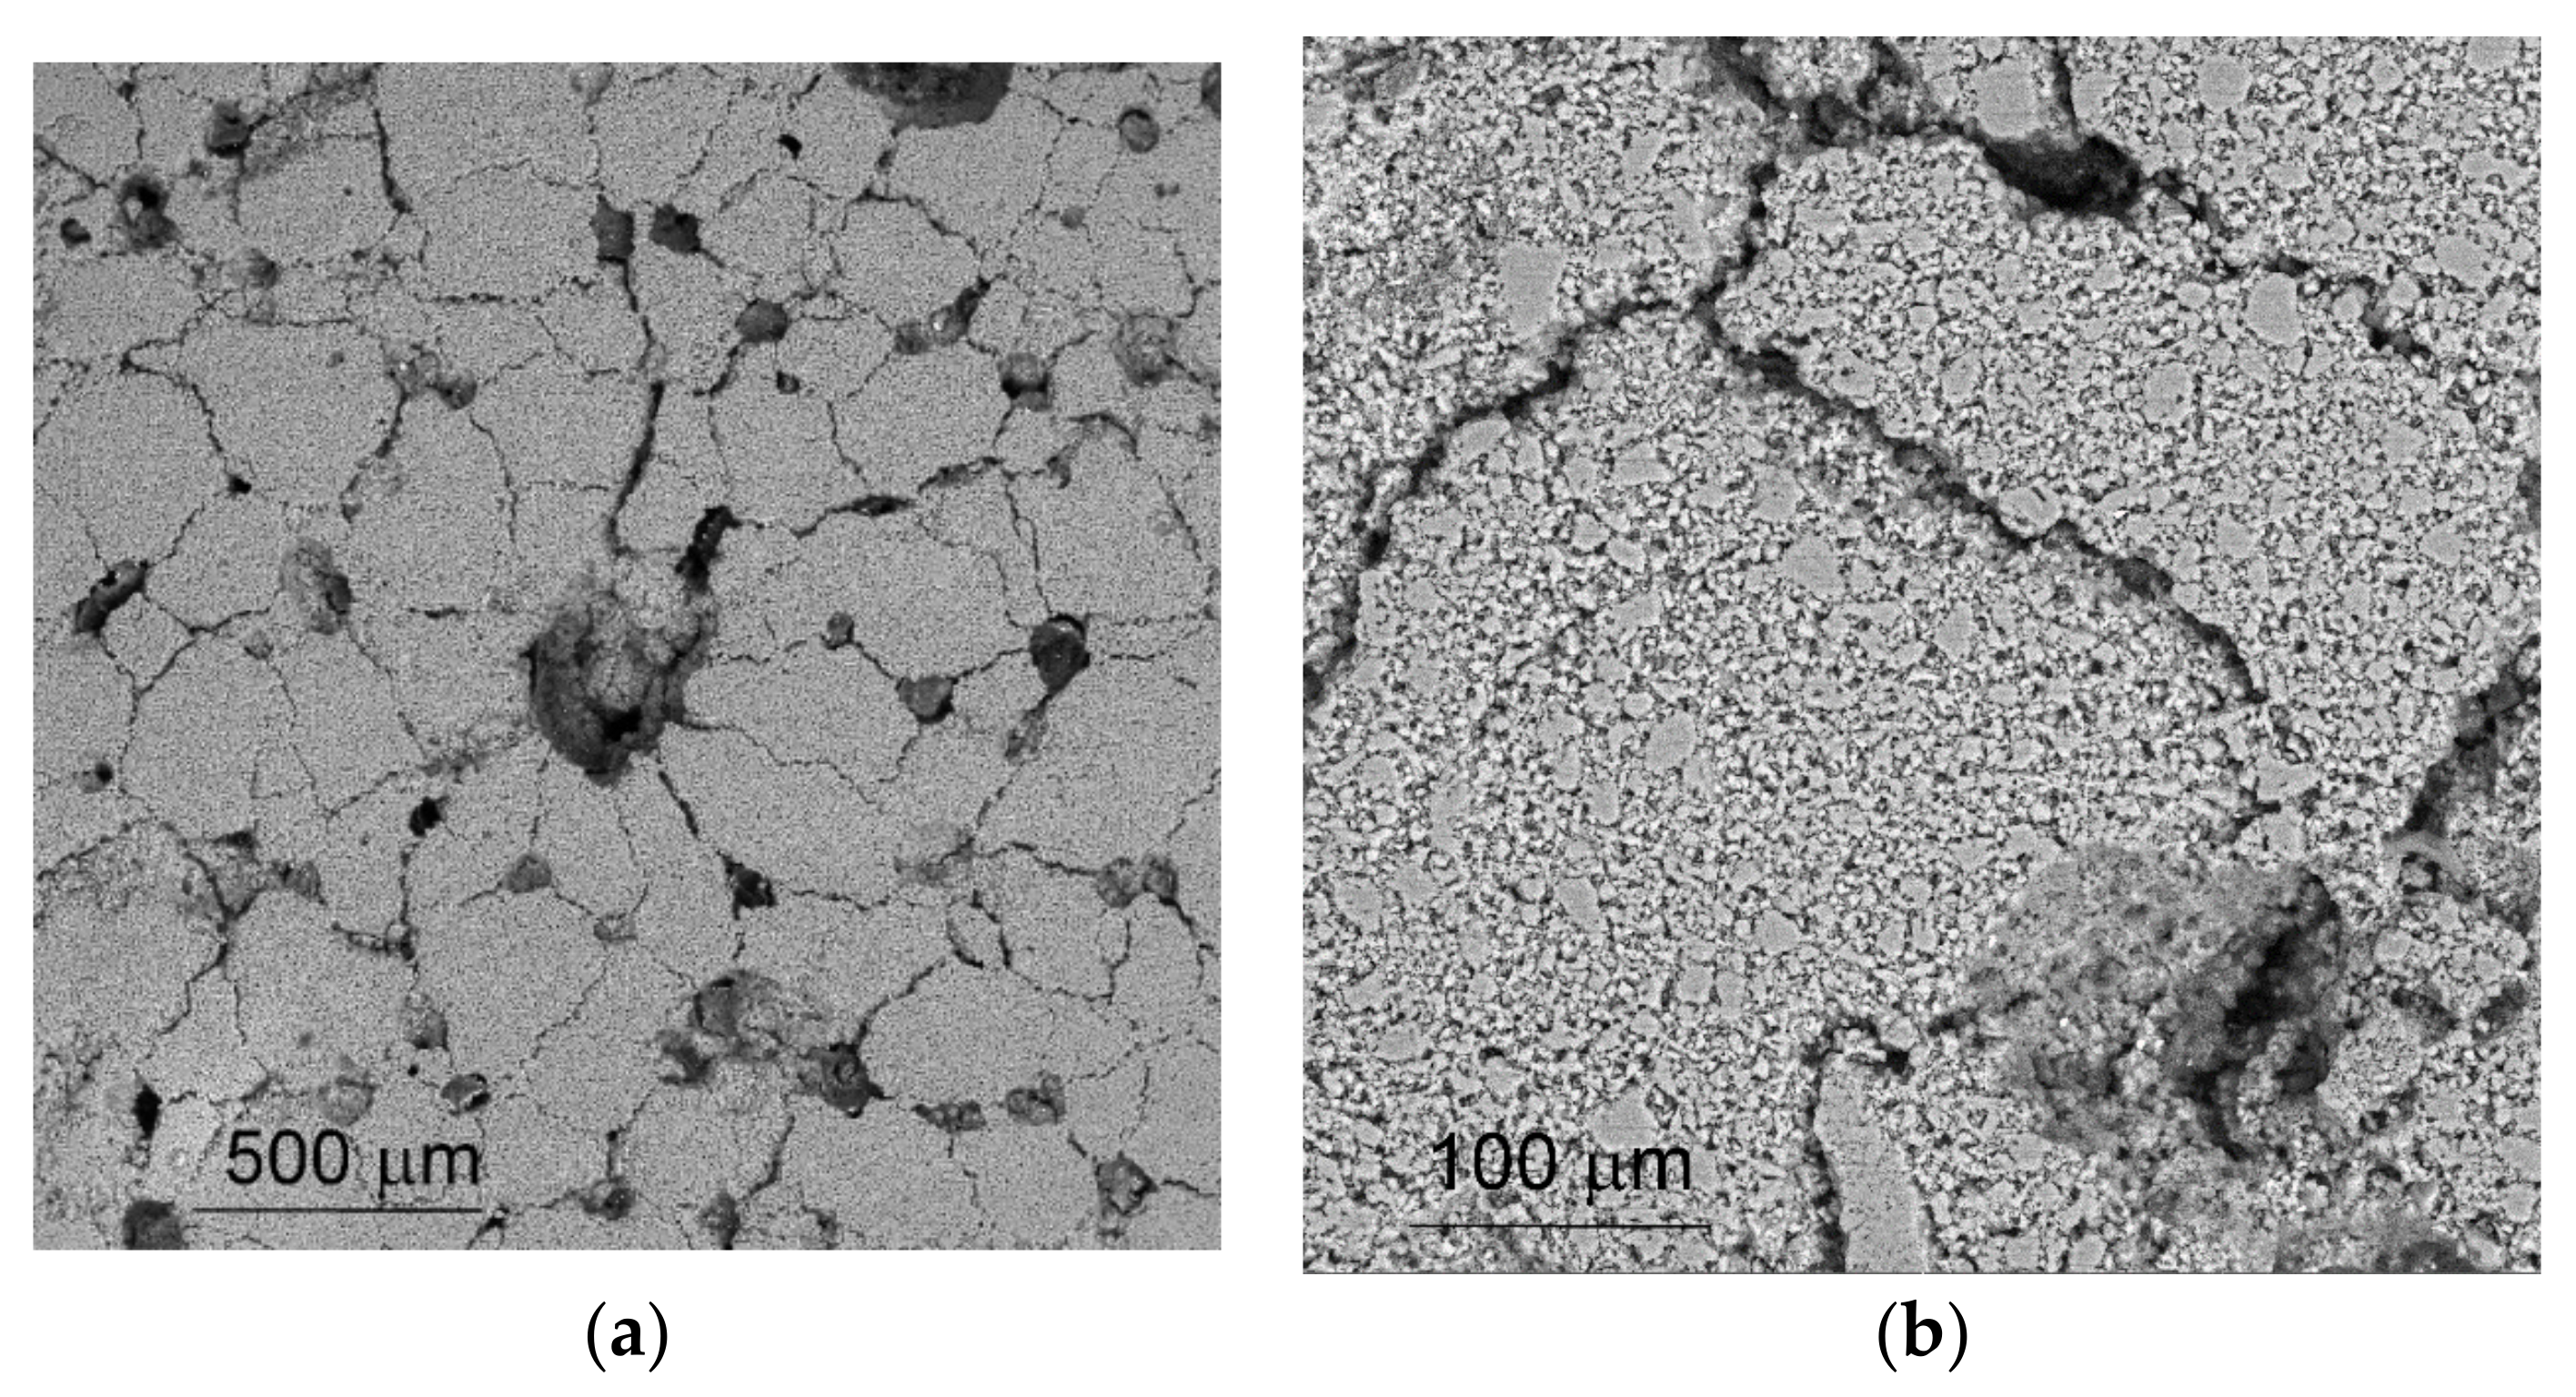
2.1. Sample Preparation and Examination
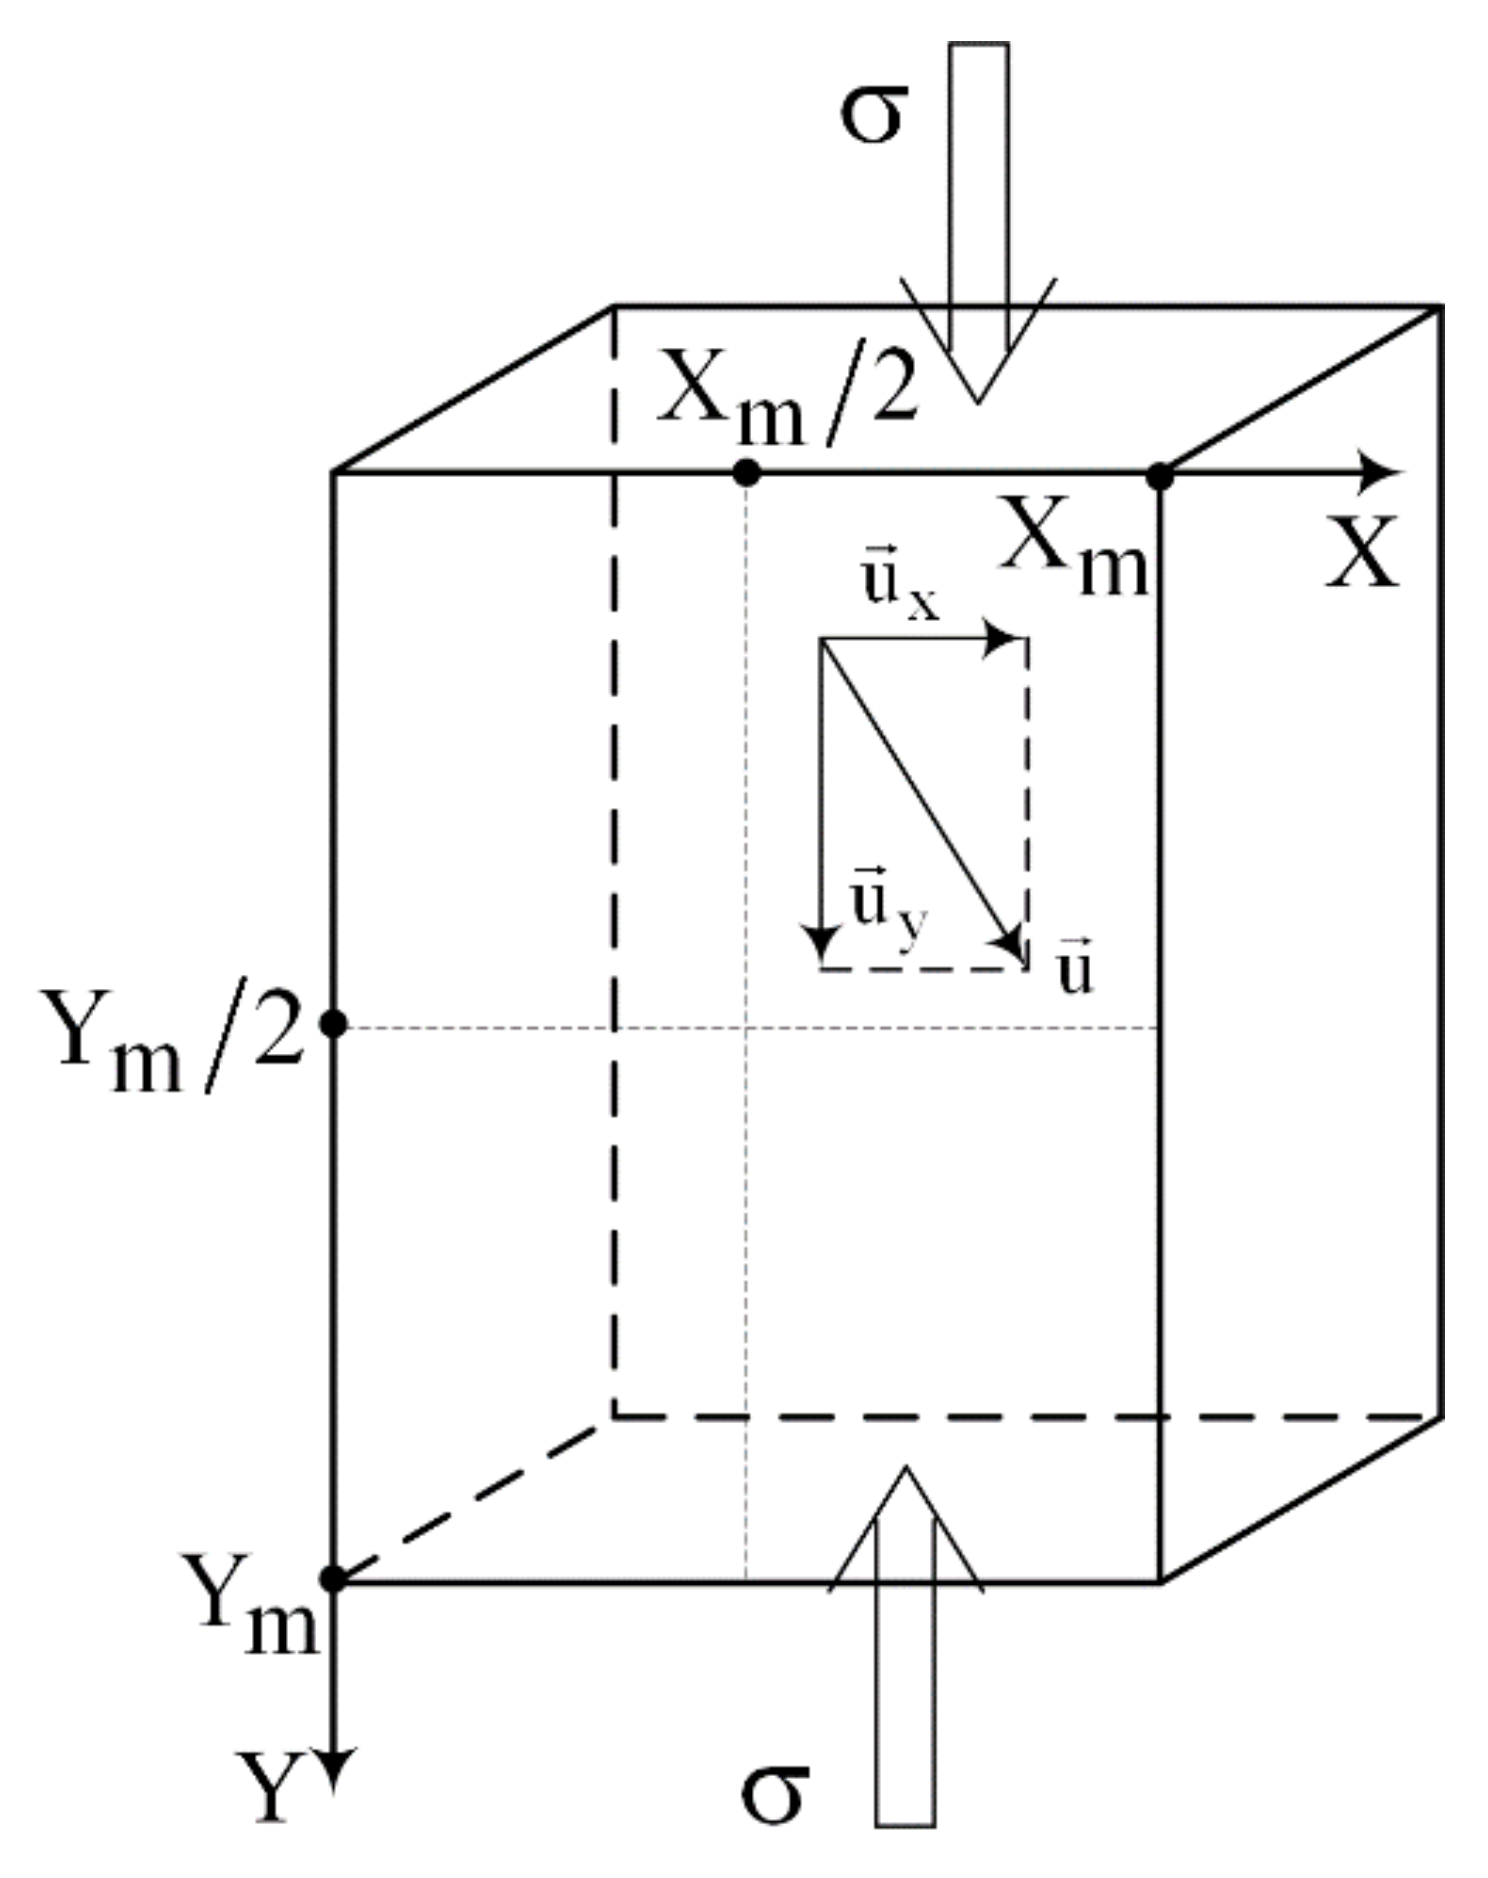
2.2. DIC Procedure
3. Results
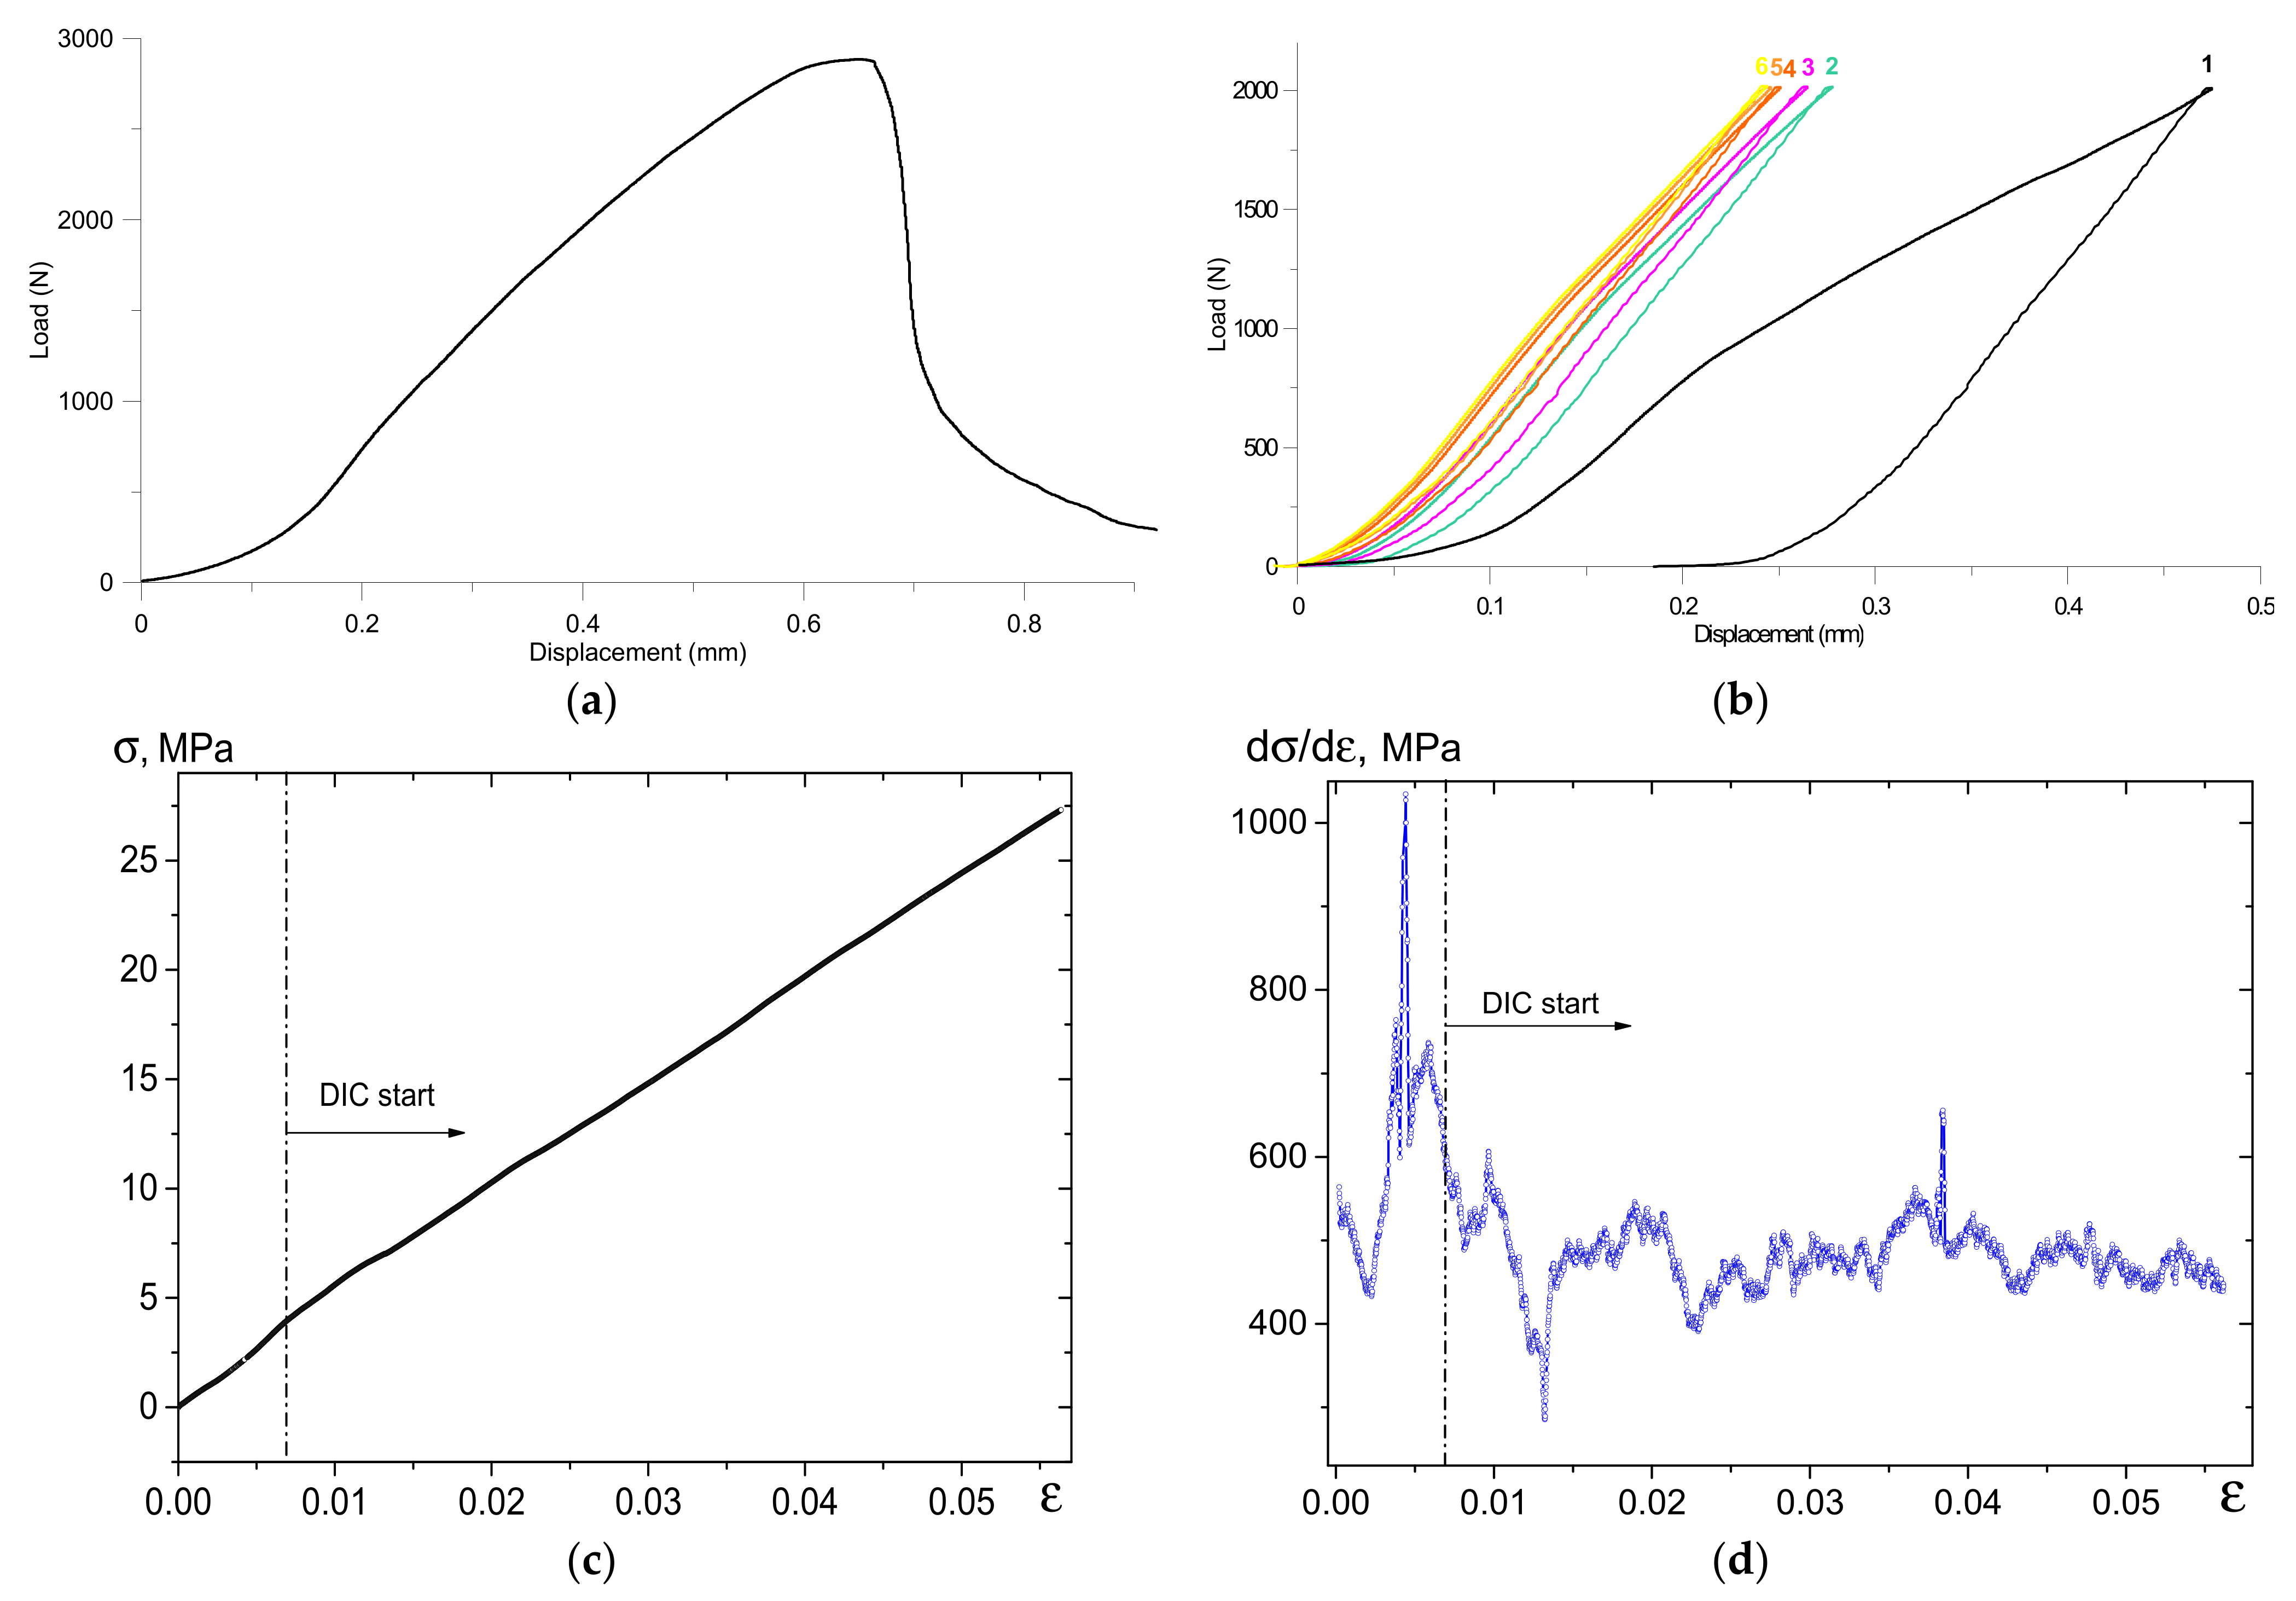
3.1. Compression
3.2. DIC
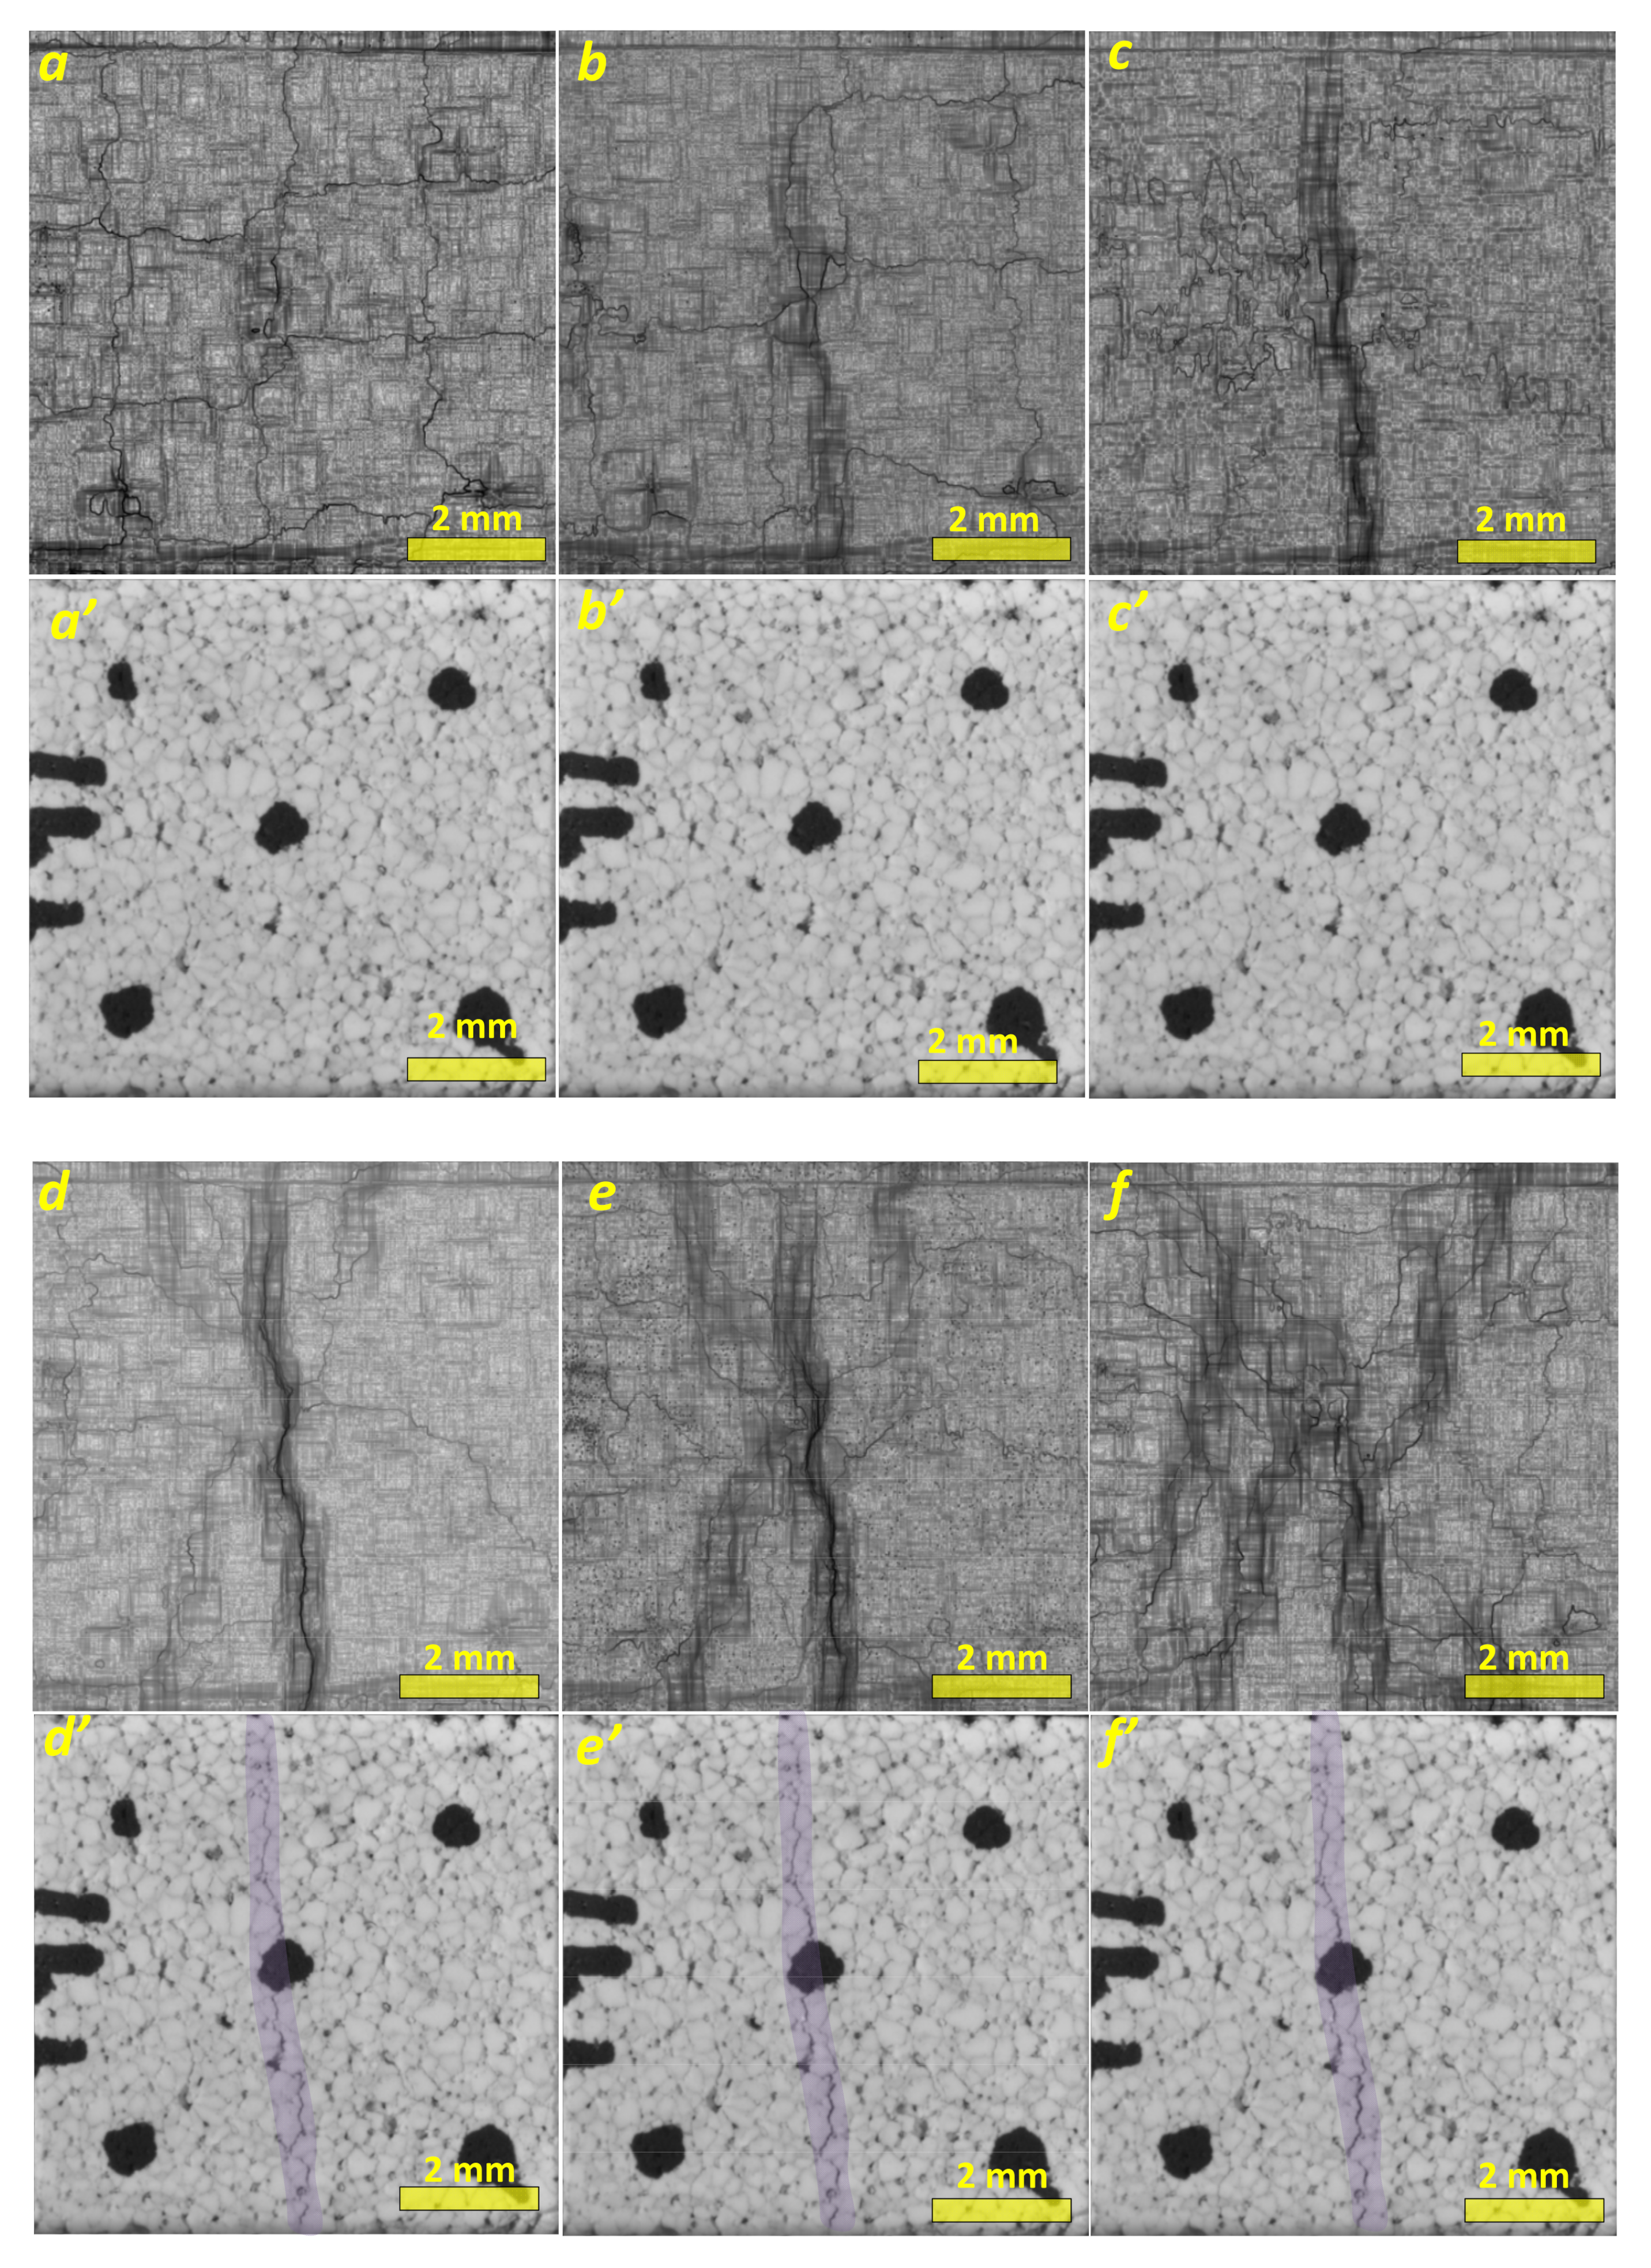
3.2.1. In Situ Strain Mapping and SEM
3.2.2. Estimation of Microfracture-Retardation Mechanism by Rate-of-Strain Tensor (ROST) Components
3.2.3. Fracture-to-Compaction Banding Transition
4. Discussion
4.1. Compression
4.2. Primary and Accomodation Compaction Bands
4.3. Future Efforts
5. Conclusions
Author Contributions
Funding
Institutional Review Board Statement
Informed Consent Statement
Data Availability Statement
Conflicts of Interest
References
- Chen, Y.; Wang, N.; Ola, O.; Xia, Y.; Zhu, Y. Porous ceramics: Light in weight but heavy in energy and environment technologies. Mater. Sci. Eng. R Rep. 2021, 143, 100589. [Google Scholar] [CrossRef]
- Ohji, T.; Fukushima, M. Macro-porous ceramics: Processing and properties. Int. Mater. Rev. 2012, 57, 115–131. [Google Scholar] [CrossRef]
- Bhaduri, S.B. Science and Technology of Ceramic Foams. Adv. Perform. Mater. 1994, 1, 205–220. [Google Scholar] [CrossRef]
- Goldstein, R.V.; Osipenko, N.M. Influence of the Form of Material Structure Elements on the Fracture Scenario in a Complex Stress State. Mech. Solids 2015, 50, 147–159. [Google Scholar] [CrossRef]
- Fischer-Cripps, A.C.; Lawn, B.R. Stress Analysis of Contact Deformation in Quasi-Plastic Ceramics. J. Am. Ceram. Soc. 2005, 79, 2609–2618. [Google Scholar] [CrossRef]
- Meille, S.; Lombardi, M.; Chevalier, J.; Montanaro, L. Mechanical properties of porous ceramics in compression: On the transition between elastic, brittle, and cellular behavior. J. Eur. Ceram. Soc. 2012, 32, 3959–3967. [Google Scholar] [CrossRef]
- Tallon, C.; Chuanuwatanakul, C.; Dunstan, D.E.; Franks, G.V. Mechanical strength and damage tolerance of highly porous alumina ceramics produced from sintered particle stabilized foams. Ceram. Int. 2016, 42, 8478–8487. [Google Scholar] [CrossRef]
- Tulliani, J.-M.; Montanaro, L.; Bell, T.J.; Swain, M.V. Semiclosed-Cell Mullite Foams: Preparation and Macro- and Micromechanical Characterization. J. Am. Ceram. Soc. 1999, 82, 961–968. [Google Scholar] [CrossRef]
- Baino, F.; Caddeo, S.; Novajra, G.; Vitale-Brovarone, C. Using porous bioceramic scaffolds to model healthy and osteoporotic bone. J. Eur. Ceram. Soc. 2016, 36, 2175–2182. [Google Scholar] [CrossRef]
- Latella, B.A.; O’Connor, B.H.; Padture, N.P.; Lawn, B.R. Hertzian Contact Damage in Porous Alumina Ceramics. J. Am. Ceram. Soc. 1997, 80, 1027–1031. [Google Scholar] [CrossRef]
- Hirth, G.; Tullis, J. The Effects of Pressure and Porosity on the Micro-mechanics of the Brittle–Ductile Transition in Quartzite. J. Geophys. Res. 1989, 94, 17825–17838. [Google Scholar] [CrossRef]
- Bruno, G.; Efremov, A.M.; Levandovsky, A.N.; Clausen, B. Connecting the macro and microscopic strain response in porous ceramics: Modeling and experimental validation. J. Mater. Sci. 2011, 46, 161–173. Available online: https://link.springer.com/article/10.1007/s10853-010-4899-0 (accessed on 28 September 2010). [CrossRef] [Green Version]
- Bruno, G.; Kachanov, M. Porous microcracked ceramics under compression: Micromechanical model of non-linear behavior. J. Eur. Ceram. Soc. 2013, 33, 2073–2085. [Google Scholar] [CrossRef]
- Estrin, Y.; Dyskin, A.V.; Pasternak, E. Topological interlocking as a material design concept. Mater. Sci. Eng. C 2011, 31, 1189–1194. [Google Scholar] [CrossRef]
- Krause, T.; Molotnikov, A.; Carlesso, M.; Rente, J.; Rezwan, K.; Estrin, Y.; Koch, D. Mechanical Properties of Topologically Interlocked Structures with Elements Produced by Freeze Gelation of Ceramic Slurries. Adv. Eng. Mater. 2012, 14, 335–341. [Google Scholar] [CrossRef]
- Carlesso, M.; Giacomelli, R.; Krause, T.; Molotnikov, A.; Koch, D.; Kroll, S.; Tushtev, K.; Estrin, Y.; Rezwan, K. Improvement of sound absorption and flexural compliance of porous alumina-mullite ceramics by engineering the microstructure and segmentation into topologically interlocked blocks. J. Eur. Ceram. Soc. 2013, 33, 2549–2558. [Google Scholar] [CrossRef]
- Sutton, M.A.; Orteu, J.J.; Schreier, H.W. Image Correlation for Shape, Motion and Deformation Measurements; Springer: Boston, MA, USA, 2009; p. 332. [Google Scholar] [CrossRef]
- Kibitkin, V.; Solodushkin, A.; Pleshanov, V.; Napryushkin, A. On a choice of input parameters for calculation the vector field and deformation with DIC. Measurement 2017, 95, 266–272. [Google Scholar] [CrossRef]
- Suna, Y.; Zhang, X.; Shao, Z.; Lia, Q.M. Image-based correlation between the meso-scale structure and deformation of closed-cell foam. Mater. Sci. Eng. A 2017, 688, 27–39. [Google Scholar] [CrossRef] [Green Version]
- Statnik, E.S.; Dragu, C.; Besnard, C.; Lunt, A.J.; Salimon, A.I.; Maksimkin, A.; Korsunsky, A.M. Multi-Scale Digital Image Correlation Analysis of In Situ Deformation of Open-Cell Porous Ultra-High Molecular Weight Polyethylene Foam. Polymers 2020, 12, 2607. [Google Scholar] [CrossRef]
- Loa, C.; Sano, T.; Hogan, J.D. Microstructural and mechanical characterization of variability in porous advanced ceramics using X-ray computed tomography and digital image correlation. Mater. Charact. 2019, 158, 109929. [Google Scholar] [CrossRef]
- Savchenko, N.L.; Kibitkin, V.V.; Grigoriev, M.V. Characterization of deformation and damage process of alumina-based ceramics by DIC technique. In AIP Conference Proceedings; AIP Publishing LLC: Melville, NY, USA, 2019; Volume 2167, p. 020312. [Google Scholar] [CrossRef]
- Grigoriev, M.V.; Kibitkin, V.V.; Savchenko, N.L.; Utyaganova, V.R. In-situ study of mechanical damage evolution of segmented ceramic using digital image correlation. In AIP Conference Proceedings; AIP Publishing LLC: Melville, NY, USA, 2019; Volume 2167, p. 020118. [Google Scholar] [CrossRef]
- Heap, M.J.; Vinciguerra, S.; Meredith, P.G. The evolution of elastic moduli with increasing crack damage during cyclic stressing of a basalt from Mt. Etna volcano. Tectonophysics 2009, 471, 153–160. [Google Scholar] [CrossRef]
- Heap, M.J.; Faulkner, D.R. Quantifying the evolution of static elastic properties as crystalline rock approaches failure. Int. J. Rock Mech. Min. Sci. 2008, 45, 564–573. [Google Scholar] [CrossRef]
- Louis, L.; Wong, T.-F.; Baud, P.; Tembe, S. Imaging strain localization by X-ray computed tomography: Discrete compaction bands in Diemelstadt sandstone. J. Struct. Geol. 2006, 28, 762–775. [Google Scholar] [CrossRef]
- Hill, R.E. Analysis of Deformation Bands in the Aztec Sandstone, Valley of Fire State Park, Nevada. Master’s Thesis, University of Nevada, Las Vegas, NV, USA, 1989. [Google Scholar] [CrossRef]
- Eichhubl, P.; Hooker, J.N.; Laubach, S.E. Pure and shear-enhanced compaction bands in Aztec Sandstone. J. Struct. Geol. 2010, 32, 1873–1886. [Google Scholar] [CrossRef]
- Charalampidou, E.-M.; Hall, S.A.; Stanchits, S.; Lewis, H.; Viggiani, G. Characterization of shear and compaction bands in a porous sandstone deformed under triaxial compression. Tectonophysics 2011, 503, 8–17. [Google Scholar] [CrossRef]
- Iwashita, K.; Oda, M. Rolling resistance at contacts in simulation of shear band development by DEM. J. Eng. Mech. 1998, 124, 285–292. [Google Scholar] [CrossRef]
- Ma, G.; Zhou, W.; Chang, X.-L.; Ng, T.-T.; Yang, L.-F. Formation of shear bands in crushable and irregularly shaped granular materials and the associated microstructural evolution. Powder Technol. 2016, 301, 118–130. [Google Scholar] [CrossRef]
- Wang, J.; Yan, H. On the role of particle breakage in the shear failure behavior of granular soils by DEM. Int. J. Numer. Anal. Methods Geomech. 2013, 37, 832–854. [Google Scholar] [CrossRef]
- Hwa, L.C.; Rajoo, S.; Noor, A.M.; Ahmad, N.; Uday, M.B. Recent advances in 3D printing of porous ceramics: A review. Curr. Opin. Solid State Mater. Sci. 2017, 21, 323–347. [Google Scholar] [CrossRef]
- Wu, J.-M.; Li, M.; Liu, S.-S.; Shi, Y.-S.; Li, C.-H.; Wang, W. Selective laser sintering of porous Al2O3-based ceramics using both Al2O3 and SiO2 poly-hollow microspheres as raw materials. Ceram. Int. 2021, 47, 15313–15318. [Google Scholar] [CrossRef]
- Wu, J.-M.; Li, M.; Liu, S.-S.; Shi, Y.-S.; Li, C.-H.; Wang, W. Preparation of porous Al2O3 ceramics with enhanced properties by SLS using Al2O3 poly-hollow microspheres (PHMs) coated with CaSiO3 sintering additive. Ceram. Int. 2020, 46, 26888–26894. [Google Scholar] [CrossRef]
- Dong, Y.; Jiang, H.; Chen, A.; Yang, T.; Zou, T.; Xu, D. Porous Al2O3 ceramics with spontaneously formed pores and enhanced strength prepared by indirect selective laser sintering combined with reaction bonding. Ceram. Int. 2020, 46, 15159–15166. [Google Scholar] [CrossRef]
- Camblor, M.A. The Synthetic Zeolites as Geoinspired Materials. Macla 2006, 6, 19–22. Available online: https://digital.csic.es/handle/10261/7703 (accessed on 14 September 2006).


Publisher’s Note: MDPI stays neutral with regard to jurisdictional claims in published maps and institutional affiliations. |
© 2021 by the authors. Licensee MDPI, Basel, Switzerland. This article is an open access article distributed under the terms and conditions of the Creative Commons Attribution (CC BY) license (https://creativecommons.org/licenses/by/4.0/).
Share and Cite
Kibitkin, V.; Grigoriev, M.; Burlachenko, A.; Solodushkin, A.; Savchenko, N.; Rubtsov, V.; Tarasov, S. In Situ Investigation of Strain Localization in Sintered, Porous Segmented Alumina. Materials 2021, 14, 3720. https://doi.org/10.3390/ma14133720
Kibitkin V, Grigoriev M, Burlachenko A, Solodushkin A, Savchenko N, Rubtsov V, Tarasov S. In Situ Investigation of Strain Localization in Sintered, Porous Segmented Alumina. Materials. 2021; 14(13):3720. https://doi.org/10.3390/ma14133720
Chicago/Turabian StyleKibitkin, Vladimir, Mikhail Grigoriev, Alexander Burlachenko, Andrey Solodushkin, Nickolai Savchenko, Valery Rubtsov, and Sergei Tarasov. 2021. "In Situ Investigation of Strain Localization in Sintered, Porous Segmented Alumina" Materials 14, no. 13: 3720. https://doi.org/10.3390/ma14133720