
Rational Choice of Reinforcement of Reinforced Concrete Frame Corners Subjected to Opening Bending Moment


Abstract
:1. Introduction
- (1)
- Strut-and-tie method (S&T)—to calculate the required reinforcement and to calculate the efficiency factor.
- (2)
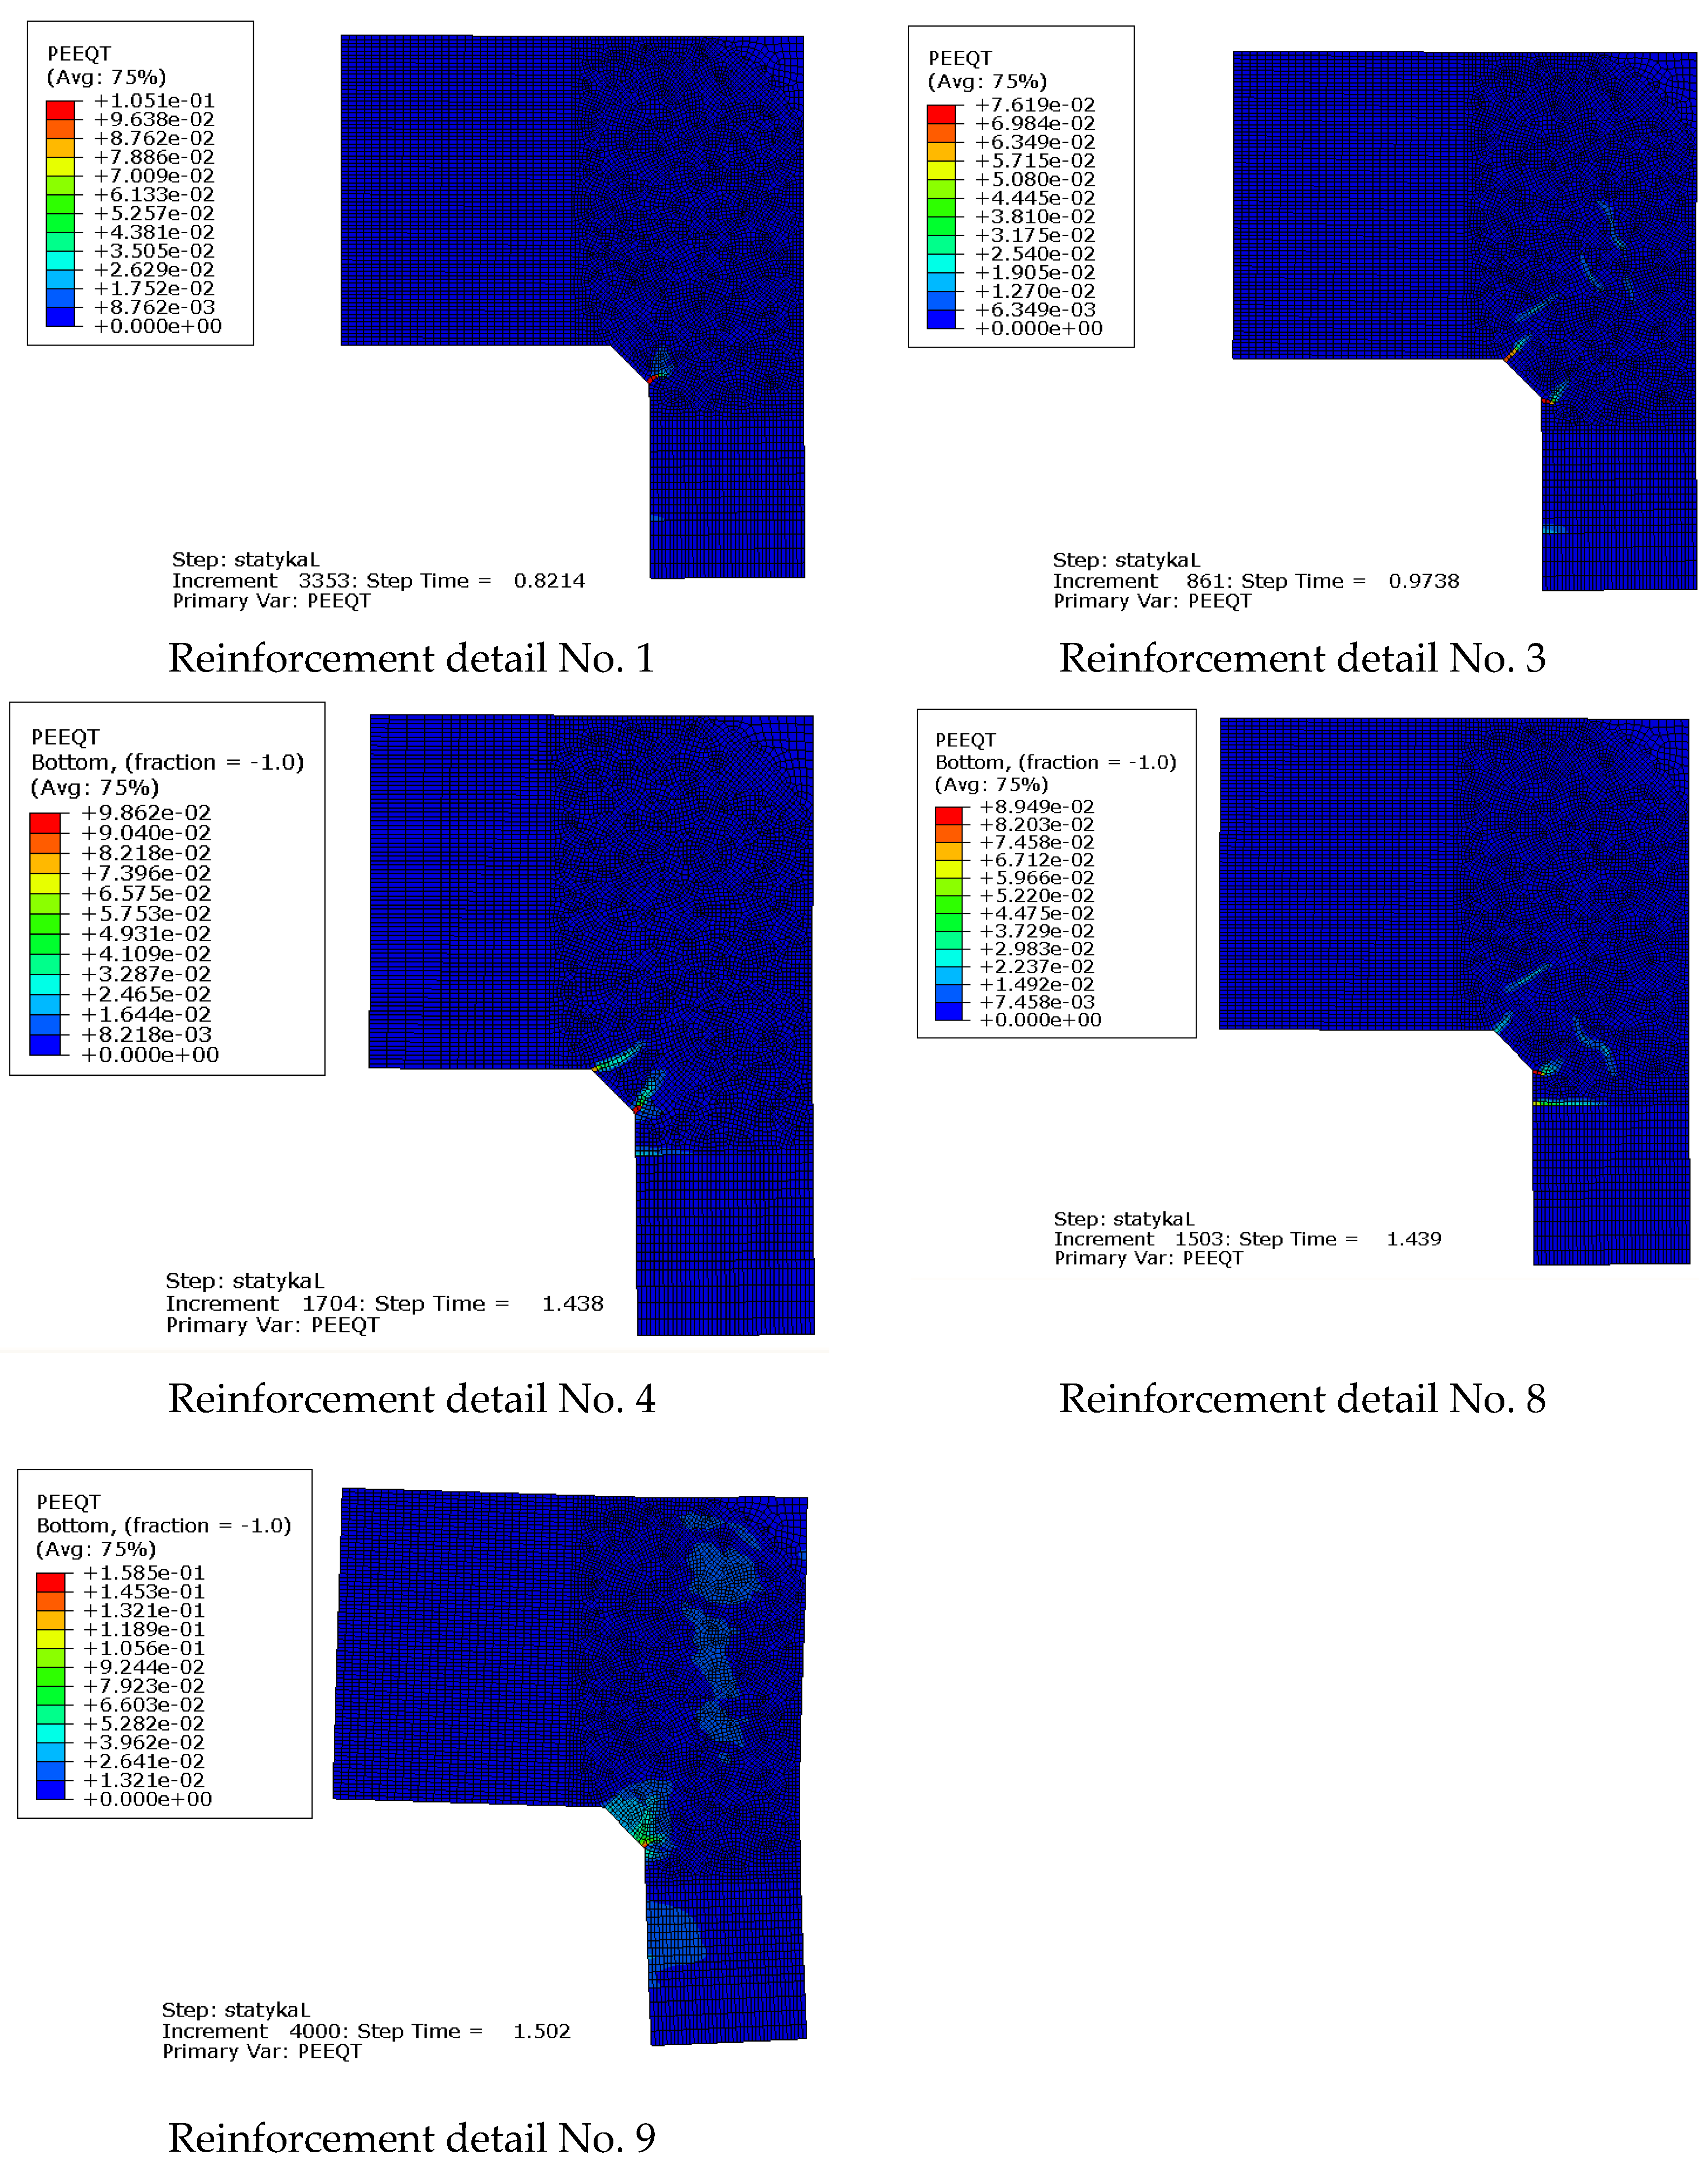
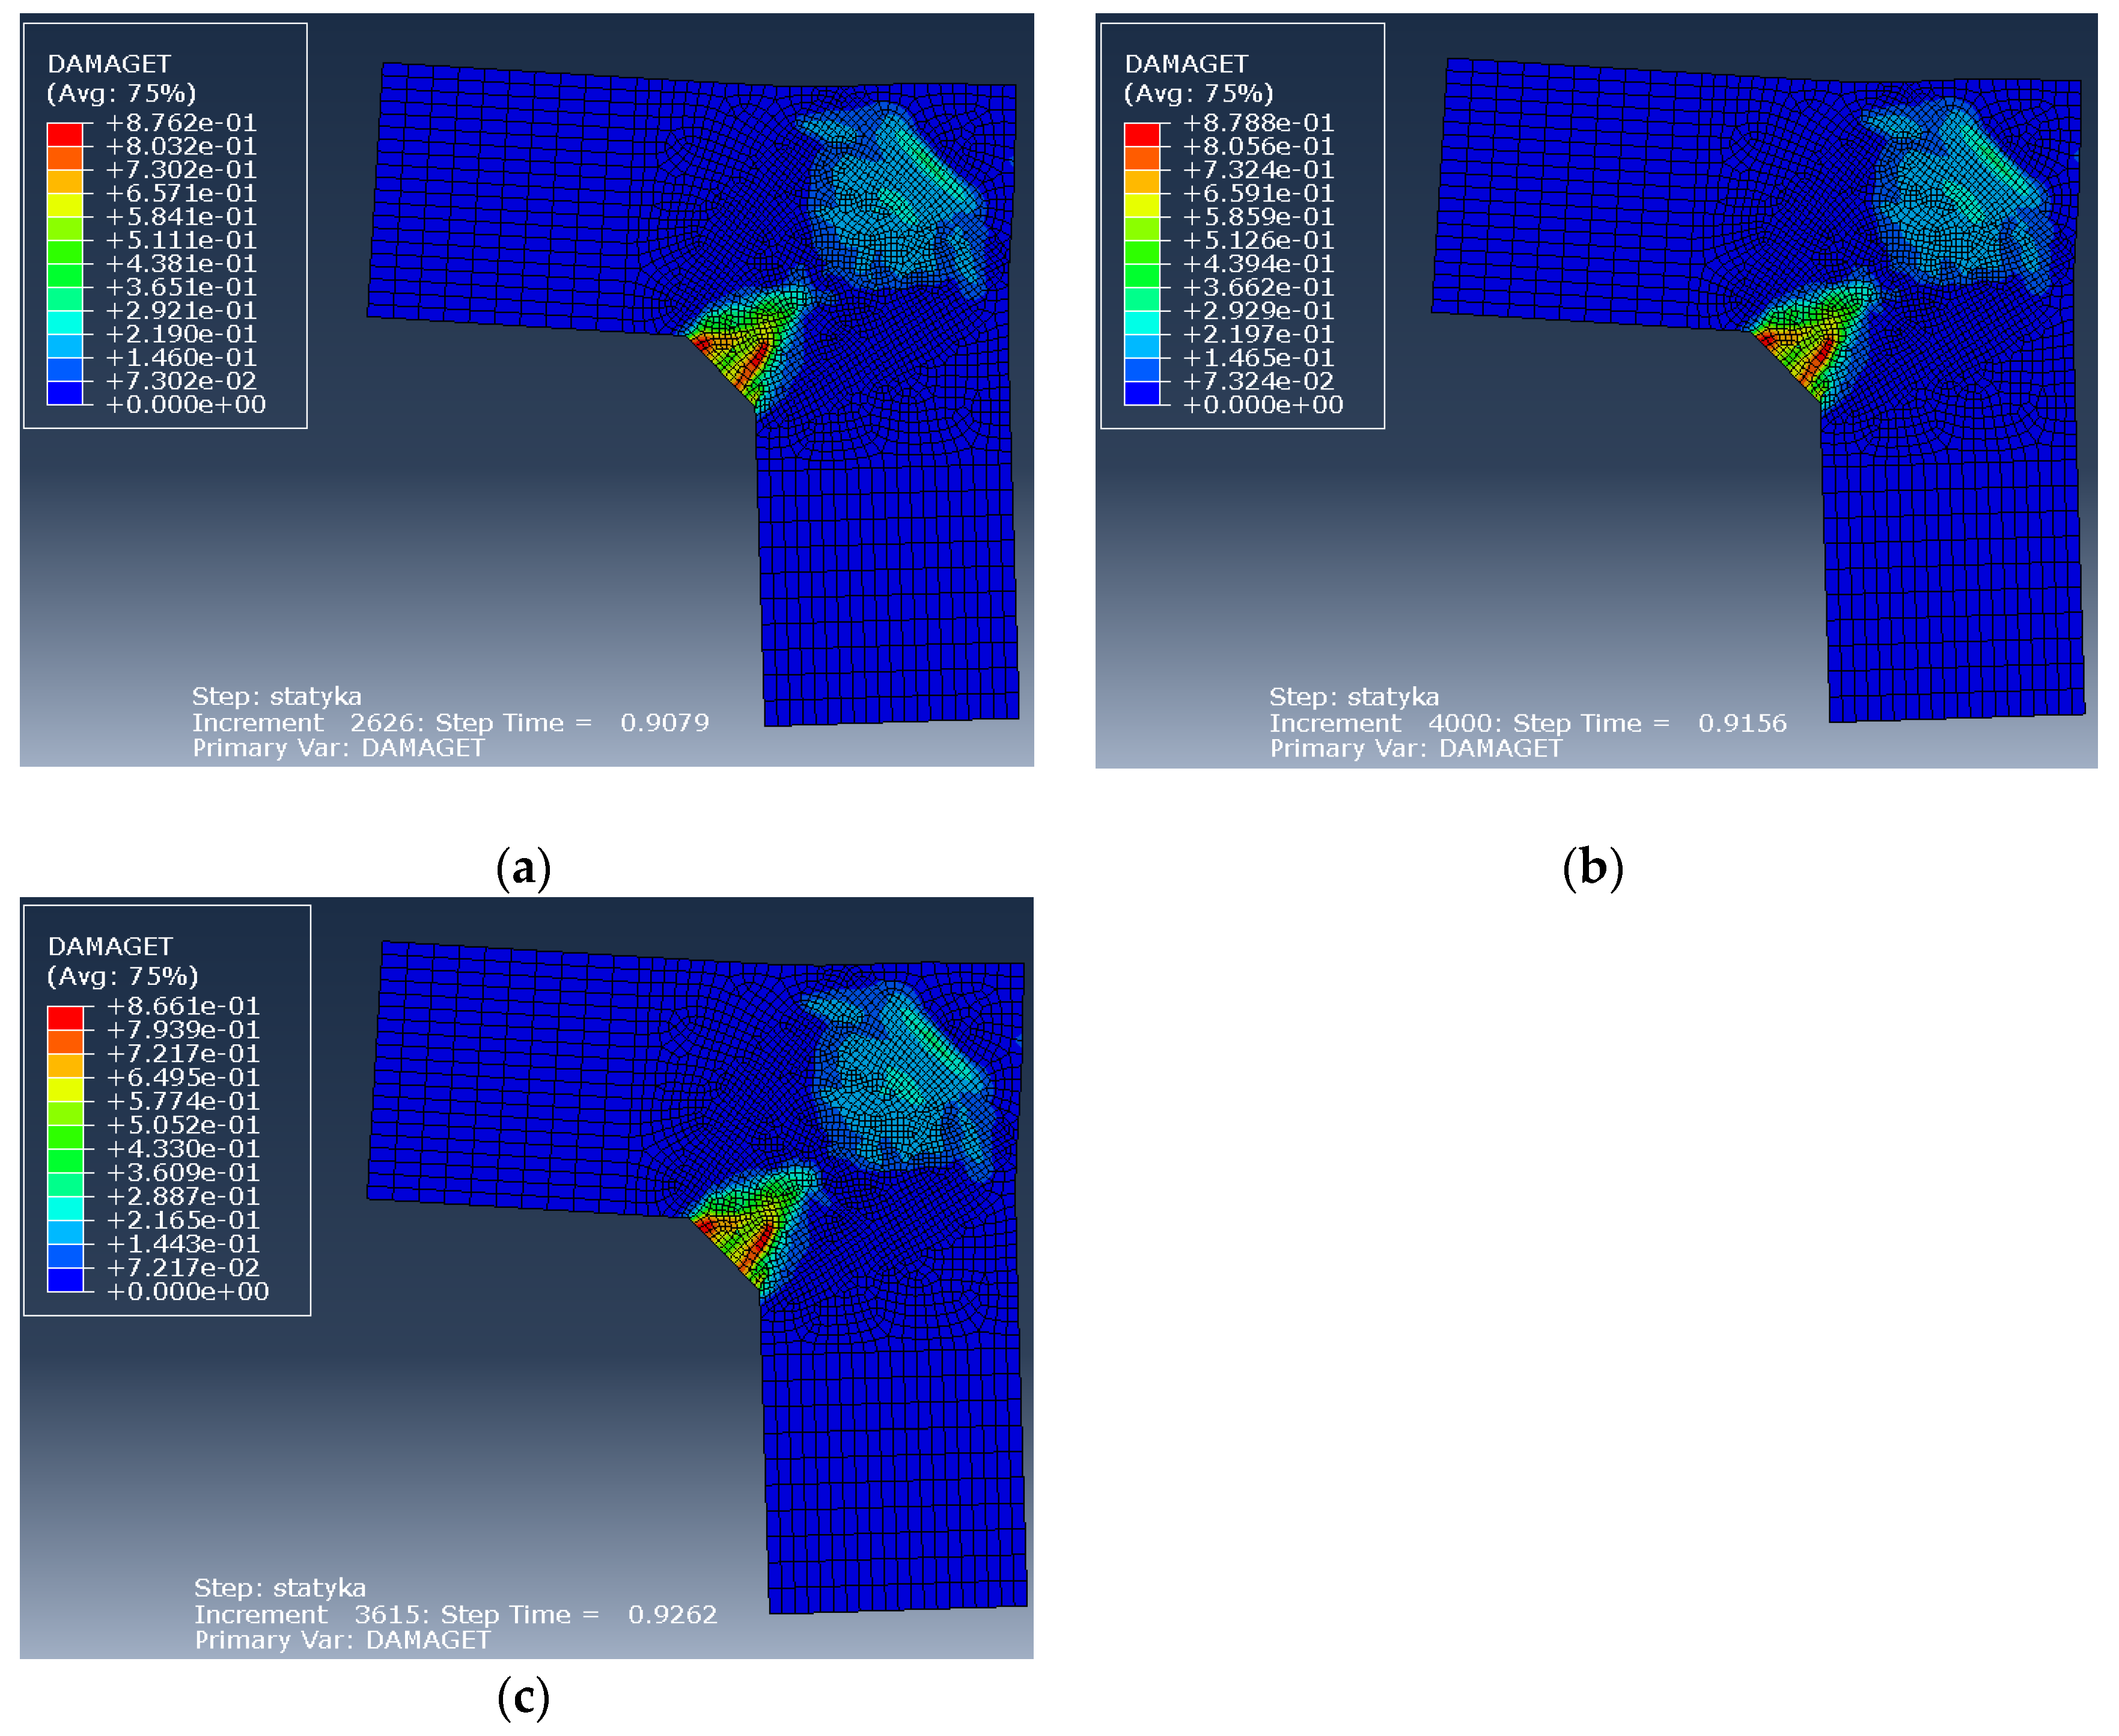
- Finite element method (FEM) in Abaqus software using the Concrete Damaged Plasticity (CDP) model for concrete—to calculate the efficiency factor and to recreate the history of loading, the yielding of steel and crack development.
2. Methodology
2.1. Strut-and-Tie Method
- In struts: σRd,max = fcd, where fcd denotes the design compressive strength if a strut is under compression only and 0.6ν’fcd if a strut is also in tension in a perpendicular direction, where (Equation (2)):
- In nodes: CCC node—σRd,max = ν’fcd, CCT node—σRd,max = 0.85ν’fcd, CTT node—σRd,max = 0.75ν’fcd.
2.2. Concrete Damaged Plasticity Model for Concrete in FEM Analysis
- (1)
- The stress–strain relationship defining a compressive behavior of concrete, usually in a form of a set of points;
- (2)
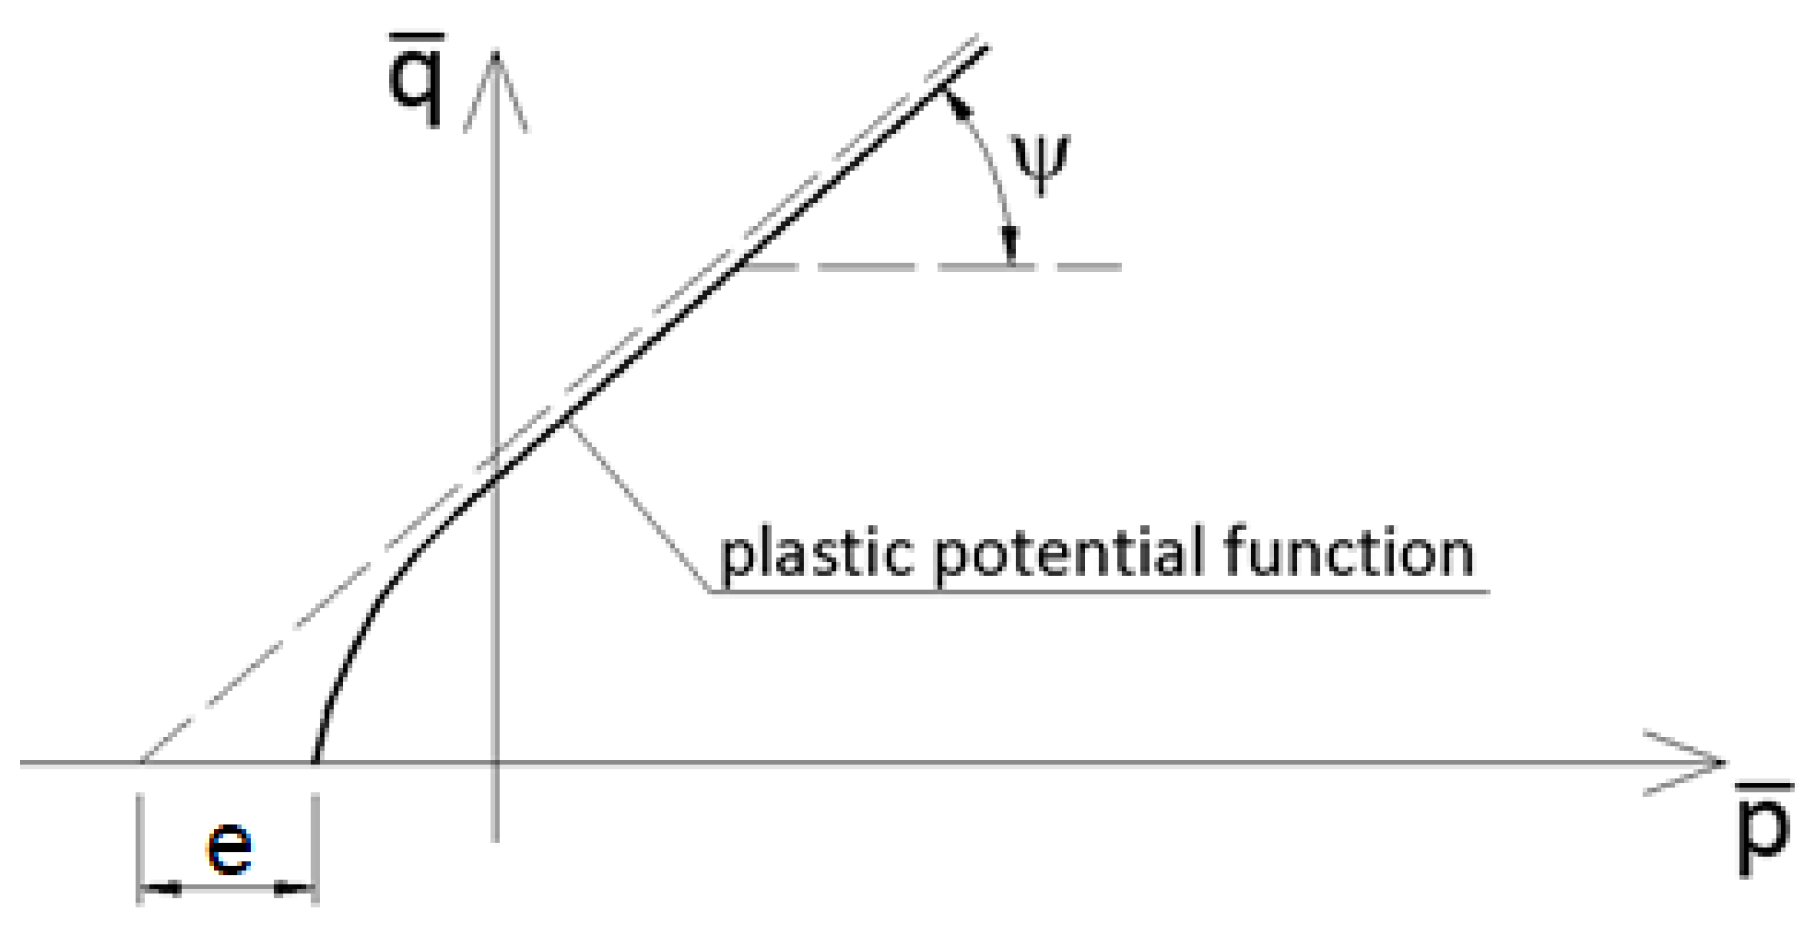
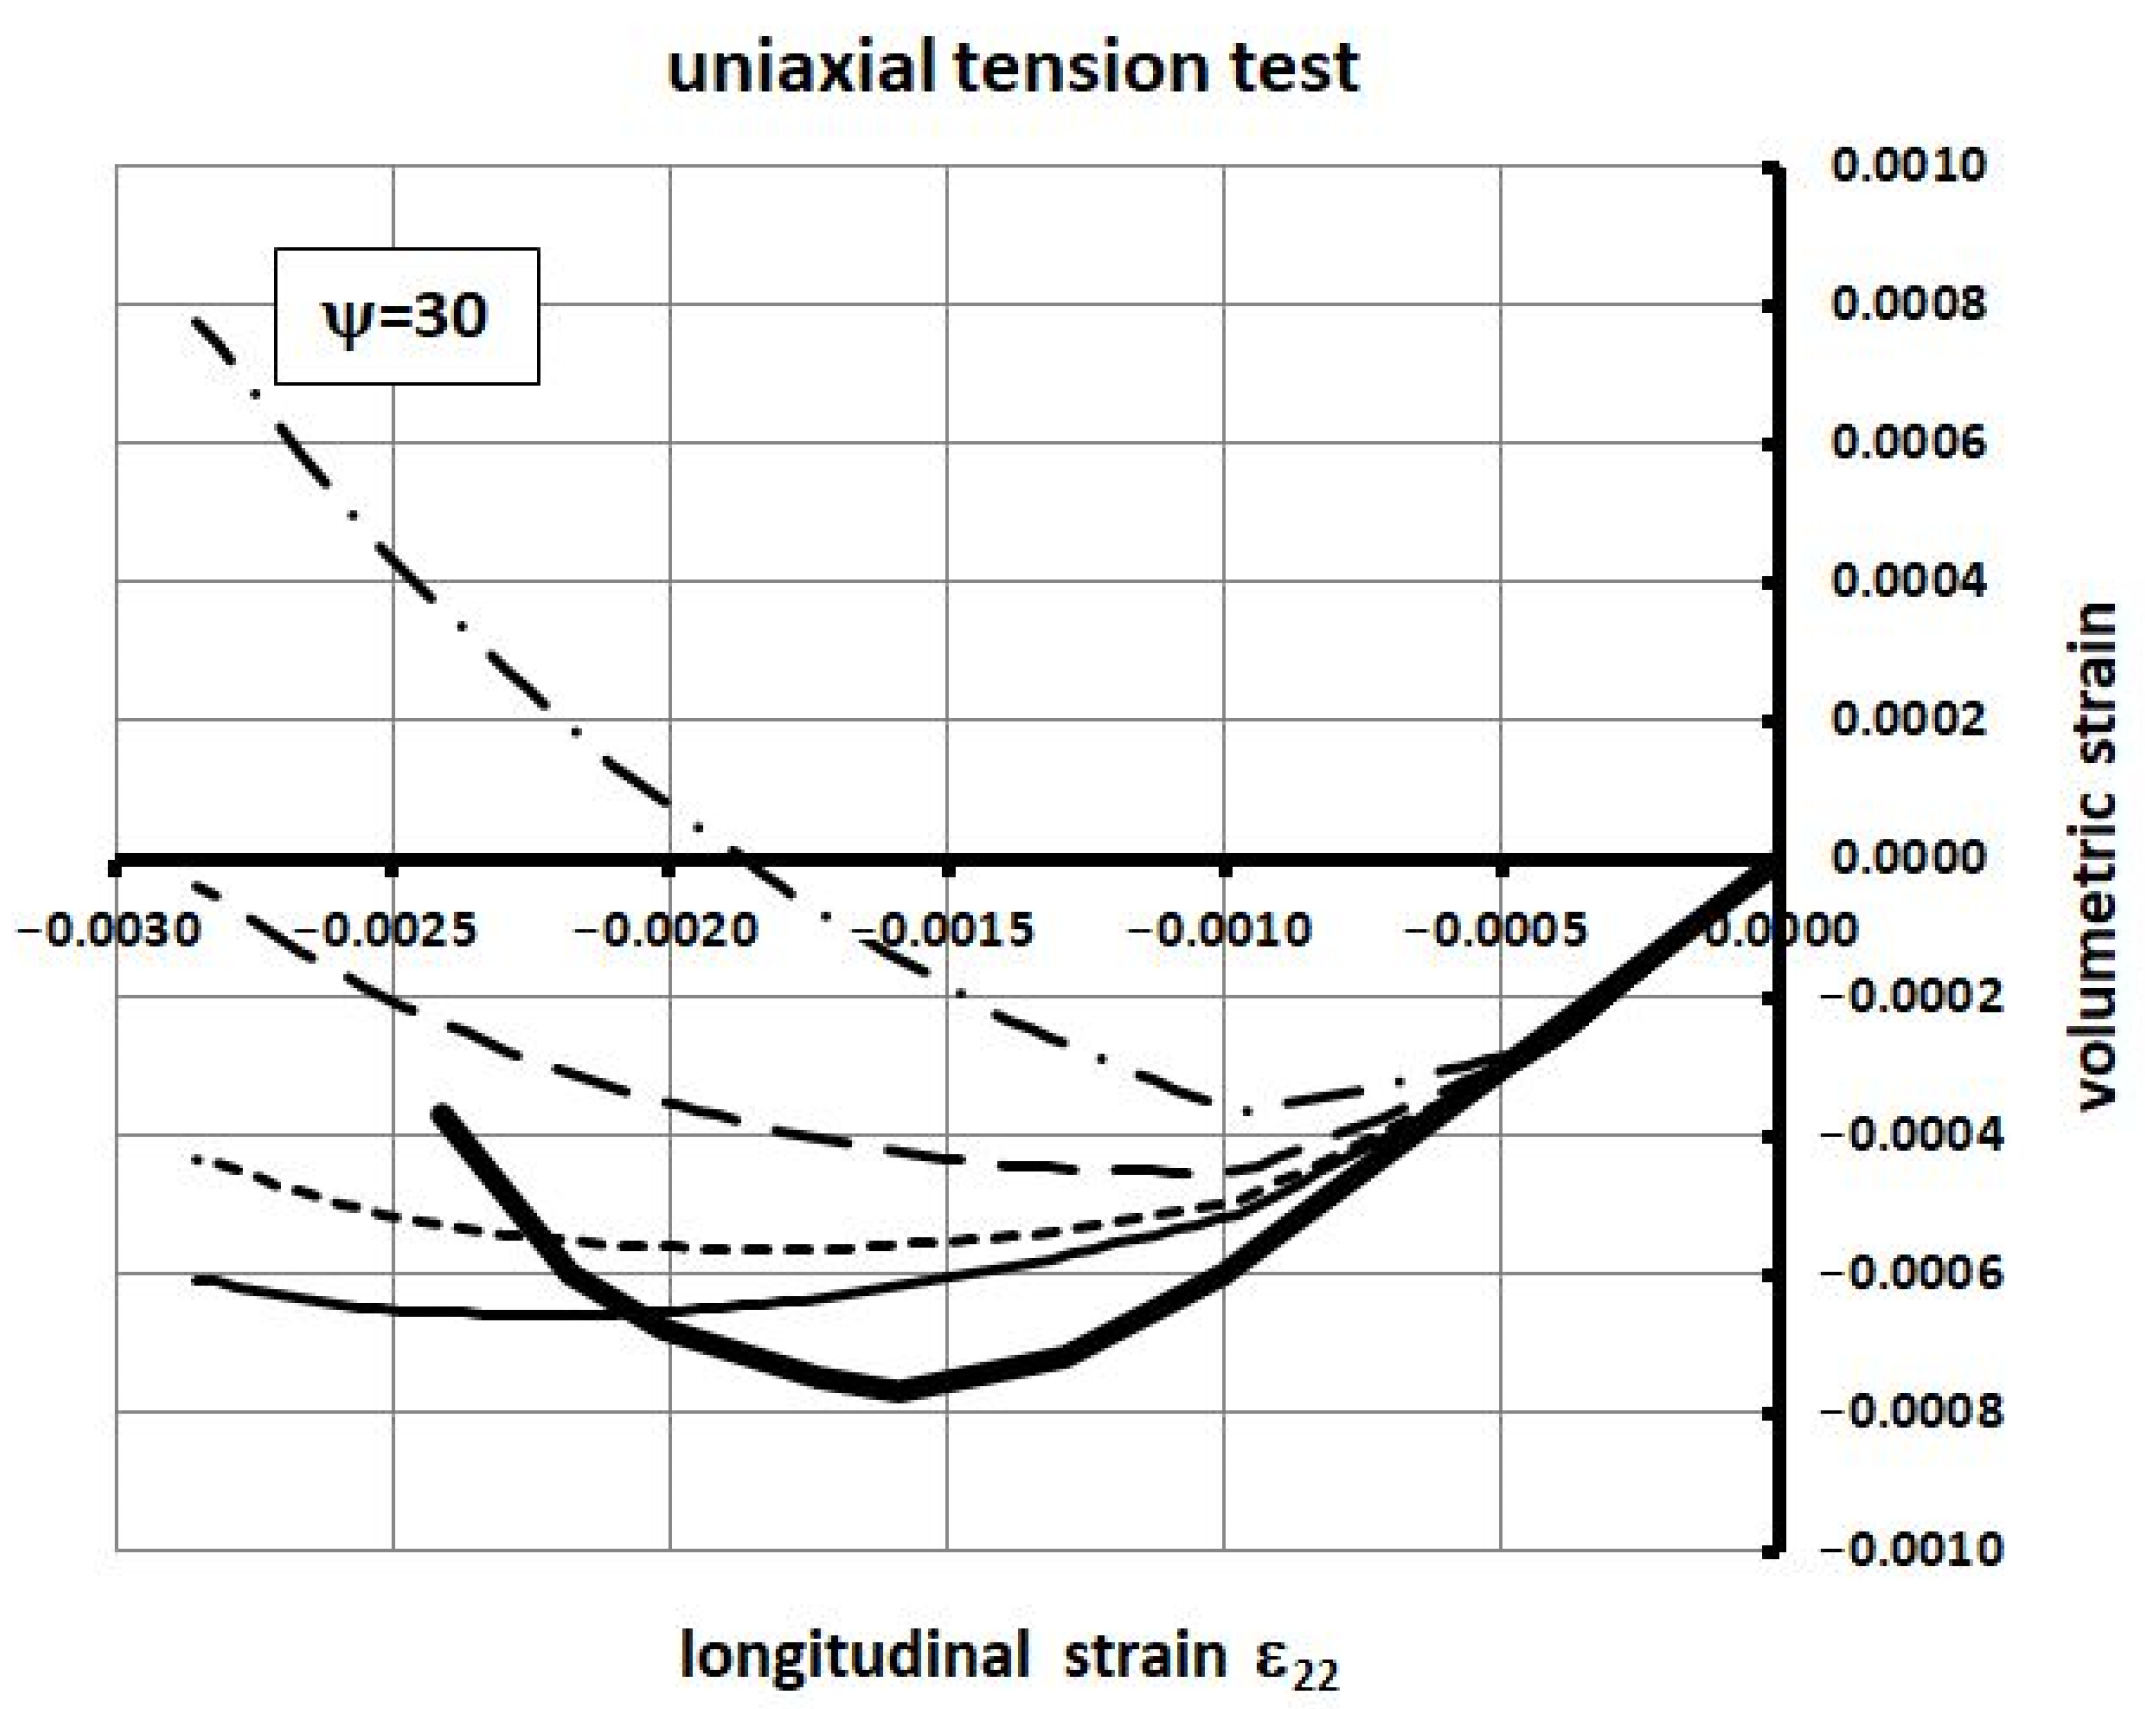
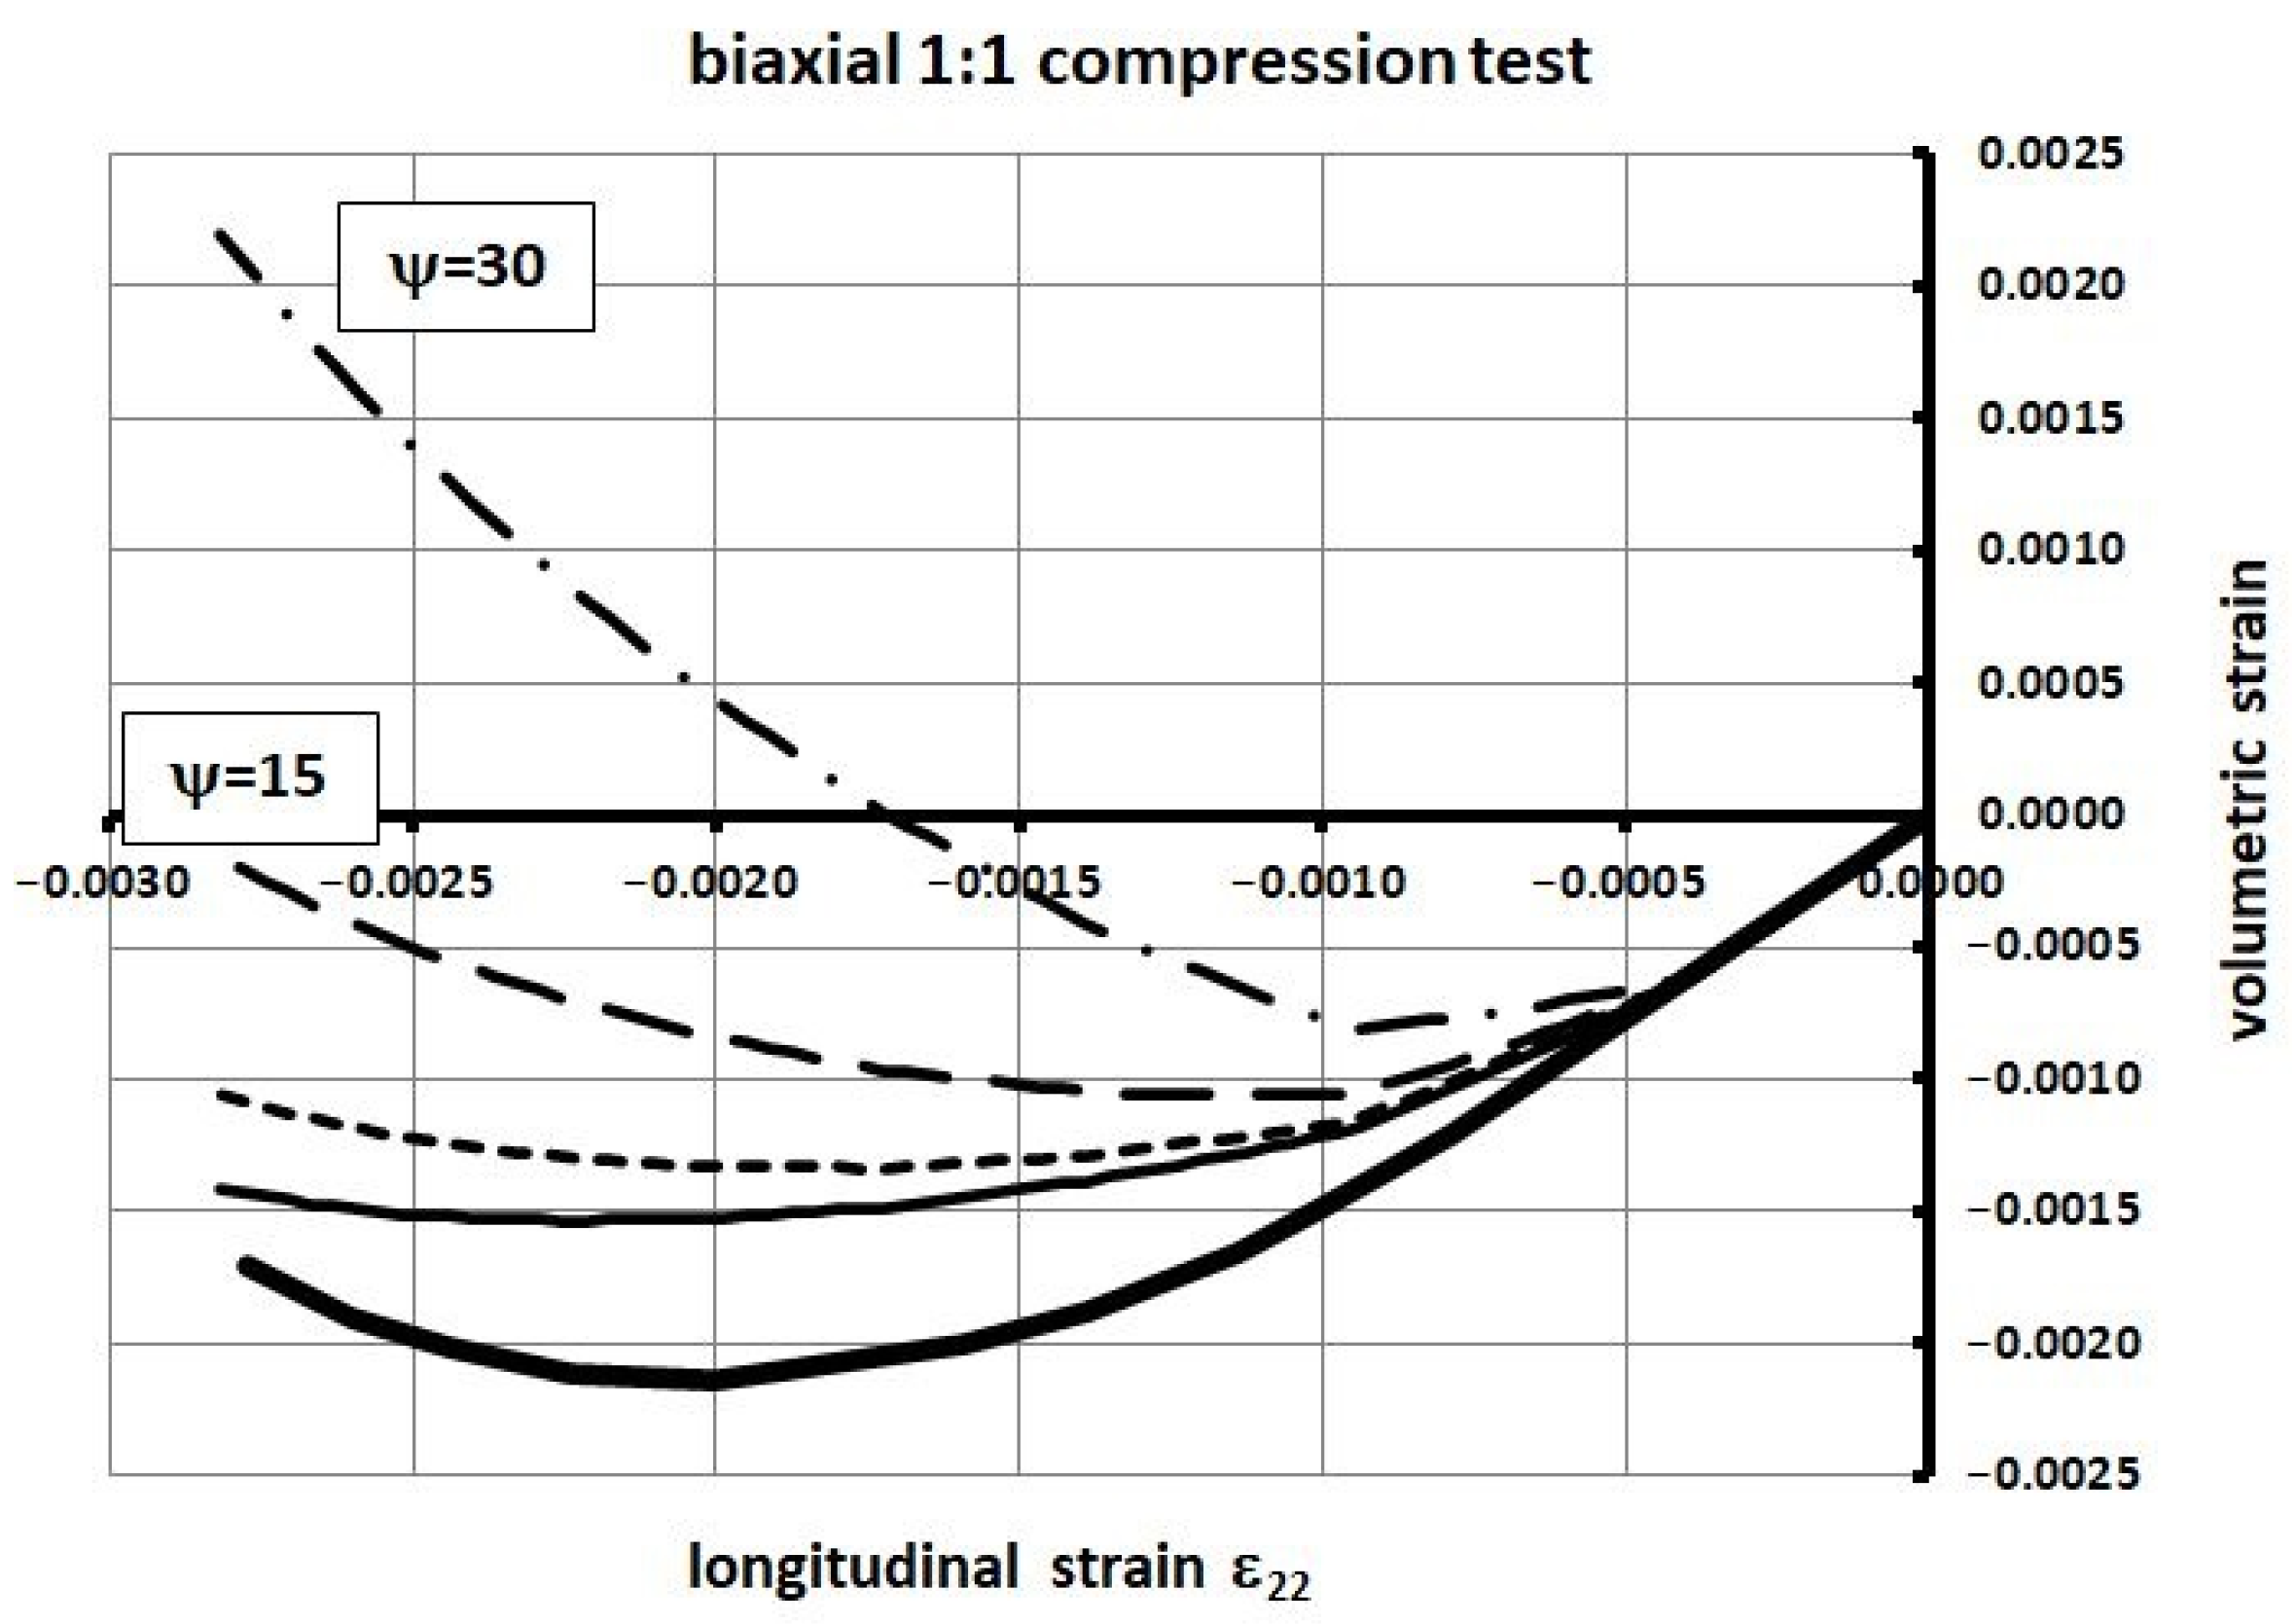
- The dilatation angle ψ in the plane;
- (3)
- The flow potential eccentricity e;
- (4)
- The ratio fb0/fc0 of the biaxial compressive strength to the uniaxial compressive strength;
- (5)
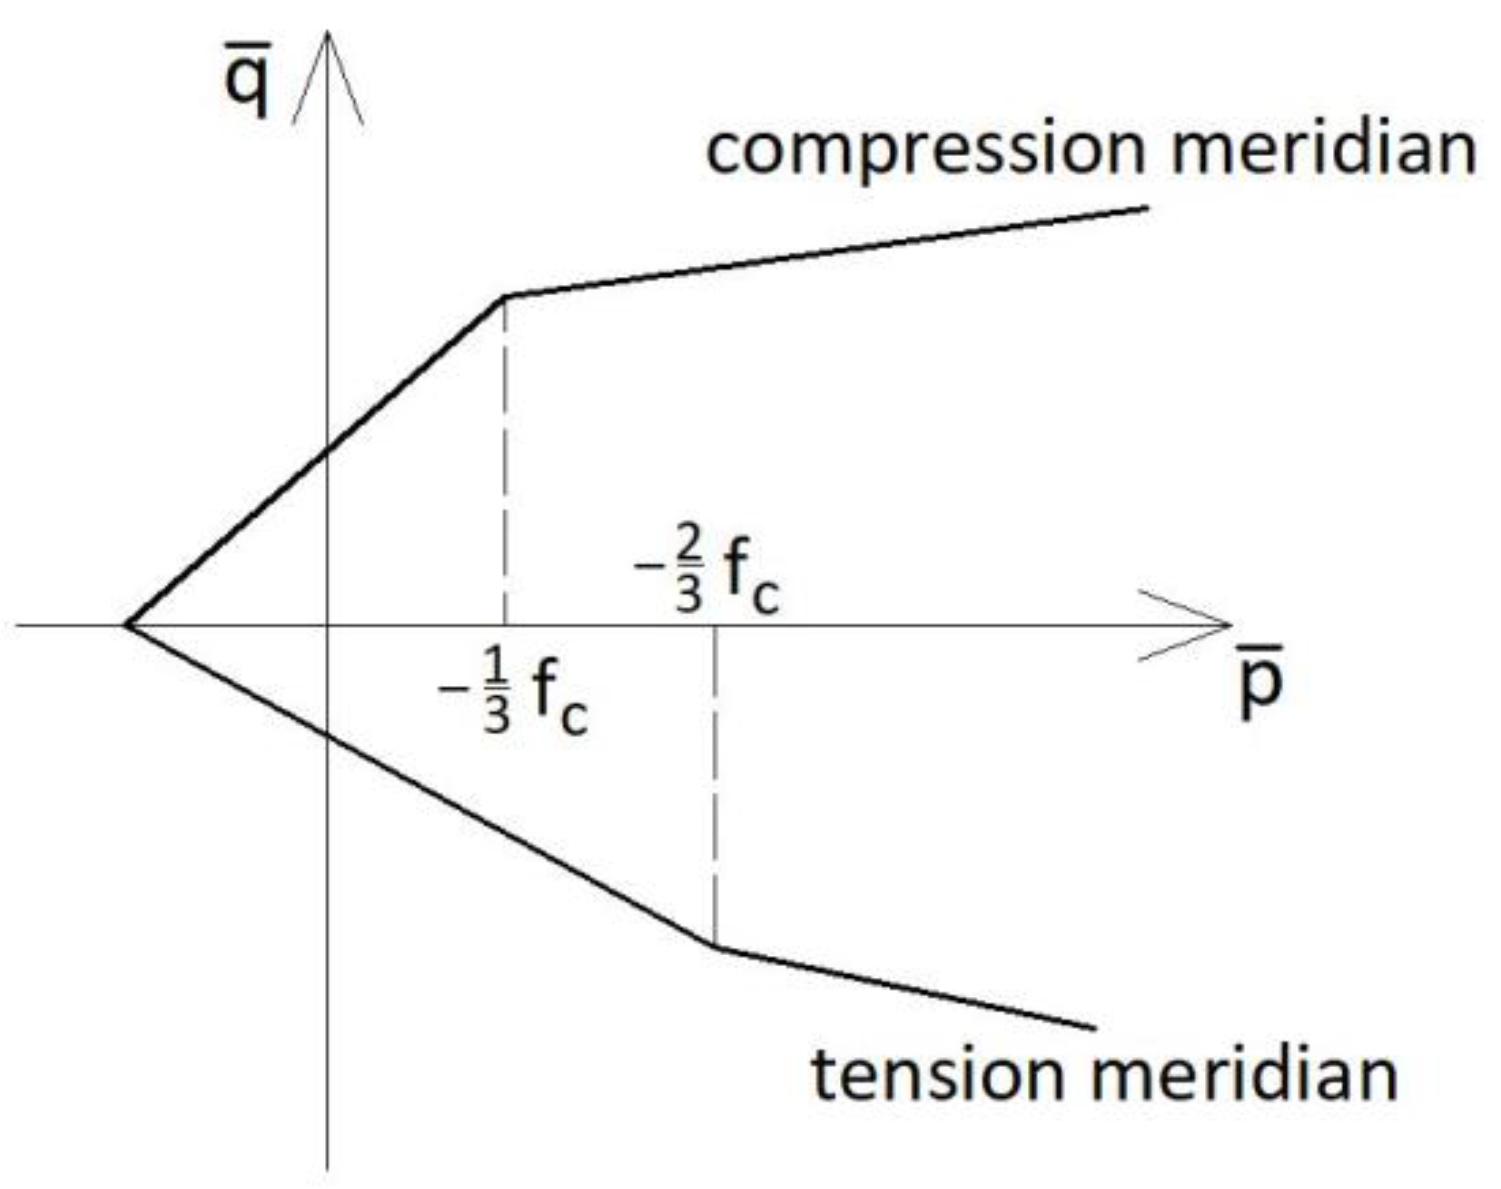
- The ratio K of the second stress invariant on the tensile meridian to that on the compressive meridian for the yield function;
- (6)
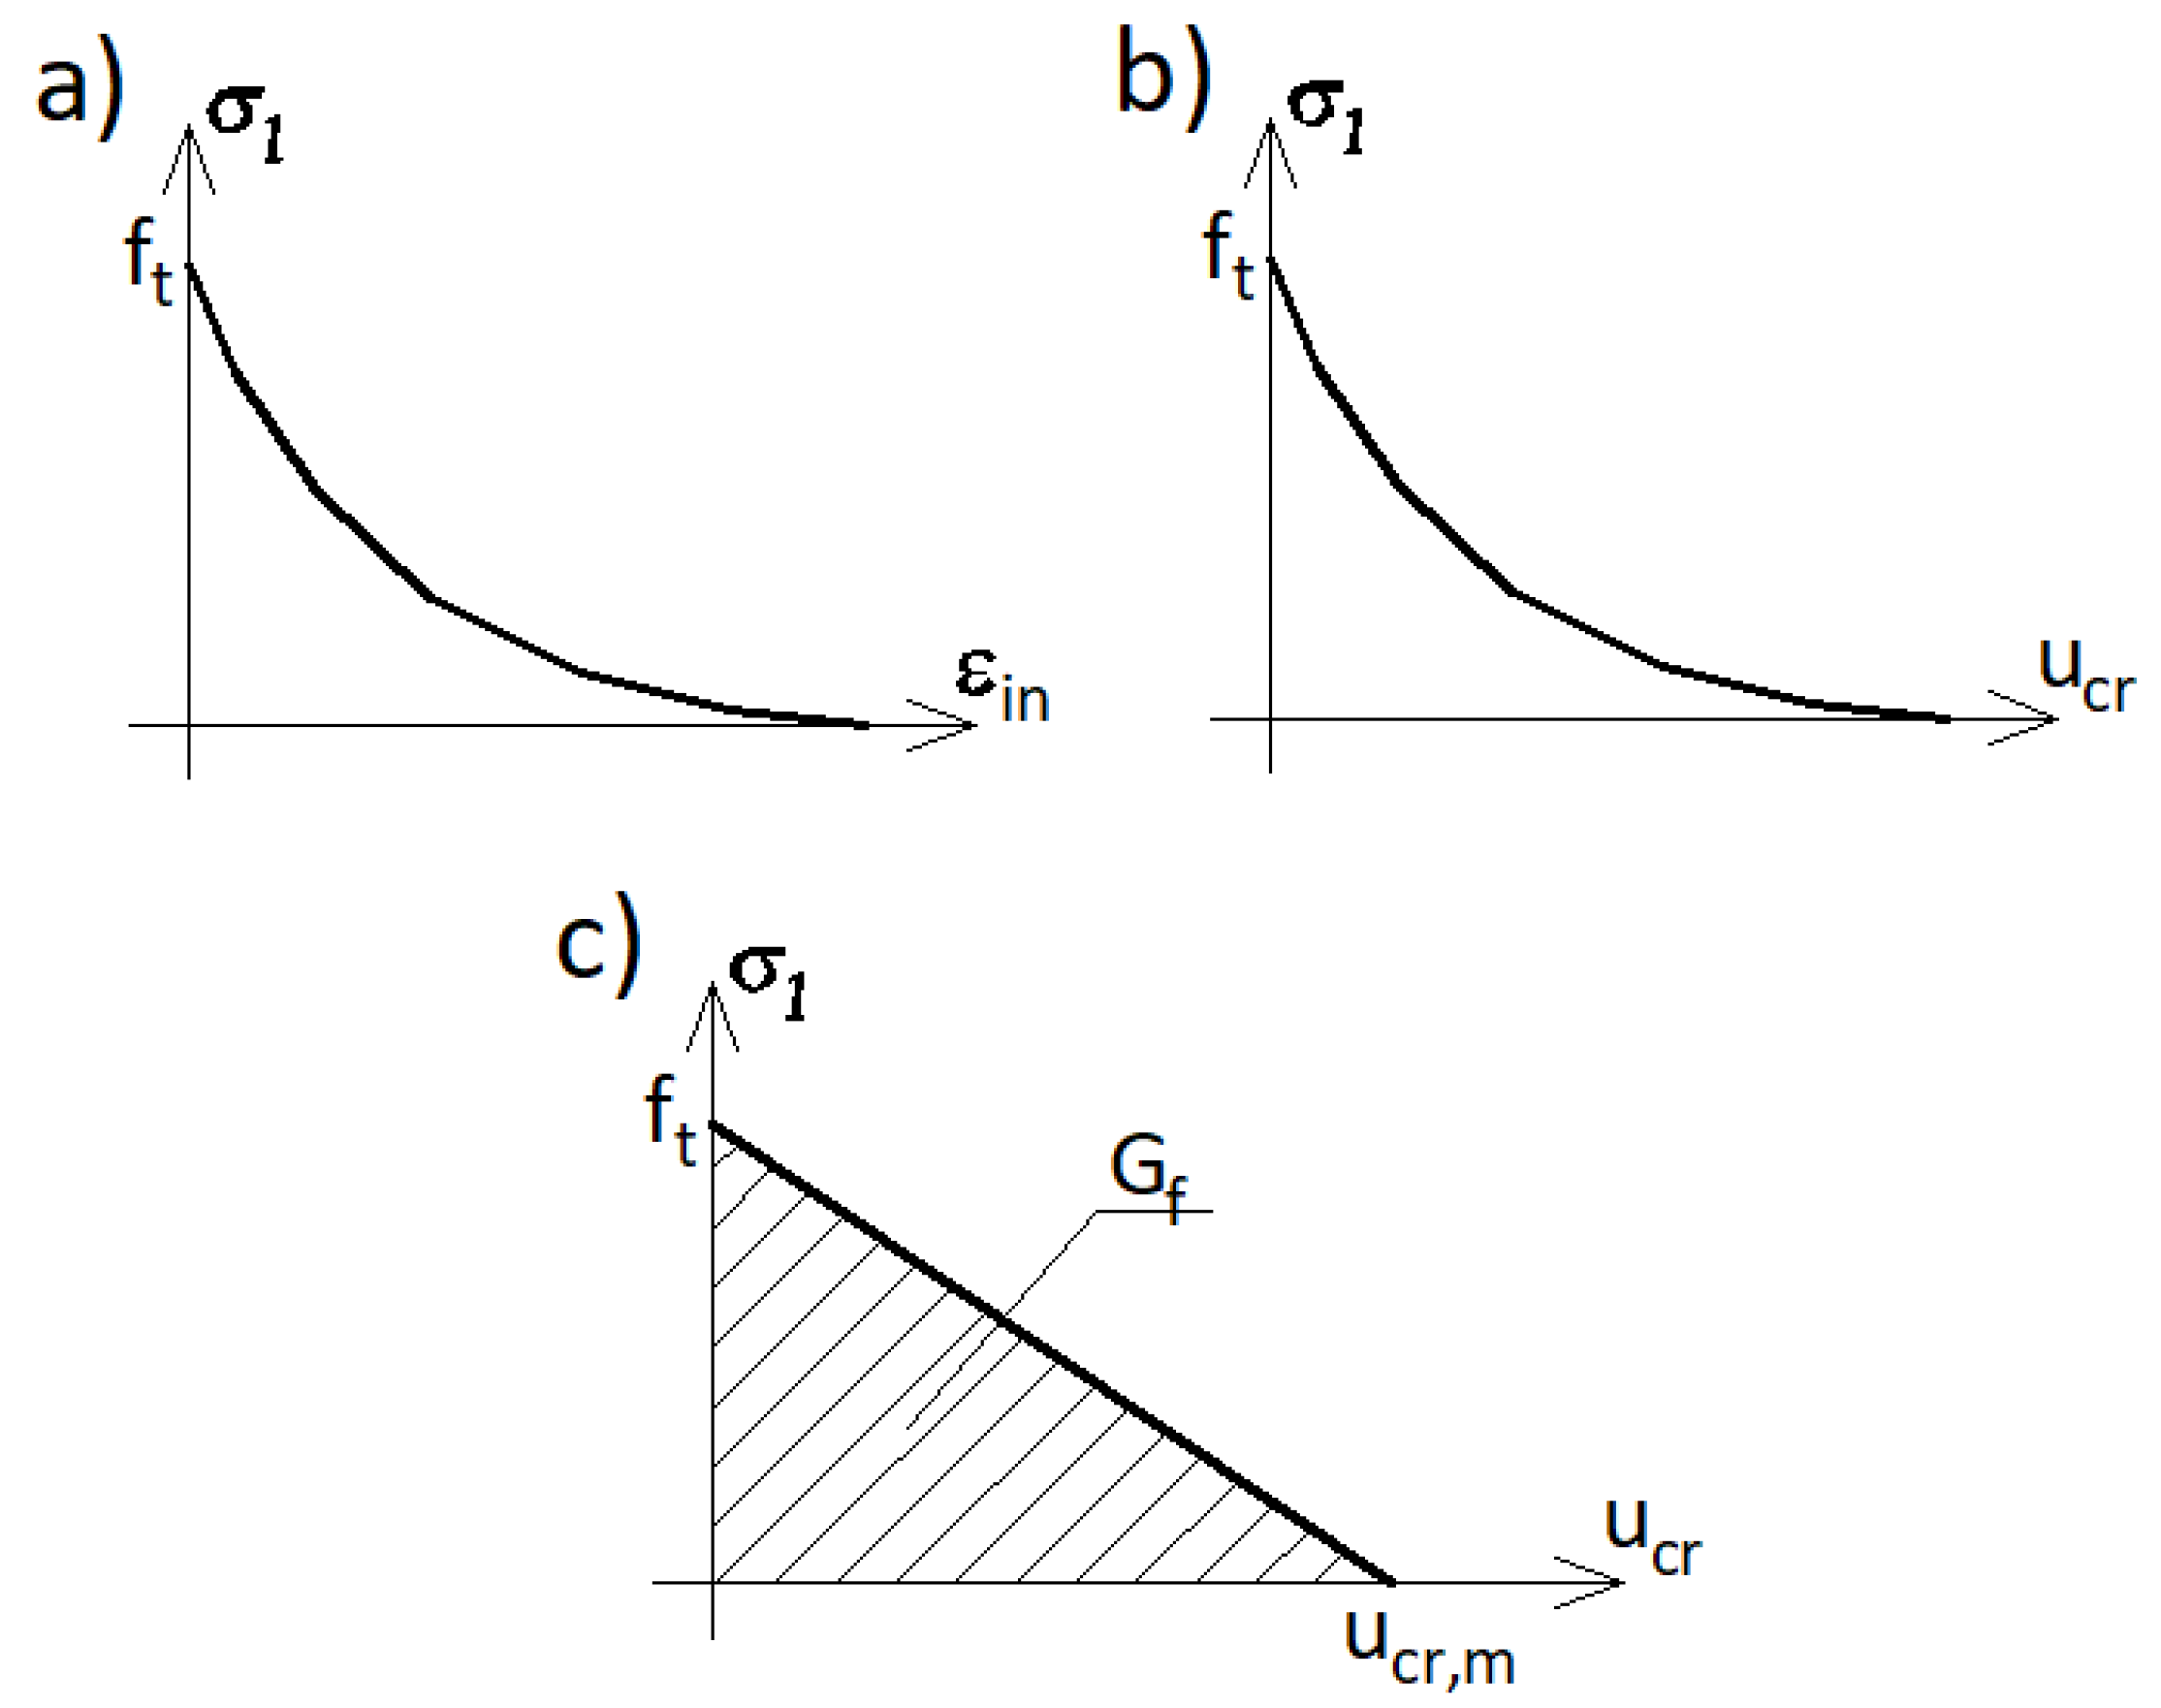
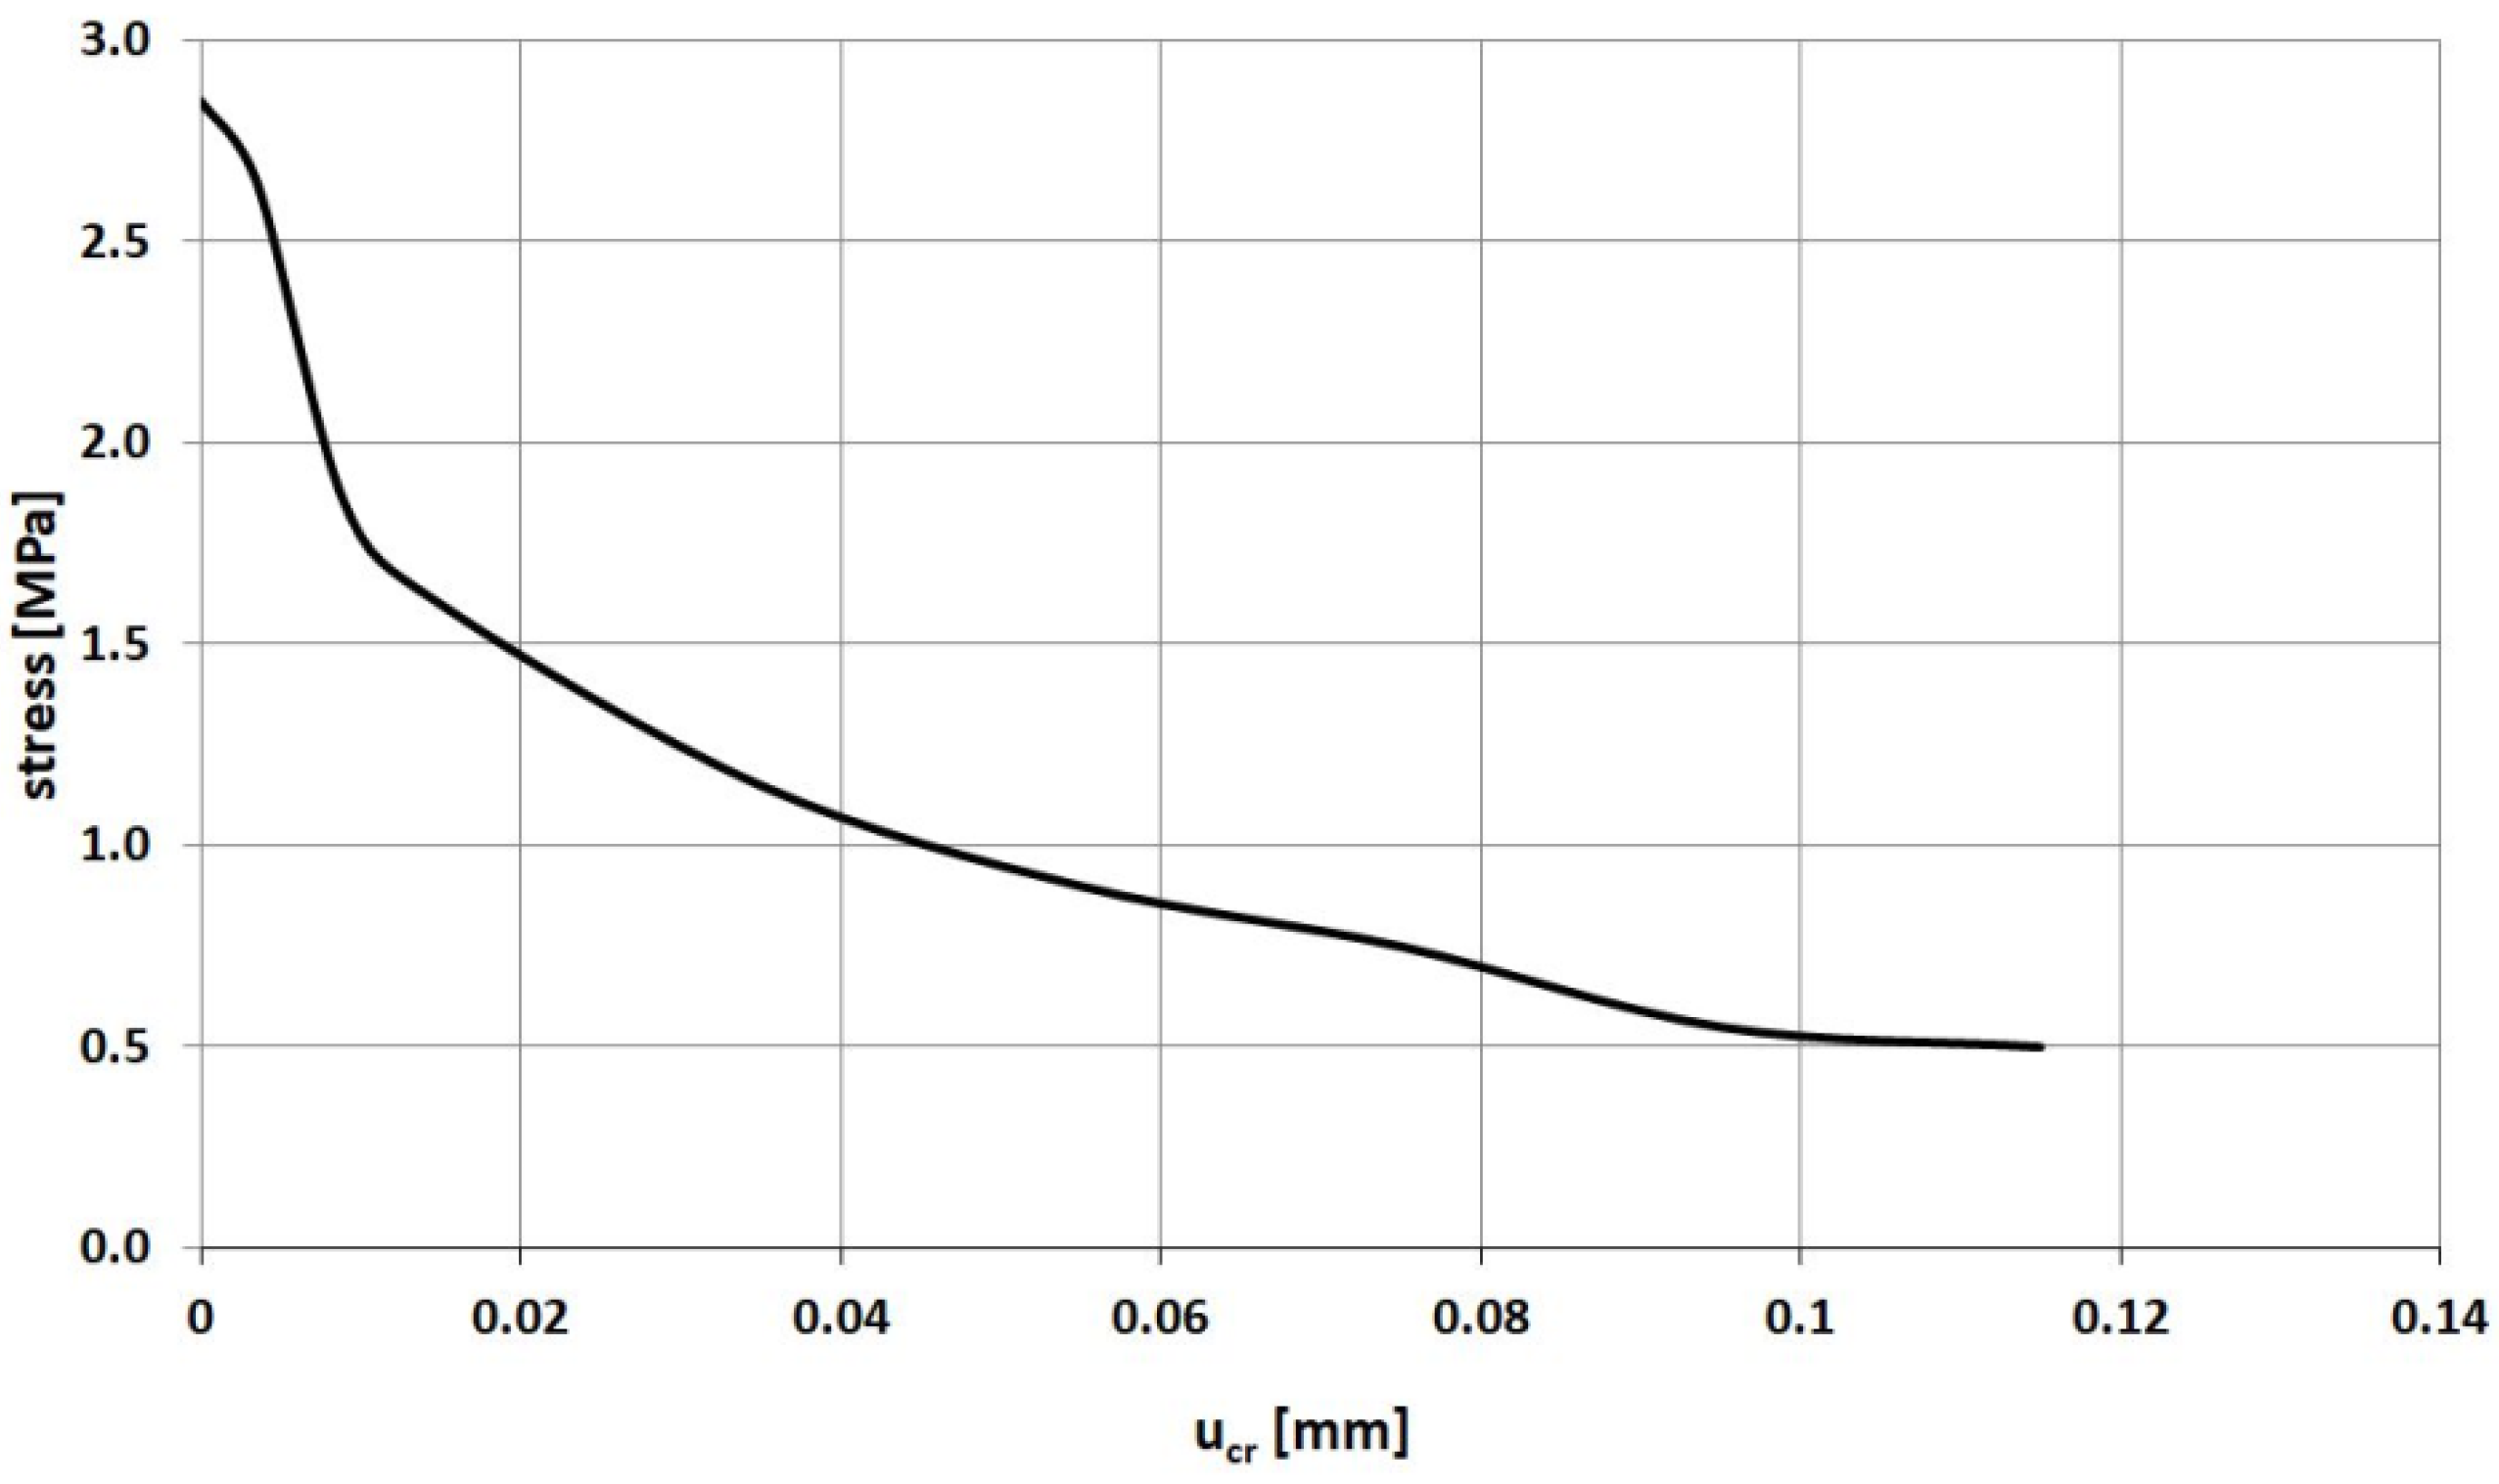
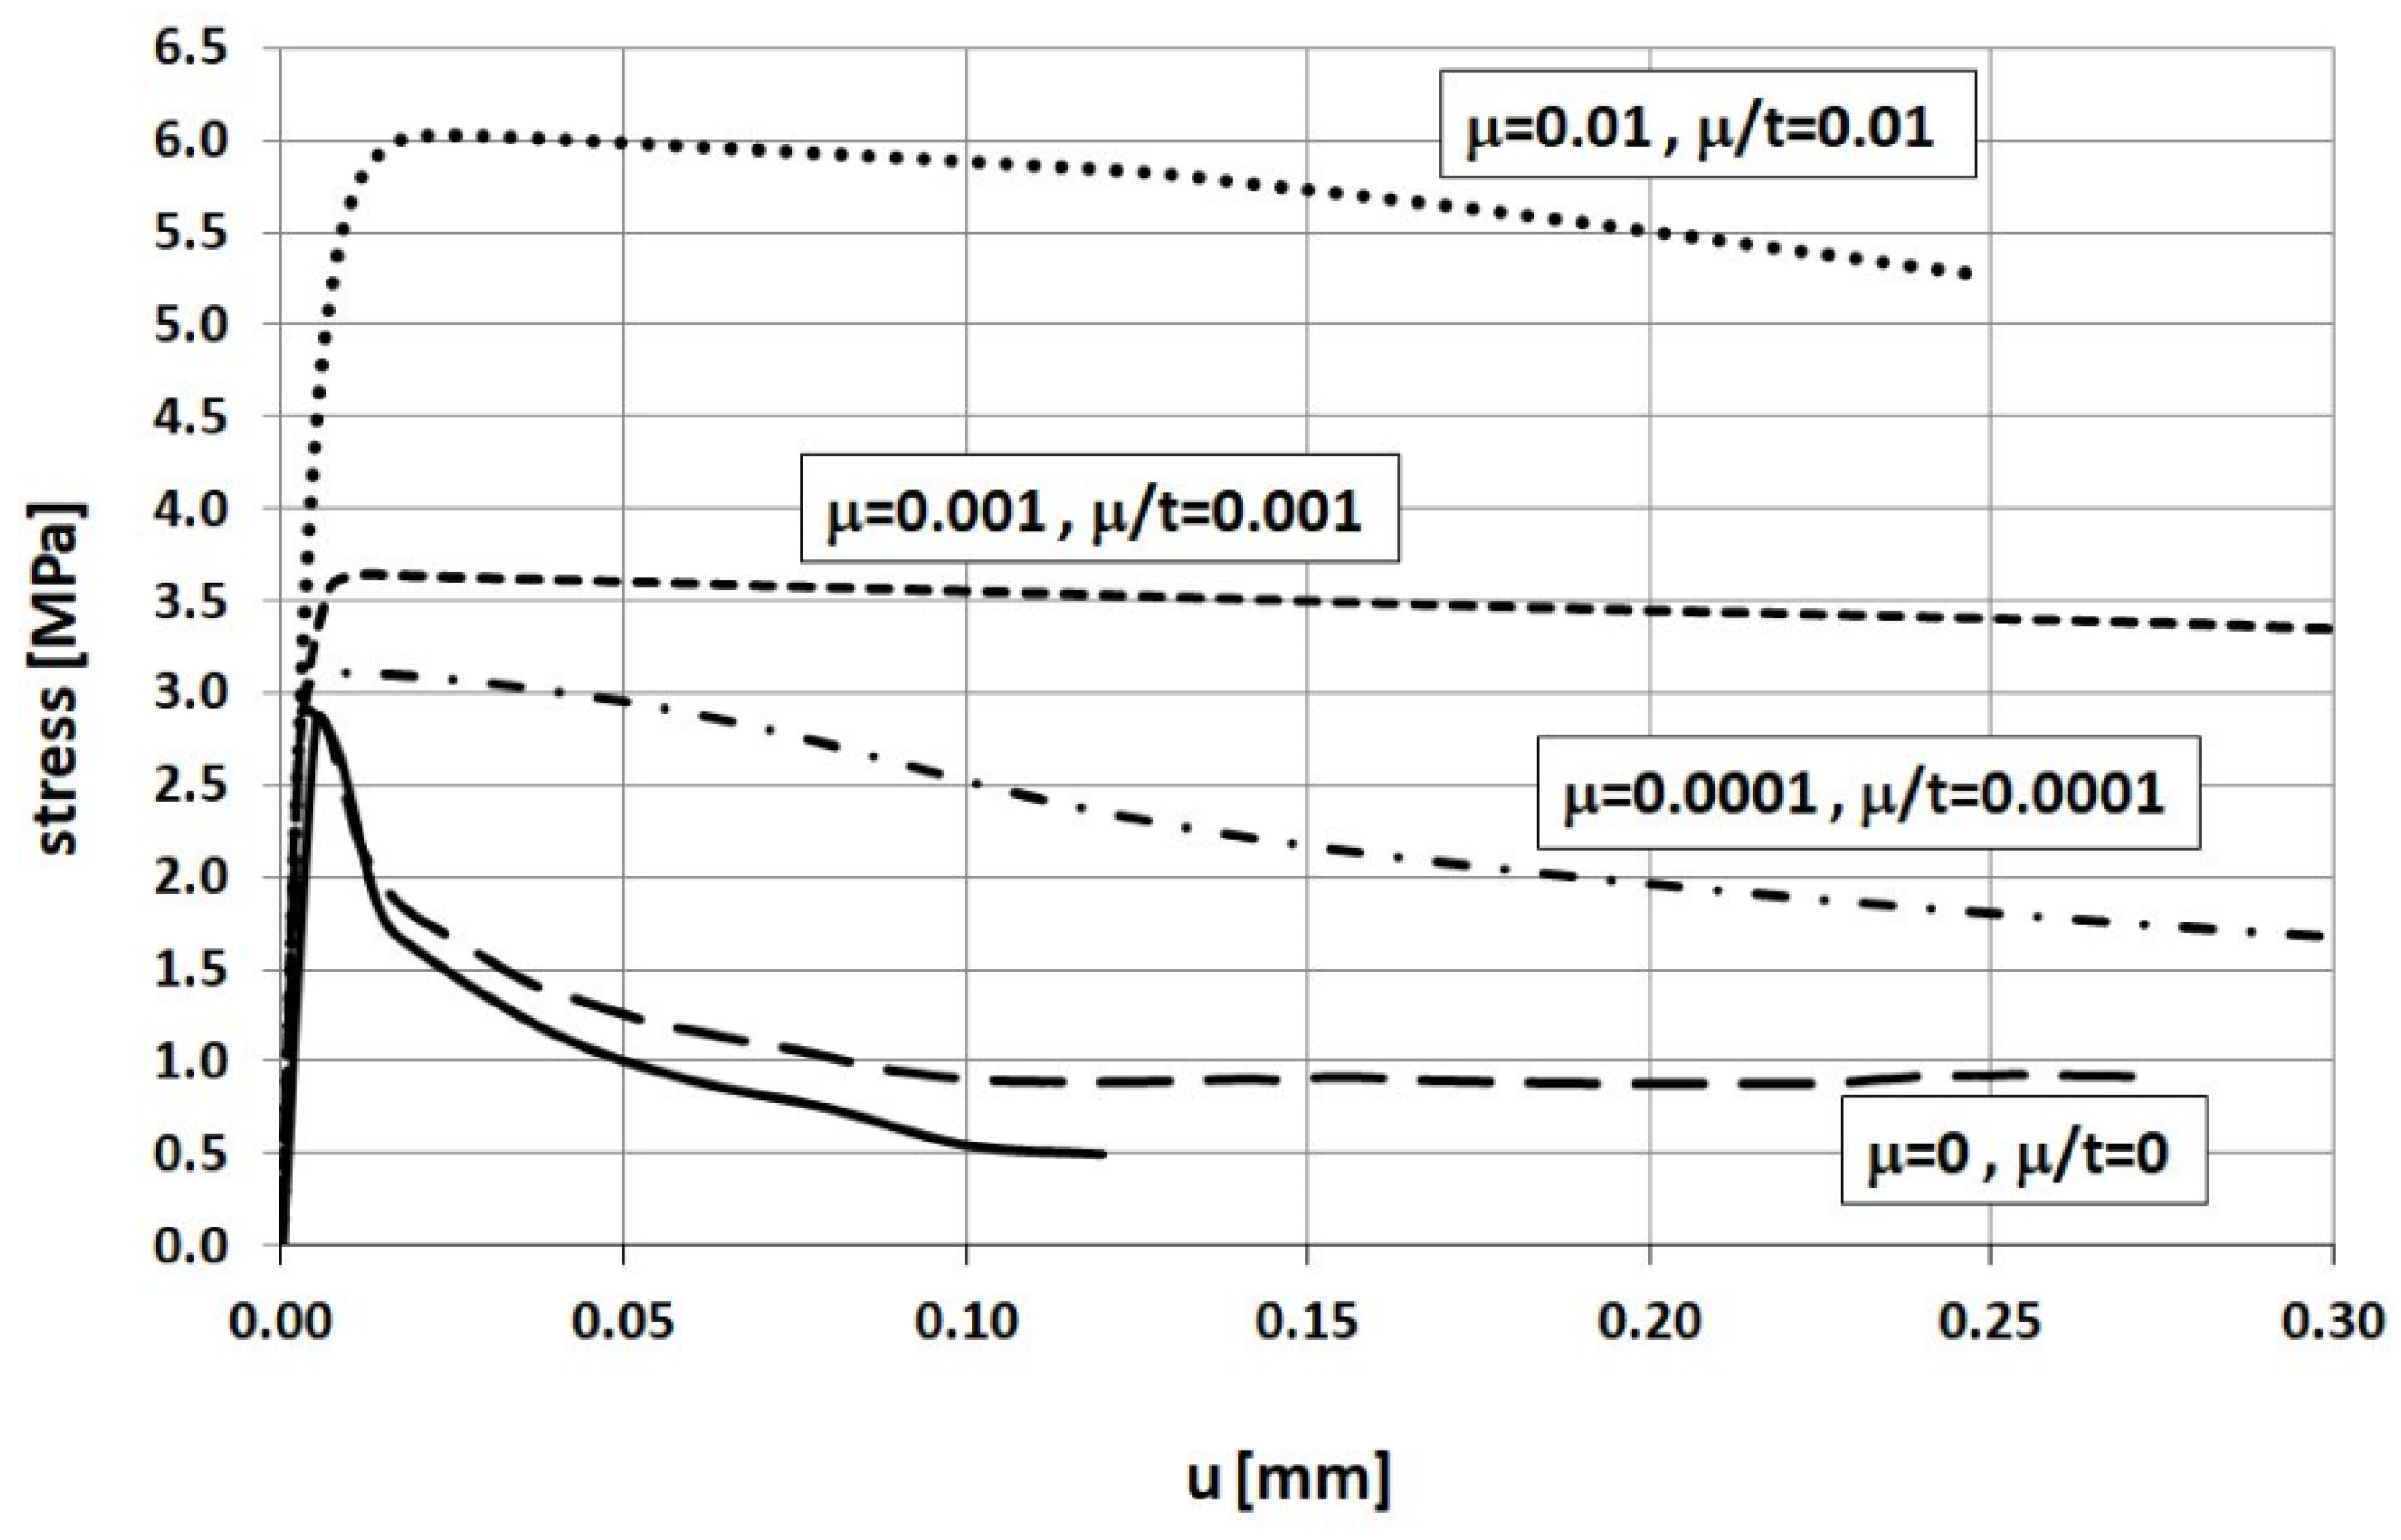
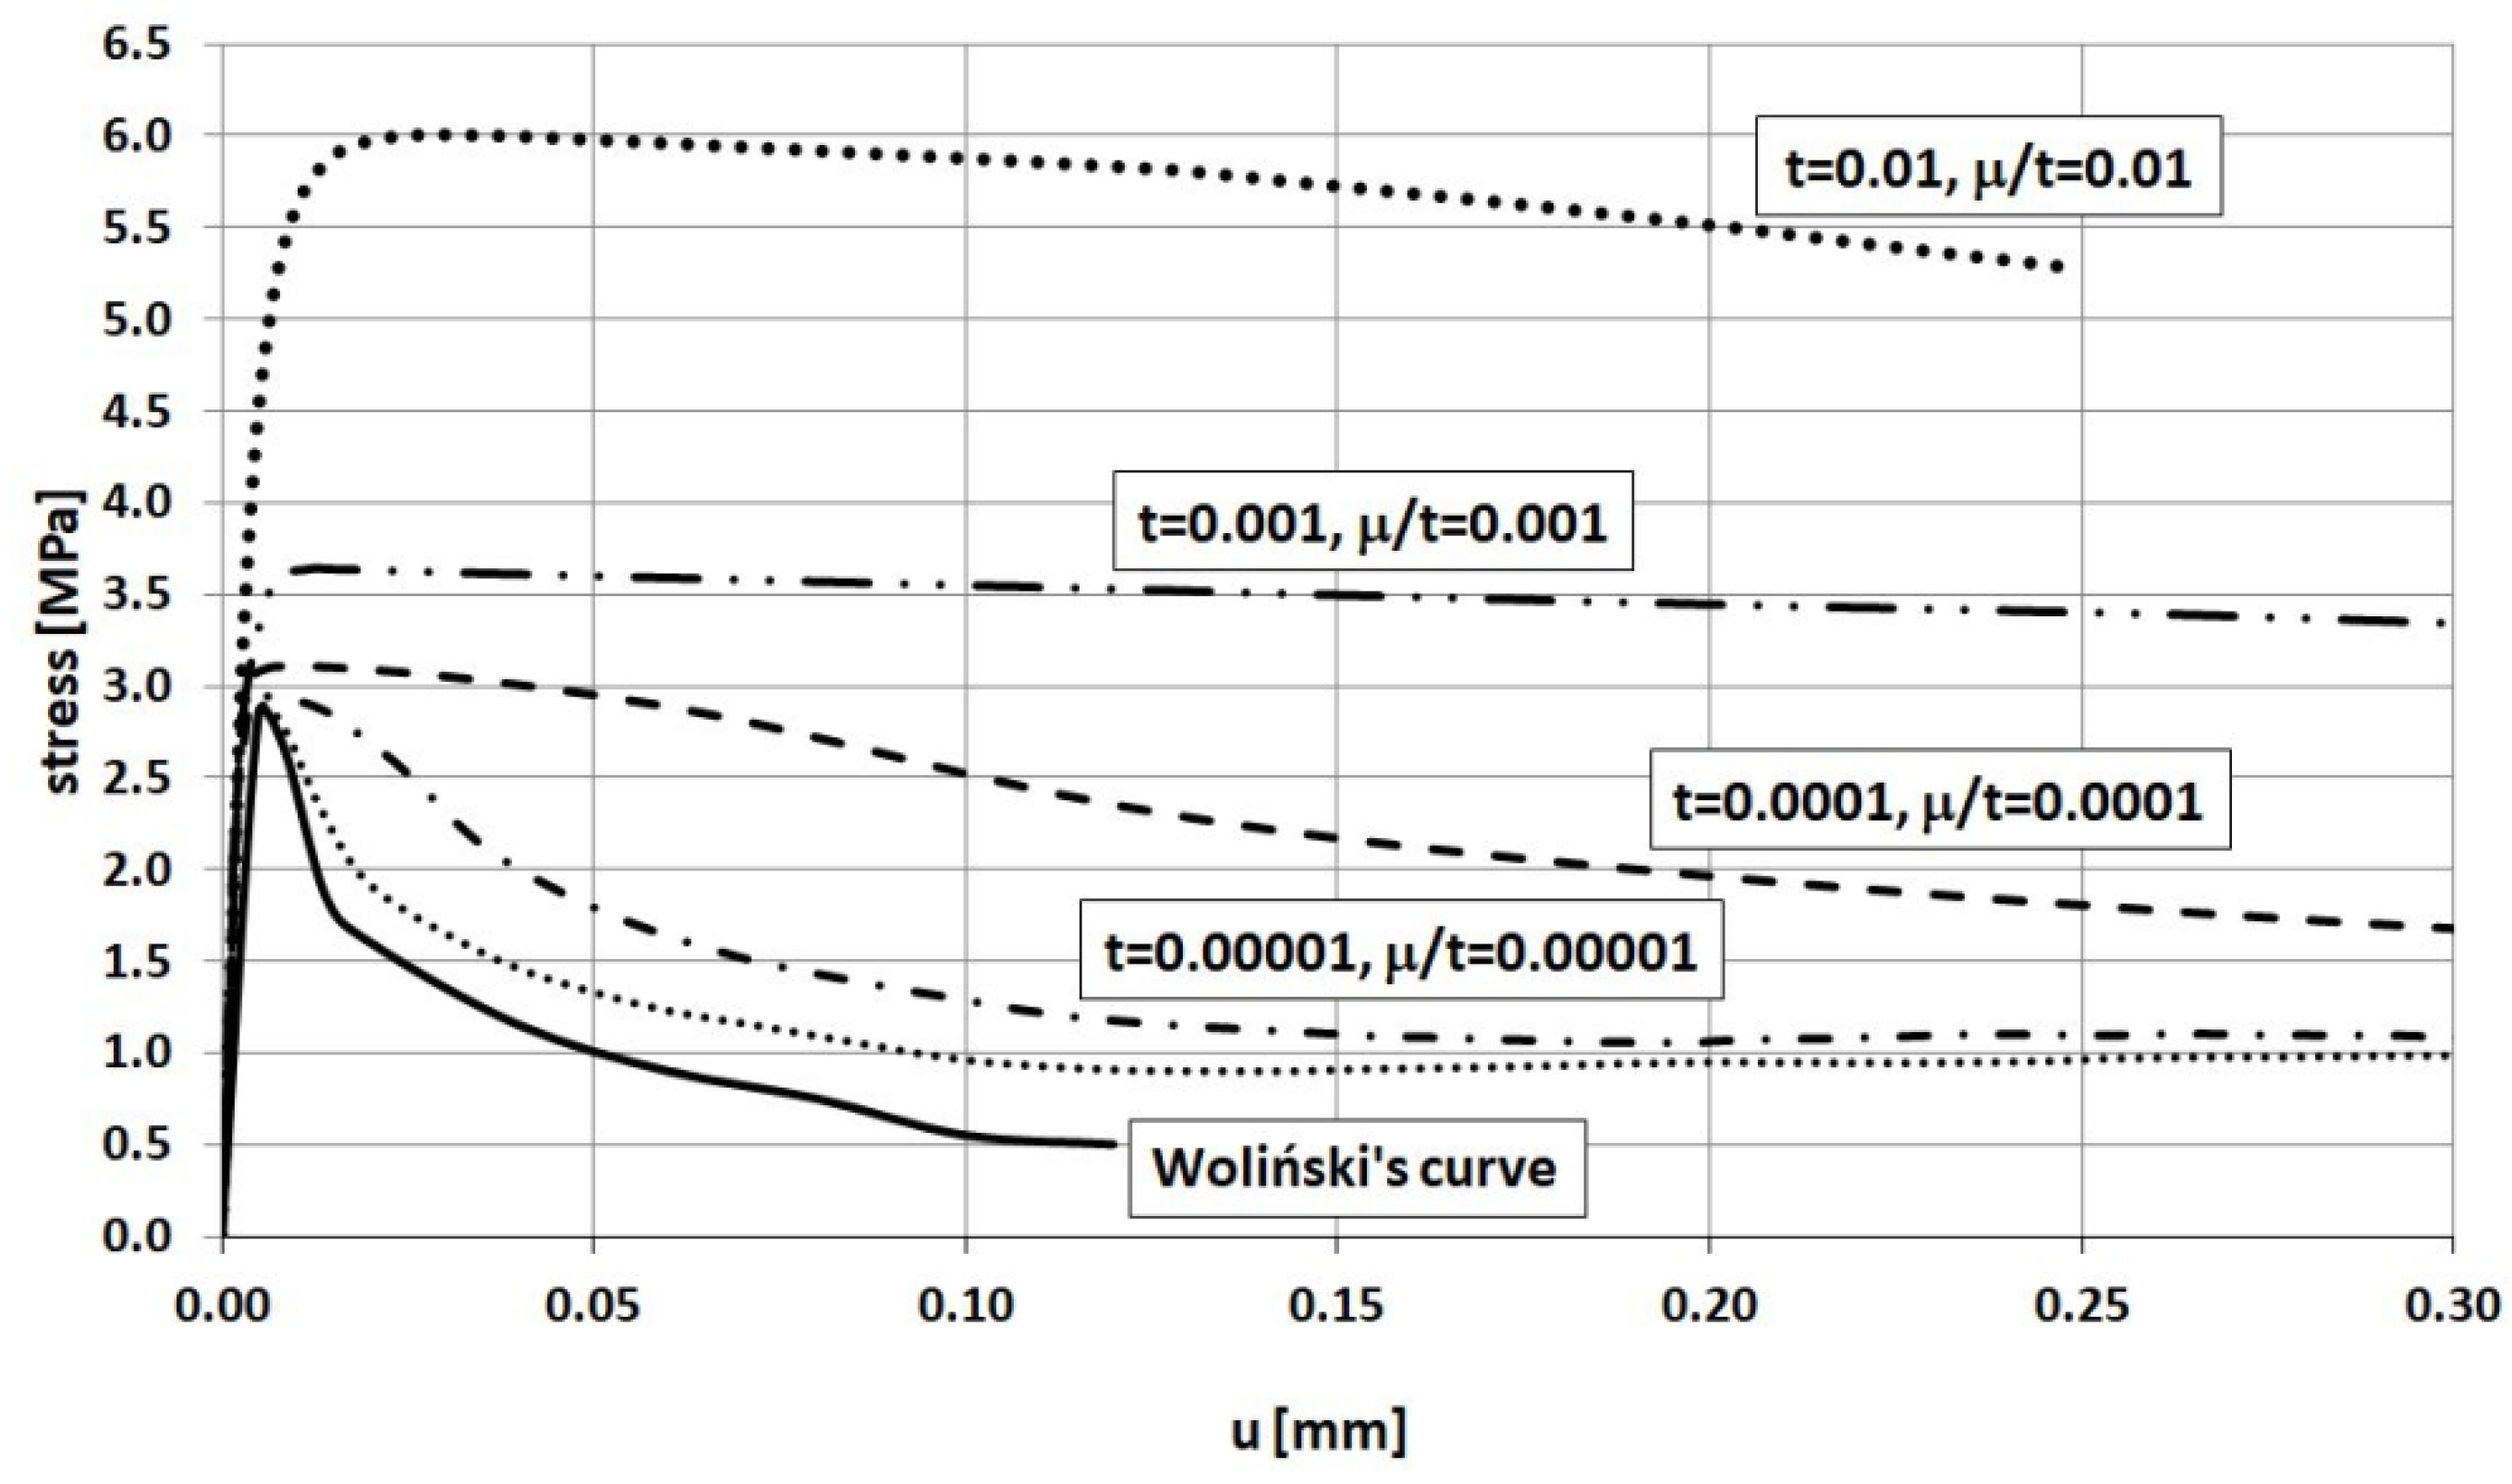
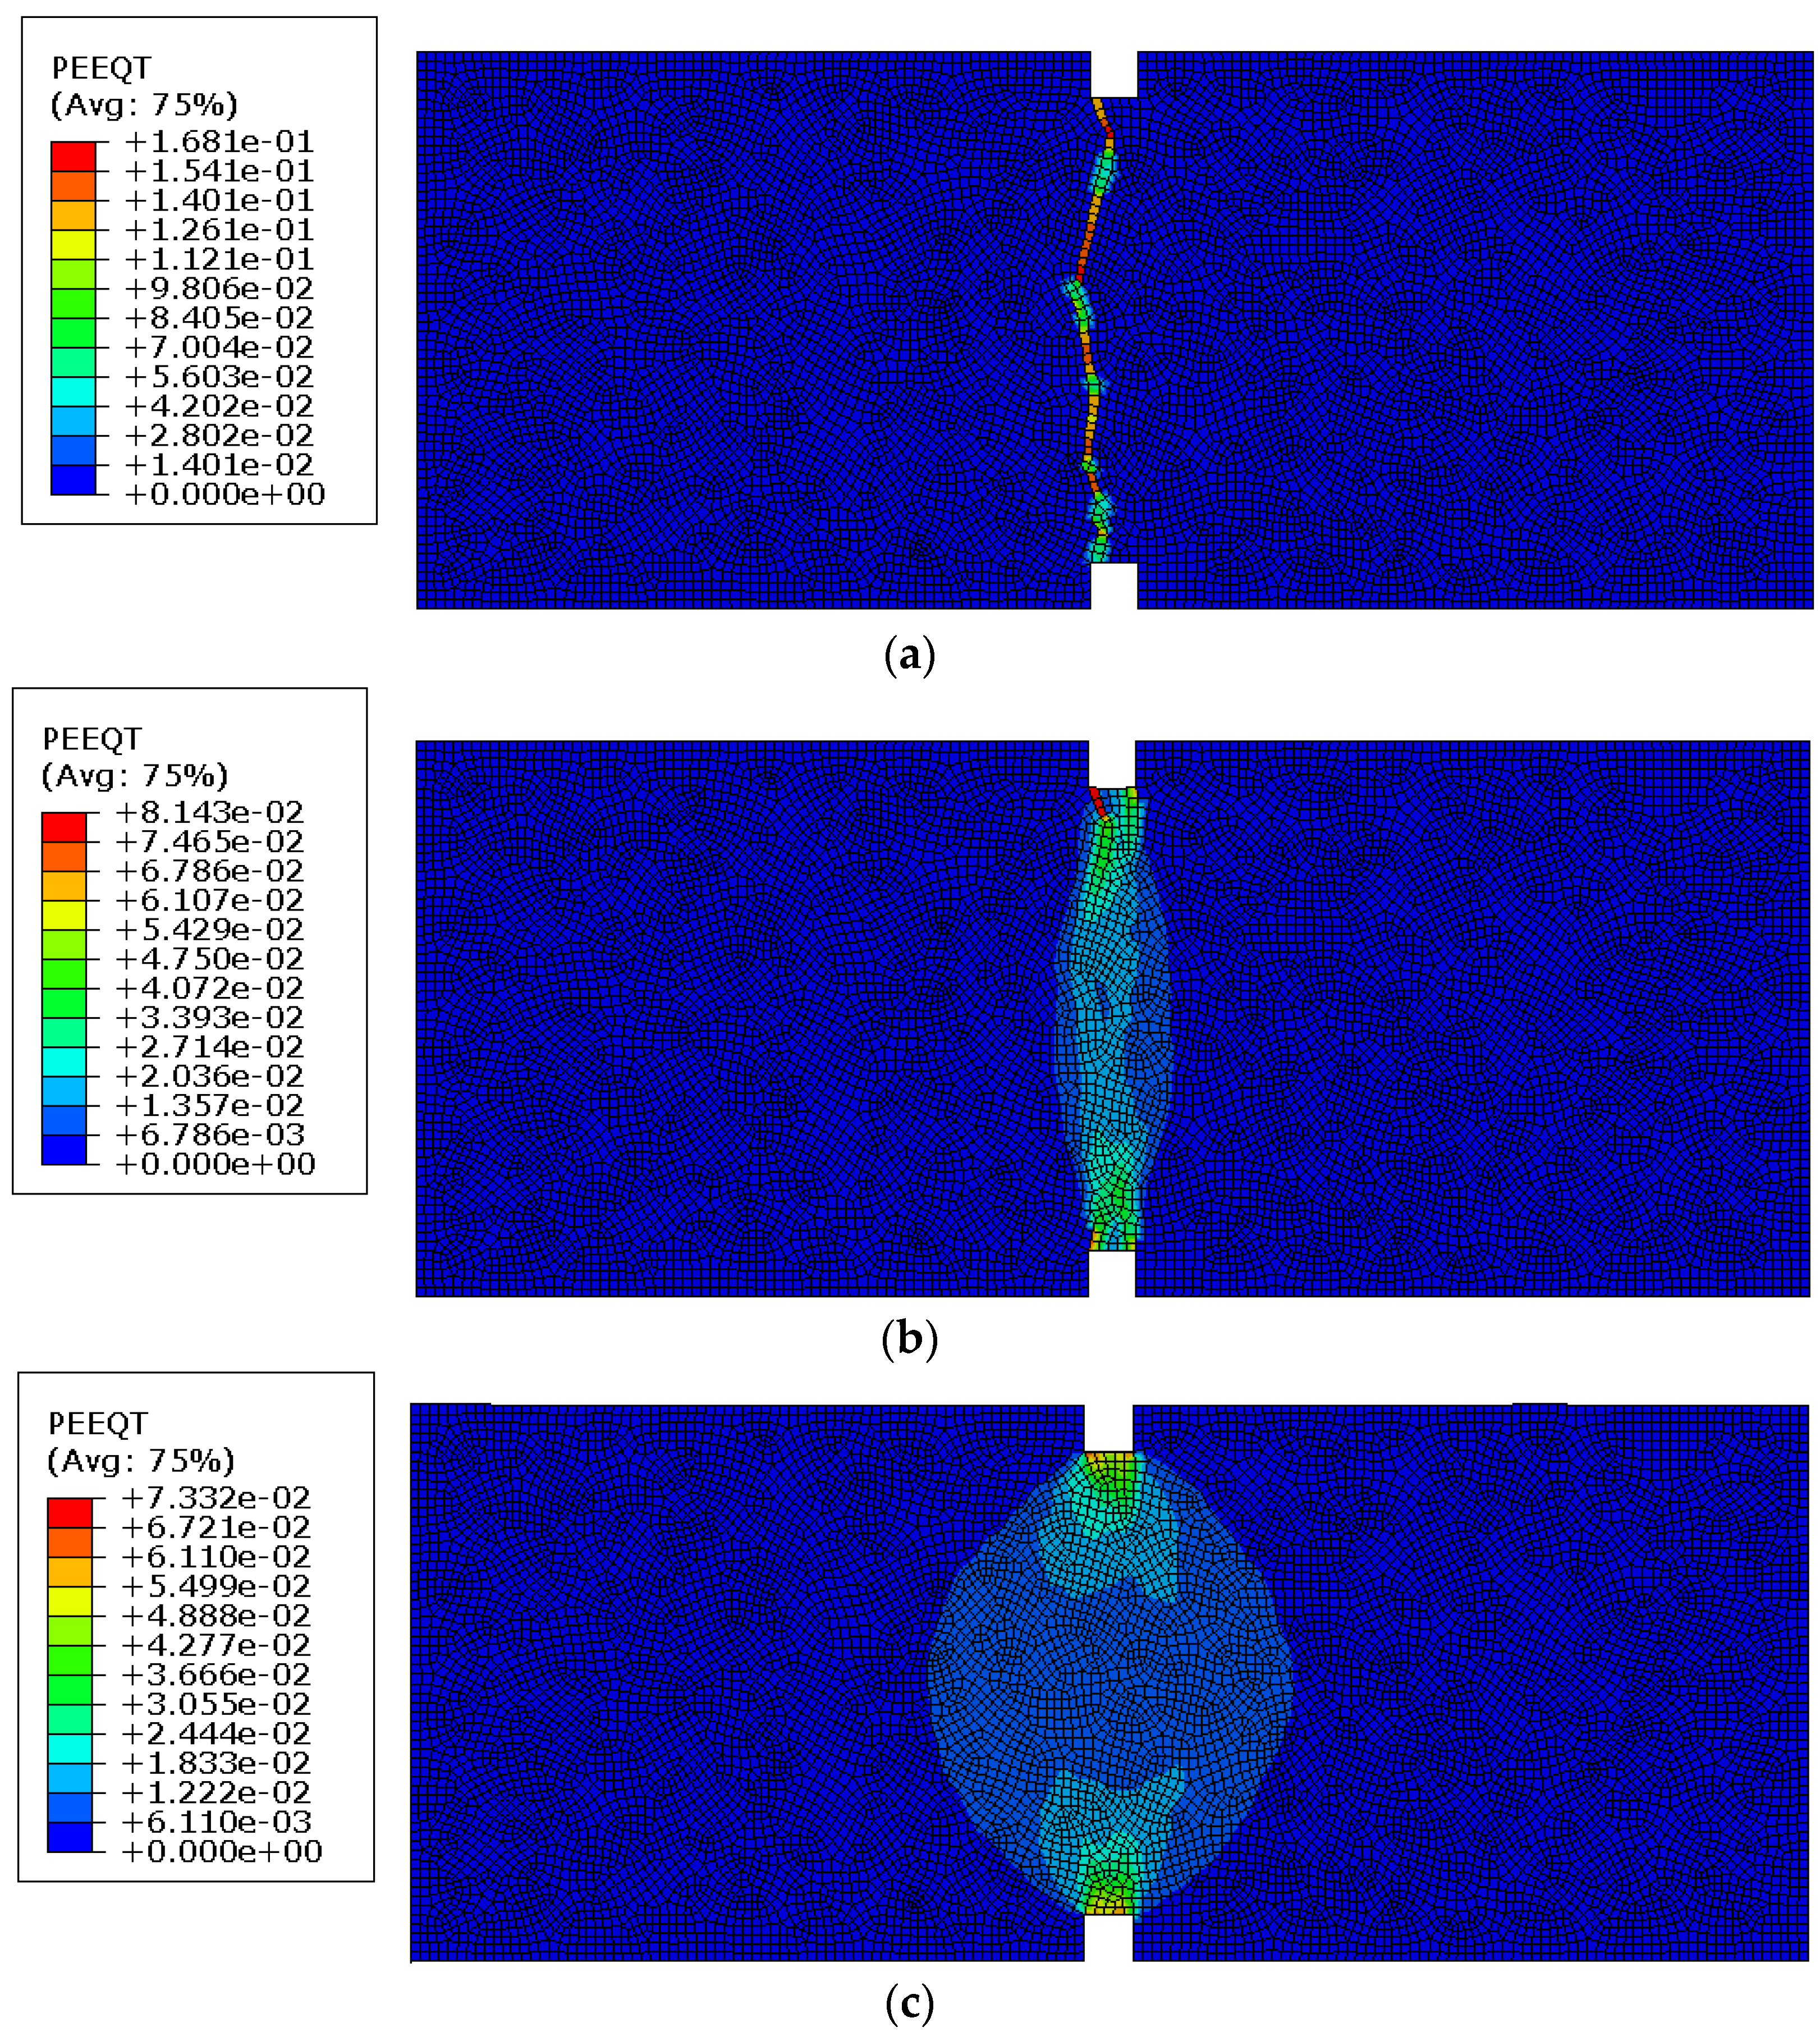
- The tension behavior of concrete in the post-critical range in Abaqus can be defined in three different ways (see Figure 3), namely, as coordinates of points on σ–εin curve in a tabular form called STRA in Abaqus code (Figure 3a), σ–ucr curve called DISP (Figure 3b), or the fracture energy Gf called GFTEN (Figure 3c).
3. Calibration and Validation of CDP Model Parameters
3.1. Uniaxial and Biaxial Compression Tests
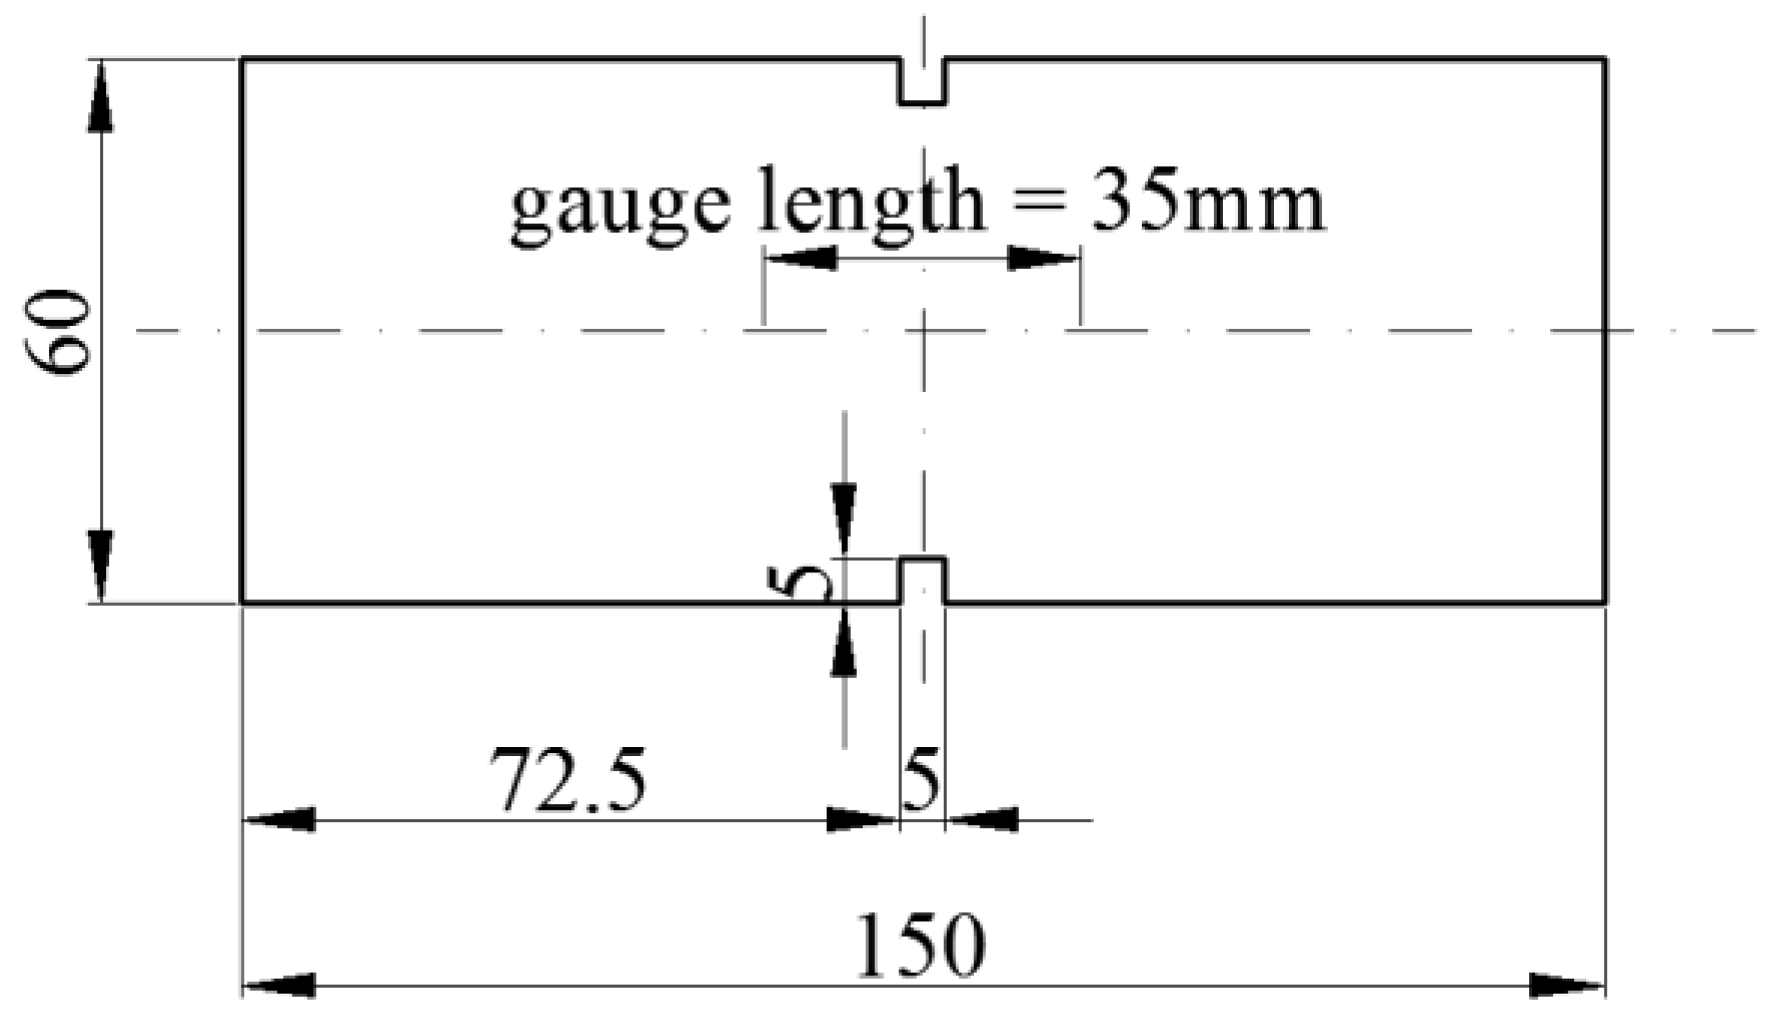
3.2. Uniaxial Tension Test
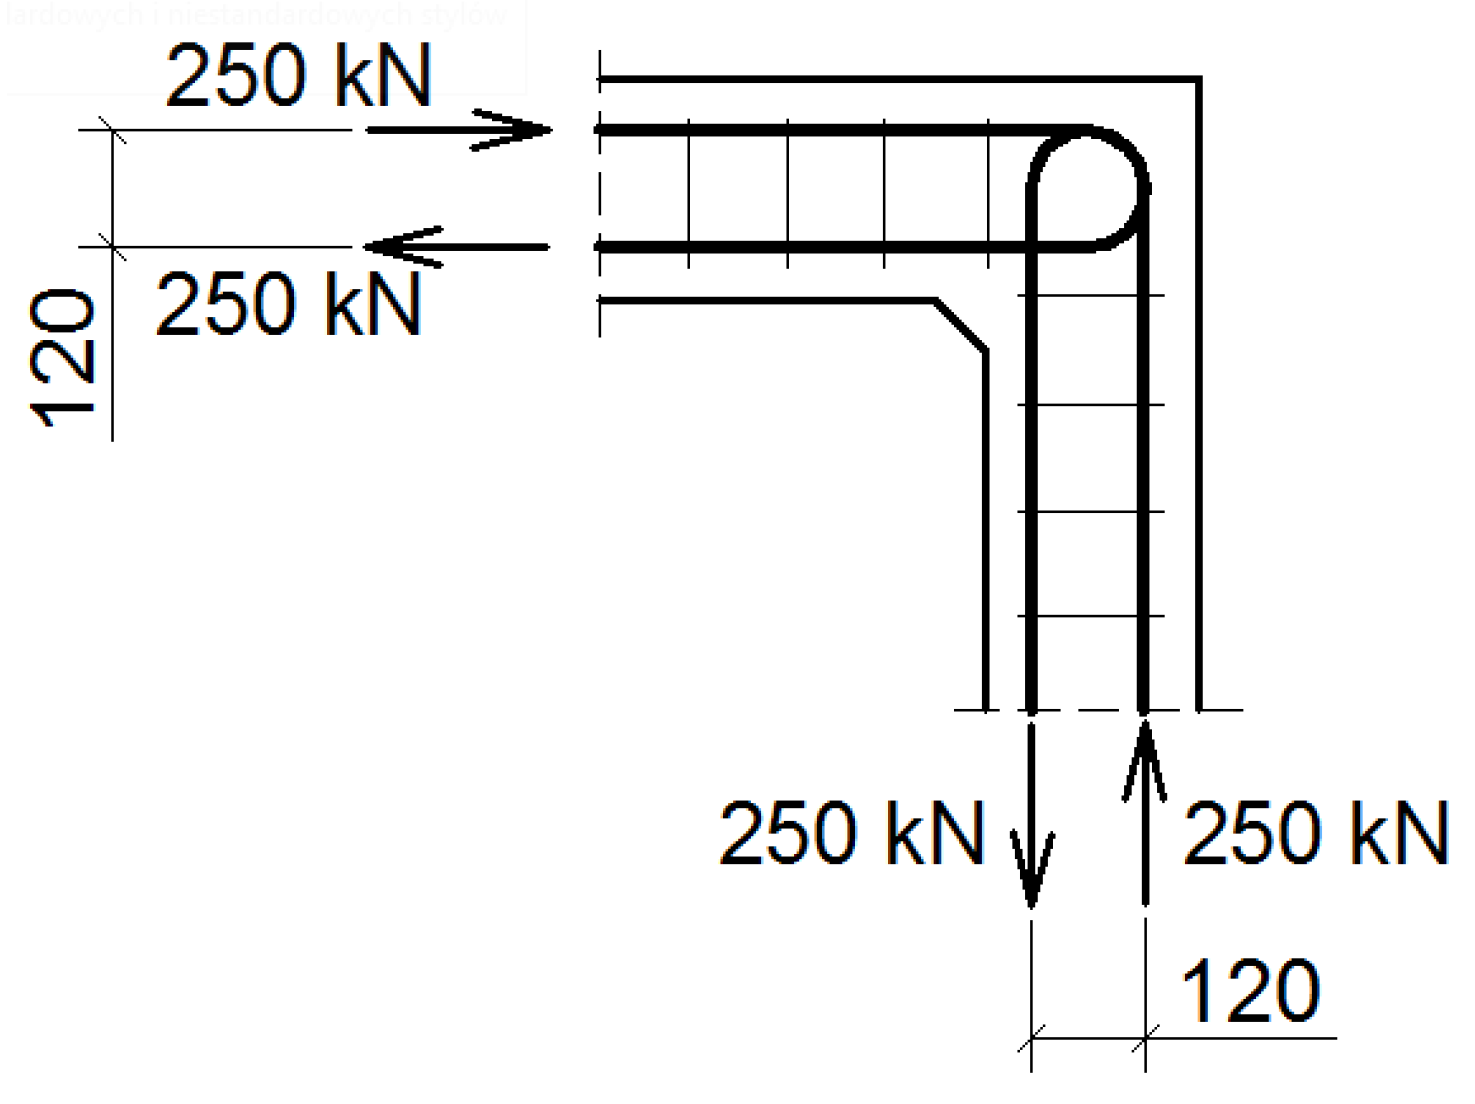
4. Strut-and-Tie and FEM Analysis of Corners under Opening Bending Moment
- Concrete: fc = 34.30 MPa, Ec = 35 GPa, ν = 0.167, ft = 3.5 MPa, Gf = 146.5 N/m;
- Reinforcing steel: fy = 434.8 MPa, Es = 200 GPa, ν = 0.3.
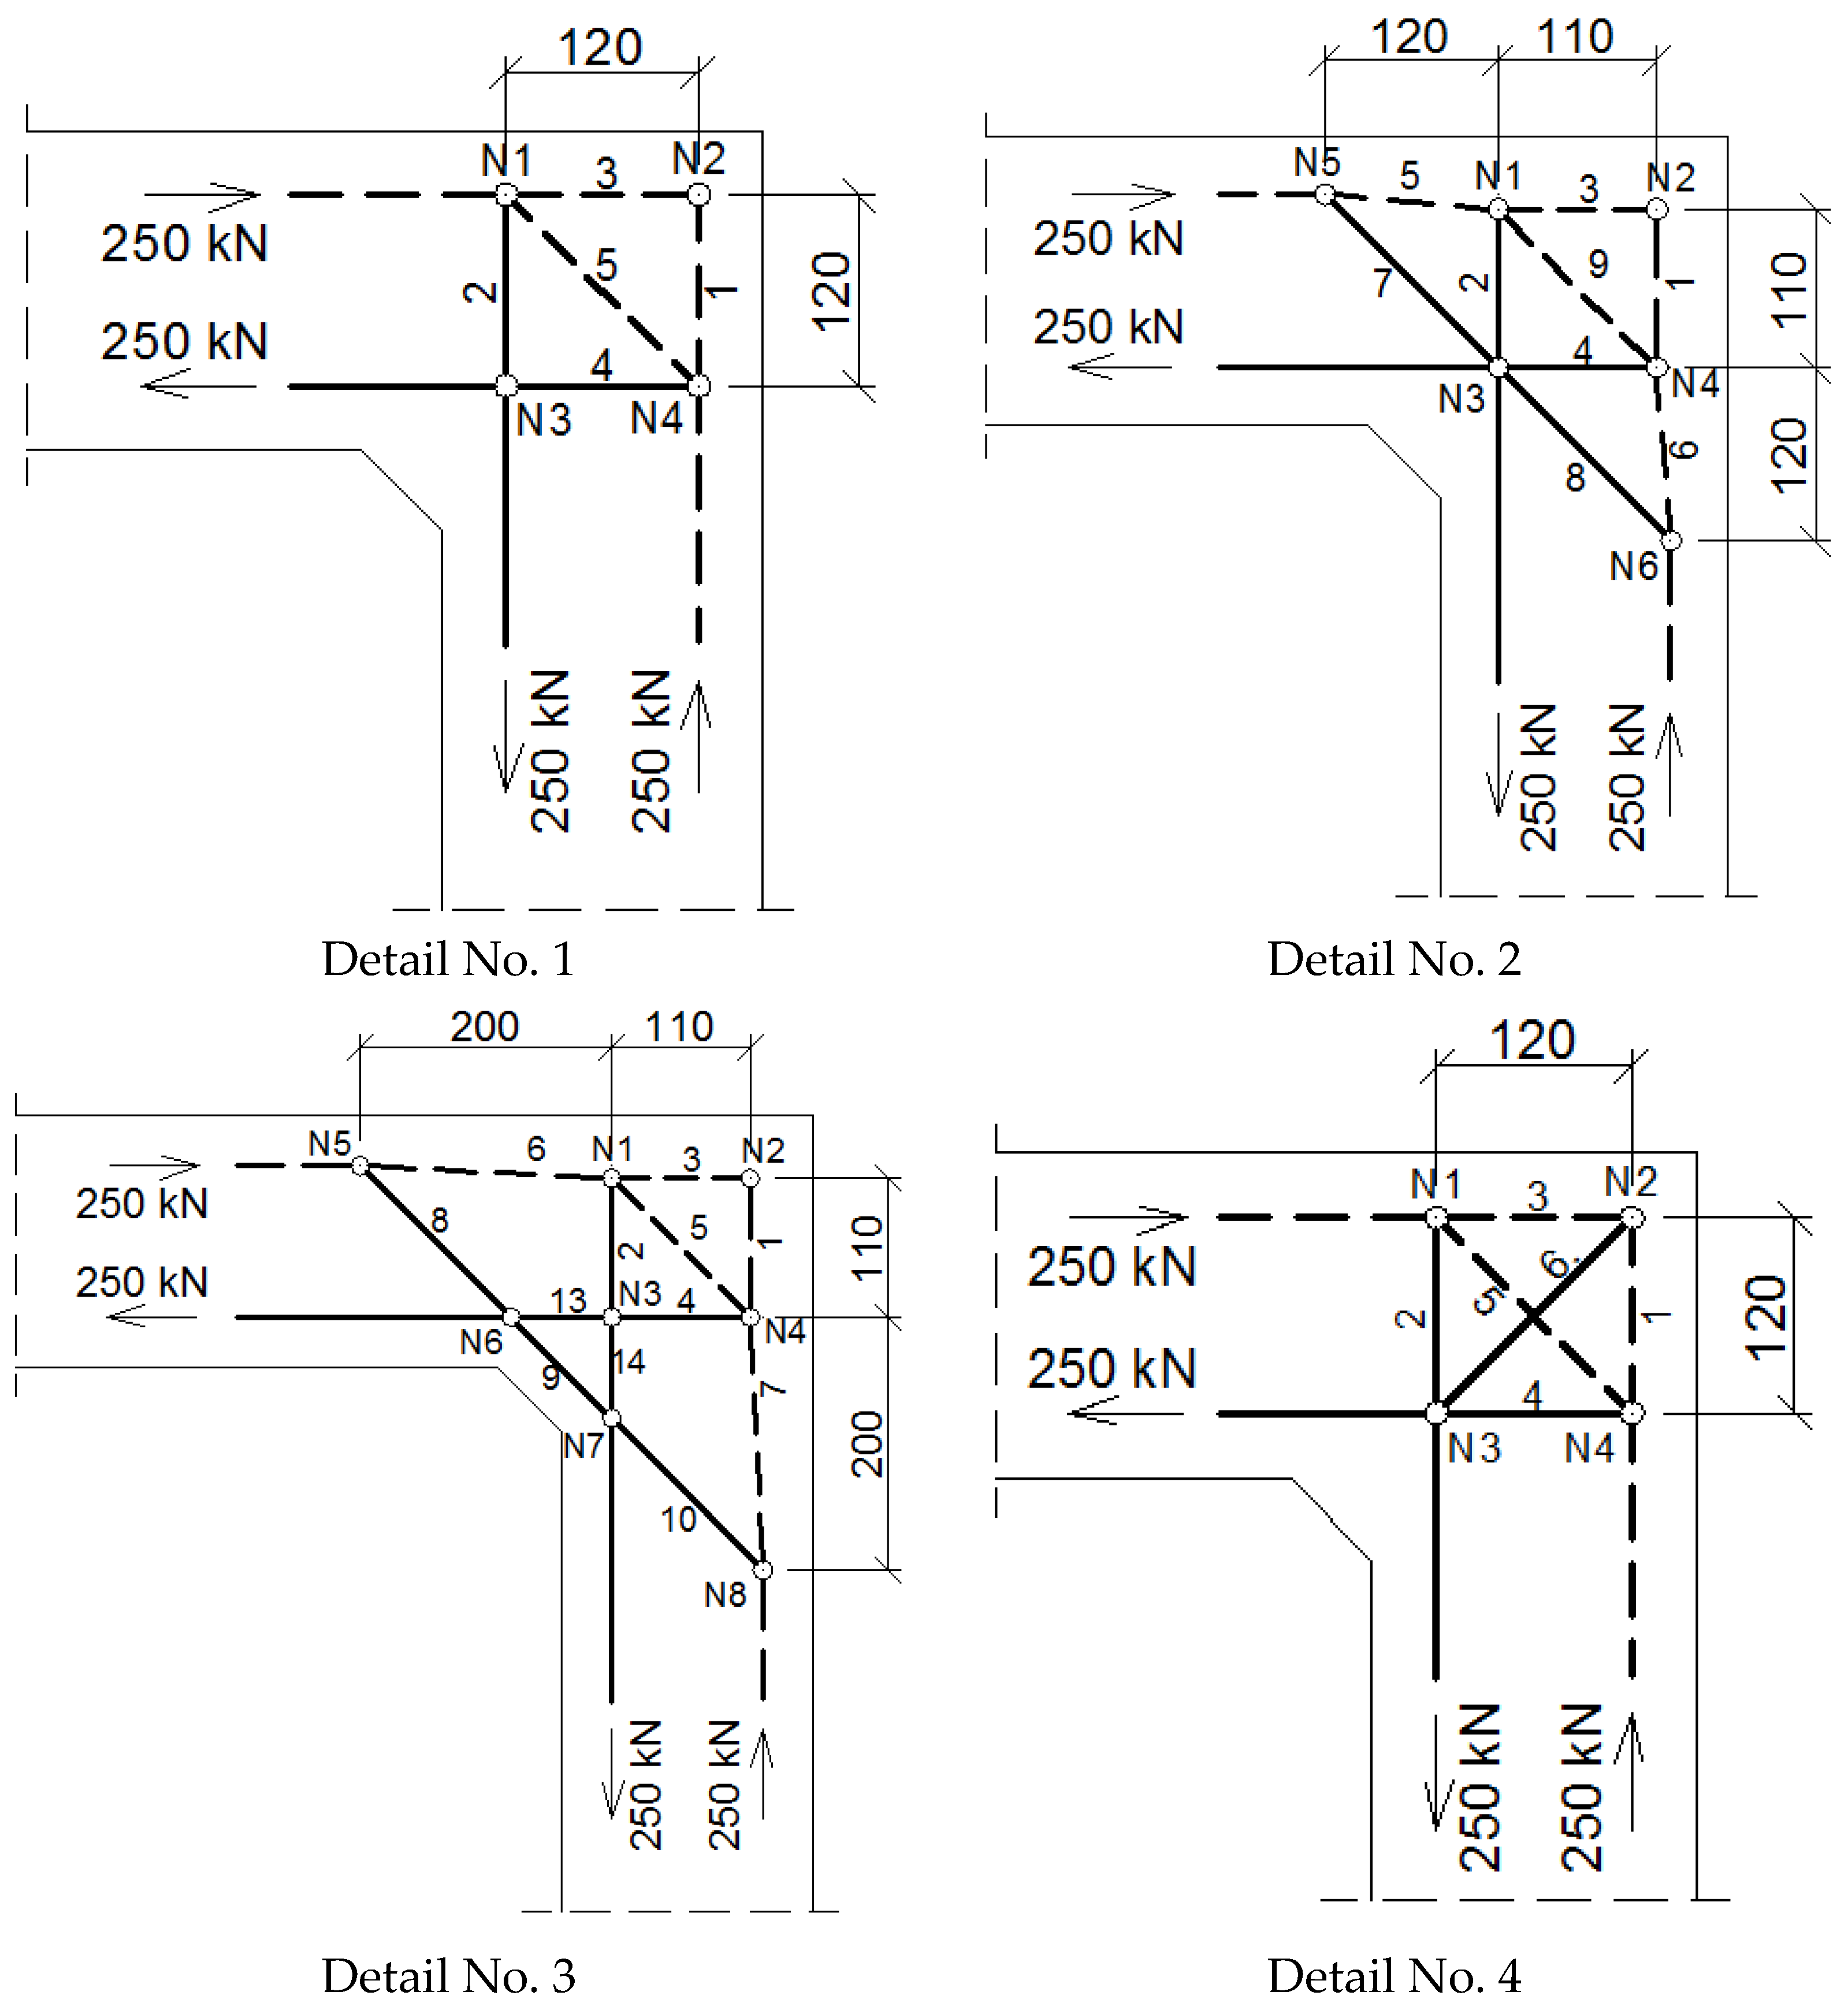
4.1. Calculations in the Strut-and-Tie Method
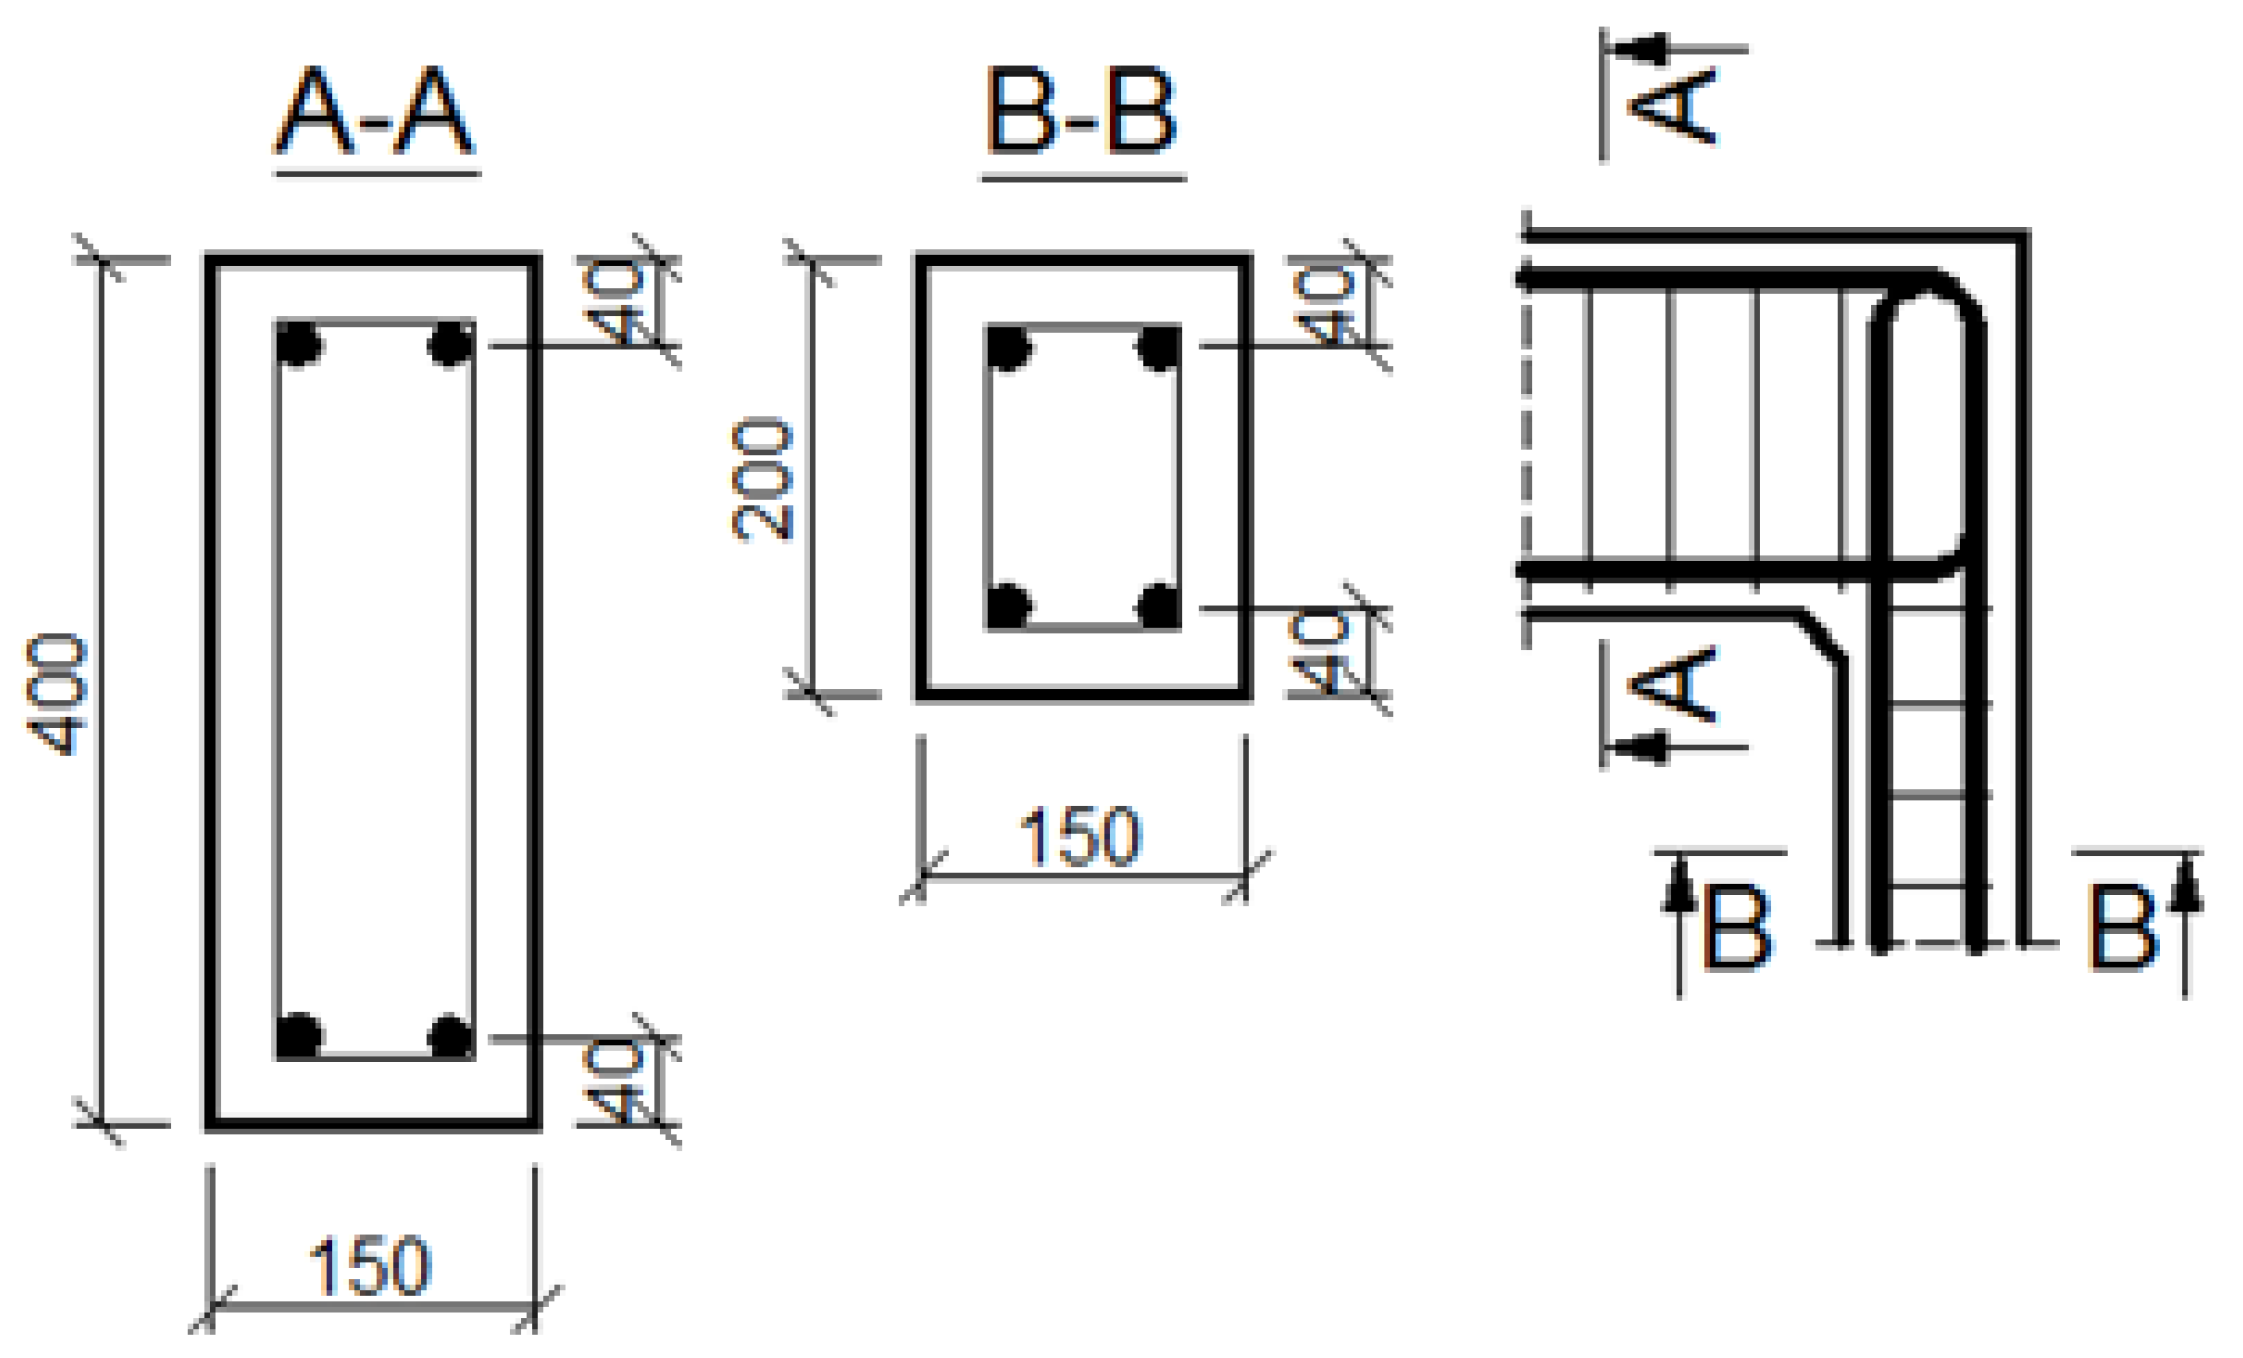
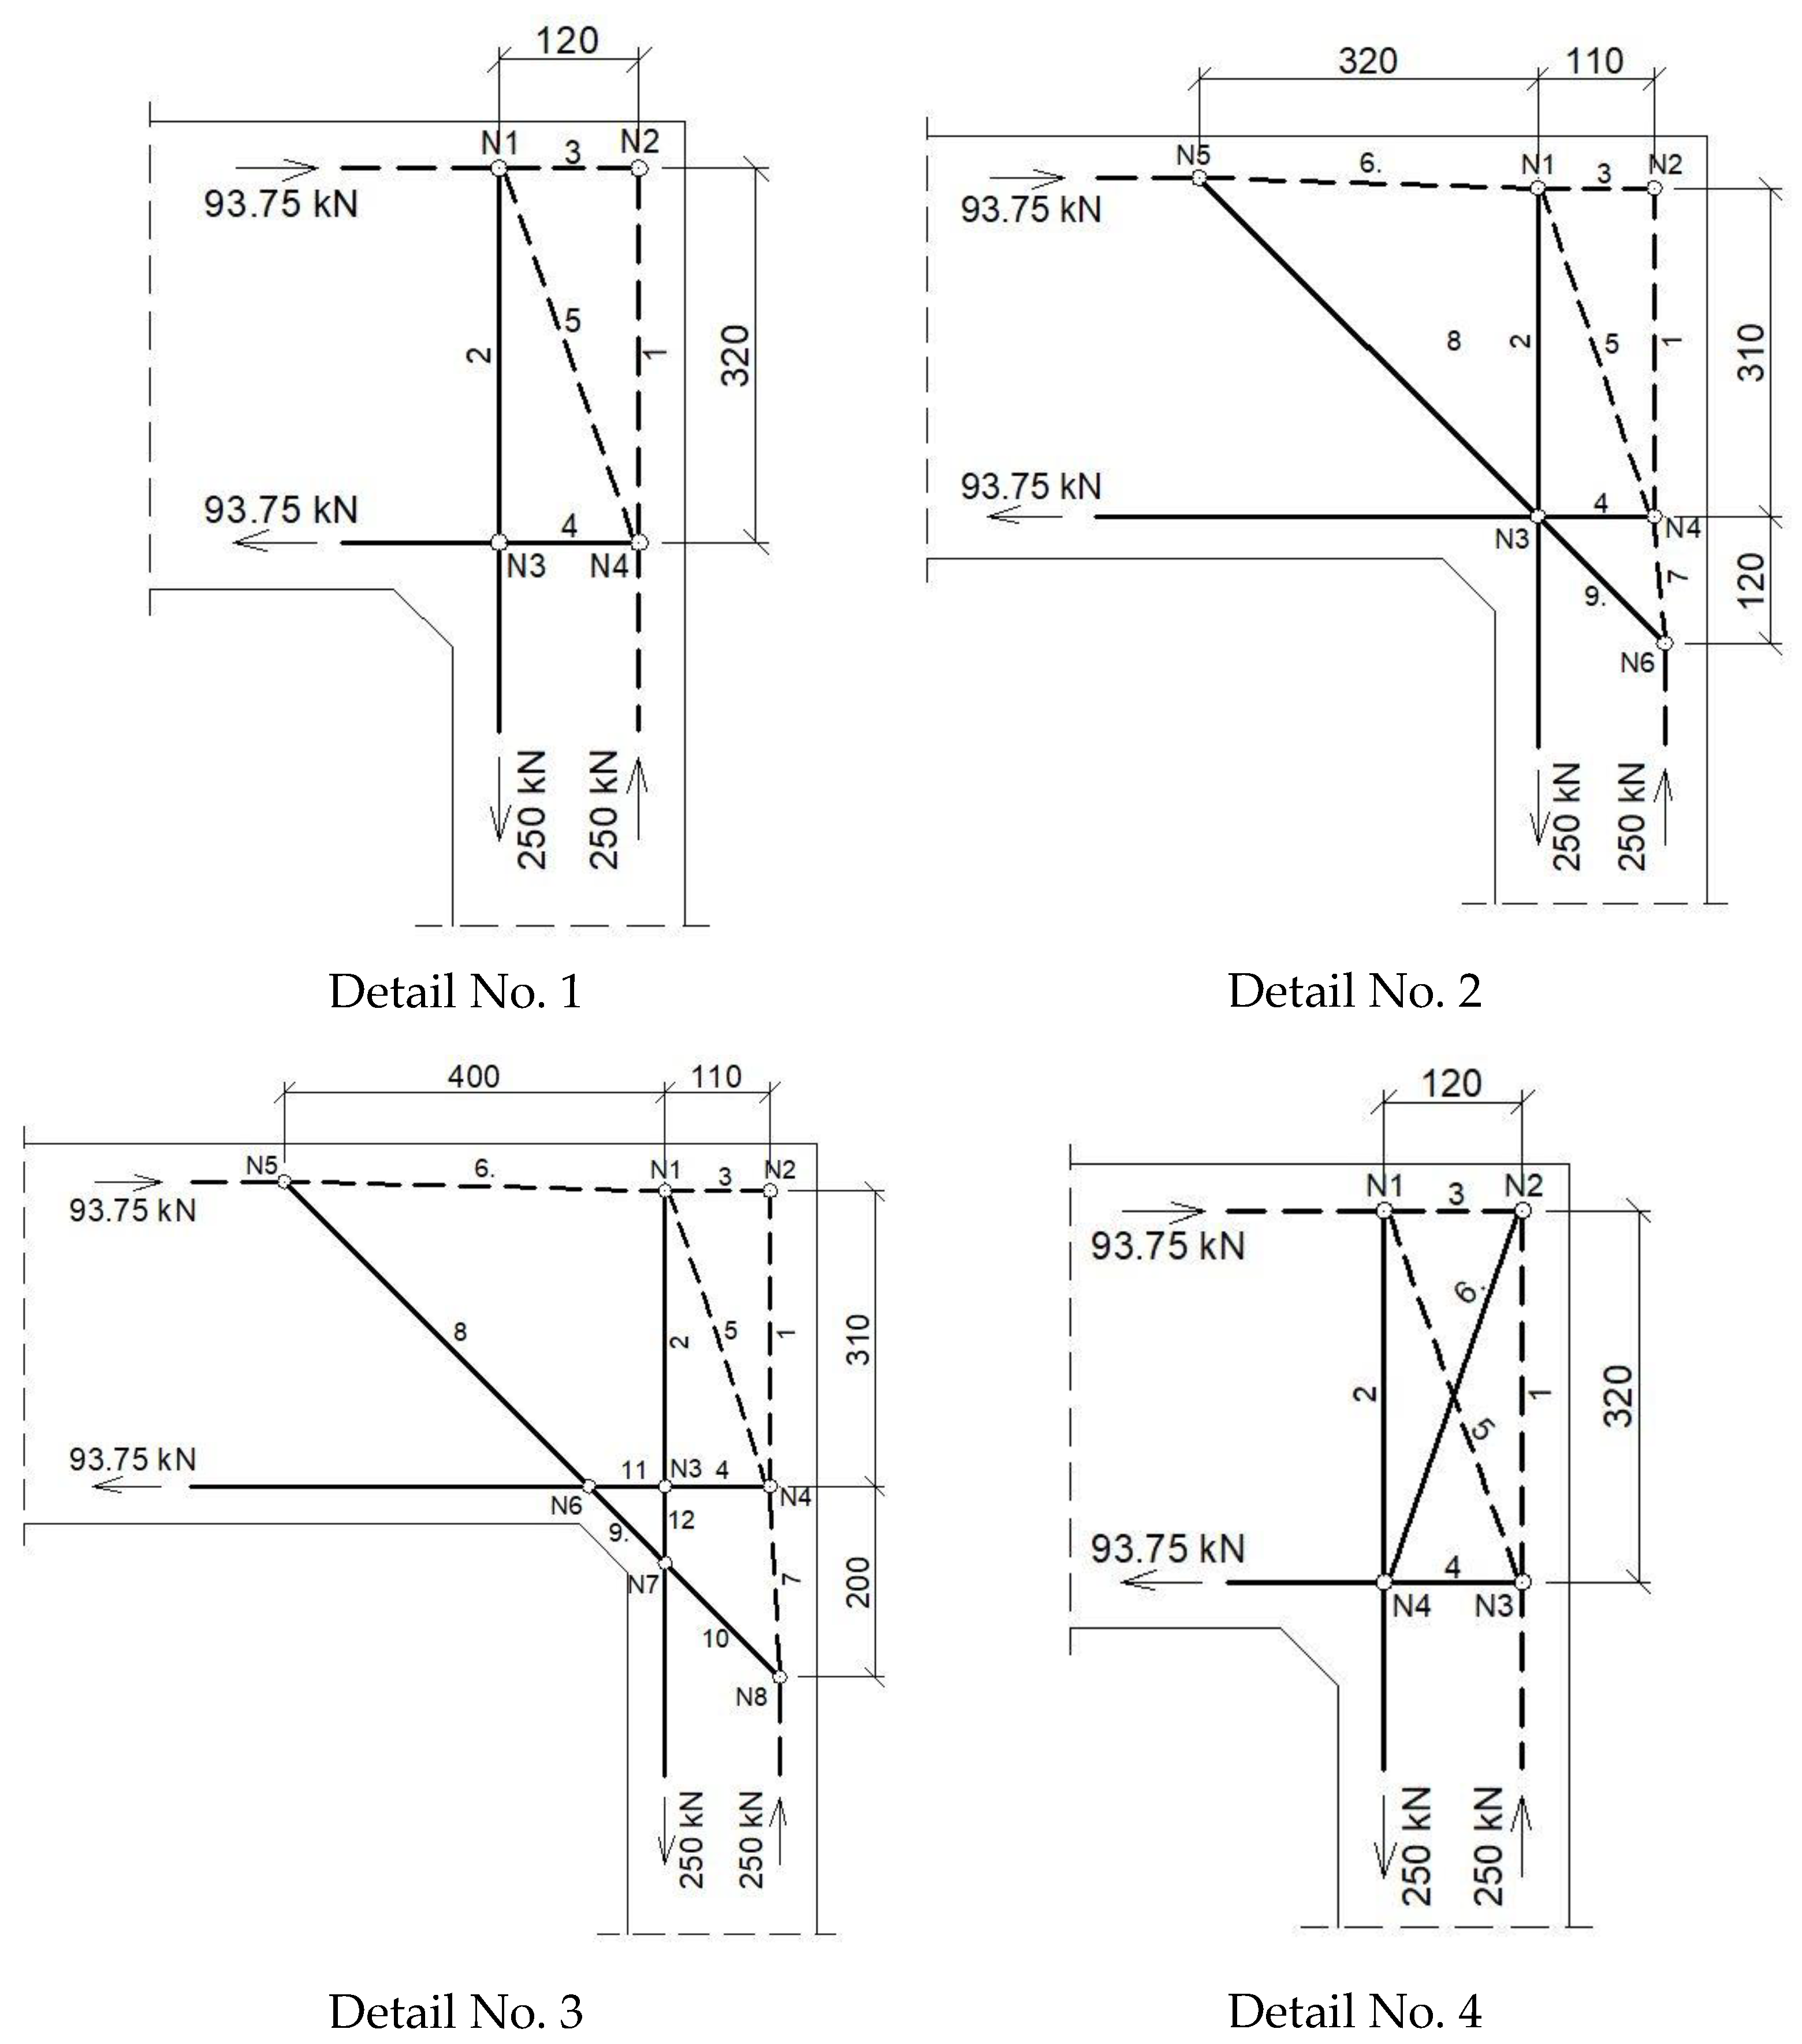
4.1.1. The Case of Elements with the Same Cross Section Heights
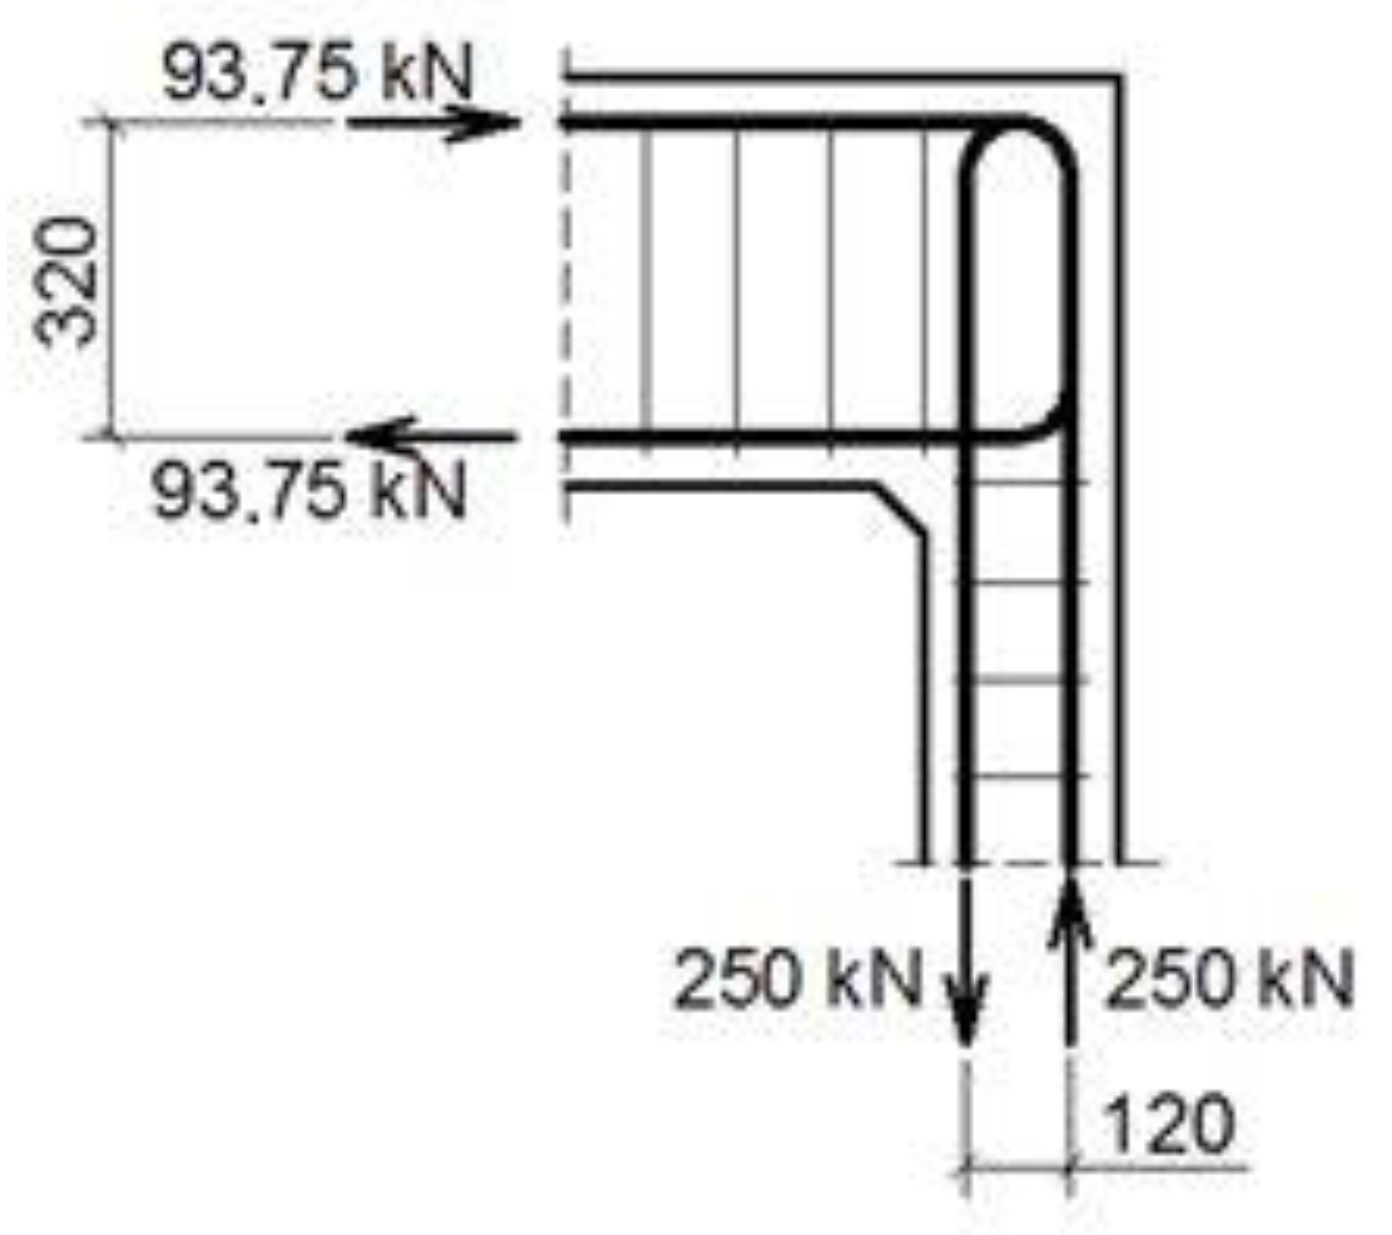
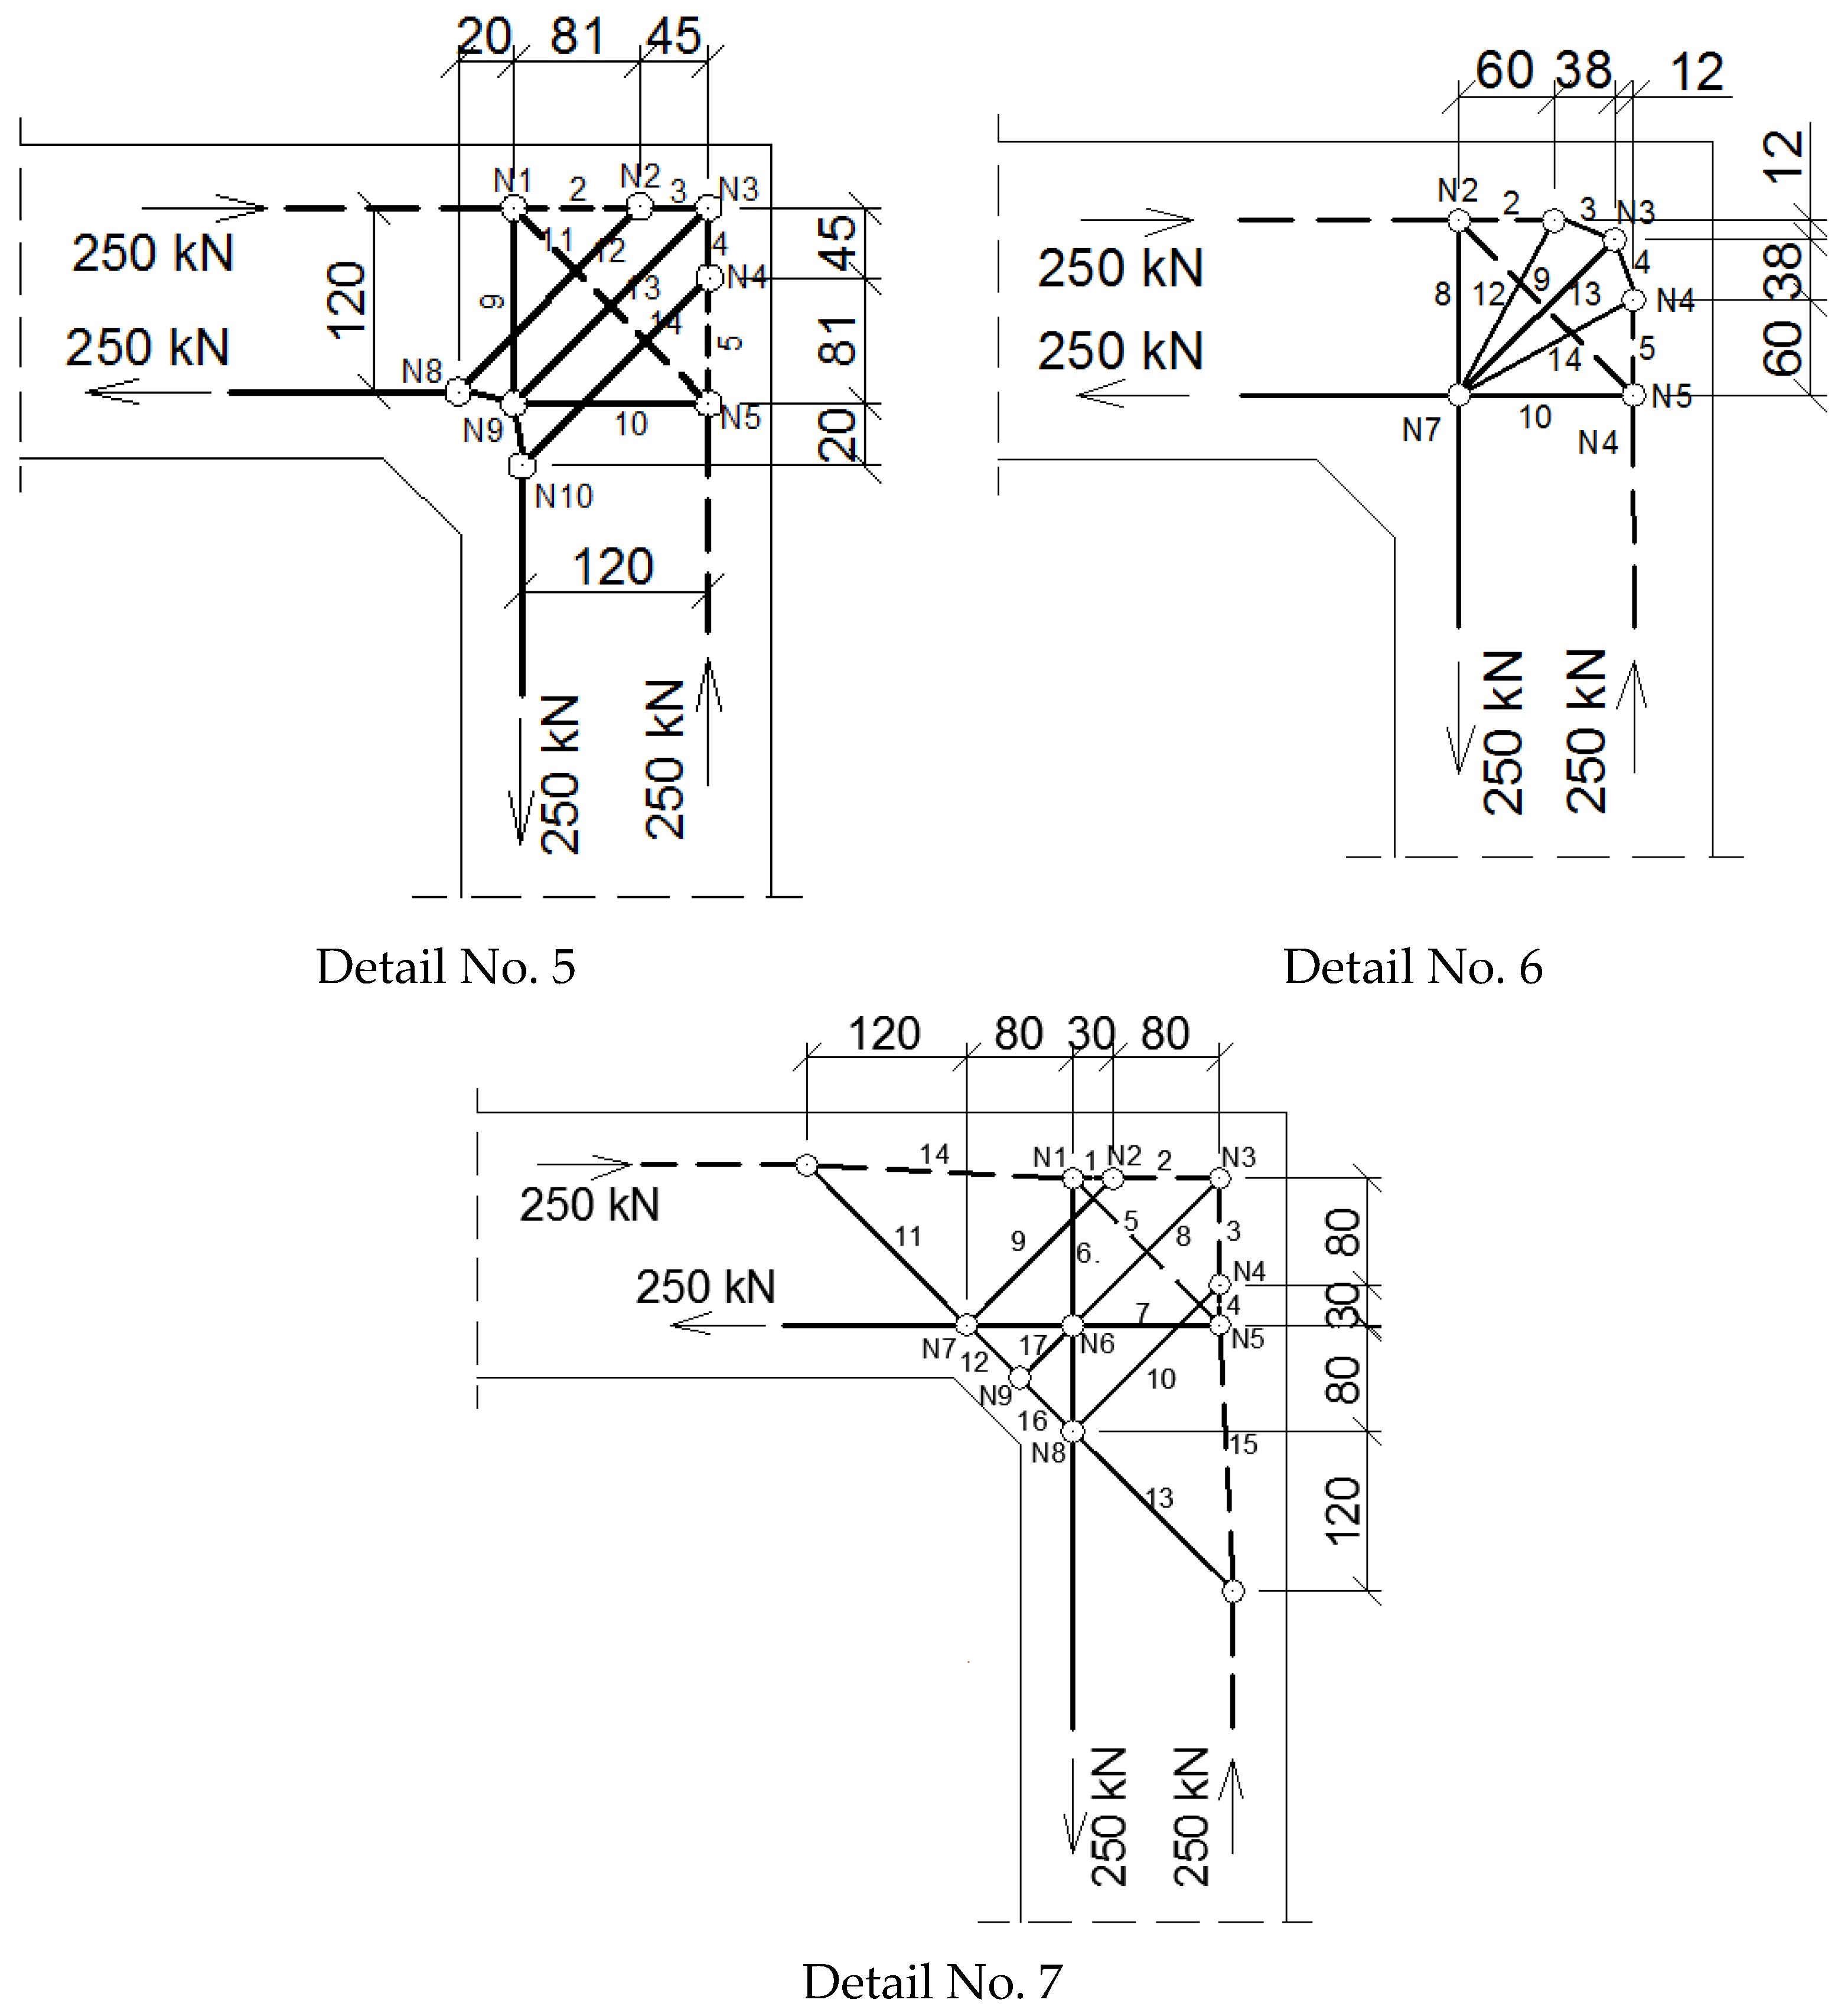
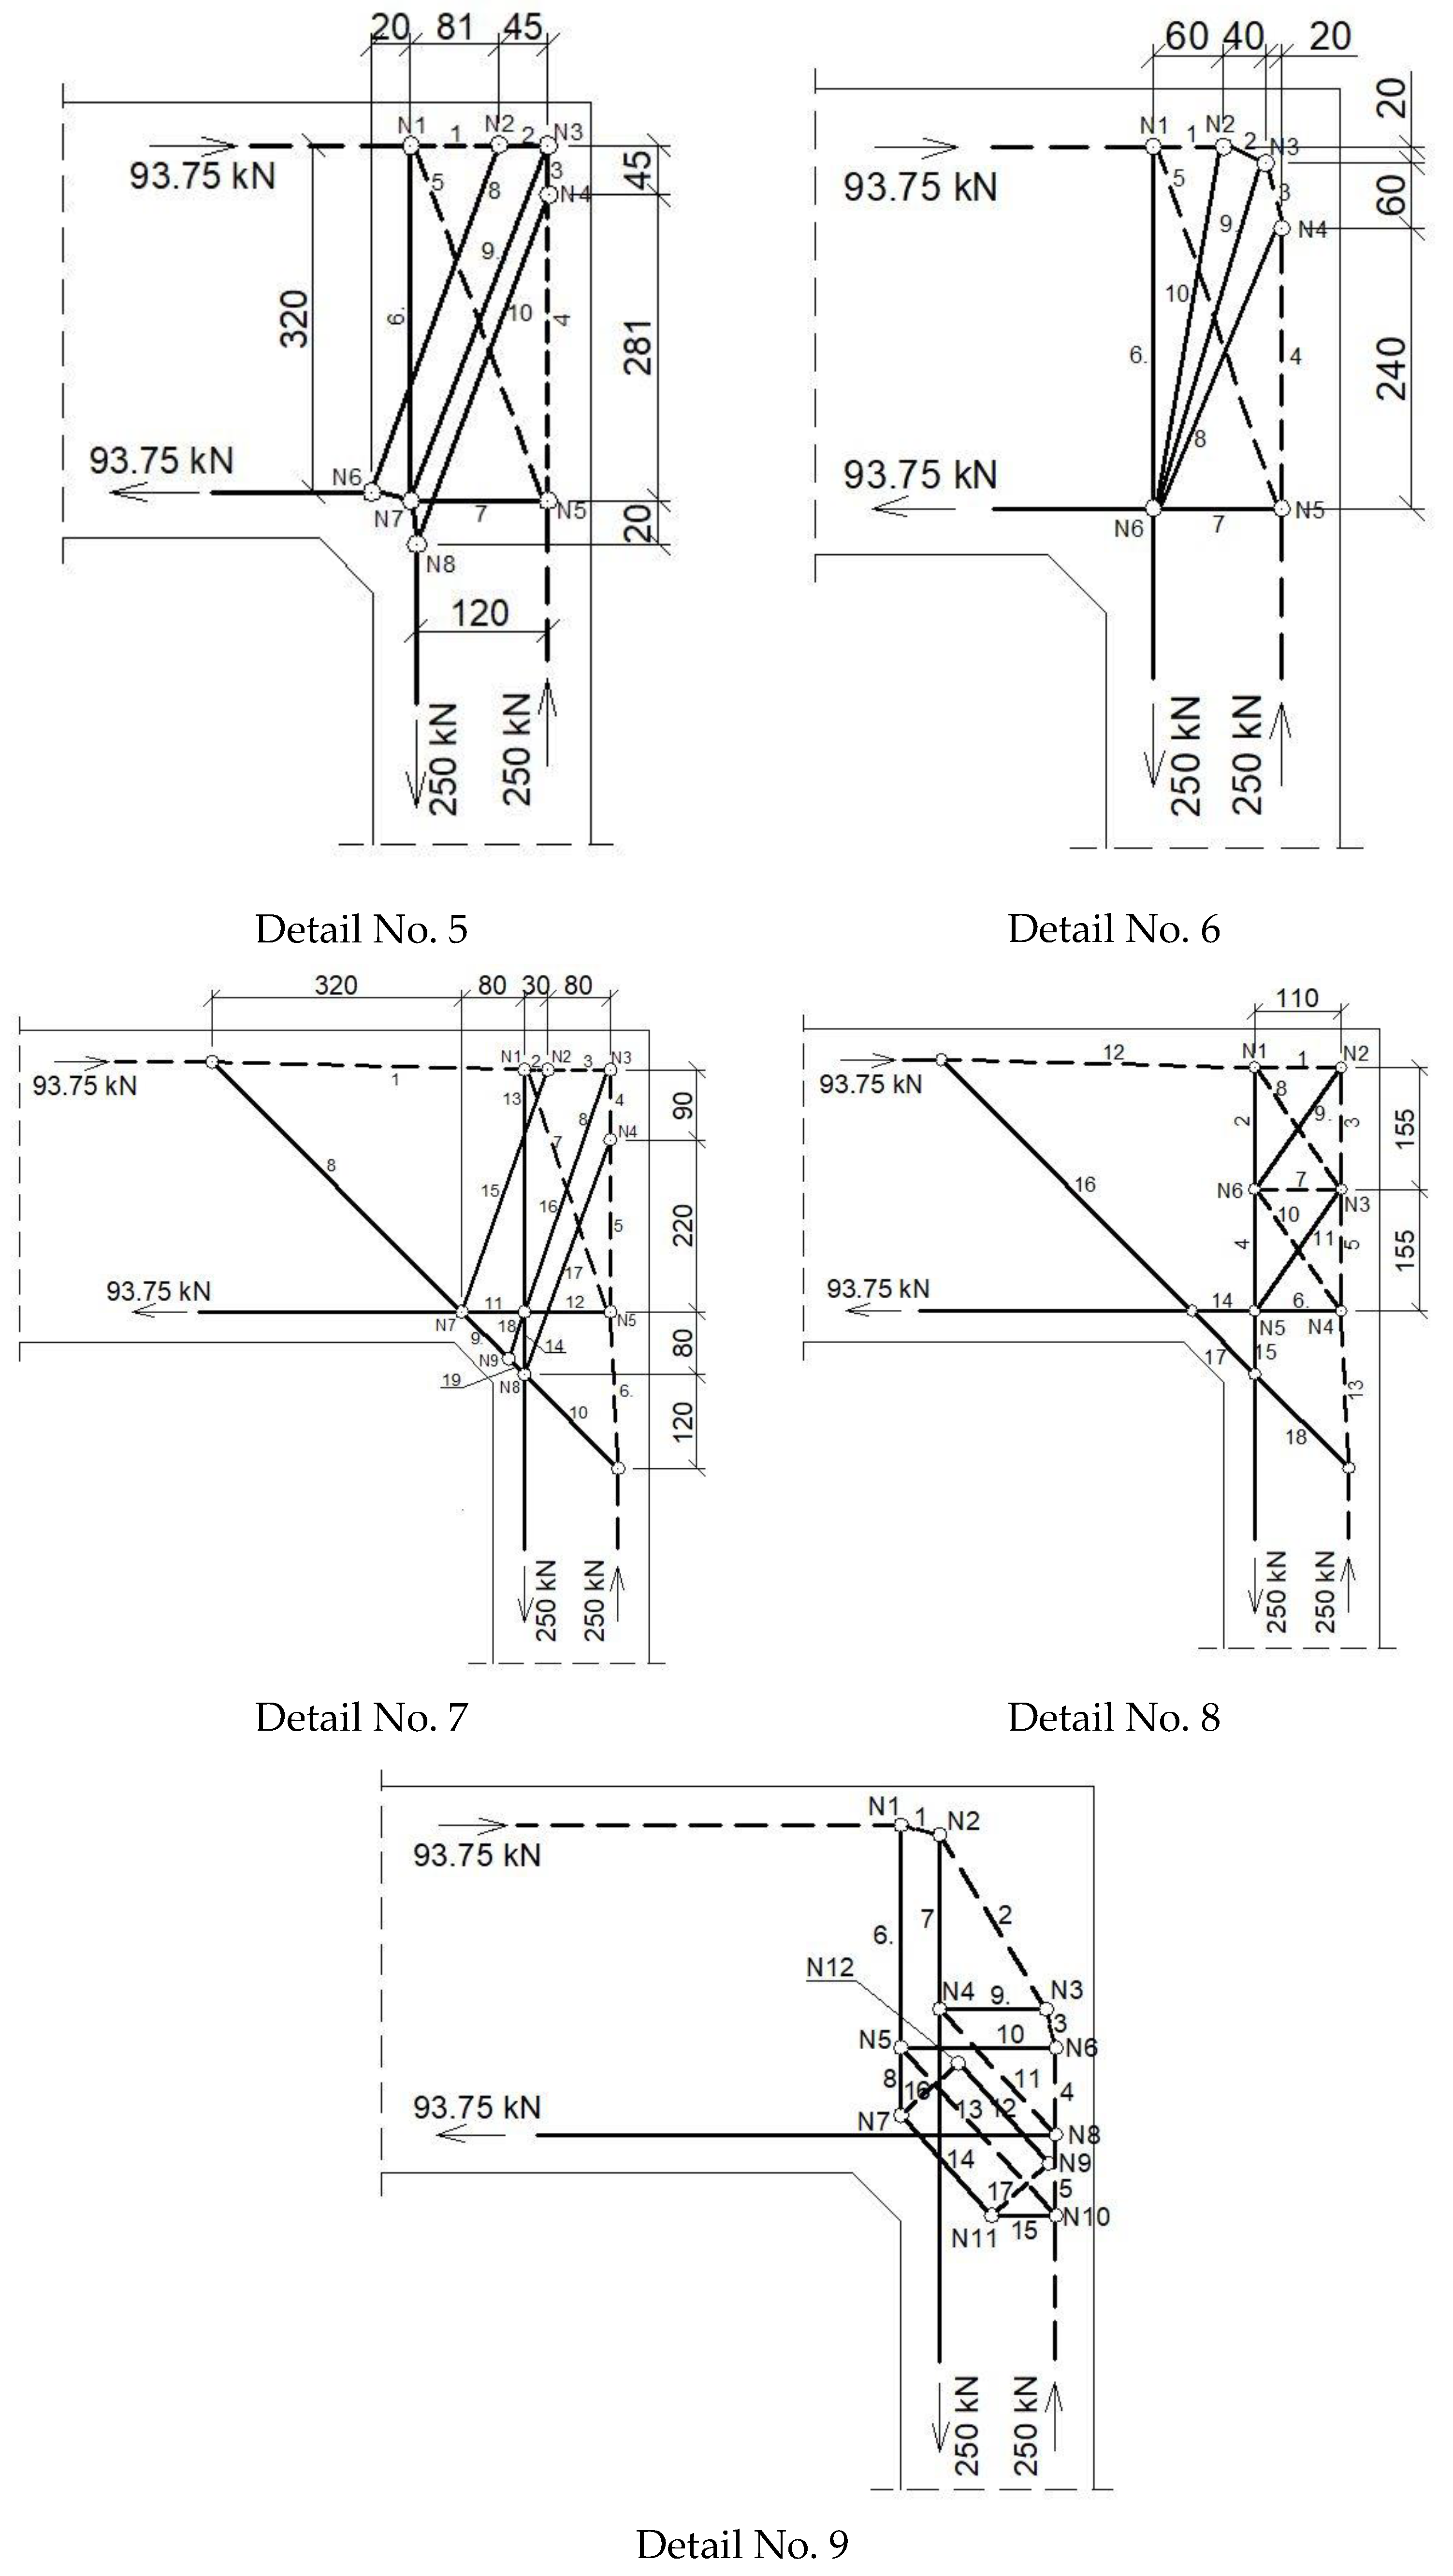
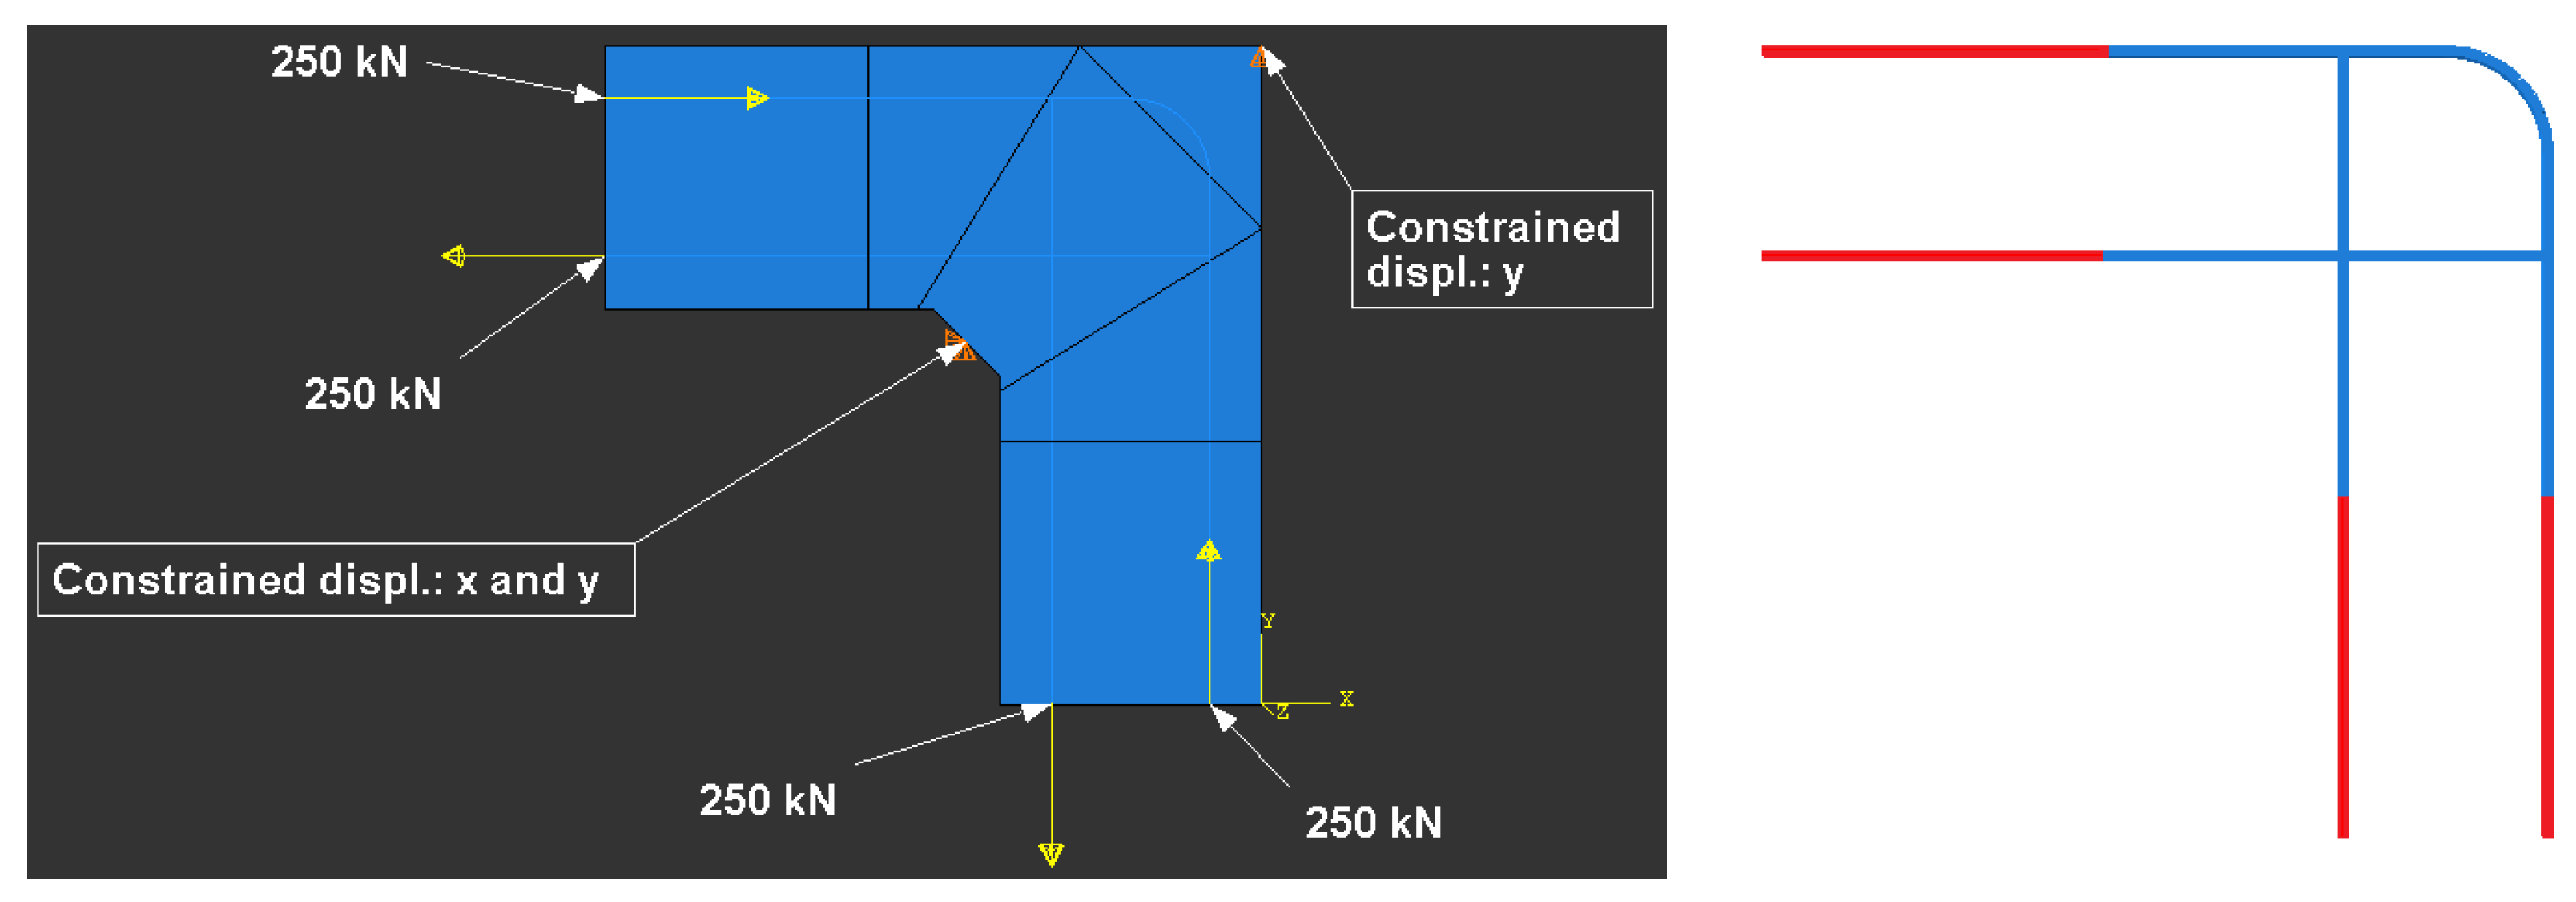
4.1.2. The Case of Elements with Different Cross Section Heights
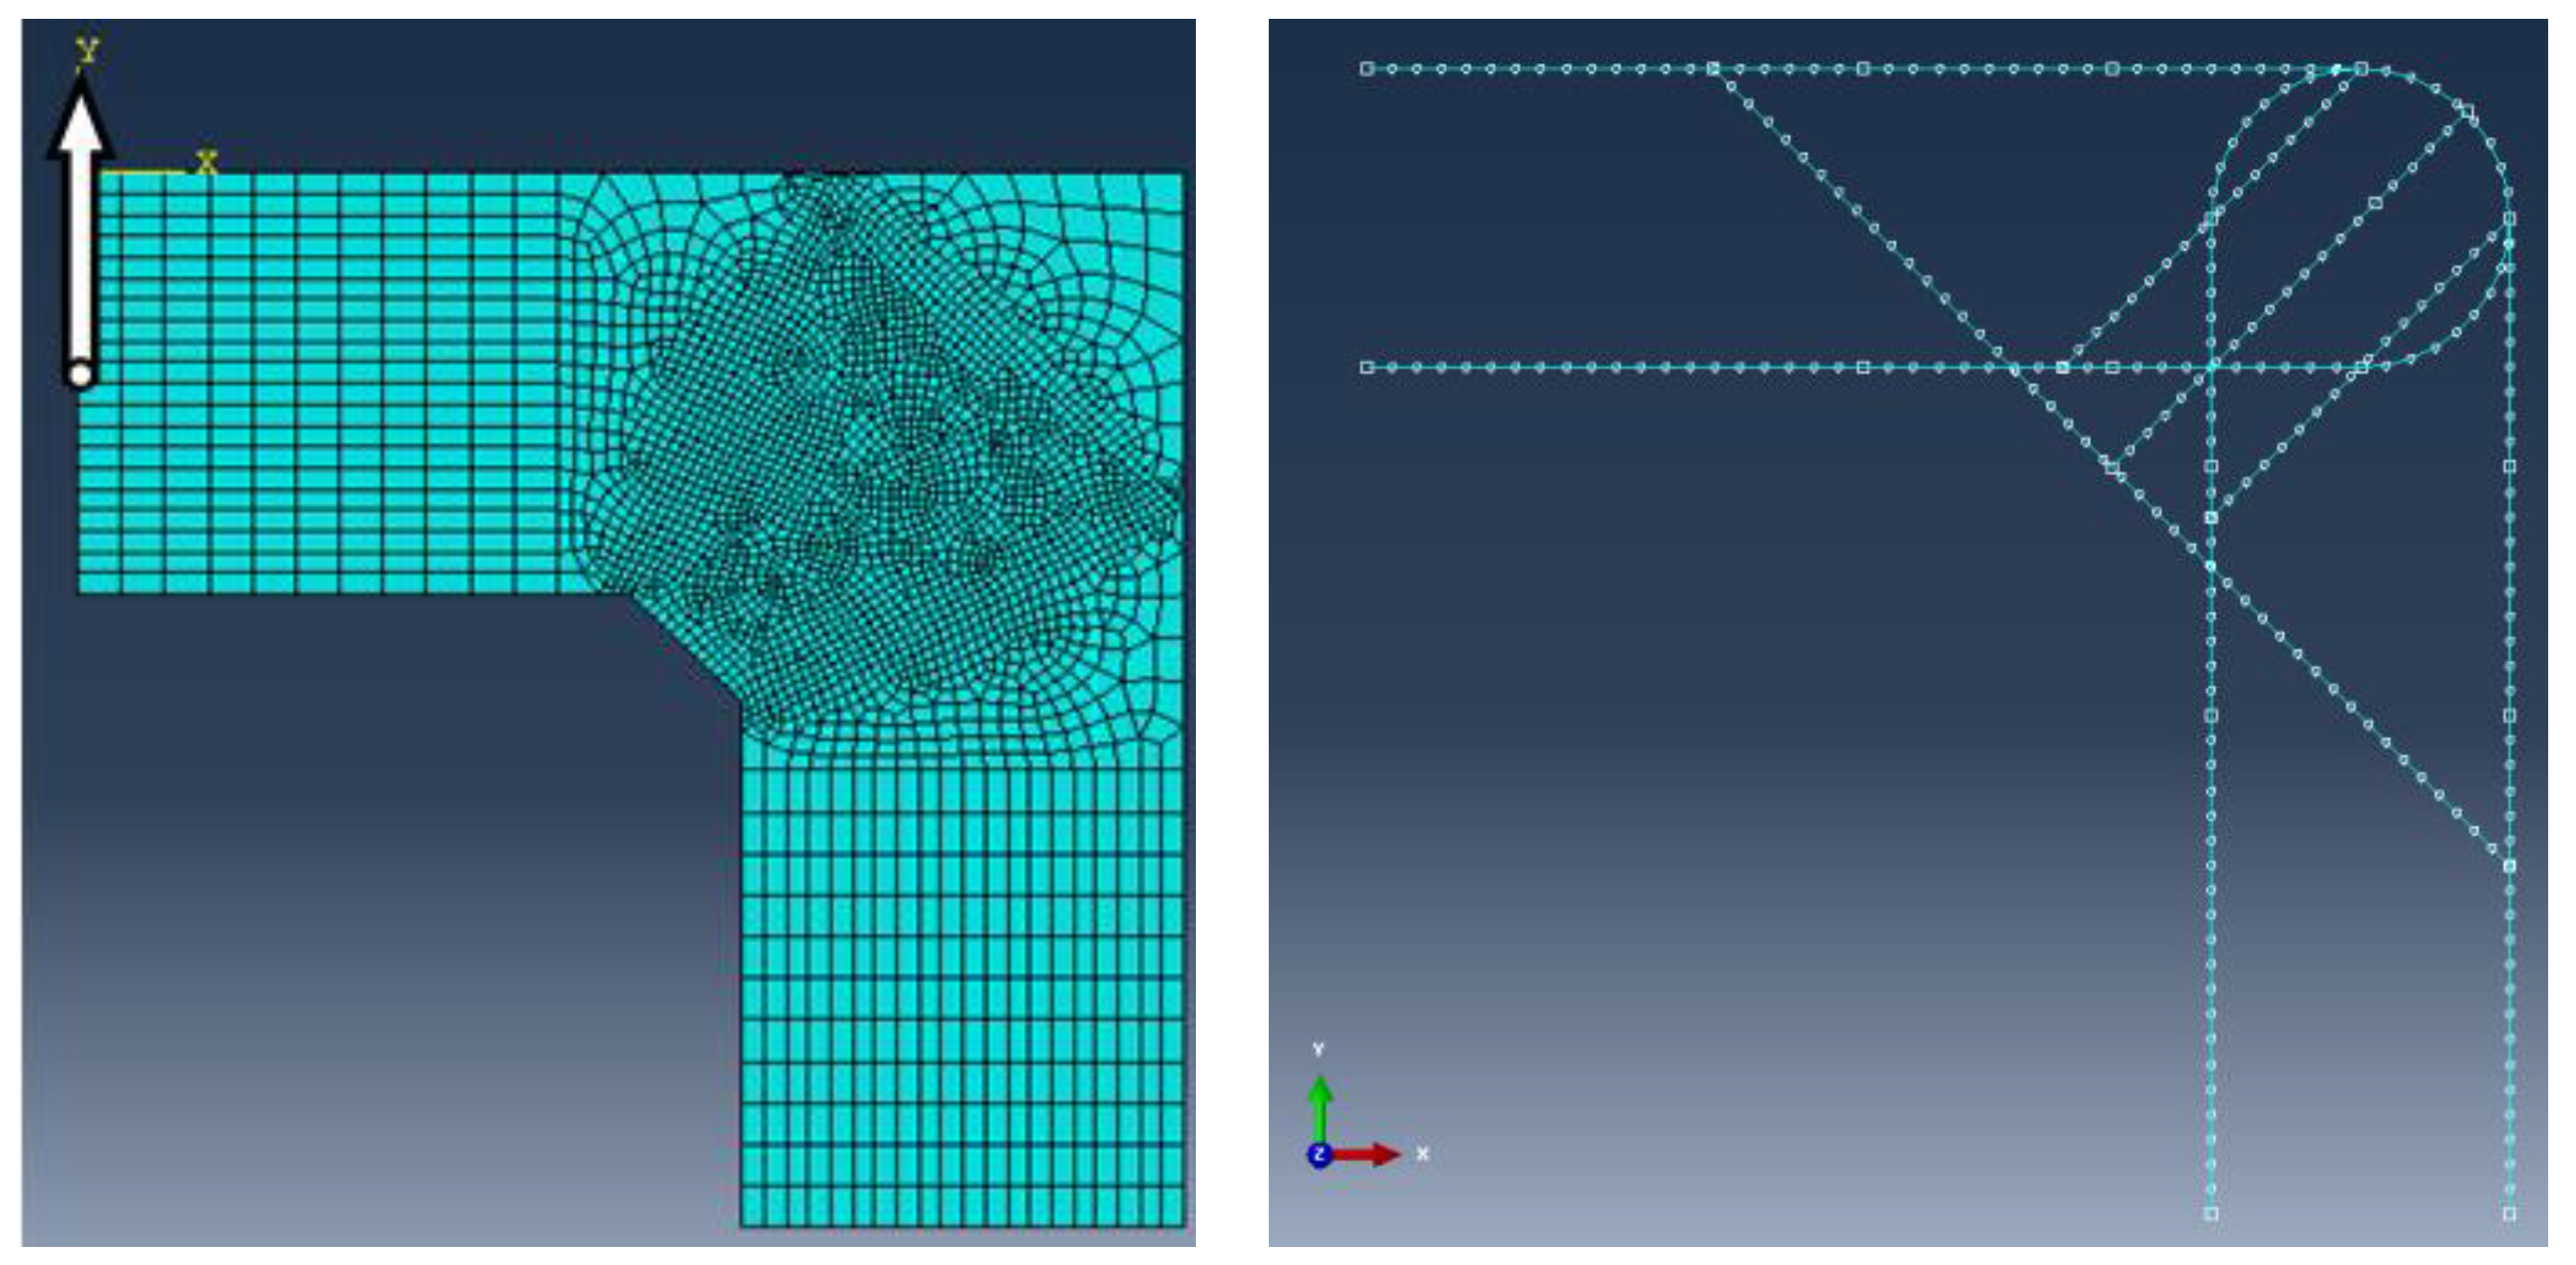
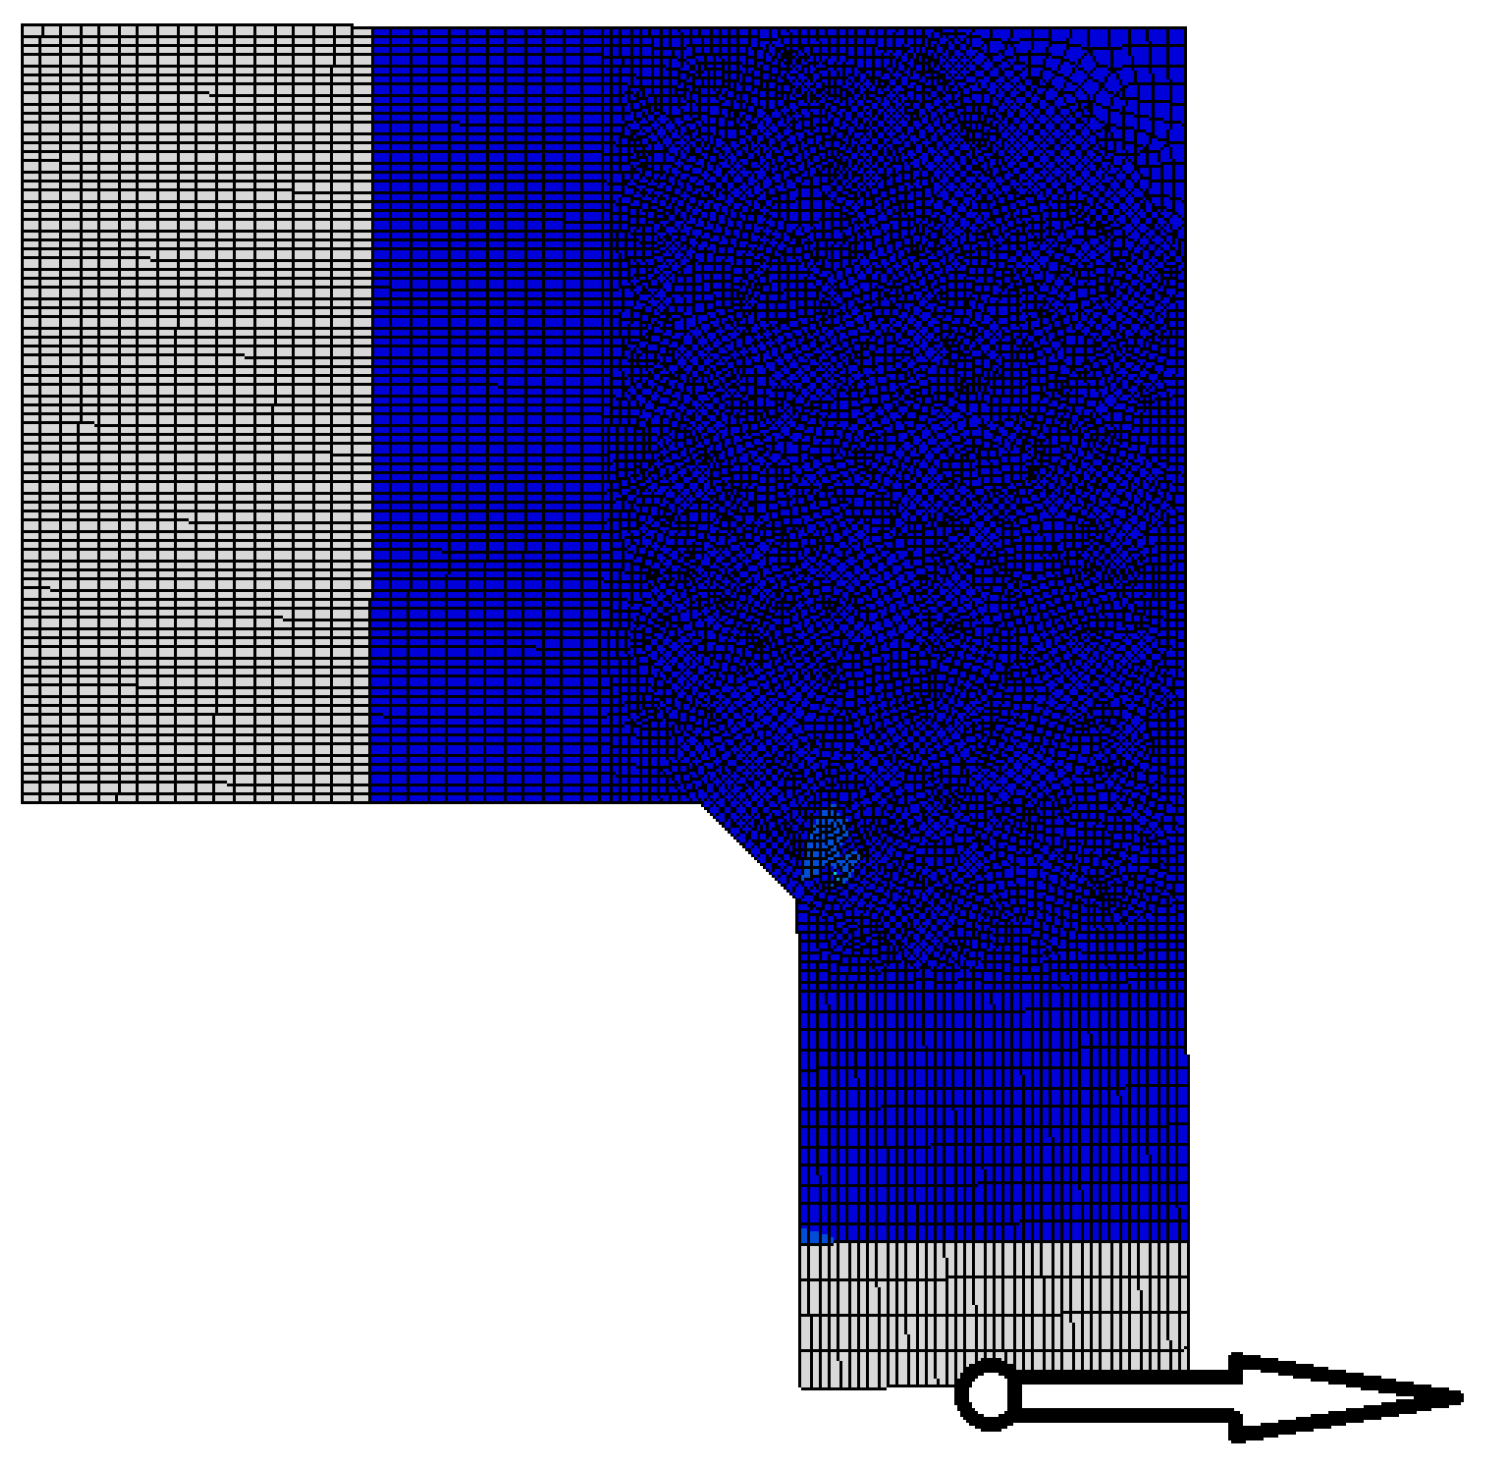
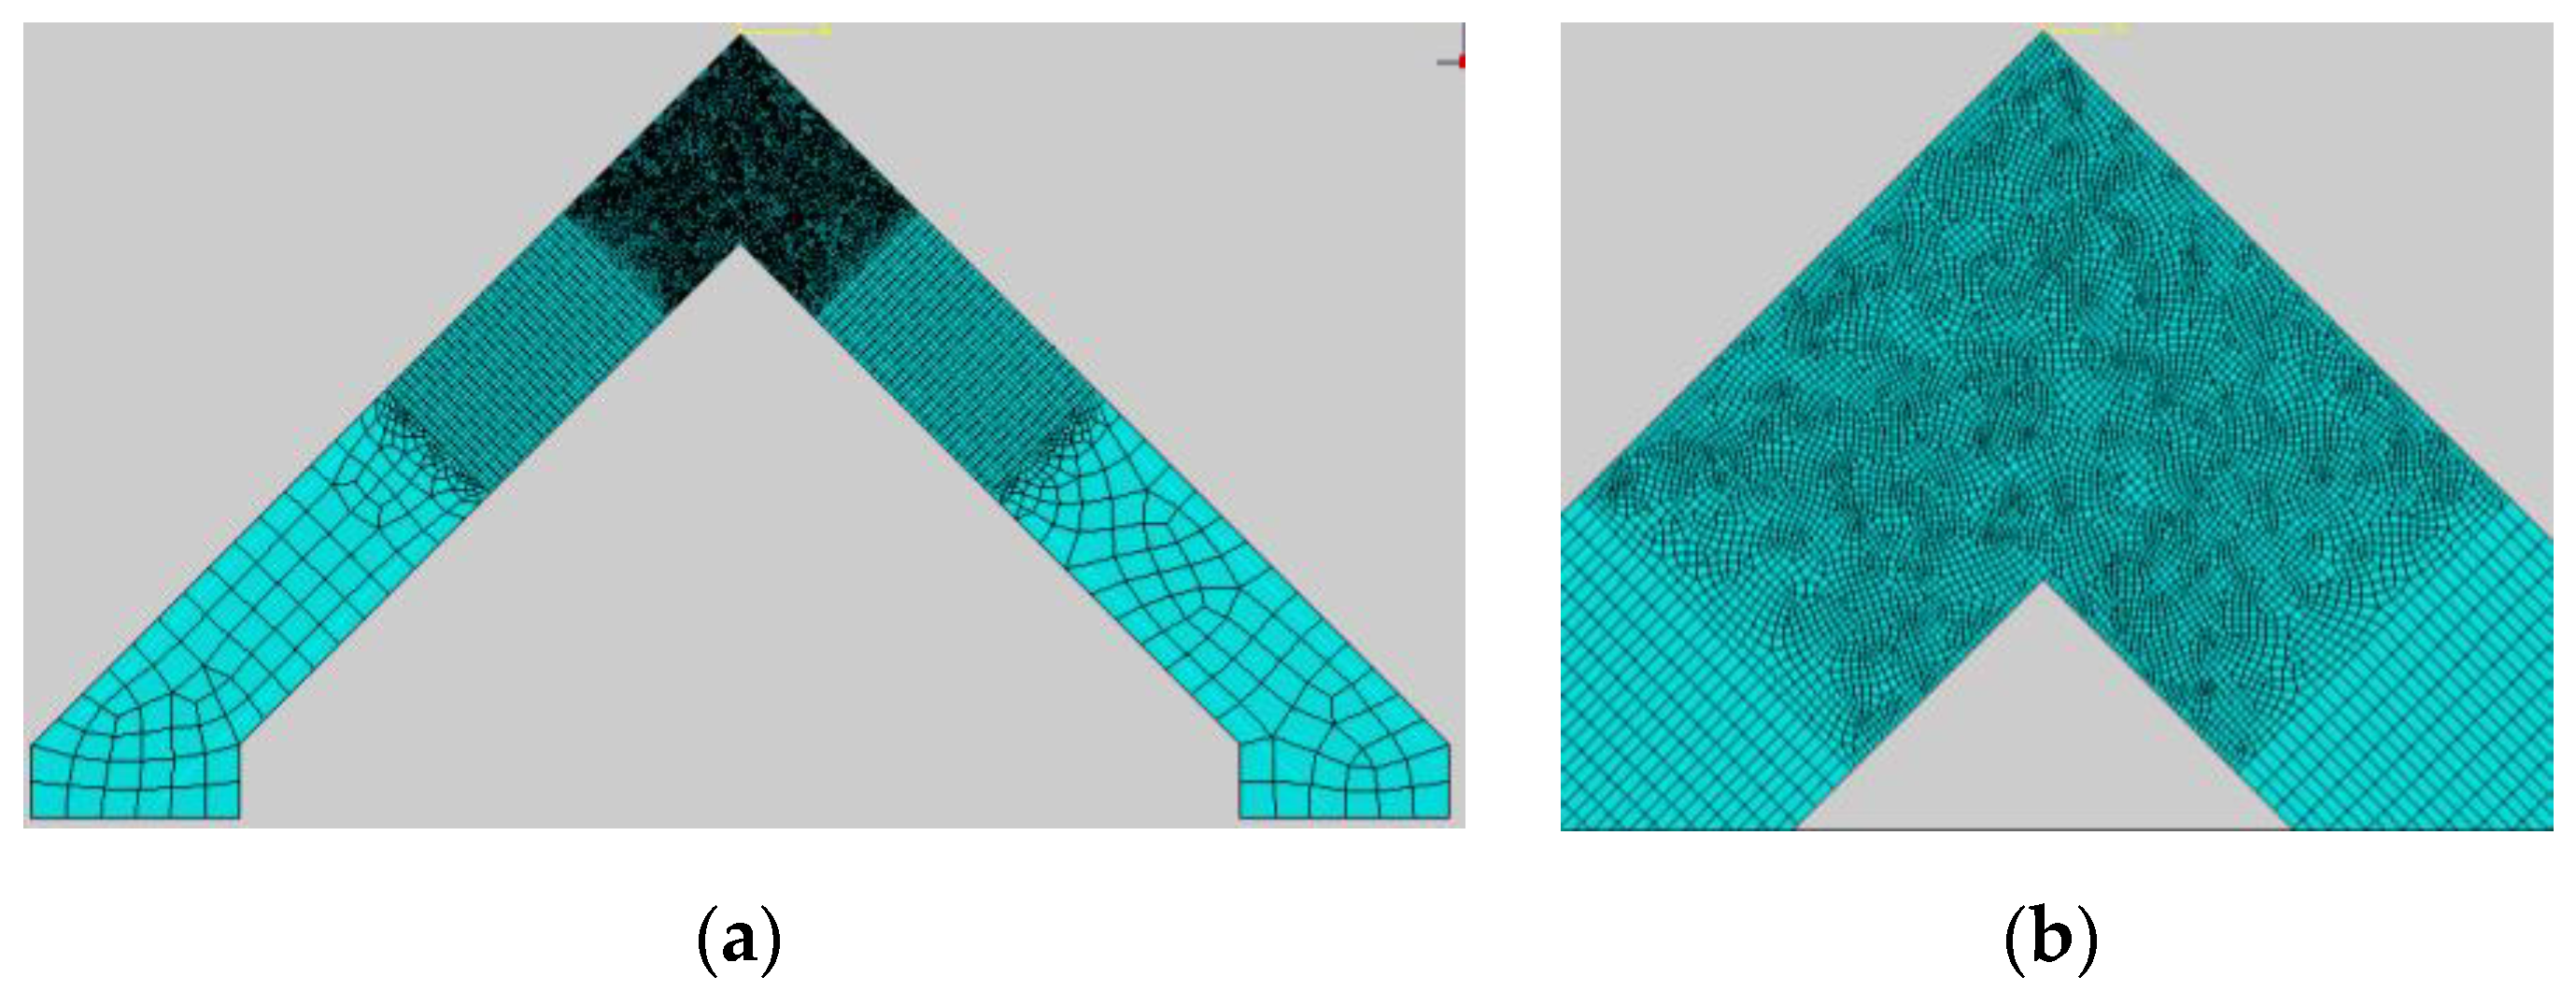
4.2. Calculations in FEM
4.2.1. The Case of Elements with the Same Cross Section Heights
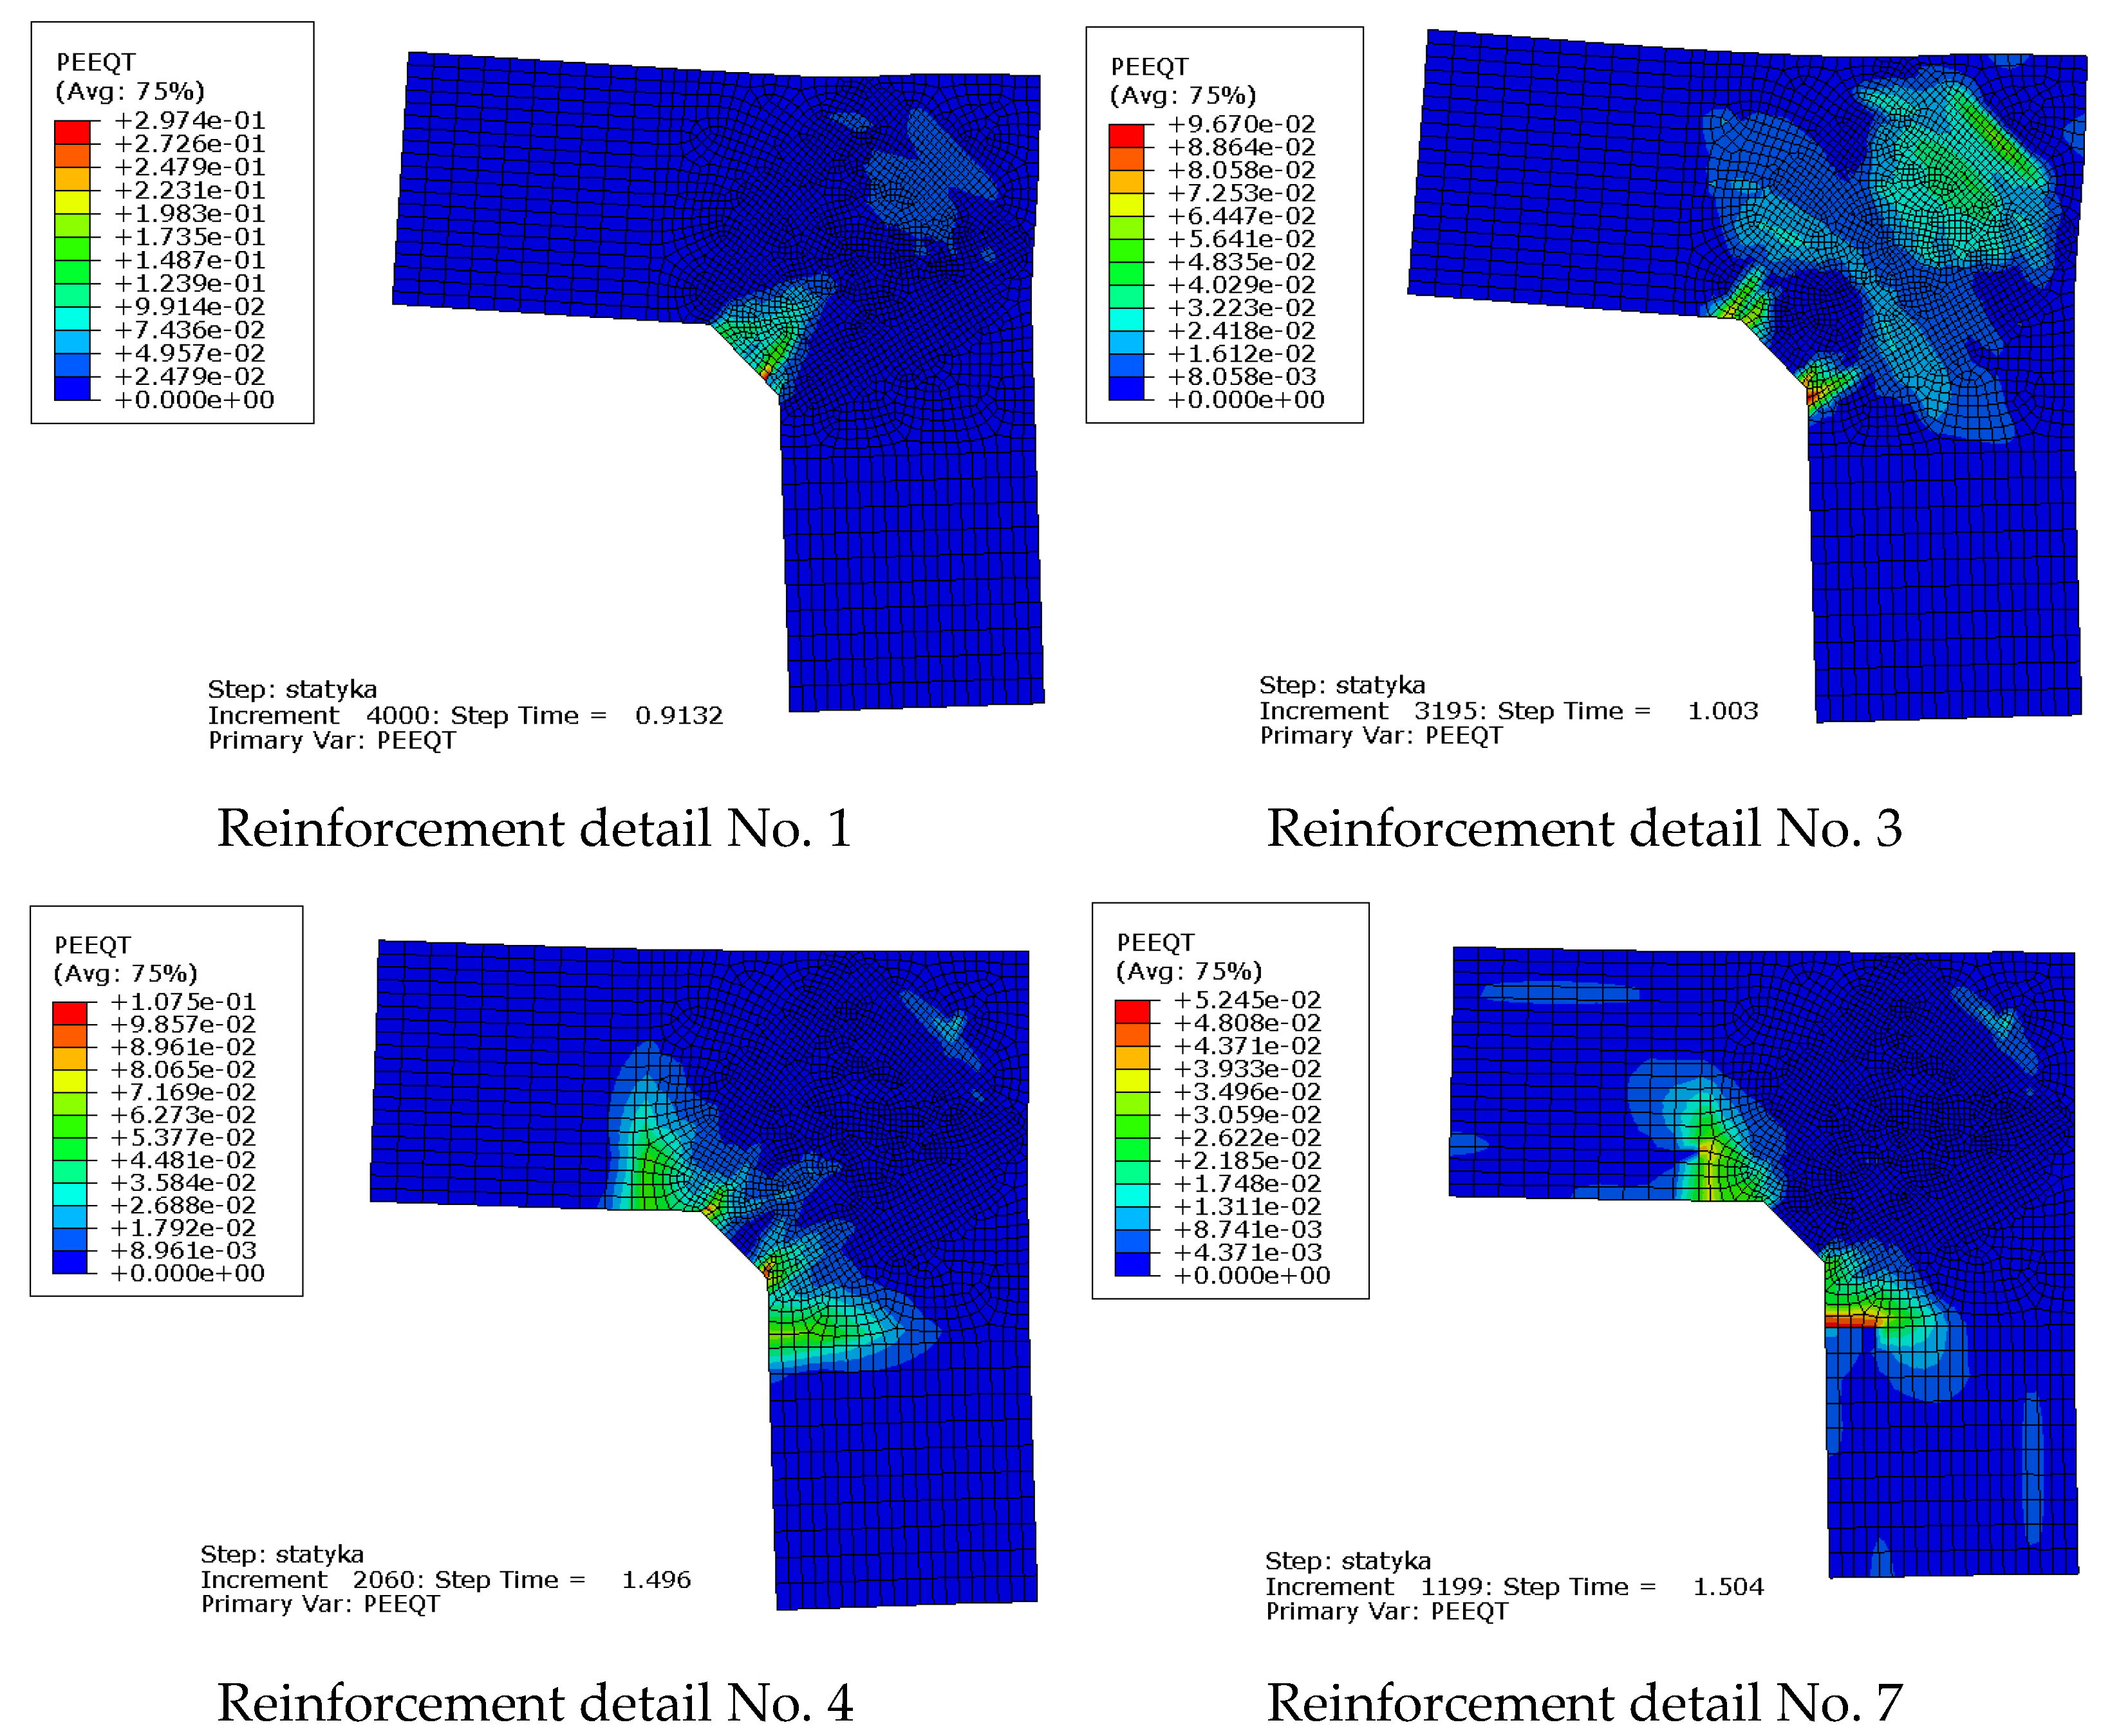
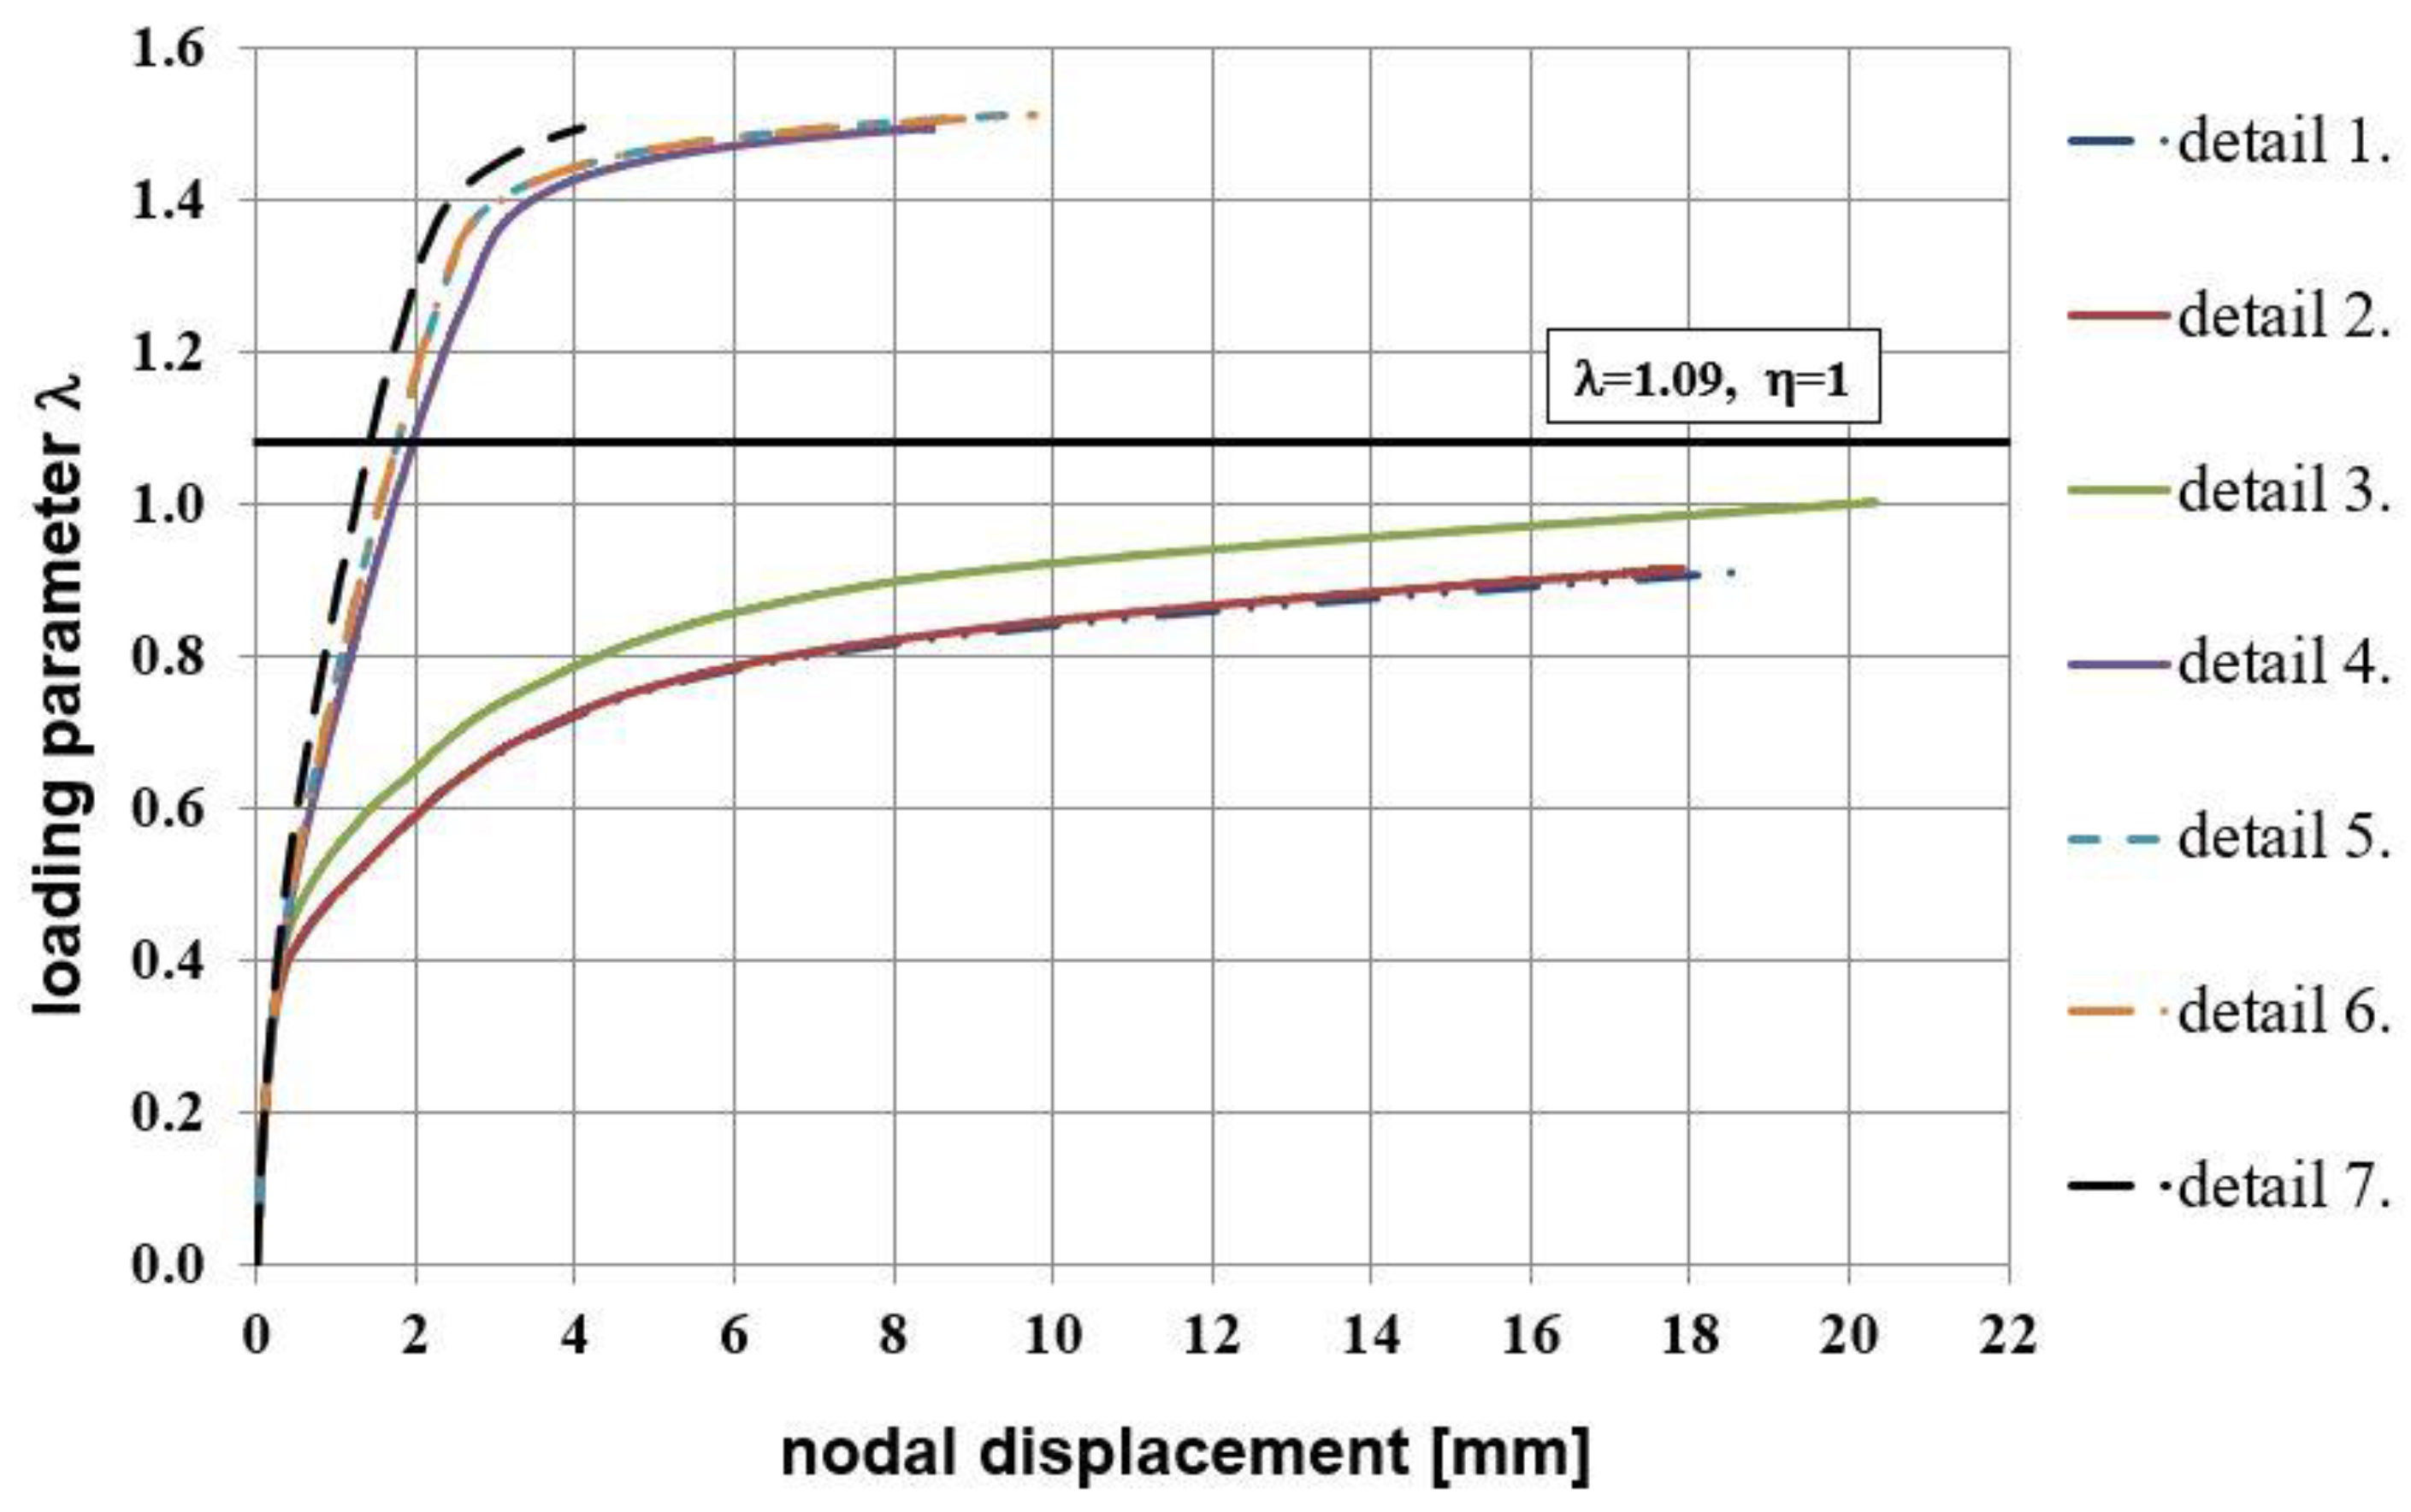
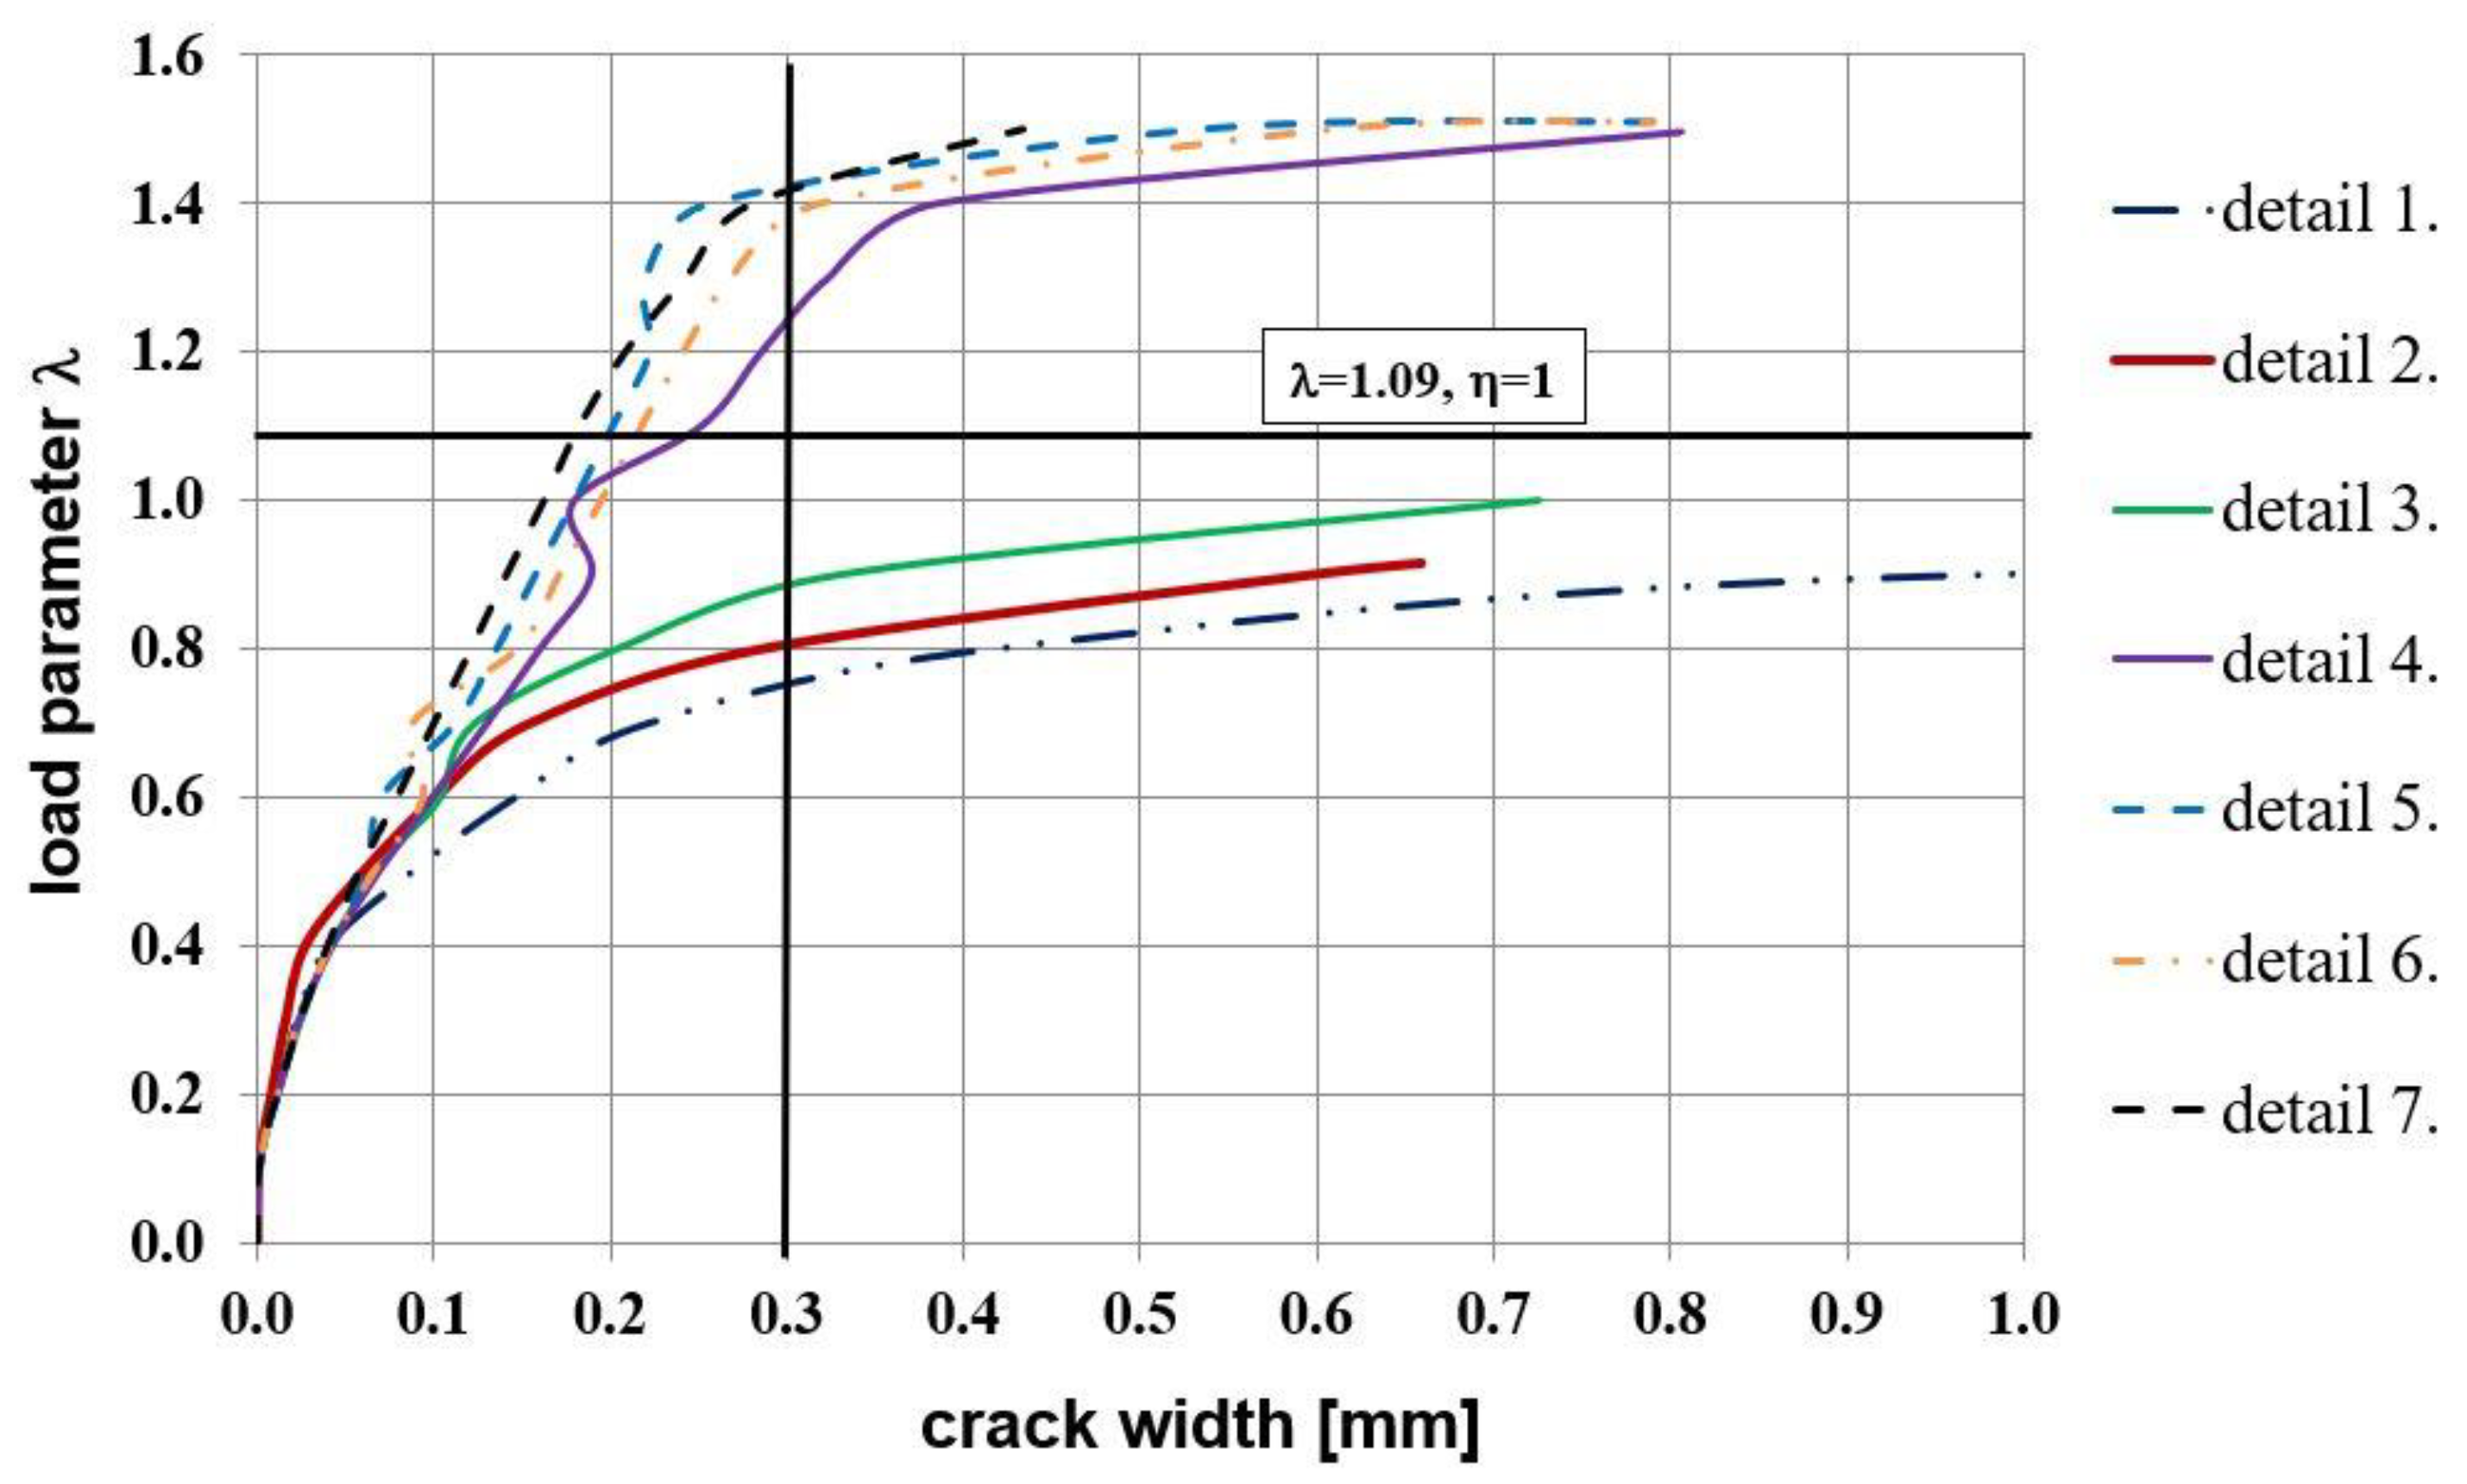
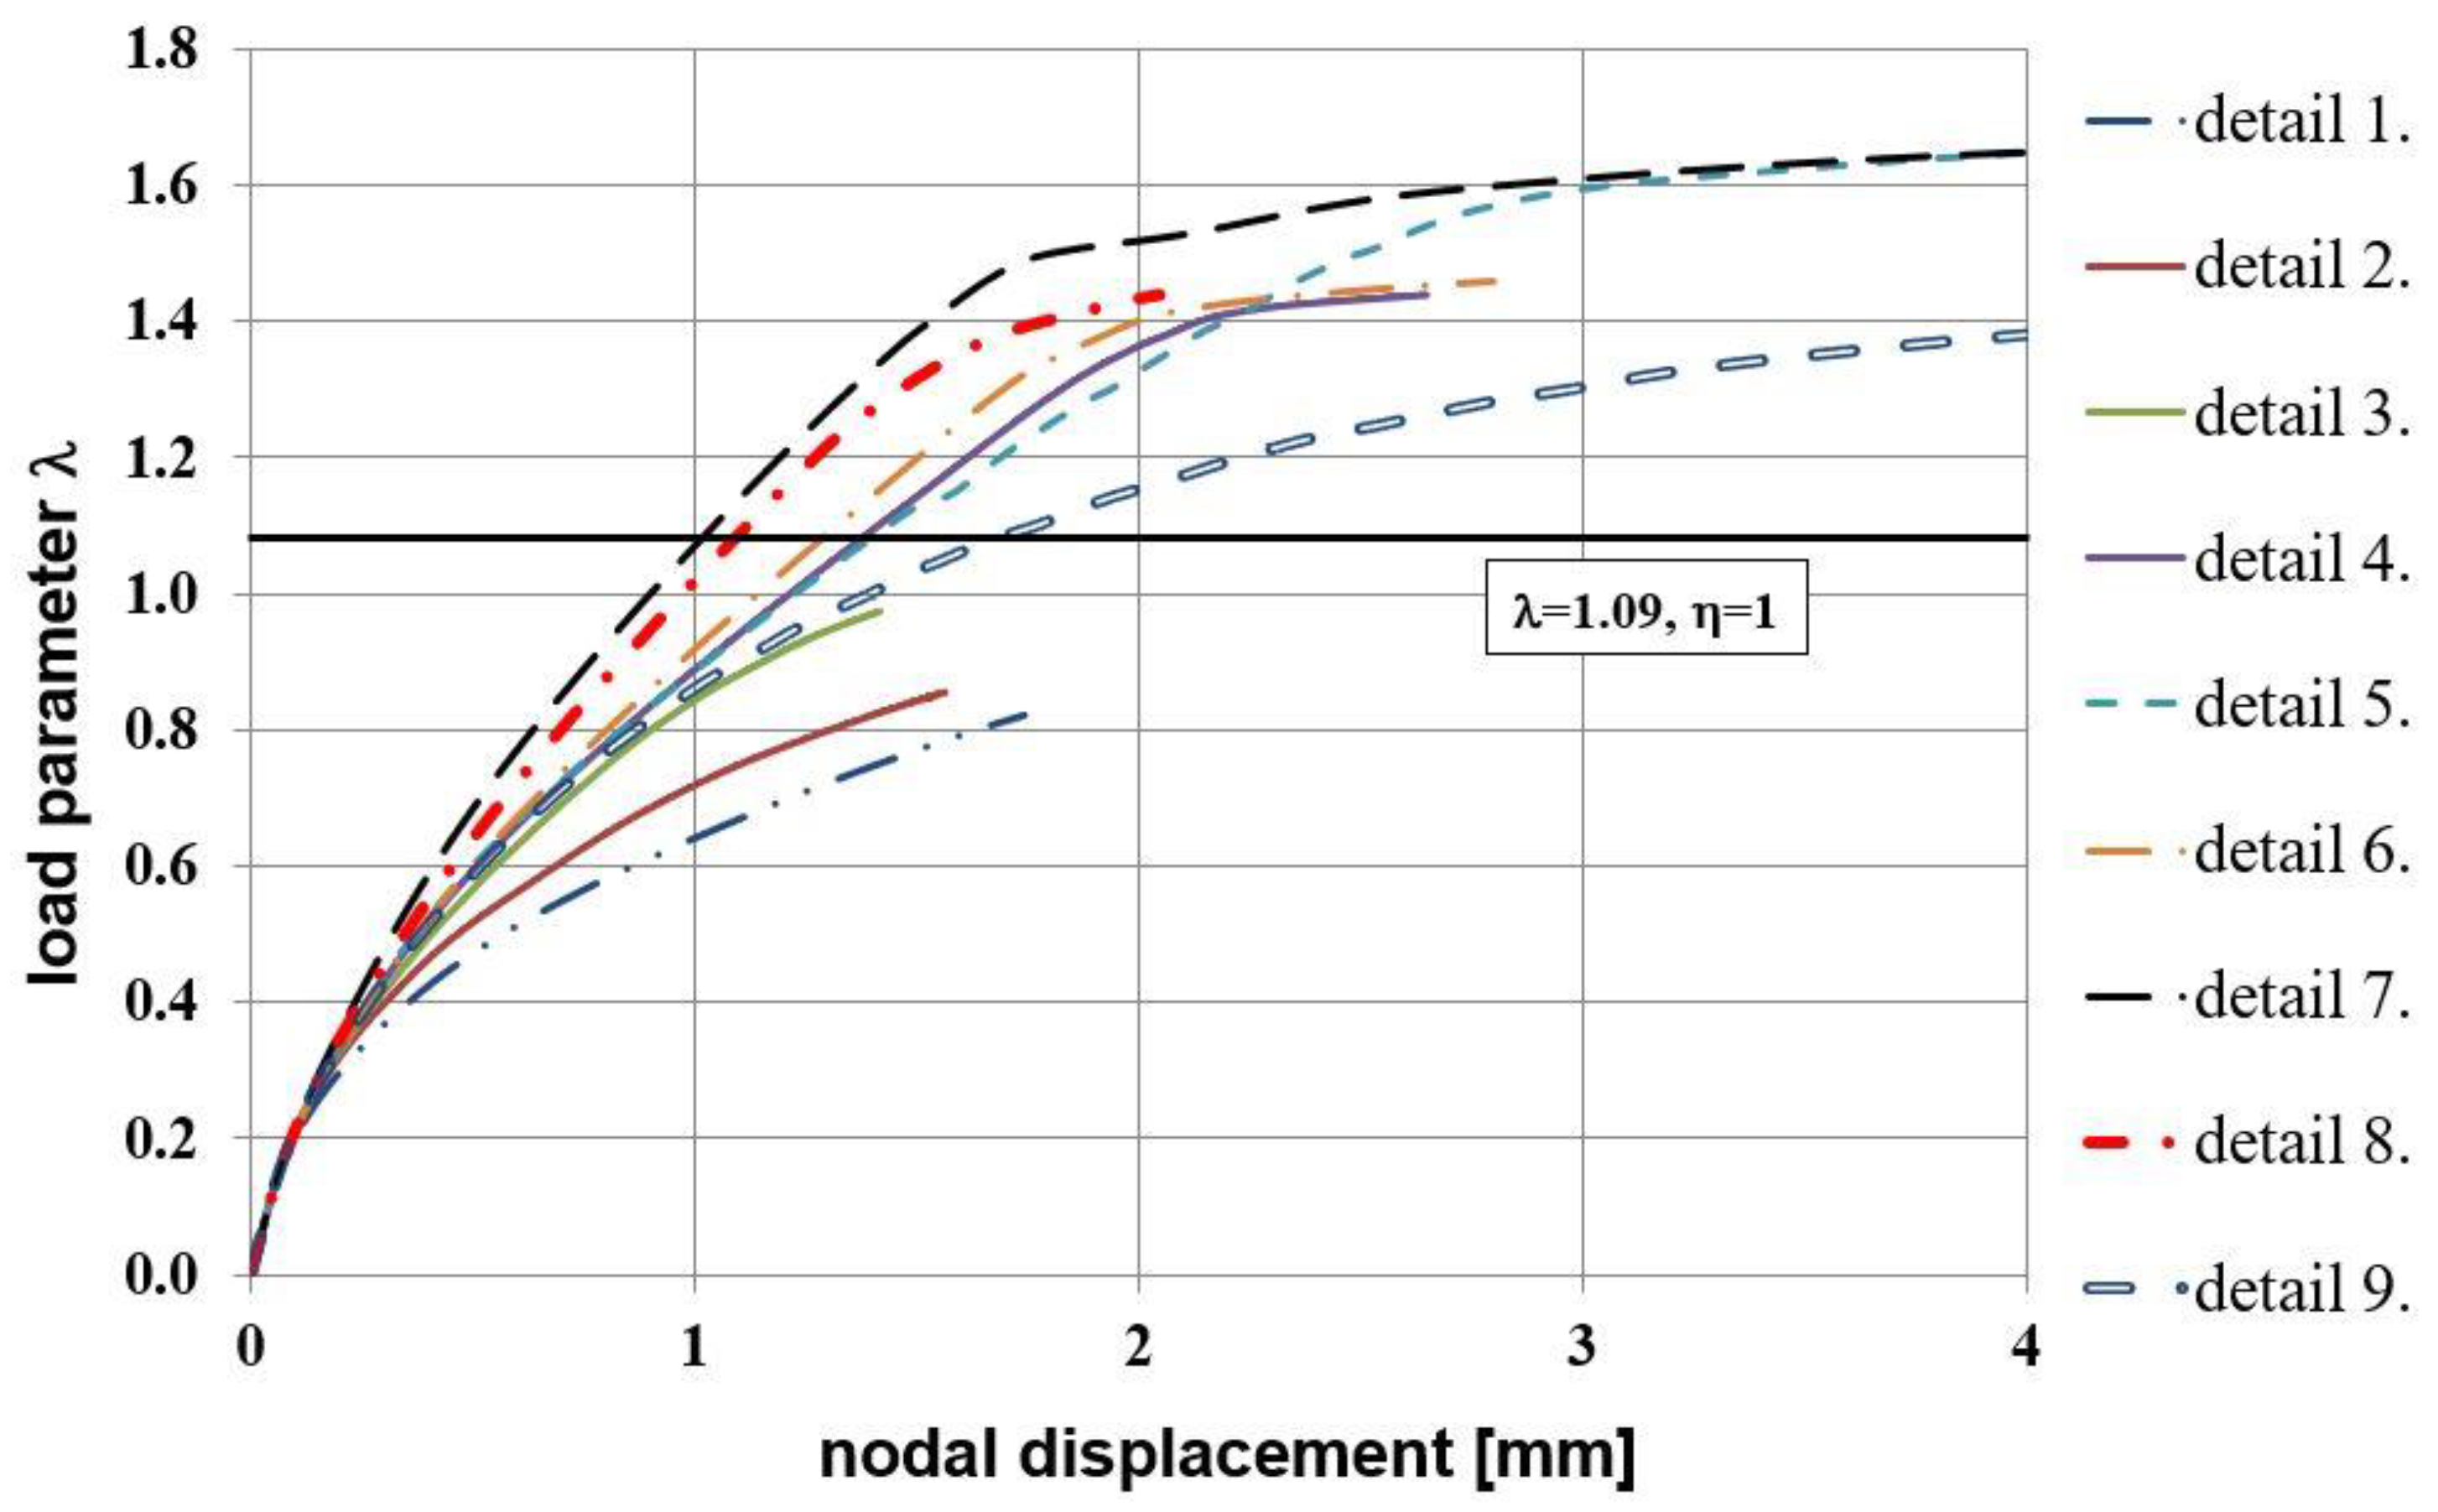
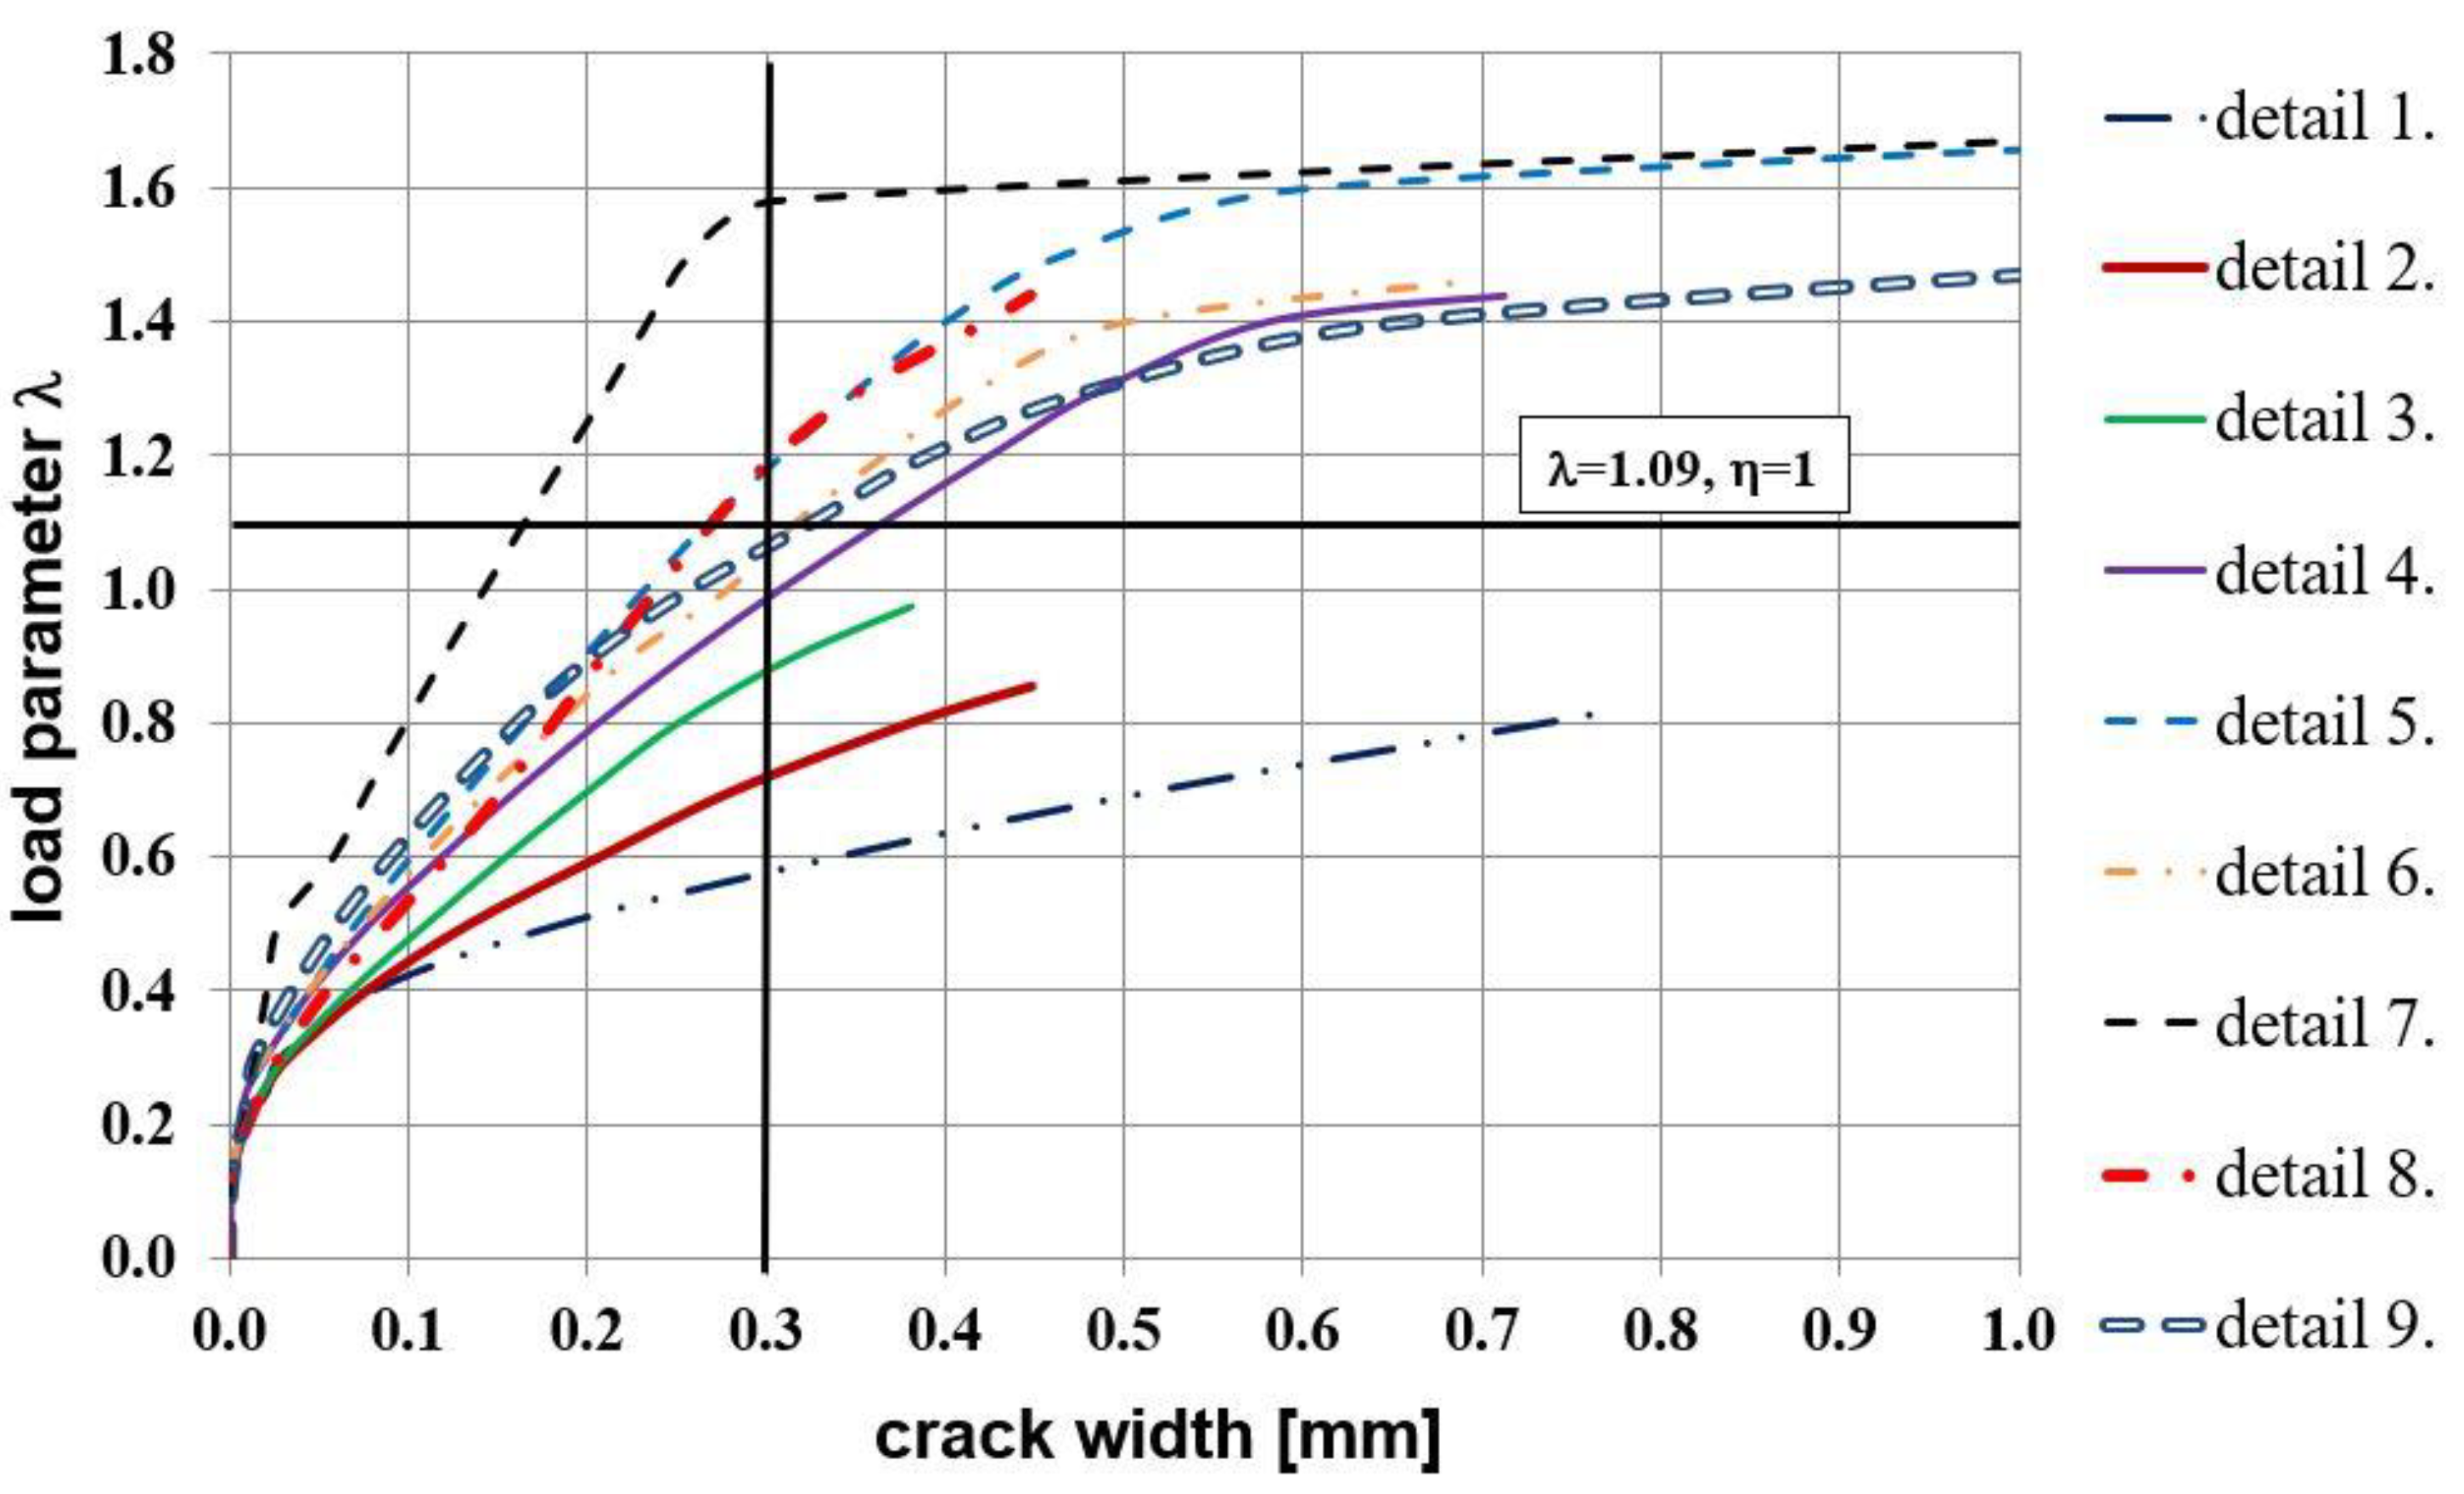
4.2.2. The Case of Elements with Different Cross Section Heights
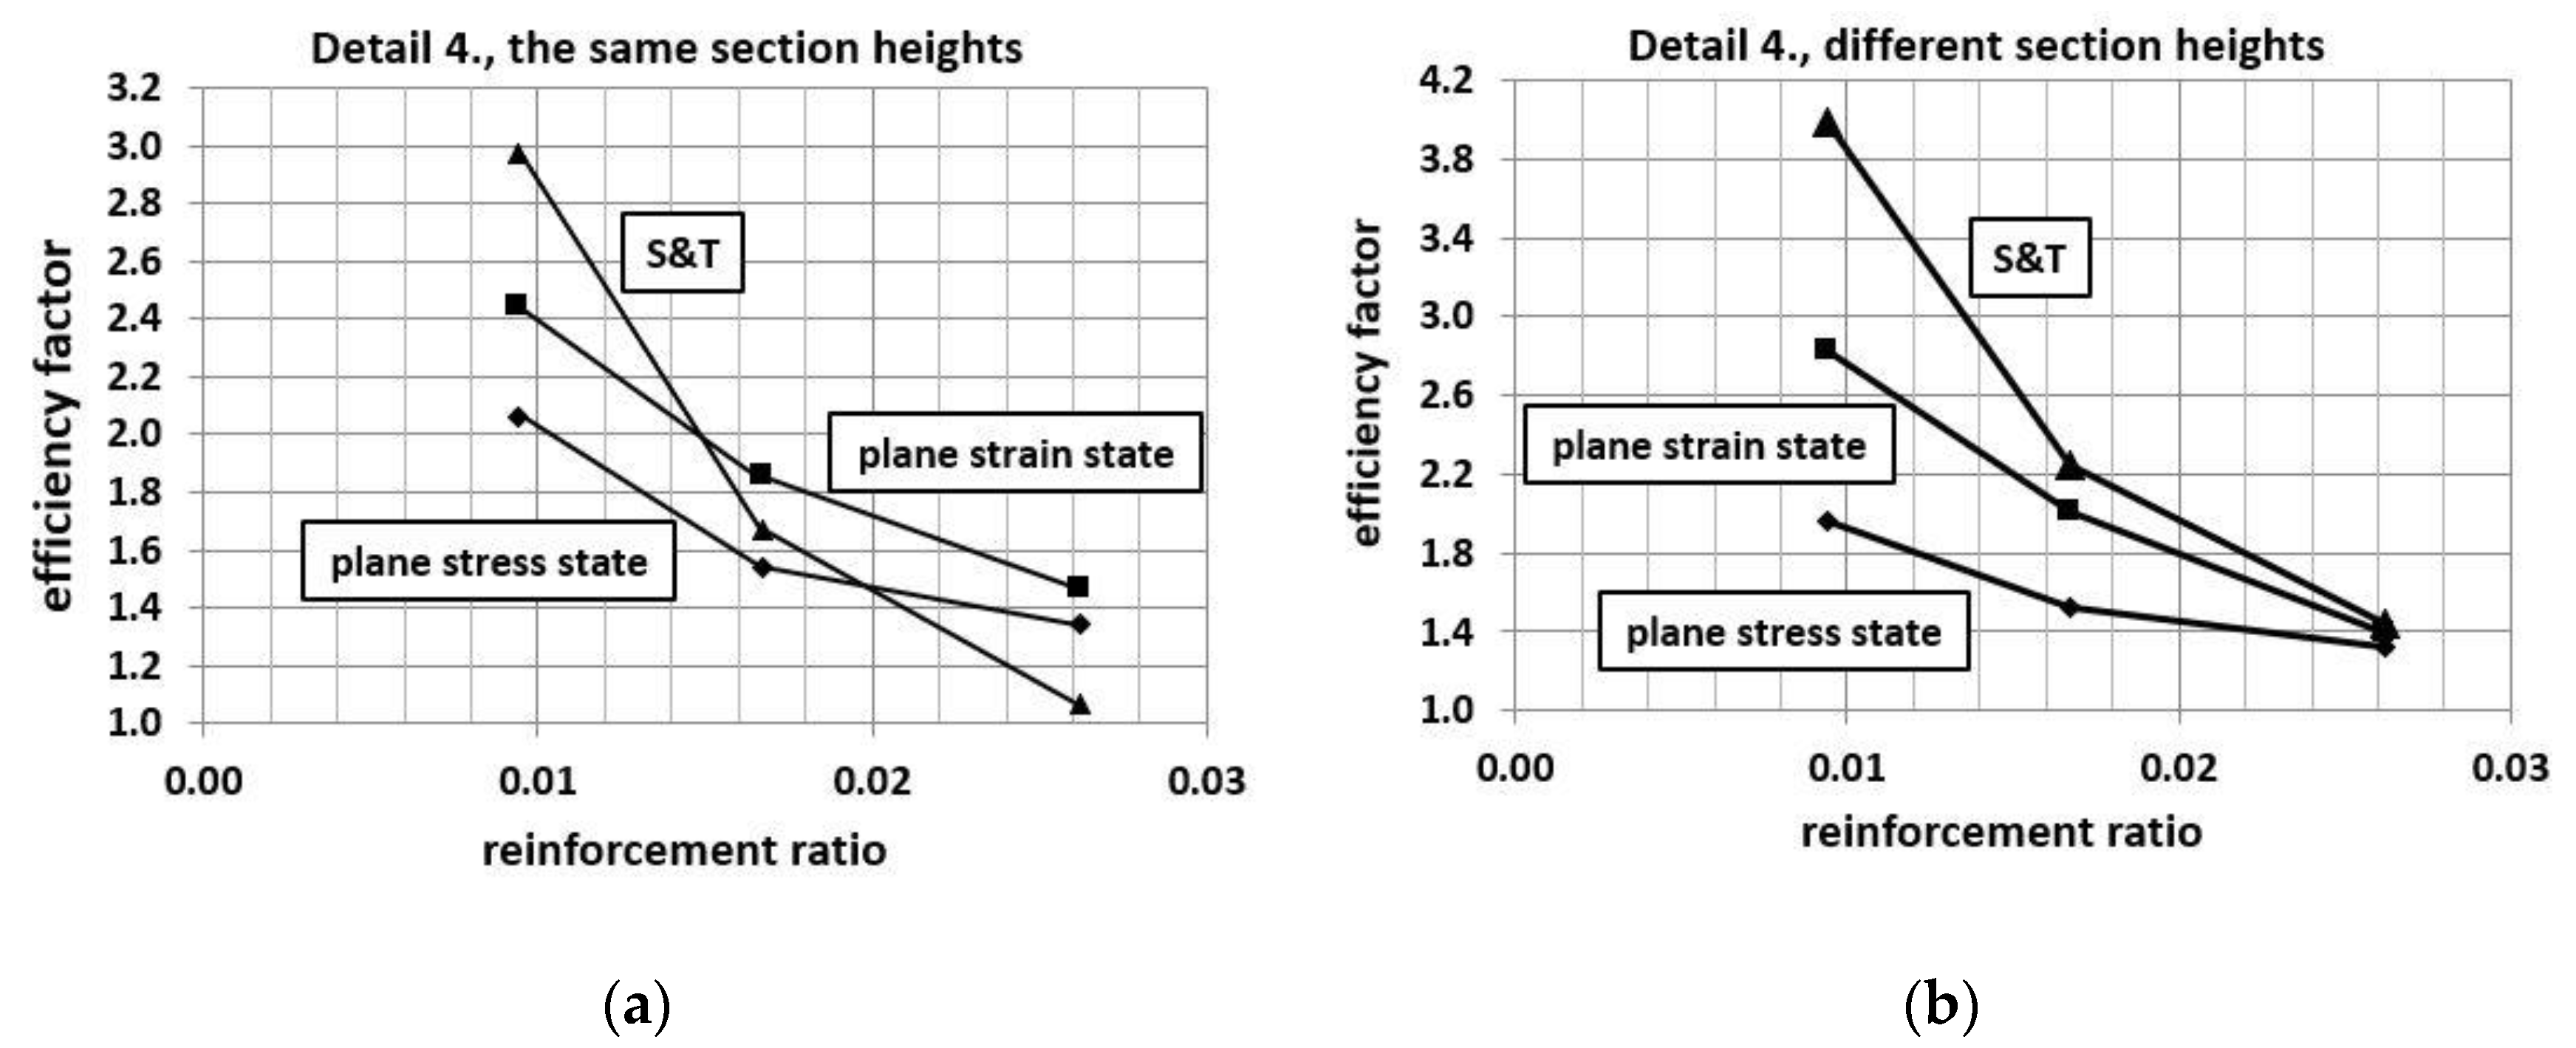
4.2.3. Influence of Reinforcement Ratio on the Efficiency Factor
4.2.4. Dependence of the Results on the Diagonal Reinforcement Area
5. Comparison of Numerical Results with Laboratory Tests
5.1. Efficiency Factors for the Case of Elements with the Same Cross Section Heights
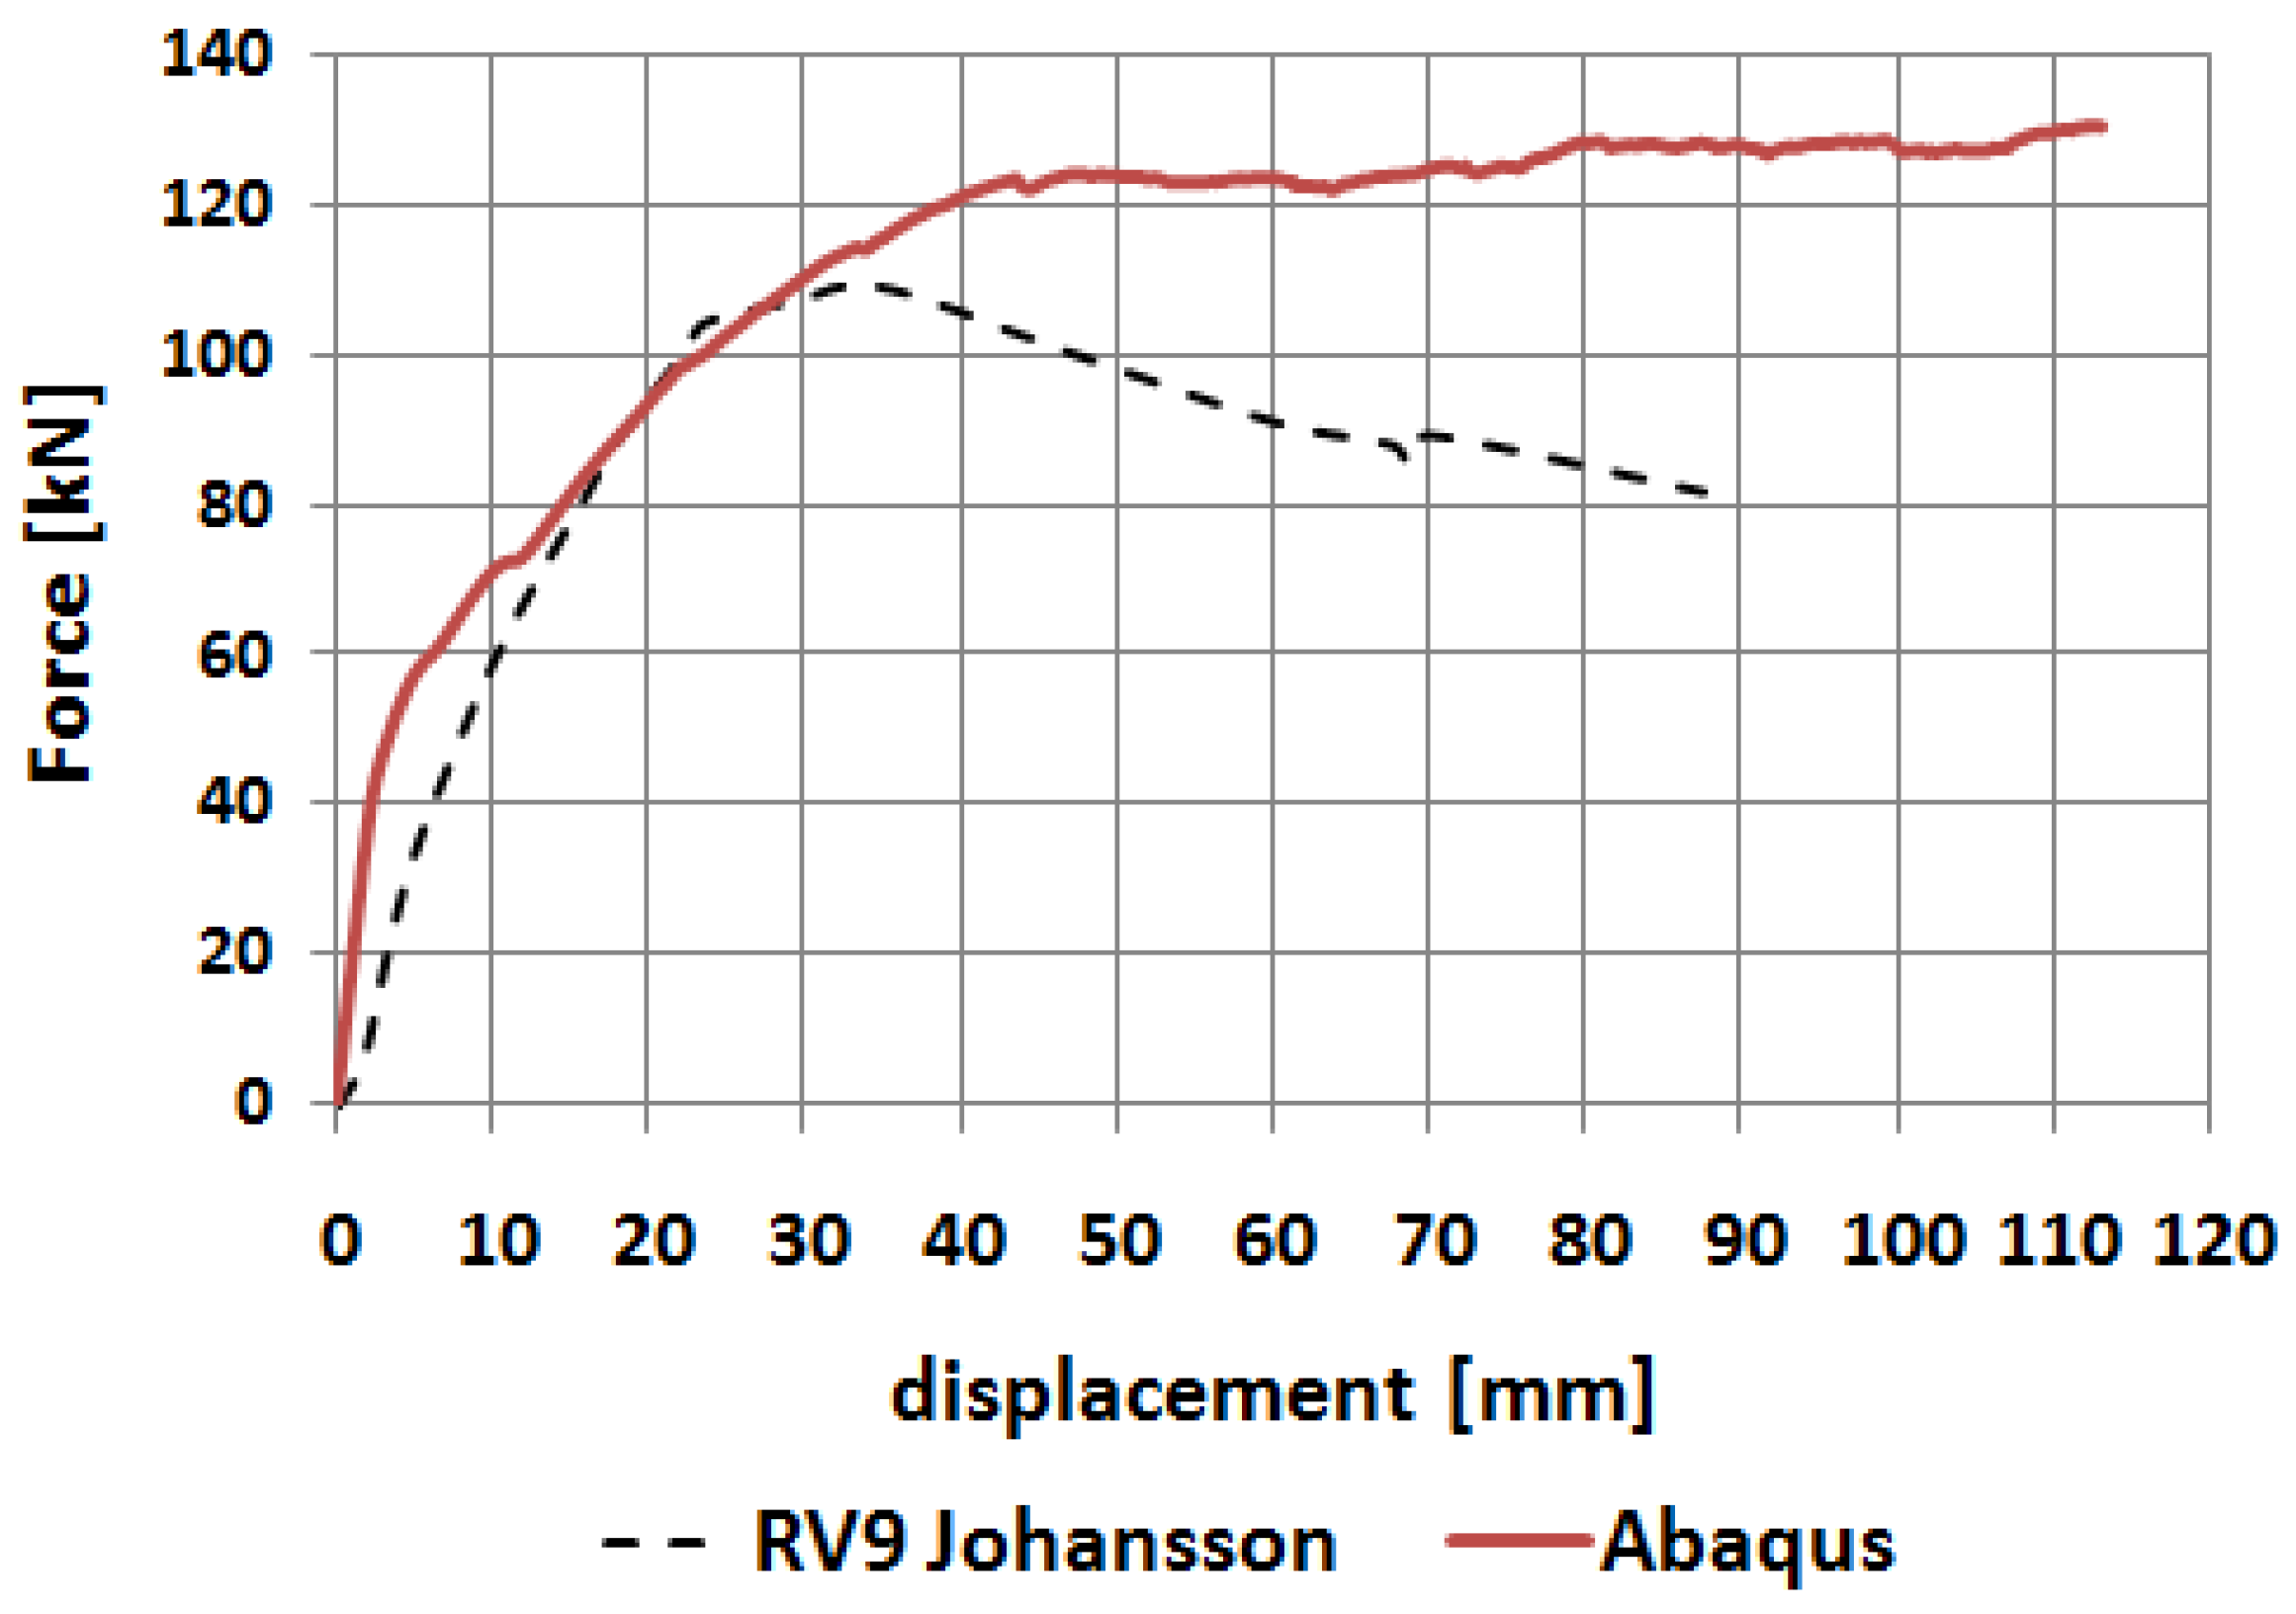
5.2. Comparison with Johansson’s Laboratory Tests
- Concrete: fc = 32.2 MPa, Ec = 31 GPa, ν = 0.2, ft = 2.6 MPa, Gf = 136.4 N/m,
- Reinforcing steel: fy = 570 MPa, Es = 200 GPa, ν = 0.3.
6. Conclusions
- (1)
- It is possible to choose a rational reinforcement detail for a corner under opening moment even in the case of elements with different cross section heights using a combination of the S&T method and FEM.
- (2)
- (3)
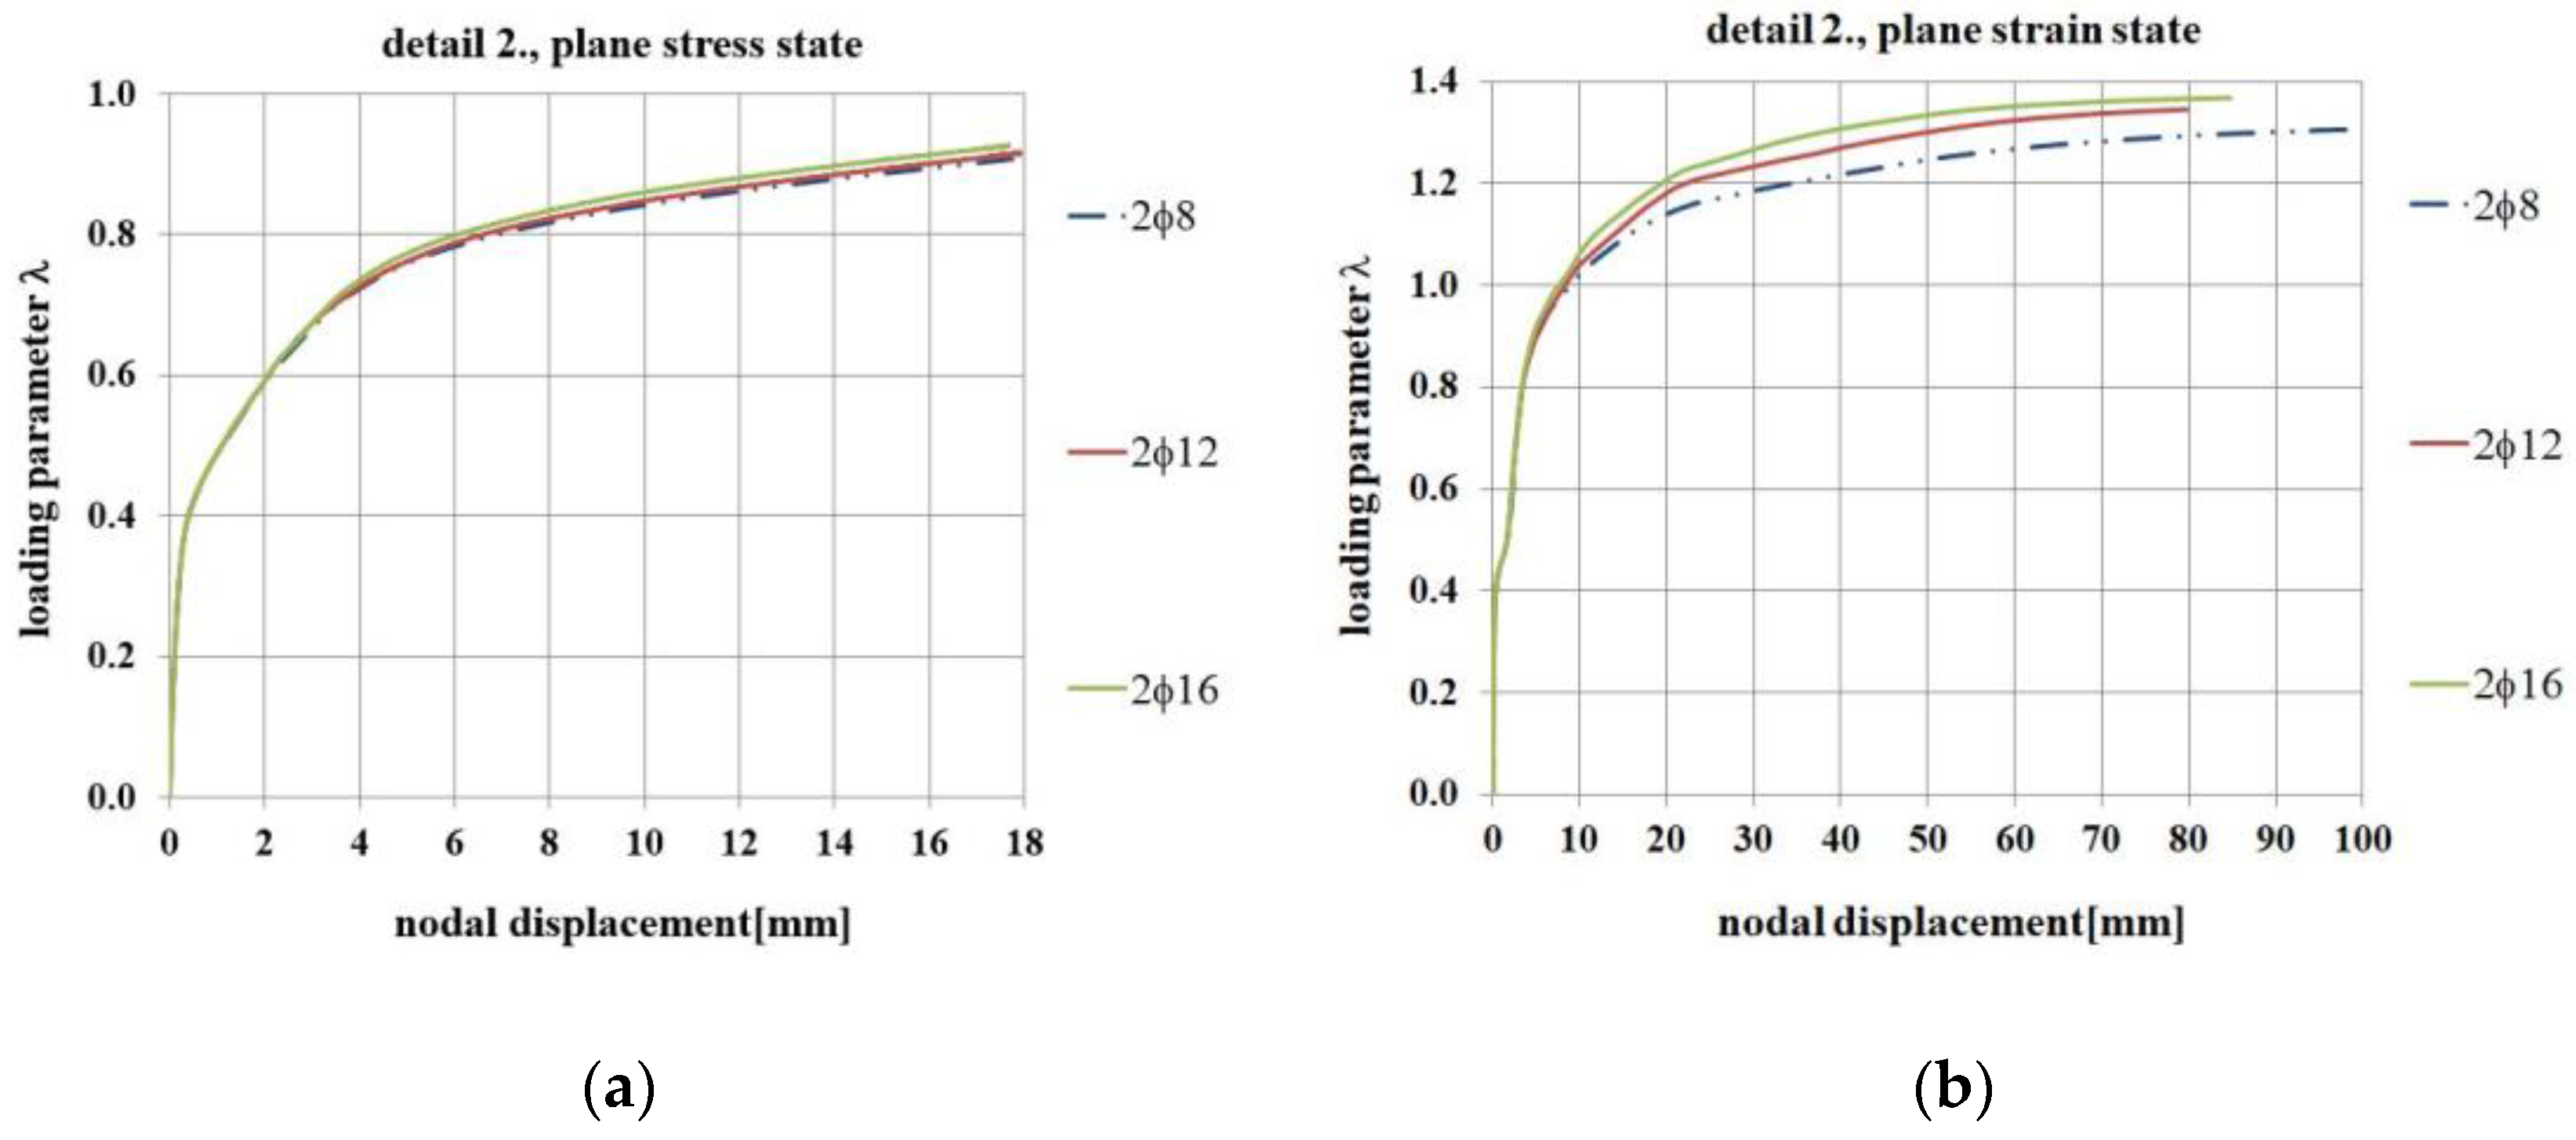
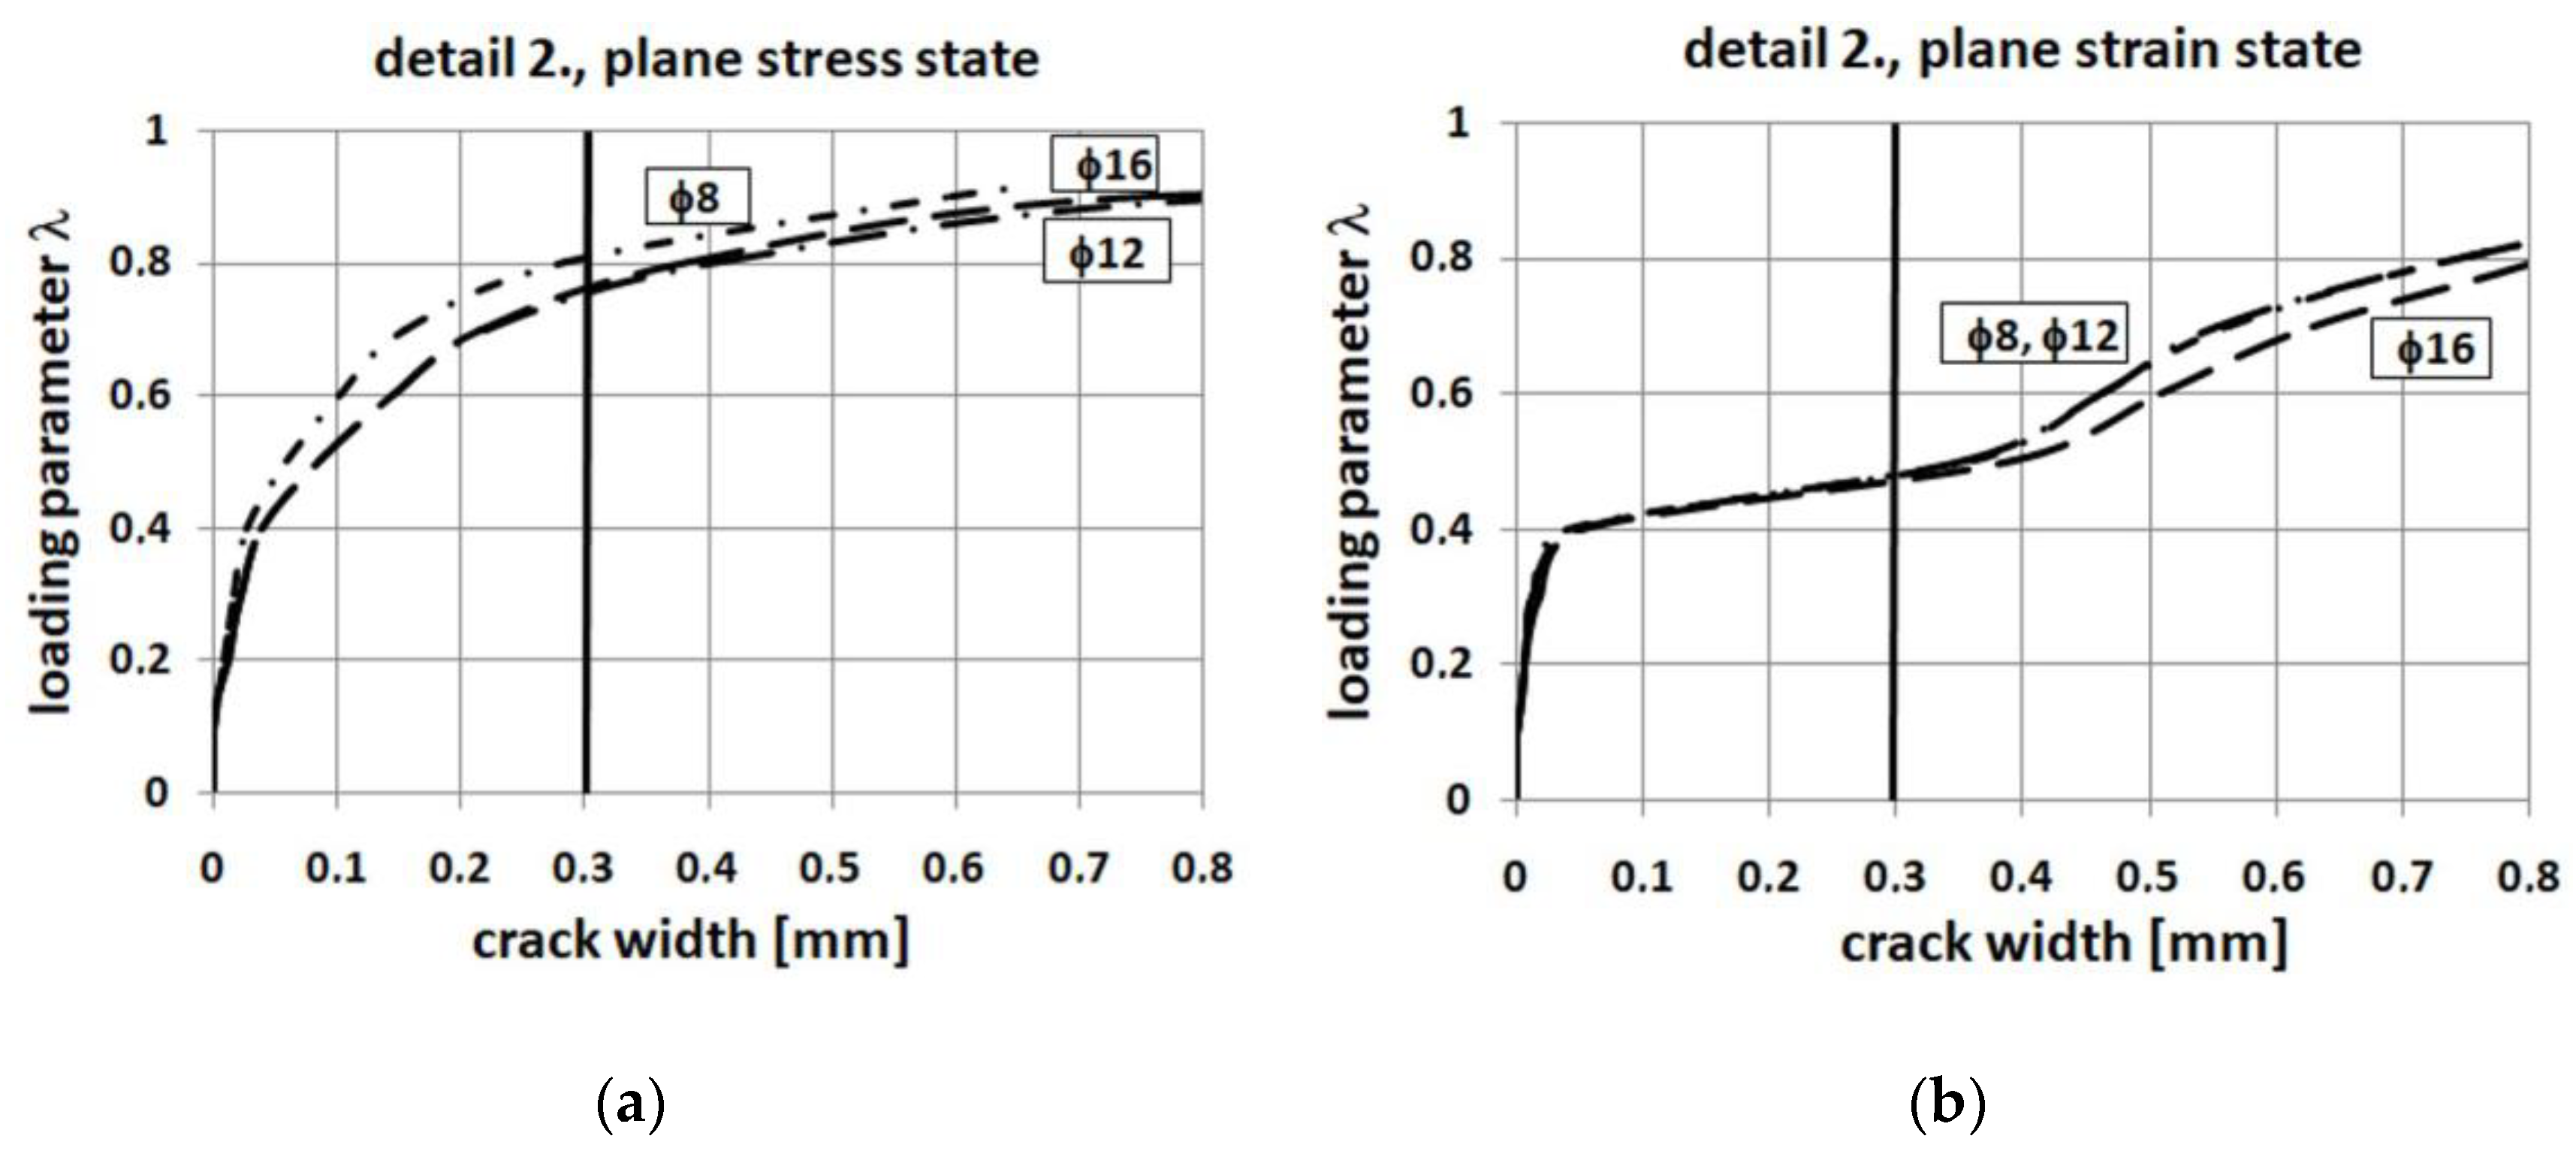
- There are no significant differences in the obtained results when applying the different areas of the diagonal bars (2ϕ8, 2ϕ12 or 2ϕ16 mm).
- (4)
- The use of diagonal bars only is insufficient to obtain a satisfactory efficiency factor and a limited crack width; these goals can only be achieved by using diagonal stirrups.
- (5)
- The reinforcement ratio of the adjacent elements has a large influence on the efficiency factor of the corner, namely an increase in the reinforcement ratio causes a decrease in the efficiency factor.
- (6)
- It is possible to assume simpler and still appropriate S&T truss schemes than that used in Eurocode 2 [1] and handbooks for a corner under opening bending moment, even in the case of the use of corner elements with different cross section heights.
- (7)
- When using the CDP model its parameters should be assumed in a careful way. The authors recommend calibrating and validating some of these parameters. To obtain realistic results, the authors propose the following values of CDP parameters (see the discussion in Section 3):
- -
- A relaxation time of 0.0001 s or less (for the loading time 1 s);
- -
- A dilatation angle of 5 to 15 degrees.
Author Contributions
Funding

Institutional Review Board Statement
Informed Consent Statement
Data Availability Statement
Acknowledgments
Conflicts of Interest
References
- Code, P. Eurocode 2: Design of Concrete Structures. Part 1-1: General Rules and Rules for Buildings; EN 1992-1-1; British Standard Institution: London, UK, 2004. [Google Scholar]
- Akkermann, J. Rotationsverhalten von Stahlbeton-Rahmenecken (Rotational Behaviour of Reinforced Concrete Frame Corners). Ph.D. Thesis, Universität Fridericiana, Karlsruhe, Germany, 2000. [Google Scholar]
- Balint, P.S.; Taylor, H.P.J. Reinforcement Detailing of Frame Corner Joints with Particular Reference to Opening Corners; Technical Report 42.462; Cement and Concrete Association: London, UK, 1972. [Google Scholar]
- Mayfield, B.; Kong, F.K.; Bennison, A. Strength and stiffness of lightweight concrete corners. ACI Struct. J. 1972, 69, 420–427. [Google Scholar]
- Nilsson, I.H.E. Reinforced Concrete Corners and Joints Subjected to Bending Moment. Design of Corners and Joints in Frame Structures; Document D7; National Swedish Building Research: Stockholm, Sweden, 1973. [Google Scholar]
- Nilsson, I.H.E.; Losberg, A. Reinforced concrete corners and joints subjected to bending moment. J. Struct. Div. 1976, 102, 1229–1254. [Google Scholar] [CrossRef]
- Kordina, K.; Wiedemann, G. Forschungsvorhaben V 112. 1 A/DAfStb. Bewehrungsführung in Rahmenecken (Reinforcement in Frame Corners); Technische Universität: Braunschweig, Germany, 1978. [Google Scholar]
- Stroband, J.; Kolpa, J. The Behaviour of Reinforced Concrete Column-to-Beam Joints, Part 2, Corners Subjected to Positive Moments; Report 5-81-5; TH Delft: Delft, The Netherlands, 1981. [Google Scholar]
- Skettrup, E.; Strabo, J.; Andersen, J.H.; Brøndum-Nielsen, T. Concrete frame corners. ACI Struct. J. 1984, 81, 587–593. [Google Scholar]
- Eibl, J.; Kreuser, K.; Cüppers, H.; Dahlhaus, F. Grenztragfähigkeit von Stahlbetonumschliessungen im Kernkraftwerksbau. Teil 1: Behälterecke (Limit Capacity of Reinforced Concrete Casings in Nuclear Power Plant Structures. Part 1: Corners of Containers); Institut für Massivbau und Baustofftechnologie, Universität Karlsruhe: Karlsruhe, Germany, 1993. [Google Scholar]
- Al-Khafaji, J.M.; Al-Bayati, Z.A.; Al-Mallki, A.A.K. Experimental study of R.C. corner details. Al-Qadisiyah J. Eng. Sci. 2014, 1, 516–531. [Google Scholar]
- Moretti, M.; Tassios, T.P. Detailing of corner joints under opening moment. In Proceedings of the fib Symposium, Prague, Czech Republic, 8–10 June 2011. [Google Scholar]
- Johansson, M. Structural Behaviour in Concrete Frame Corners of Civil Defence Shelters: Non-linear Finite Element Analyses and Experiments. Ph.D. Thesis, Chalmers University of Technology, Göteborg, Sweden, 2000. [Google Scholar]
- Starosolski, W. Konstrukcje Żelbetowe wg PN-B-03264:2002 i Eurokodu 2. Tom III (Concrete Structures According to PN-B-0324:2002 and Eurocode 2. Volume 3); Wydawnictwo Naukowe PWN: Warsaw, Poland, 2007. [Google Scholar]
- Marzec, I.; Bobiński, J.; Tejchman, J.; Schönnagel, J. Finite element analysis on failure of reinforced concrete corner in sewage tank under opening bending moment. Eng. Struct. 2021, 228, 111506. [Google Scholar] [CrossRef]
- Wang, H.C. Behavior and Design of Concrete Frame Corners: Strut-and-Tie Method Approach. Ph.D. Thesis, Purdue University, West Lafayette, IN, USA, 2020. [Google Scholar]
- Berglund, J.; Holström, M.I. Loop Connections in Heavily Reinforced Concrete Frame Corners. Master’s Thesis, Chalmers University of Technology, Göteborg, Sweden, 2019. [Google Scholar]
- Getachew, L. Evaluation of Reinforcement Detailing in Corner Beam-Column Joints. Master’s Thesis, Addis Ababa University, Addis Ababa, Ethiopia, 2018. [Google Scholar]
- Haris, I.; Roszevak, Z. Finite element analysis of cast-in-situ RC frame corner joints under quasi-static and cyclic loading. Rev. Construcción 2019, 18, 579–594. [Google Scholar] [CrossRef]
- Abdelwahed, B. Beam-Column Joints Reinforcement Detailing Adequacy in Case of a Corner Column Loss—Numerical Analysis. Lat. Am. J. Solids Struct. 2019, 16, e1–13. [Google Scholar] [CrossRef] [Green Version]
- Abdelwahed, B.; Belkassem, B.; Vantomme, J. Reinforced Concrete Beam-Column Inverted Knee Joint Behaviour after Ground Corner Column Loss—Numerical Analysis. Lat. Am. J. Solids Struct. 2018, 15, e1–15. [Google Scholar] [CrossRef]
- Mörsch, E. Der Eisenbetonbau, Seine Theorie und Anwendung (Concrete-Steel Construction, Its Theory and Application); Verlag Konrad Wittwer: Stuttgart, Germany, 1912. [Google Scholar]
- Schlaich, J.; Schäfer, K.; Jennewein, M. Toward a consistent design of structural concrete. J. Prestress. Concr. Inst. 1987, 32, 74–150. [Google Scholar] [CrossRef]
- ACI 318-19. Building Code Requirements for Structural Concrete; American Concrete Institute: Farmington Hills, MI, USA, 2019. [Google Scholar]
- Taerwe, L.; Matthys, S. fib Model Code for Concrete Structures 2010; Ernst & Sohn (A Wiley Brand): Berlin, Germany, 2013. [Google Scholar]
- Reineck, K.H. Examples for the Design of Structural Concrete with Strut-and-Tie Models; American Concrete Institute: Farmington Hills, MI, USA, 2002. [Google Scholar]
- El-Metwally, S.E.E.; Chen, W.F. Structural Concrete. Strut-and-Tie Models for Unified Design; CRC Press: Boca Raton, FL, USA; Taylor & Francis Group: Abingdon, UK, 2018. [Google Scholar]
- Abaqus/CAE. User’s Guide; Version 6-12.2; Dassault Systemes Simulia Corp: Providence, RI, USA, 2012. [Google Scholar]
- Cichoń, C.; Winnicki, A. Plastic Model for Concrete in Plane Stress State. Part I: Theory. J. Eng. Mech. 1998, 124, 591–602. [Google Scholar] [CrossRef]
- Cichoń, C.; Winnicki, A. Plastic Model for Concrete in Plane Stress State. Part II: Numerical validation. J. Eng. Mech. 1998, 124, 603–613. [Google Scholar] [CrossRef]
- Lubliner, J.; Oliver, J.; Oller, S.; Oñate, E. A plastic-damage model for concrete. Int. J. Solids Struct. 1989, 25, 229–326. [Google Scholar] [CrossRef]
- Lee, J.; Fenves, G.L. Plastic-damage model for cyclic loading of concrete structures. J. Eng. Mech. 1998, 124, 892–900. [Google Scholar] [CrossRef]
- Lee, J.; Fenves, G.L. A return-mapping algorithm for plastic-damage models: 3-D and plane stress formulation. Int. J. Numer. Meth. Eng. 2001, 50, 487–506. [Google Scholar] [CrossRef]
- Kupfer, H. Das Verhalten des Betons unter Mehrachsiger Kurzzeitbelastung unter Besonderen Berücksichtigung der ZweiachsigenBeanspruchung (Behaviour of Concrete Under Multiaxial Short-Term Load with Special Consideration of the Biaxial Loading); Verlag von Wilhelm Ernst und Sohn: Berlin, Germany, 1973. [Google Scholar]
- Szwed, A.; Kamińska, I. O Kalibracji Parametrów Modelu Konstytutywnego Betonu i Badaniach Doświadczalnych Temu Służących (On Calibration of Parameters of Concrete Constitutional Model and Laboratory Tests Serving This Issue); Chapter VIII in Beton i Konstrukcje z Betonu—Badania (Concrete and Concrete Structures-Tests); Oficyna Wydawnicza Politechniki Warszawskiej: Warsaw, Poland, 2015; pp. 93–110. [Google Scholar]
- Duvaut, G.; Lions, J.L. Inequalities in Mechanics and Physics; Springer: Berlin/Heidelberg, Germany, 1976. [Google Scholar]
- Bažant, Z.; Oh, B.H. Crack band theory for fracture of concrete. Mater. Struct. 1983, 16, 155–177. [Google Scholar] [CrossRef] [Green Version]
- Szczecina, M.; Winnicki, A. Calibration of the CDP model parameters in ABAQUS. In Proceedings of the World Congress on Advances in Structural Engineering and Mechanics ASEM15, Incheon, Korea, 25–29 August 2015; International Association of Structural Engineering & Mechanics: Incheon, Korea, 2015. [Google Scholar]
- Wosatko, A.; Winnicki, A.; Polak, M.A.; Pamin, J. Role of dilatancy angle in plasticity-based models of concrete. Arch. Civ. Mech. Eng. 2019, 4, 1268–1283. [Google Scholar] [CrossRef]
- Genikomsou, A.; Polak, M.A. FEA of RC slabs under static and cyclic loadings based on damage plasticity mode. In Proceedings of the 8th International Conference AMCM, Wrocław, Poland, 16–18 June 2014. [Google Scholar]
- Genikomsou, A.; Polak, M.A. Finite element analysis of punching shear of concrete slabs using damaged plasticity model in ABAQUS. Eng. Struct. 2015, 98, 38–48. [Google Scholar] [CrossRef]
- Pereira, H.F.S.G.; Cunha, V.M.C.F.; Sena-Cruz, J. Numerical simulation of galvanized rebars pullout. Frat. Integrità Strutt. Gruppo Ital. Frat. Cassino 2015, 31, 54–66. [Google Scholar] [CrossRef] [Green Version]
- Jankowiak, T. Kryteria Zniszczenia Betonu Poddanego Obciążeniom Quasi-Statycznym i Dynamicznym (Damage Criteria of Concrete under Quasi-Static and Dynamic Load Condition). Ph.D. Thesis, Politechnika Poznańska, Poznań, Poland, 2010. [Google Scholar]
- Mostafiz, E.; Al Azad, A.; Shahin, H.M.; Al Shafian, S. Numerical analysis of a reinforced concrete slab column connection subjected to lateral & vertical loading. In Proceedings of the International MultiConference of Engineers and Computer Scientists IMECS 2017, Hong Kong, China, 15–17 March 2017. [Google Scholar]
- Kmiecik, P.; Kamiński, M. Modelling of reinforced concrete structures and composite structures with concrete strength degradation taken into consideration. Arch. Civ. Mech. Eng. 2011, 9, 623–636. [Google Scholar] [CrossRef]
- Malm, R. Predicting Shear Type Crack Initiation and Growth in Concrete with Non-Linear Finite Element Method. Ph.D. Thesis, Royal Institute of Technology, Stockholm, Sweden, 2009. [Google Scholar]
- Menetrey, P. Numerical Analysis of Punching Failure in Reinforced Concrete Structures. Ph.D. Thesis, Ecole Polytechnique Federale de Lausanne, Lausanne, Switzerland, 1994. [Google Scholar]
- Mostofinejad, D.; Saadatmand, H. A procedure for predicting the behavior of FRP confined concrete using the FE method. In Transaction A: Civil Engineering; Sharif University of Technology: Tehran, Iran, 2010; Volume 17, pp. 471–481. [Google Scholar]
- Marzec, I. Zastosowanie Modelu Sprężysto-Plastycznego Betonu z Degradacją Sztywności i Nielokalnym Osłabieniem Do Modelowania Elementów Betonowych Cyklicznie Obciążonych (Application of Elasto-Plastic Model of Concrete with Stiffness Degradation and Non-Local Softening for Concrete Elements under Cyclic Loading Conditions). Ph.D. Thesis, Politechnika Gdańska, Gdańsk, Poland, 2008. [Google Scholar]
- Rodríguez, J.; Martínez, F.; Martí, J. Concrete constitutive model, calibration and applications. In Proceedings of the 2013 SIMULIA Community Conference, Vienna, Austria, 21–24 May 2013. [Google Scholar]
- Urbański, A.; Łabuda, M. Analiza nośności przekroju pali żelbetowych w warunkach interakcji mimośrodowego ściskania ze ścinaniem (Analysis of bearing capacity of concrete piles under eccentric compression combined with shearing). In Technical Transactions; Wydawnictwo Politechniki Krakowskiej: Cracow, Poland, 2012; Volume 27, pp. 157–168. [Google Scholar]
- Woliński, S.z. Własności Betonu Rozciąganego i ich Zastosowania w Nieliniowej Mechanice Pękania (Properties of Concrete under Tension and Their Use in Non-Linear Fracture Mechanics); Rzeszów University of Technology: Rzeszów, Poland, 1991. [Google Scholar]
- Szczecina, M.; Winnicki, A. Relaxation time in CDP model used for analyses of RC structures. Procedia. Eng. 2017, 193, 369–376. [Google Scholar] [CrossRef]
- Červenka, V.; Jendele, L.; Červenka, J. ATENA Program Documentation. Part 1—Theory; Červenka Consulting: Prague, Czech Republic, 2012. [Google Scholar]
- MacGregor, J. Reinforced Concrete: Mechanics and Design; Prentice Hall: New Jersey, NJ, USA, 2004. [Google Scholar]
- Campana, S.; Ruiz Fernandez, M.; Muttoni, A. Behaviour of nodal regions of reinforced concrete frames subjected to opening moments and proposals for their reinforcement. Eng. Struct. 2013, 51, 200–210. [Google Scholar] [CrossRef] [Green Version]
- Leonhardt, F. Vorlesungen über Massivbau: Dritter Teil Grundlagen zum Bewehren im Stahlbetonbau (Lectures on Solid Construction. Part 3. Basics of Reinforcement in Reinforced Concrete Construction); Springer: Berlin/Heidelberg, Germany; New York, NY, USA, 1977. [Google Scholar]
- DIN 1045-1. Tragwerke aus Beton, Stahlbeton und Spannbeton; Teil 1: Bemessung und Konstruktion—Entwurf (Concrete, reinforced concrete and prestressed concrete structures. Part 1: Dimensioning and construction—design); Beuth Verlag: Berlin, Germany, 2008. [Google Scholar]


| Reinforcement Detail | Efficiency Factor | Reinforcement Detail | Efficiency Factor |
|---|---|---|---|
 | 0.43 (Mayfield et al. [4]) 0.66 (Kordina and Wiedemann [7]) 0.46 (Al-Khafaji et al. [11]) |  | 0.78 (Mayfield et al. [4]) |
 | 0.59 (Mayfield et al. [4]) 0.55 (Skettrup et al. [9]) |  | 1.32 (Kordina and Wiedemann [7]) 1.13 (Skettrup et al. [9]) |
 | 1.07 (Moretti and Tassios [12]) |  | 1.12 (Moretti and Tassios [12]) |
 | 0.88 (Mayfield et al. [4]) |
 |  |  |
| Detail No. 1 | Detail No. 2 | Detail No. 3 |
 |  |  |
| Detail No. 4 | Detail No. 5 | Detail No. 6 |
 |  |  |
| Detail No. 7 | Detail No. 8 | Detail No. 9 |
| Source | Dilatation Angle ψ [°] |
|---|---|
| Jankowiak [43] | 49 |
| Genikomsou and Polak [40] | 38 |
| Mostafiz et al. [44] | 38 |
| Kmiecik and Kamiński [45] | 36 |
| Malm [46] | 25–38 |
| Menetrey [47] | 10 |
| Mostofinejad and Saadatmand [48] | 0 |
| Marzec [49] | 8 or 10 |
| Rodriguez et al. [50] | 30 |
| Urbański and Łabuda [51] | 15 |
| Detail No. | Efficiency Factor Obtained in S&T | Decisive Element (No. of Strut or Node) | Provided Reinforcement, Diameters Given in (mm) |
|---|---|---|---|
| 1. | 0.70 | Strut No. 5 | main reinforcement: 2ϕ20 top and 2ϕ20 bottom, no loops |
| 2. | 0.64 | Strut No. 9 | 2 diagonal bars ϕ8 each, no loops |
| 3. | 0.66 | Strut No. 5 | 2 diagonal bars ϕ8 each, no loops |
| 4. | 0.94 | Strut No. 5 | diagonal stirrup ϕ16, looped main bars |
| 5. | 1.21 | Nodes N1, N2, N4, N5 | central diagonal stirrup ϕ16, outside stirrups ϕ10, looped main bars |
| 6. | 1.25 | Nodes N2, N3, N4, N5 | central diagonal stirrup ϕ16, outside stirrups ϕ12, looped main bars |
| 7. | 1.31 | Struts No. 14 and 15 | 2 diagonal bars ϕ16 each, central diagonal stirrup ϕ12, outside stirrups ϕ16, looped main bars |
| Detail No. | Efficiency Factor Obtained in S&T | Decisive Element (No. of Strut or Node) | Provided Reinforcement, Diameters Given in (mm) |
|---|---|---|---|
| 1. | 0.61 | Strut No. 5 | main reinforcement: 2ϕ20 top and 2ϕ20 bottom in a smaller cross section (column), and 2ϕ12 top and 2ϕ12 bottom in a larger cross section (beam), no loops |
| 2. | 0.58 | Strut No. 5 | 2 diagonal bars ϕ8 each, no loops |
| 3. | 0.60 | Strut No. 5 | 2 diagonal bars ϕ8 each, no loops |
| 4. | 1.44 | Nodes N1, N2, N3 | diagonal stirrup ϕ16, looped main bars |
| 5. | 1.23 | Nodes N1, N2, N5 | diagonal stirrups ϕ12, looped main bars |
| 6. | 1.15 | Nodes N2 and N3 | diagonal stirrups ϕ12, looped main bars |
| 7. | 1.17 | Node N7 | 2 diagonal bars ϕ16 each, central diagonal stirrup ϕ16, outside stirrups ϕ12, looped main bars |
| 8. | 1.07 | Nodes N3 and N4 | diagonal bar ϕ8, diagonal stirrups ϕ12, looped main bars |
| 9. | 0.88 | Nodes N1 and N2 | 2 horizontal stirrups ϕ8 each, diagonal bar ϕ8, looped main bars |
| Dilatation Angle ψ (degree) | Flow Potential Eccentricity e | Ratio fb0/fc0 | Ratio K | Viscosity Parameter μ (s) | Fracture Energy Gf (N/m) |
|---|---|---|---|---|---|
| 15 | 0.1 | 1.16 | 0.667 | 0.0001 | 146.5 |
| Detail No. | Efficiency Factor S&T | Efficiency Factor FEM, Plane Stress | Efficiency Factor FEM, Plane Strain |
|---|---|---|---|
| 1. | 0.70 | 0.75 | 1.01 |
| 2. | 0.64 | 0.79 | 1.11 |
| 3. | 0.66 | 0.82 | 1.17 |
| 4. | 0.94 | 1.23 | 1.26 |
| 5. | 1.21 | 1.24 | 1.29 |
| 6. | 1.25 | 1.27 | 1.29 |
| 7. | 1.31 | 1.23 | 1.32 |
| Detail No. | Efficiency Factor S&T | Efficiency Factor FEM, Plane Stress | Efficiency Factor FEM, Plane Strain |
|---|---|---|---|
| 1. | 0.61 | 0.75 | 1.31 |
| 2. | 0.58 | 0.78 | 1.36 |
| 3. | 0.60 | 0.89 | 1.43 |
| 4. | 1.44 | 1.32 | 1.40 |
| 5. | 1.23 | 1.57 | 1.40 |
| 6. | 1.15 | 1.34 | 1.38 |
| 7. | 1.17 | 1.54 | 1.51 |
| 8. | 1.07 | 1.32 | 1.52 |
| 9. | 0.88 | 1.38 | 1.44 |
| Detail No. | Efficiency Factor in Laboratory Tests | Efficiency Factor S&T | Efficiency Factor FEM, Plane Stress | Efficiency Factor FEM, Plane Strain |
|---|---|---|---|---|
| 1. | 0.43 (Mayfield et al. [4]) 0.66 (Kordina and Wiedemann [7]) 0.46 (Al-Khafaji et al. [11]) | 0.70 | 0.75 | 1.01 |
| 2. | 0.59 (Mayfield et al. [4]) 0.55 (Skettrup et al. [9]) | 0.64 | 0.79 | 1.11 |
| 3. | 1.07 (Moretti and Tassios [12]) | 0.66 | 0.82 | 1.17 |
| 4. | 0.88 (Mayfield et al. [4]) | 0.94 | 1.23 | 1.26 |
| 5. | 0.78 (Mayfield et al. [4]) | 1.21 | 1.24 | 1.29 |
| 6. | 1.32 (Kordina and Wiedemann [7]) 1.13 (Skettrup et al. [9]) | 1.25 | 1.27 | 1.29 |
| 7. | 1.12 (Moretti and Tassios [12]) | 1.31 | 1.23 | 1.32 |
Publisher’s Note: MDPI stays neutral with regard to jurisdictional claims in published maps and institutional affiliations. |
© 2021 by the authors. Licensee MDPI, Basel, Switzerland. This article is an open access article distributed under the terms and conditions of the Creative Commons Attribution (CC BY) license (https://creativecommons.org/licenses/by/4.0/).
Share and Cite
Szczecina, M.; Winnicki, A. Rational Choice of Reinforcement of Reinforced Concrete Frame Corners Subjected to Opening Bending Moment. Materials 2021, 14, 3438. https://doi.org/10.3390/ma14123438
Szczecina M, Winnicki A. Rational Choice of Reinforcement of Reinforced Concrete Frame Corners Subjected to Opening Bending Moment. Materials. 2021; 14(12):3438. https://doi.org/10.3390/ma14123438
Chicago/Turabian StyleSzczecina, Michał, and Andrzej Winnicki. 2021. "Rational Choice of Reinforcement of Reinforced Concrete Frame Corners Subjected to Opening Bending Moment" Materials 14, no. 12: 3438. https://doi.org/10.3390/ma14123438