1. Introduction
Over the last decades, the scientific community has seen a growing interest in the production of Radioactive Ion Beams (RIBs) according to the Isotope Separation On-Line (ISOL) technique. A key role has been played by important international facilities such as ISOLDE [
1], ISAC [
2], HRIBF [
3], SPIRAL [
4] and ALTO [
5]. Nowadays, several new facilities are under construction around the world, and the Selective Production of Exotic Species (SPES) project represents the contribution of the Italian National Institute for Nuclear Physics (INFN). The aim is to construct at Legnaro National Laboratories (LNL) an ISOL facility to produce neutron-rich nuclei in the 80–160 amu mass range. They will be generated by means of a 40 MeV, 200 µA primary proton beam, directly impinging on a series of thin uranium carbide discs (composing the production target) that are axially spaced in order to dissipate by thermal radiation the considerable amount of power deposited by protons [
6,
7,
8]. As a rule of thumb, the fission of
235,238U,
232Th and other long lived actinides is adopted to produce neutron-rich nuclei in a wide mass range. These elements are typically used in their carbide forms in order to allow the target operation at high temperature (typically between 1600 °C and 2200 °C) in high vacuum [
9]. Indeed, high temperature resistance, together with other material characteristics such as open porosity, is fundamental to guarantee an efficient extraction of radioactive isotopes from the target material [
10,
11,
12].
For some specific applications, focused on narrow mass ranges, it is possible to use different carbides. An example is silicon carbide (SiC), which is usually irradiated with energetic protons to deliver radioactive Al isotopes (mainly
26Al,
28Al and
29Al). This is the case of the SPES facility, which during the commissioning phase will be operated making use of a SiC target. In this way, radioprotection concerns will be extremely limited with respect to uranium carbide. It will be also possible to take as a reference the SPES SiC target tests carried out at the Oak Ridge National Laboratories (ORNL) in similar conditions [
13].
It is important to underline the extremely high-power density characterizing the main SPES target components. Indeed, unlike the current ISOL facilities, which are characterized by much higher primary beam energies [
1] (with the beam passing through the target and depositing only a fraction of its power), the 40 MeV proton beam available at the SPES facility will be completely stopped into the target, causing the dissipation of the whole beam power within the small target volume. In this context, an intense research and development activity has started with the aim to study the thermal–structural behavior of target materials. As a first step, all efforts were addressed to the commercial high-performance silicon carbides (SiC) that will be used at the SPES facility during the commissioning phase. In this work, a specific approach for their thermal and mechanical characterization is presented and discussed. The experimental apparatuses and techniques described in [
14,
15] were taken as a reference, and a novel strategy to identify a stress limit value for the structural design phase was introduced. In the future, the same methodology will be extended to new high-performance materials for ISOL applications [
10,
11,
12].
2. Target Design Process and Thermo-Mechanical Characterization of Materials
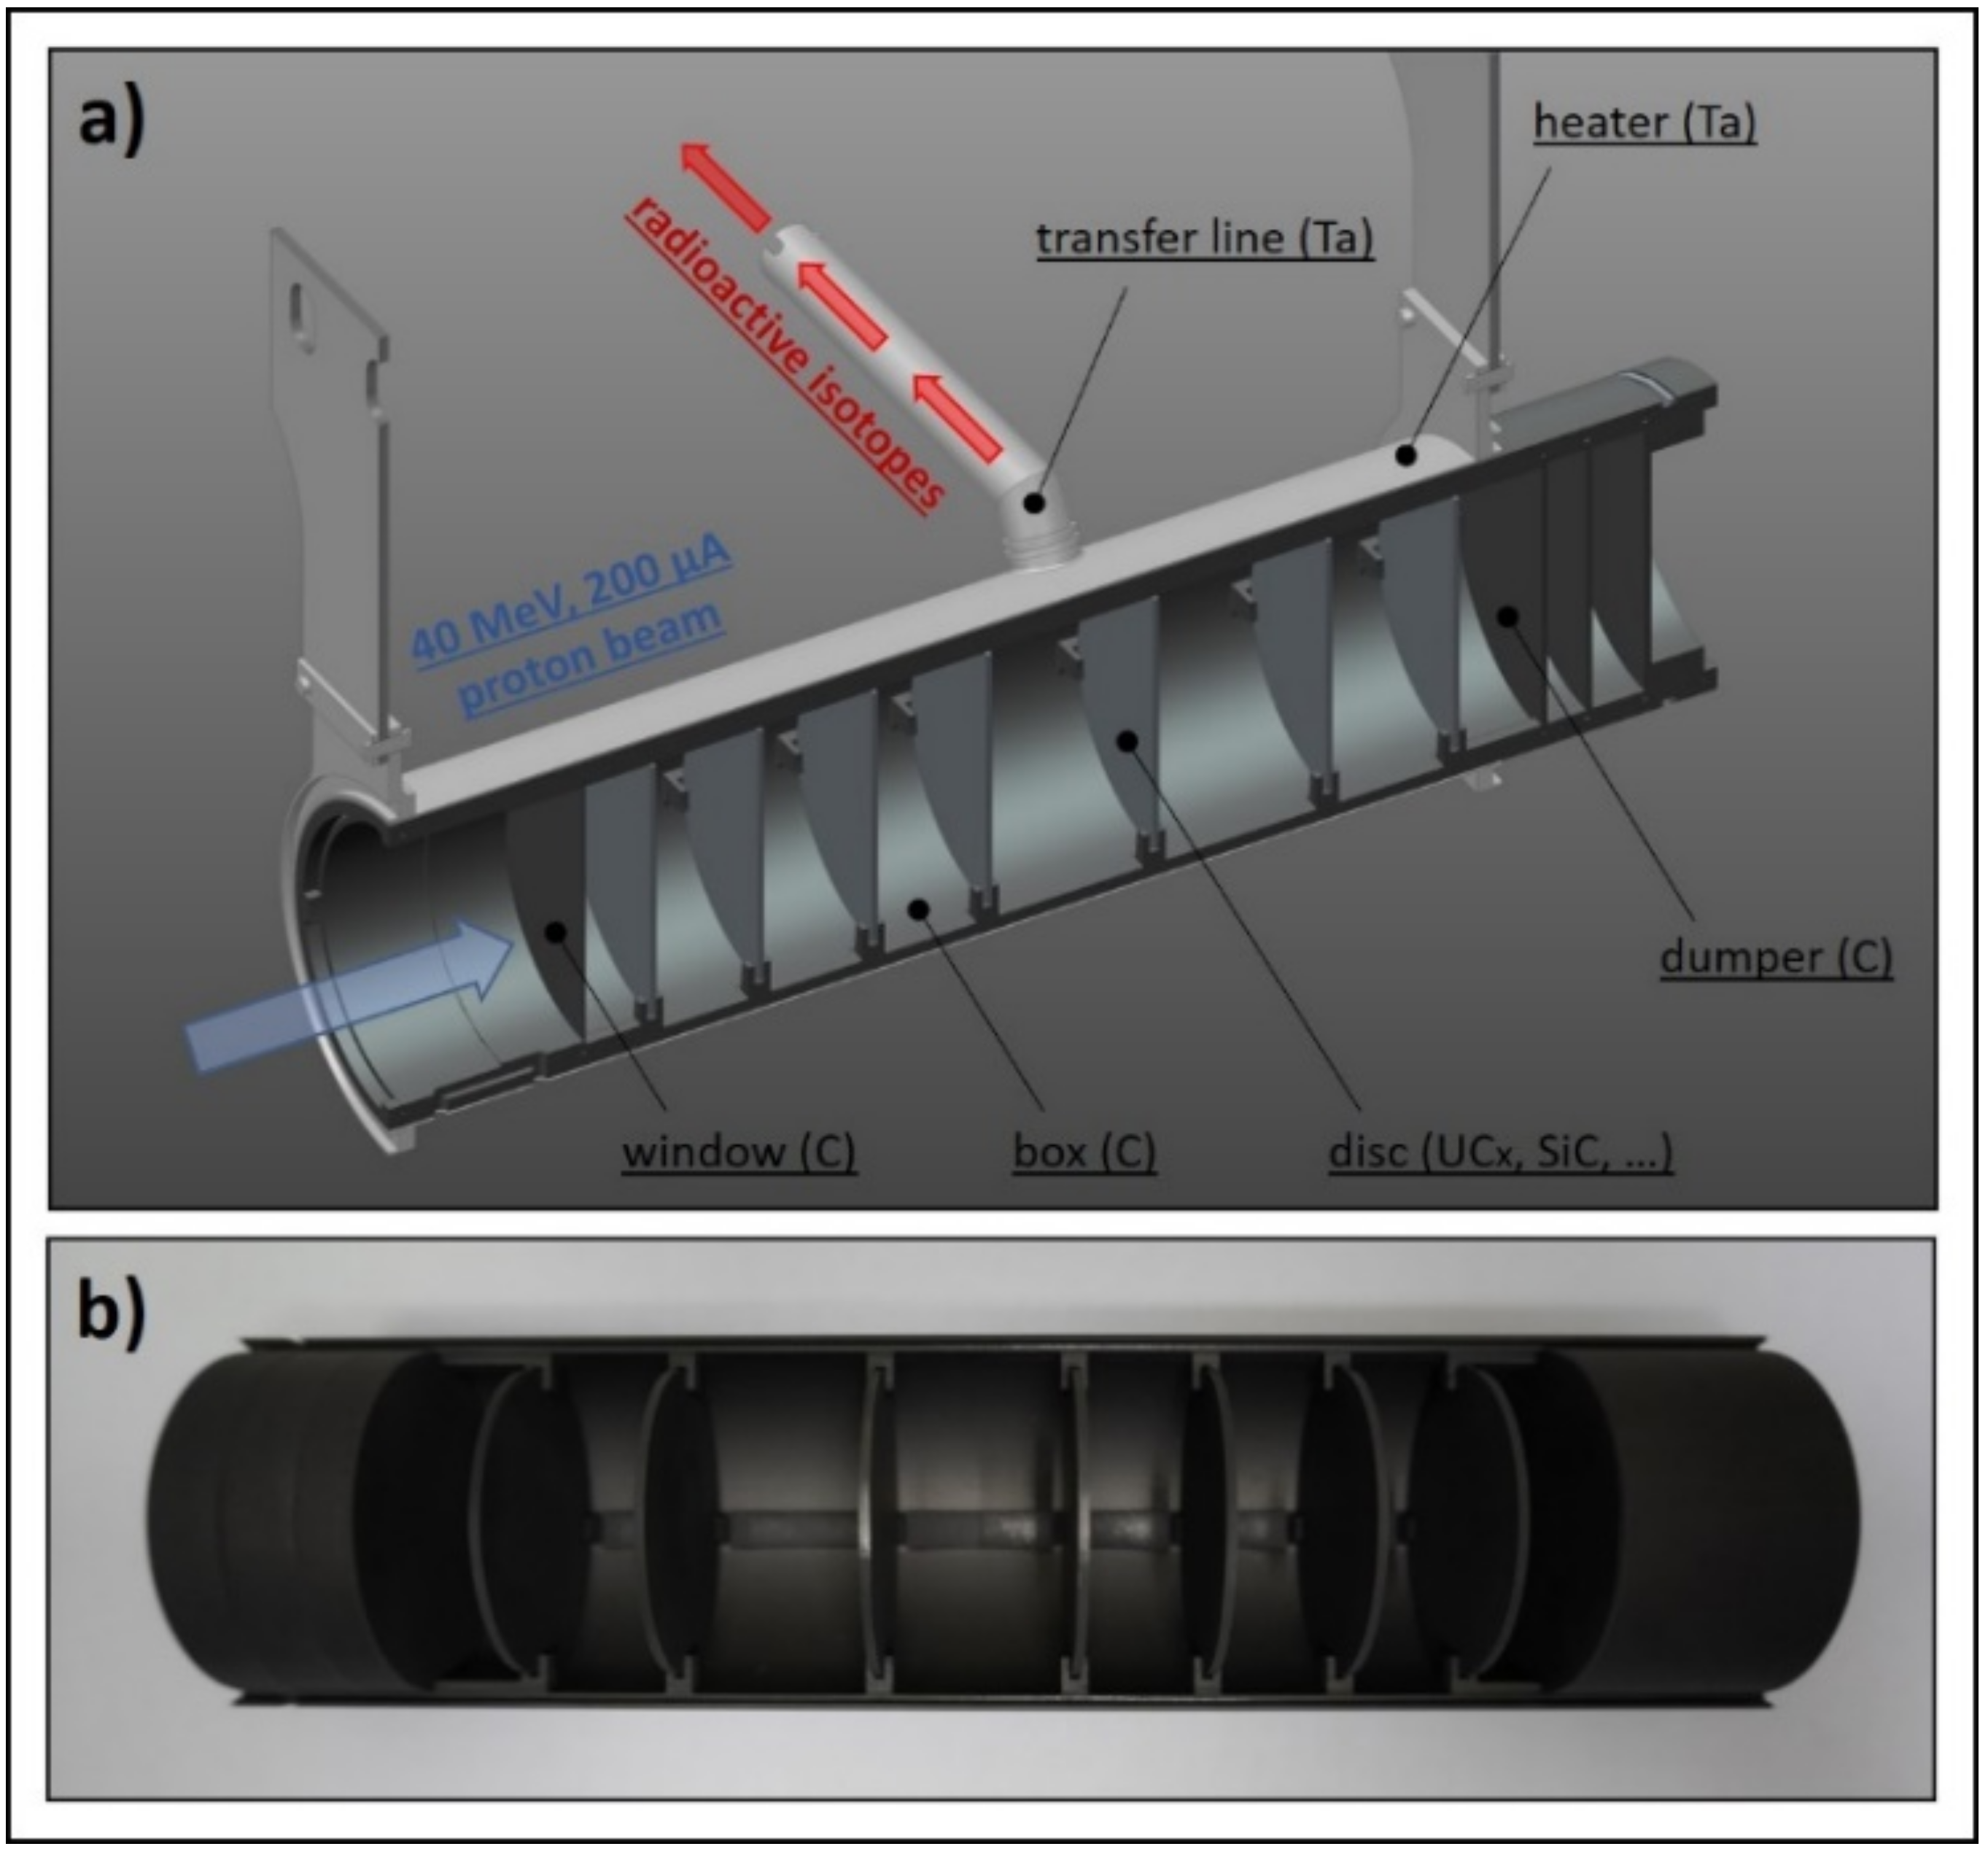
As mentioned above, the SPES production target (see
Figure 1) is specifically designed for high-power depositions [
6,
7] and optimized for the maximization of radiative heat transfer [
16]. It is composed of seven co-axial discs made of uranium carbide or other carbides, according to the specific RIB requests. The discs are properly spaced in the axial direction in order to dissipate by thermal radiation the large amount of power deposited by the proton beam. They are characterized by a diameter and a thickness of 40 and 0.8 mm, respectively. Two thin graphite windows located at the frontal part of the target prevent the undesired loss of isotopes, while three graphite dumpers completely stop the proton beam at the rear side. All discs, windows and dumpers are enclosed in a tubular hollow box made of graphite, defining the main target assembly. A tantalum tubular heater is used to heat the target by Joule effect and to control accurately and gradually its temperature during the start-up and the shut-down procedures [
17], i.e., when the proton beam power is not stabilized yet. In
Figure 1, it is also possible to observe the transfer line. It is a small tube made of tantalum used to transport the radioactive isotopes from the target to the ion source, where they can be ionized and subsequently accelerated by an extraction voltage of approximately 40 kV.
The design process of high-power targets is complicated and should always include the three following steps:
- (a)
Analysis of particle interactions with matter;
- (b)
Thermal analysis;
- (c)
Structural analysis.
(Step a) is schematically represented in
Figure 2. In order to have an accurate estimation of the radioactive isotopes produced by protons’ interaction with the target material, dedicated Monte Carlo codes such as FLUKA and MCNP are adopted [
6]. The same codes also provide detailed power deposition maps for the target components directly impinged by the beam (discs, windows, dumpers, box). Of course, the quality and reliability of results are deeply affected by input parameters, in particular by the proton beam energy, intensity and profile.
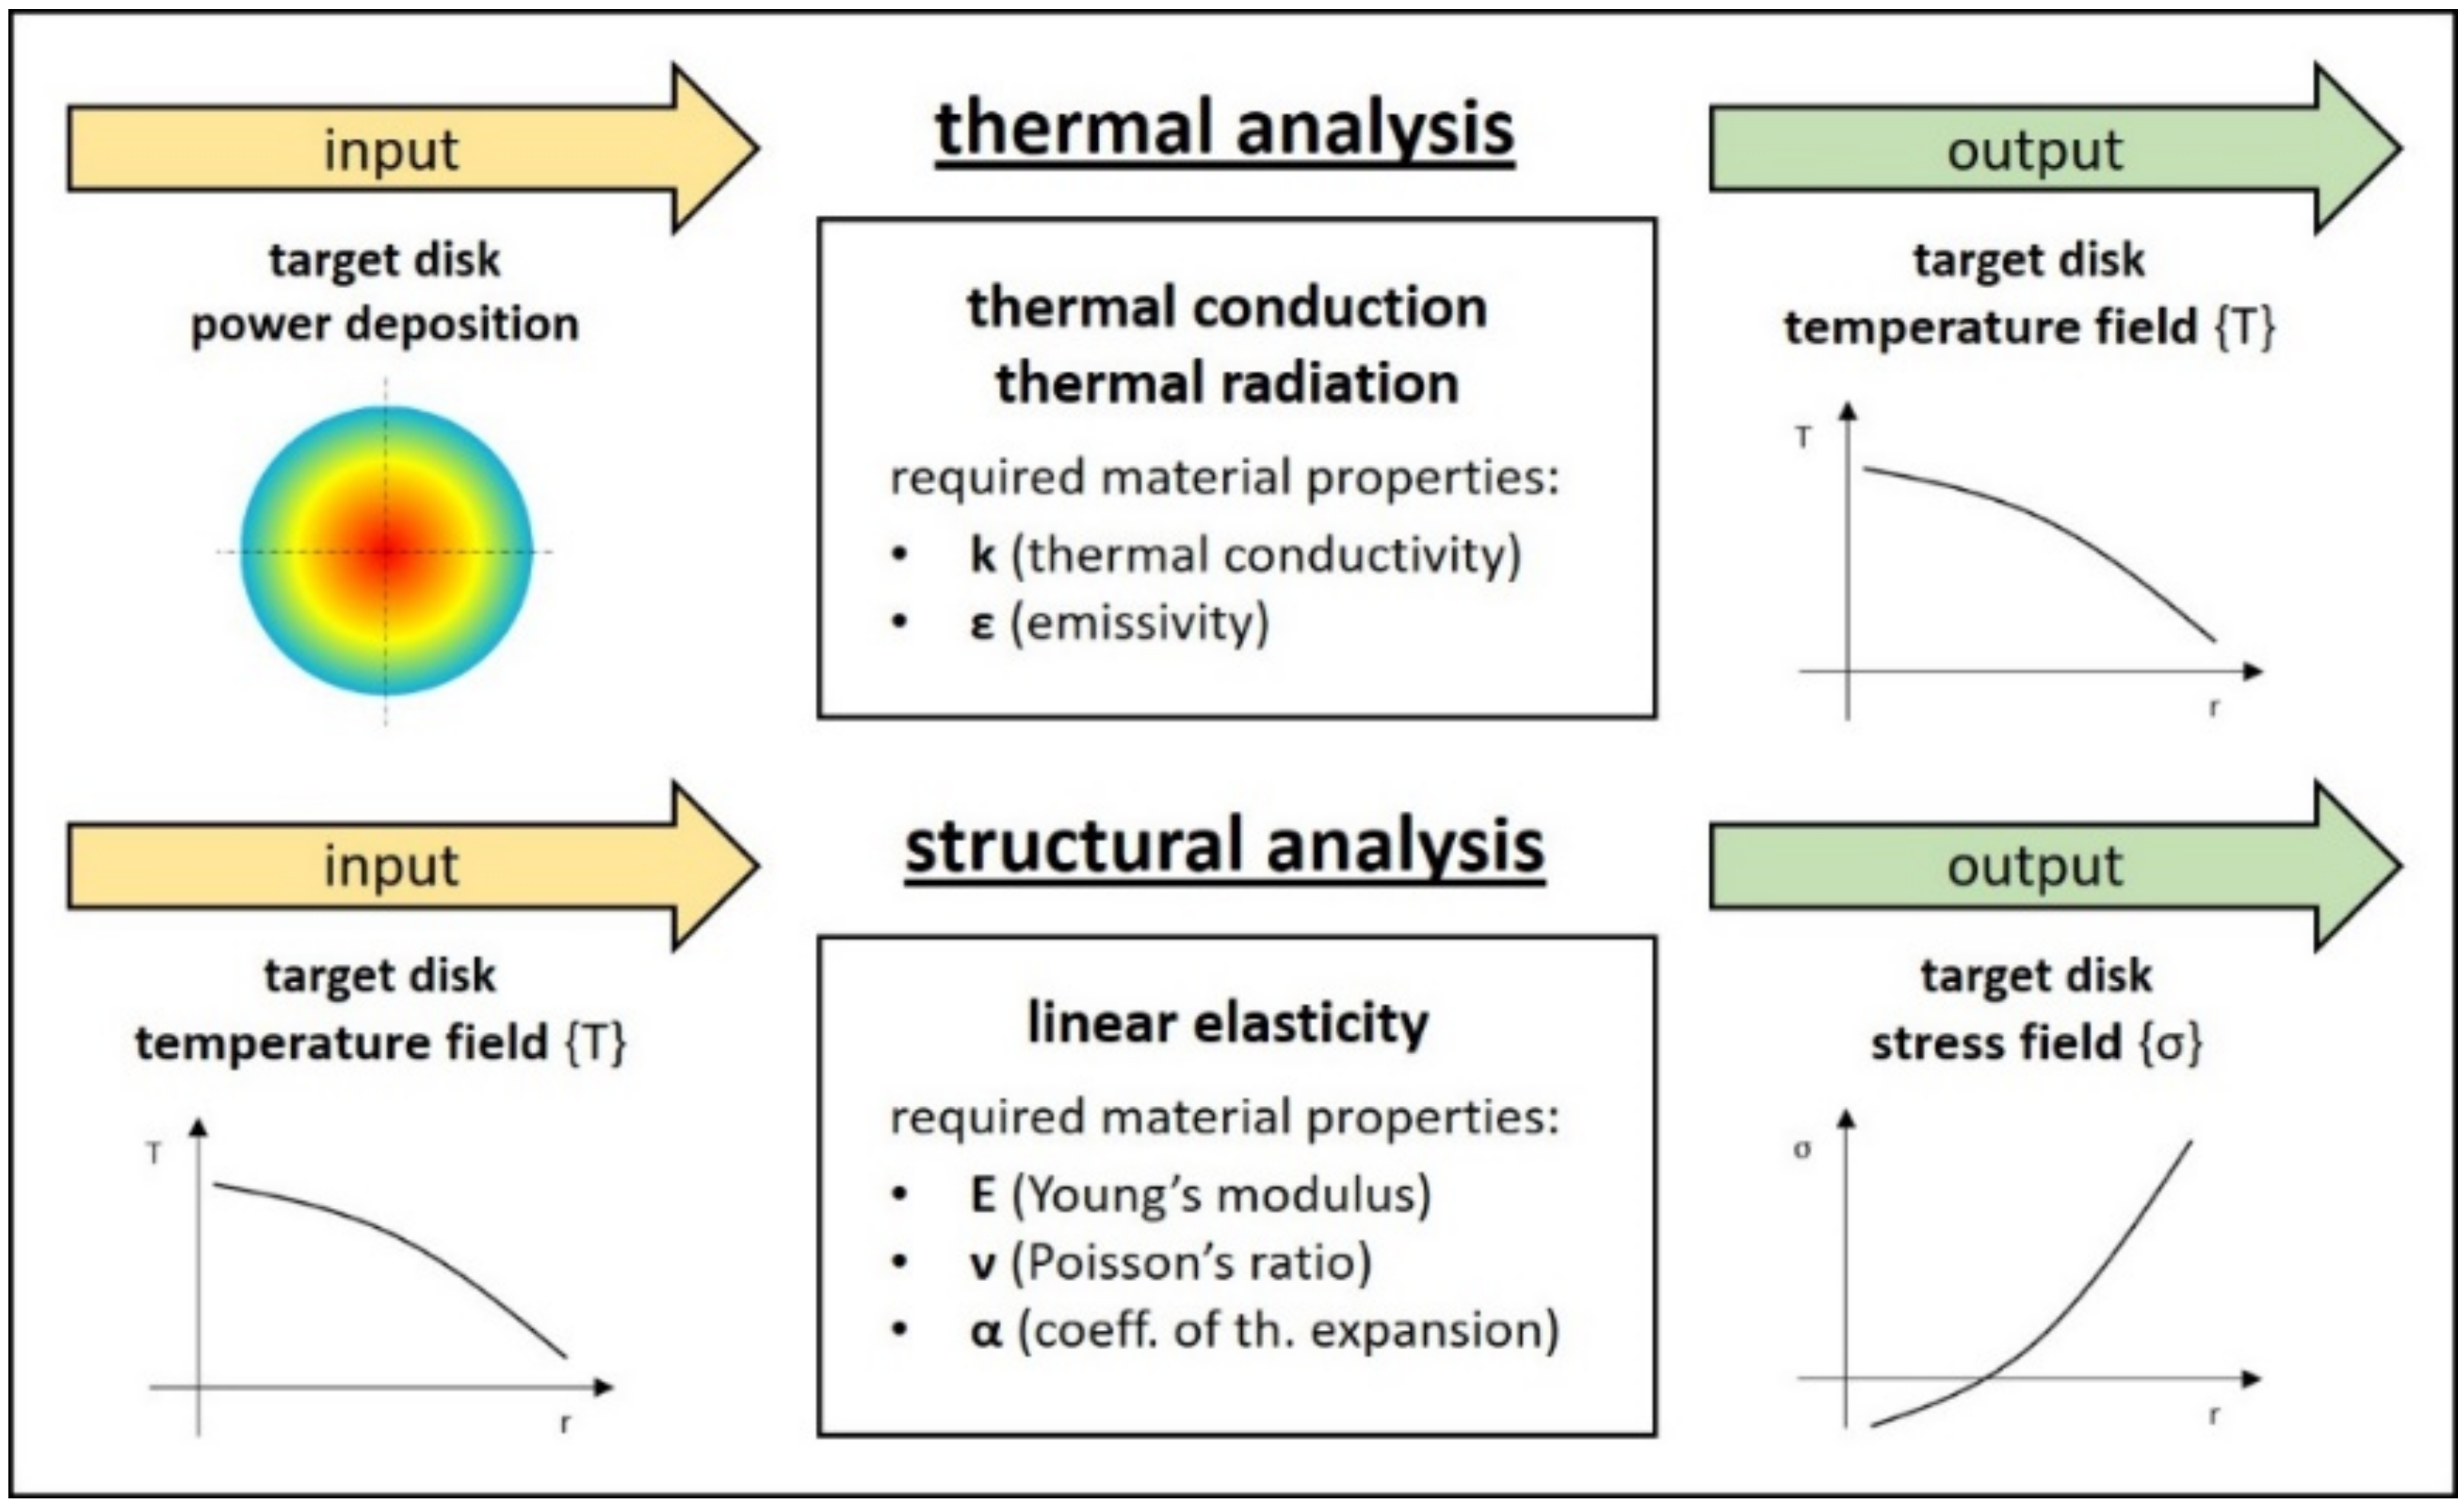
Being the main thermal load for the thermal analysis, power deposition maps are particularly important and directly affect the target temperature field {T}. Accordingly, {T} and temperature gradients constitute the main load for the structural analysis, whose aim is to estimate the stress field {σ} for the target discs (which are surely the most stressed and precious components of the whole target assembly). Both thermal and structural analyses (step b) and (step c), respectively) are schematically represented in
Figure 3. They are usually performed with an integrated approach, making use of general-purpose Finite Elements (FE) codes such as ANSYS
®.
In the case of thermal analyses (step b), steady-state conditions can be considered as a good approximation for typical RIB production phases. In addition, since exclusively thermal conduction and thermal radiation should be included as heat transfer modes (the target works in high vacuum, so thermal convection is not considered), the two material properties required in the pre-processing phase are the thermal conductivity k (materials are considered isotropic) and the total hemispherical emissivity ε (gray-diffuse surfaces are commonly assumed for this kind of radiative heat transfer calculation) [
17,
18].
Regarding the directly related steady-state structural analyses (step c), the hypotheses of isotropic and linear elastic materials were taken into consideration for the sake of simplicity. Such calculations are clearly used to pass from {T} to the stress field {σ} once the thermoelastic material properties are introduced in the pre-processing phase, which are the Young’s modulus E, the Poisson’s ratio ν and the coefficient of thermal expansion α.
In the final part of the design process, it is fundamental to verify that both the maximum temperature and the maximum stress are well below the material limits, which in this work are indicated as TLIMIT and σLIMIT, respectively. If these conditions are verified, the target design can be approved together with the proton beam working parameters. On the other hand, if TLIMIT and/or σLIMIT are exceeded, the designer has the possibility to fix the problem in many different ways. Firstly, it is preferable to adjust the proton beam energy, profile and intensity, but this can be performed within certain limits since the RIB production rate must not be affected substantially. Secondly, the target design can be modified in terms of geometry and material selection, but keeping into consideration the constraints related to the surrounding components and the requested nuclear reactions, respectively.
The design approach described above can be actuated only if thermal and structural properties (k, ε, E, ν, α) and limits (TLIMIT, σLIMIT) are well known for all the materials constituting the target. Usually, all the components surrounding the target discs (windows, dumpers, heater, …) are made of high-performance commercial materials (graphite, tantalum, …) whose properties are available for a wide temperature range. On the other hand, target discs are manufactured by means of specific home-made procedures. In this case, materials require an accurate thermal and mechanical characterization.
Thermal conductivity (k), total hemispherical emissivity (ε) and temperature limit (T
LIMIT) can be estimated making use of experimental techniques developed at LNL in the context of the SPES project [
14,
15]. On the contrary, thermoelastic properties E, ν and α are usually difficult to obtain, especially if temperature-dependent values are required. Sometimes it is possible to assume some values based on the literature, but most of the time these properties are completely unknown. For this specific case, the strategy proposed in this paper is to consider a set of Virtual Thermoelastic Parameters (VTPs). They will be used both for the calculation of {σ} and for the numerical estimation of σ
LIMIT (taking as a reference dedicated destructive tests at high temperature). In this way, {σ} and σ
LIMIT can be directly compared, with the possibility to evaluate the structural design of the target
. More details will be described in the following paragraphs.
3. Thermal Characterization and Related Experimental Procedures
The aforementioned design process for high-power targets requires the possibility to perform accurate and reliable thermal analyses. As discussed in the previous paragraph, the temperature field in steady-state conditions depends exclusively on k and ε. These two properties are usually unknown for the home-made materials constituting the target discs. With this in mind, a concise description of the methodologies developed at LNL for the estimation of both ε [
14] and k [
15] is proposed in the following. The high temperature furnace adopted to define T
LIMIT is also presented as discussed. Finally, k, ε and T
LIMIT values measured for the Hexoloy
® silicon carbides SA and SP are reported in the next paragraphs, together with grain size, density, pore size and surface roughness data for both SiC grades. These properties are particularly useful to comment on results, and being referred to commercial materials, they are all available from datasheets, with the exception of surface roughness, which was accurately measured by making use of the mechanical stylus method (Mitutoyo Surftest SJ-210, stylus tip radius R2 µm, detector measuring force 0.75 mN).
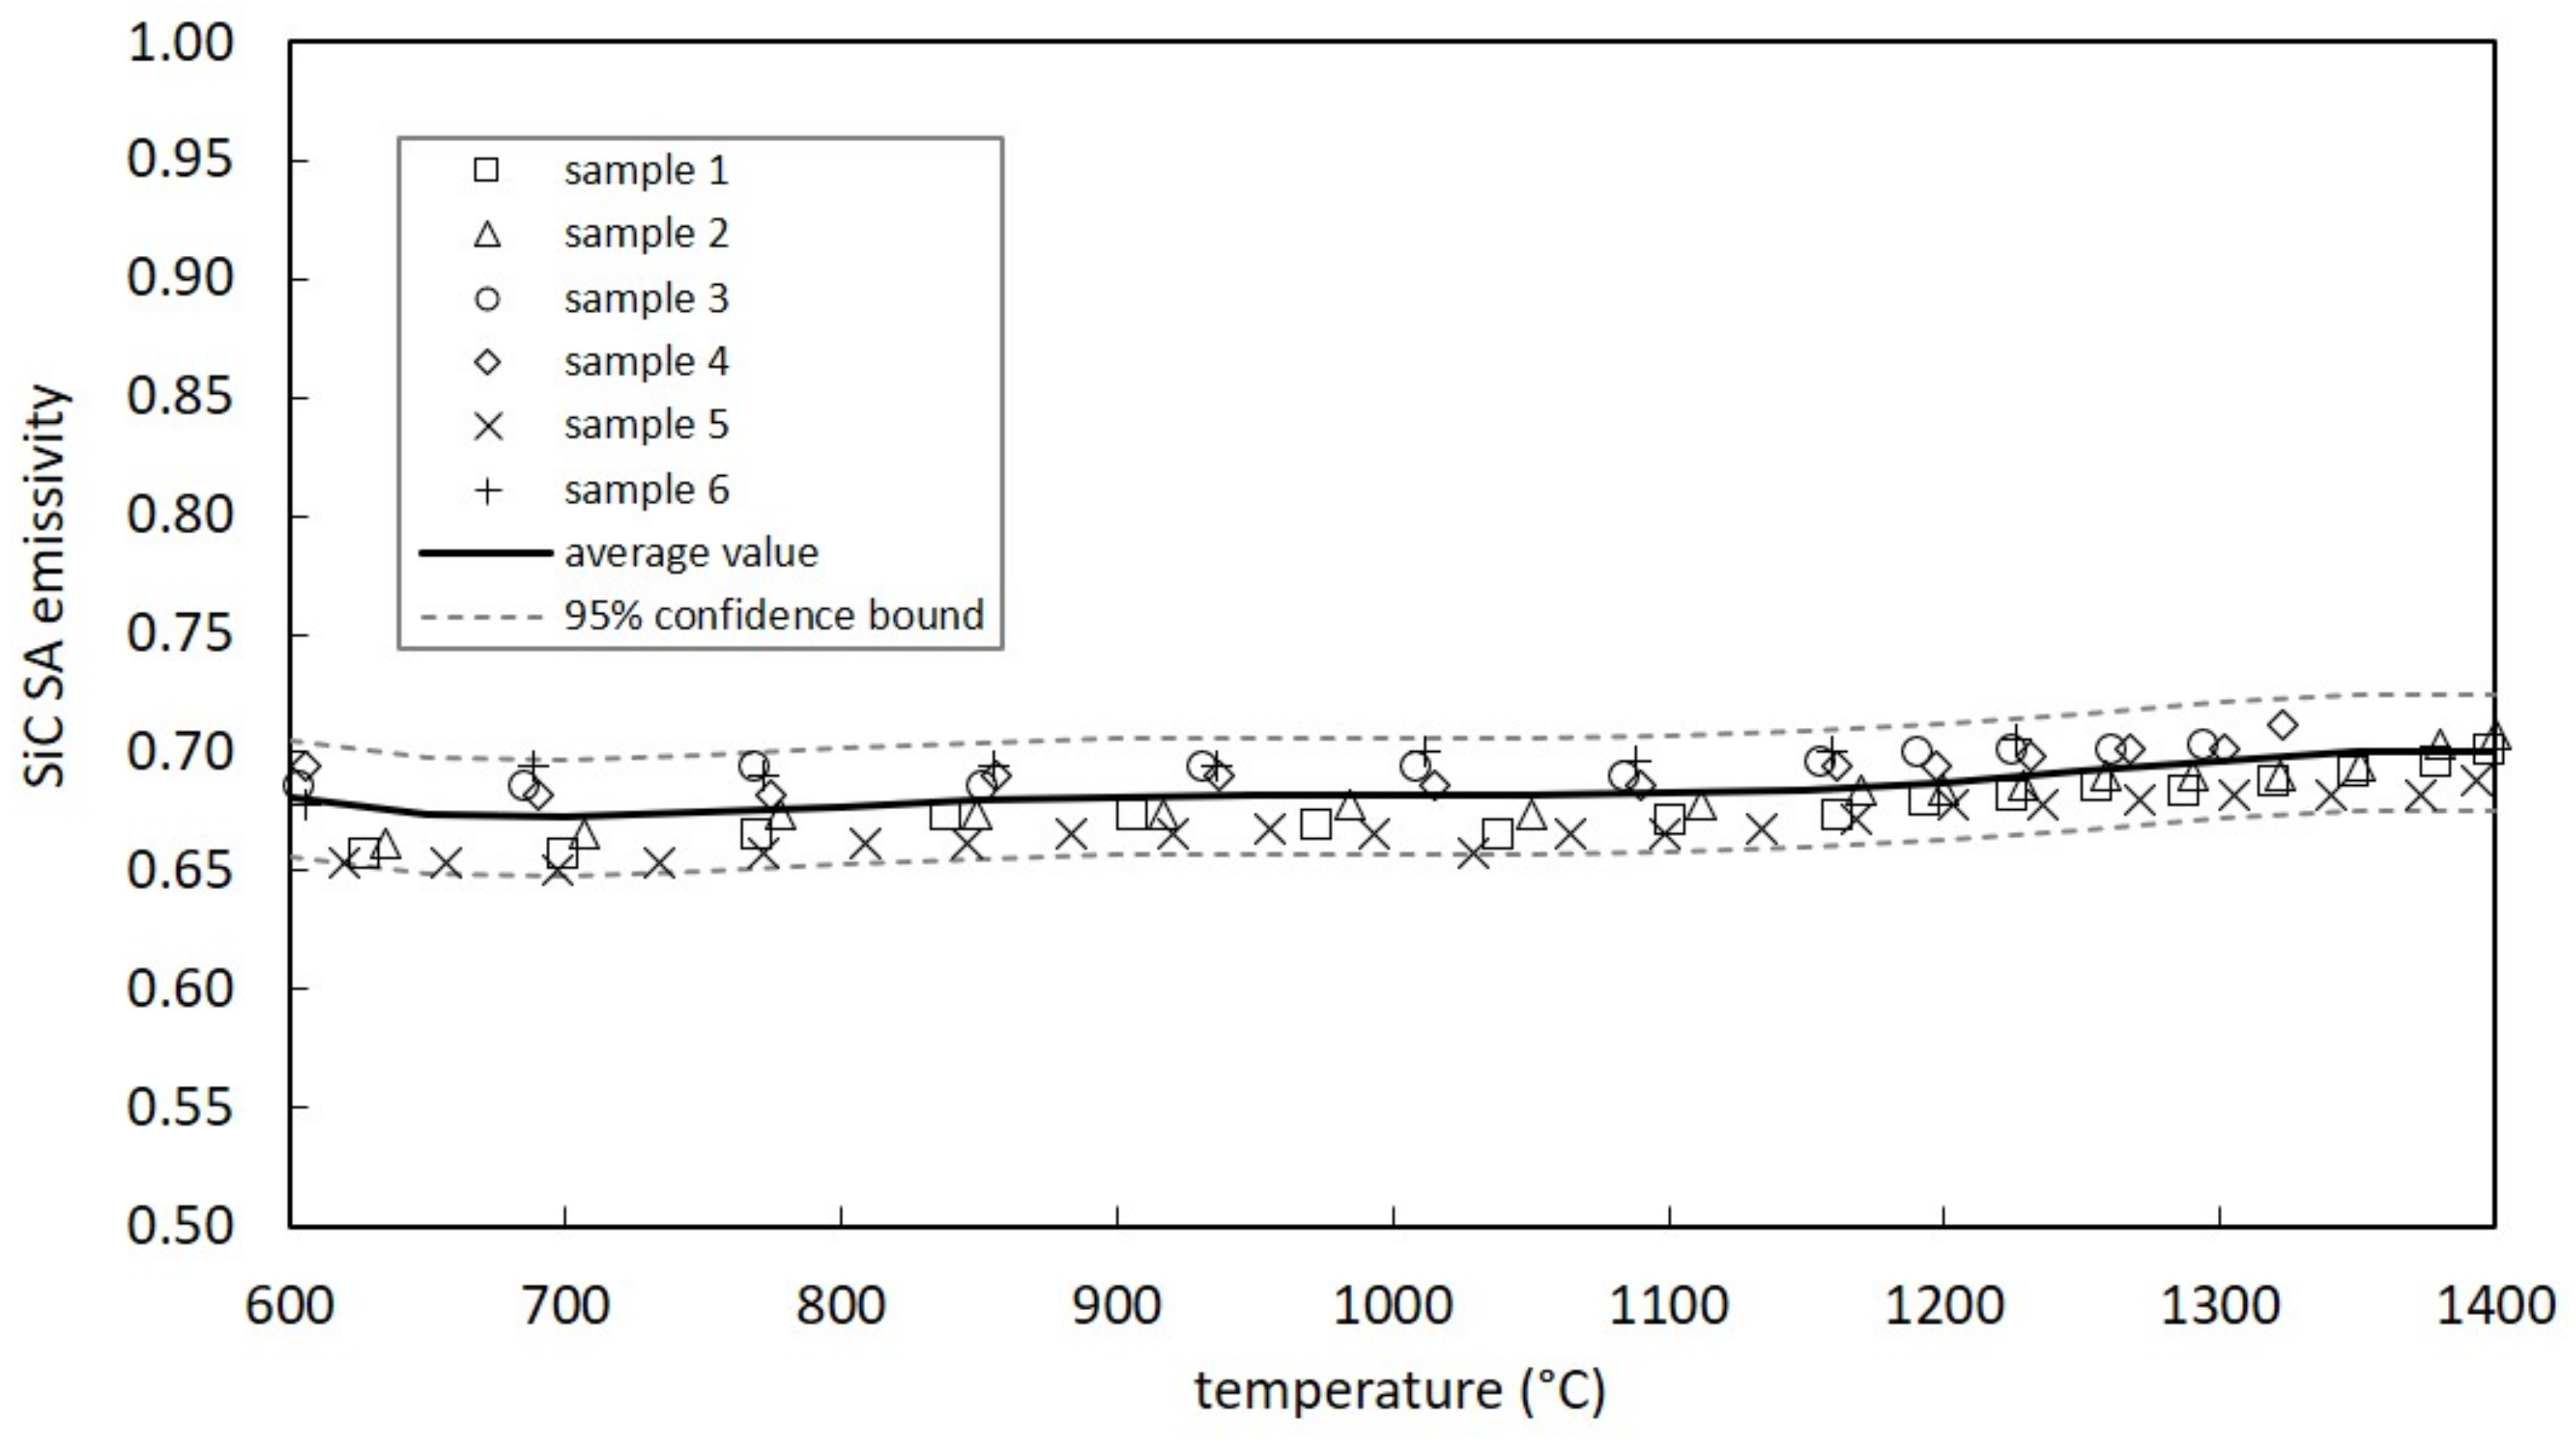
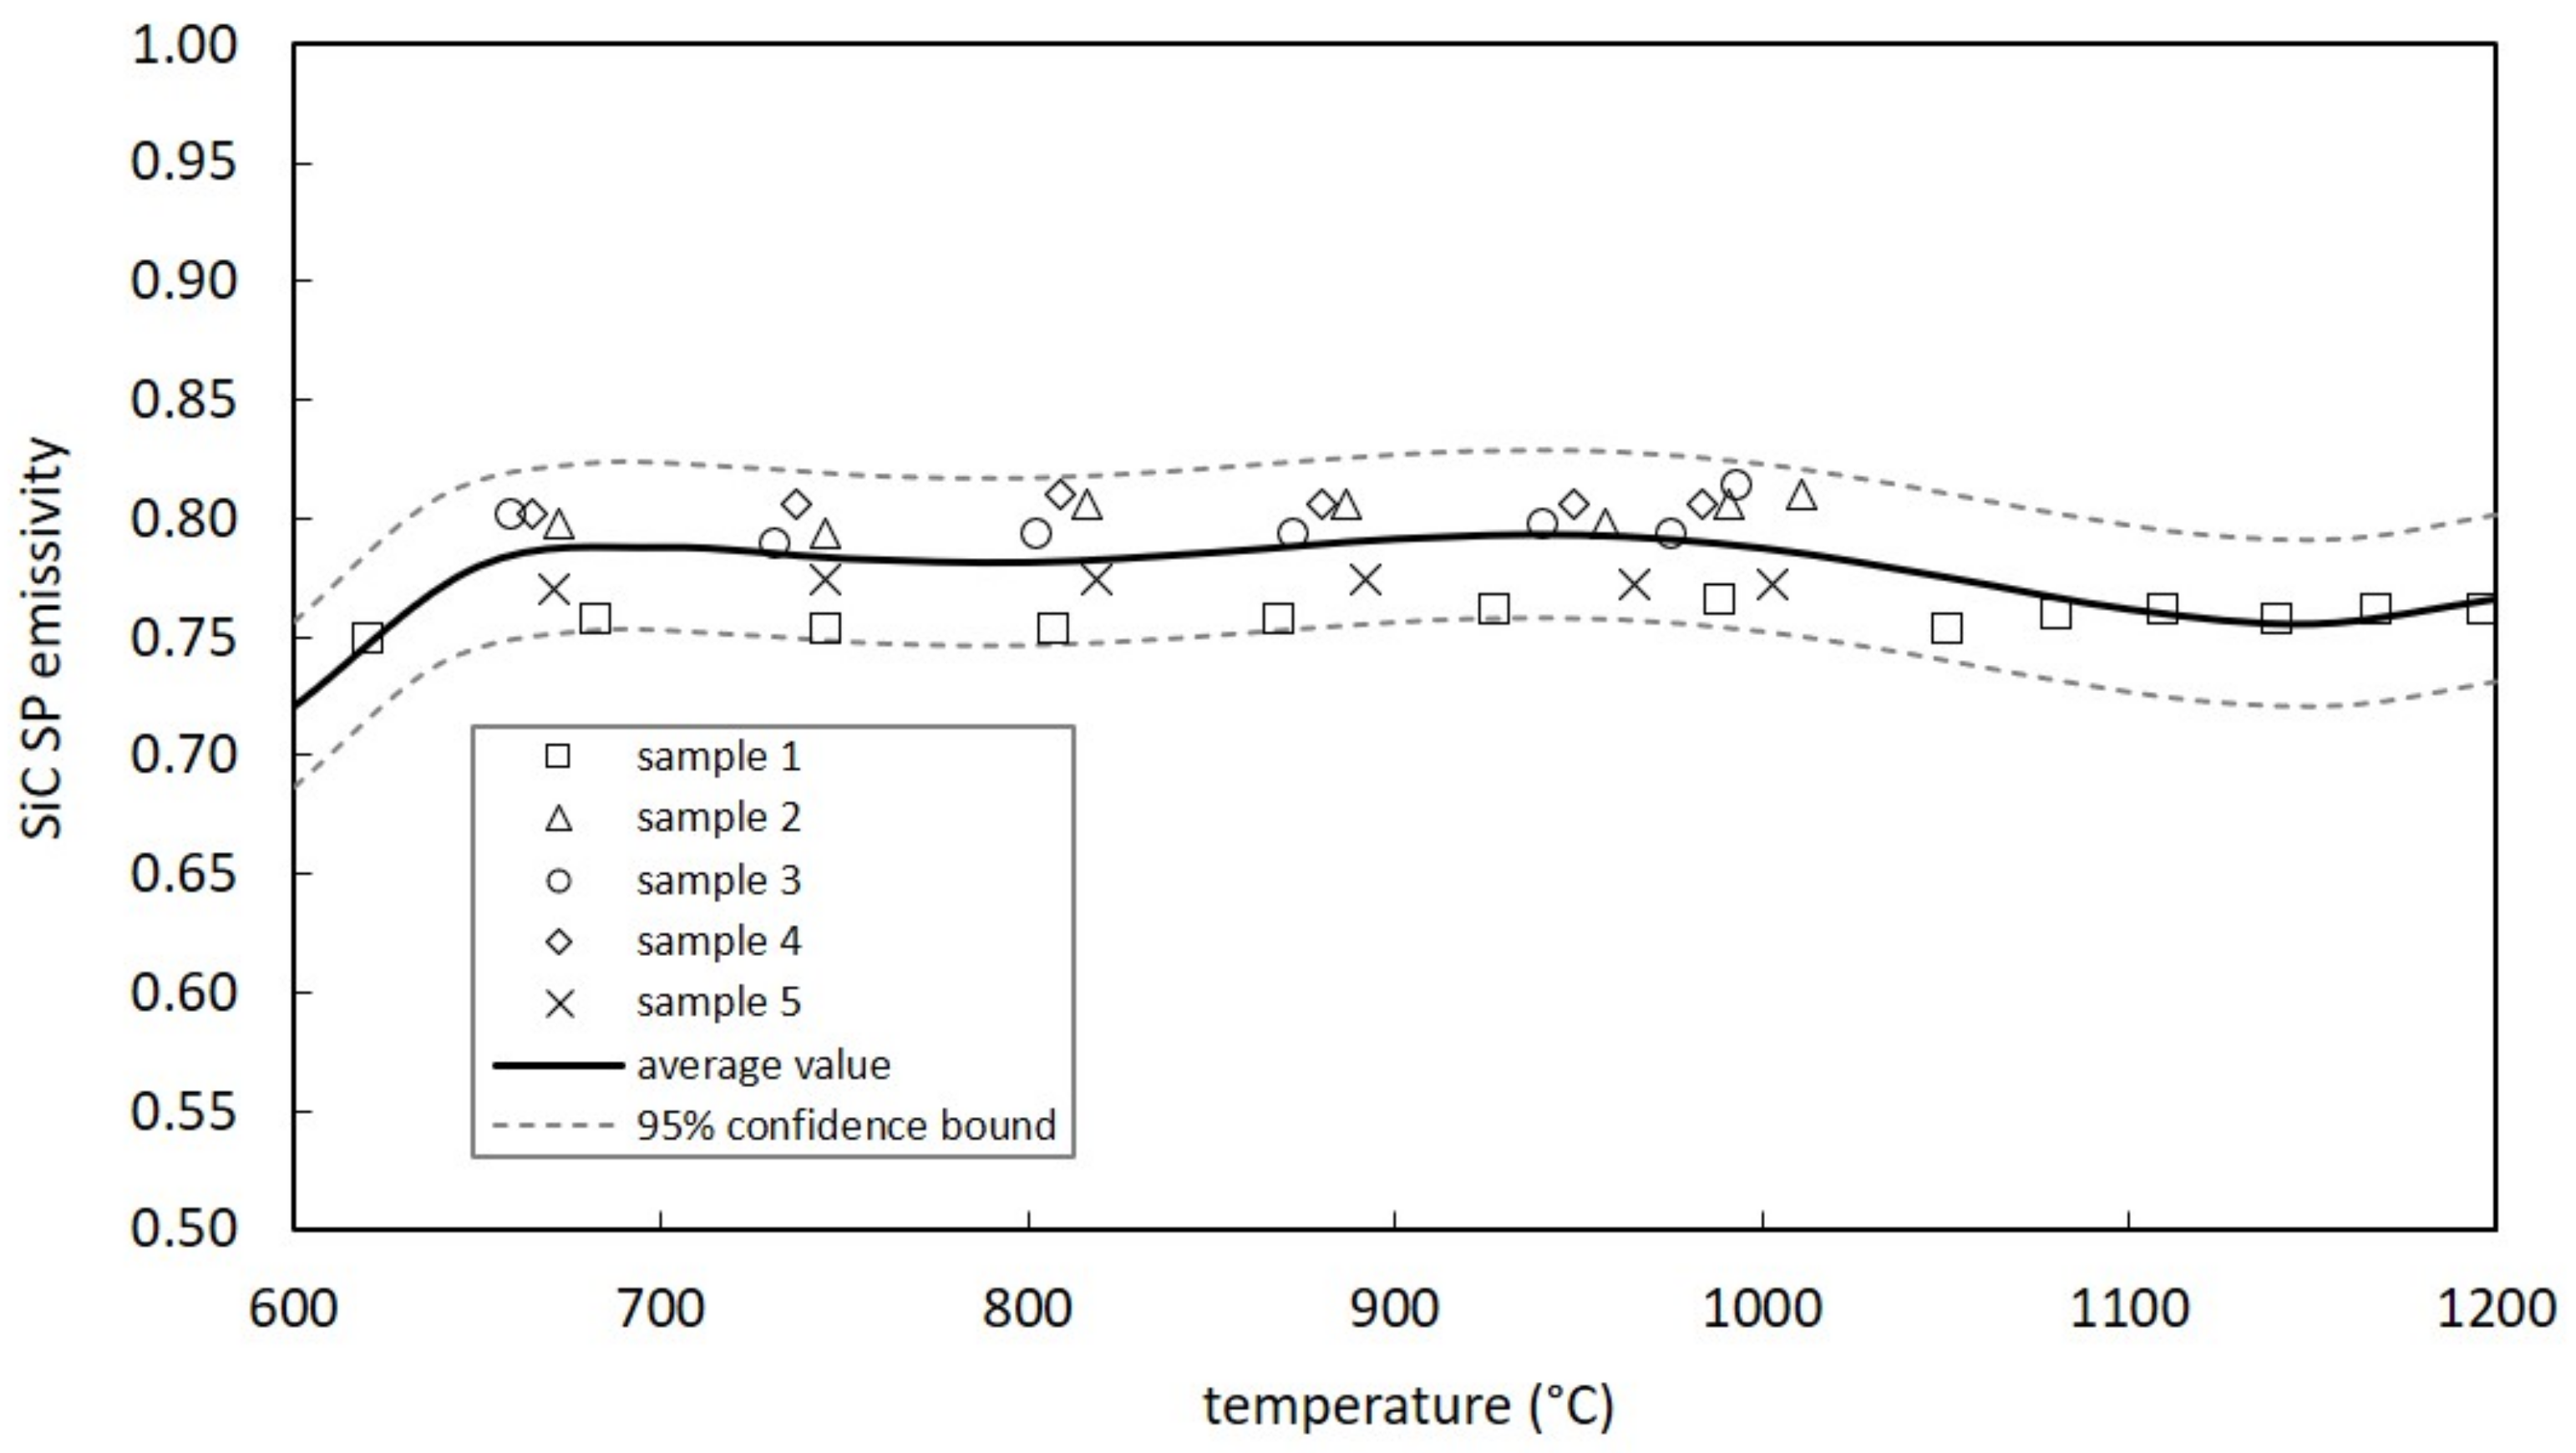
3.1. Emissivity
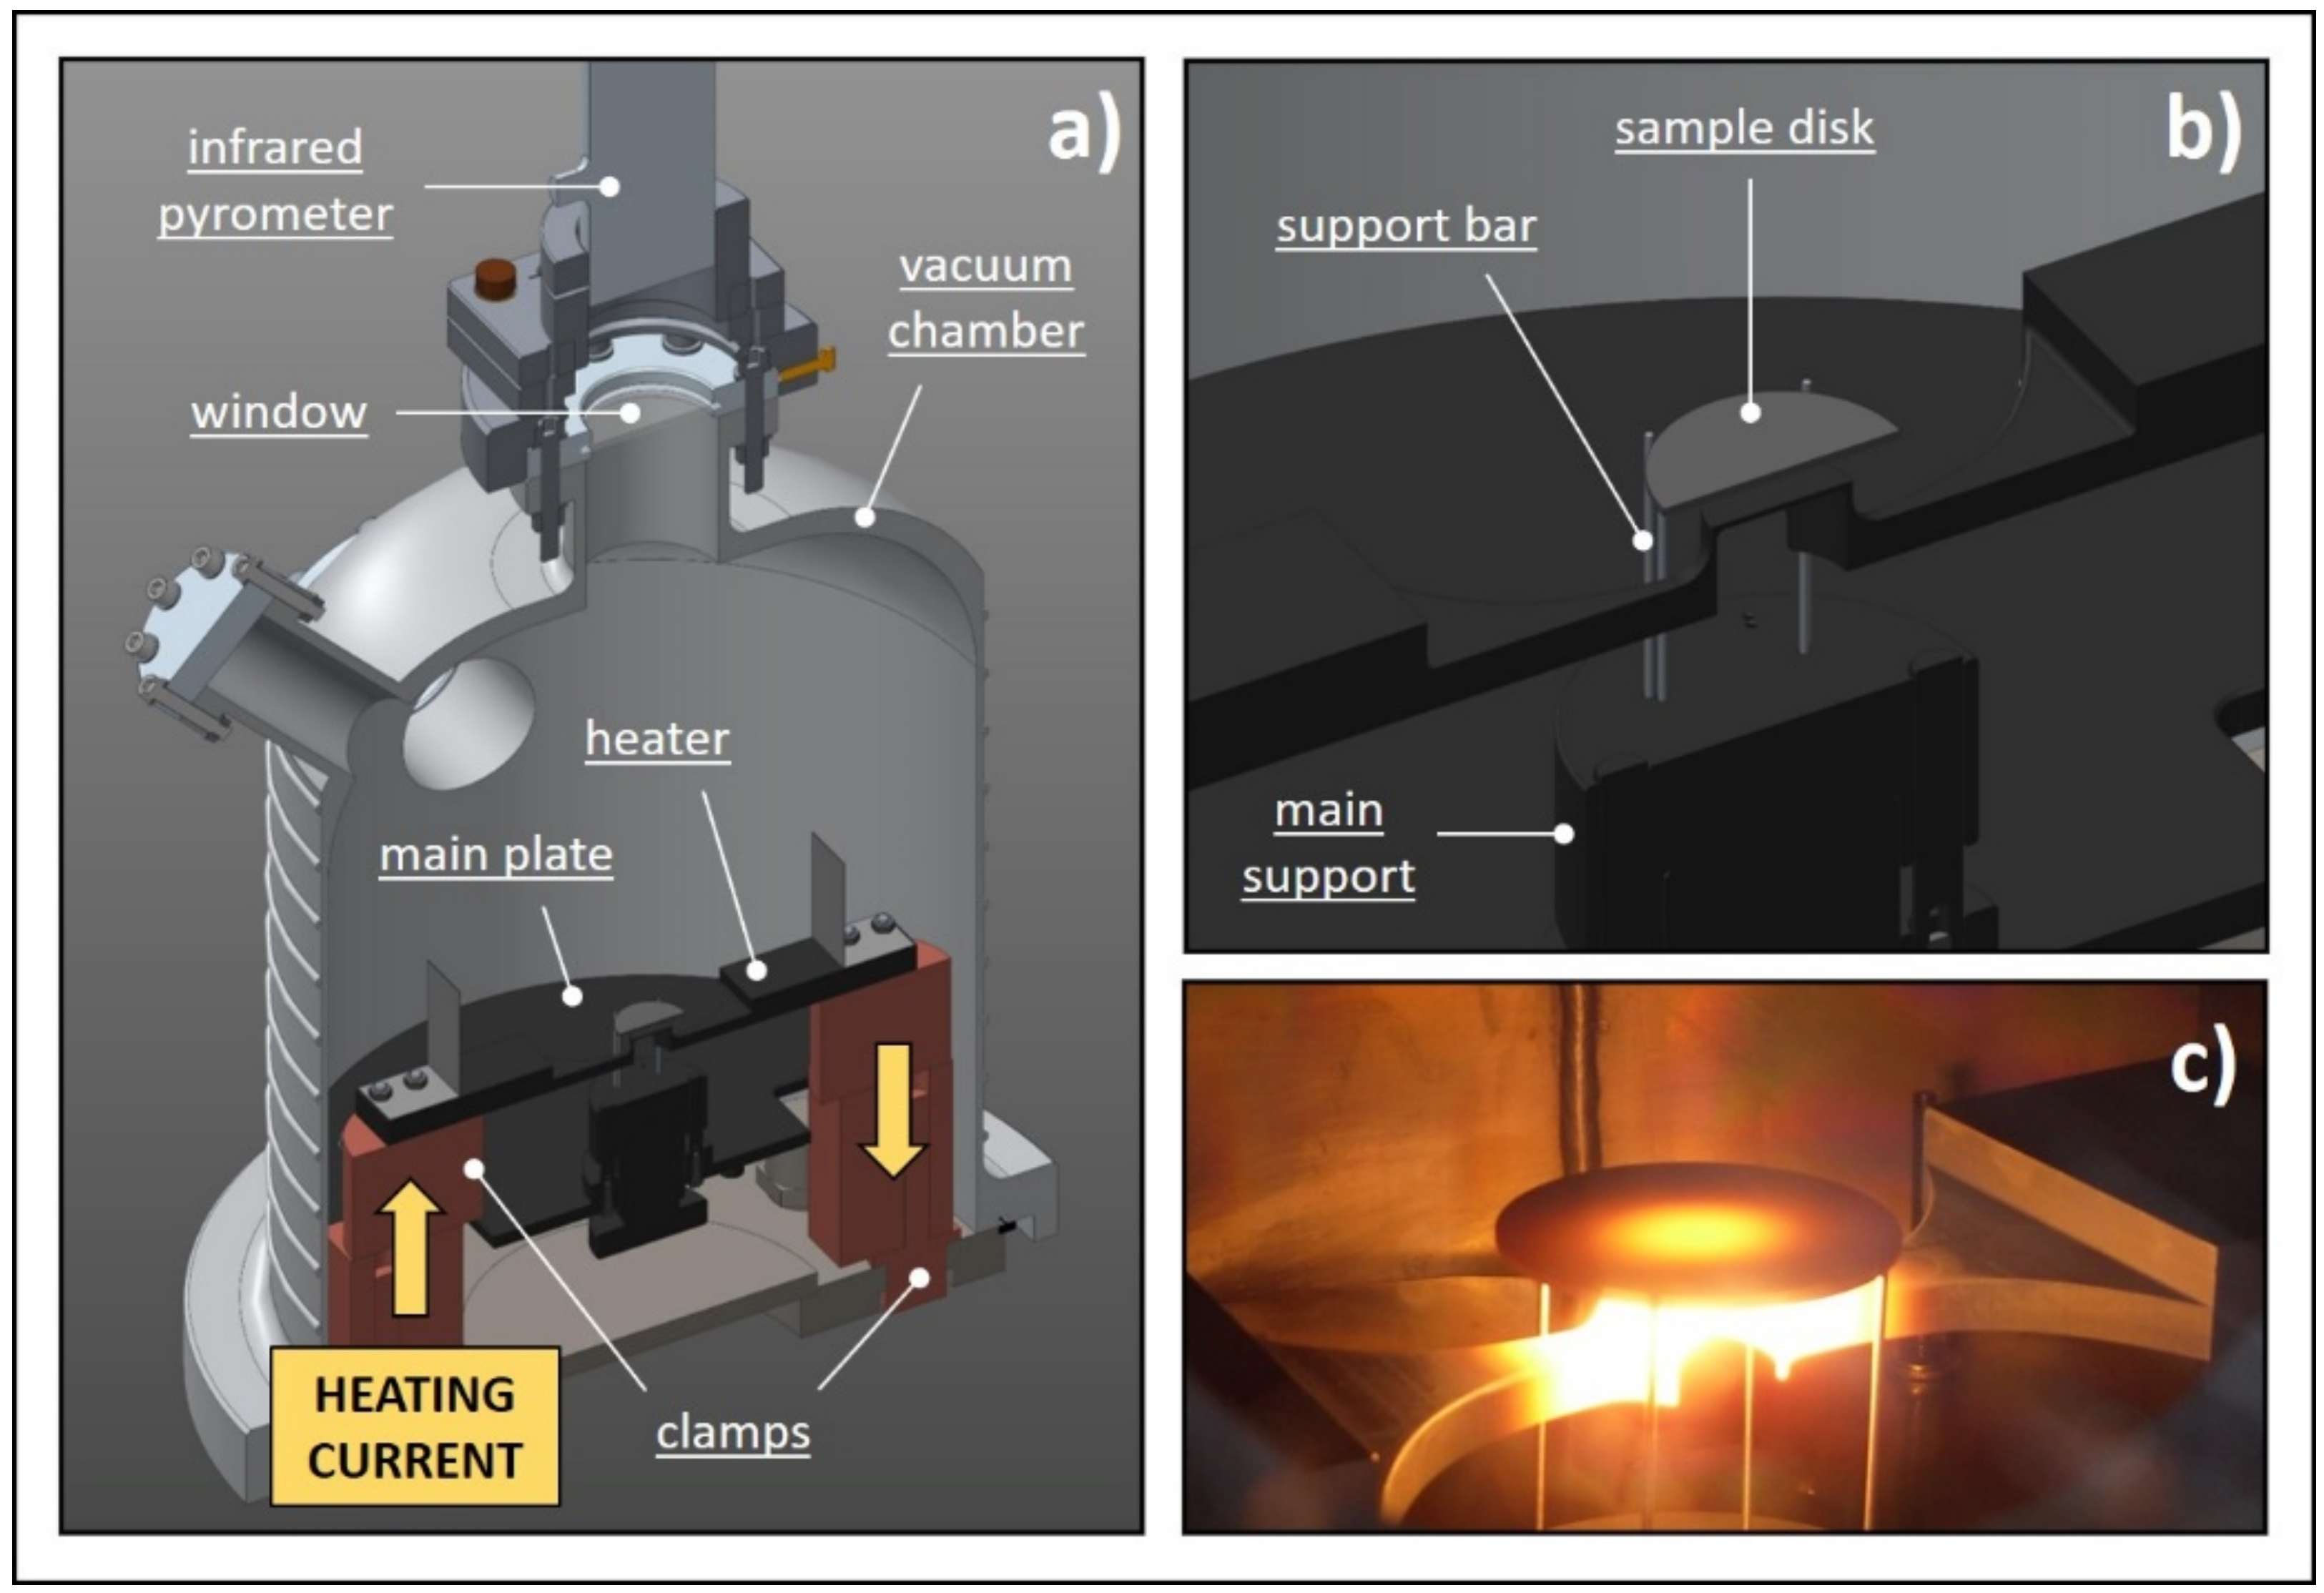
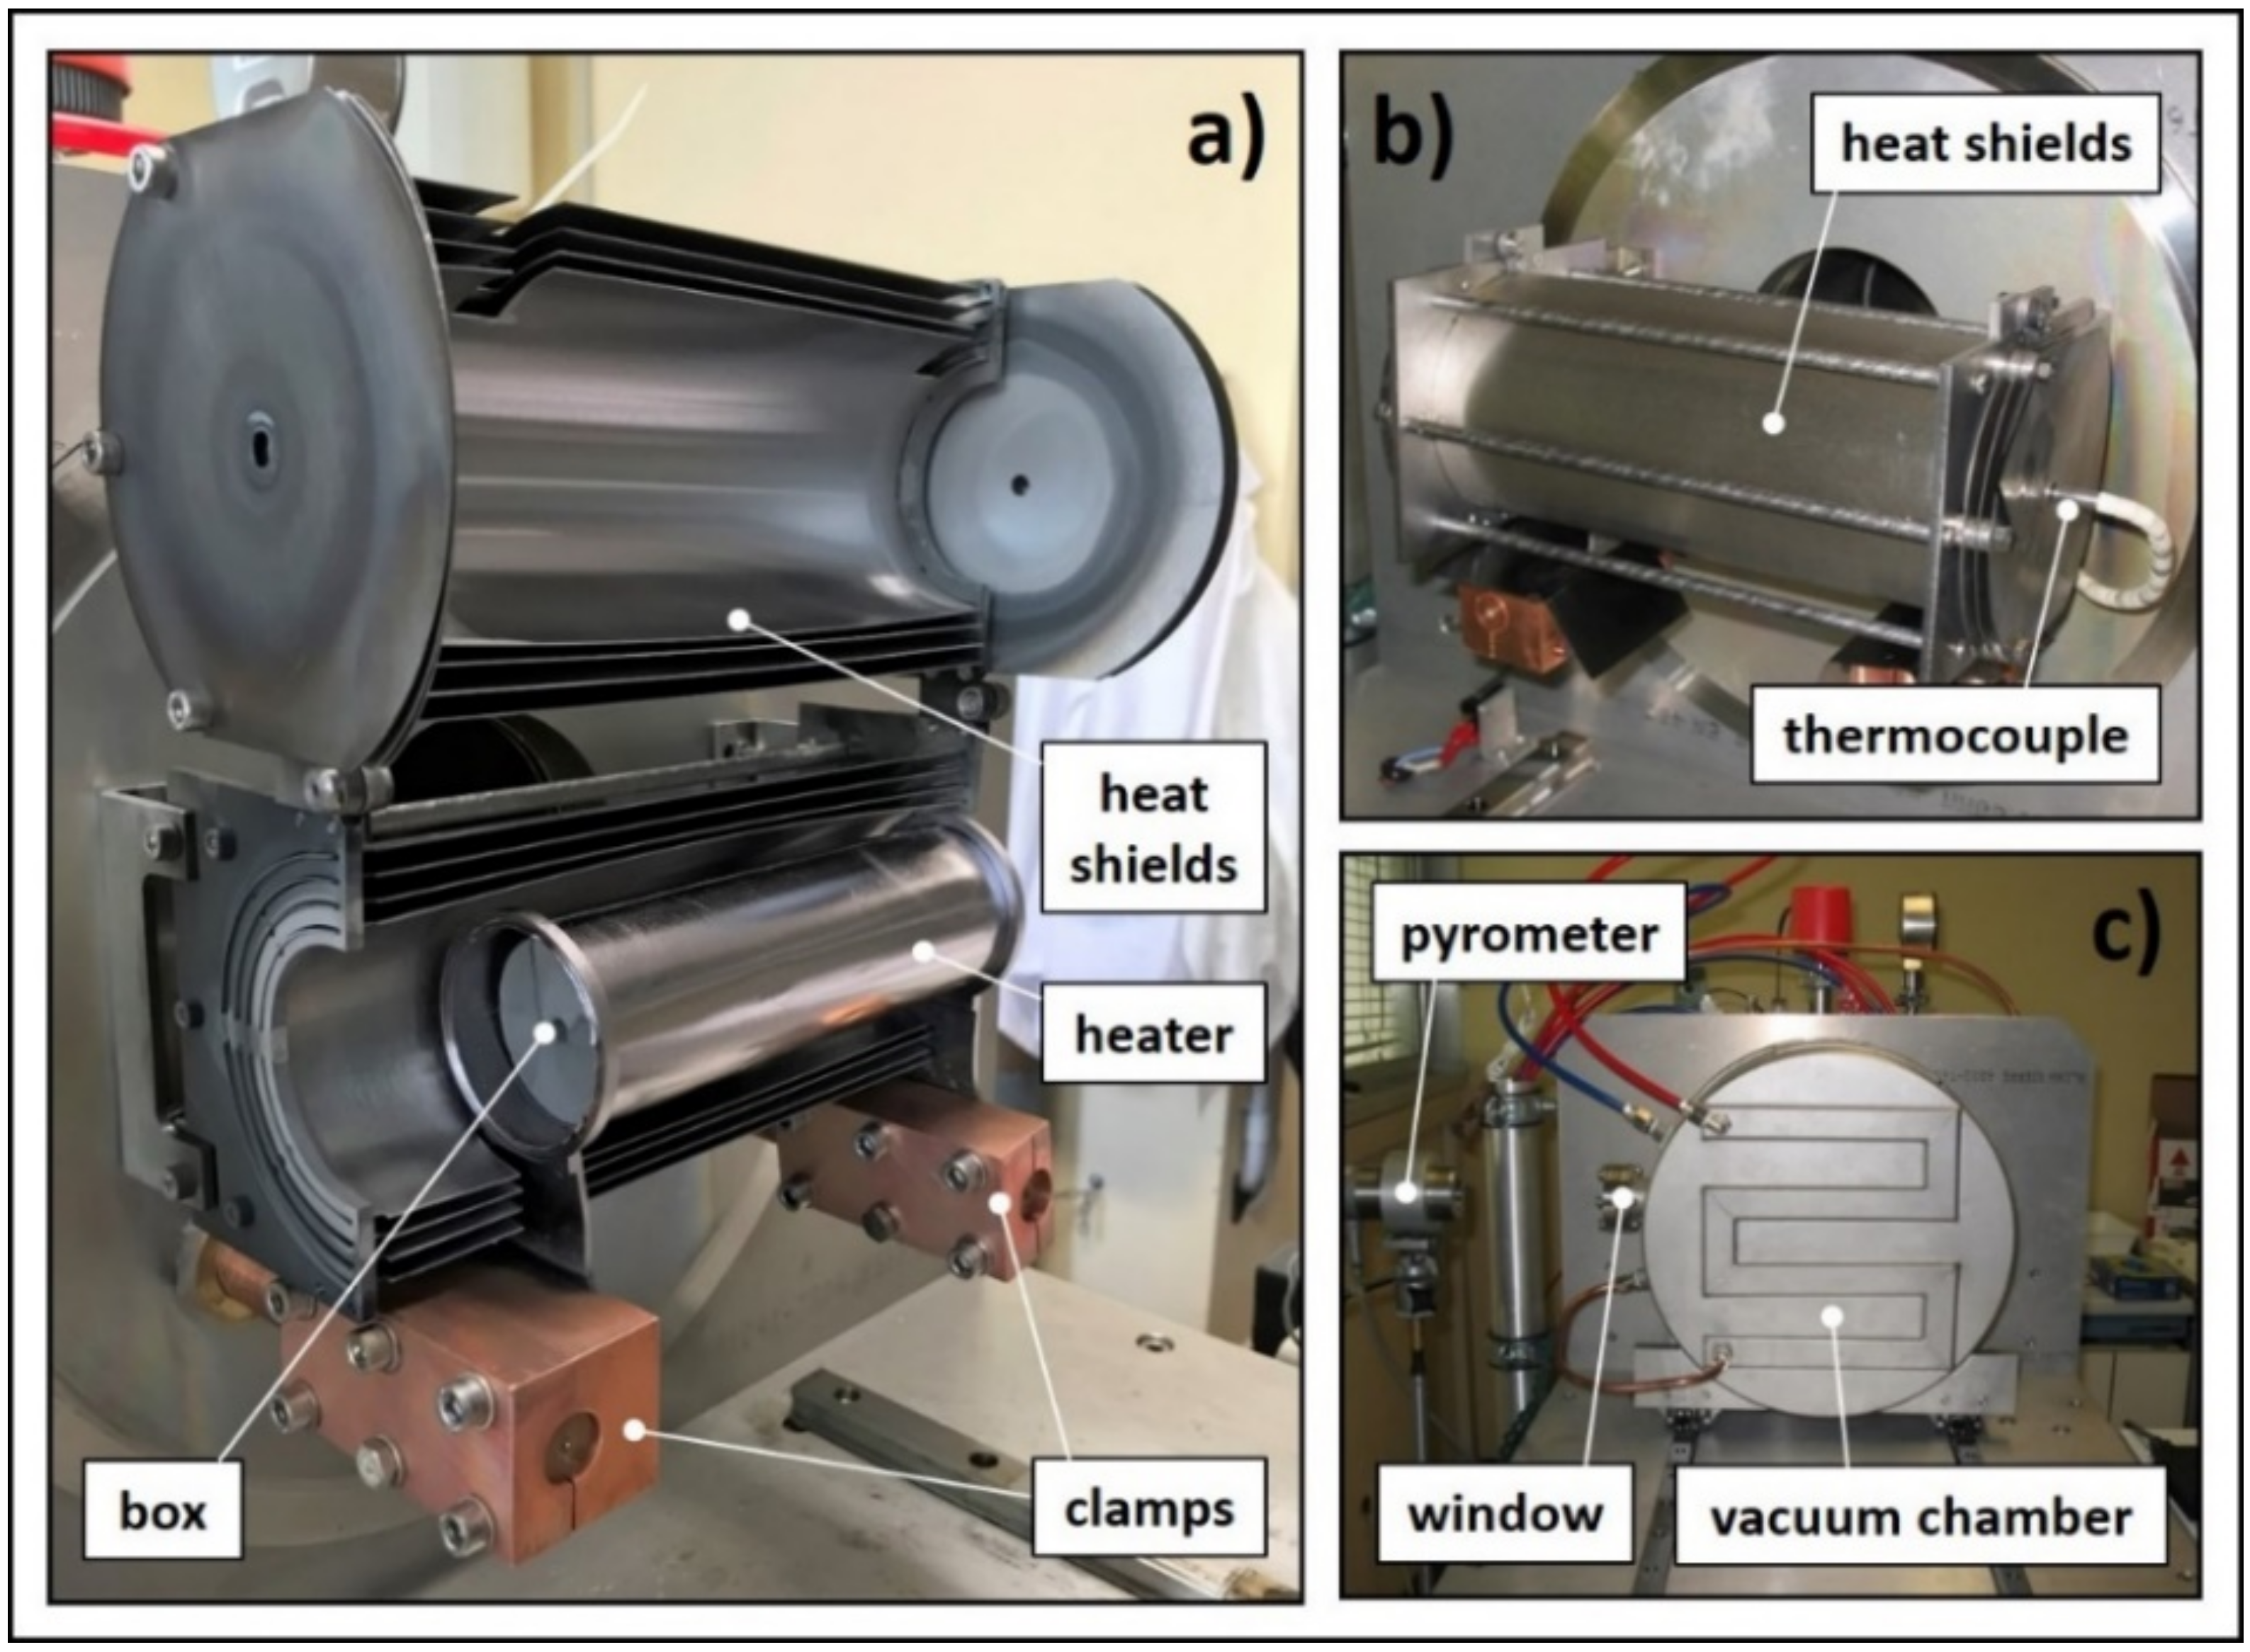
The experimental set-up used to measure the total hemispherical emissivity ε was entirely designed and constructed at LNL. Its main details are illustrated in
Figure 4. A dedicated power supply (I
MAX = 1000 A, V
MAX = 10 V) directly heats by Joule effect the graphite heater, which is connected to water-cooled copper clamps at its extremities. The heater is designed in order to produce on its top circular surface (diameter equal to 18 mm) a homogeneous temperature distribution at temperature levels up to 2200 °C. Four tungsten bars suspend the sample disc coaxially with respect to the round hot surface of the heater. Sample diameters can range from 30 to 40 mm (the thickness is usually between 0.5 and 3 mm), and the bars (inserted in the graphite main support represented in
Figure 4) allow for a precise spacing between the sample disc and the hot surface of the heater, with the possibility to make fine regulations between 0.2 and 5 mm. The spacing is an extremely important parameter that deeply affects both the maximum disc temperature (in the center) and the severity of the gradients (in the radial direction). The temperature profile induced in the sample disc indeed reproduces very closely the temperature field {T} related to the proton beam power deposition, characterized by strong radial temperature gradients. As explained in the following paragraphs, these gradients are particularly important for the study of both k and σ
LIMIT. For the moment, we simply highlight that such an apparatus allows for fine temperature regulations in the center of the disc (see
Figure 4c) by setting up the heater–disc spacing and the heating current coming from the power supply.
All the components described above are closed inside a water-cooled vacuum chamber. Vacuum is kept at approximately 10
−6 mbar by a rotary pump and a turbomolecular pump placed in series. A high-temperature infrared pyrometer is placed on the top of the vacuum chamber, in proximity of a boro-silicate glass window, which is almost completely transparent to infrared radiation. As discussed in [
14], this instrument can operate both in two- and single-color modes. For the materials tested in this work (Hexoloy
® silicon carbides SA and SP), the gray-body hypothesis is assumed and temperature in the center of the disc is measured in the two-color mode as specified in the instrument guide and in [
14]. At this point, emissivity can be defined using the pyrometer in the monochromatic mode and changing the instrument emissivity value until the measured temperature in the monochromatic mode matches the temperature measured in the two-color mode. Assuming that the measurement direction is normal to the pointed surface, it is fundamental to underline that the emissivity measured in this way is the spectral normal emissivity ε
λ,n related to the working wavelength of the instrument in the monochromatic mode (λ = 1.05 μm). If the diffuse gray surface hypothesis (widely used for radiation exchange engineering calculations) is adopted [
14], the total hemispherical emissivity ε can be directly approximated with ε
λ,n. It is important to underline that all data are collected automatically by making use of a computer connected to the instrumentation by a Programmable Logic Controller (PLC).
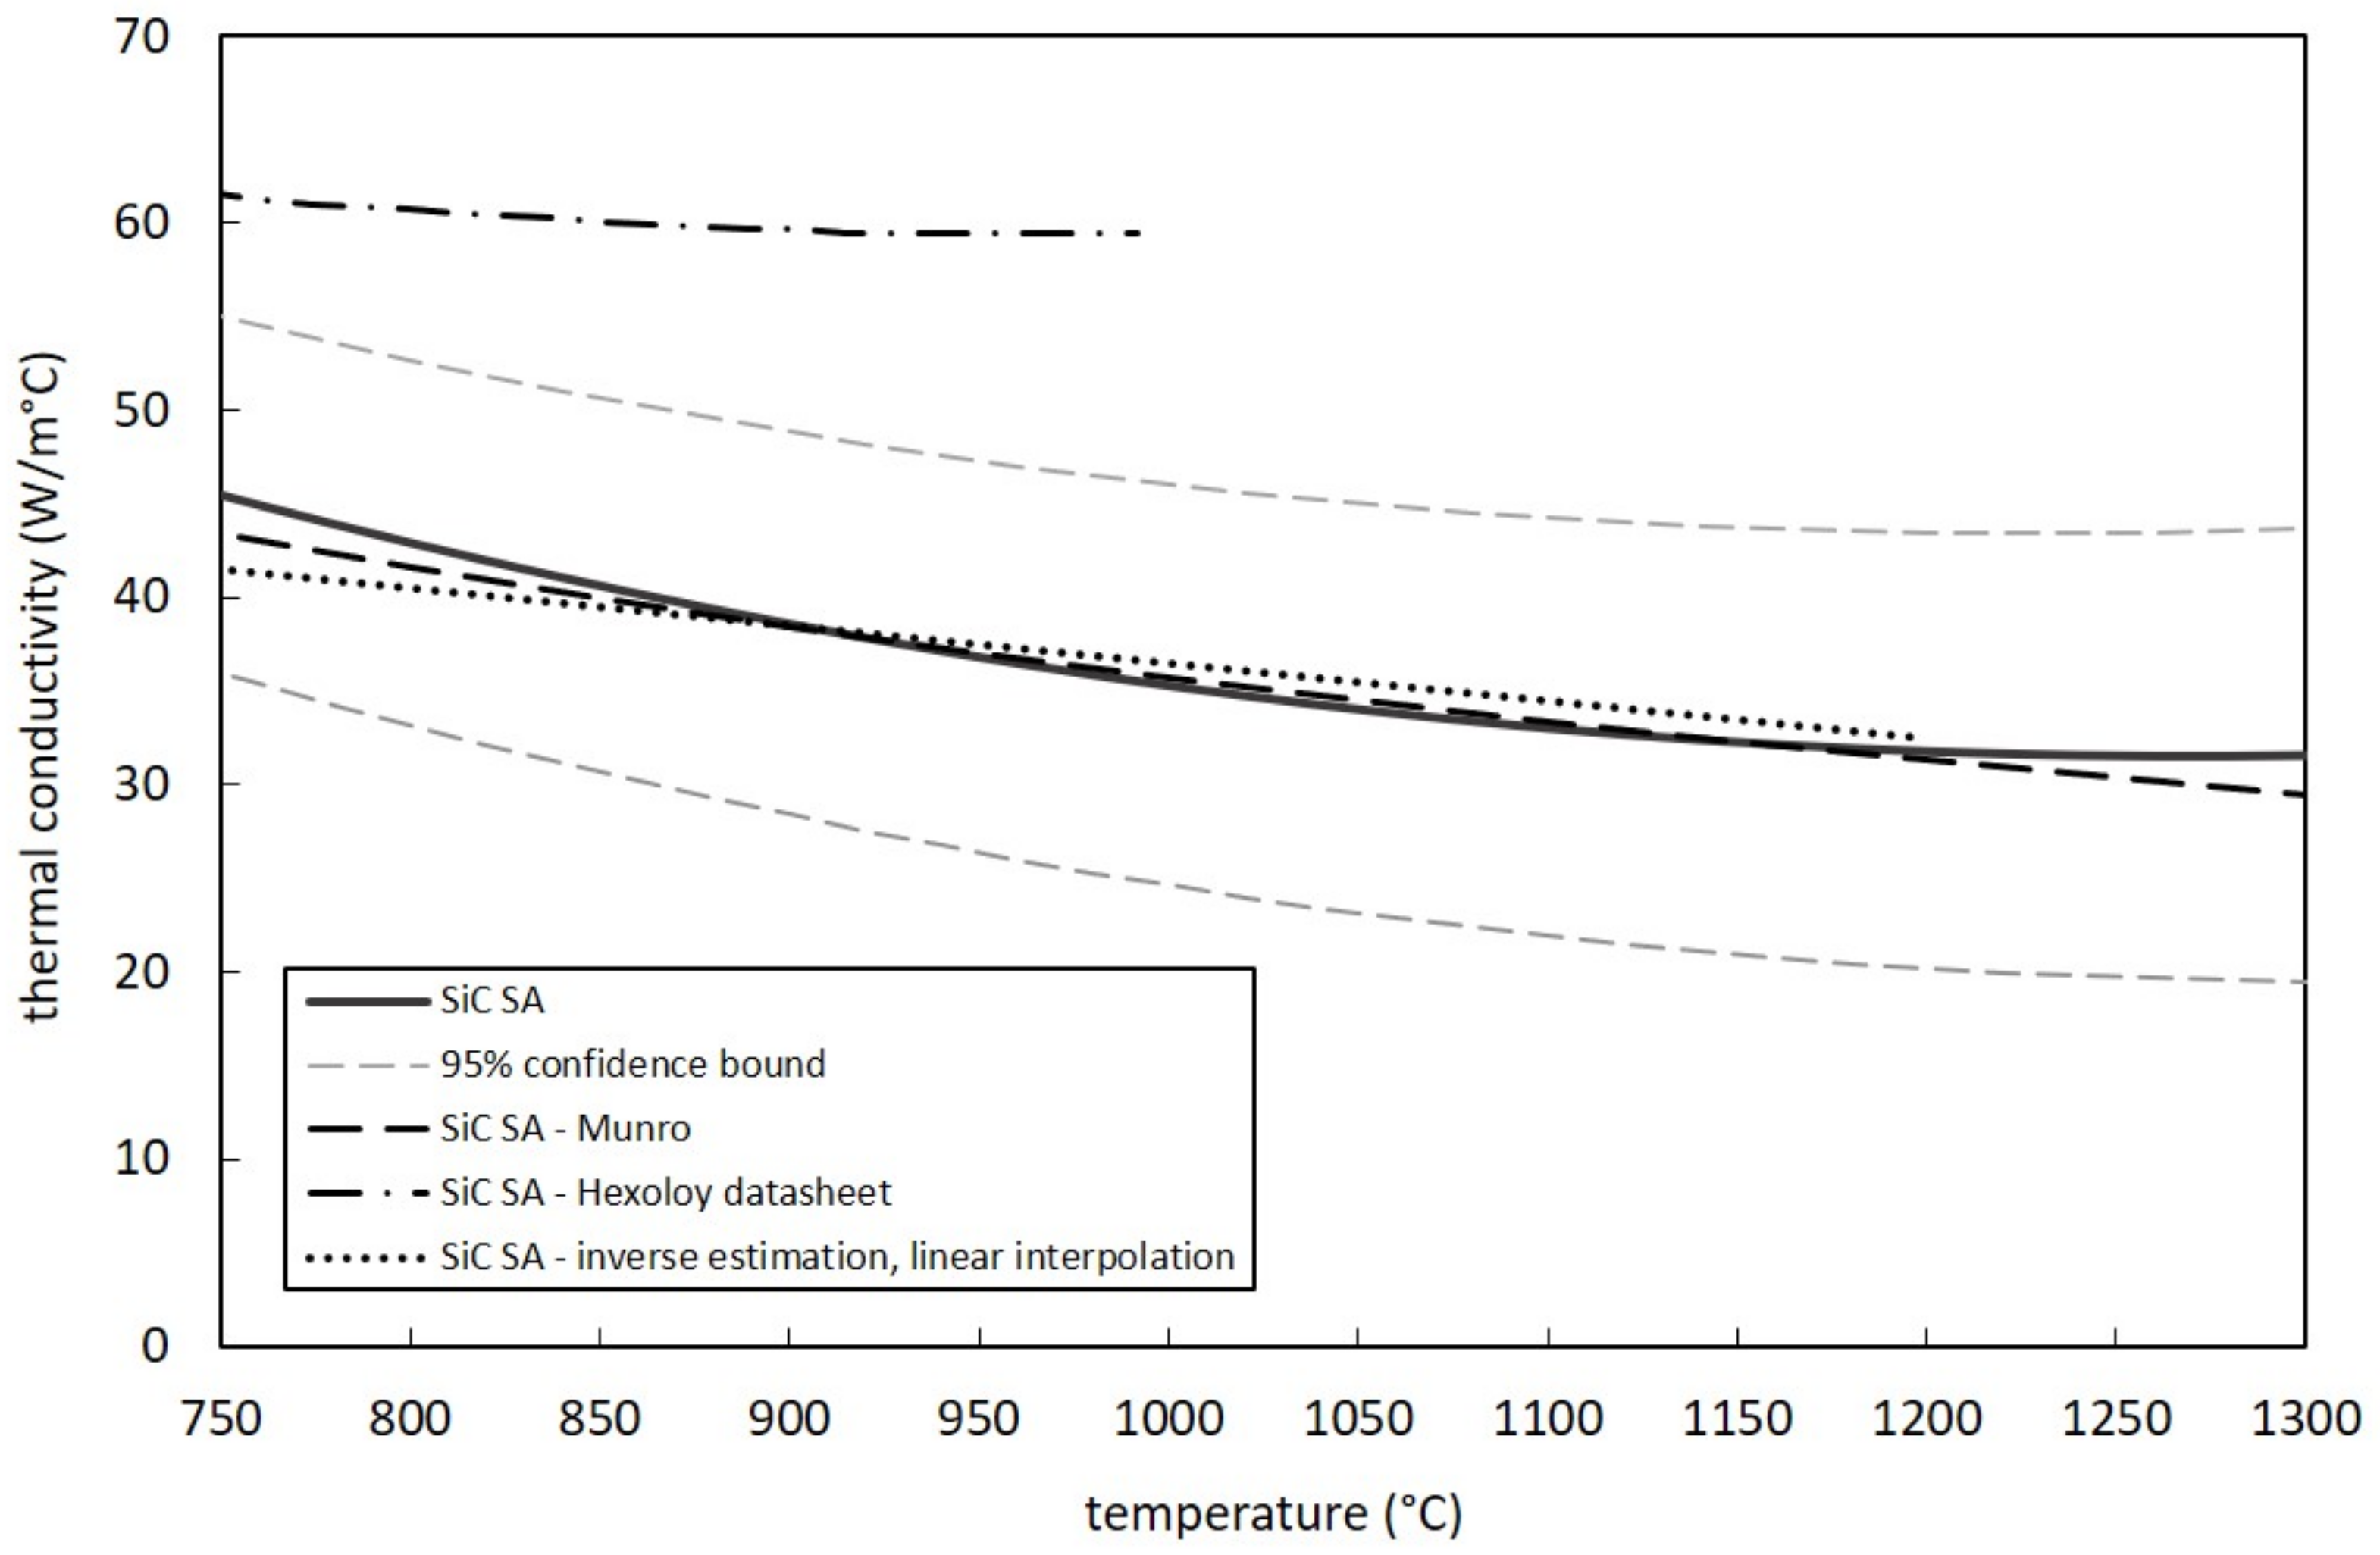
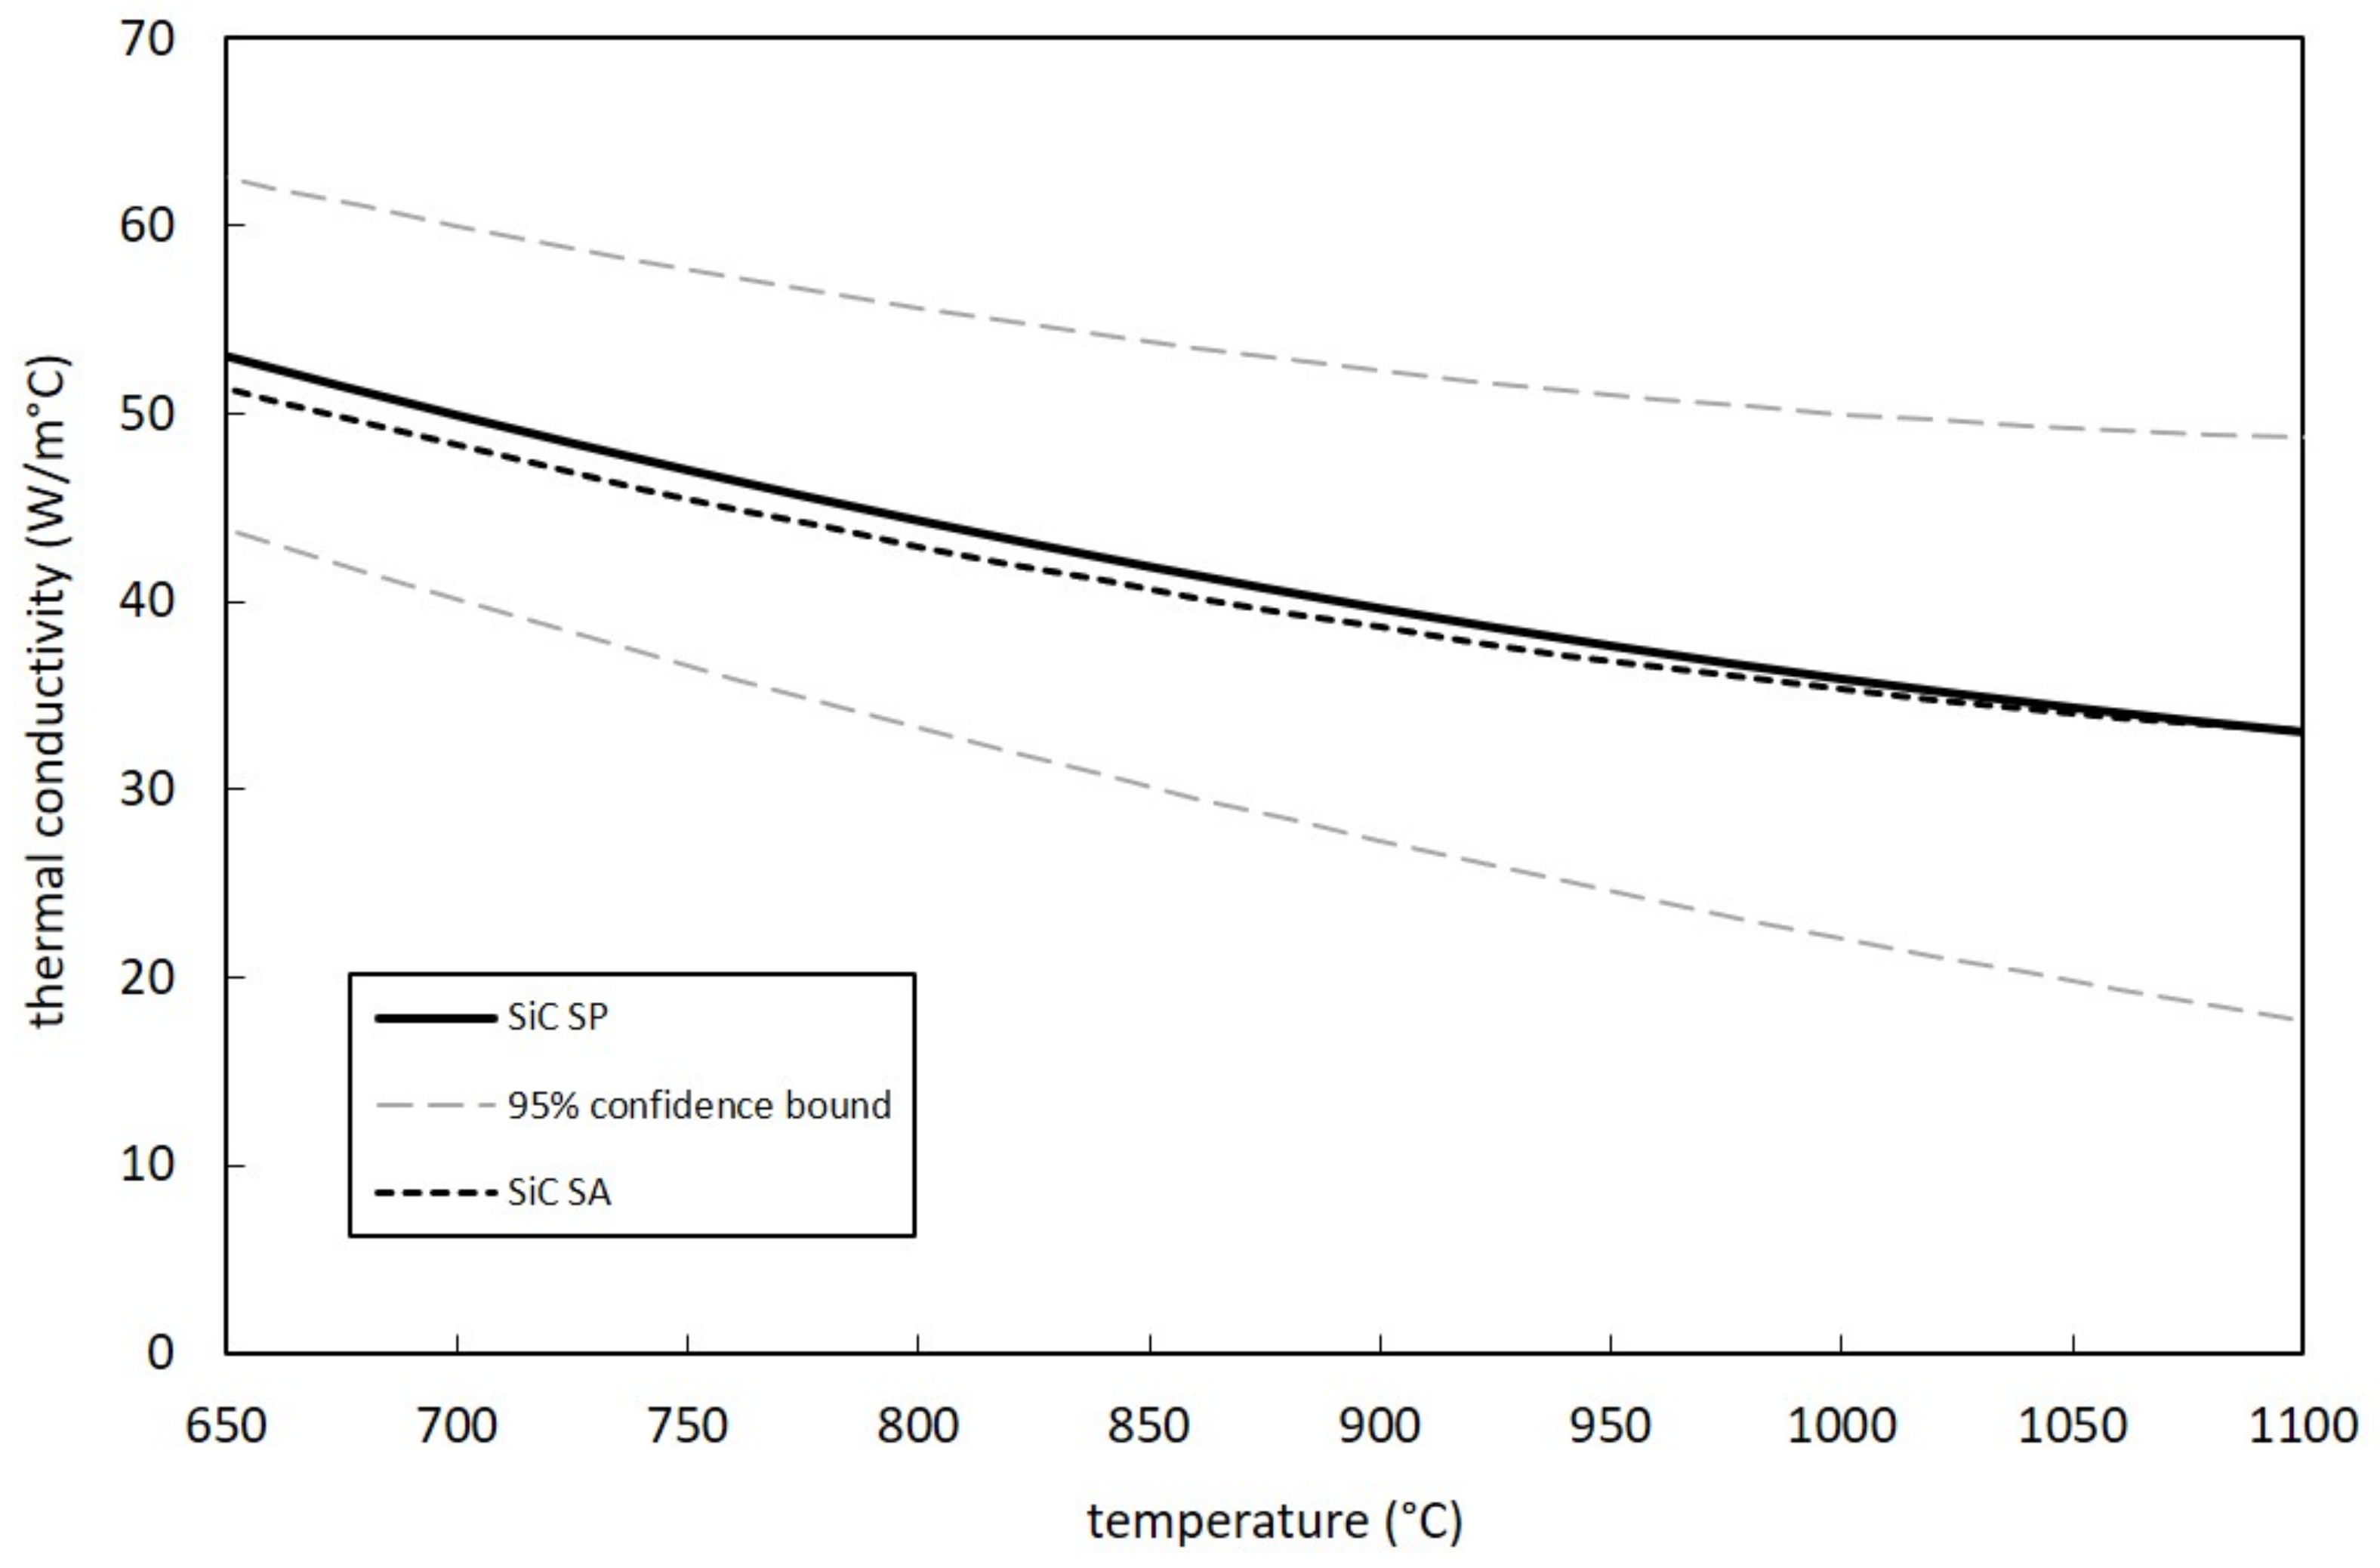
3.2. Thermal Conductivity
The thermal conductivity k of the sample material can be estimated by means of the steady-state method reported in [
15] and the experimental apparatus described in the previous paragraph (see
Figure 4). At the basis of the method there is a consolidated electrical–thermal finite element model of the experimental apparatus that is capable of simulating both the conduction/radiation thermal problem (convection is not considered in high vacuum) and the electrical one. In steady-state conditions, ε and k must be known for all materials since these are the two properties required to solve the thermal problem. Moreover, since high DC currents pass through the heater and the clamps, the electrical resistivity ρ should be introduced for both graphite and copper to allow the implementation of the electrical problem and the Joule heating effect.
At this point, it is important to highlight that all the aforementioned material properties (ε, k and ρ) were accurately verified during the years through dedicated experimental tests and accurate literature searches [
15]. Of course, the only exception is constituted by the sample material (involved exclusively in the thermal problem), for which ε and k are unknown. Now, temperature-dependent emissivity values can be surely estimated using the above described procedure, whereas k is assumed to be temperature dependent through the following quadratic expression:
From the observation of Equation (1), it is evident that k is expressed by means of three unknown parameters (C
0, C
1 and C
2) that can be easily represented in vector form as proposed in the following:
In this shape, the problem can be regarded as a typical optimization problem, whose goal is the consistency between computed and measured temperatures. The quantification of such consistency is represented by the following residual function:
where N
CS is the number of current steps used to power the heater and so to heat the sample, T
C_COMP_i and T
P_COMP_i are the computed temperatures at the center and at the periphery of the sample disc, respectively, and T
C_MEAS_i and T
P_MEAS_i are the correspondent measured values. A specific steady-state temperature field is associated with every current step, for both the numerical model (T
C_COMP_i, T
P_COMP_i) and the experimental tests (T
C_MEAS_i, T
P_MEAS_i). The optimization process, so the minimization of J with respect to
f, is performed numerically, making use of the optimization tools implemented in the ANSYS
® environment, allowing the determination of the quadratic expression for k.
3.3. Temperature Limit
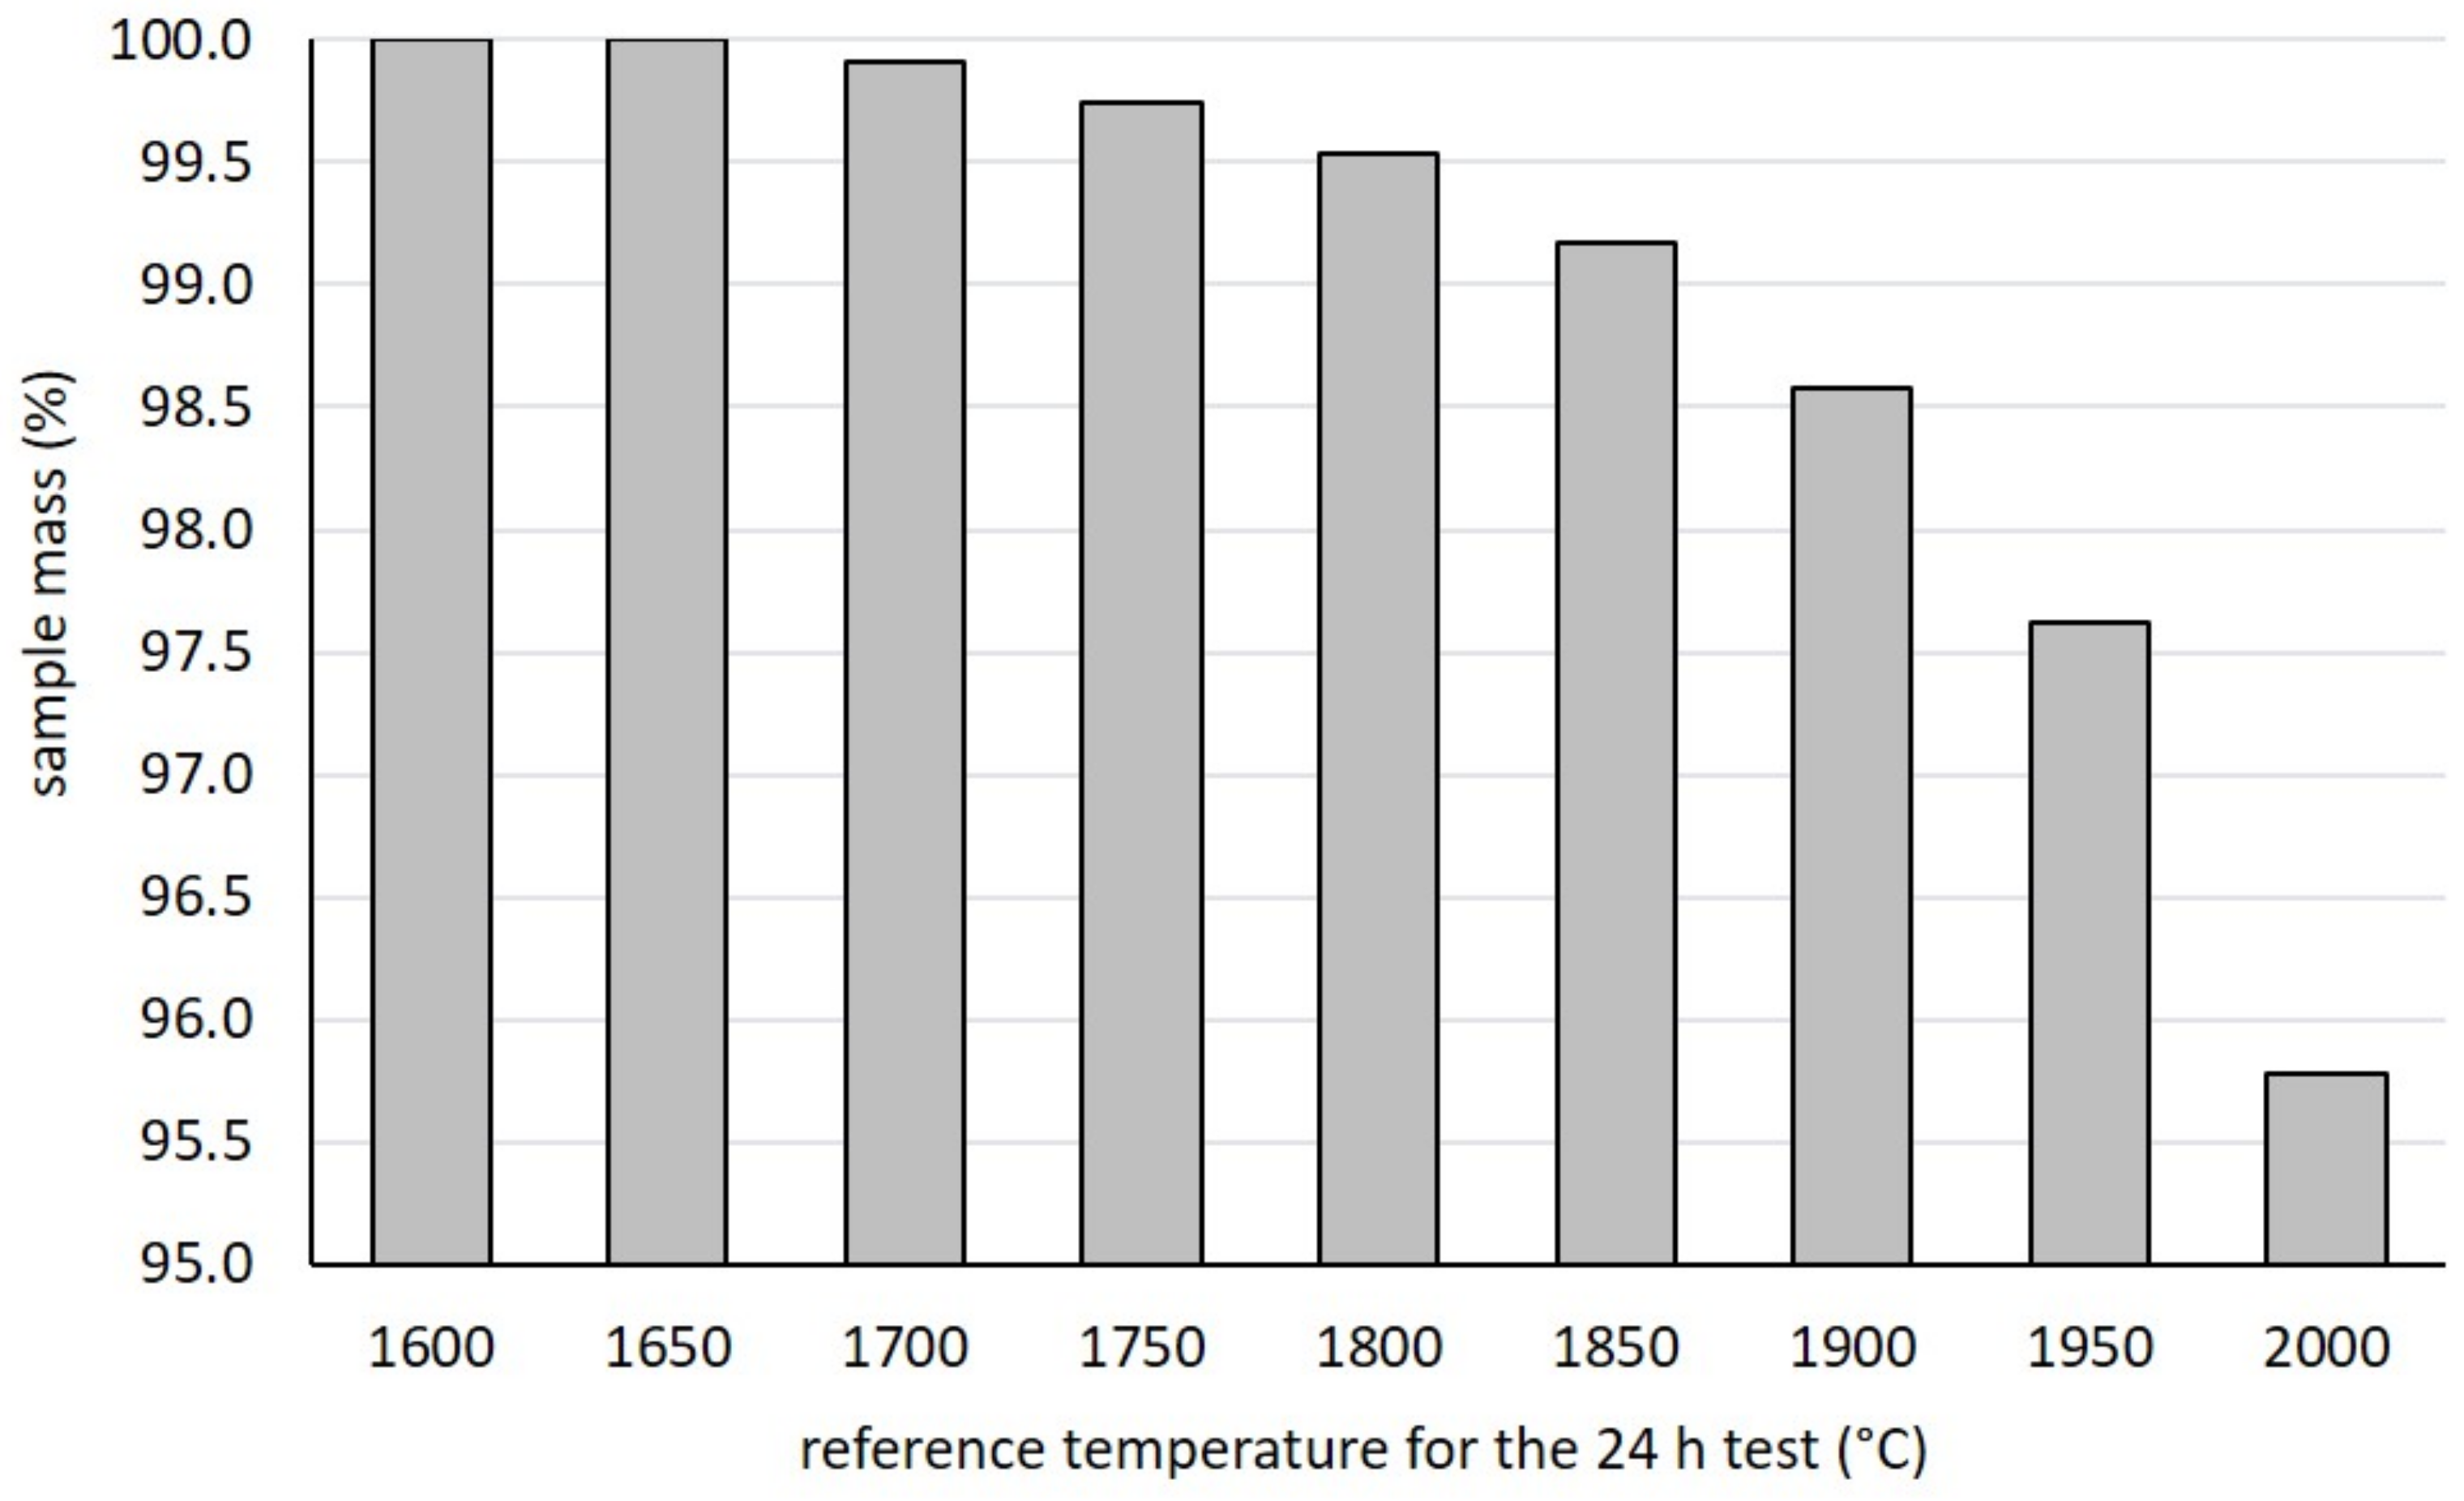
As mentioned in the previous paragraphs, the proton beam working parameters must be accurately set in order to guarantee that the maximum temperature of the target discs stays well below the temperature limit (TLIMIT) of their material, which is usually between 1600 °C and 2200 °C.
In our case, TLIMIT is estimated as the highest temperature level for which the observed mass loss (due to sublimation in high vacuum) stays below 0.5%. Numerous tests were performed, keeping the sample at a constant reference temperature for 24 h (at similar vacuum levels with respect to typical ISOL target working conditions) and measuring its weight just before and after every single test.
Data related to T
LIMIT were collected by means of the high temperature furnace represented in
Figure 5. The hot zone is composed of a tantalum tubular heater (internal diameter and thickness equal to 50 and 0.25 mm, respectively) connected to the power supply (I
MAX = 1300 A, V
MAX = 10 V) by means of two water-cooled copper clamps. In this way, it is possible to heat by Joule effect the cylindrical graphite box containing the samples (see
Figure 5). Tantalum and molybdenum heat shields surround the heater, contributing to keeping the box at extremely high temperatures and to improving the homogeneity of the thermal field. The hot zone is closed inside a water-cooled vacuum chamber equipped with a boro-silicate glass window; through it an infrared pyrometer allows for temperature measurements directly inside the box, making use of a series of holes passing through the shields and the box itself. At the other side of the heat shields, another system of holes is used for the positioning of a type C thermocouple on the external cap of the box. Additionally, for this apparatus, all data are collected automatically by a dedicated PLC.
4. Mechanical Characterization and Related Experimental Procedures
As discussed in the previous paragraphs, the target design can be validated from the structural point of view only if the maximum stress is well below σ
LIMIT. Taking into consideration steady-state conditions and the hypothesis of isotropic, linear elastic material, the transition from the temperature field {T} to the stress field {σ} can be made through the thermoelastic material properties E (Young’s modulus), ν (Poisson’s ratio) and α (coefficient of thermal expansion). This step is clearly illustrated in
Figure 3. For standard commercial materials, these properties are usually well known, whereas for homemade materials a specific strategy for their determination is required. Different solutions are proposed in the literature [
19,
20,
21], but when data sets are requested for radioactive materials at high temperature ranges, E, ν and α values are extremely difficult to obtain.
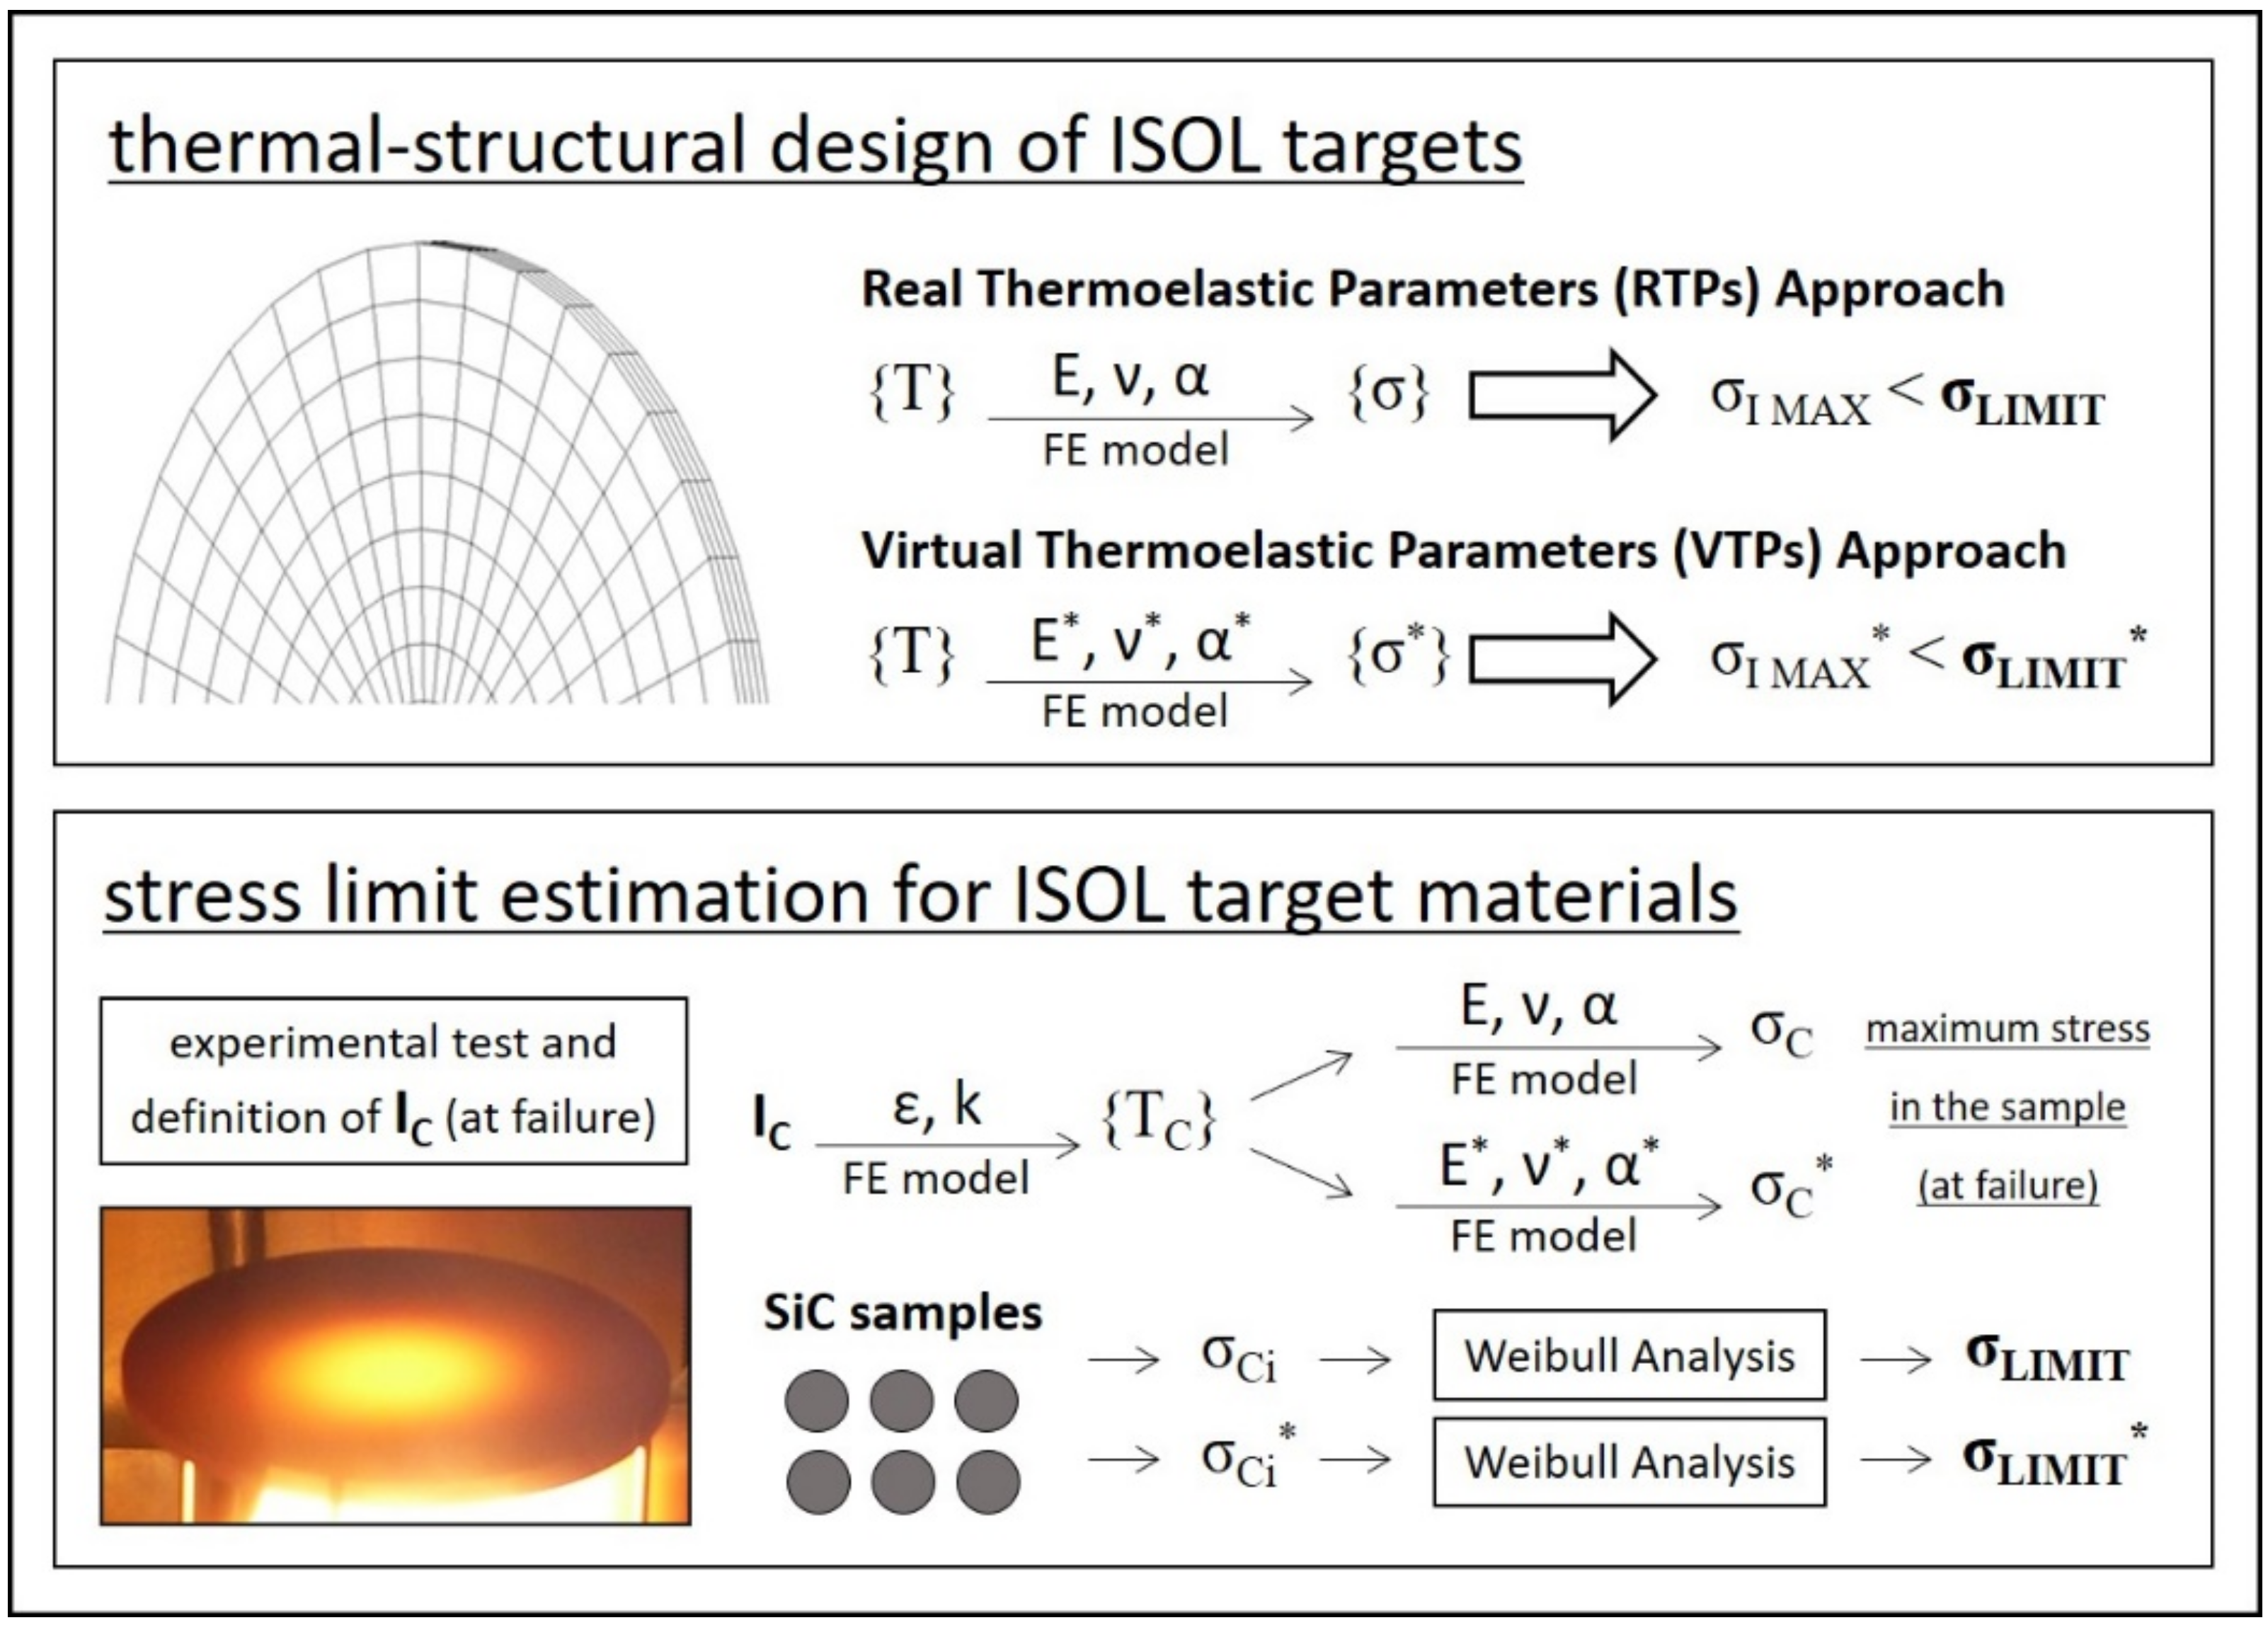
In the following paragraphs, the main steps adopted to estimate σLIMIT are presented. For both SiC SA and SP, the material properties E, ν and α are known parameters, and the calculation of the stress limit σLIMIT can be directly performed. On the other side, if E, ν and α are not available (this is usually the case of homemade materials for target production), the Virtual Thermoelastic Parameters approach can be adopted. Both procedures are presented in the following.
4.1. Stress Limit Estimated by Means of Real Thermoelastic Parameters (RTPs)
The estimation of the stress limit is based on a statistical approach and consequently 38 disc-shaped test specimens were prepared for SiC SA, and 28 for SiC SP. The diameter was fixed at 40 mm, whereas the thickness ranged from 0.5 to 1.5 mm because of evident difficulties in the manufacturing procedure: the extremely high hardness of SiC made cut operations complicated and difficult to control in terms of reproducibility.
Every disc was accurately positioned and centered on the experimental apparatus illustrated in
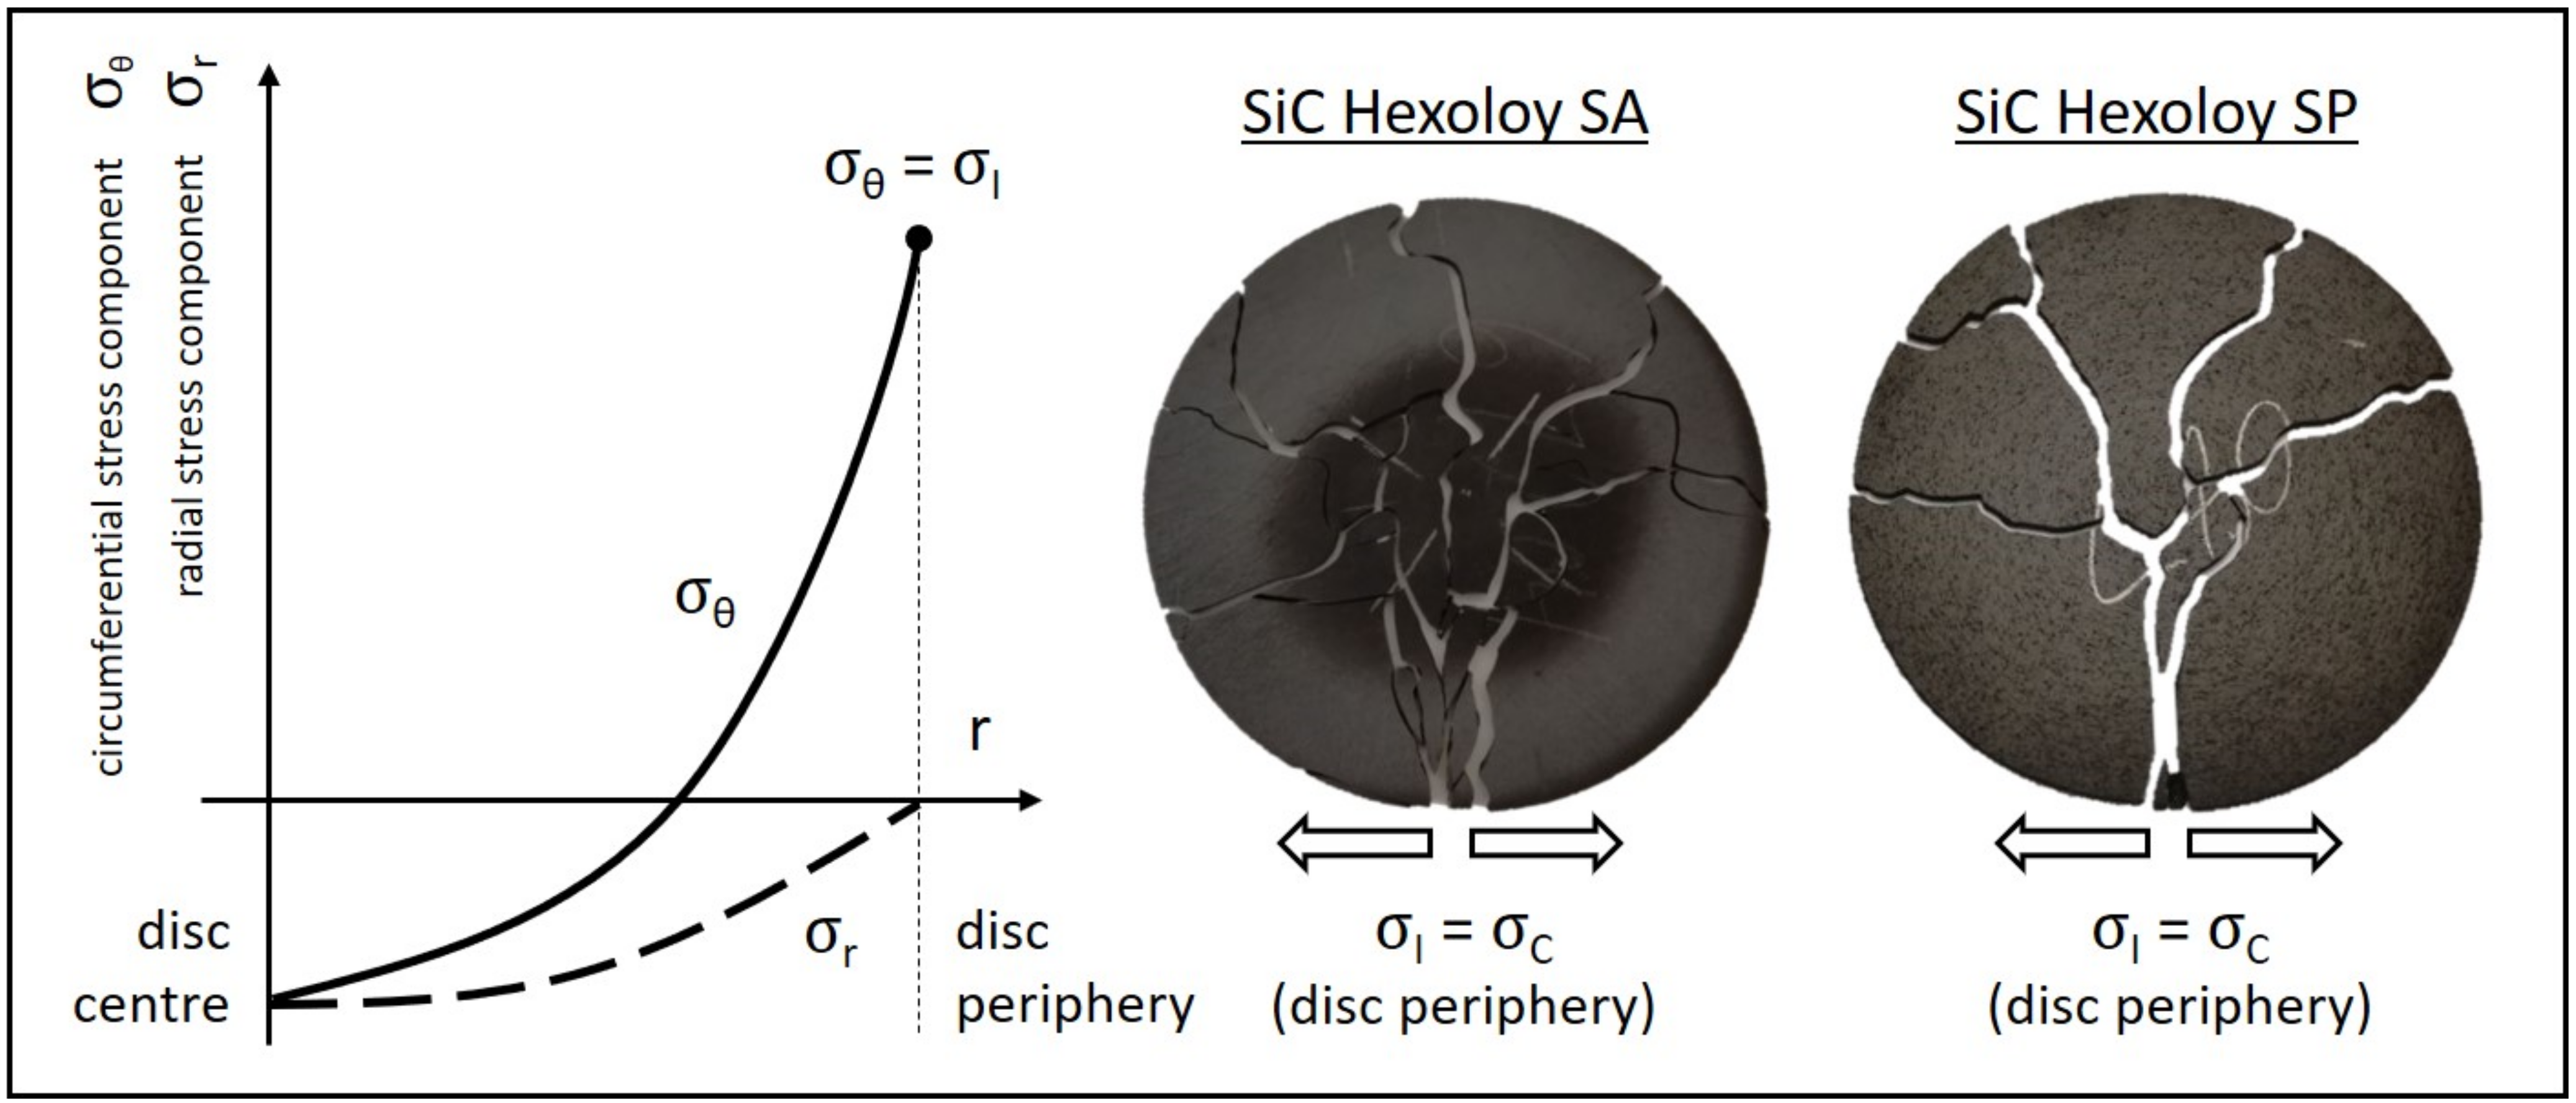
Figure 4. The induced temperature field {T} proved to be axial-symmetric and characterized by strong radial temperature gradients, with decreasing temperature values from the center to the periphery. For each test, the heating current was gradually and slowly increased, augmenting at the same time thermal gradients. These are directly related to specific radial distributions of the stress components σ
θ and σ
r (σ
z is always negligible because of evident plane stress conditions) [
22,
23], as shown in
Figure 6. The compressive stresses (negative values for both σ
θ and σ
r) at the center of the disc do not constitute a serious problem for the structural integrity of the sample. The real danger is the peak value of the circumferential stress component σ
θ at the periphery of the disc. In this region, σ
θ reaches its maximum positive (tensile stress) value and coincides with the first principal stress σ
I, which is, in general, used to recognize the maximum tensile stress induced by loading conditions. While increasing the heating current, the maximum value of σ
I (at the periphery of the disc) augments too, and when it reaches the critical value σ
C the test specimen fails in a brittle fashion, with the typical crack path illustrated in
Figure 6. In this phase of the test, the optical pyrometer used to monitor the disc temperature detects a strong discontinuity. Indeed, the test specimen is broken into a lot of different fragments, allowing in this way the pyrometer to directly point the heater, which is much hotter. At this point, the test is stopped and the critical heating current value I
C can be easily obtained from recorded data.
Once the I
C value for the specific sample is collected, the experimental activity can be considered completed and it is possible to go on with the calculation of the critical temperature field {T
C} making use of the electrical–thermal finite element model mentioned in
Section 3.2. In this phase, the disc thermal properties ε and k adopted for calculations are those estimated according to the thermal characterization described above. In addition, the model geometry includes all the specific information regarding the sample thickness and positioning with respect to the heater.
The next step is the calculation of the critical stress field {σ
C} according to the scheme reported in
Figure 3 and making use of the Real Thermoelastic Parameters (RTPs) listed in
Table 1. Once the solution is obtained, it is relatively easy to plot the first principal stress σ
I and to highlight the maximum value at the periphery of the disc. As shown in
Figure 6, it corresponds to the critical stress σ
C, which is in practice the maximum stress in the test specimen at failure.
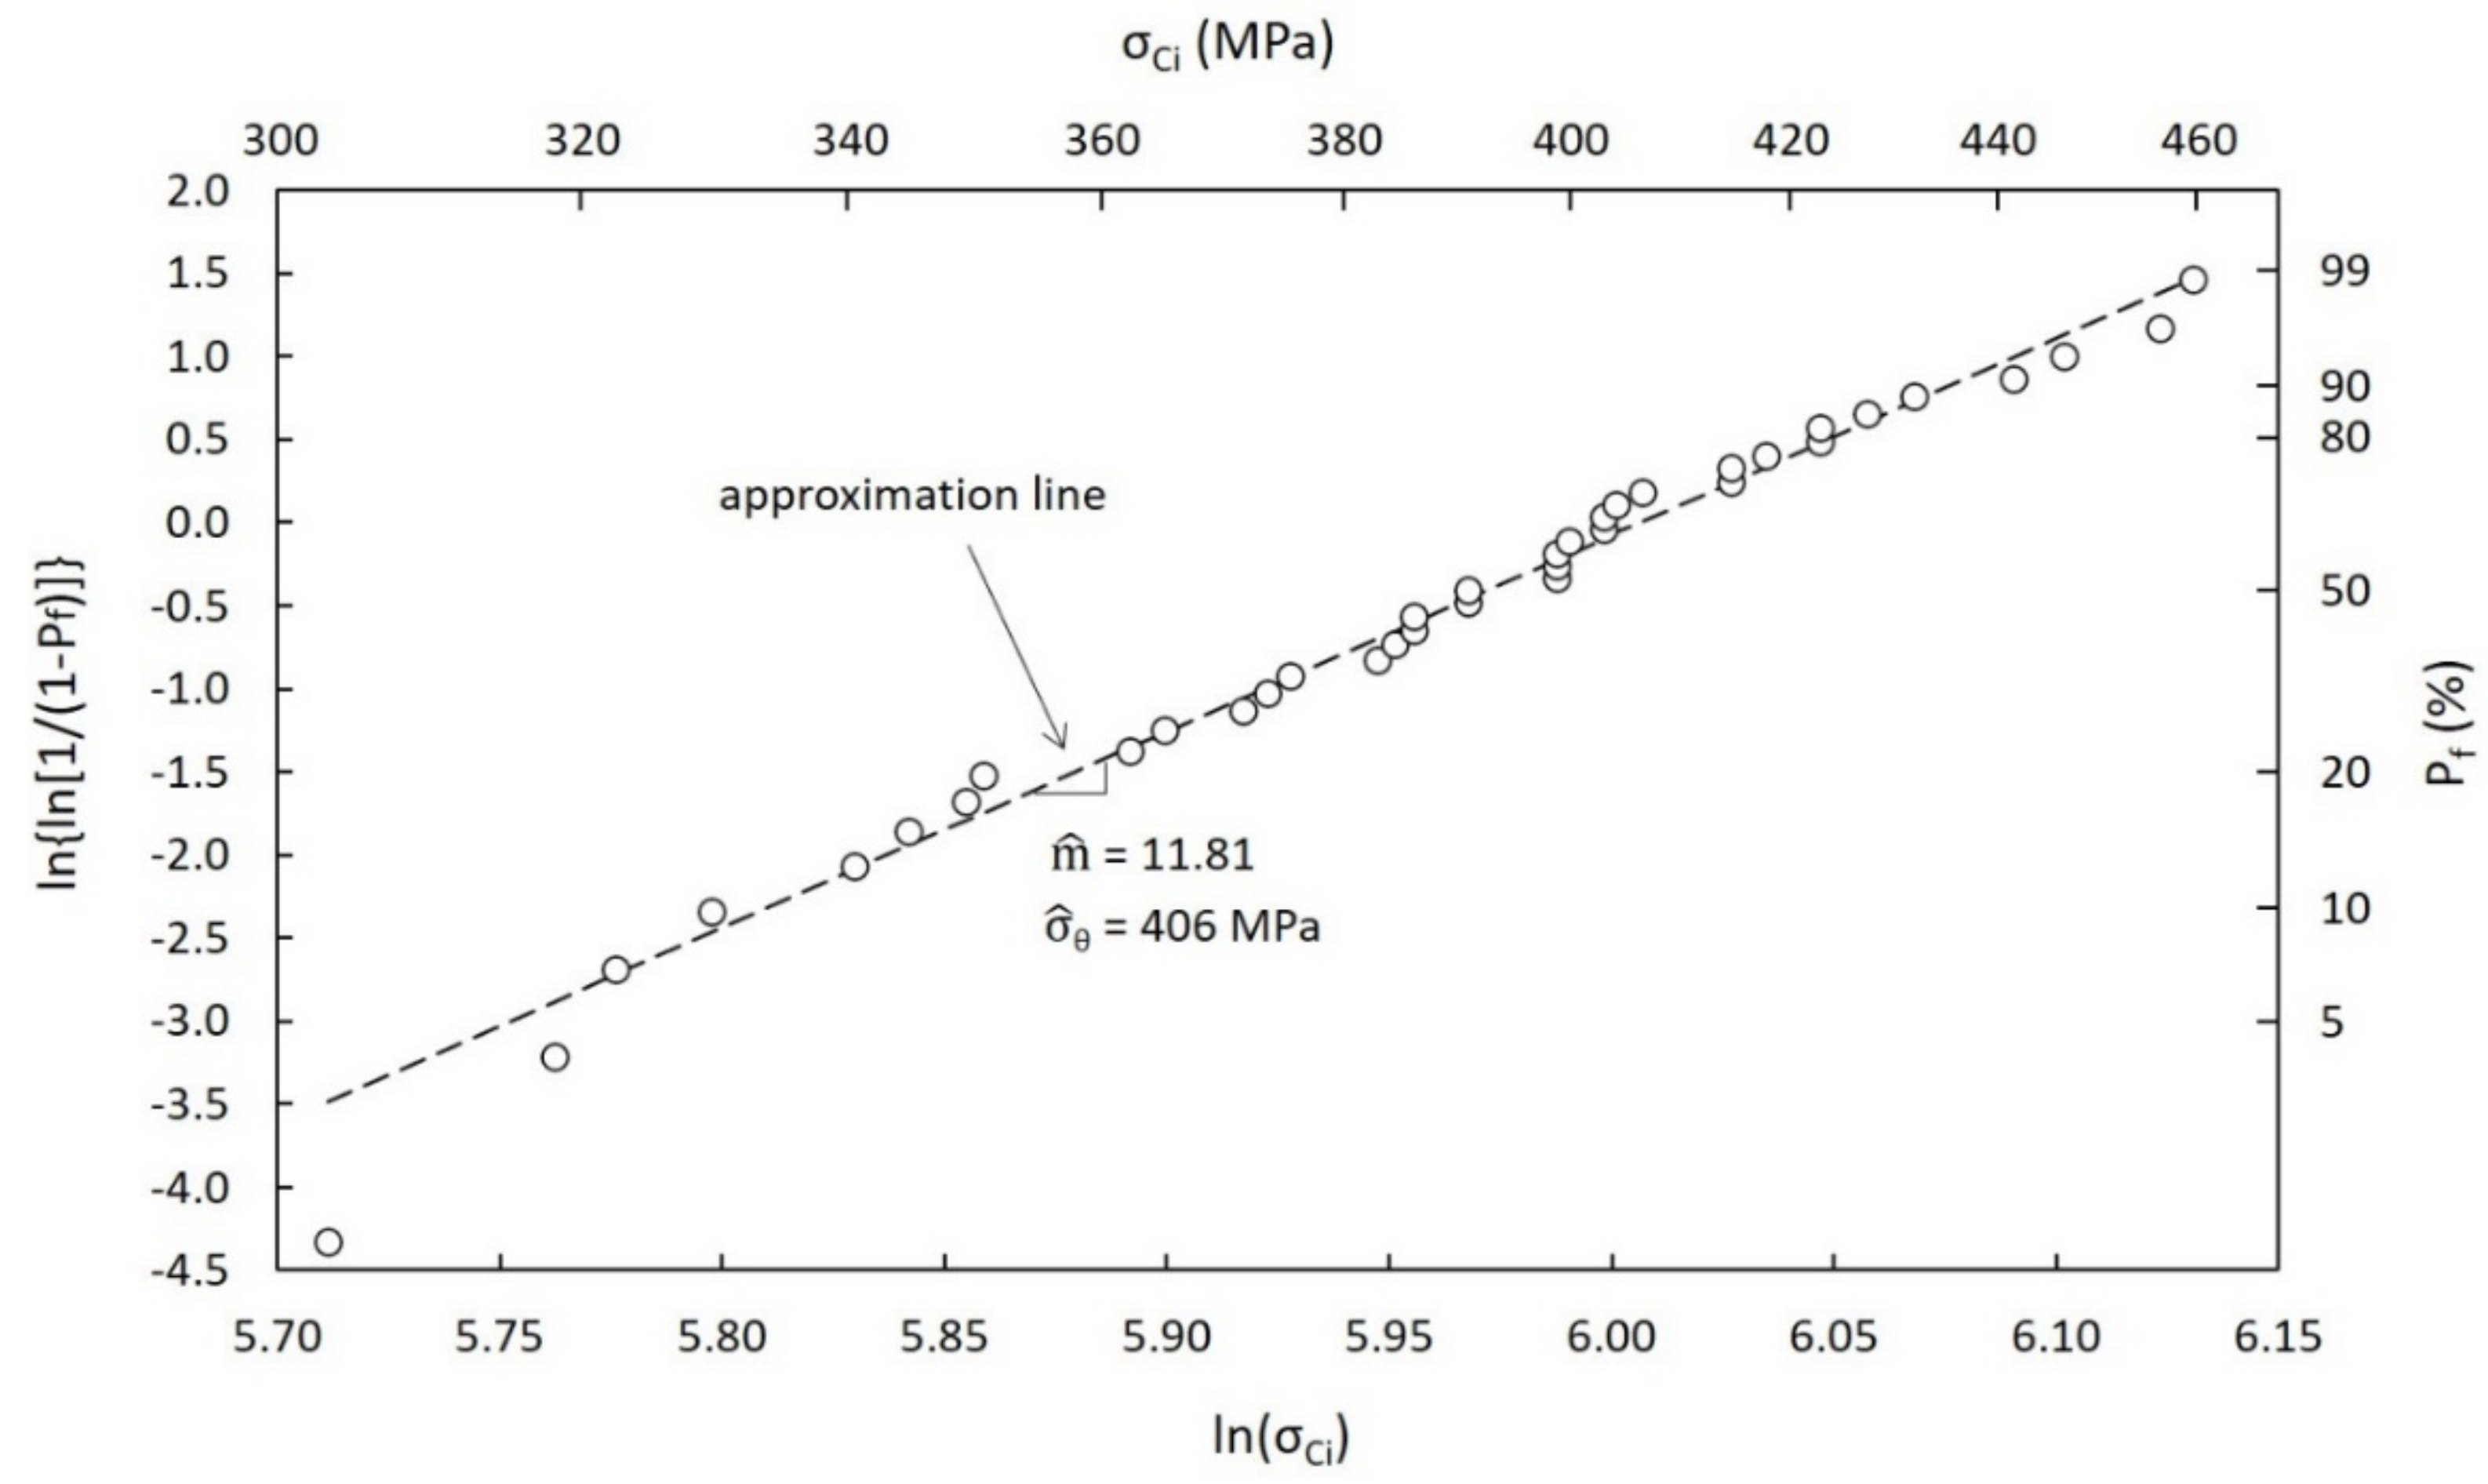
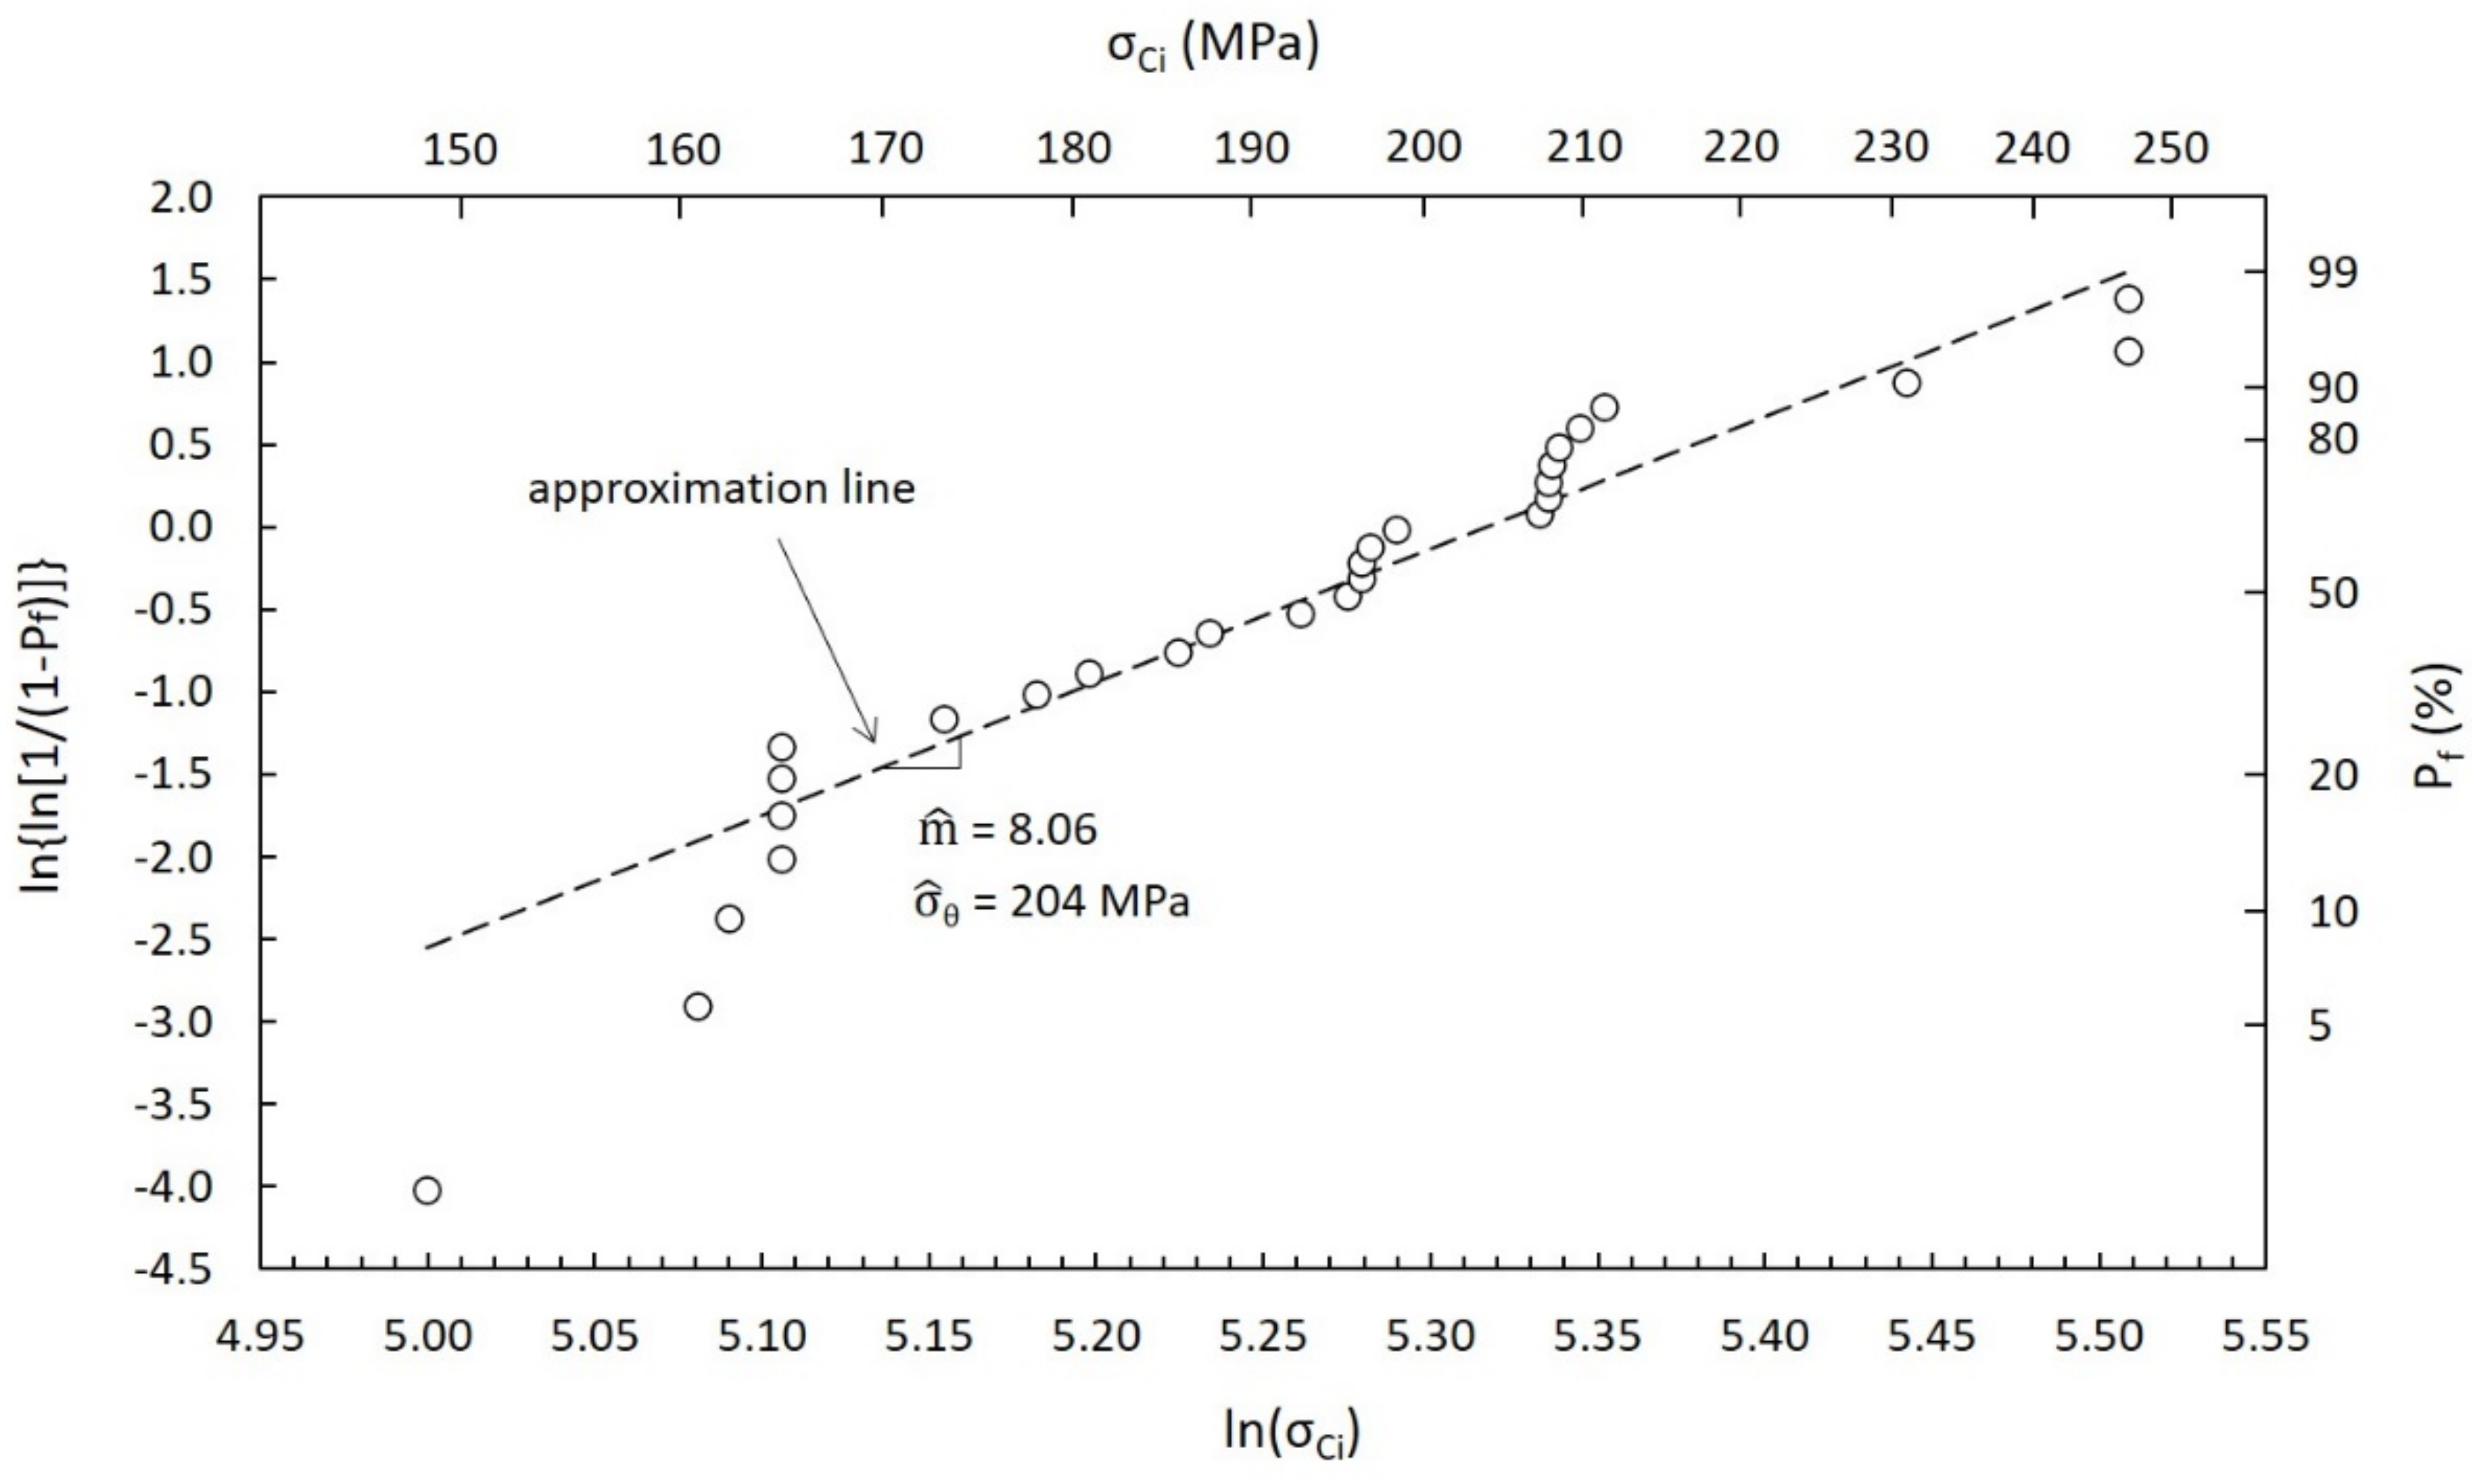
The same procedure was adopted for all SiC SA and SP test specimens, obtaining in this way two series of critical stress values σ
Ci. The resulting failure stress data were used to obtain the estimation of the Weibull probability distribution parameters according to the ASTM standard practice [
24]. Then, the stress limit σ
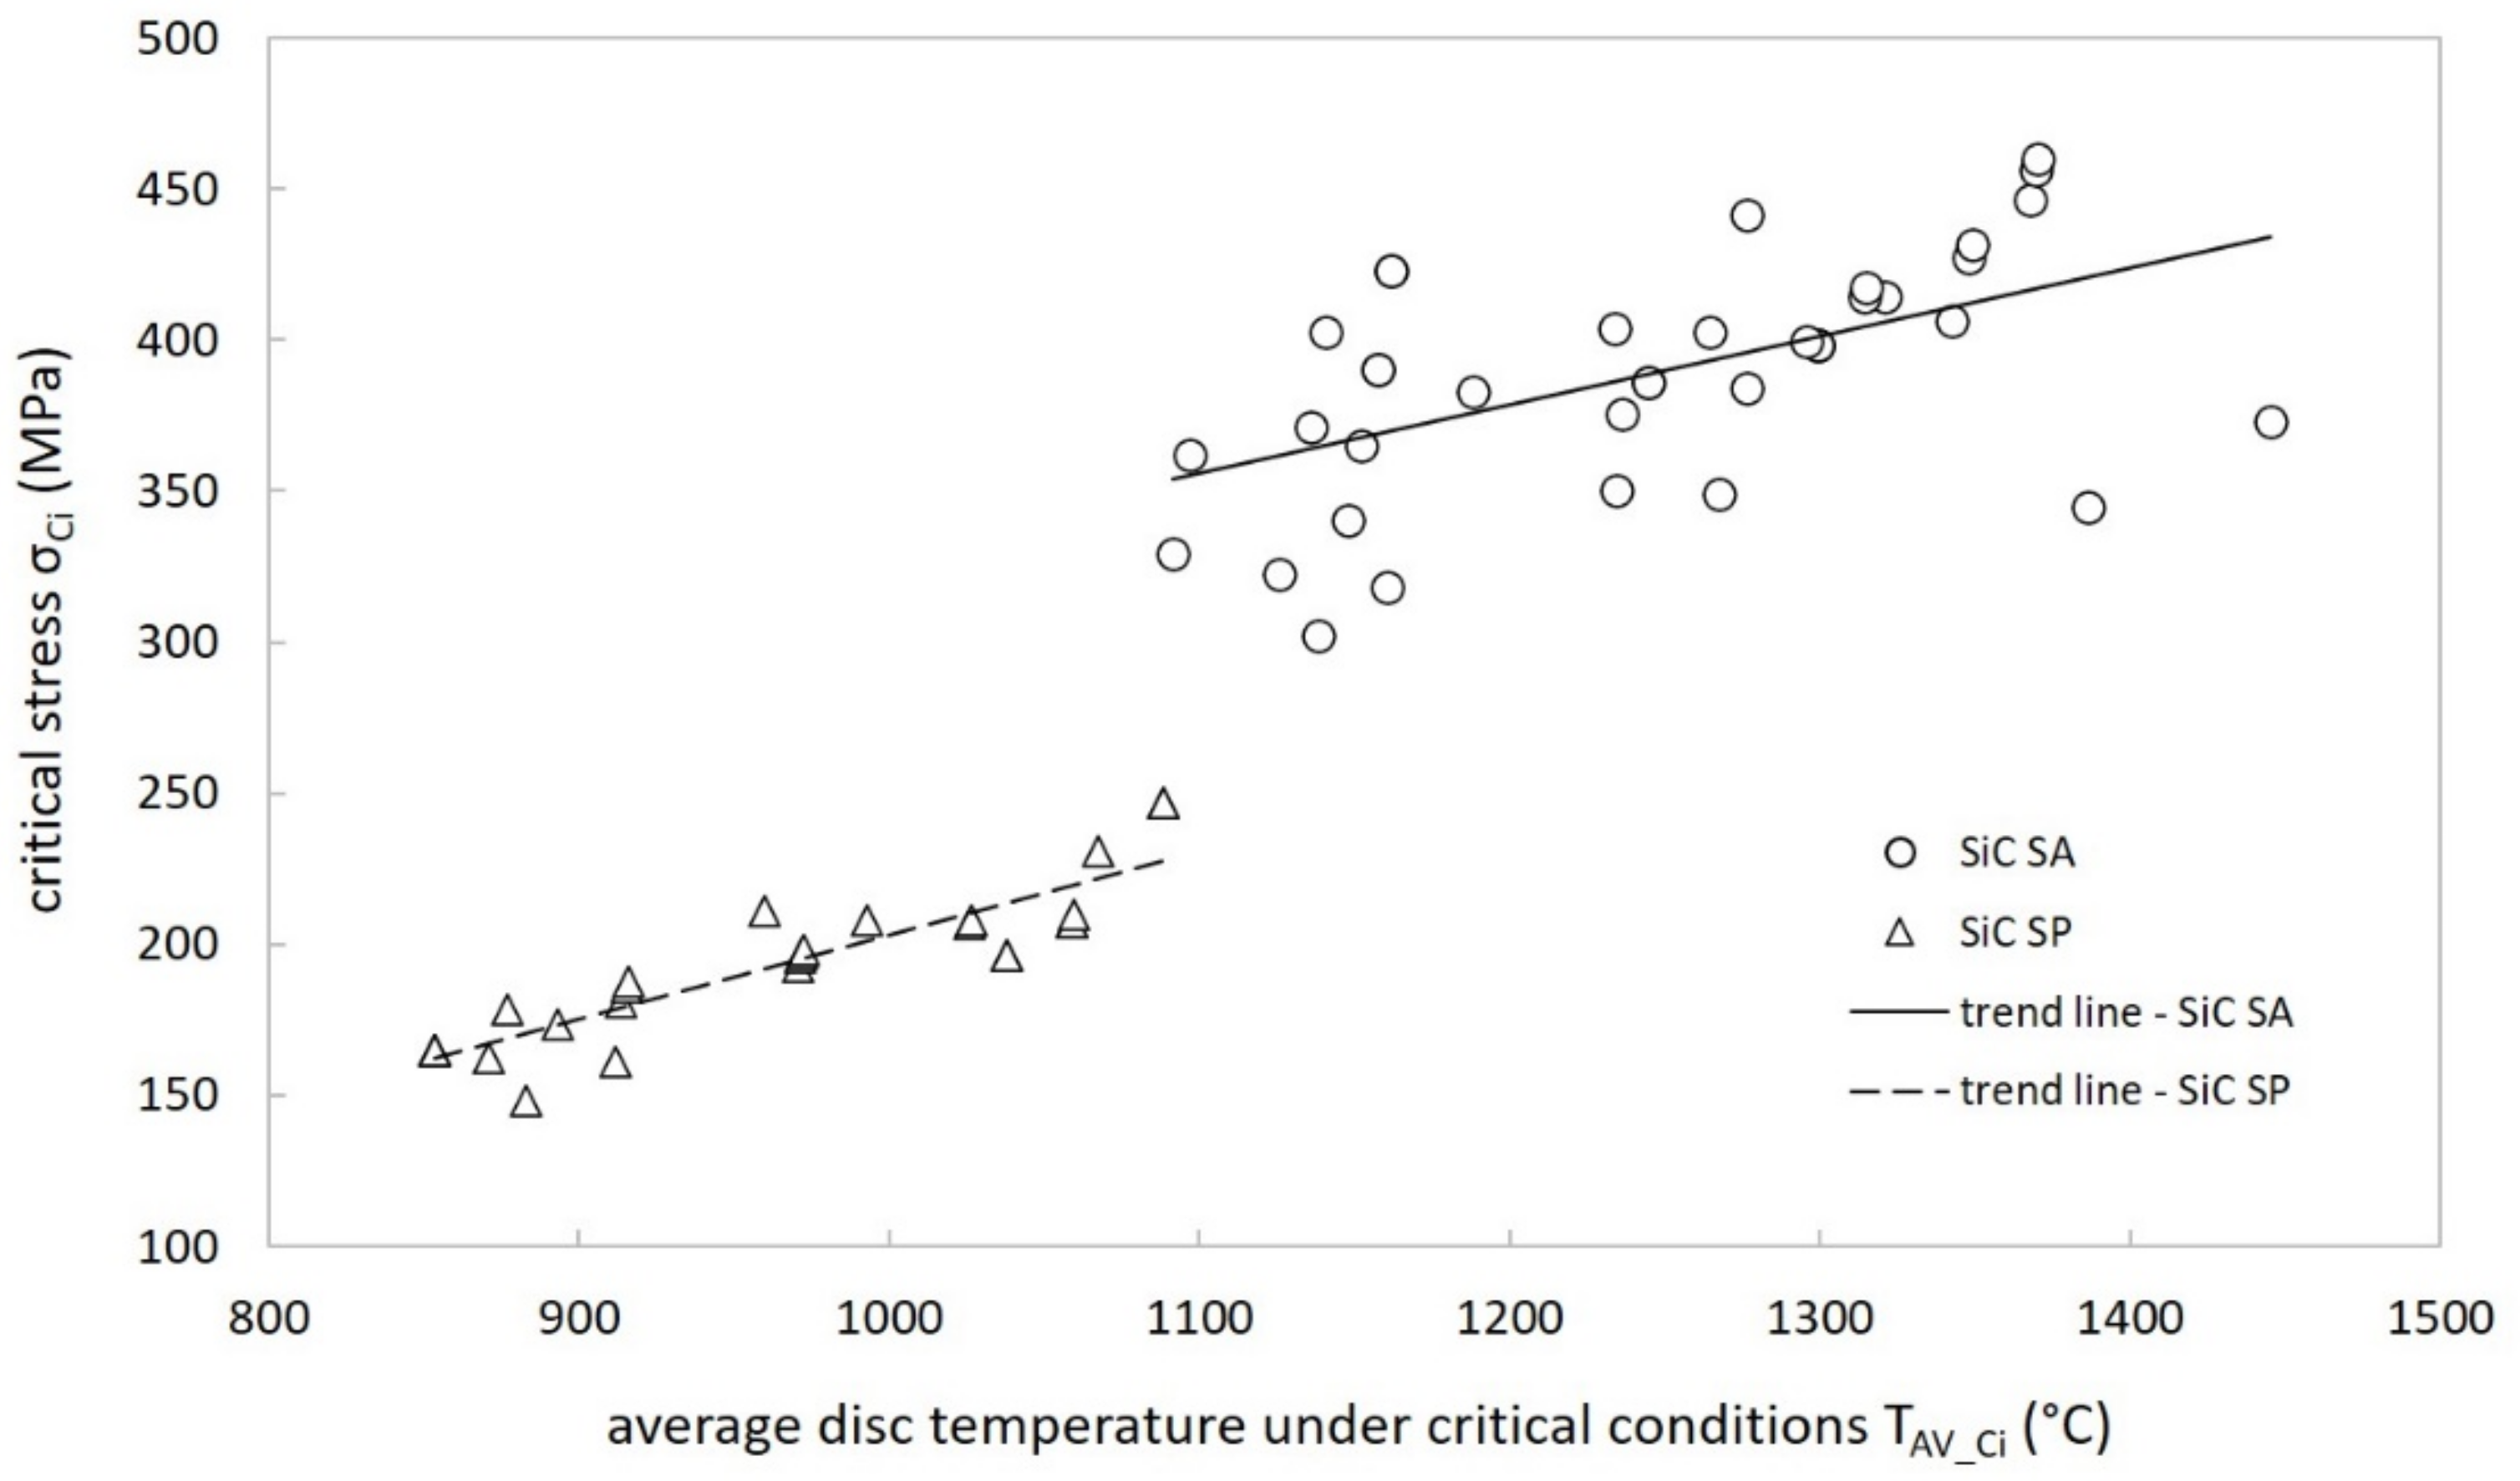
LIMIT was calculated for both SiC SA and SP, taking as a reference a survival probability equal to 99.99%. As a final step, these values were associated with a specific temperature range, considering the average minimum temperature and the average maximum temperature of the discs under critical conditions.
4.2. Stress Limit Estimated by Means of Virtual Thermoelastic Parameters (VTPs)
As indicated at the beginning of the paragraph, thermoelastic material properties E, ν and α are usually unknown for most homemade ISOL materials (transition metal or actinide carbides) [
26,
27]. In this case, the RTPs approach cannot be used for the thermal–structural design of ISOL targets, and an alternative solution was formulated. It is clearly illustrated in
Figure 7 and named as the Virtual Thermoelastic Parameters (VTPs) approach. According to it, a set of Virtual Thermoelastic Parameters E*, ν* and α* can be arbitrarily assumed. For the sake of simplicity, in this work, E*, ν* and α* were imposed equal to 102 GPa, 0.1 and 10
−6 °C
−1, respectively, taking as a reference the order of magnitude of the correspondent SiC material properties. This assumption is surely strong, but reasonable. Indeed, adopting the same E*, ν* and α* values for the design phase and the stress limit estimation (see
Figure 7), it is formally correct to compare σ
I MAX* and σ
LIMIT* for the structural verification of components.
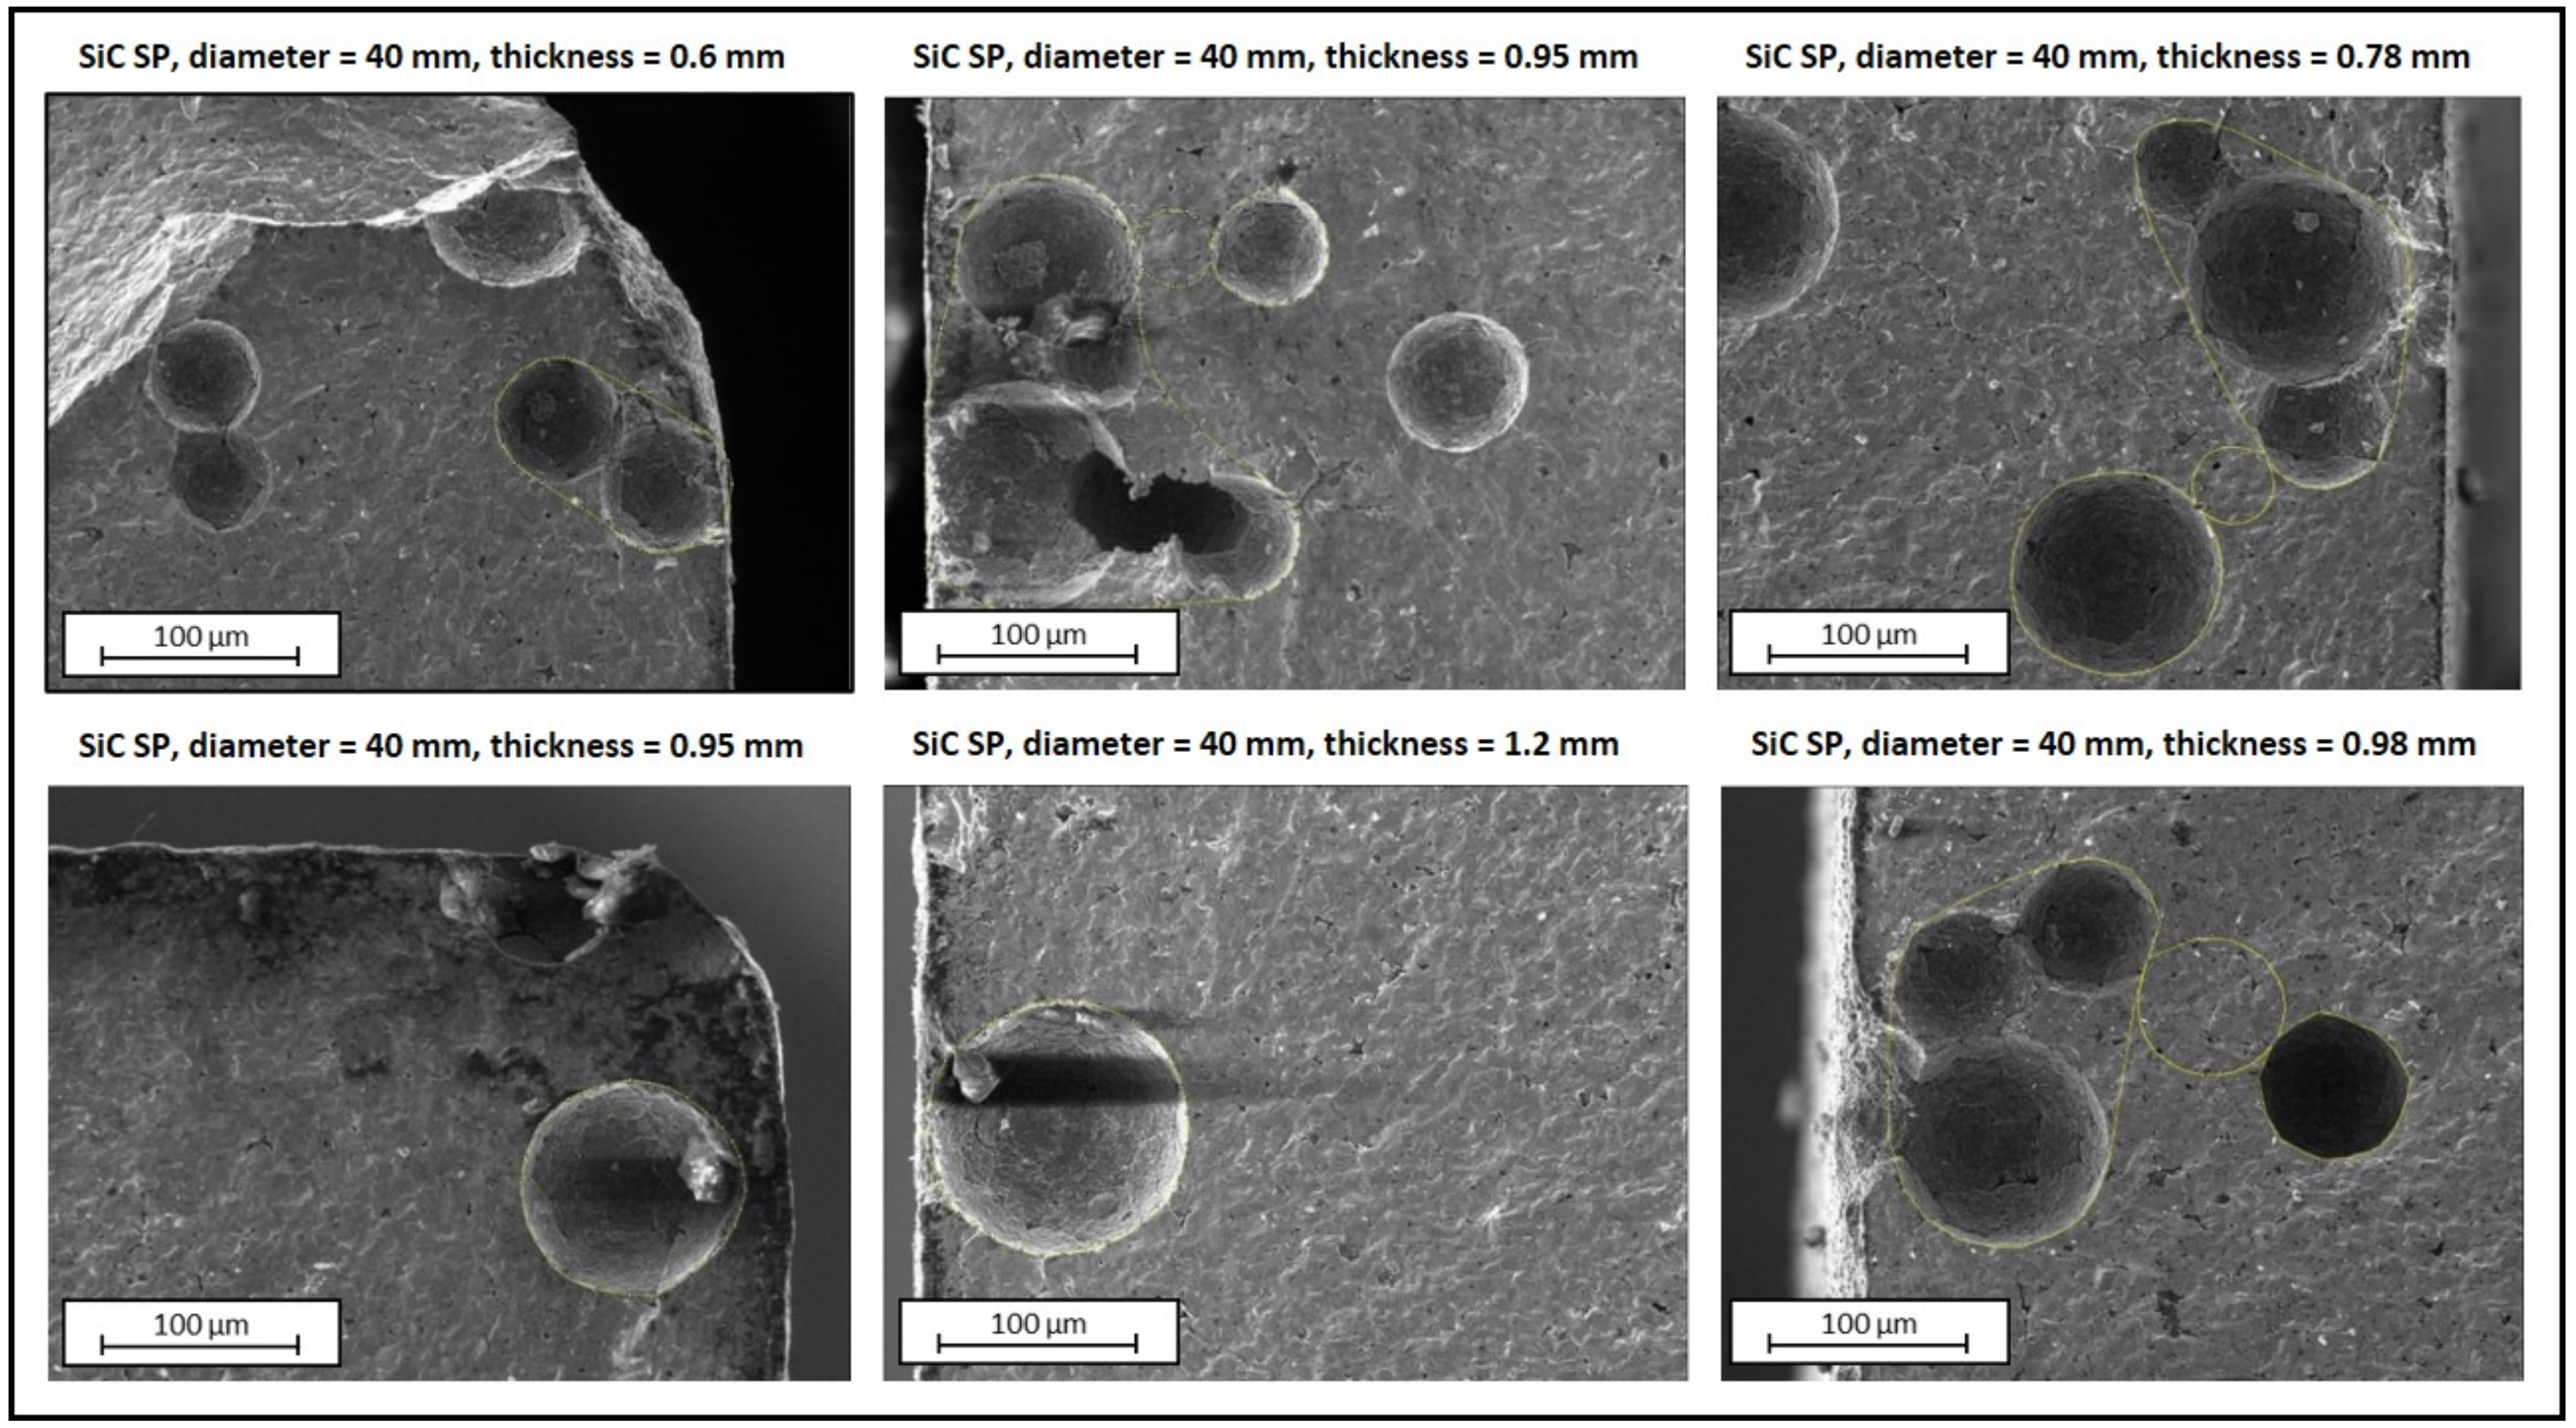
4.3. Fractographic Study
The ASTM standard practice [
24] clearly states the importance of fractography for the estimation of Weibull Distribution Parameters. In this work, all SiC test specimens were accurately reconstructed at the end of the destructive tests described in the previous paragraphs (see
Figure 6). Unfortunately, for SiC SA samples it was impossible to identify in a clear way the critical flaws. This was mainly due to the high density and microstructural homogeneity of this specific material. Moreover, SiC SA exhibits a high mechanical strength, and the high energy values released at failure led to a fine fragmentation of the samples in the proximity of the fracture origin, with the consequent impossibility to identify the critical flaws.
On the other side, SiC SP shows a sensibly lower mechanical strength and is characterized by discrete, non-interconnected pores, which are dispersed in a controlled manner throughout the body of the material [
25]. In this case, it was possible to observe for every sample the fracture surface in the proximity of the disc periphery, with the opportunity to highlight the critical flaws originating fracture.
Figure 8 presents some SEM (TESCAN, model VEGA 3xmh) images taken on the fracture surface in the proximity of the disc periphery for six different SiC SP samples. Pores are evident and their size confirms the typical values indicated in [
25].
All data related to the statistical Weibull analysis presented in the next paragraph assume that all sample failures originate from the same flaw population (that is, a single failure mode).
6. Conclusions
In the framework of the research and development of high-power targets for nuclear applications, the thermal and mechanical characterization of silicon carbides was carried out by means of a method based on both experimental measurements and numerical simulations. Two materials characterized by different porosities were studied in order to highlight the differences between two of the most performant materials found on the market. To obtain experimental data, two high-vacuum homemade devices were used. An extensive numerical and simulation activity was then carried out to obtain thermal and mechanical parameters. In this frame, a novel approach for the structural verification based on Virtual Thermoelastic Parameters was proposed and applied to the two types of SiC. To shed more light on the different mechanical behavior of the two materials, a fractographic study by means of SEM was also performed.
The results highlighted some peculiarities of the less porous SiC SA and the more porous SiC SP. Despite their similar microstructural properties (composition, grain size and density), SiC SP showed a higher emissivity, most probably due to a higher surface roughness. However, the thermal conductivity of the two materials did not show any significant difference in the analyzed thermal conditions. On the other hand, the mechanical characterization results showed that SiC SA has a higher stress limit due to the absence of macroscopic defects (pores) which were instead found in SiC SP. The availability of a large set of mechanical data in a defined temperature range (up to 1500 °C in the case of SiC SA) allows for the definition of parameters for the on-line operation of the high-power targets that errs on the side of safety.
All data collected at LNL for the Hexoloy® silicon carbides SA and SP will be crucial for both the design phase and the commissioning of the SiC production targets that will be operated in the context of the SPES facility. As discussed in the previous paragraphs, SiC will be gradually substituted by other brand new homemade materials, with the aim to produce neutron-rich nuclei in a wide mass range (uranium carbide is surely the best candidate). Of course, the approach presented in this work for the thermal and mechanical characterizations will be extended to these new high-performance materials, allowing for a specific and well defined design procedure for the new high-performance targets to be used in the next generation ISOL facilities.


 ,
, 


