Effect of Jet Impingement Velocity and Angle on CO2 Erosion–Corrosion with and without Sand for API 5L-X65 Carbon Steel

 ,
, 
Abstract
:
1. Introduction
2. Materials and Methods
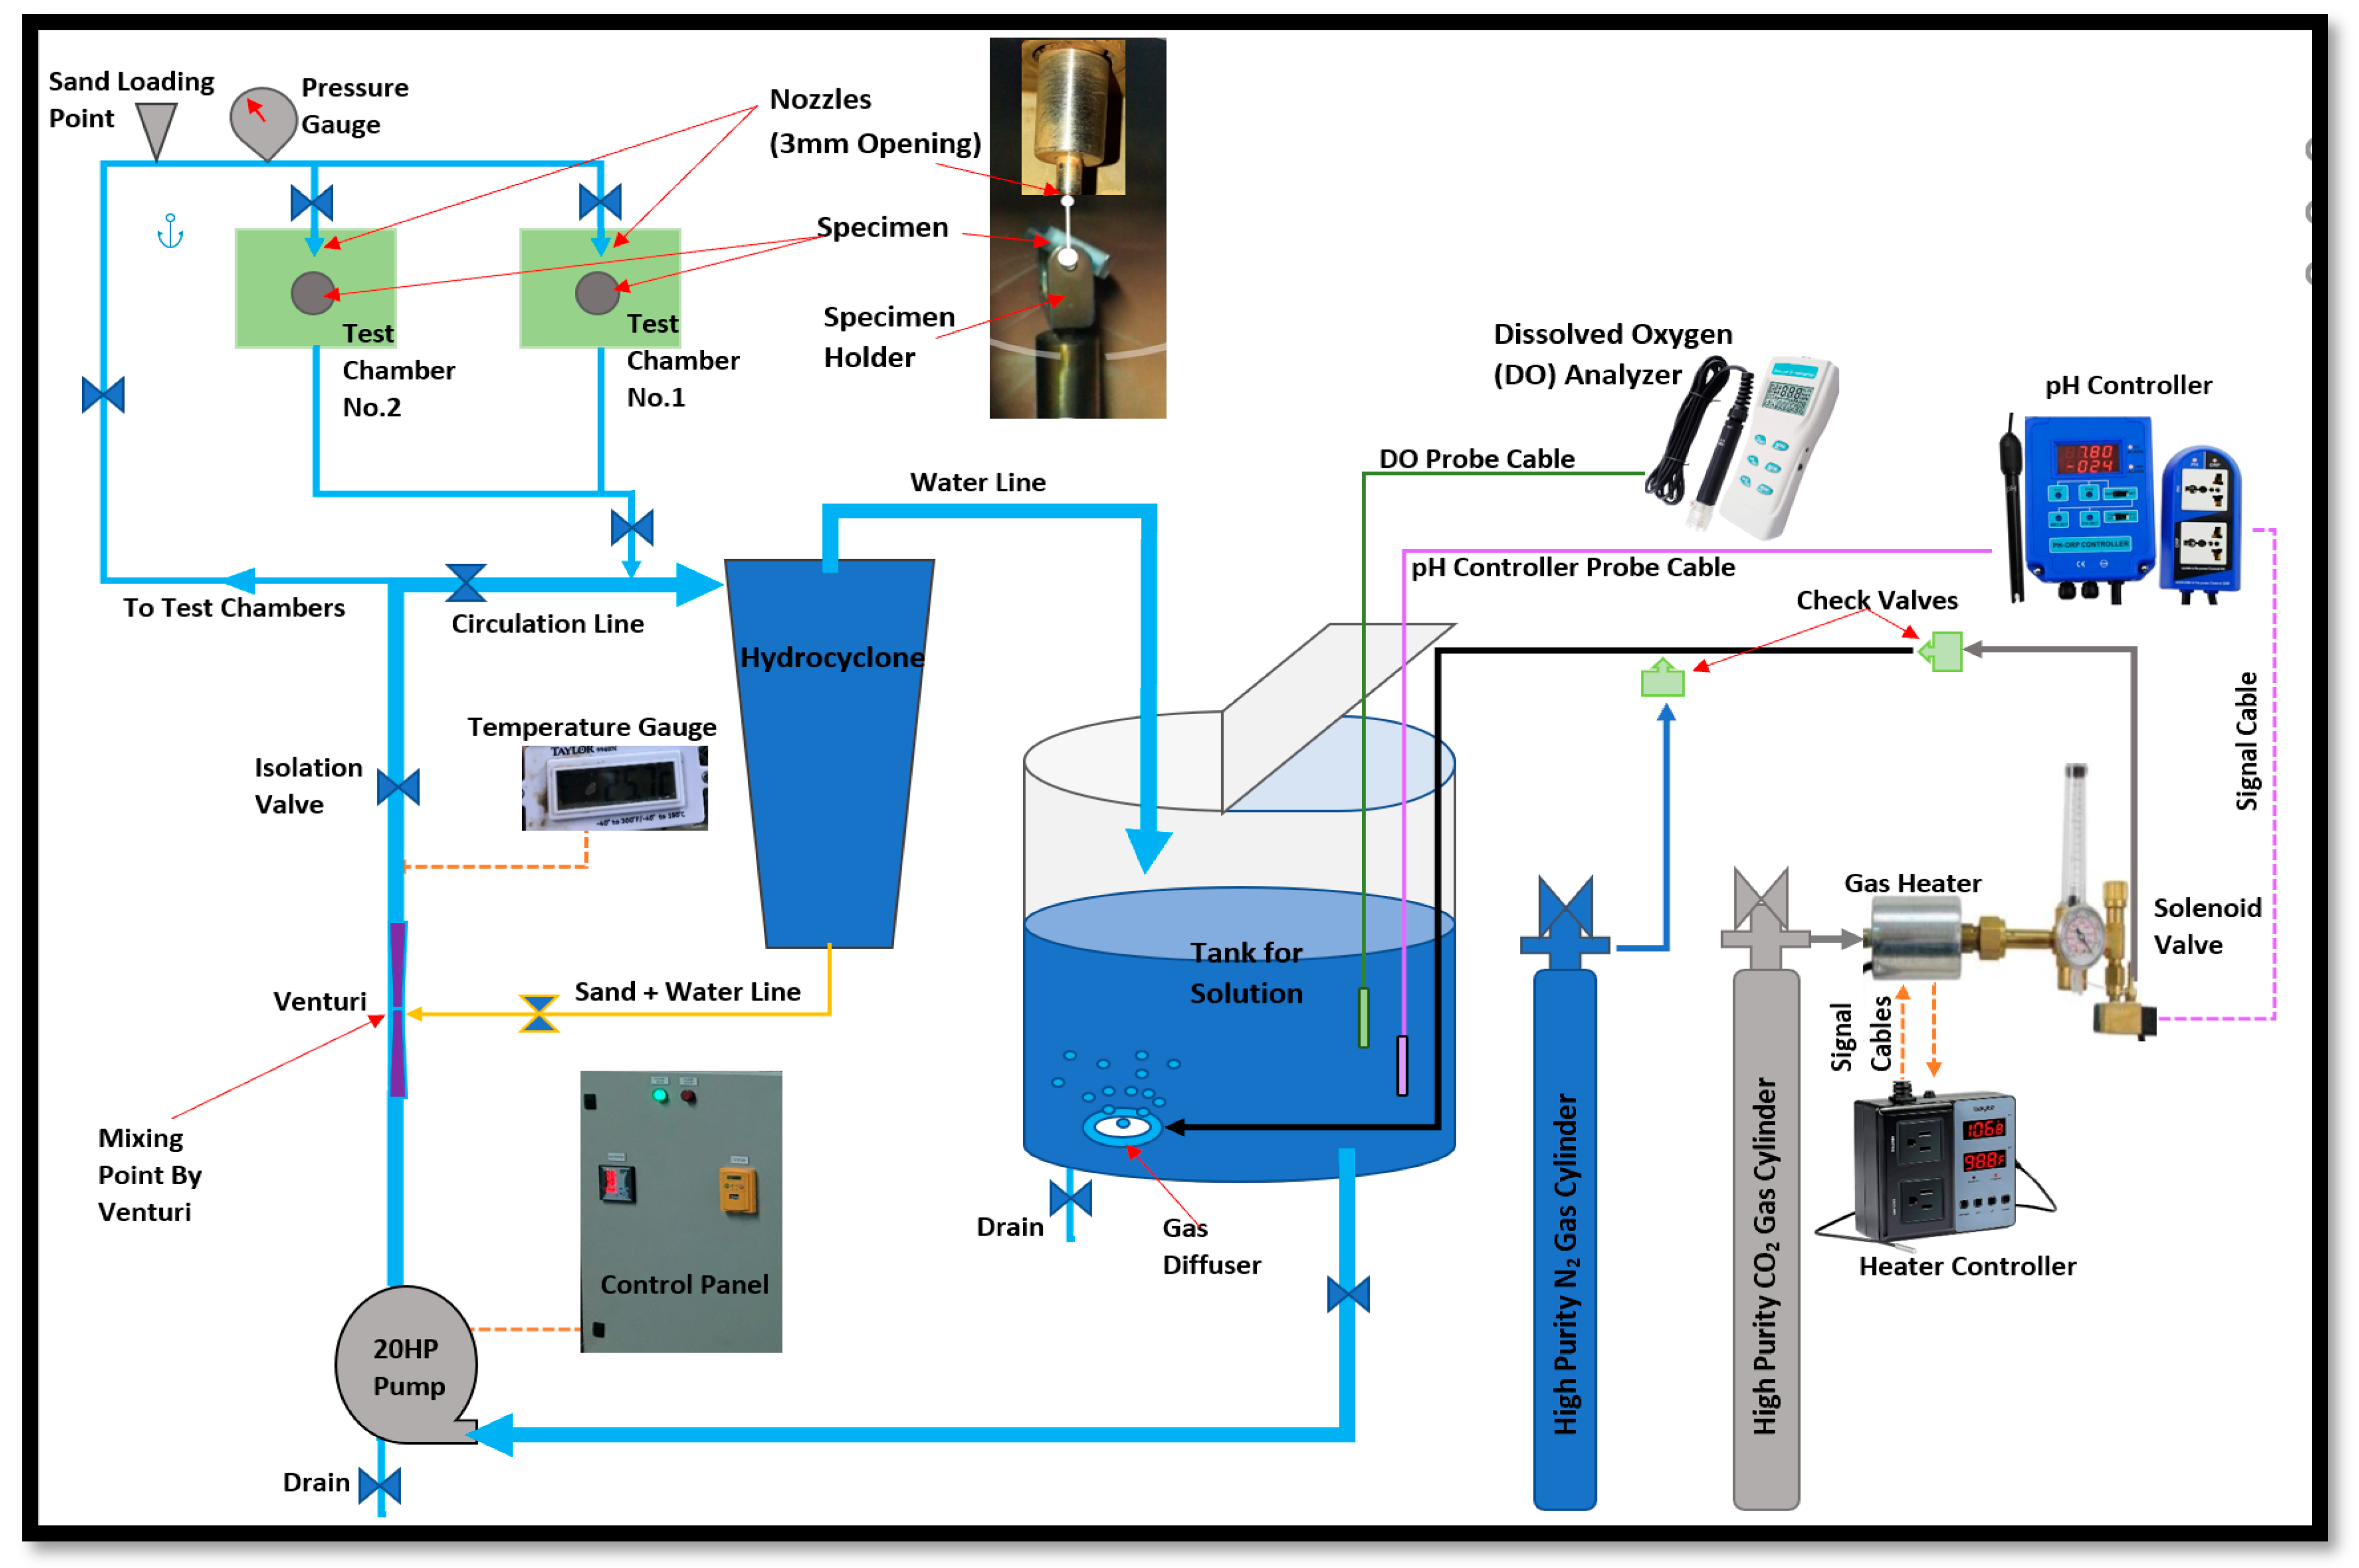
2.1. Equipment
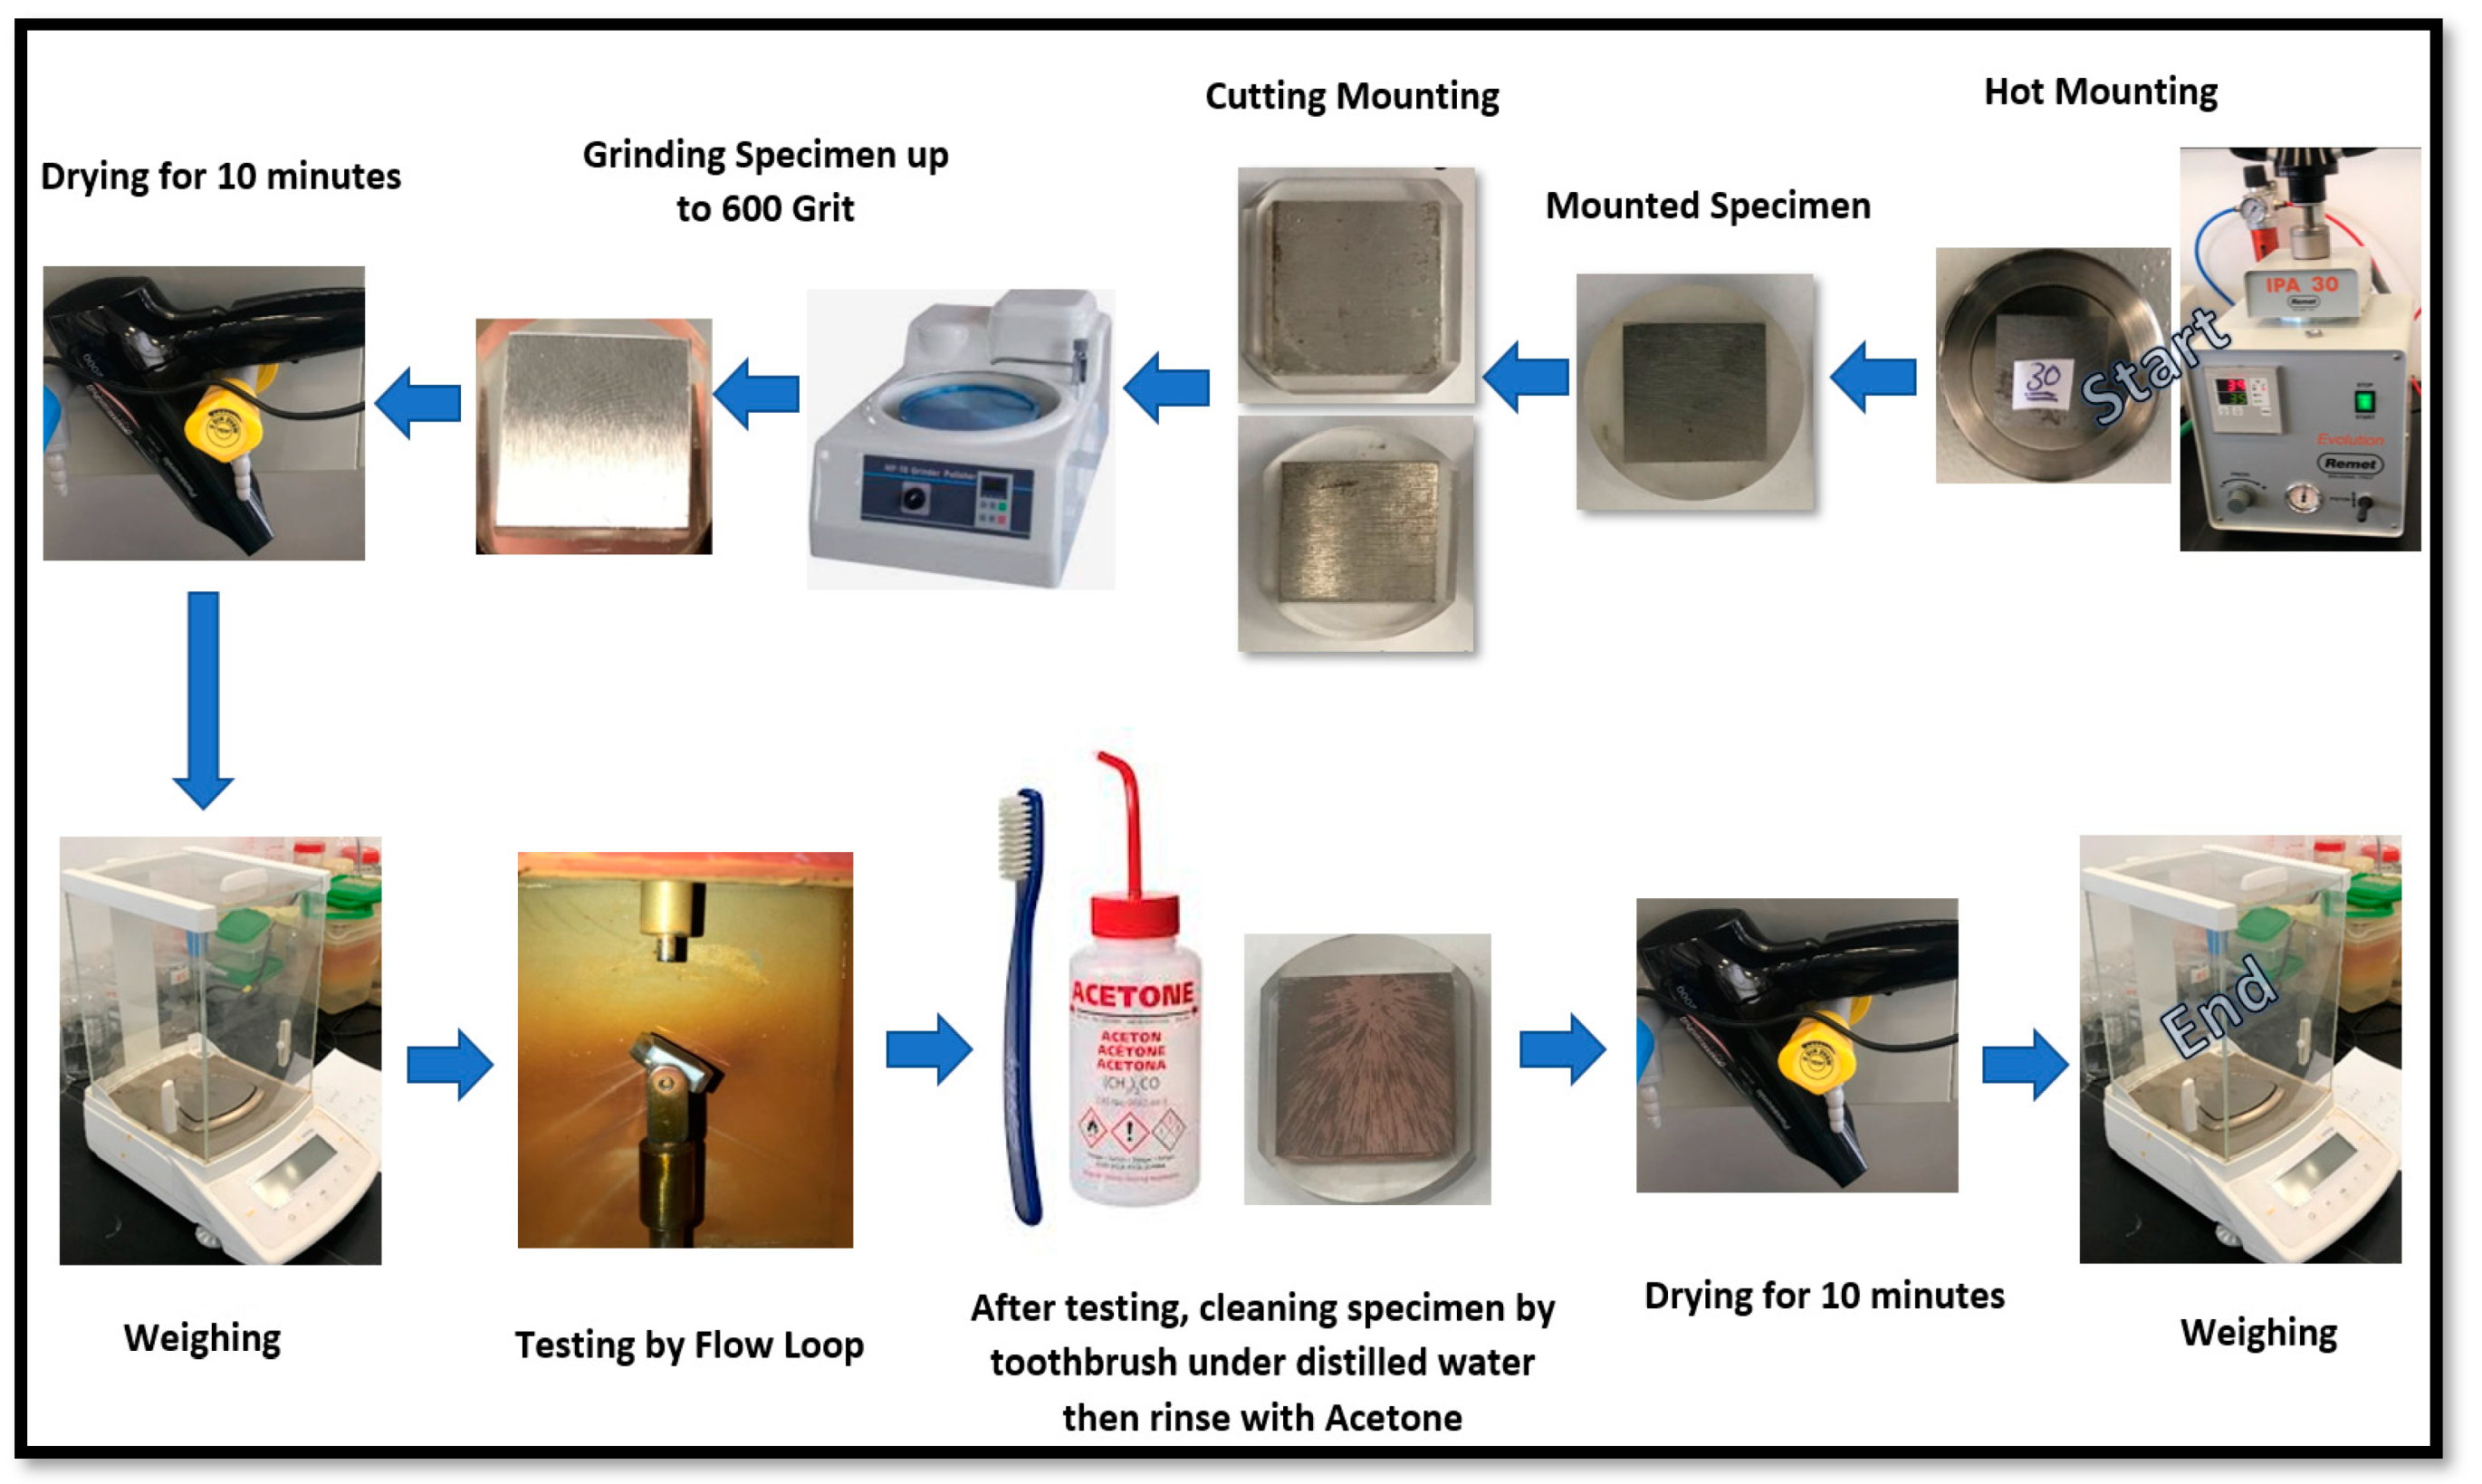
2.2. Test Specimens
2.3. Test Solution
2.4. Testing Procedure
2.5. Surface and Corrosion Scales Characterization
3. Results and Discussion
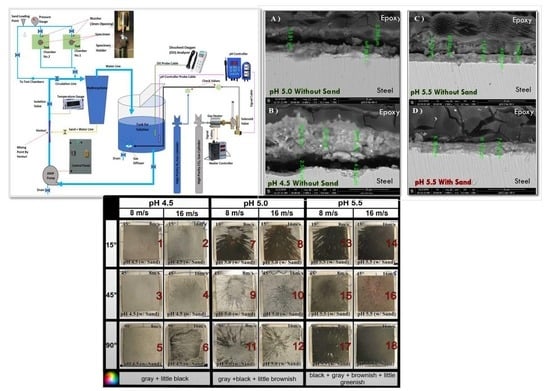
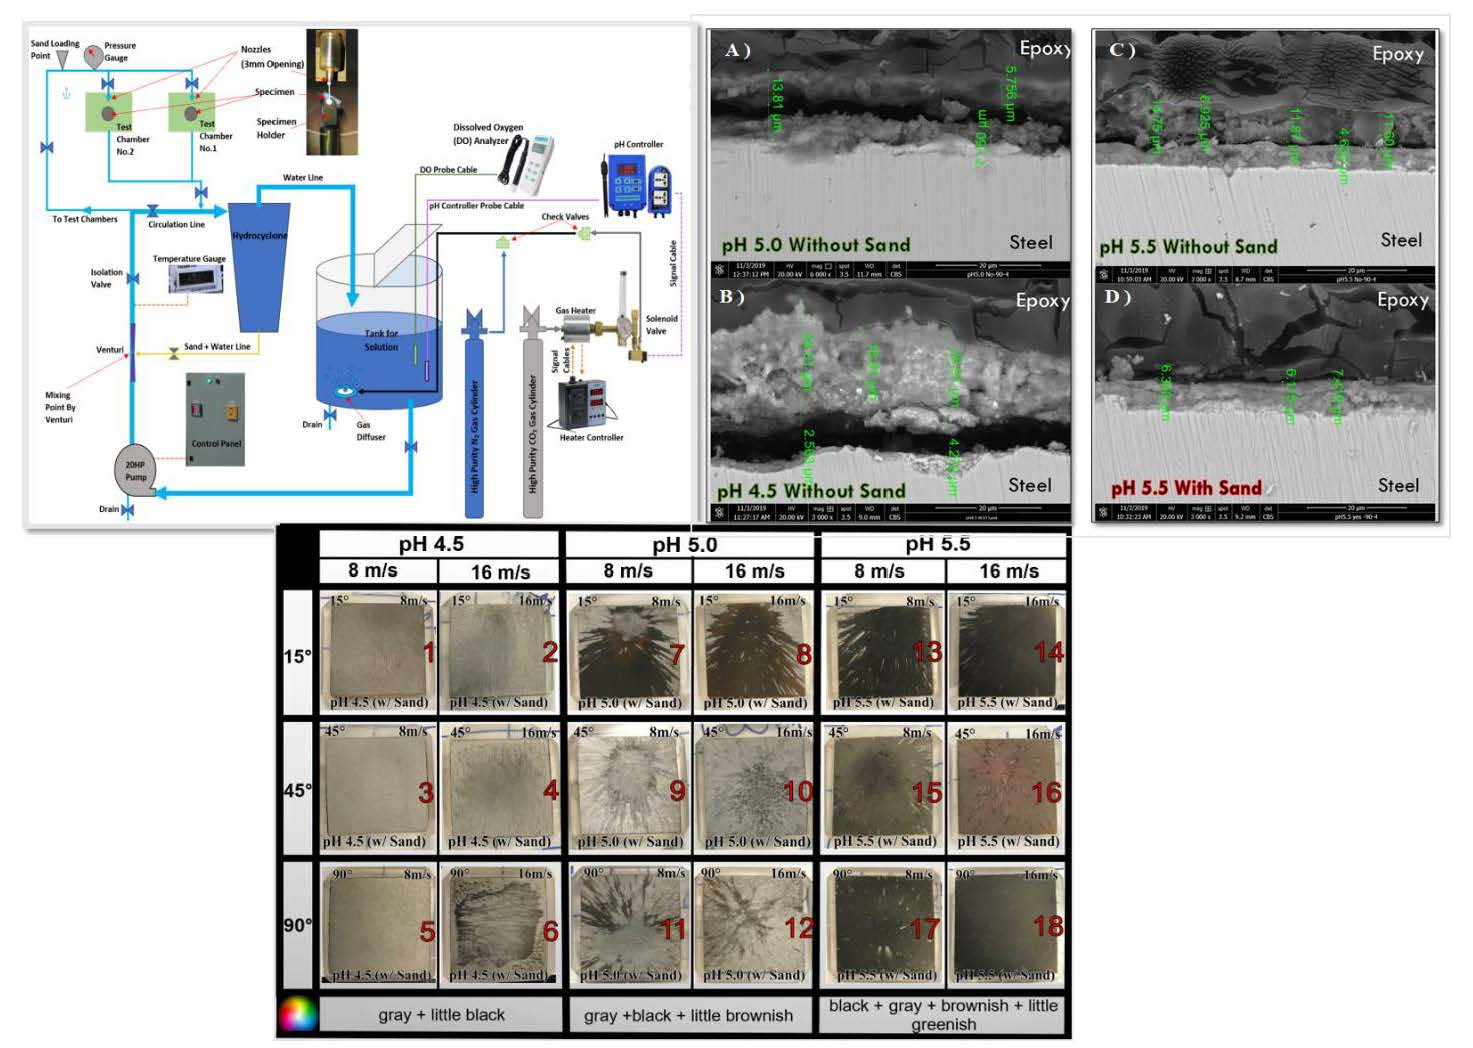
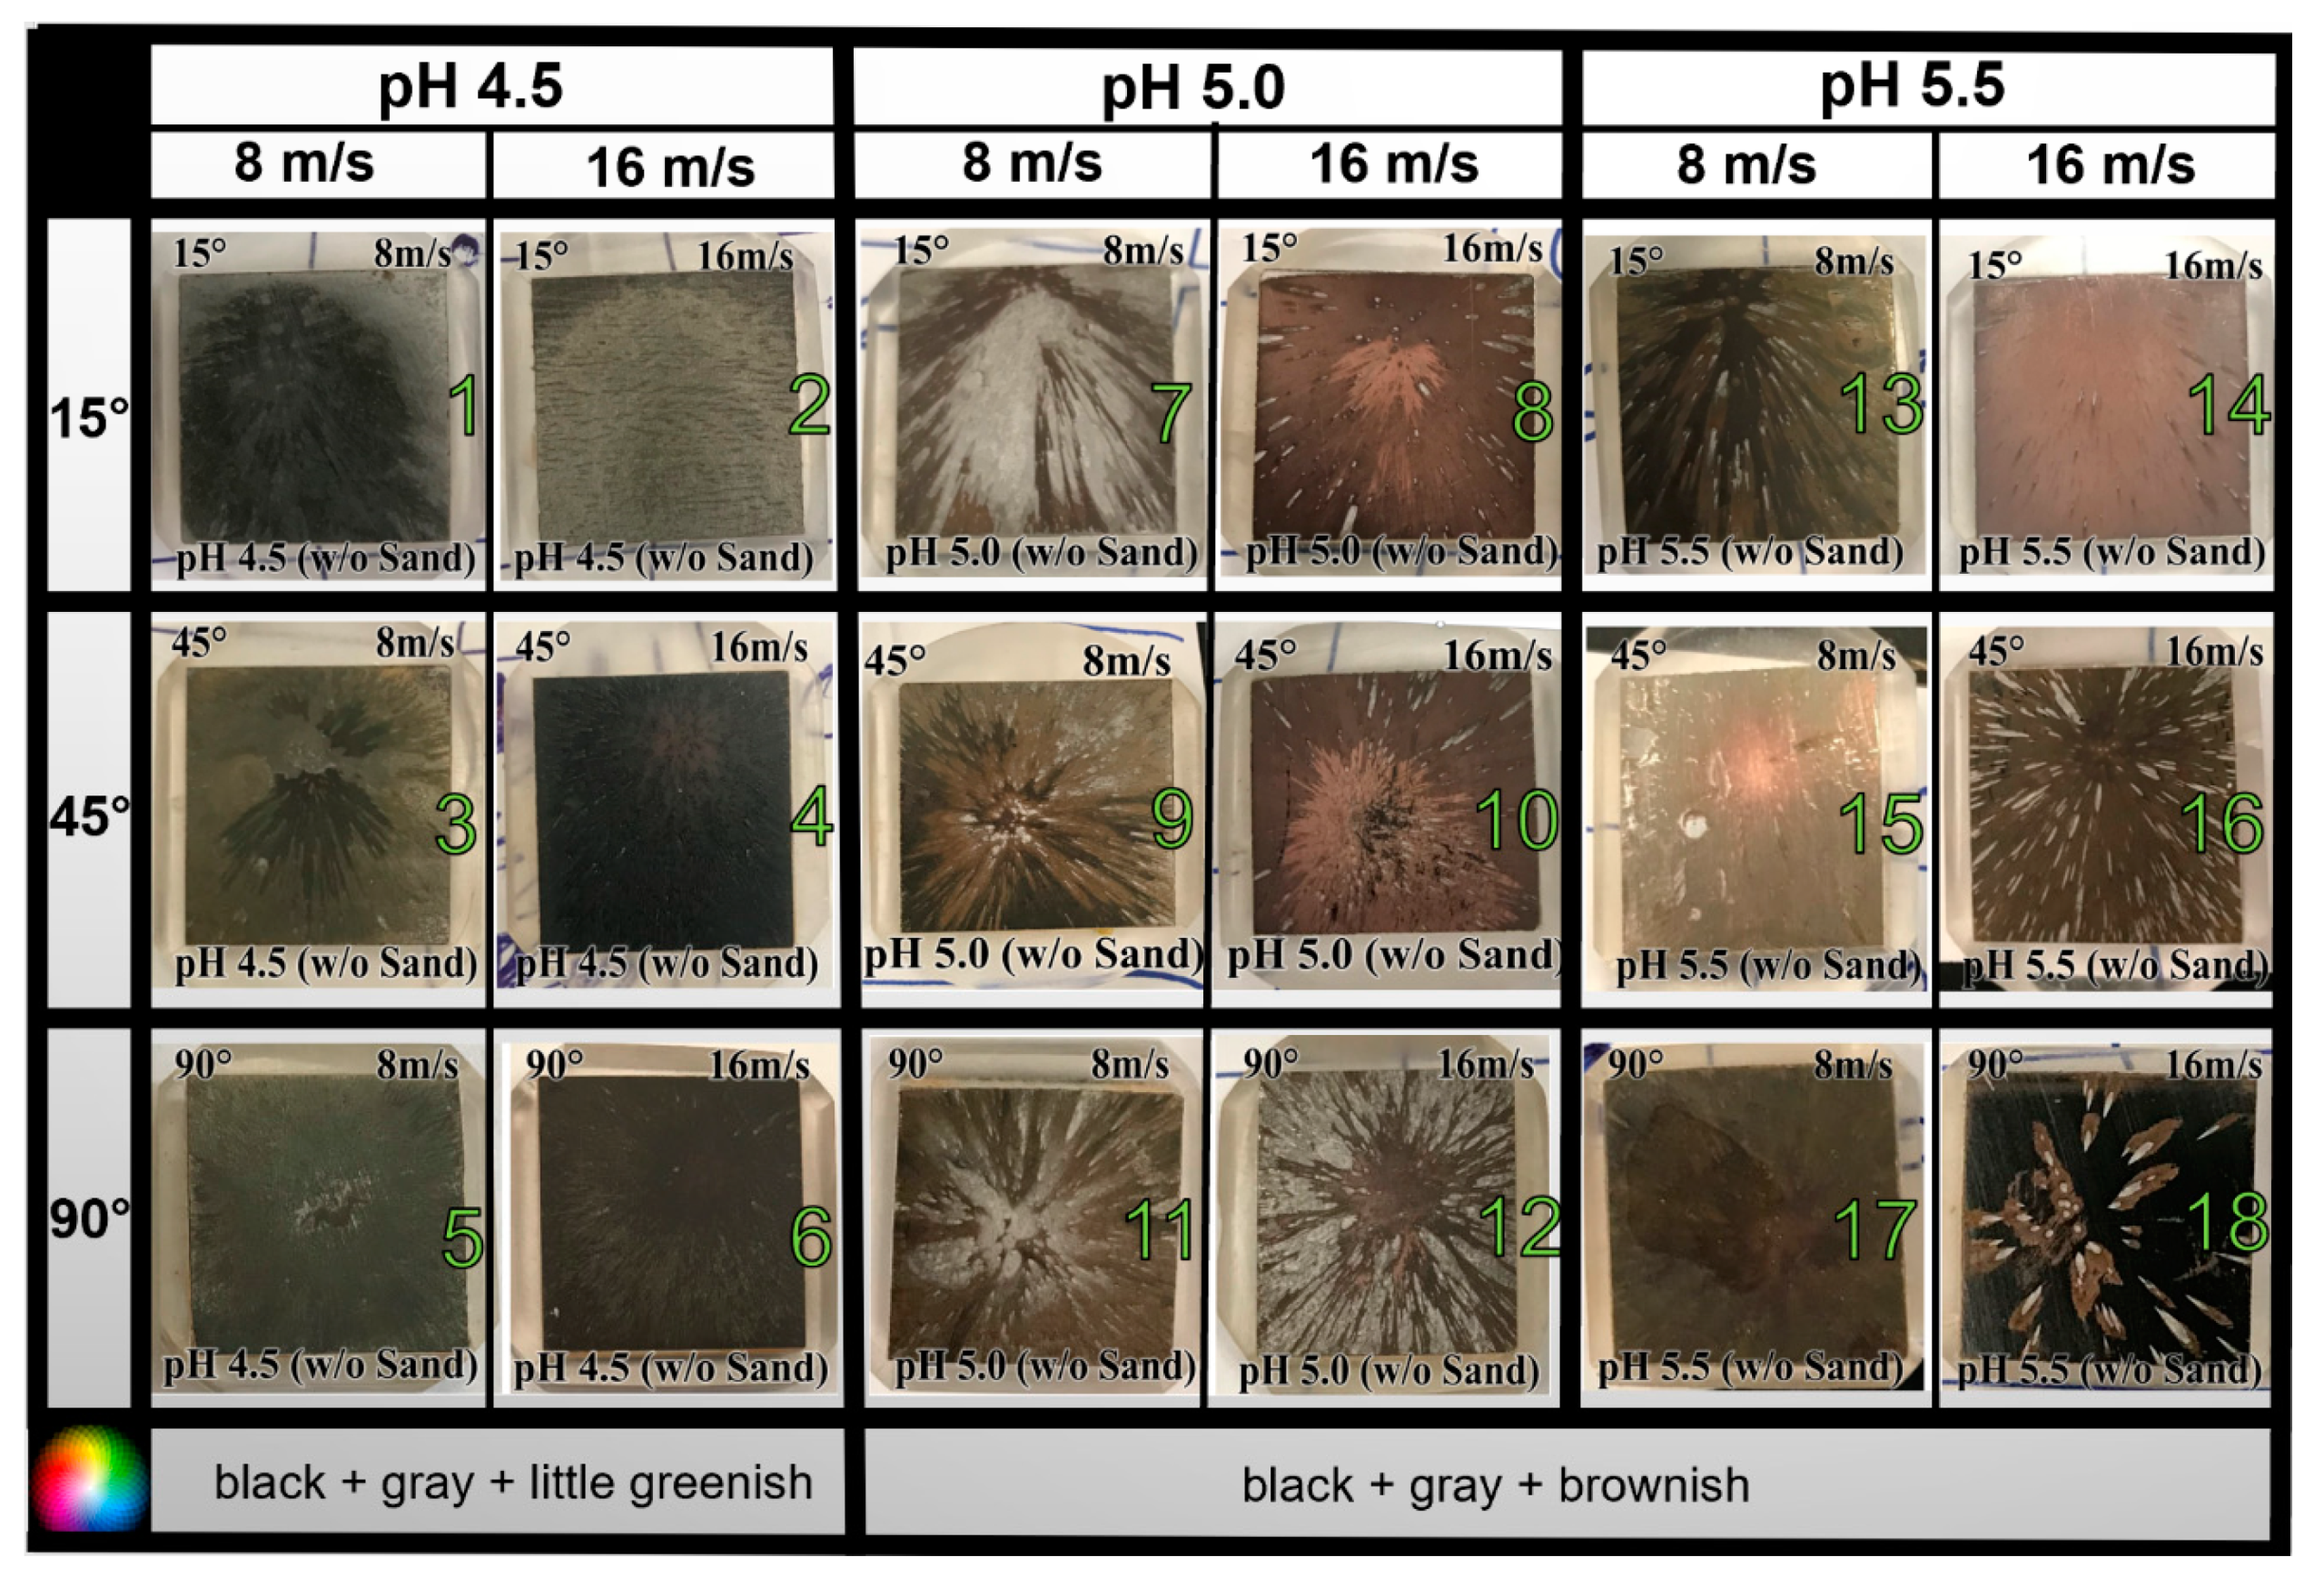
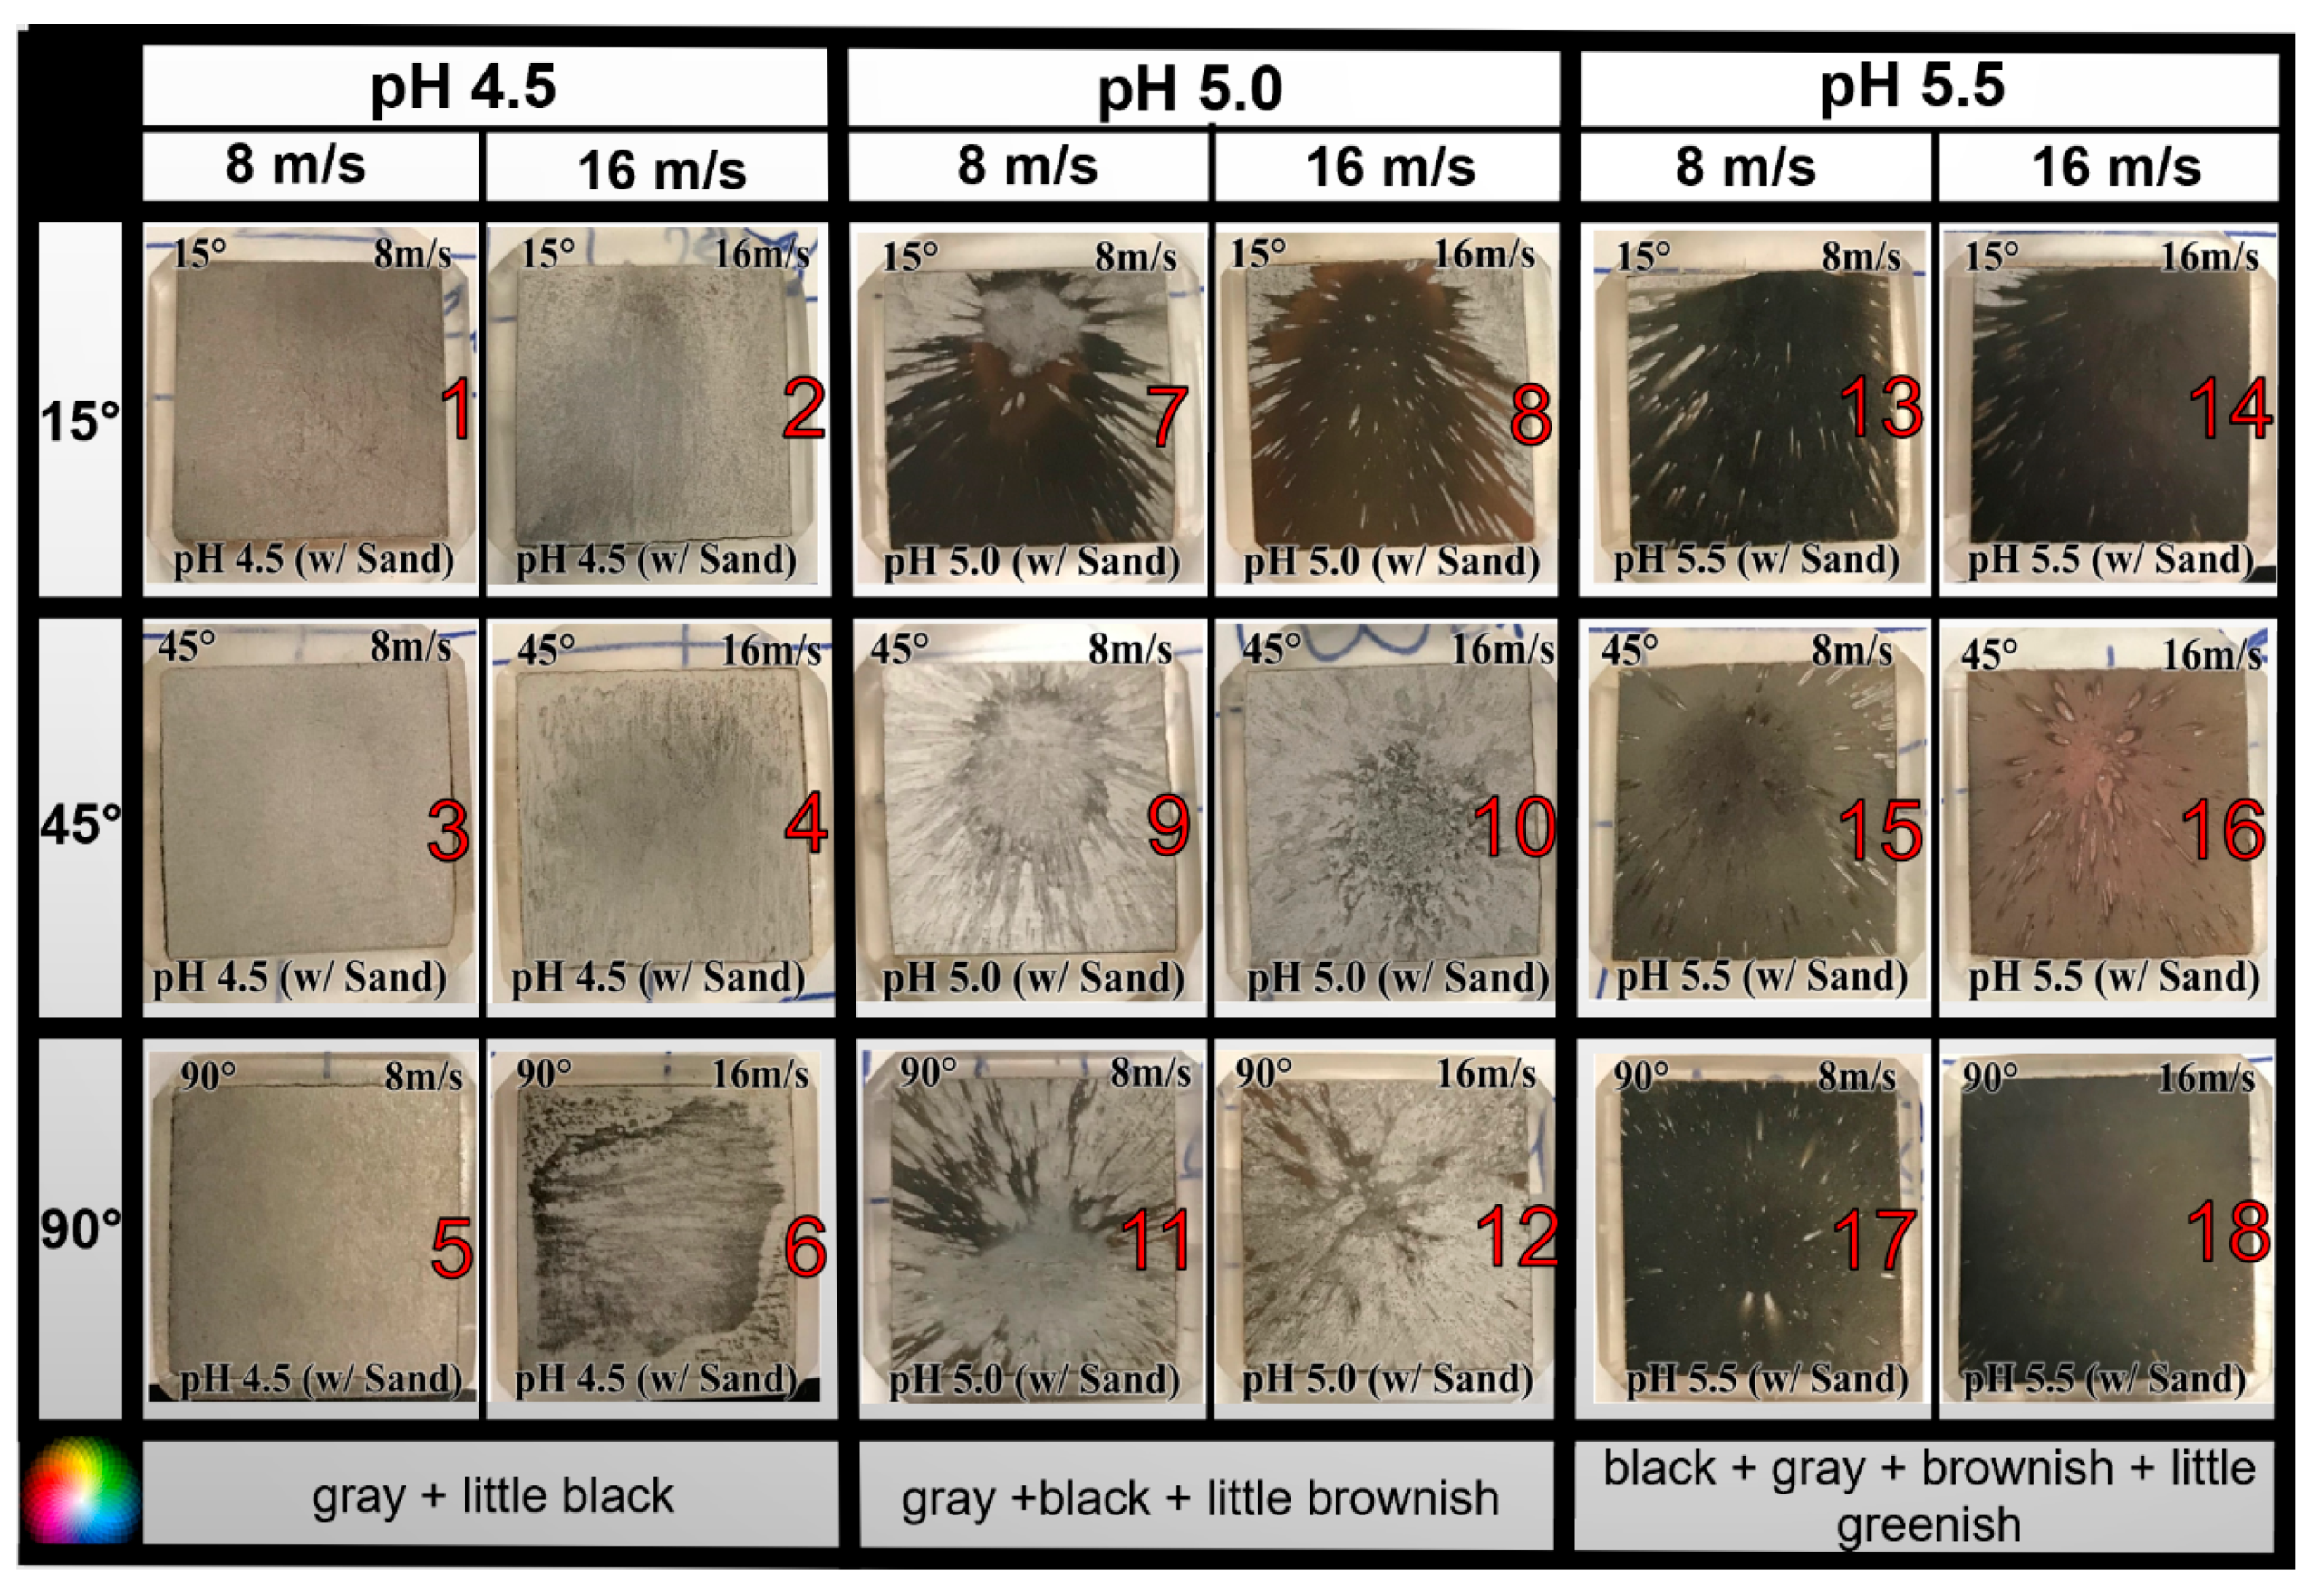
3.1. Visual Observation
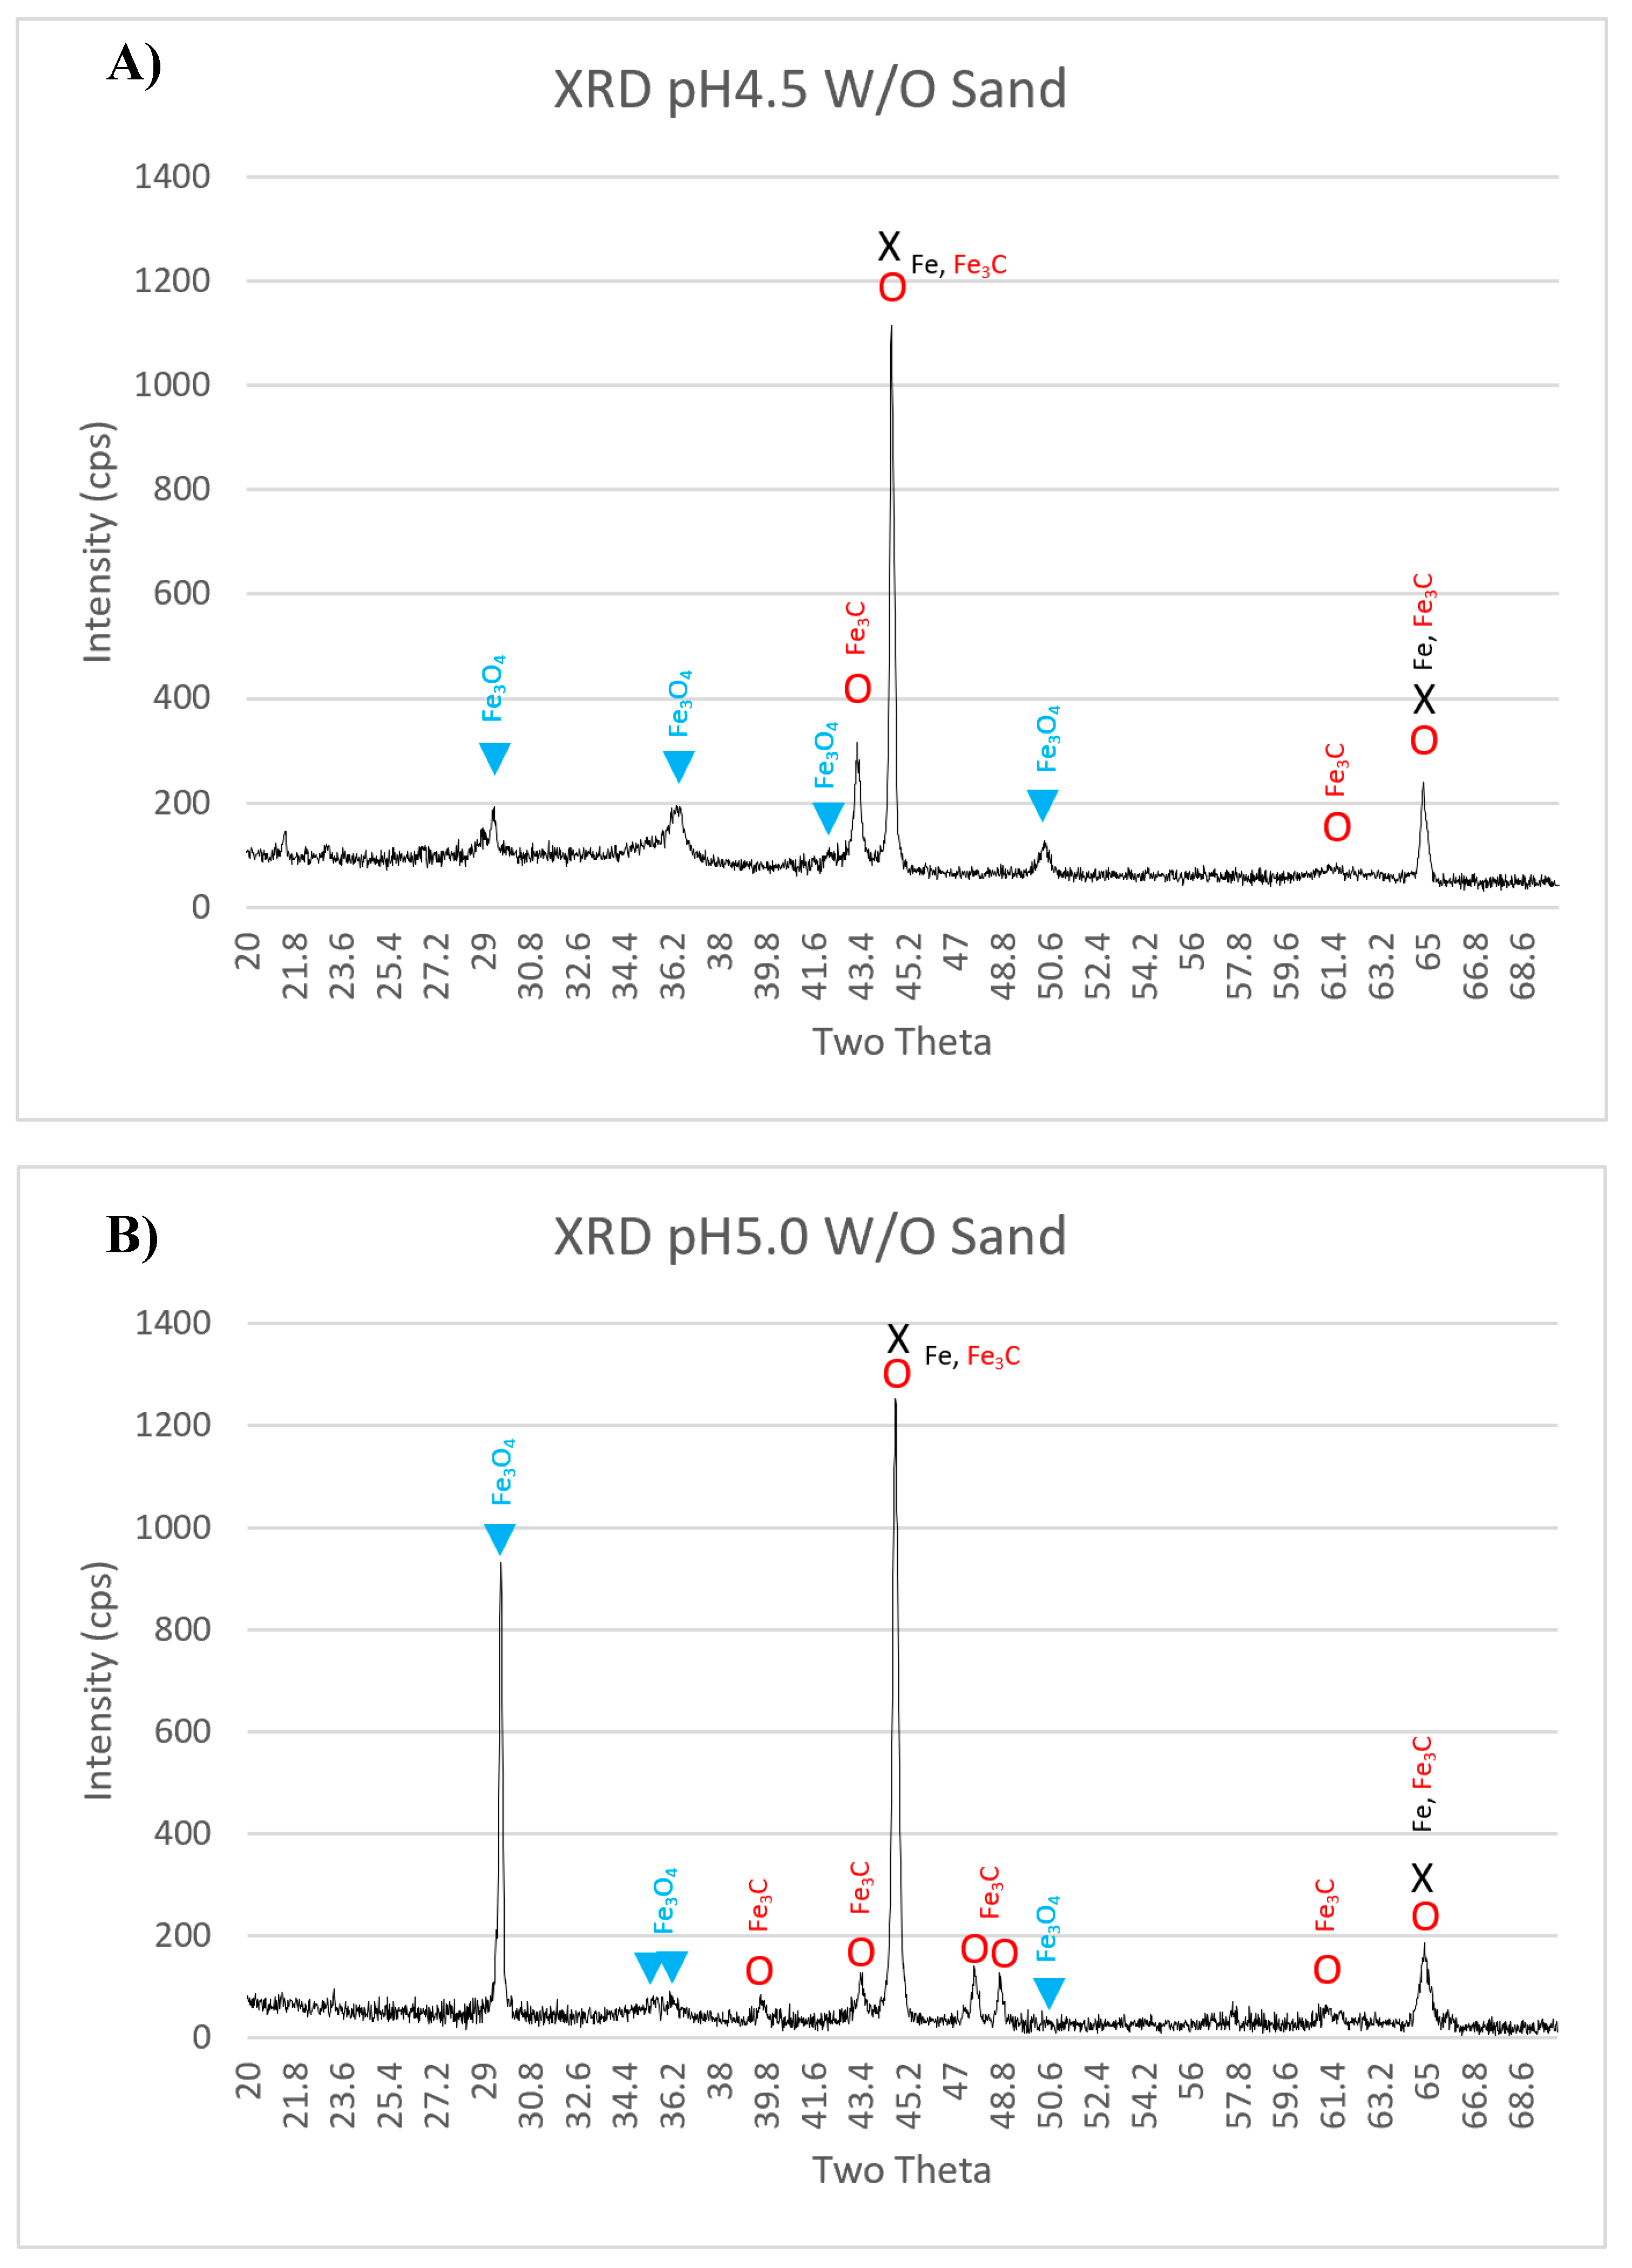
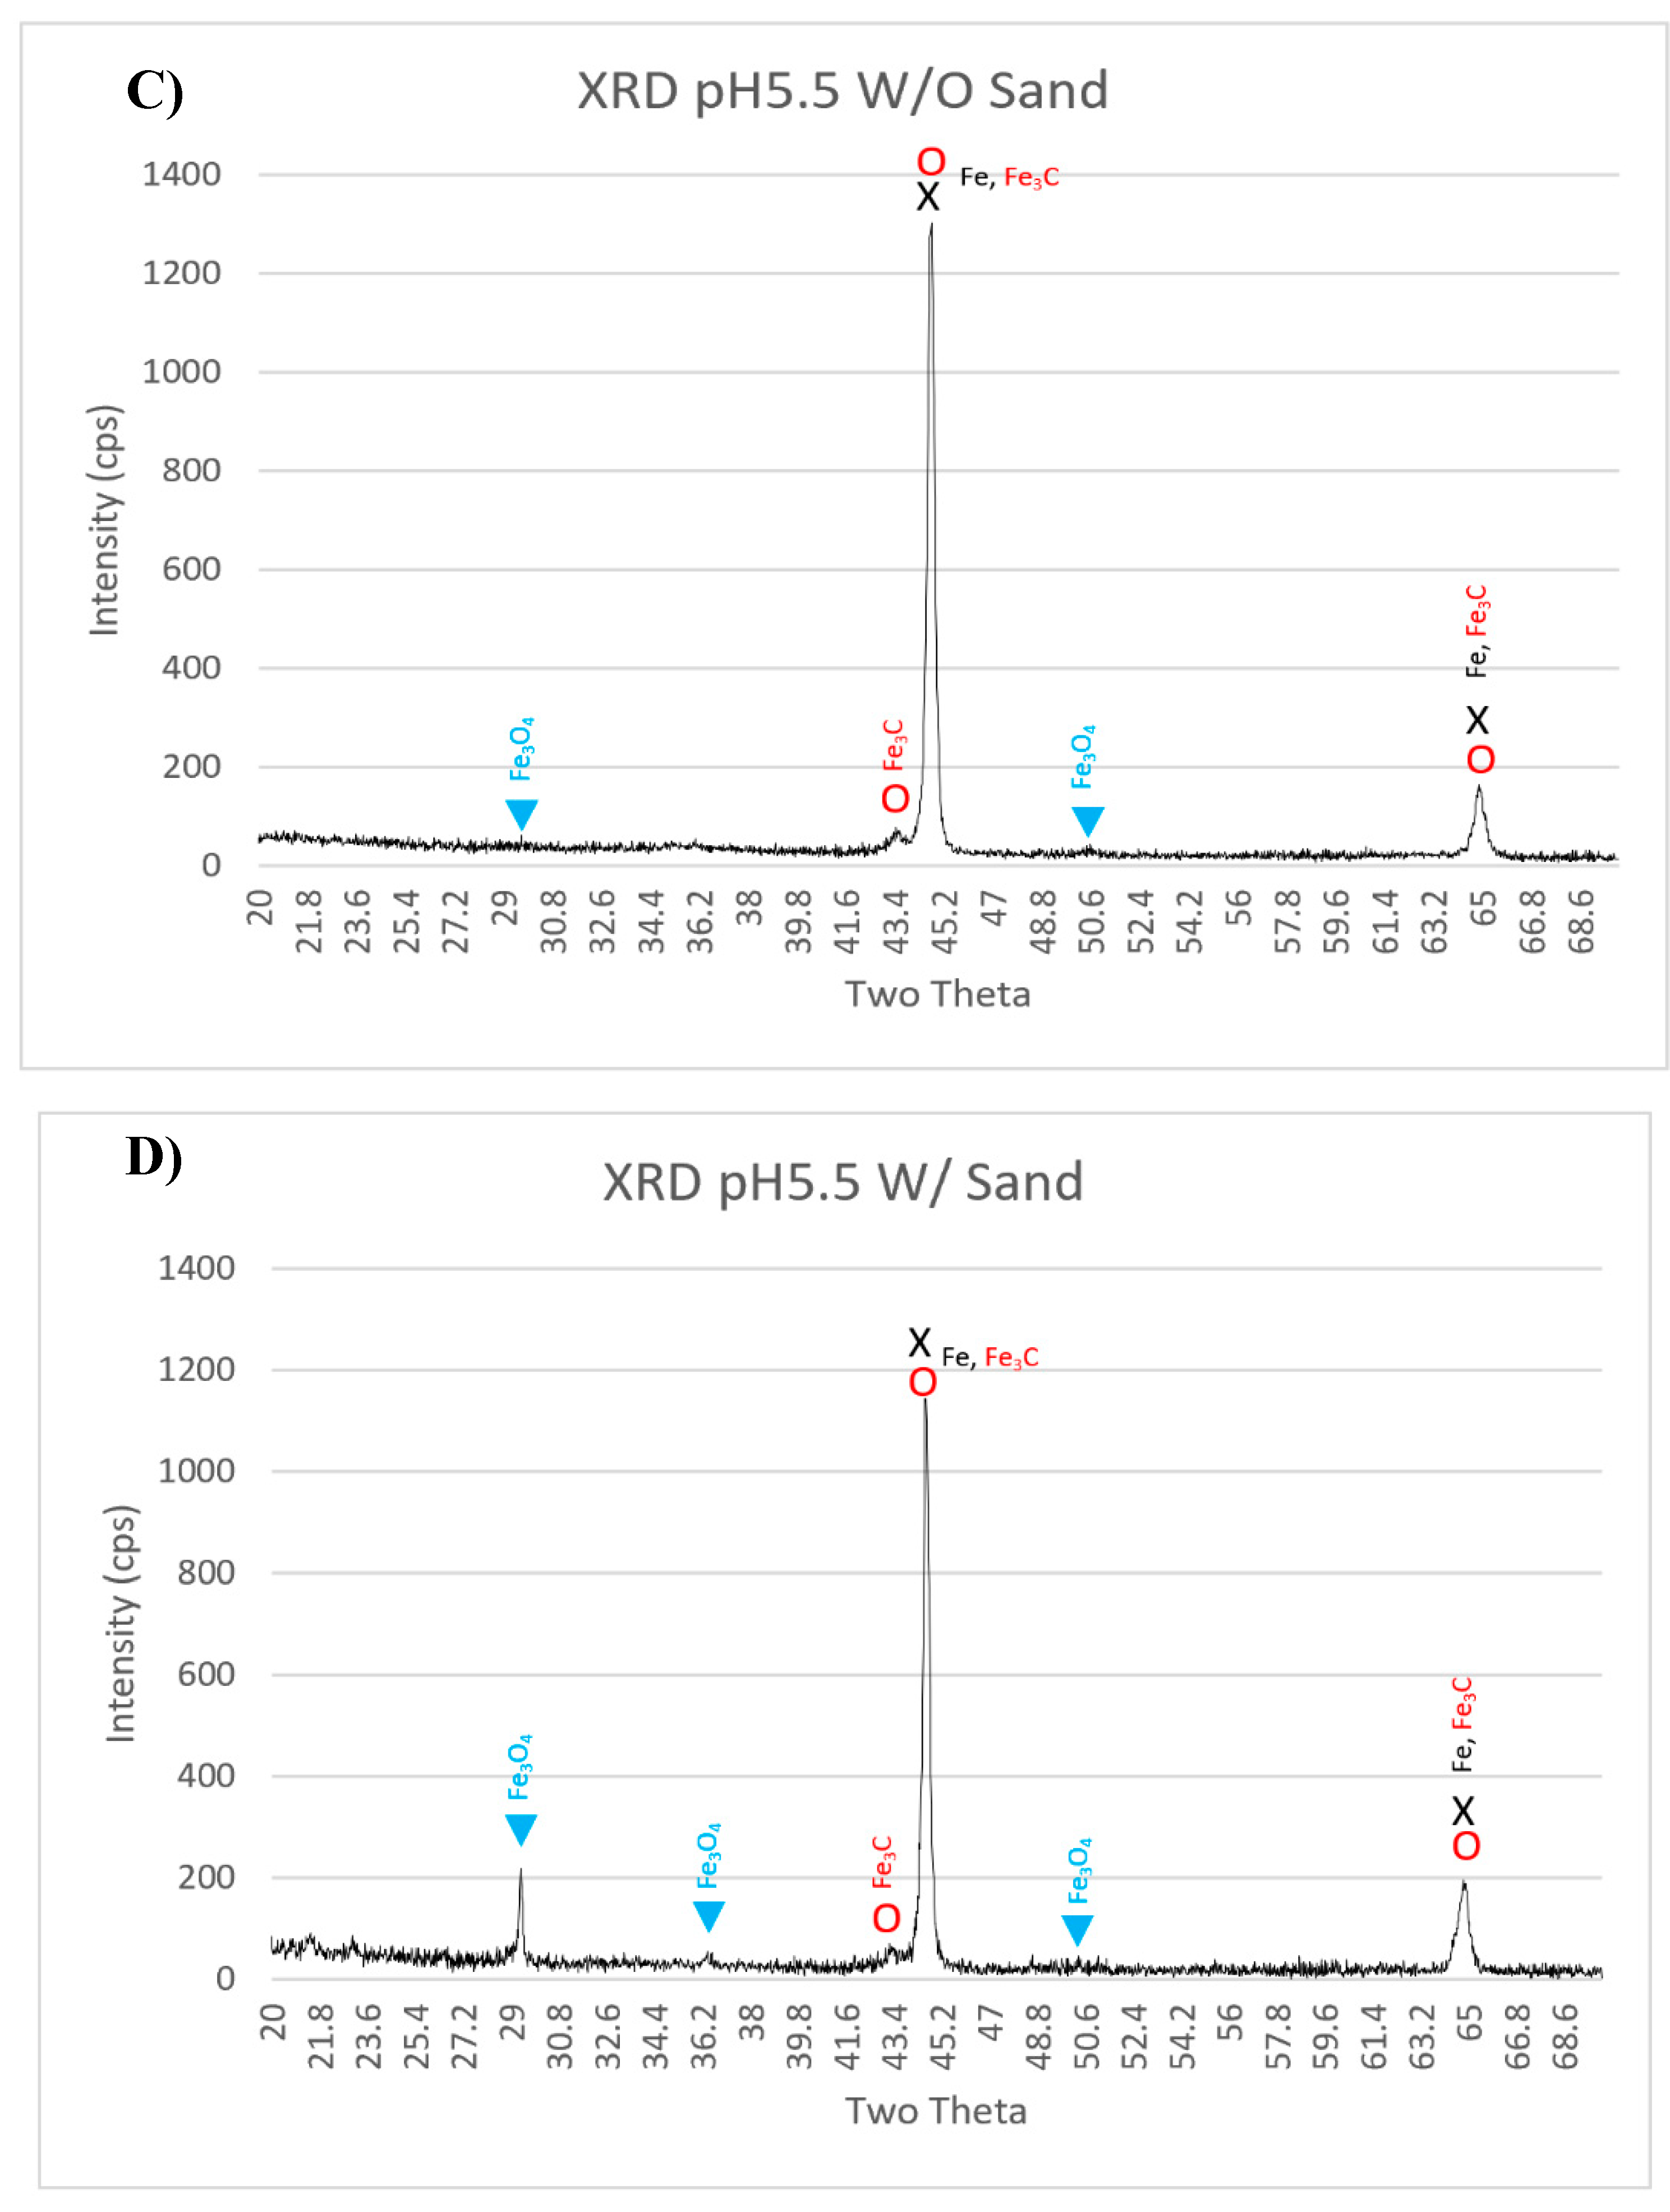
3.2. Corrosion Scales Phase Identification by XRD
3.3. Cross-Section Characterization of Corrosion Scales
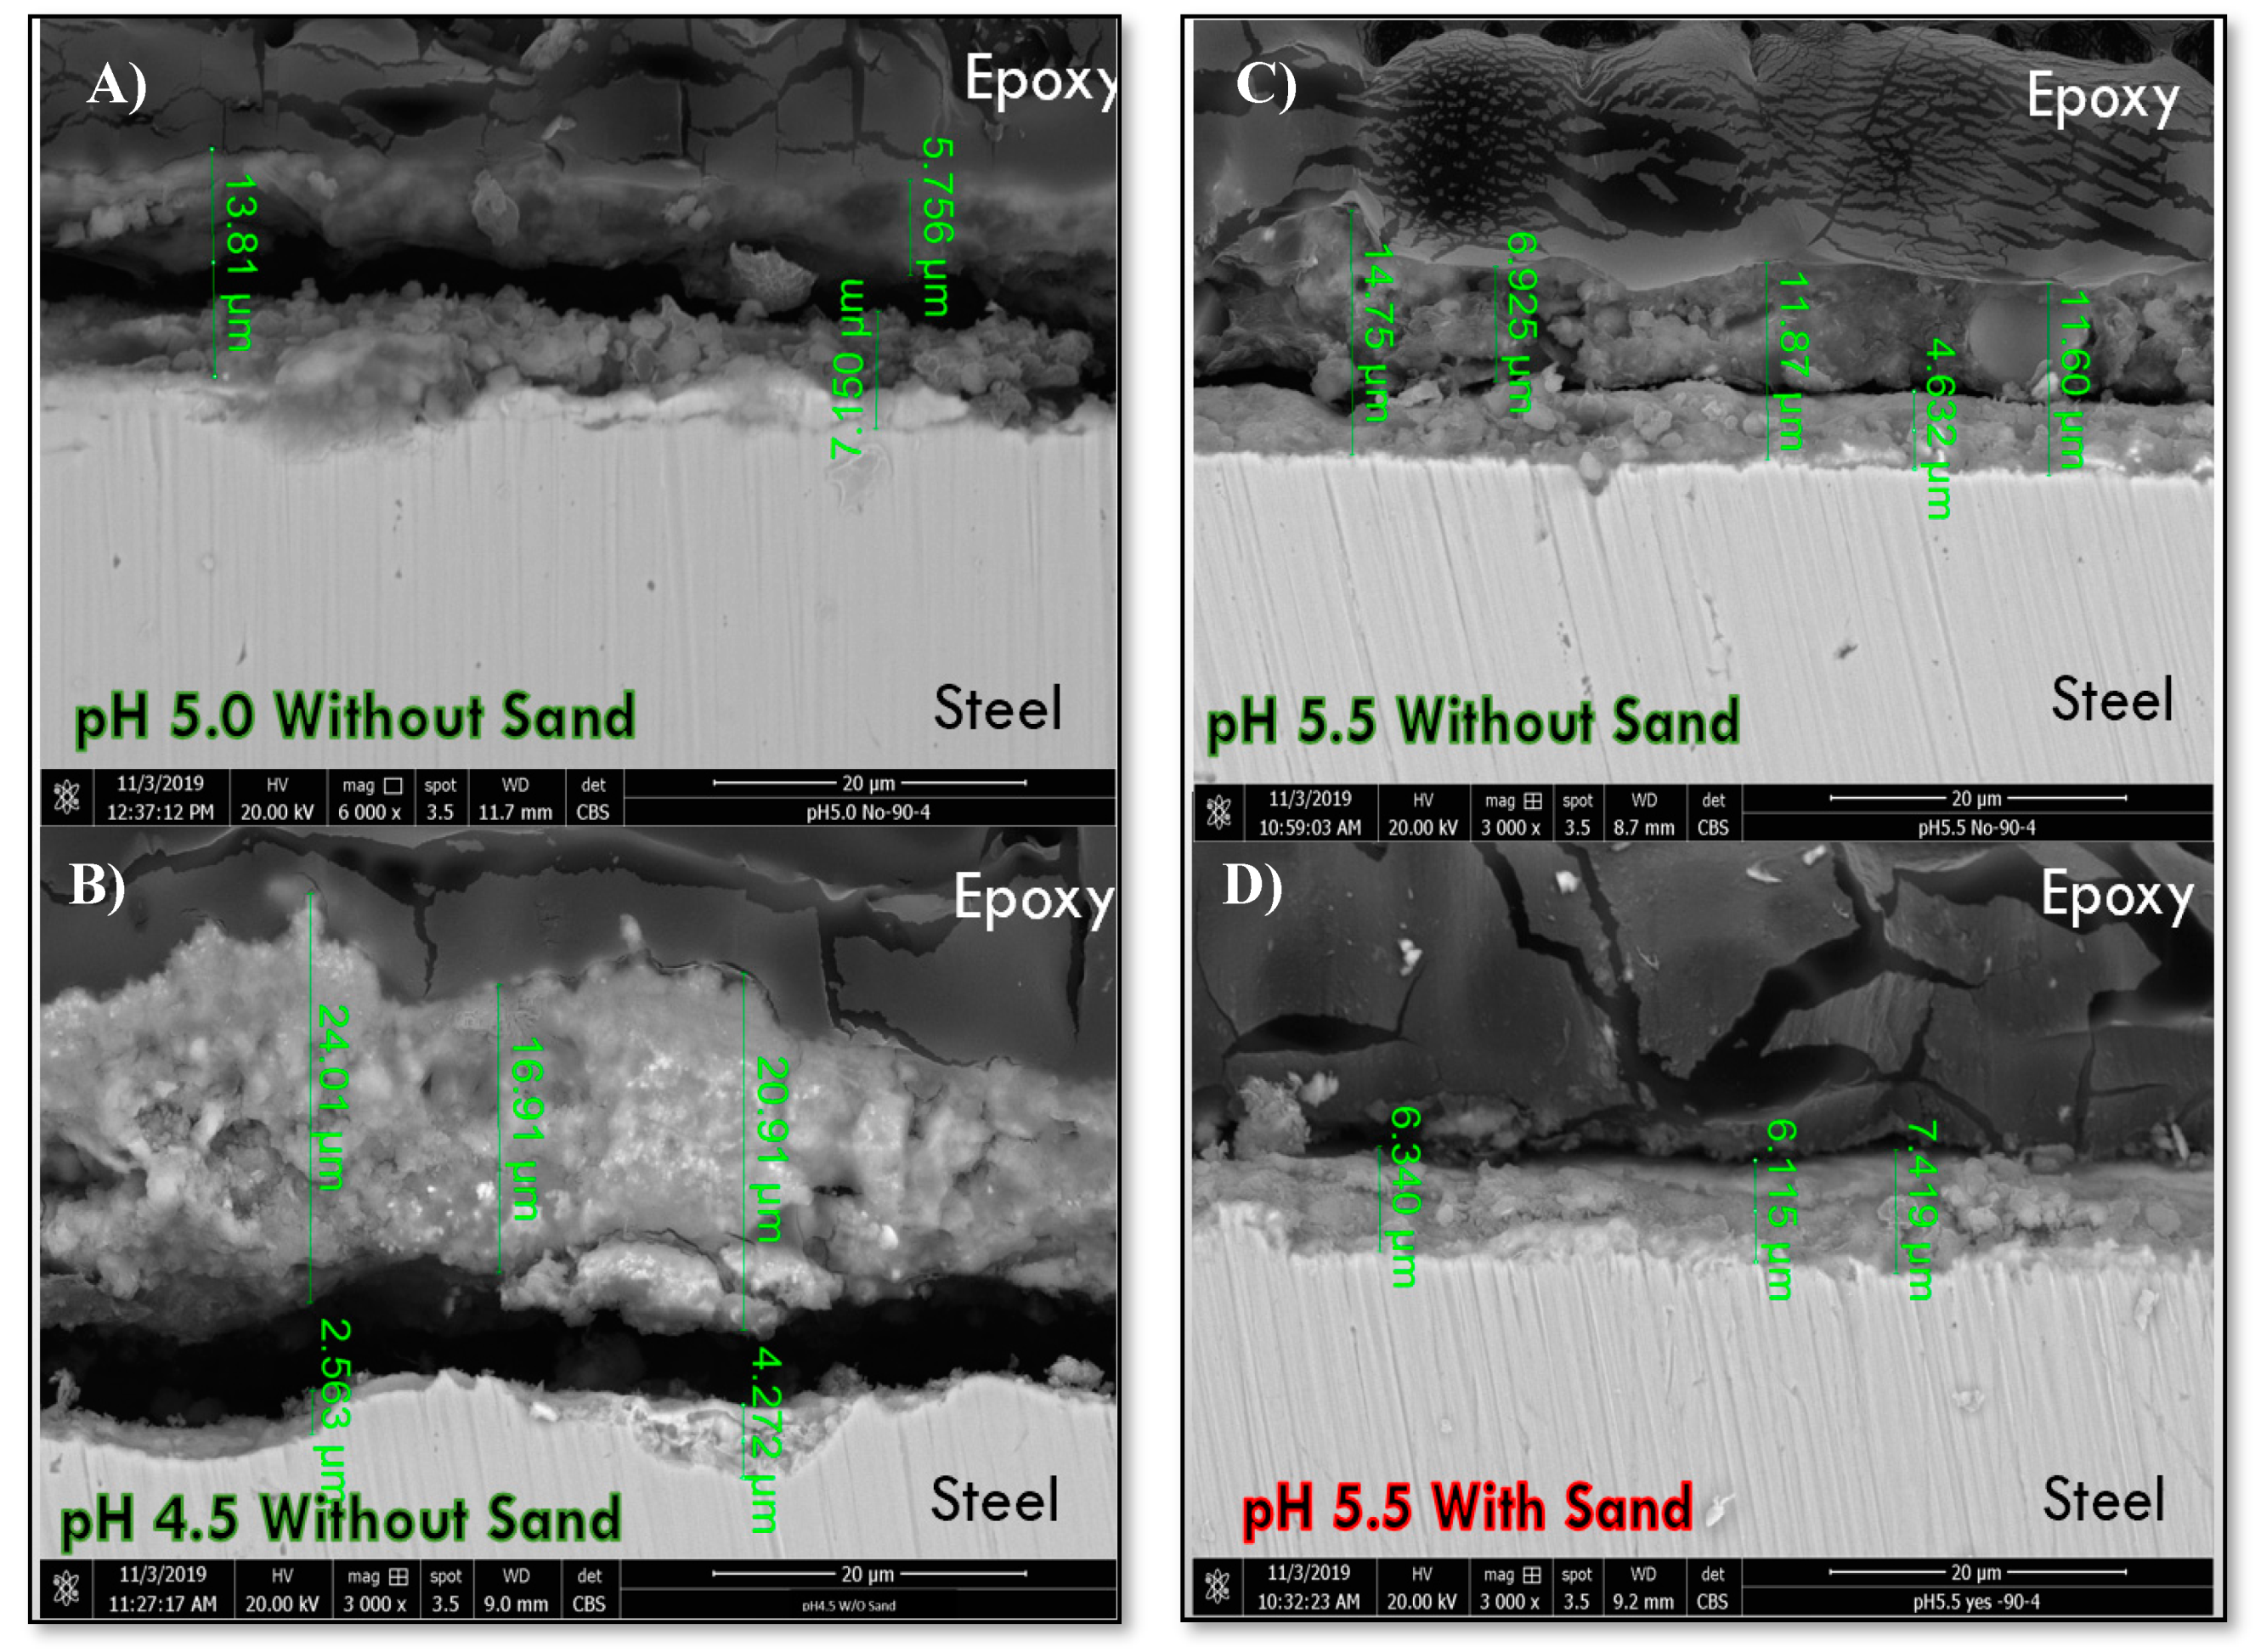
3.3.1. FE-SEM Observations
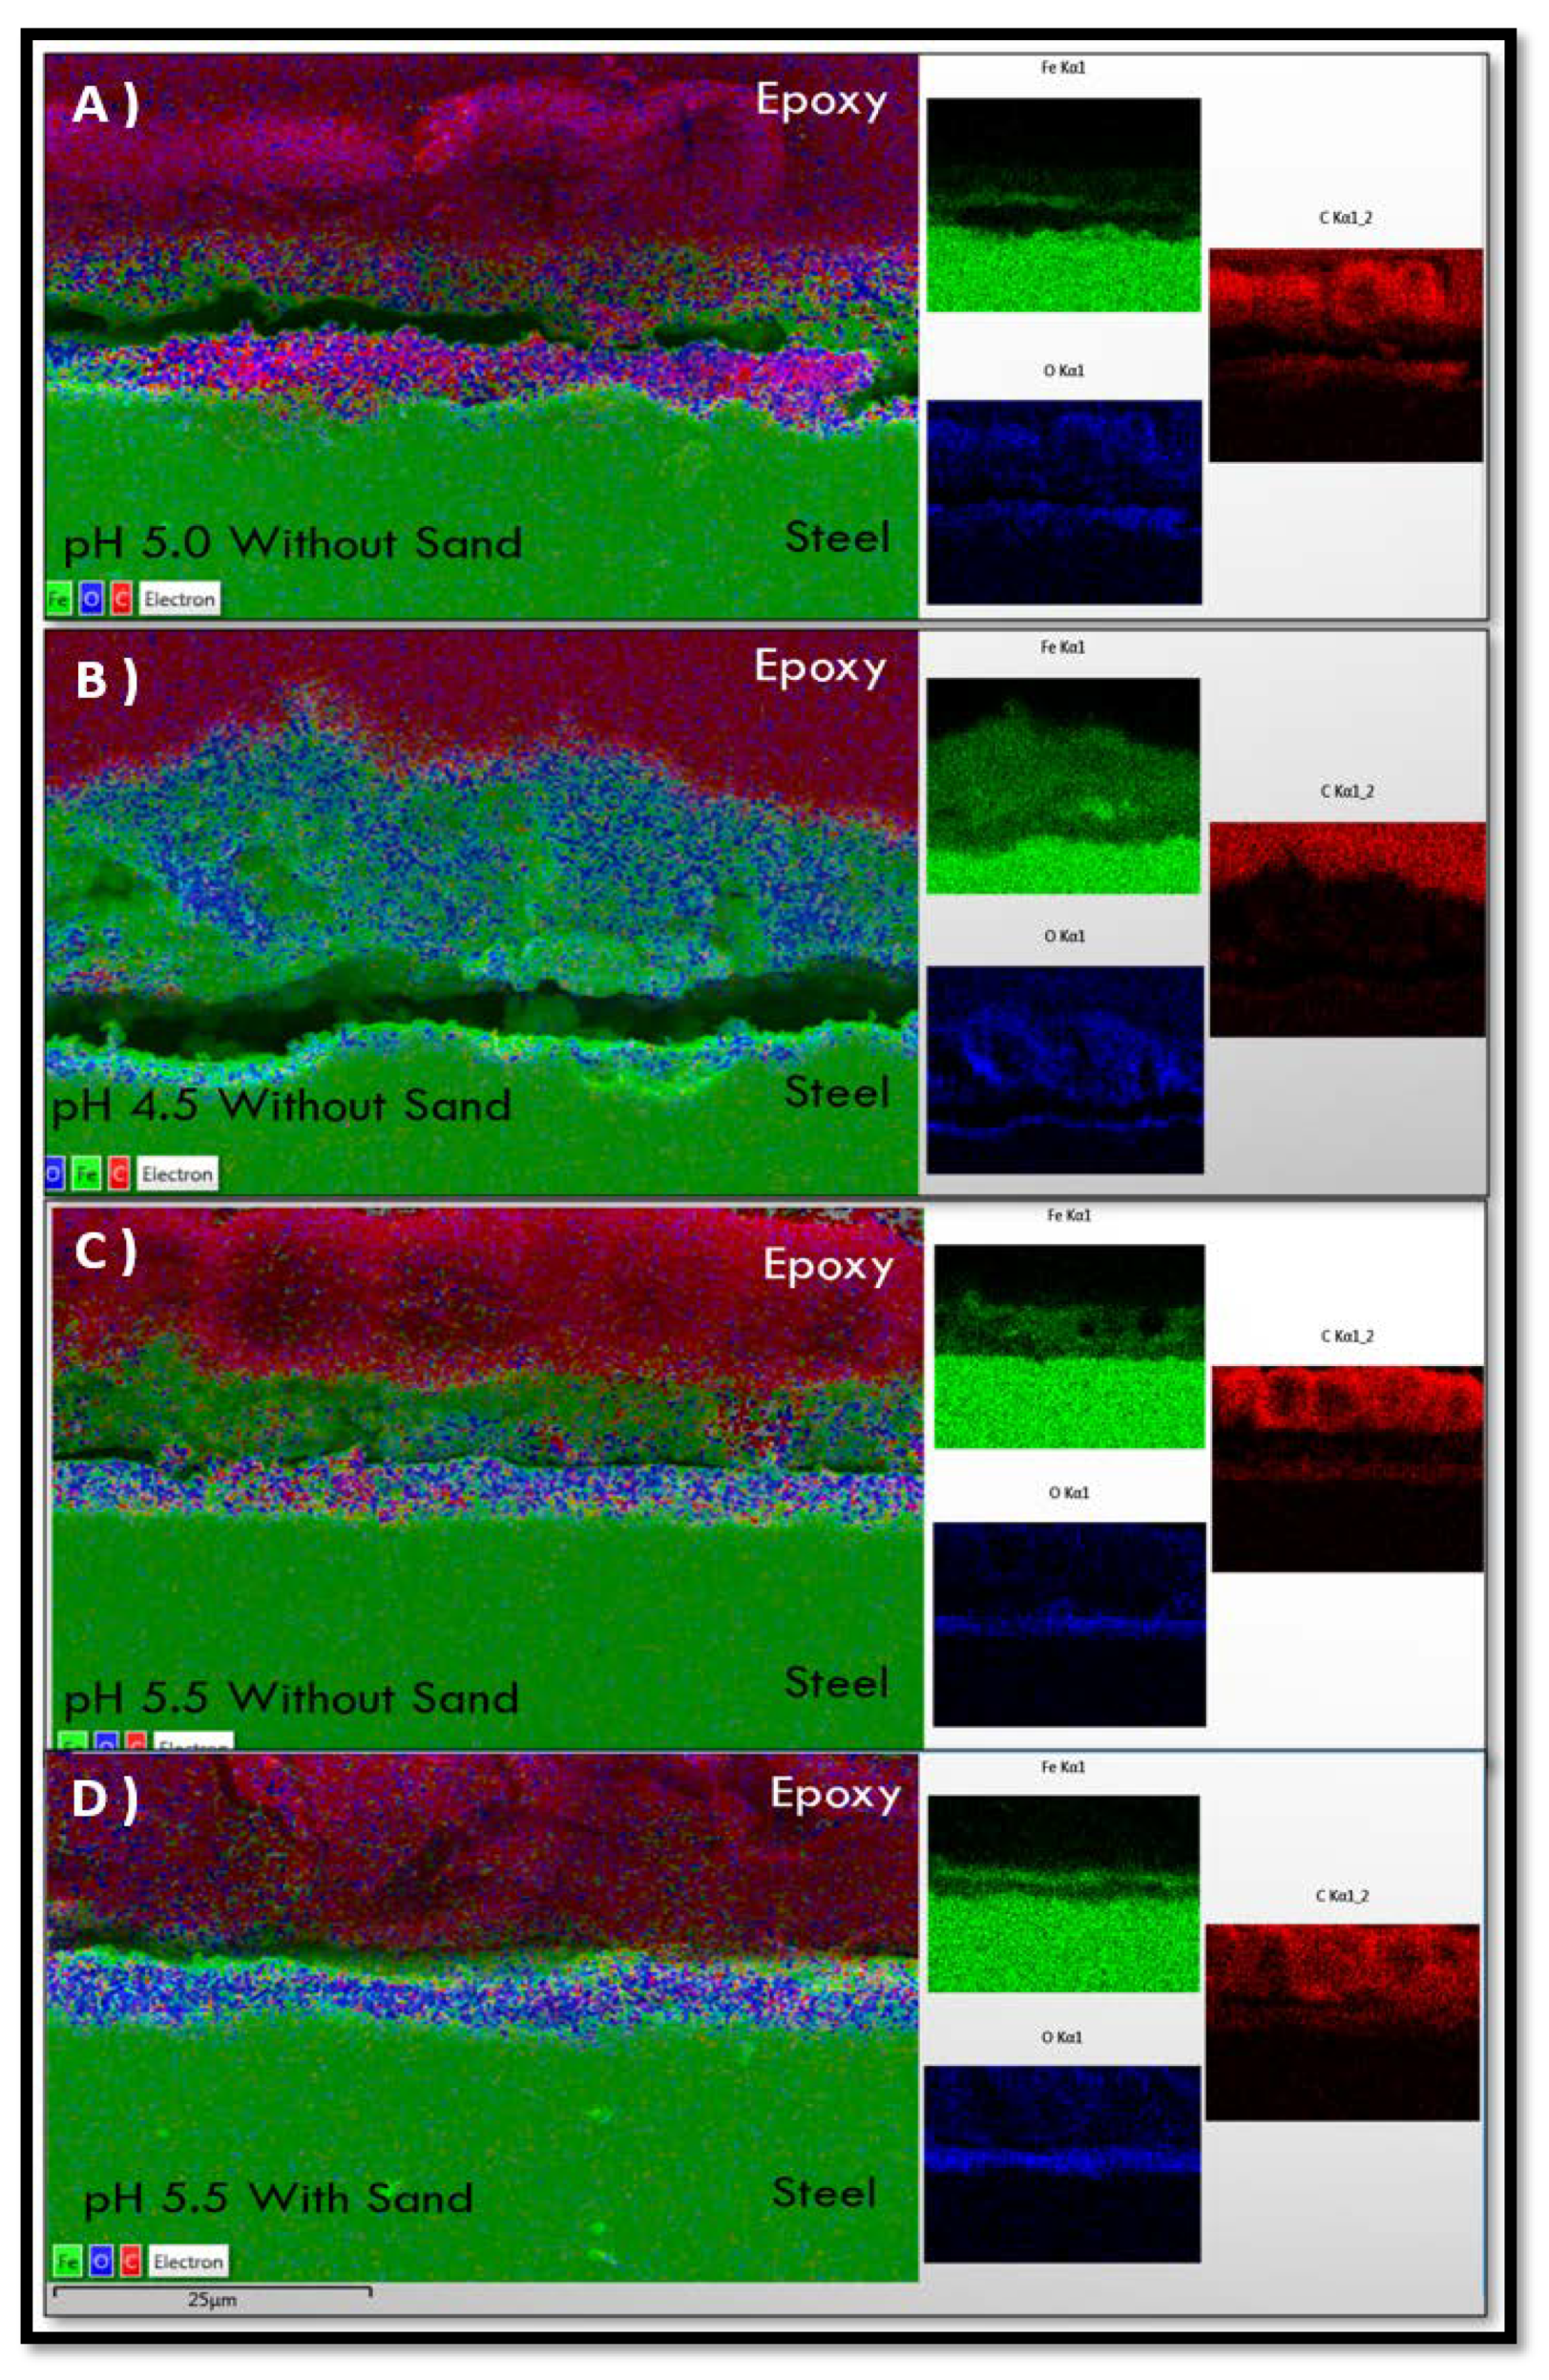
3.3.2. Elemental Analysis by EDS
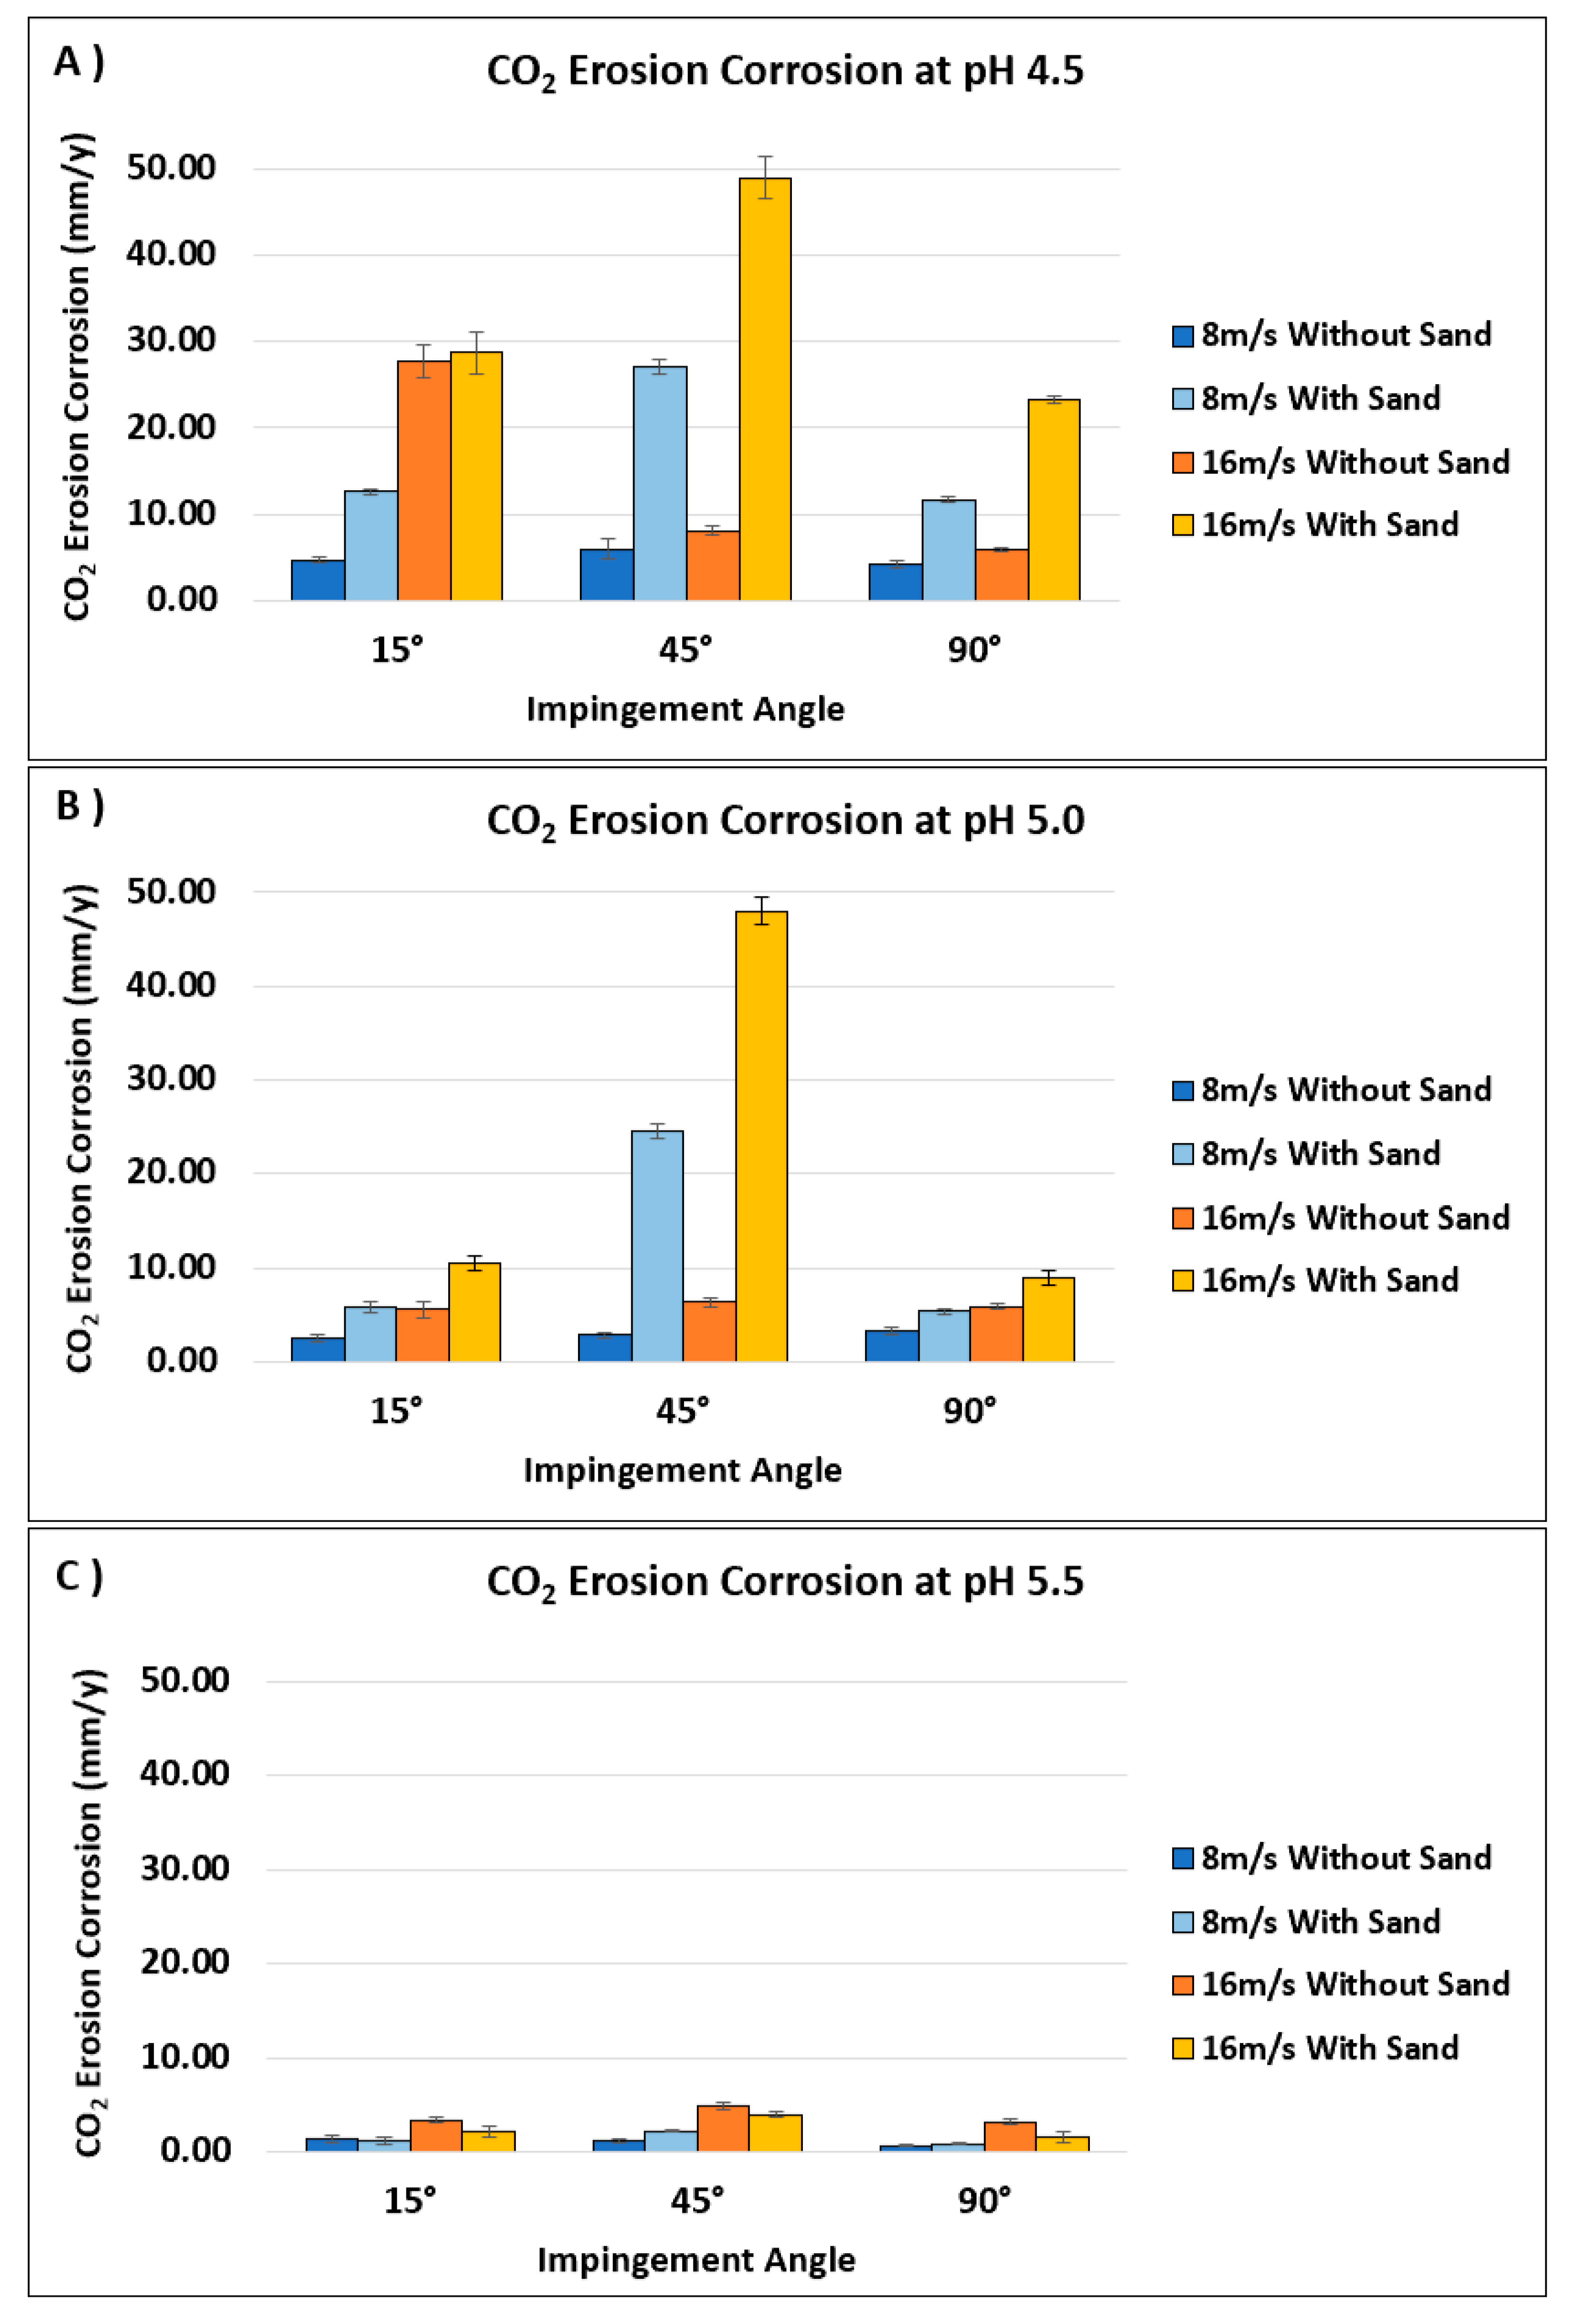
3.4. Effect of Varying Parameters on CO2 Erosion–corrosion Rates
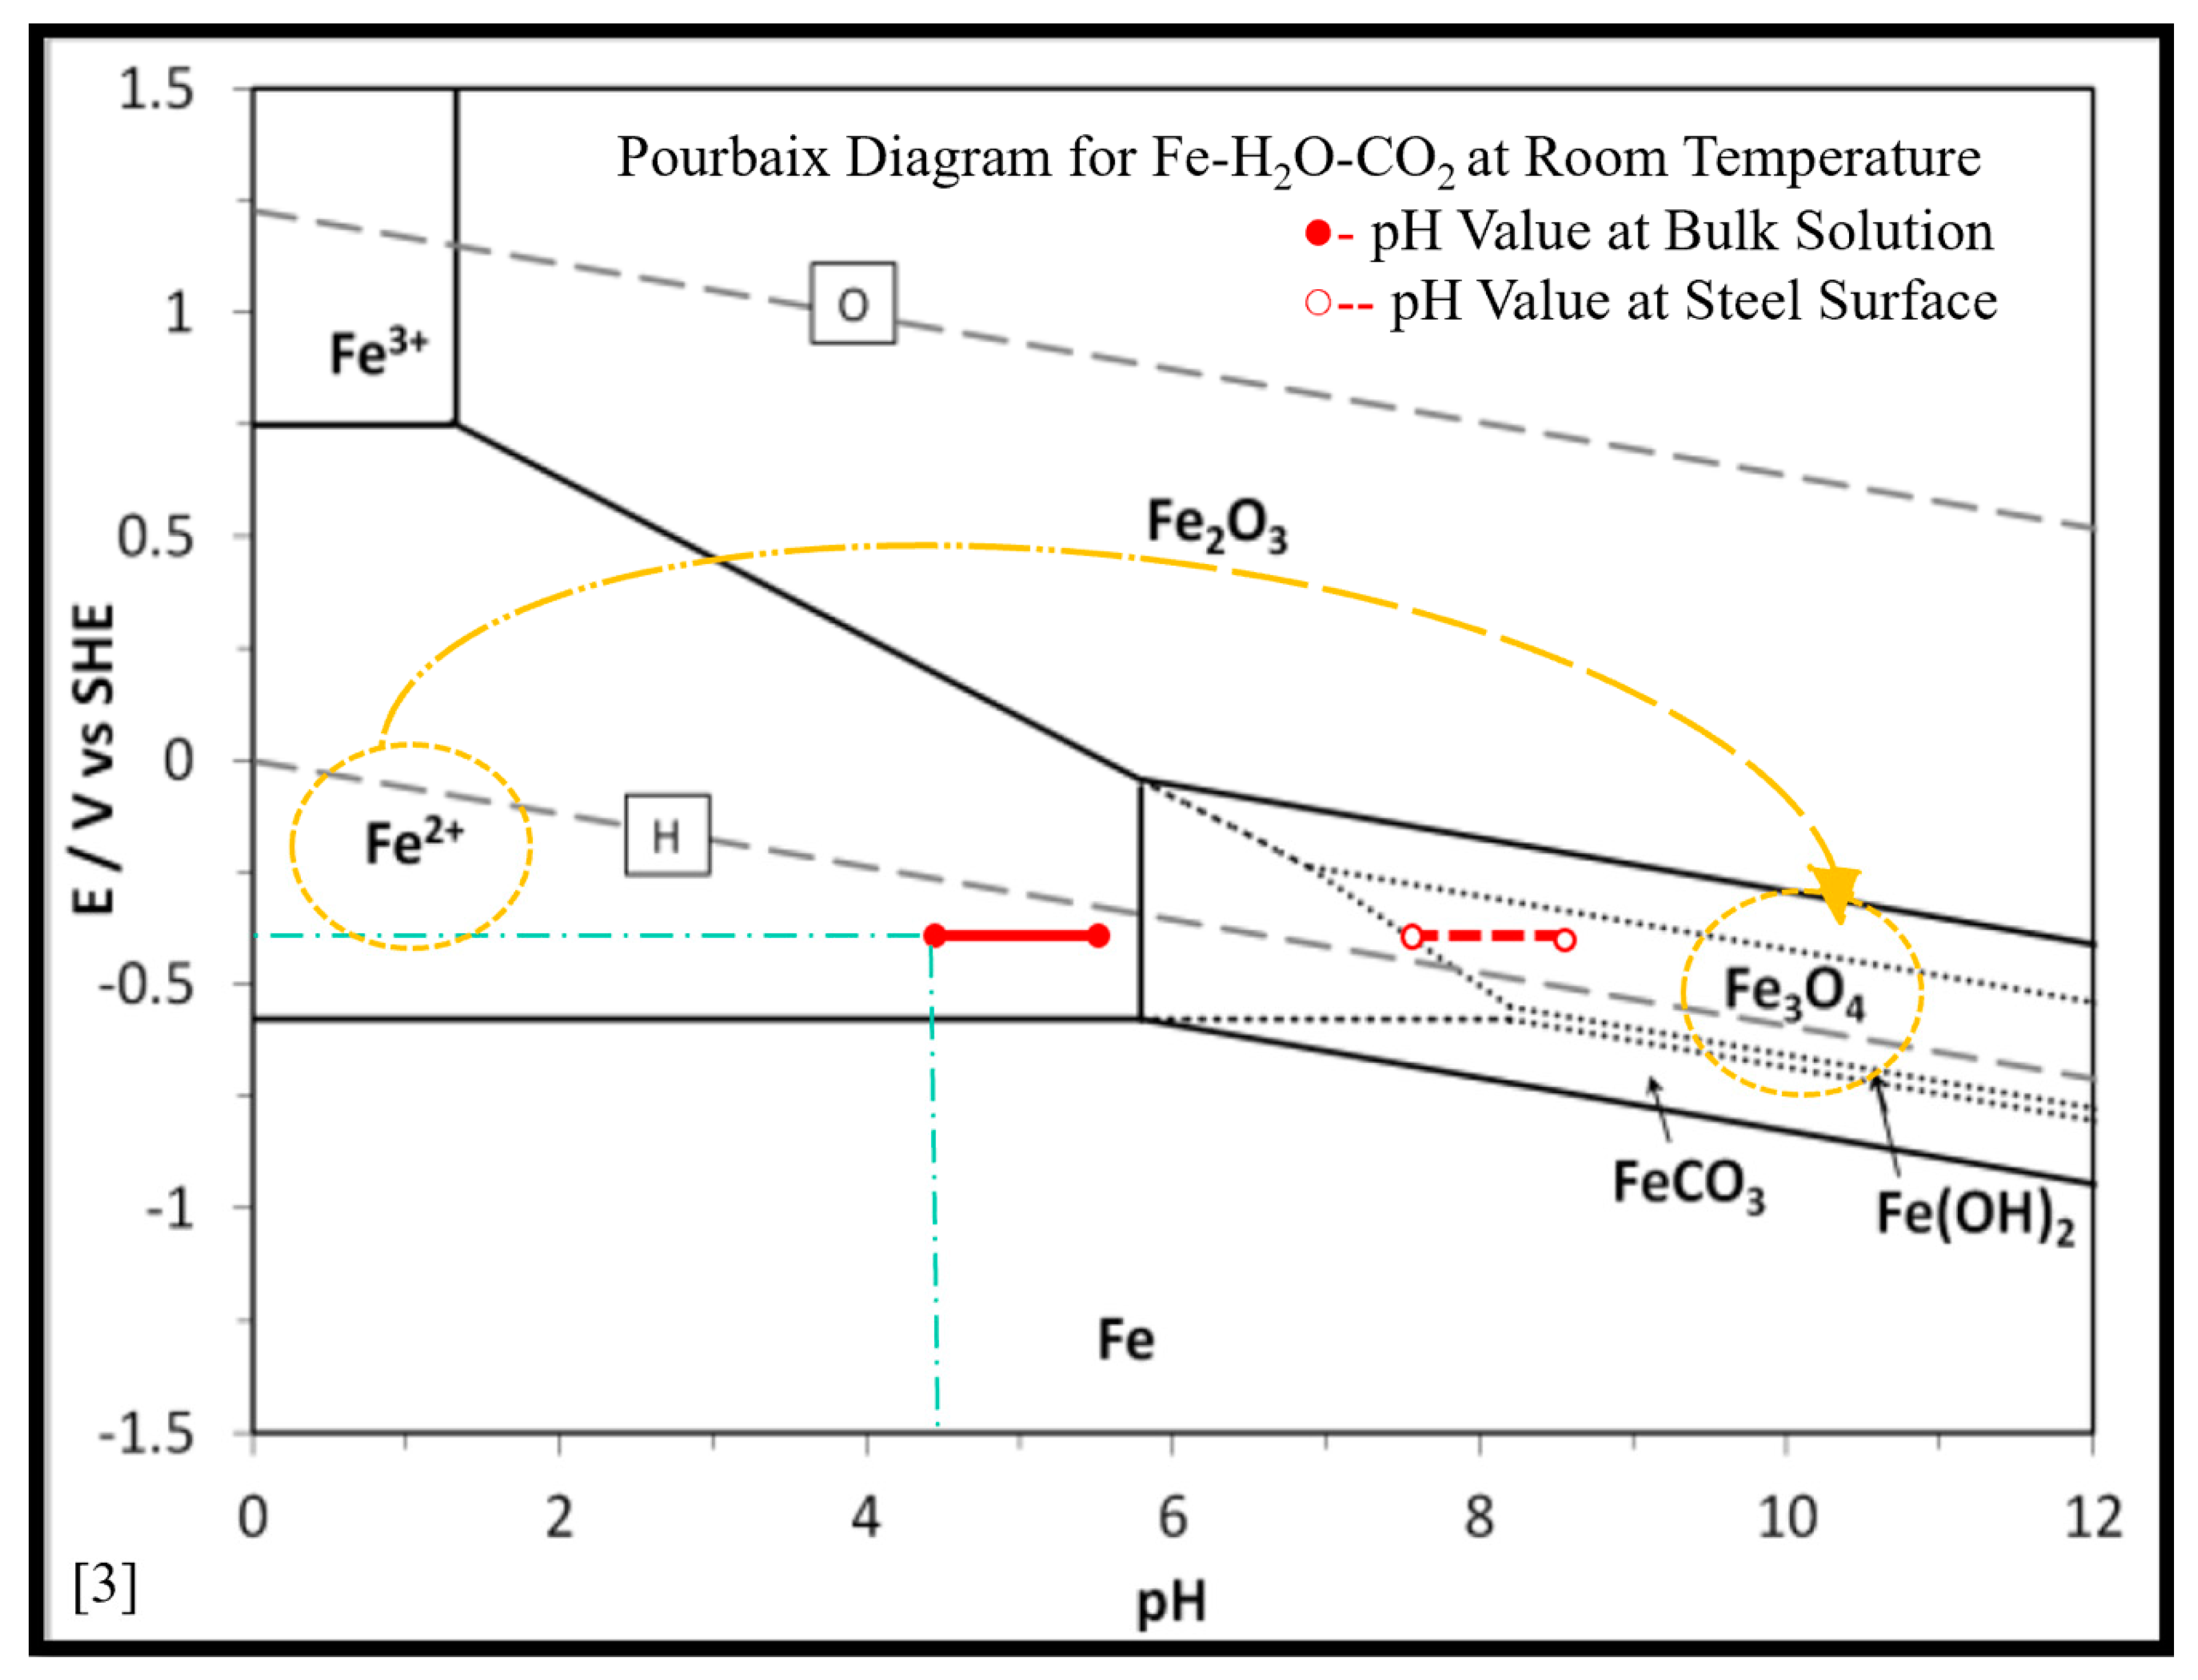
3.4.1. Effect of CO2 Concentration Represented in pH Value
3.4.2. Effect of Impingement Angle
3.4.3. Effect of Impingement Velocity
4. Conclusions
- The CO2 erosion–corrosion rate decreased with an increase in solution pH;
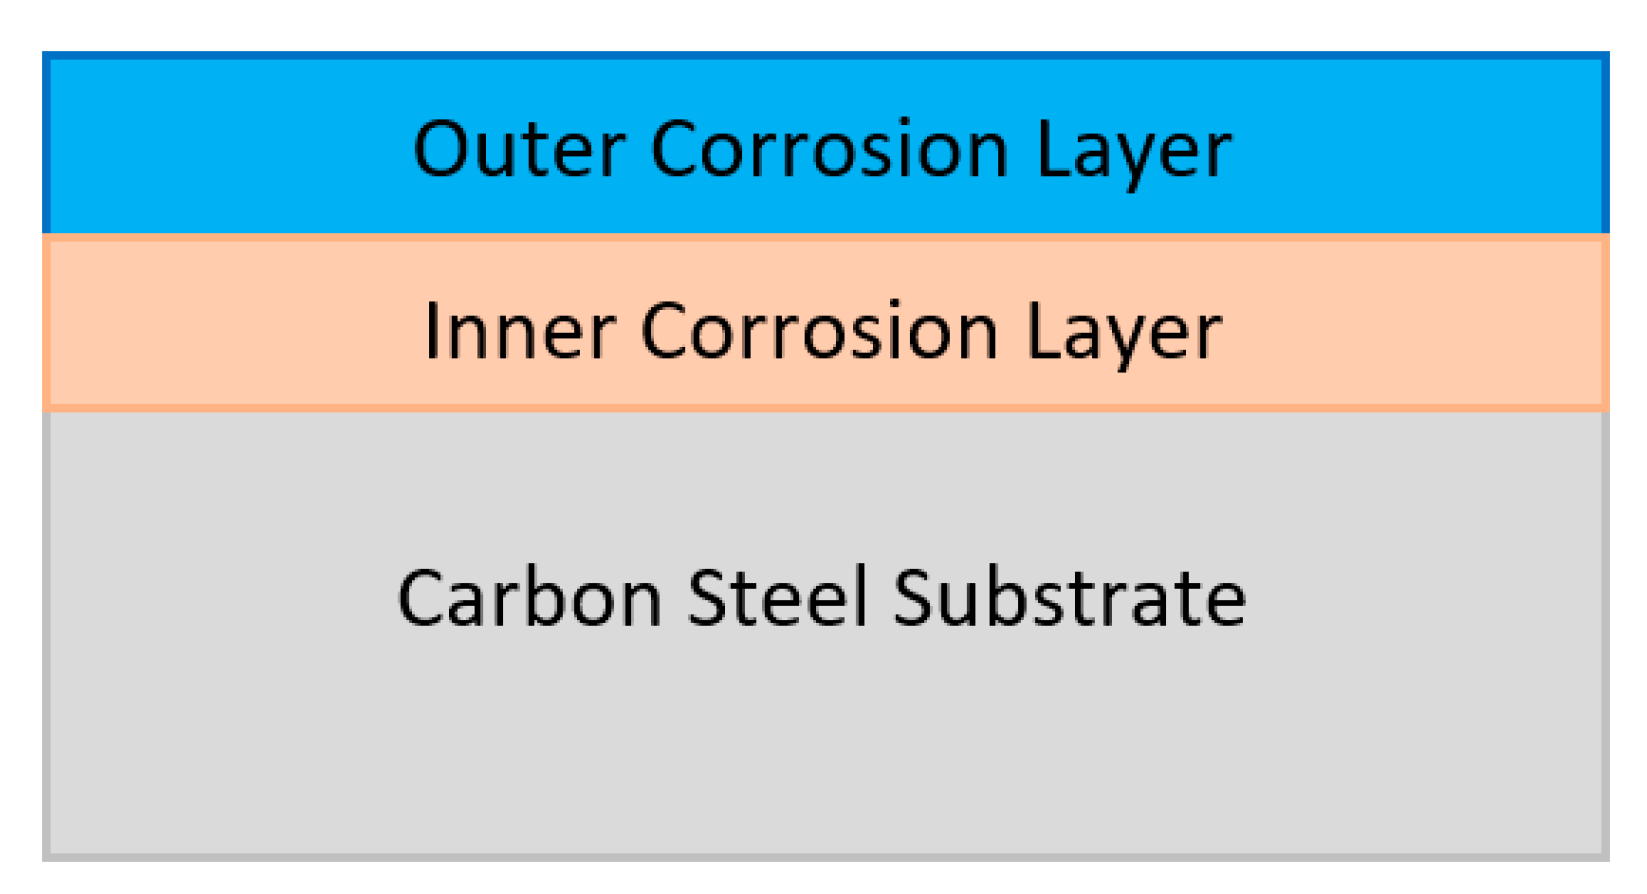
- Two layers of corrosion scales were observed on the top of the steel surface with different thicknesses and adherent properties at different pH values;
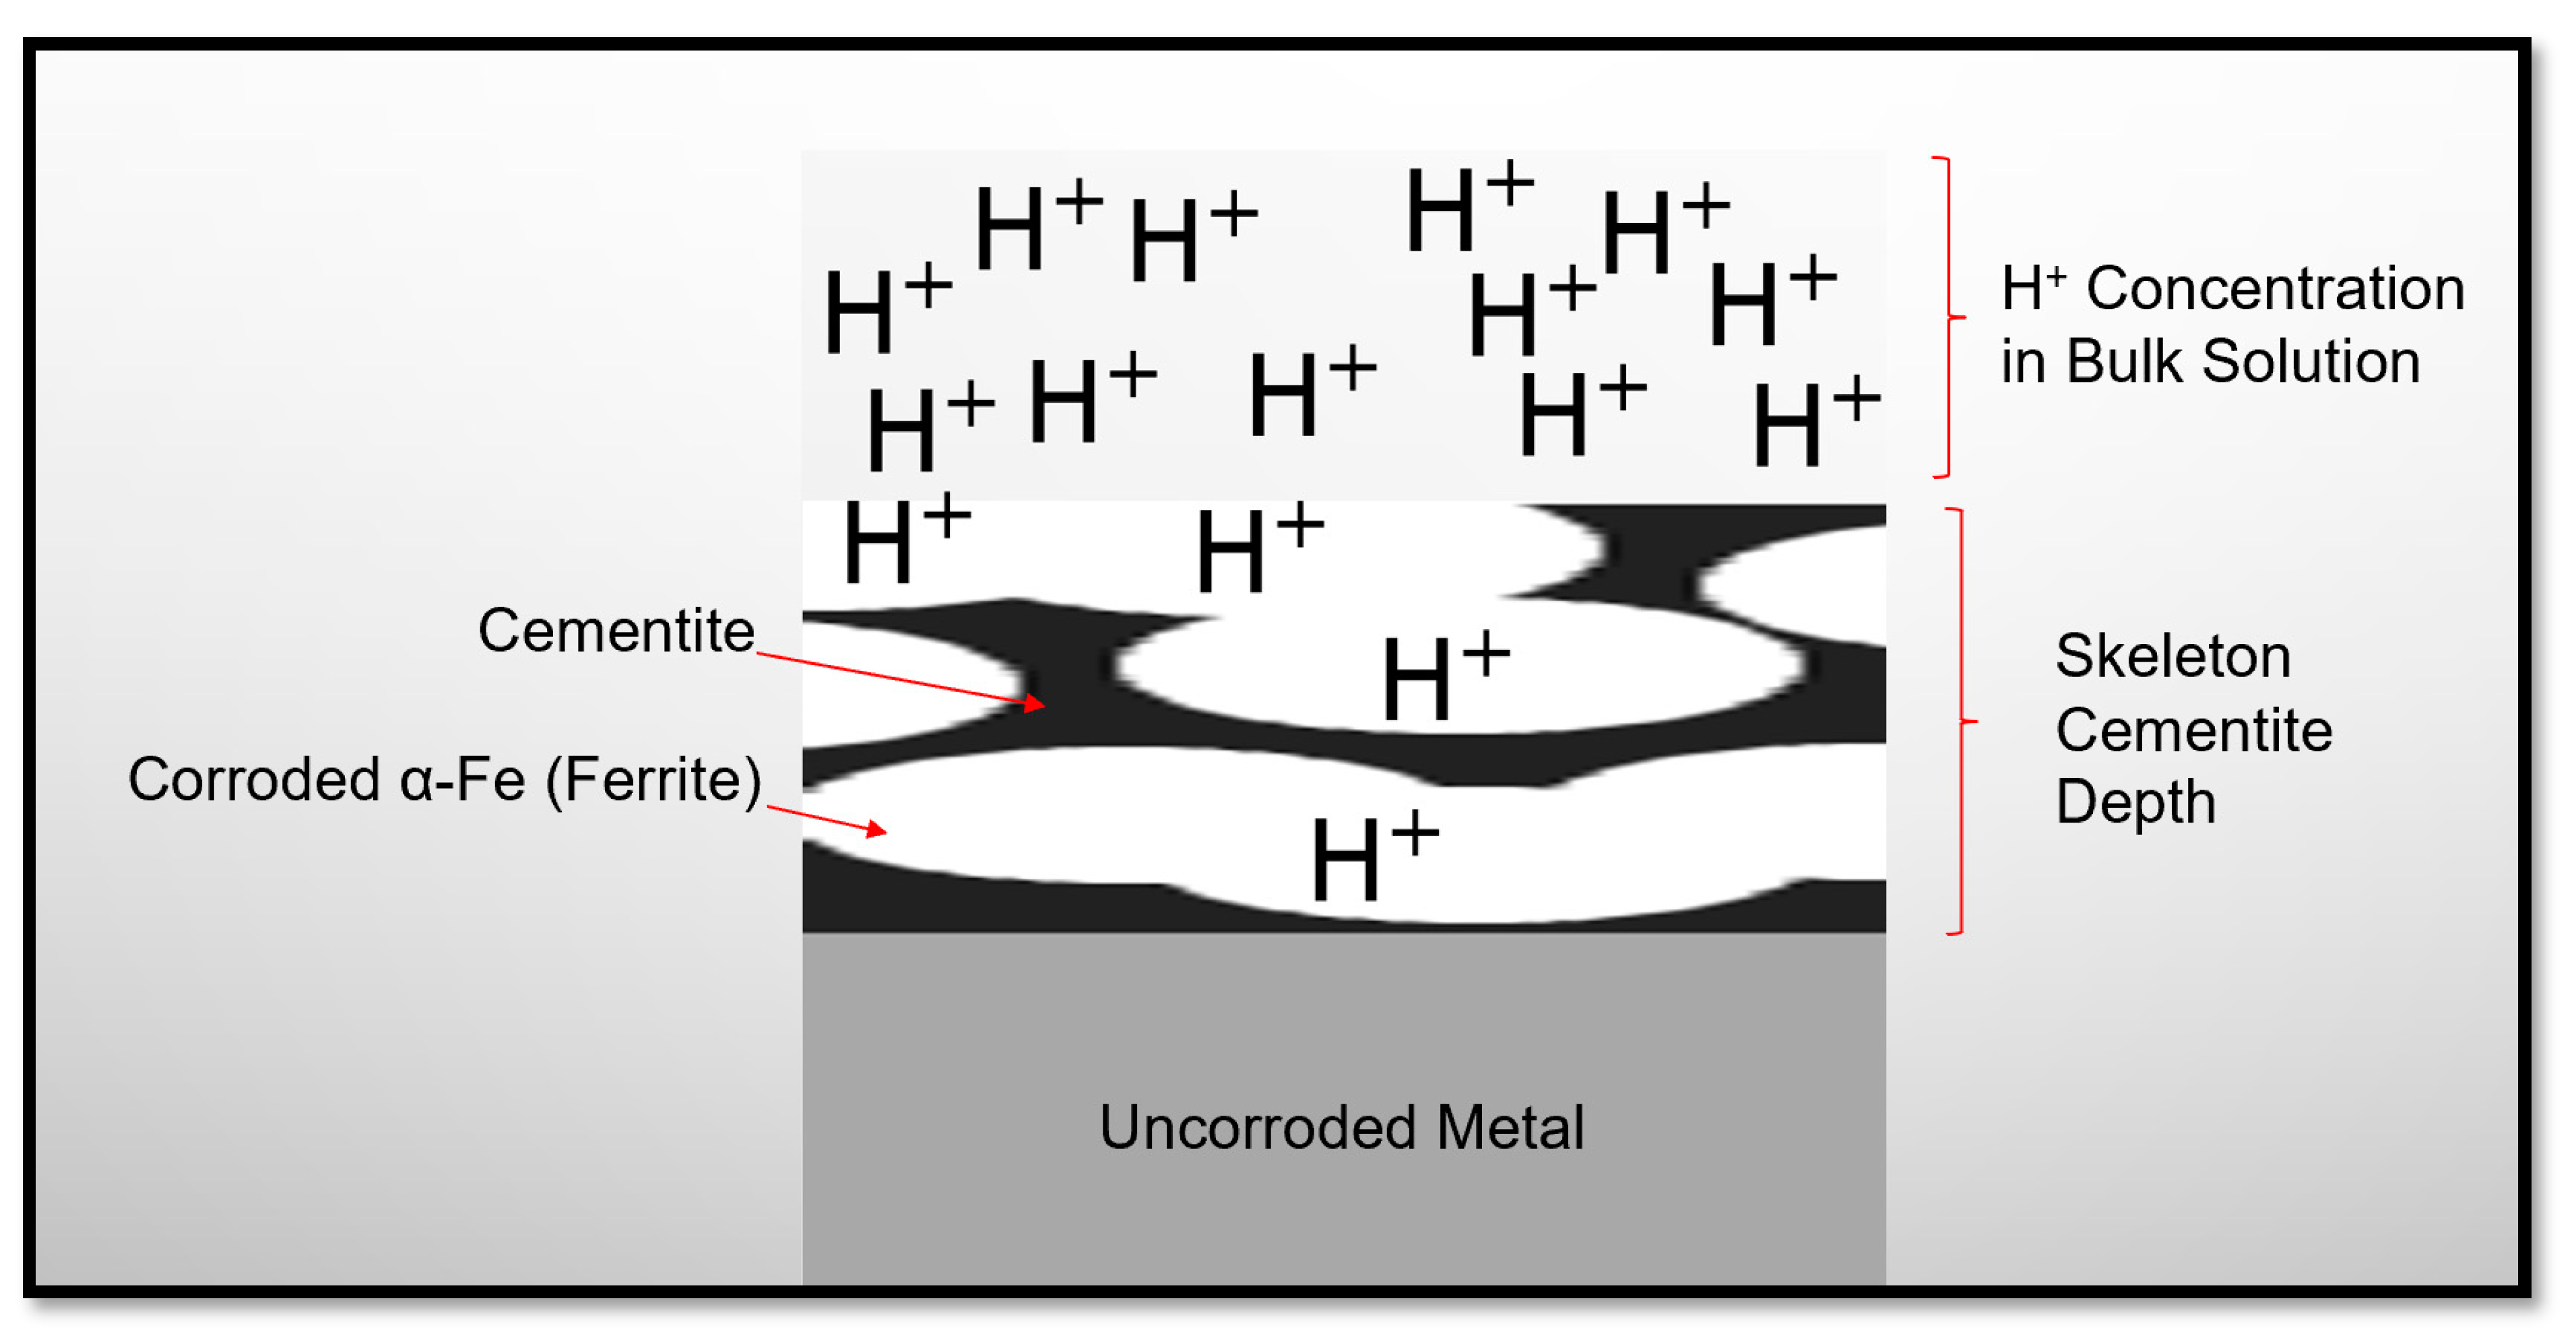
- Cementite (Fe3C) and magnetite (Fe3O4) were present in the corrosion scales formed on specimen surfaces;
- The highest CO2 erosion–corrosion was observed at an impingement angle of 45° due to the balance between normal and shear stresses which resulted in deeper erosion than that observed at an impingement angle of 15°;
- The CO2 erosion–corrosion rate increased with an increase in impingement velocity due to the increased loading of corrosive spices and higher stresses induced by turbulence flow;
- All specimens tested in the presence of sand particles exhibited much higher CO2 EC rates than those tested without sand due to the erosion effect of impinging sand particles.
Author Contributions
Funding
Acknowledgments
Conflicts of Interest
References
- Lu, S.; Liu, W.; Zhang, S.; Qi, X.; Li, X.; Wang, X. Corrosion performance of carbon steel in CO2 aqueous environment containing silty sand with different sizes. Acta Metall. Sin. 2017, 30, 1055–1066. [Google Scholar] [CrossRef] [Green Version]
- Liu, W.; Lu, S.; Zhang, P.; Dou, J.; Zhao, Q. Effect of silty sand with different sizes on corrosion behavior of 3Cr steel in CO2 aqueous environment. Appl. Surf. Sci. 2016, 379, 163–170. [Google Scholar] [CrossRef]
- Parsi, M.; Najmi, K.; Najafifard, F.; Hassani, S.; McLaury, B.S.; Shirazi, S.A. A comprehensive review of solid particle erosion modeling for oil and gas wells and pipelines applications. J. Nat. Gas Sci. Eng. 2014, 21, 850–873. [Google Scholar] [CrossRef]
- Luqman, A.; Moosavi, A. The impact of CO2 injection for EOR & its breakthrough on corrosion and integrity of new and existing facilities. In Society of Petroleum Engineers—Abu Dhabi International Petroleum Exhibition and Conference 2016 (Vol. 2016-January); Society of Petroleum Engineers: Abu Dhabi, UAE, 2016. [Google Scholar] [CrossRef]
- Sun, Y.; Nesic, S. Parametric Study and Modeling on Localized CO2 Corrosion in Horizontal Wet Gas Flow; NACE International: New Orleans, LA, USA, 2004. [Google Scholar]
- Hu, X.; Neville, A. CO2 erosion-corrosion of pipeline steel (API X65) in oil and gas conditions-A systematic approach. Wear 2009, 267, 2027–2032. [Google Scholar] [CrossRef]
- API. Damage Mechanisms Affecting Fixed Equipment in the Refining Industry RP 571; American Petroleum Institute: Washington, DC, USA, 2011. [Google Scholar]
- Zhang, G.A.; Cheng, Y.F. Electrochemical characterization and computational fluid dynamics simulation of flow-accelerated corrosion of X65 steel in a CO2-saturated oilfield formation water. Corros. Sci. 2010, 52, 2716–2724. [Google Scholar] [CrossRef]
- Revie, R.W. Uhlig’s Corrosion Handbook the Electrochemical Society Series, 3rd ed.; Uhlig’s Corrosion Handbook: Hoboken, NJ, USA, 2011; pp. 1–20. [Google Scholar]
- Emerson, S.; Hedges, J. Chemical Oceanography and the Marine Carbon Cycle; Cambridge University Press: Cambridge, UK, 2011. [Google Scholar]
- Hassani, S.; Roberts, K.P.; Shirazi, S.A.; Shadley, J.R.; Rybicki, E.F.; Joia, C. Flow loop study of NaCl concentration effect on erosion, corrosion, and erosion-corrosion of carbon steel in CO2-saturated systems. Corrosion 2012, 68, 026001-1. [Google Scholar] [CrossRef]
- Yu, B.; Li, D.Y.; Grondin, A. Effects of the dissolved oxygen and slurry velocity on erosion-corrosion of carbon steel in aqueous slurries with carbon dioxide and silica sand. Wear 2013, 302, 1609–1614. [Google Scholar] [CrossRef]
- Hamzah, R.; Stephenson, D.J.; Strutt, J.E. Erosion of material used in petroleum production. Wear 1995, 186, 493–496. [Google Scholar] [CrossRef]
- Shadley, J.R.; Shirazi, S.A.; Dayalan, E.; Ismail, M.; Rybicki, E.F. Erosion-Corrosion of a Carbon Steel Elbow in a Carbon Dioxide Environment. Corrosion 1996, 52, 714–723. [Google Scholar] [CrossRef]
- Burstein, G.T.; Sasaki, K. Effect of impact angle on the slurry erosion-corrosion of 304L stainless steel. Wear 2000, 240, 80–94. [Google Scholar] [CrossRef]
- Nassef, A.S.; Keller, M.W.; Roberts, K.P.; Iski, E.V.; Rybicki, E.F.; Shirazi, S.A. Erosion-Corrosion of Low Carbon Steel Inhibition in Oil-Brine-Sand Flow; NACE Paper 7426; NACE International Corrosion: Vancouver, BC, Canada, 2016. [Google Scholar]
- Nassef, A.S.; Banazadeh-Neishabori, N.; Keller, M.W.; Roberts, K.P.; Rybicki, E.F.; Iski, E.V.; Shirazi, S.A. Comparison of Erosion Resistance of Iron Carbonate Protective Layer with Calcium Carbonate Particles Versus Sand, SPE-188531-MS. In Proceedings of the Abu Dhabi International Petroleum Exhibition & Conference, Abu Dhabi, UAE, 13–16 November 2017. [Google Scholar]
- Toor, I.U.; Irshad, H.M.; Badr, H.M.; Samad, M.A. The effect of impingement velocity and angle variation on the erosion corrosion performance of API 5L-X65 carbon steel in a flow loop. Metals 2018, 8, 402. [Google Scholar] [CrossRef] [Green Version]
- Neville, A.; Hodgkiess, T.; Dallas, J.T. A study of the erosion-corrosion behaviour of engineering steels for marine pumping applications. Wear 1995, 186, 497–507. [Google Scholar] [CrossRef]
- Stack, M.M.; Zhou, S.; Newman, R.C. Identification of transitions in erosion-corrosion regimes in aqueous environments. Wear 1995, 186, 523–532. [Google Scholar] [CrossRef]
- Islam, M.A.; Farhat, Z.N. The synergistic effect between erosion and corrosion of API pipeline in CO2 and saline medium. Tribol. Int. 2013, 68, 26–34. [Google Scholar] [CrossRef]
- ASTM. G73-98, Standard Practice for Liquid Impingement Erosion Testing; ASTM International: West Conshohocken, PA, USA, 1998. [Google Scholar]
- Xia, Z.; Chou, K.C.; Szklarska-Smialowska, Z. Pitting corrosion of carbon steel in CO2-containing NaCl brine. Corrosion 1989, 45, 636–642. [Google Scholar] [CrossRef]
- Pessu, F.; Barker, R.; Neville, A. The influence of pH on localized corrosion behavior of X65 carbon steel in CO2-saturated brines. Corrosion 2015, 71, 1452–1466. [Google Scholar] [CrossRef]
- Li, S.; Zeng, Z.; Harris, M.A.; Sánchez, L.J.; Cong, H. CO2 corrosion of low carbon steel under the joint effects of time-temperature-salt concentration. Front. Mater. 2019, 6, 10. [Google Scholar] [CrossRef]
- Ruiz-Baltazar, A.; Esparza, R.; Rosas, G.; Pérez, R. Effect of the Surfactant on the Growth and Oxidation of Iron Nanoparticles. J. Nanomater. 2015, 2015, 240948. [Google Scholar] [CrossRef]
- Nesic, S.; Lee, K.-L.J. A Mechanistic Model for Carbon Dioxide Corrosion of Mild Steel in the Presence of Protective Iron Carbonate Films—Part 3: Film Growth Model. Corrosion 2003, 59, 616–628. [Google Scholar] [CrossRef] [Green Version]
- Benezeth, P.; Dandurand, J.L.; Harrichoury, J.C. Solubility product of siderite (FeCO3) as a function of temperature (25–250 °C). Chem. Geol. 2009, 265, 3–12. [Google Scholar] [CrossRef]
- Tanupabrungsun, T. CO2 Corrosion of Mild Steel at Elevated Temperatures. Ph.D. Thesis, Russ College of Engineering and Technology of Ohio University, Athens, OH, USA, 2013. [Google Scholar]
- Berntsen, T.; Seiersten, M.; Hemmingsen, T. Effect of FeCO3 Supersaturation and Carbide Exposure on the CO2 Corrosion Rate of Carbon Steel. Corrosion 2013, 69, 601–613. [Google Scholar] [CrossRef] [Green Version]
- Mora-Mendoza, J.L.; Turgoose, S. Fe3C influence on the corrosion rate of mild steel in aqueous CO2 systems under turbulent flow conditions. Corros. Sci. 2002, 44, 1223–1246. [Google Scholar] [CrossRef]
- Kakooei, S.; Ismail, M.C.; Ari-Wahjoedi, B. Surface pH Measurement during CO2 Corrosion by an IrOx pH Probe. Adv. Mater. Res. 2016, 1133, 381–385. [Google Scholar] [CrossRef]
- Hu, H.; Cheng, Y.F. Modeling by computational fluid dynamics simulation of pipeline corrosion in CO2-containing oil-water two phase flow. J. Pet. Sci. Eng. 2016, 146, 134–141. [Google Scholar] [CrossRef]


| Effect | without Sand | with Sand |
|---|---|---|
| Coloring | Dark coloring was observed, almost in all images | Dark coloring was observed only for pH 5.0 and 5.5. Coloring intensity ↑ as V ↑. |
| Velocity Effect Scars | Number of scars ↑ as V ↑. | Number of scars ↓ as V ↑. |
| Pitting | Higher | Lower |
© 2020 by the authors. Licensee MDPI, Basel, Switzerland. This article is an open access article distributed under the terms and conditions of the Creative Commons Attribution (CC BY) license (http://creativecommons.org/licenses/by/4.0/).
Share and Cite
Toor, I.U.; Alashwan, Z.; Badr, H.M.; Ben-Mansour, R.; Shirazi, S.A. Effect of Jet Impingement Velocity and Angle on CO2 Erosion–Corrosion with and without Sand for API 5L-X65 Carbon Steel. Materials 2020, 13, 2198. https://doi.org/10.3390/ma13092198
Toor IU, Alashwan Z, Badr HM, Ben-Mansour R, Shirazi SA. Effect of Jet Impingement Velocity and Angle on CO2 Erosion–Corrosion with and without Sand for API 5L-X65 Carbon Steel. Materials. 2020; 13(9):2198. https://doi.org/10.3390/ma13092198
Chicago/Turabian StyleToor, Ihsan Ulhaq, Zakariya Alashwan, Hassan Mohamed Badr, Rached Ben-Mansour, and Siamack A. Shirazi. 2020. "Effect of Jet Impingement Velocity and Angle on CO2 Erosion–Corrosion with and without Sand for API 5L-X65 Carbon Steel" Materials 13, no. 9: 2198. https://doi.org/10.3390/ma13092198