1. Introduction
The strength of Ni
3Al-based alloy is primarily derived from the coherent L1
2-γ’ precipitates, which are embedded in a face-centered cubic (fcc) γ-Ni matrix. The morphology and distribution of γ’ precipitates have a significant impact on the mechanical properties and hardness of Ni-based superalloys [
1,
2,
3,
4,
5]. As documented in numerous studies, γ’ precipitates as a main microstructural characteristic of Ni-based superalloys are not stable at elevated temperatures [
6,
7,
8,
9]. Smaller γ’ precipitates with a large surface-area-to-volume ratio will grow to a smaller number of larger γ’ precipitates at high temperatures, in order to decrease the total energy of the system by decreasing interfacial energy. This process is realized by the solute diffusion, and this diffusion process is referred to as coarsening or Ostwald ripening [
10,
11]. With increasing the service temperature and time of superalloys, some neighboring γ’ precipitates even coalesce to further decrease the total energy of system [
12].
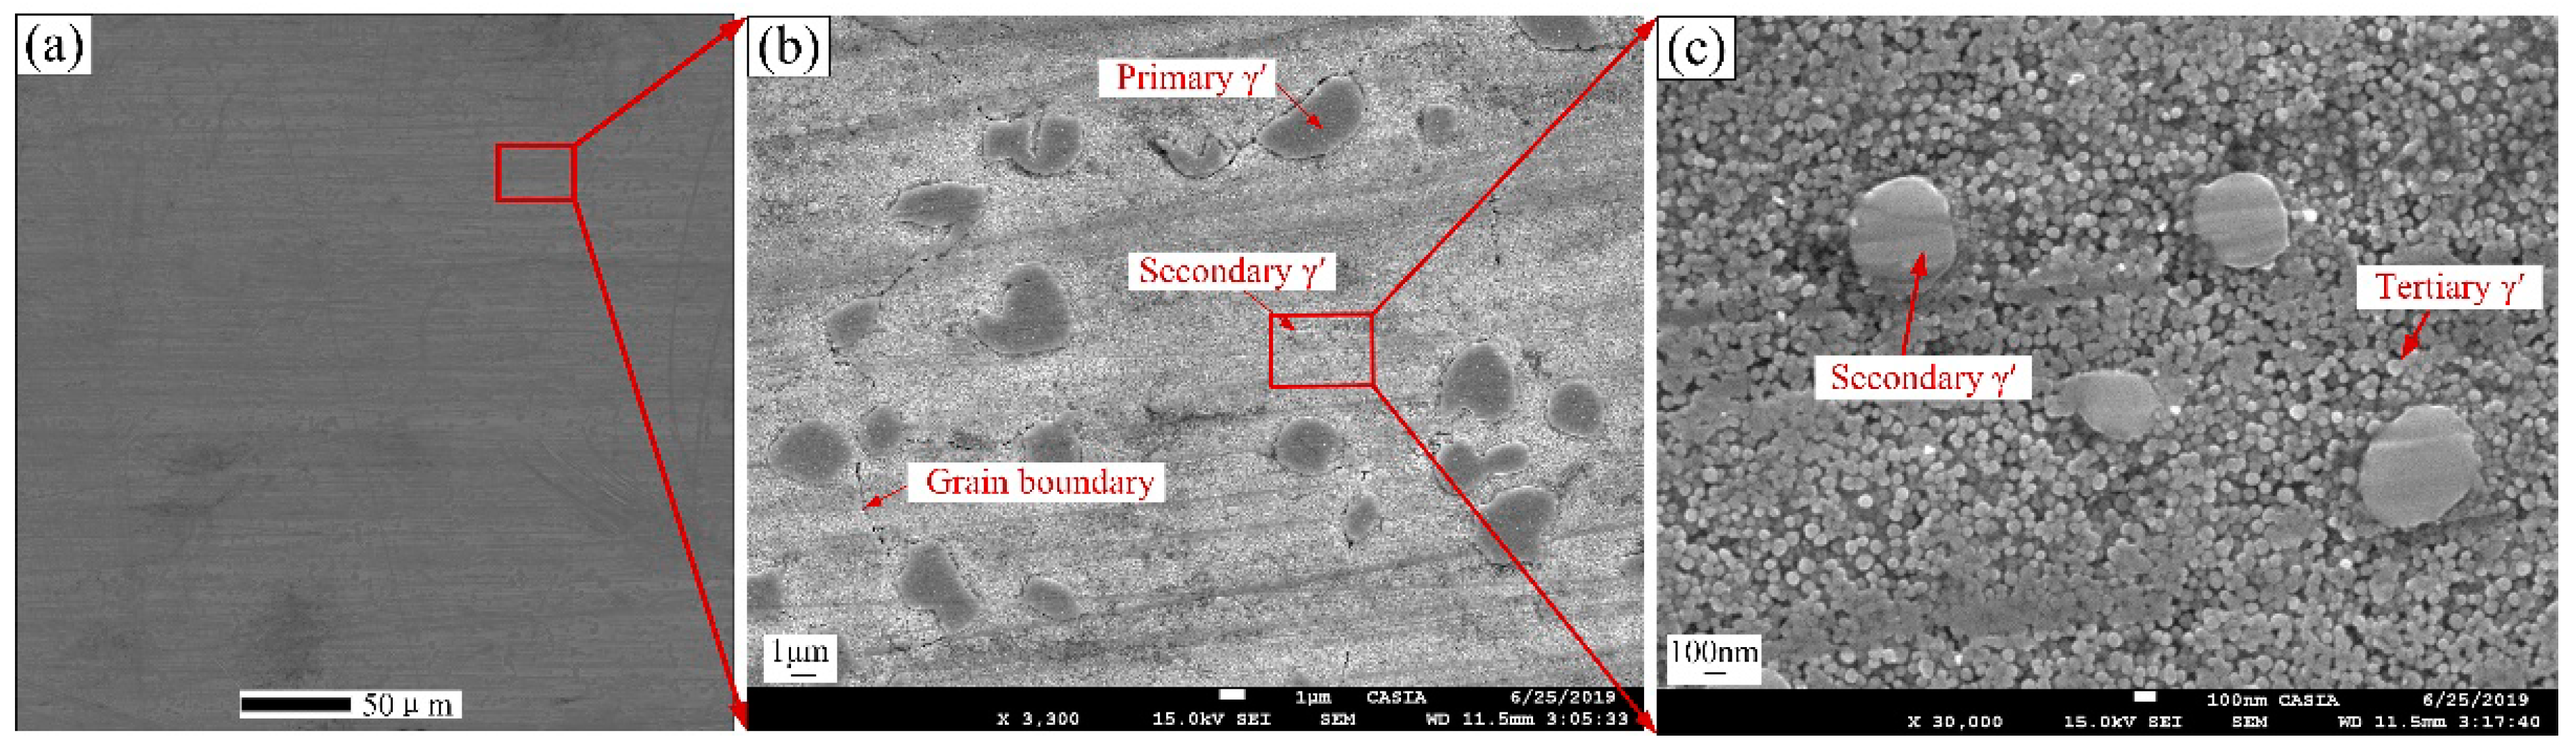
A polycrystalline Ni-based superalloy GH4720Li, with good high-temperature strength [
13], has been extensively applied to make aero-engine turbine disks working at temperatures of about 600 °C–750 °C. In this alloy, multiple generations of γ’ precipitates can be formed during heat treatment with slow cooling rates, including the primary, secondary and tertiary γ’ precipitates. The largest primary γ’ precipitates are present when precipitates are not completely dissolved during the subsolvus solution heat treatment. The secondary and tertiary γ’ precipitates are formed by two nucleation bursts during slow cooling [
14]. The γ’ coarsening behaviors in this alloy have been studied extensively, and many quantitative studies have been performed during various heat treatment processes [
15,
16]. The γ’ precipitates in this alloy will be largely dissolved during solution treatment at temperatures above 1140 °C. Their average size increases and volume fraction decrease with increasing the solutioning temperature. The size and morphology of secondary γ’ precipitates can be significantly influenced by the cooling rate after the solution treatment. The size of secondary γ’ precipitates increases significantly with decreasing the cooling rate, and the morphology changes from fine spherical particles to large irregular-shaped particles with slower cooling rates. The size of tertiary γ’ precipitates increases during aging. However, there is few quantitative data on the precipitate stability of GH4720Li alloy at service temperatures for a long time. For Ni-based superalloys, the γ’ precipitates strengthen the hardness of alloys, and the morphology and distribution of γ’ precipitates have significant effects on the hardness [
17,
18,
19]. The depletion and coarsening of γ’ precipitates decrease the hardness of alloys, whereas the recovery and recrystallization increasing the number of the γ’ precipitates increase the alloy hardness. However, there is no hardness model which could correlate the hardness and the γ’ morphology, in order to predict the hardness of Ni-based superalloys with different microstructures.
Precise recognition and segmentation of γ’ precipitates from large quantities of scanning electron microscope (SEM) images is the most important step for extracting morphological parameters of γ’ precipitates to quantitatively study the precipitate stability and the related properties of alloys. The common approach to segment γ’ precipitates is simple thresholding, which is effective when there have obvious differences in the gray value between target and background. The quantitative parameters of γ’ precipitates in Ni-based superalloys are obtained mostly by this approach. However, this approach is not suitable for distinguishing different generations of γ’ precipitates in Ni-based superalloys, which have similar gray values. It needs a lot of manual interventions during thresholding [
10], resulting in unpredicted errors. Furthermore, when there are too many SEM images or each SEM image contains too much information, this work will take a very long time and a high labor cost. Other experimental methods can also be applied to distinguish different phases of alloys based on the difference of their compositions or structures in order to obtain the sizes or volume fractions of the phases, such as EDX elemental mapping [
20], X-ray diffraction (XRD). But these experimental methods will take a high cost and the results are not accurate. Moreover, these methods are also difficult to distinguish different generations of γ’ precipitates which are the same phase with different size distributions.
Deep learning has become a strong tool for automatic image segmentation and achieved the state-of-the-art results. The convolutional neural networks (CNNs) use relatively little pre-processing and automatically learn representative complex features directly from the data itself. Therefore, CNNs have been widely applied to segment the various medical images [
21,
22]. However, CNNs have size requirement for the input images, and the calculation is inefficient. Jonathan Long et al. [
23] proposed the fully convolutional networks (FCNs), which were first trained end-to-end, pixels-to-pixels on semantic segmentation. Moreover, FCNs can be used to segment arbitrarily large images. Olaf Ronneberger et al. [
24] modified and extended the architecture of fully convolutional network and proposed a U-Net convolutional neural network (U-Net). This strategy also allows the seamless segmentation of arbitrarily large images. Furthermore, this strategy uses very few training images and yields more precise segmentations.
In this study, γ’ precipitate stability and hardness of GH4720Li alloy are investigated in the temperature range from 630 °C to 760 °C for 500–2500 h. The experimental temperatures are determined based on the service temperature of the turbine disk. It is very difficult to accurately and quickly segment different generations of γ’ precipitates from massive SEM images, and the problem has not been solved properly in open literatures. In this paper, a new strategy is proposed to apply learning method to segment γ’ precipitates from the extremely large-area SEM images and then obtain their sizes and area fractions. Based on the obtained data, a microstructure-related hardness model is established, which can correlate the microstructure and the hardness of the γ’/γ coherent structures of Ni-based alloys. To the authors’ knowledge, it is the first time to employ a deep learning algorithm to automatically segment γ’ precipitates and extract their parameters to quantitative research, which could greatly promote the application of deep learning in materials science.
2. Materials and Experimental Methods
The cuboid-shaped samples of GH4720Li superalloy with size of 30 mm × 5 mm × 5 mm were used for thermal exposure tests, and the experimental parameters are shown in
Table 1. The microstructure of sample at initial condition was characterized as the data at time 0 h of the thermal exposure tests. After the tests, the cuboid samples at initial condition and after different tests were grinded and mechanically polished, then they were electro-etched by a solution of 15 g CrO
3 + 10 mL H
2SO
4 + 150 mL H
3PO
4 with voltage of 5 V to emerge the γ’ precipitates of the alloy. Subsequently, the γ’ evolution was observed by Zeiss SUPRA55 field emission scanning electron microscope (Carl Zeiss, Jena, Germany) with ATLAS (AuTomated Large Area Scanning, Carl Zeiss, Jena, (TH), Germany) integrated module, which can be used to automatically and quickly detect a wider range of microstructures and produce high-resolution large area images. Because of the inhomogeneous distribution of primary and secondary γ’ precipitates in GH4720Li alloy, the large-area SEM images could ensure the statistical accuracy of parameters. The pixel size of each large-area SEM image is 10 nm. For the digital images, the number of pixels is usually expressed in units of K (1024 pixels) [
25]. The area of each SEM image is 32 K pixels × 32 K pixels, corresponding to 327.68 μm × 327.68 μm. Each large-area SEM image contains at least 2300 primary γ’ precipitates and at least 3500 secondary γ’ precipitates. In addition, some small SEM images are used in this paper to show the γ’ morphologies under different test conditions.
After the different thermal exposure tests, the nanoindentation experiments were performed to test the nanoindentation hardness of the γ’/γ coherent structure inside grains of the alloy. The nanoindentation experiments were carried out using a Bruker UMT-2 nanoindenter (Bruker Nano Inc., Campbell, CA, USA) with a load force of 50 mN. Each sample was tested 5 times at different positions of samples, and all indentations were made in the interior of grains. The effect of carbides can be avoided by selecting proper test positions.
3. Segmentation of γ’ Precipitates Using U-Net
The U-Net model [
24] is employed to recognize and segment different generations of γ’ precipitates from 2D SEM images. Then the morphological parameters of each γ’ precipitate including diameter
d and area
Aj are calculated in order to quantitatively describe the γ’ morphology during thermal exposure. The equivalent circular-area diameter is calculated as the diameter
d of γ’ precipitate [
26]. Finally, the average diameter
and the area fraction
of different generations of γ’ precipitates are calculated respectively using Equations (1) and (2).
where
N is the number of one kind of γ’ precipitates in the large-area SEM image.
Aj is the area of the
j-th γ’ precipitate.
A is the area of the large-area SEM image.
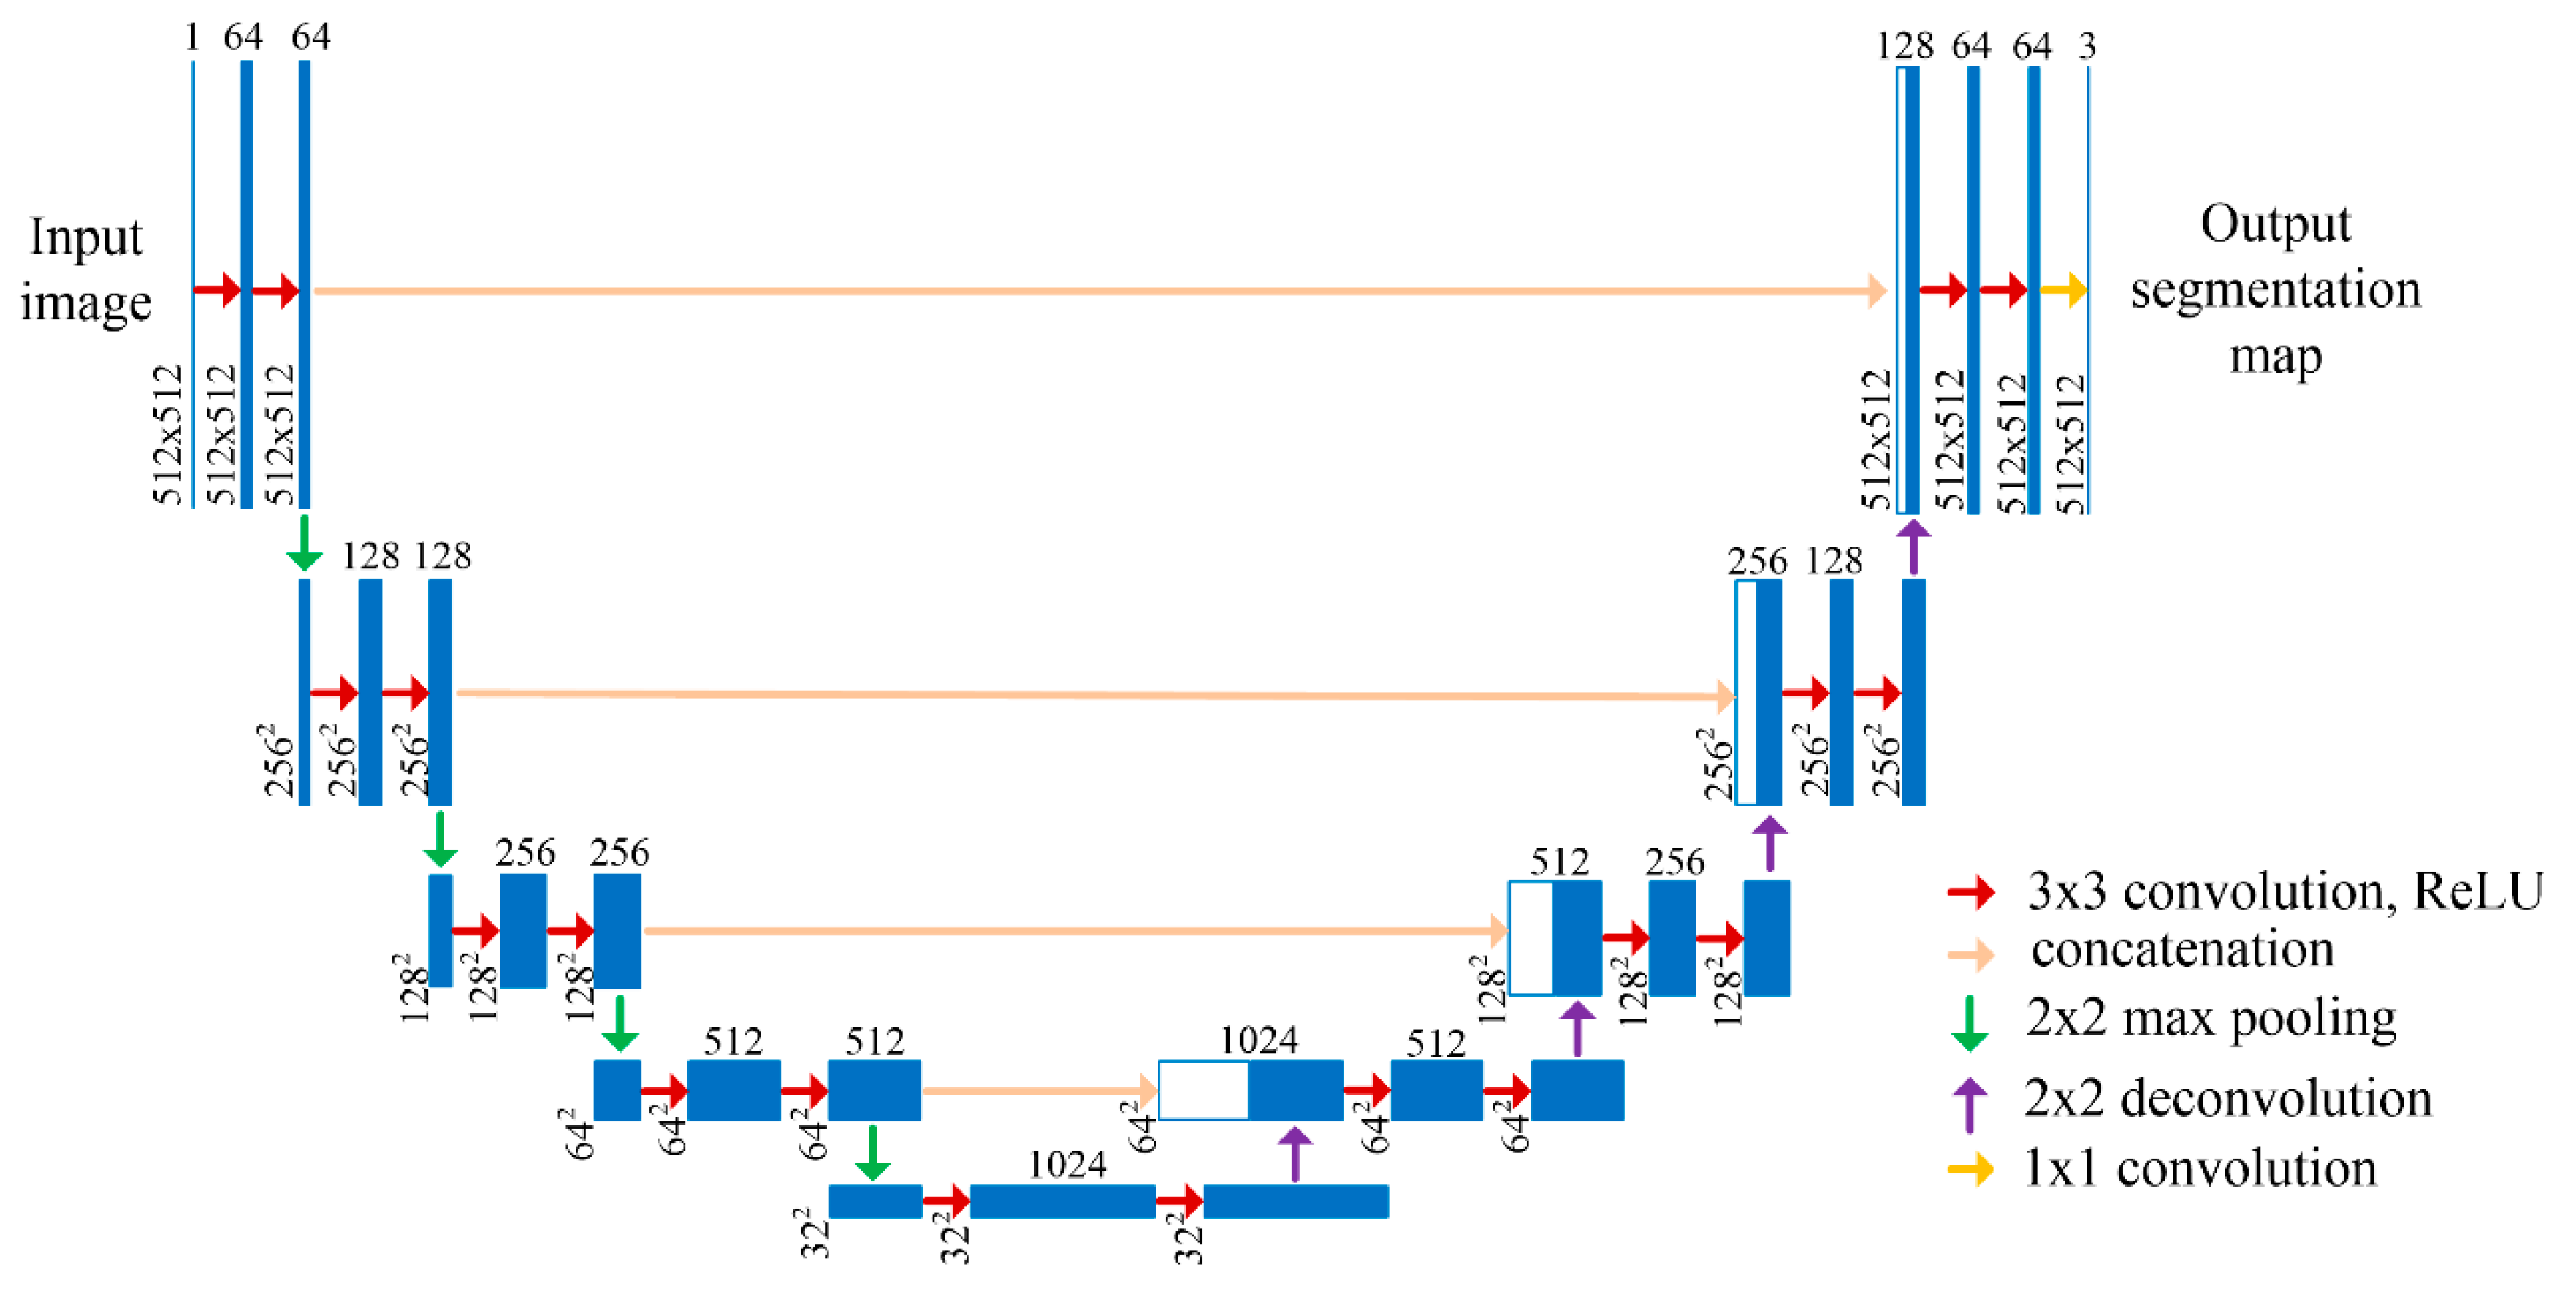
The U-Net architecture consists of a contracting path and an expansive path as shown in
Figure 1. There are 23 convolutional layers in the U-Net network. The contracting path is used to extract a hierarchy of increasingly complex features from input images. The contracting path consists of the repeated application of two 3 × 3 convolutions with stride 1, each followed by a ReLU activation function and a 2 × 2 max pooling operation with stride 2 for downsampling. The number of feature channels is doubled at each downsampling step. The expansive path takes the feature representation and recovers the feature maps to the input dimensions, realizing pixel prediction in the original image. The expansive path consists of the repeated application of a 2 × 2 deconvolution which upsamples the feature maps and halves the number of feature channels, a concatenation with the correspondingly cropped feature map from the contracting path to improve the prediction accuracy, and two 3 × 3 convolutions, each followed by a ReLU. Then 64-component feature vectors can be produced after repeating these steps 4 times in the expansive path. At the final layer a 1 × 1 convolution is used to map each output feature vector to the desired number of classes. In addition, in order to ensure the size of input images and output images are same, this paper uses the U-Net network with padding, and the padding value is 1 [
27].
After pixel prediction, the parameters of each γ’ precipitate can be calculated based on the pixel size.
4. Dataset and Training
There are 17 large-area SEM images under initial condition and different test conditions. These large-area SEM images with the size of 32 K × 32 K pixels are used as the dataset to train and test. Before running the program for image segmentation, each large-area SEM image is cut and resized to 512 × 512 pixels for ease of computation. These cut images as inputs are split into training (80%) and testing (20%) data sets. The algorithm is executed based on the open code of the U-Net [
28].
The input images and their corresponding segmentation maps are used to train the U-Net model. In this model, the loss function of softmax cross-entropy loss is selected, which combines the softmax function with the cross entropy loss function [
29,
30]. The softmax function is defined as Equation (3) to calculate the predicted class score at each pixel position. Then the cross entropy is used to penalize the deviation of predicted class scores from the true class scores at all pixel positions, which is expressed as Equation (4). The training process is to obtain the appropriate model parameters by minimizing the loss function.
where
ai(
x) denotes the activation in feature channel
i at the pixel position
x,
x∈Ω.
K is the number of classes,
pi(
x) is the predicted class score of pixel
x belong to
i-th category.
.
li is the true class score of pixel
x belong to
i-th category. If pixel
x belongs to
i-th category,
li = 1 and
ln = 0 for
n ≠
i. Therefore,
,
l(
x) is the true label of the pixel
x.
is a weight of pixel
x, which is introduced to give the different importance for each pixel.
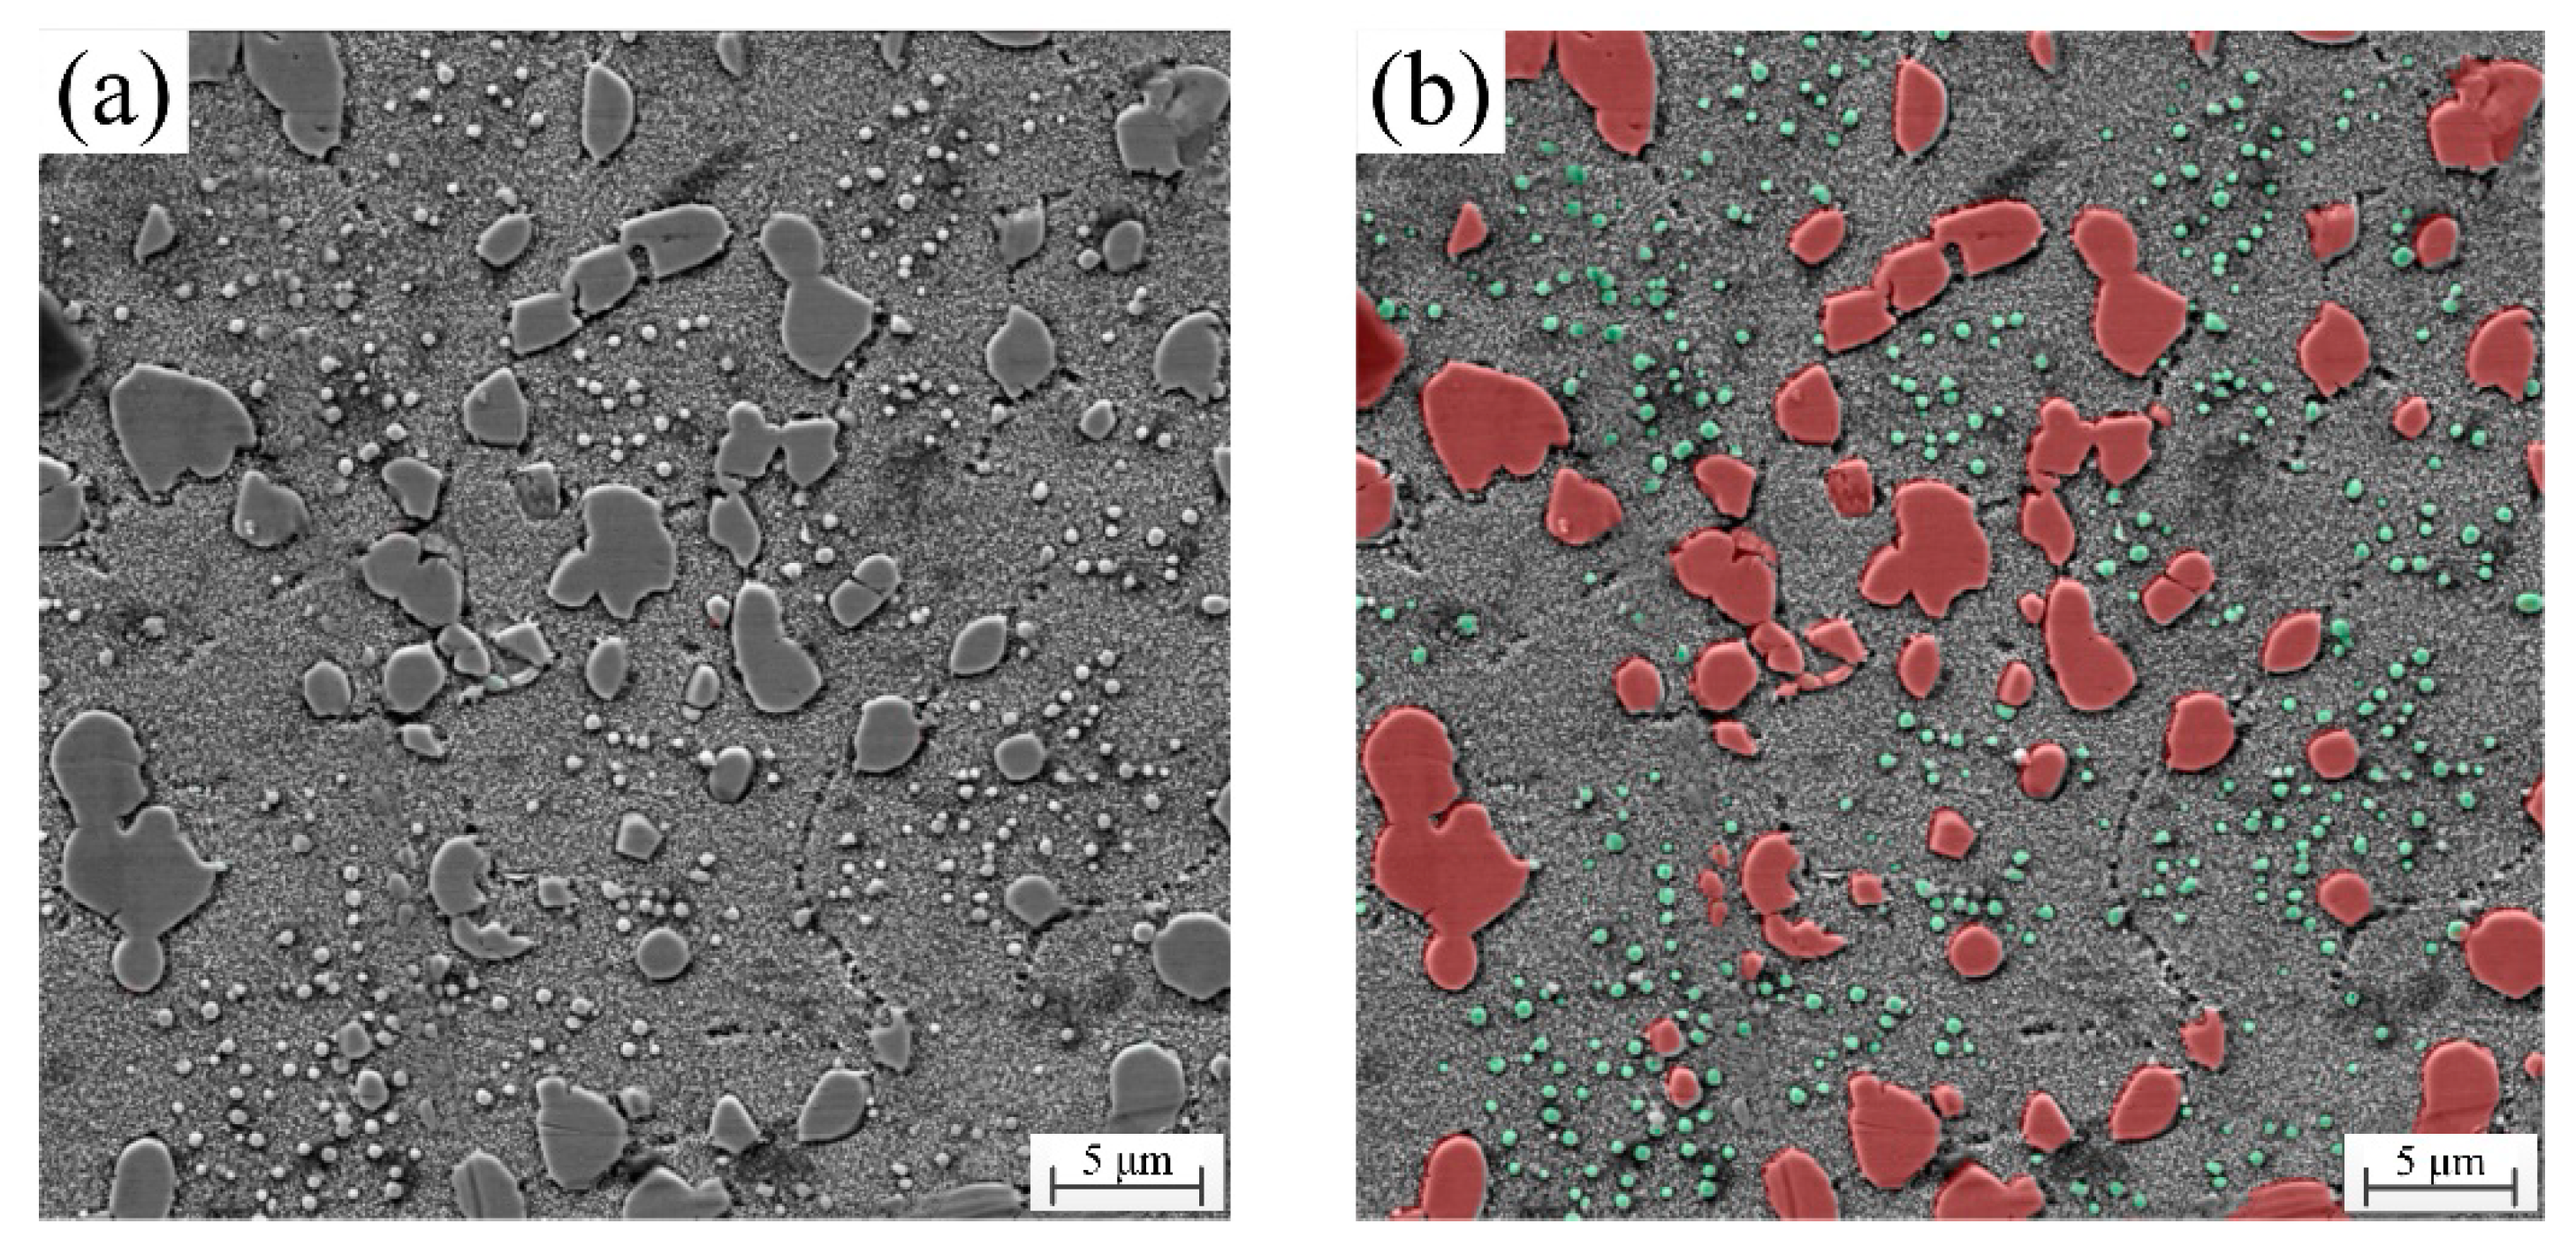
The segmented image by the U-Net model is shown in
Figure 2. Red particles are primary γ’ precipitates, and green particles are secondary γ’ precipitates. Other areas are fine tertiary γ’ precipitates and γ matrix.
Figure 2 shows that primary and secondary γ’ precipitates have been segmented accurately. The training accuracy is evaluated quantitatively by pixel accuracy (PA) [
31], which computes the proportion of the correctly classified pixels to the total pixels. The calculate equation is expressed as Equation (5). The training process gives a high accuracy of 92.19%, and then the trained model is used to test.
where
K denotes the total number of categories in the image dataset,
ti denotes the total number of pixels belongs to
i-th category, and
nii denotes the number of pixels that belong to
i-th category, and correctly predict as
i-th category.
The U-Net algorithm is not applied to segment fine tertiary γ’ precipitates, because their distribution is too dense and the size is too small, leading low prediction accuracy. Therefore, the average sizes of tertiary γ’ precipitates are calculated after labeling of 1000 tertiary γ’ precipitates.
6. Modeling the Coarsening Kinetics of γ’ Precipitates
The classic Lifshitz–Slyozov–Wagner (LSW) model [
32,
33] is the main approach to predict γ’ coarsening, but this model is strictly applicable when the volume fraction f of γ’ precipitates is small and approaches zero. Then the Lifshitz–Slyozov encounter modified (LSEM) model was developed with the assumption of instantaneous coalescence of γ’ particles, and this model removed the assumption of f = 0 [
34]. The LSEM model also describes a linear relationship between the cube of average precipitate radius and the holding time at a high temperature, which express the coarsening process of γ’ precipitate is controlled by solute diffusion through the matrix. The expression of the LSEM model is given by
where
t is the thermal exposure time,
rt and
r0 are the average radius of γ’ precipitates at time
t and initial time, respectively.
KL is the coarsening rate constant of the LSEM model, which can be calculated by equation as following
where
σ is the surface energy associated with the precipitate-matrix interface,
Vm is the molar volume of γ’ precipitates,
ce is the per mole volume fraction of solute in equilibrium,
D is the temperature-dependent diffusion coefficient.
, where
r is the average precipitate radius, and
rc is the critical radius.
R is the gas constant,
T is the thermodynamic temperature,
γ is a constant factor. The values of parameters
and γ are determined by the given volume fraction of γ’ precipitates.
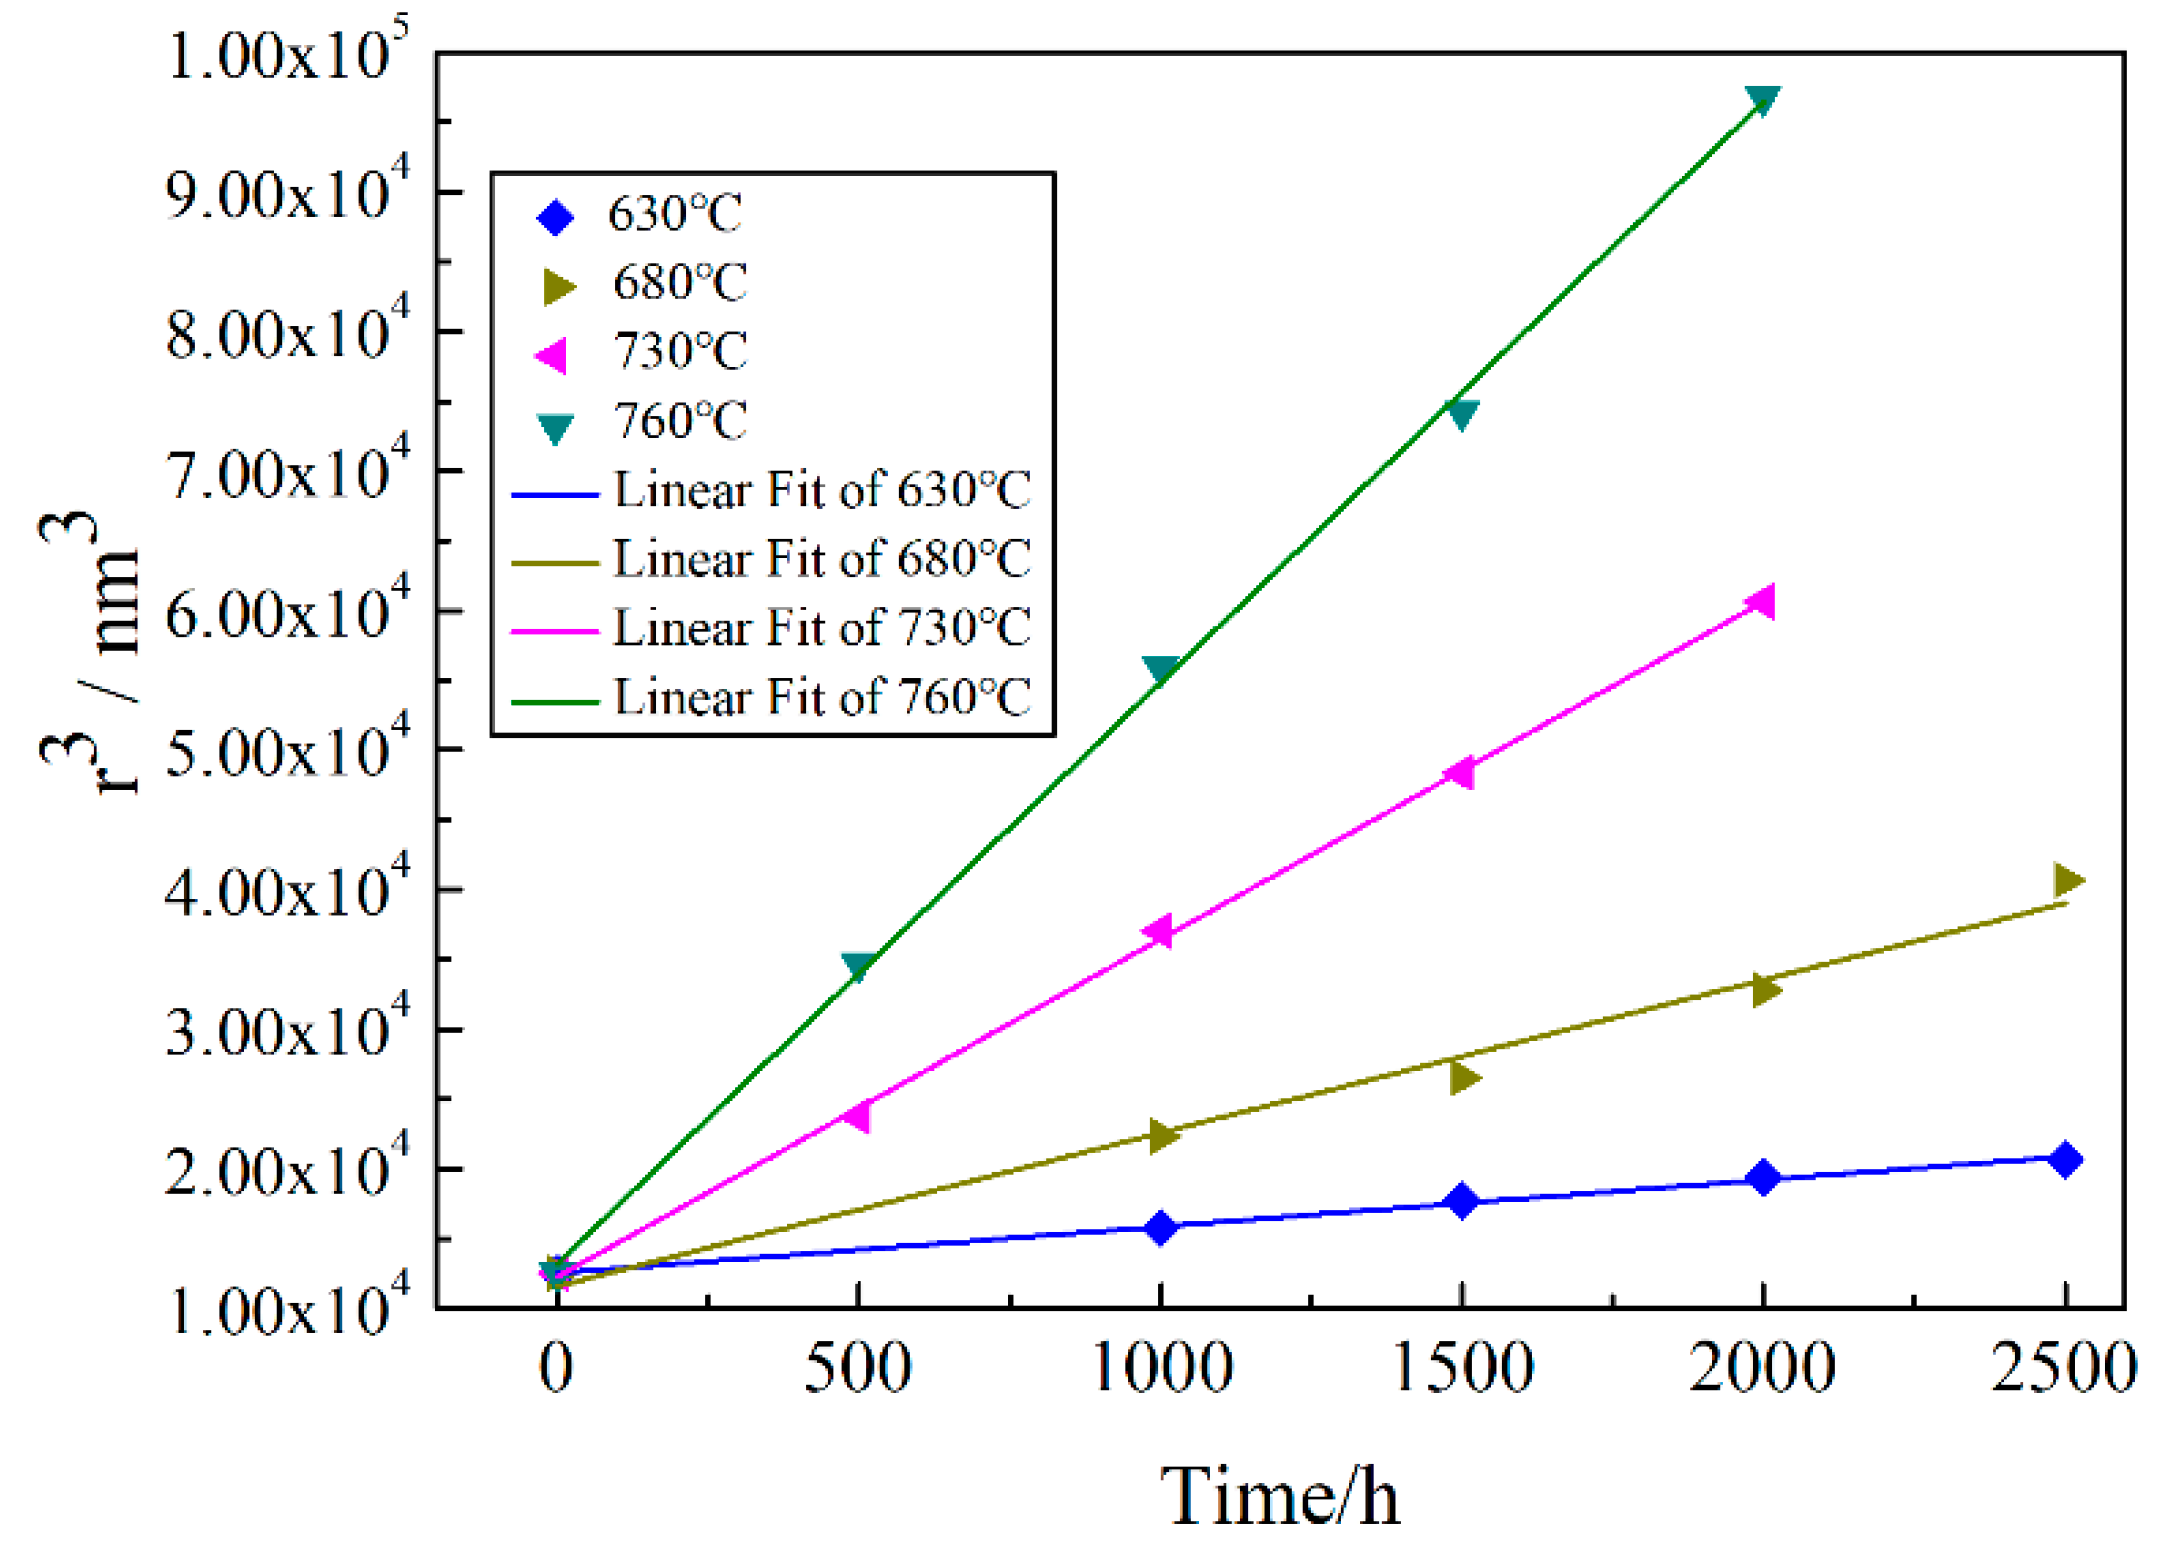
The LSEM model is applied to modeling the coarsening kinetics of tertiary γ’ precipitates during long-term thermal exposure.
Figure 7 shows the linear relationship between the cube of average radius of tertiary γ’ precipitates and the thermal exposure time at temperature ranging from 630 to 760 °C. The coarsening rate
KL is 3.33 nm
3/h at 630 °C, 10.97 nm
3/h at 680 °C, 24.17 nm
3/h at 730 °C and 41.61 nm
3/h at 760 °C. The corresponding fitting parameters
R2 are 0.9956, 0.9805, 0.9992 and 0.9987, respectively, which also proves the growth of tertiary γ’ precipitate is consistent with the matrix-diffusion-controlled coarsening mechanism.
7. A Microstructure-Related Hardness Model
During the thermal exposure, the variations of hardness are caused by the γ’ coarsening in the alloy. The overall nanoindentation hardness of alloys can be divided into two parts [
35]. One is the matrix hardness with the contribution by other sources rather than γ’ precipitates, including solid-solution strengthening, grain boundary strengthening. The contribution of grain boundary strengthening can be ignored because all indentations are made at the interior of grains. The other is the hardness due to the precipitation strengthening. By using Tabor’s empirical relationship Hppt = 3σppt [
18,
36] and σppt = Mτppt [
1], where M is the Taylor factor, which is equal to three for polycrystalline fcc-base alloys, the contributions of precipitation hardening are estimated in terms of the critical resolved shear stress (CRSS). The overall hardness of the alloy is expressed as Equation (8).
where
Htot is the overall hardness of the γ’/γ coherent structures,
Hmat is the hardness which includes the inherent hardness of the γ matrix and the solid-solution strengthening contribution.
Hppt is the hardness due to the precipitation strengthening contribution.
τppt is the CRSS of the bimodal particle system, including secondary and tertiary γ’ precipitates.
For the small γ’ precipitates, the classic precipitation strengthening models are based on the fact that dislocations pair-up to cut through the γ’ precipitates. The leading dislocation cut through the γ’ precipitates and creates the anti-phase boundary, then the trailing dislocation glides in the same plane to remove it. The size and distribution of γ’ precipitates affect the precipitation strengthening by strong coupling and by weak coupling [
37,
38], and it is traditionally assumed that the maximum particle strength occurs when the strong and weak pair-coupling models converge at a constant temperature. The strong and weak-pair coupling configurations are dictated when
r > rm and
r < rm, respectively.
rm is the precipitate radius with maximum strength. The corresponding CRSS from these two mechanisms is expressed as Equations (9) and (10) respectively.
where G
γ’ is the shear modulus of γ’ precipitates, and the value is 85 GPa.
b is the Burgers vector, and the value is 0.248 nm.
r and
f are the average radius and volume fraction of γ’ precipitates, and it is assumed that the volume fraction of γ’ precipitates is equal to their area fraction during calculation.
γAPB is the APB energy, and the value is 0.29 J/m
2 for GH4720Li alloy [
1]. When the inter-particle spacing and the size of γ’ precipitates are sufficiently large, the Orowan mechanism can occur [
2]. However, it is generally difficult to observe the Orowan looping in polycrystalline Ni-based superalloys [
39,
40]. Therefore, the CRSS of the Orowan mechanism is not considered for estimating the precipitation strengthening in this paper.
In order to calculate the CRSS of the bimodal particle system, the bimodal γ’ size distributions are translated into two types of unimodal γ’ size distribution. In this case, the CRSS of secondary and tertiary γ’ precipitates can be calculated respectively as individual unimodal γ’ size distribution using Equations (9) and (10). The CRSS of the bimodal particle system is assumed to be the simple summation of CRSS of these two types of unimodal γ’ size distribution,
τppt =
τppt,s +
τppt,t.
τppt,s is the CRSS of secondary γ’ precipitates, and
τppt,t is the CRSS of tertiary γ’ precipitates.
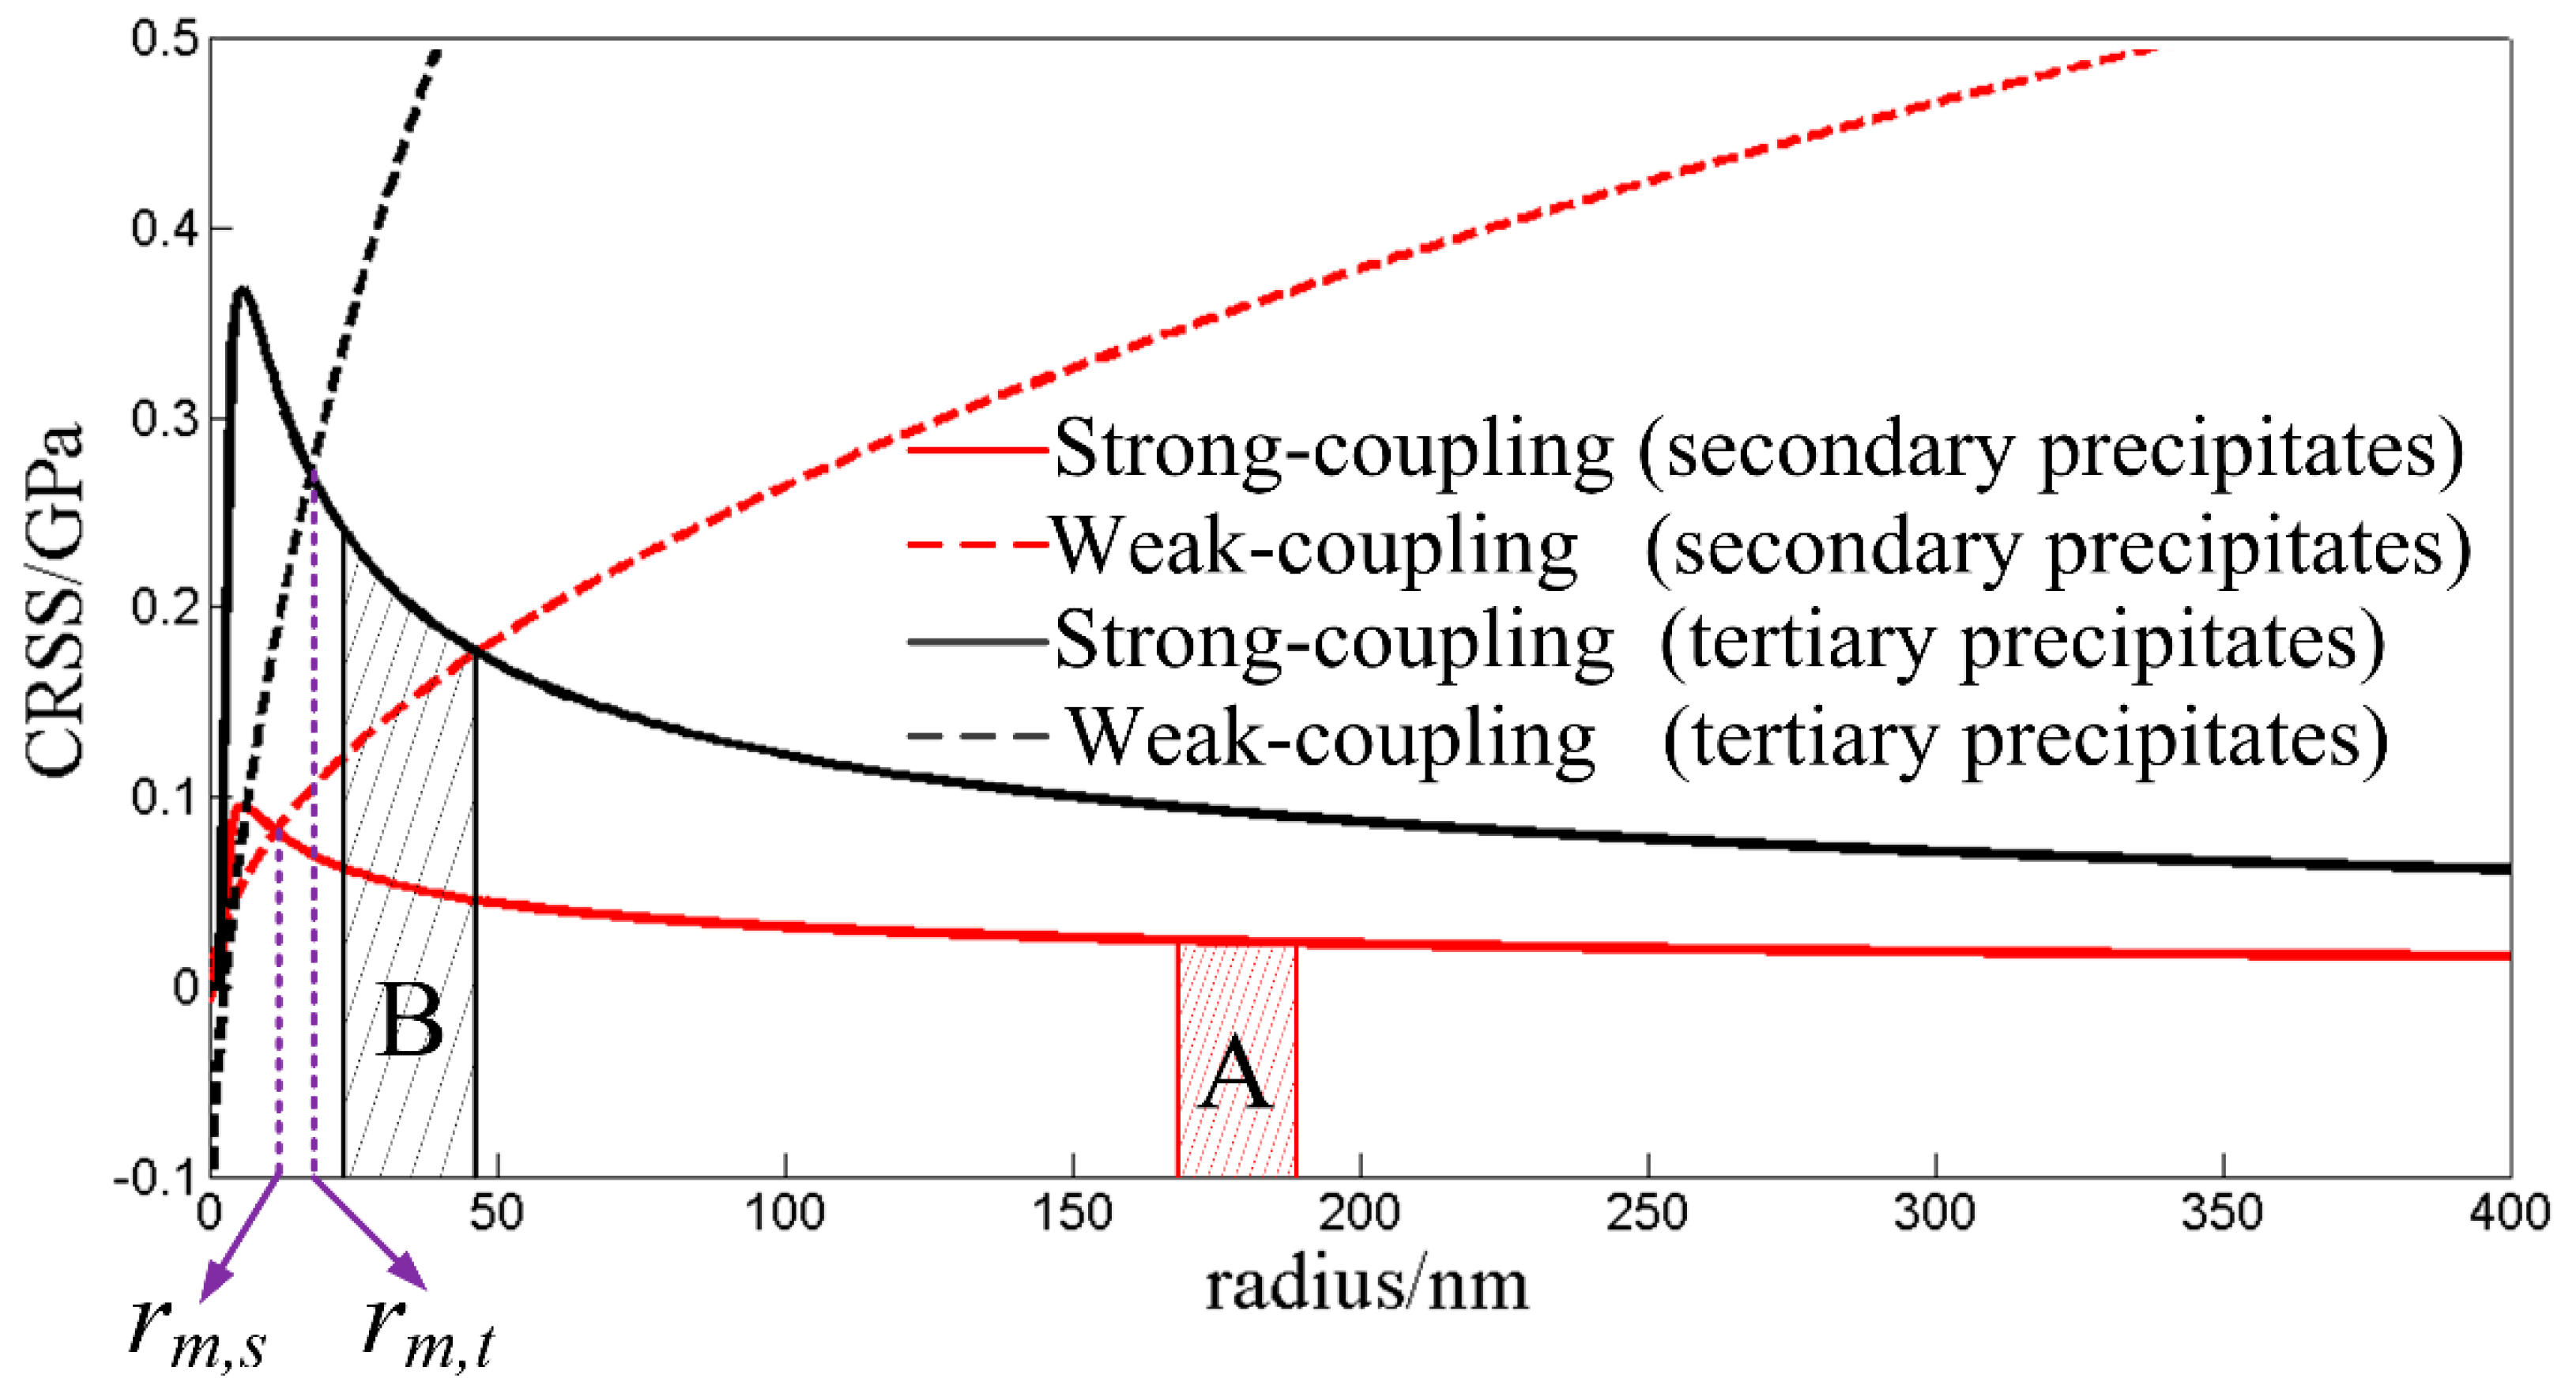
Figure 8 shows the relationship between the CRSS of secondary and tertiary γ’ precipitates and the mean radius of γ’ precipitates.
rm,s is the secondary precipitate radius with maximum strength, and
rm,t is the tertiary precipitate radius with maximum strength. The regions A and B represent the distribution range of mean radius of the secondary and tertiary γ’ precipitates respectively during long-term thermal exposure. It could be seen that mean radius of secondary γ’ precipitates is larger than
rm,s, and mean radius of tertiary γ’ precipitates is larger than
rm,t. Therefore, the precipitation strengthening in the bimodal particle system follows the strong coupling mechanism. The CRSS of secondary and tertiary γ’ precipitates which will be calculated by Equation (9) decreases with increasing γ’ radius, so the corresponding hardness decreases during γ’ coarsening. The microstructure-related hardness model of GH4720Li alloy with multiple generations of γ’ precipitates can be established by inserting Equation (9) into Equation (8), and its expression is given by Equation (11). This model can be used to predict the hardness of GH4720Li alloy with different microstructures. During the long-term thermal exposure at 630–760 °C, it is assumed that the area fractions of secondary and tertiary γ’ precipitates used in Equation (9) keep constant, and the values are 2% and 30% respectively.
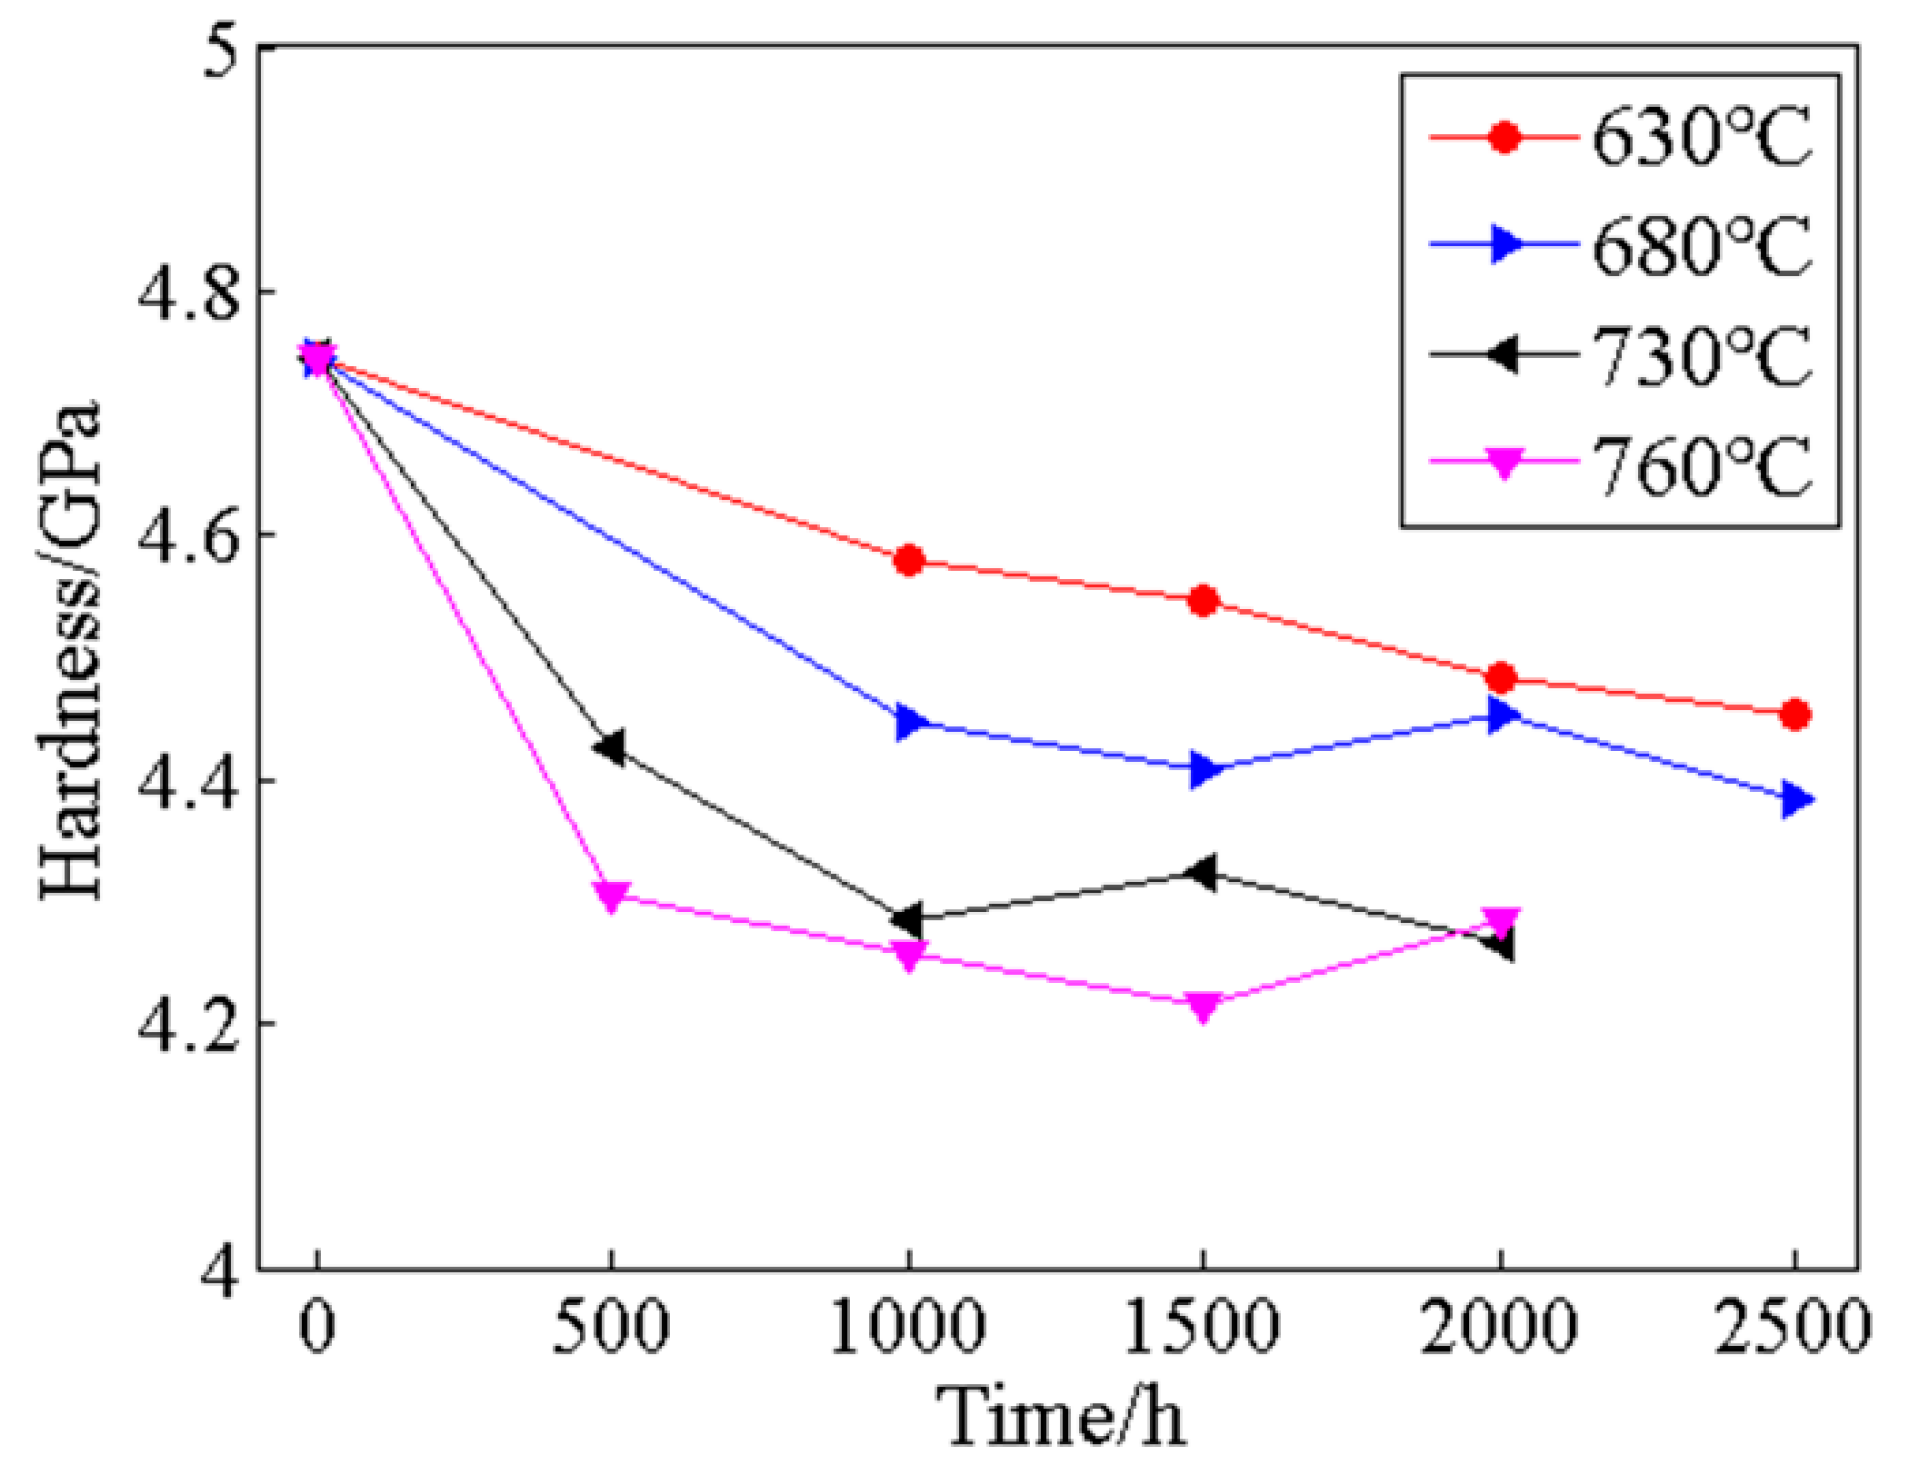
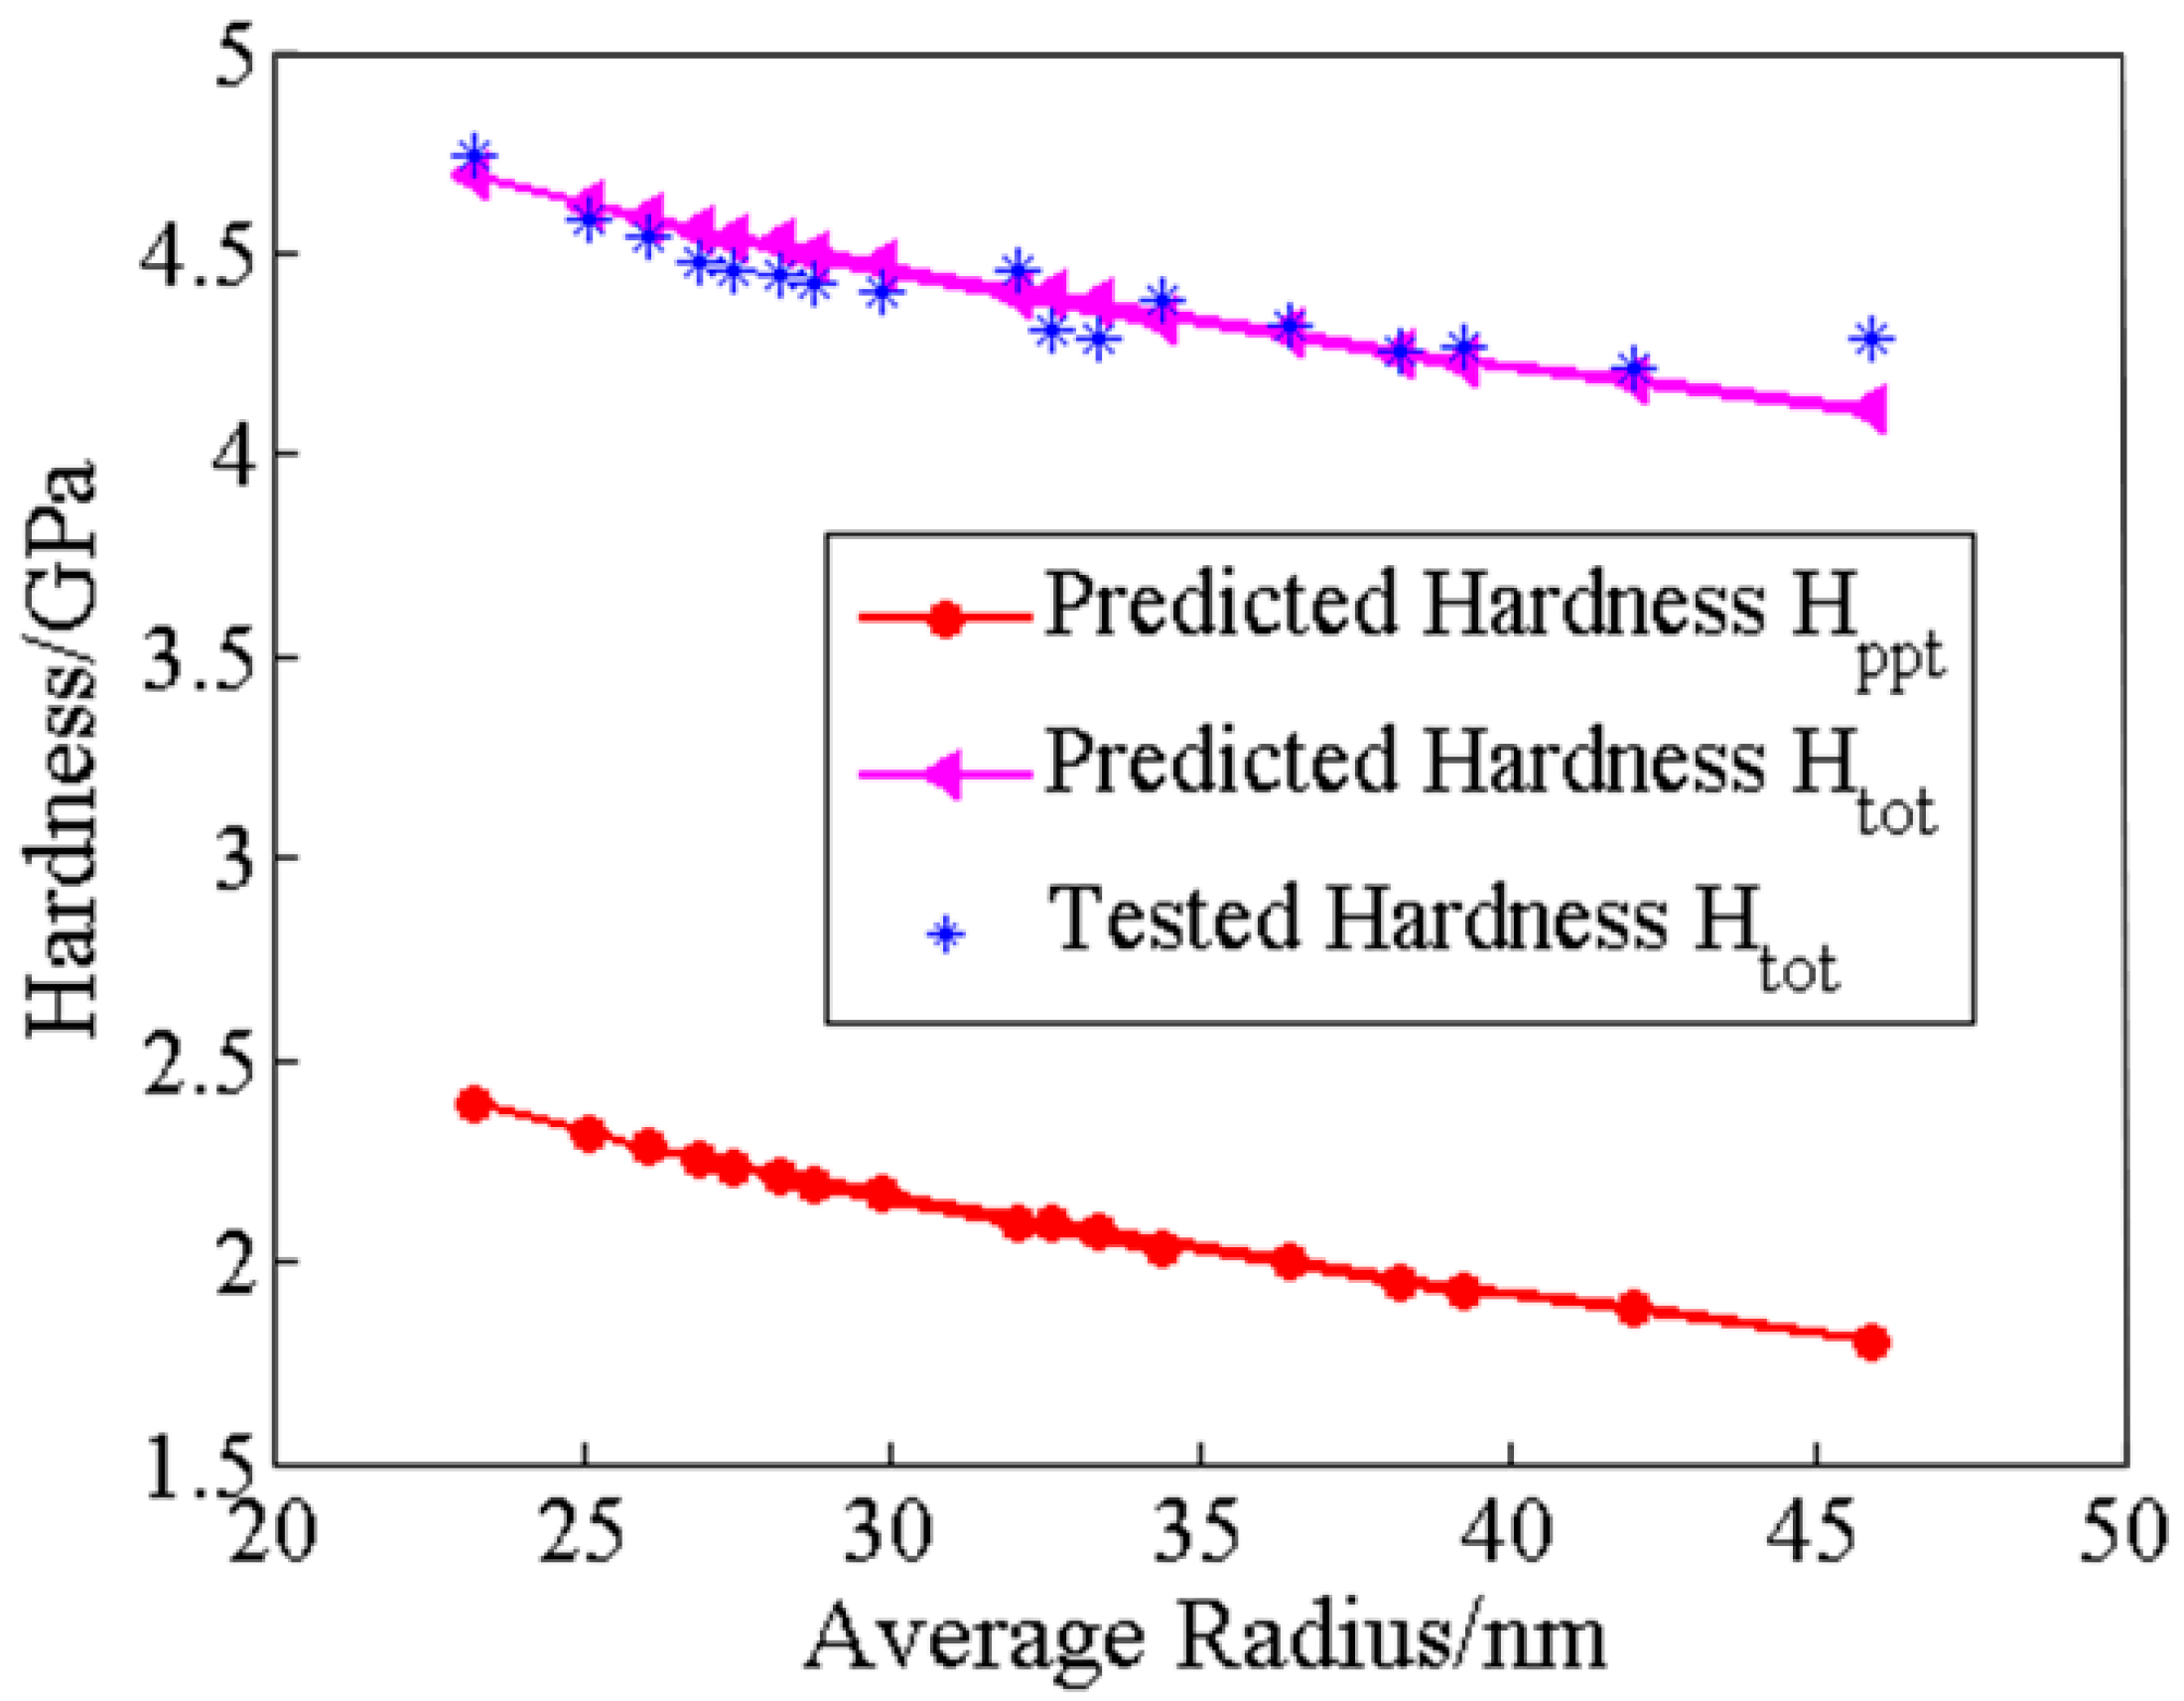
Figure 9 shows the hardness variations during coarsening of tertiary γ’ precipitates. The overall hardness
Htot includes the values predicted by above microstructure-related hardness model and tested by nanoindentation experiments. It could be seen that the microstructure-related hardness model can accurately predict the hardness of GH4720Li alloy during long-term thermal exposure. Similar trend of the hardness
Htot and
Hppt also indicates that the degradation of overall hardness of GH4720Li alloy is caused by the coarsening of γ’ predictions, and the hardness
Hmat is constant. Comparing the hardness values of
Htot and
Hppt at different mean radii of tertiary γ’ precipitates, the value of
Hmat is about 2.3 GPa.
8. Conclusions
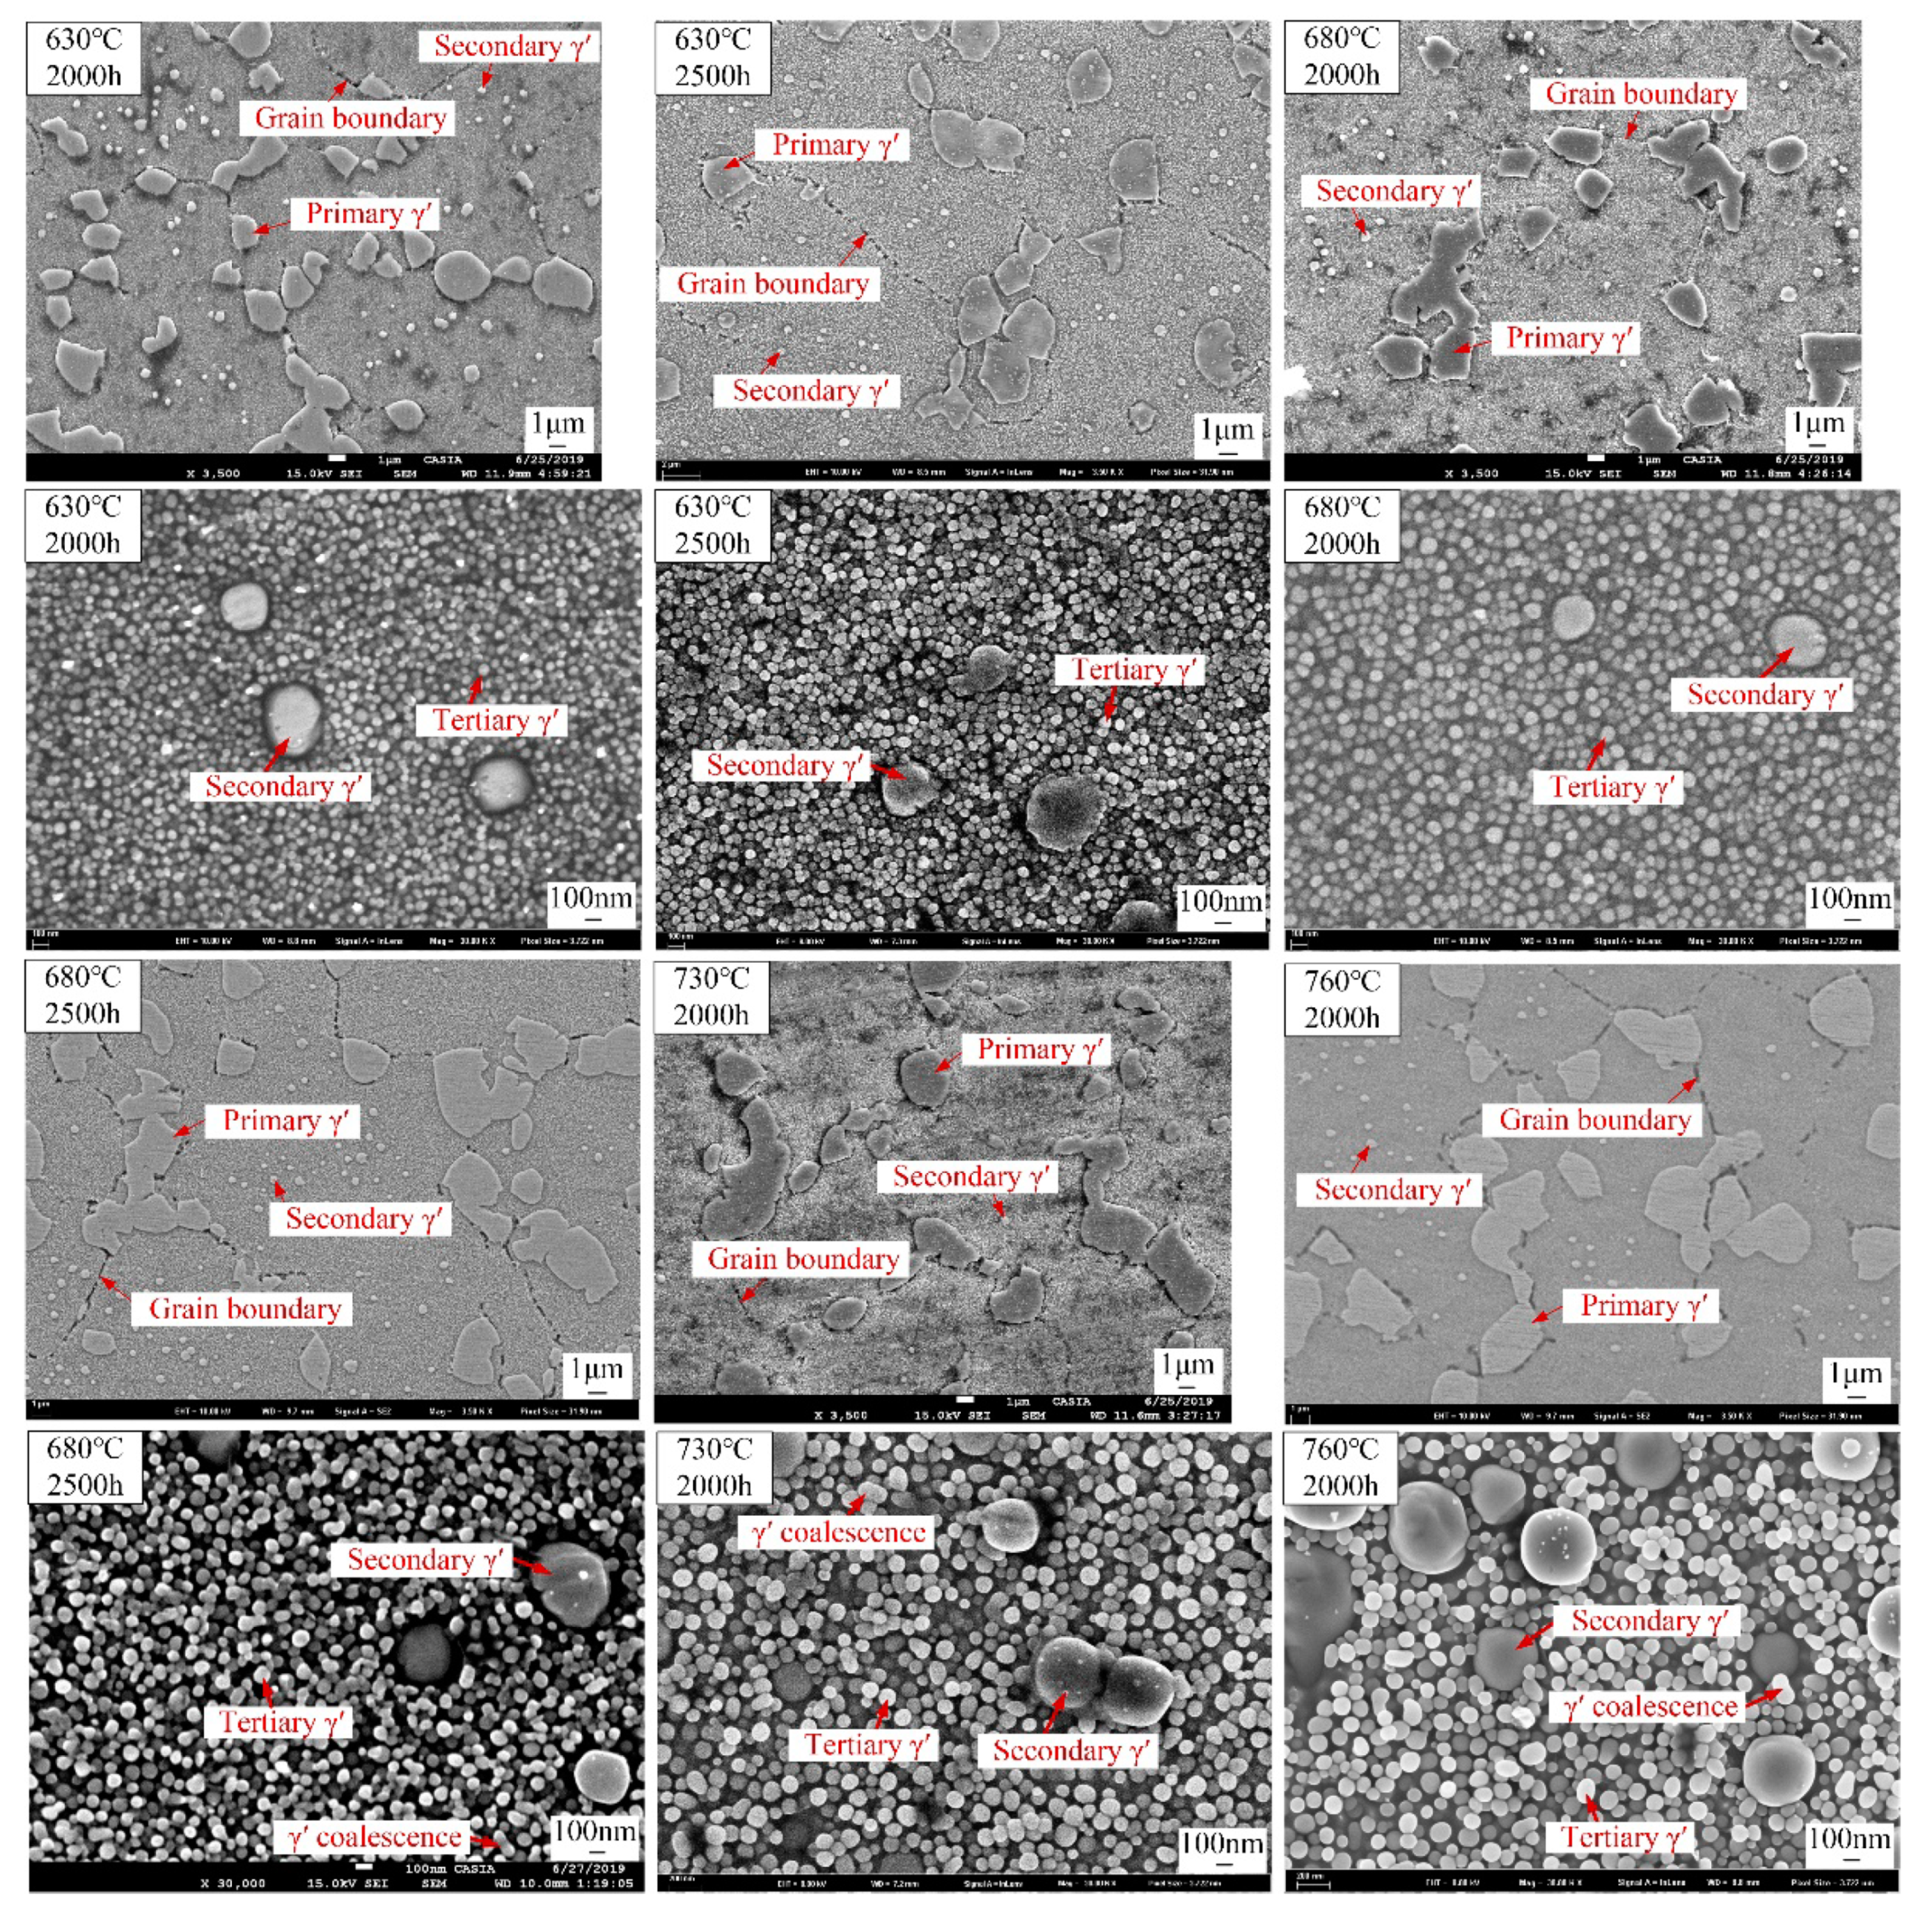
In this paper, thermal exposure tests and microstructural detection were conducted to study the precipitate stability and the microstructure related hardness of a polycrystalline Ni-based superalloy GH4720Li during long-term thermal exposure at 630–760 °C. In order to accurately and automatically derive the morphological parameters of γ’ precipitates from extremely large-area SEM images with the size of 32 K × 32 K pixels (327.68 μm × 327.68 μm), a new strategy to segment γ’ precipitates by deep learning method is proposed. The deep learning method of U-Net was successfully applied to accurately and quickly segment different generations of γ’ precipitates with similar gray values in the large-area SEM images. As far as the authors’ knowledge, this is the first time the deep learning method has been applied to obtain the morphological parameters of γ’ precipitates for subsequent quantitative research, which can effectively promote the application of deep learning in material sciences.
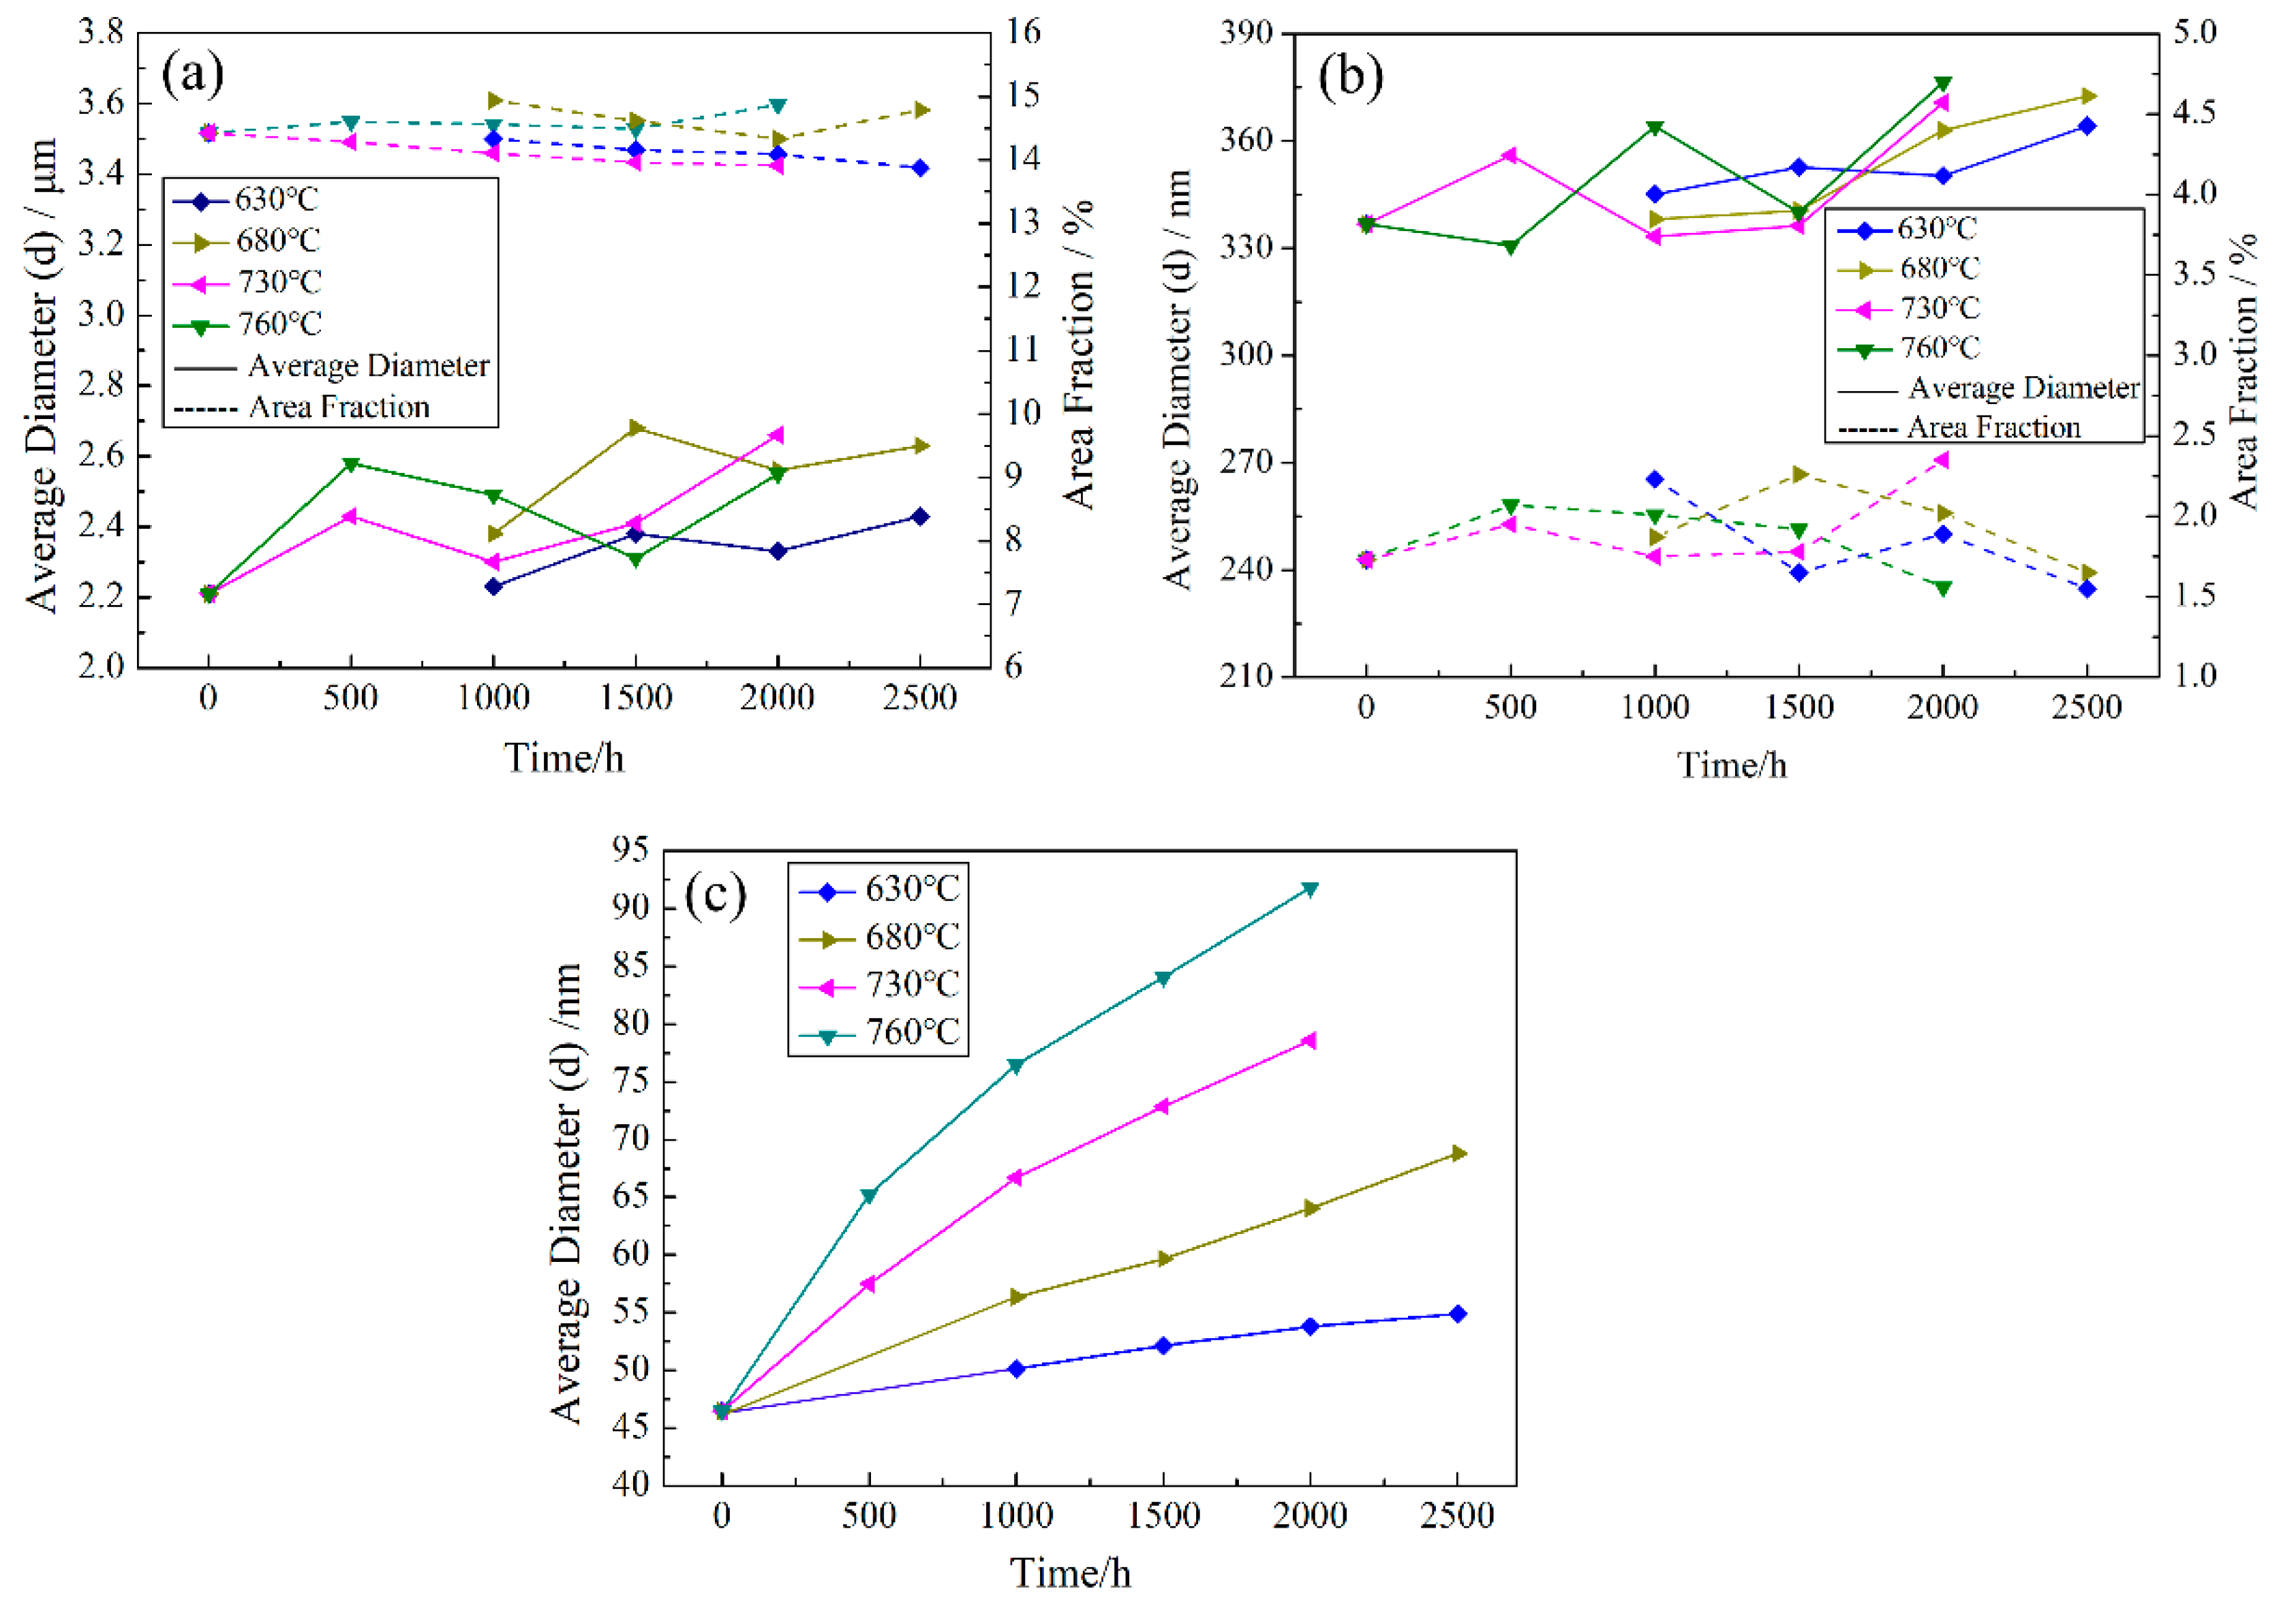
Based on the experimental results, primary and secondary γ’ precipitates show good stability during long-term thermal exposure. On contrary, the sizes of tertiary γ’ precipitates increase significantly with increasing thermal exposure time and temperature, leading to the hardness degradation of the alloy. A microstructure-related hardness model is established, and it could accurately predict the hardness of GH4720Li alloy with different microstructures during thermal exposure. As far as our knowledge, it is the first time the microstructure-related hardness model has been used to correlate the γ’ morphology and the hardness of Ni-based alloys.


